the effects of service recovery satisfaction on customer …
TRANSCRIPT

THE EFFECTS OF SERVICE RECOVERY SATISFACTION ON CUSTOMER
LOYALTY AND FUTURE BEHAVIORAL INTENTIONS:
AN EXPLORATORY STUDY IN THE
LUXURY HOTEL INDUSTRY
Except where reference is made to the work of others, the work described in this dissertation is my own or was done in the collaboration with my advisory committee.
This dissertation does not include proprietary or classified information.
__________________________________ Kristen A. Riscinto-Kozub
Certificate of Approval: ________________________ __________________________ Susan Hubbard Martin O�Neill, Chair Professor Program Director Nutrition and Food Science Nutrition and Food Science ________________________ _________________________ James Witte Anthony Guarino Associate Professor Associate Professor Educational Foundations, Educational Foundations, Leadership, and Technology Leadership, and Technology
_________________________ Joe F. Pittman Interim Dean Graduate School

THE EFFECTS OF SERVICE RECOVERY SATISFACTION ON CUSTOMER
LOYALTY AND FUTURE BEHAVIORAL INTENTIONS:
AN EXPLORATORY STUDY IN THE
LUXURY HOTEL INDUSTRY
Kristen A. Riscinto-Kozub
A Dissertation
Submitted to
the Graduate Faculty of
Auburn University
in Partial Fulfillment of the
Requirements for the
Degree of
Doctor of Philosophy
Auburn, Alabama May 10, 2008

iii
THE EFFECTS OF SERVICE RECOVERY SATISFACTION ON CUSTOMER
LOYALTY AND FUTURE BEHAVIORAL INTENTIONS:
AN EXPLORATORY STUDY IN THE
LUXURY HOTEL INDUSTRY
Kristen A. Riscinto-Kozub
Permission is granted to Auburn University to make copies of this dissertation at its
discretion, upon request of individuals or institutions and at their expense. The author reserves all publication rights.
__________________________ Signature of Author
_________________________ Date of Graduation

iv
VITA
Kristen Ann Riscinto-Kozub, daughter of Nicholas and Anna Marie Riscinto, was
born October 1, 1975, in Dubois, Pennsylvania. She graduated from Indiana University
of Pennsylvania (IUP) with a Bachelor of Science in Hotel, Restaurant and Institutional
Management in 1999. Over a twelve year period in the hospitality industry she was the
assistant catering and banquet manager for the Indiana Country Club, a Service Manager
for Red Lobster Restaurant, trainer for Olive Garden Restaurants and eventually became
a Store Manager for Starbucks Coffee Company. She received a Master of Science in
Hospitality and Tourism Management from Roosevelt University, Chicago. In 2003 she
accepted a position as Program Coordinator of the Hotel, Restaurant and Tourism
Management Program at Ogeechee College. While at Auburn Kristen had the honor of
participating in the Epicurean Wine Tour and was selected to represent the College of
Human Sciences at the Quality of Life Awards held at the United Nations, New York,
New York, December, 2006. She was also inducted in to the Kappa Omicron Nu Honor
Society. In accordance with Dr. Martin O�Neill, she was the first graduate student to
conduct guest-oriented research with the West Pace Hotel Group; founded by Horst
Schulze, Founder and former CEO of Ritz Carlton. Kristen has accepted a position as
Assistant Professor in Hospitality Management at Widener University. She and her
husband, Jeff, live in Drexel Hill with their two cats; Max and Monty and three dogs;
Maddie, Foster, and Patrick.

v
DISSERTATION ABSTRACT
THE EFFECTS OF SERVICE RECOVERY SATISFACTION ON CUSTOMER
LOYALTY AND FUTURE BEHAVIORAL INTENTIONS:
AN EXPLORATORY STUDY IN THE
LUXURY HOTEL INDUSTRY
Kristen A. Riscinto-Kozub
Doctor of Philosophy, May 10, 2008 (M.S., Roosevelt University, 2005)
(B.S., Indiana University of Pennsylvania, 1999)
216 typed pages
Directed by Martin O�Neill
This study investigated the quality of the complaint management process
employed in five luxury hotels around the United States. Over the past two decades,
complaint management research has focused on methods to evaluate service failures and
identify and measure service recovery attributes. Although research has contributed to
the evolution of supporting literature, there appears to be numerous opportunities for
additional contributions. In 2000, Andreessen observed that service recovery research
only focused on why, to whom, and how customers responded to dissatisfaction.
Moreover, Ruyter and Wetzels (2000) revealed that very little research had examined the

vi
relationship between service recovery and service quality variables (i.e. on-going
customer satisfaction, loyalty and behavioral intentions).
Current research has centered on the relationship between service recovery
satisfaction, loyalty and future behavioral intentions (Boshoff, 1997, 1999; Mattila, 2001;
Boshoff & Staude, 2003; Matilla & Wirtz, 2004) with research methods primarily
focused on hypothetical service scenarios; which measured customer expectations
opposed to customer perception. Furthermore, evaluating hypothetical service scenarios
has eliminated the role of post-failure and post-recovery emotion and how the two relate
to on-going satisfaction, loyalty and future behavioral intentions (FBI).
Therefore, the primary focus of this research was 1) to empirically test the
performance of a pre-developed service recovery satisfaction measurement in the luxury
hotel industry, 2) to explore the relationship between the customer�s degree of pre-failure
loyalty with service recovery satisfaction, 3) to explore the relationship between post-
failure emotion, post-recovery emotion on on-going satisfaction, loyalty and FBI and 4)
to explore the relationship between on-going satisfaction and the customer�s post-
recovery loyalty and FBI intentions.
A total of 553 or 48% claimed to have experienced a service failure while staying
at one of the selected hotel properties. Results of the factor analysis revealed a two factor
structure as drivers of service recovery satisfaction. The factors support the concept that
customer satisfaction is achieved through a combination of what is done and how well it
is done. Results also revealed a unique relationship between pre-failure loyalty and
emotion with on-going satisfaction, post-recovery loyalty and the customer�s FBI toward
the organization.
vii
ACKNOWLEDGEMENTS
First and foremost, I am truly grateful to my committee chair, Dr. Martin O�Neill.
Thank you for your endless support and encouragement and for creating a standard that
was challenging as well as rewarding. You have been a wonderful mentor. To Dr. Susan
Hubbard, I am truly grateful for your guidance and support. To Dr. James Witte, I am
thankful to have had the opportunity to work with you and Dr. Maria Witte. My sincere
thanks to both of you for your guidance and direction. To Dr. Anthony Guarino, I am
much appreciative of your statistical guidance and support.
To my wonderful friend, JoEllen. Thank you for all of your support during this
time. Your friendship has been an amazing blessing and you have enriched my life. To
my extended family, Consetta and Chuck, for your love and encouragement. I will never
forget how you helped me have the Auburn experience.
I am grateful to my Grandmothers, Mary Ann and Rose; and to my Godparents,
Aunt Jeannie & John K for their love and support. To my Parents, Nick and Anna Marie,
for their endless love, helping me keep things in perspective and for always encouraging
me to do better. To my �kids� Maddie, Foster, Patrick, Max and Monty, for never
leaving my side. To my husband Jeff, for your abundant love, laughter and patience.
To my Grandfathers, Dominick and John; failure is never an option with the two of you
watching over me. Last, but never least, I am most thankful to God, for sending these
angels to enrich my life and for always helping me find my faith.

viii
Style manual or journal used: Publication Manual of the American Psychological
Association, 5th Edition.
Computer software used: SPSS 15, SPSS 16, Amos 16 Windows 2000, and
Microsoft Word 2000

ix
TABLE OF CONTENTS
Page
LIST OF TABLES ............................................................................................. xi LIST OF FIGURES.......................................................................................... xiii CHAPTER I
INTRODUCTION ......................................................................................... 1 Overview ........................................................................................... 1 Statement of the Problem ................................................................... 1 Purpose of the Research ..................................................................... 4
Aims and Objectives .......................................................................... 5 Research Questions ............................................................................ 5
Limitations and Delimitations of the Study......................................... 6 Definition of Terms............................................................................ 7
CHAPTER II
LITERATURE REVIEW............................................................................. 10 Services Marketing and Relationship Marketing............................... 10 Importance of Service ...................................................................... 13 Satisfaction ...................................................................................... 18 Quality ............................................................................................. 29 Loyalty............................................................................................. 44 Emotion ........................................................................................... 61 Service Failure ................................................................................. 72 Service Recovery ............................................................................. 76 Service Recovery and Justice Theories ............................................. 77 Service Failure and Service Recovery............................................... 80 Service Recovery Defined ................................................................ 83 Measurements of Service Recovery.................................................. 85 RECOVSAT .................................................................................... 91 Antecedents of RECOVSAT ............................................................ 92 Hypotheses and Related Literature ................................................... 94 Summary ......................................................................................... 96
CHAPTER III METHODS.................................................................................................. 98 Introduction...................................................................................... 98 Research Considerations .................................................................. 98 Research Hypotheses...................................................................... 100 Theoretical Model .......................................................................... 104

x
Methods Overview ......................................................................... 105 Research Setting............................................................................. 108 Research Sample ............................................................................ 111 Research Instrument ....................................................................... 113 Measurement of Variables.............................................................. 115 Ethical Considerations.................................................................... 116 Summary........................................................................................ 116 CHAPTER IV RESULTS ................................................................................................. 117
Introduction.................................................................................... 117 Discussion of Returned Questionnaire ............................................ 117 Sample Demographic Characteristics ............................................. 118 Description of Loyalty and Future Behavioral Data ........................ 121 Description of Emotion Data .......................................................... 126 Description of Service Recovery Data ............................................ 130 Evaluation of Validity and Reliability............................................. 132 Dimensionality of the Research Instrument .................................... 140 Dimensionality of Emotion Scales.................................................. 140 Dimensionality of Loyalty Scales ................................................... 142 Dimensionality of the Recovery Satisfaction Scale ......................... 144 Testing the Central Research Hypotheses ....................................... 149 Path Analysis of Central Research Hypotheses ............................... 156 Summary........................................................................................ 158
CHAPTER V CONCLUSIONS, DISCUSSION, AND
RECOMMENDATIONS................................................................ 160 Conclusions.................................................................................... 160 Performance of the Instrument........................................................ 172 Academic Implications................................................................... 175 Practitioner Implications ................................................................ 178 Future Research.............................................................................. 182 Conclusion ..................................................................................... 183
REFERENCES................................................................................................ 184 APPENDIX A .............................................................................................. 199 APPENDIX B .............................................................................................. 201 APPENDIX C .............................................................................................. 203

xi
LIST OF TABLES Table Page
1. Hotel Participation ................................................................................. 118 2. Demographic Profile of Respondents ..................................................... 119 3. Service Failure Details ........................................................................... 120
4. Descriptive Statistics for Pre-Failure Loyalty and FBI............................ 122
5. Descriptive Statistics for Post-Recovery Loyalty and FBI ...................... 122
6. Paired Sample t Test for Loyalty Variables ............................................ 123 7. Pre-Failure and Post-Recovery Customer Loyalty .................................. 124
8. Pre-Failure and Post-Recovery Future Behavioral Intentions.................. 125 9. Descriptive Statistics for Post-Failure Emotion Data .............................. 127 10. Descriptive Statistics for Post-Recovery Emotion Data ......................... 127 11. Paired Sample t Test for Emotion Variables .......................................... 128 12. Emotion Intensity During Failure .......................................................... 129 13. Emotion Intensity After the Service Recovery Process .......................... 130 14. Descriptive Statistics for Service Recovery Data................................... 131 15. Correlation Matrix of Post-Recovery Loyalty and ................................. 137
Post-Recovery FBI
16. Internal Reliability Statistics for Measurement Scales ........................... 139 17. Factor Analysis for Emotion Scales....................................................... 142
18. Factor Analysis for Loyalty Scales ........................................................ 143
19. Exploratory Factor Analysis/Service Recovery Satisfaction Attributes . 146

xii
20. Correlation Index for Recovery Satisfaction Components ..................... 151 And On-Going Satisfaction.
21. Correlation Index for Recovery Satisfaction Components ..................... 153 And Expressed Loyalty
22. Independent Samples t Test for Loyalty and Recovery Satisfaction ....... 154

xiii
LIST OF FIGURES
Figure Page
1. Proposed Theoretical Model.................................................................. 105 2. Confirmatory Factor Analysis for Service Recovery.............................. 148
3. Modified Theoretical Model.................................................................. 150
4. Path Analysis of Proposed Relationship ................................................ 157

1
CHAPTER I
INTRODUCTION OVERVIEW
In 1997, Oliver stated that customer satisfaction must remain a central tenet of all
relationship management efforts in the hospitality sector. Hospitality organizations
typically strive to make customer satisfaction a focal point of their core values, visions
and mission. However, in consideration of steady growth and expansion, global
competition, and the influx of seasoned travelers, organizations face cumbersome
obstacles in delivering quality service. It appears that quality service is the cornerstone to
industry success; thus, those organizations that focus on quality become the flagship for
on-going customer satisfaction, engendering loyalty and influencing future behavioral
intentions. Shoemaker and Bowen (2003) referred to loyalty through quality service and
on-going customer satisfaction as the new Holy Grail; that in which all service
organizations should strive to achieve.
PROBLEM STATEMENT
In 1999, Andreassen observed that service recovery research over the past decade
only focused on why, to whom, and how customers responded to dissatisfaction. Prior to
that scrutiny Goodwin and Ross (1992) concluded that less attention was directed to
corporate responses to the customers’ voiced complaints and customers’ subsequent
attitudinal and behavioral changes were not effectively monitored. Furthermore, Conlon
and Murray (1996) argued that most of the existing service recovery studies, at that time,

2
focused on the short-term impact of recovery efforts (i.e. compensation and quality of
apology) and failed to explore the true drivers of service recovery satisfaction.
Moreover, Ruyter and Wetzels (2000) revealed that very little research had examined the
relationship between service recovery and service quality variables (i.e. on-going
customer satisfaction, loyalty and behavioral intentions). Consequently, service
organizations were not effectively identifying or evaluating the drivers of service
recovery satisfaction within the service industry; therefore, the benefits of on-going
satisfaction and customer retention were not truly achieved.
Within the hospitality industry, Colgate and Norris (2001) suggested that a
commitment to a continuous quality improvement process could only be achieved by
tracking the number and severity of service failures. Thus, the researchers believed that a
customer�s perception of service quality was directly linked to the number and severity of
the failures he or she experienced. In addition, their research also showed that the
organization�s quality of response and problem resolution was critical to the customer�s
continuous satisfaction, loyalty and intentions to return or recommend.
Although an extensive and thorough body of literature exists on service quality
(Berry, Zeithaml, & Parasuraman, 1985; Parasuraman, Zeithaml, & Berry, 1985, 1988,
1991, 1994; Zeithaml, Berry, Parasuraman, 1993; Zeithaml, Parasuraman & Berry, 1990;
Cronin and Taylor, 1992 & 1994; O�Neill, 1992, 2001; Kandampully, 2002; Gronroos,
2001), satisfaction (Oliver, 1980,1993 & 1997; Wirtz & Bateson, 1999;) loyalty (Oliver,
1997; Edvardsson, Johnson, Gustafsson & Strandvik, 2000; McMullan & Gilmore, 2003;
McMullan, 2005) emotion (Izard, 1992; Westbrook & Oliver, 1991; Mattila & Wirtz,
2000; Smith & Bolton, 2002; Matilla, 2002) and service recovery (Boshoff, 1997, 1999;

3
Ruyter & Weltz, 2000; Strauss, 2002; Mattila, & Wirtz, 2000; Mattila, 2001; Mattila, &
Patterson, 2004; Mueller, Palmer, Mack, & McMullan, 2003), there appears to be areas
of opportunity for additional research and new contributions. For example, as the
succeeding pages will support, a need has emerged for a systematic approach to track and
measure service failures and the overall performance of the service recovery process
within the various segments and organizations of the hospitality industry. In addition, to
the researcher�s knowledge, a scale has yet to be developed to thoroughly measure the
degree of on-going satisfaction, loyalty, emotion and future behavioral intentions in the
luxury segment of the hotel industry. While models and scales have contributed to the
body of literature (Boshoff, 1997 & 1999; Mattila, 2001; Craighead, Karwan & Miller,
2004; Kau and Loh, 2006), few have been tested empirically throughout various
segments of the service industry, let alone in the hospitality industry.
For example, Boshoff�s RECOVSAT has received a considerable amount of
attention since its development in 1999; however, Strauss (2002) suggested that although
Boshoff�s RECOVSAT performed well in a hypothetical scenario it had yet to be tested
empirically. Since that time, RECOVSAT has been applied in an empirical nature in the
banking and finance industry; however, to the researcher�s knowledge the measure has
not been applied empirically to other service industries. Furthermore, to the researcher�s
knowledge, the relationship between 1) on-going satisfaction, 2) post-recovery emotion
with on-going satisfaction and 3) the customer�s degree of pre-failure and post-recovery
loyalty and FBI has not been explored in an empirical sense within luxury hotel
properties. In addition to the above, a service recovery model has yet to be developed
and confirmed across the luxury segment of the hotel industry.

4
Therefore, the primary focus of this research was to evaluate the effectiveness of
the compliant management systems within five selected luxury hotels and to 1)
empirically test the performance of RECOVSAT in the luxury hotel segment, 2) explore
the relationship between the customer�s degree of pre-failure loyalty and their on-going
satisfaction with the organization, 3) to explore the relationship between post-recovery
emotion and on-going satisfaction and 4) to explore the relationship between on-going
satisfaction with the customer�s loyalty and FBI.
PURPOSE OF THE STUDY
Although hospitality organizations strive to provide excellent service in the first
place, the characteristic nature of the environment makes imperfections unavoidable.
With that being said, things can and frequently do go wrong, leading to the need for a
systematic recovery effort aimed at 1) resolving customer complaints, 2) influencing on-
going satisfaction, and 3) exploring the relationship between on-going satisfaction,
emotion, loyalty and FBI. While organizations should strive to provide customers with
no reason to complain in the first place, when imperfection strikes, a well-crafted
recovery process can turn a weakness into a business opportunity (Barsky, 1996).
Therefore, the purpose of this study was to 1) identify attributes of service recovery
satisfaction in luxury hotels by empirically testing the performance of RECOVSAT, 2)
explore the relationship between the customer�s degree of pre-failure loyalty and their on-
going satisfaction with the organization, and 3) to explore the relationship between post-
recovery emotion with on-going satisfaction. In addition, this study will also explore the
relationship between on-going satisfaction with the customer�s loyalty intentions and
FBI.

5
AIMS AND OBJECTIVES
Many hospitality organizations now consider the development of a complaint
management system to be a vital component to ensure service recovery satisfaction.
However, of all the efforts being made to deliver quality service, satisfy customers,
engender loyalty and influence FBI, quality service and defusing service problems are
still on-going issues in hospitality. Kandampully (2002) stated �Of all the challenges
facing hospitality establishments today- including intense competition, globalization and
technological innovation- the single most pervasive and pressing challenge is the ever-
increasing demand of customers for service quality� (p. xi).
Against this background, the aims and objectives of this study was to evaluate the
quality of the service recovery process and the relationship, from the customer�s
perspective, with long-term loyalty and behavioral intentions. The intent of this study
was to explore 1) the relationship between the organization�s service recovery efforts and
the customer�s degree of on-going satisfaction, 2) the relationship between the customer�s
degree of pre-failure loyalty, on-going satisfaction and post-recovery loyalty, 3) the
relationship between the customer�s post-recovery emotion, loyalty and behavioral
intentions and 4) the psychometric performance of Boshoff�s (1999) service recovery
satisfaction measure, RECOVSAT, from a selected group of luxury hotels throughout the
United States.
RESEARCH QUESTIONS
The primary questions were: How is the recovery satisfaction construct best
defined in the context of the luxury hotel sector? What, if any, is the relationship between

6
an organization�s service recovery efforts; satisfaction and loyalty? And what, if any,
role does perceived emotion and loyalty play as a mediator in the recovery process?
LIMITATIONS AND DELIMITATIONS
Although every attempt was made to eliminate possible limitations, this study
does have several limitations. The following section is intended to address some of the
limitations surrounding this study so they may be eliminated in future research.
One of the primary limitations for this study was the amount of time between the
actual service recovery experience and the administration of the scale for evaluation. The
sample population consisted of customers who stayed at the selected hotel properties
within the 12 months prior to the survey distribution. Unless the service recovery efforts
were to an extreme positive or negative, a limitation of the study is certainly the
customer�s ability to recall the details surrounding the service provider�s efforts.
Another limitation for this study was also related to time. Participants from the
sample population were asked to evaluate the type and degree of emotion felt at the time
of the service failure as well as the type and degree of emotion felt directly after the
service recovery process. Due to the amount of time between the experience and the
survey, the accuracy of the emotions involved during the failure and directly after the
recovery could be called into question.
Delimitations to the study were also assessed. Delimitations are areas of possible
emphasis or significance that were not included in this research. Considering the vast
scope of the issues surrounding service recovery, there are many delimitations to the
study.
7
One of the most significant delimitations was the role of the employee in the
service recovery process. Employees play a pivotal role in on-going customer
satisfaction; thus, in order to truly gauge the effectiveness of the service organization�s
recovery efforts, it would be best to explore employee attitudes and perceptions toward
on-going customer satisfaction, complaint handling and service recovery. The hotel
organizations selected for this study preferred to first and foremost explore service
recovery from the customer�s perspective.
Another delimitation to the study was the degree of dissonance the customer may
have felt prior to the time of the service failure. In an effort to fully dissect the
effectiveness of the organization�s service recovery efforts, it may be of value to
understand the customer�s attitude or emotion prior to entering into the service encounter.
This element was not included in the study due to the amount of time between the actual
service failure and the evaluation. If this indicator of service recovery satisfaction were
to be evaluated, the service recovery satisfaction measurement should be administered
closer to the actual event.
DEFINITION OF TERMS Attitudinal Loyalty: The point in which the customer develops a favorable or unfavorable attitude toward the service or provider. This leads to the customer�s intention to return or recommend (Dick & Basu, 1994). Behavioral Loyalty: When a customer�s intentions are converted into actions; thus, the customer�s motivated intentions in the previous loyalty state has transformed or progressed to the point where the customer is ready to act upon their intentions (Kahl & Beckmann, 1985). Consumption Emotion: The combination of both positive and negative emotions with the service encounter. This plays a significant role in the customer�s degree of satisfaction, loyalty and future behavioral intention (Allen, Machleit & Kleine, 1992; Oliver, 1993; Richins, 1997; Barsky & Nash, 2002).

8
Disconfirmation Theory: Based on cognitive dissonance and the way people respond to their level of dissonance (Festinger, 1957). Distributive Justice: The allocation of benefits and costs; which relates to the degree of compensation associated with recovering the failed service offering (Oliver, 1997). Emotion: �The arousal and various forms of affect and cognitive interpretations of affect that may be given a single description. One of the most predominant problems in defining emotion is to understand where emotion stops and where cognition begins. The greater the amount of cognitive interpretation required, the more cognitive the emotion becomes� (Oliver, 1997, p.294). Heterogeneity: When the customer�s overall evaluation of a service encounter does not rest solely on the processing of tangible attributes or the intangible elements from the service provider but instead on a combination of the above, paired with the customer�s mood, emotions and attitudes (Zeithaml, Parasuraman & Berry, 1990; Mantel & Kardes, 1999). Inseparability: When customers are physically involved and become a vital part of the service delivery process. Service depends on the provider�s performance as well as the customer�s participation (Kelly, Donnelly, & Skinner, 1990). Intangibility: The interpersonal elements between the people of the service organization and the customer that differentiates service and goods (Zeithaml, Parasuraman & Berry, 1990). Interactional Justice: The degree to which people are treated (Oliver, 1997). Loyalty: �A deeply held commitment to rebuy or repartonize a preferred product or service consistently in the future, thereby causing repetitive same-brand or same-brand set purchasing, despite situational influences and marketing efforts having the potential to cause switching behavior� (Oliver, 1997, p. 392). Procedural Justice: Resolving conflicts by use of a formal approach in order to be consistent and maintain the customer relationship- even if the outcome is unsatisfactory to one party (Wildes, 2005). Perishability: Services are time sensitive. Service providers have a small, distinct window of opportunity to delivery service excellence and meet the customer�s expectations (Berry, Zeithaml, & Parasuraman, 1985). Quality: Quality can be united into one concept of consumer-perceived quality, where quality can be defined only by customers and occurs where an organization supplies goods and services to a specification that satisfies their needs (O�Neill, 2001).

9
Relationship Marketing: The fundamental feature that differentiates services marketing from goods marketing is the intangible nature of the service industry (Berry, Zeithaml, & Parasuraman, 1985). Satisfaction: �The summary psychological state resulting when the emotion surrounding disconfirmation expectations is coupled with the consumer�s prior feelings about the consumption experience�. �A judgment that a product or service feature, or the product or service itself, provided (or is providing) a pleasurable level of consumption-related fulfillment, including levels of under-or-over fulfillment� (Oliver, 1981, p.13). Service: An interpersonal relationship between the organization and the customer (Price, Arnould & Tierney, 1995). A critical moment of truth that involves either satisfying or dissatisfying the customer (Albrecht & Zemke, 1995). Service Failure: Negative encounter occurs and the customer realizes that the service has not met their expectations (Zeithaml, Berry, & Parasuraman, 1993). Service Recovery: An organization�s response to poor quality service (Gronroos, 1988). Zone of Tolerance: The level of service satisfying or dissatisfying service that each individual customer will accept in each service scenario (Zeithaml & Bitner, 2000).
10
CHAPTER II
LITERATURE REVIEW
INTRODUCTION
The purpose of this chapter is to review the literature that supports the constructs
outlined in this study. To begin, the importance of relationship marketing to the service
industry as well as the hospitality industry will be evaluated. The second section of the
literature review will contain a detailed analysis of satisfaction and dissatisfaction and the
direct relationship satisfaction has with service quality, engendering loyalty and
influencing future behavioral intentions. In addition, emotion will be defined and various
measures will be analyzed to support the important contribution emotion makes to this
study. Finally, this chapter will conclude with a discussion of service failure and
complaint management and provide an extensive examination of the research that
surrounds service recovery.
SERVICES MARKETING
Over the past decade the United States economy has transformed from a
manufacturing-based economy to a service-based economy. Along with this
transformation the demand to understand and dissect the importance of service has
emerged. To truly appreciate the complex nature of the service industry, related research
has revolved around service quality (Parasuraman, Zeithaml & Berry, 1985; Gronroos,
1988; Cronin & Taylor, 1992; O�Neill, 1992; Oliver, 1997), satisfaction (Oliver, 1993 &
1997; Wirtz & Bateson, 1999; Zeithaml & Bitner, 2000), loyalty (Dick & Basu, 1994;

11
Oliver, 1997; Bowen & Shoemaker, 1998; Reichheld & Sasser, 1990; Heskett, Sasser &
Schlesinger, 1994; McMullan & Gilmore, 2003; McMullan, 2005) and complaint
management systems (Boshoff, 1997 & 1999; Mattila, 2001; Boshoff & Staude, 2003;
Craighead, Karwan, & Miller, 2004; Mattila & Patterson, 2004). Although an extensive
body of research exists today on the constructs surrounding services marketing, the
expansion and evolution of the service industry has revealed a gap in the literature
regarding customer service and related issues.
Services marketing literature suggests that a customer orientation puts the
customer at the core of an organization�s purpose and activity; therefore, looking after the
customer and maximizing satisfaction allows the firm to remain competitive and
profitable (McMullan & Gilmore, 2005). In order for a service provider to make the
customer the core of the organization, the provider must first have a detailed
understanding of the customer�s needs and expectations. As part of the service industry�s
approach to rapid growth and market domination, today many products and services are
easily duplicated, making it quiet challenging for service providers to compete by
offering unique yet basic services and products. In an effort to differentiate themselves
from the competition, many service providers have begun to place additional emphasis on
nurturing the intangible characteristic of the service industry; thus in turn, placing their
efforts on developing relationships in an effort to engender loyalty and retain customers
opposed to continuously marketing to obtain new customers.
RELATIONSHIP MARKETING
The fundamental feature that differentiates services marketing from goods
marketing is the intangible nature of the service industry (Zeithaml, Parasuraman &

12
Berry, 1990). The intangible characteristics of the service industry can simply be defined
by the uniqueness and quality that the people bring to the service transaction. Therefore,
the core of relationship marketing is developing and maintaining relations between the
employees of the service organization and the people in the micro-environment, i.e. the
customers (Ravald & Gronroos, 1996).
The concept of relationship marketing started to emerge in research in the mid-
1980s, when the notion of developing a long-term, mutually satisfying relationship
between customers and service providers was realized to be an asset (Weber, 1992).
Over the past 20 years, relationship marketing has become an increasingly popular
approach to services marketing and engendering loyalty; especially in the hospitality
industry. In fact, it appears that many service organizations strive to infiltrate
relationship marketing into the culture of the organization through their mission and
vision.
Both professional journals and trade publications recommend various concepts
and ways to approach relationship marketing; however, the most agreed upon concepts to
successful relationship marketing are that the service provider must 1) make the
customer�s needs and expectations the core of their philosophy and 2) form an emotional
connection based on trust and commitment between the service provider and the
customer. To support the above, McKenna (1991) as well as Shoemaker and Bowen
(2003) and Shoemaker and Lewis (1999) revealed that a in order to have a true bond
between the customer and the organization, that is built on trust and commitment, the
customer must be integrated into the design of the service or product. To enhance that
theory and take it one step further, Claycomb and Martin (2002) demonstrated that in

13
order for relationship marketing to be effective, organizations must strengthen ties with
existing customers in an effort to enhance satisfaction and serve the customer. Hence, it
must become the foundation of the organization�s business philosophy. Gittell�s (2002)
research in the health care industry revealed that a relationship between the service
provider and the customer had a direct connection with customer satisfaction and loyalty.
His study also showed that the stronger the relationship between the service provider and
the customer, the more likely the customer was to revisit and recommend the
organization.
In regards to the hospitality industry, since the early 1990s, hotels, restaurants,
airlines and cruiselines has focused much of their marketing attention and budget on
building customer loyalty through relationship marketing. However, according to Bowen
and Shoemaker (1998), the hospitality industry�s approach to relationship marketing has
mainly focused on transactional tactics such as frequent user programs and free amenities
and services; opposed to 1) building relationships, 2) creating an emotion connection
with the customer, and 3) engendering loyalty in an effort encourage the customer to
revisit and/or recommend. Although research has found that customers respond
favorably to these monetary relationship tactics, their actions are not truly driven by an
established, emotional connection with the service provider. Therefore, in the event of a
service failure and the customer�s dissatisfaction, the customer�s loyalty is based on a
pecuniary relationship and switching behavior is more probable.
THE IMPORTANCE OF SERVICE
When it comes to providing service,
understanding customer expectations and the customer�s perception of the service

14
encounter is a vital component to delivering superior service. Delivering superior
service, especially in the hospitality industry creates a myriad of opportunities for the
service organization to surpass the competitive and become a recognized leader in the
service industry. It only stands to rationalize that the concept of the service encounter
directly affects satisfaction, loyalty and future behavioral intensions; which in turn, has a
direct affect on the organization�s success and financial stability.
In the section that follows, a detailed analysis of the service industry will be
presented in the form of 1) the widely accepted definitions of service, 2) the service
industry�s economic impact to the United States economy, and 3) a discussion
surrounding the service industry�s distinguishing characteristics.
SERVICE DEFINED
Researchers have explored and clarified the definition and concept of service
since the early 1960s. Although a large body of service research exists acknowledging
countless definitions and theories that surround service, some of the most widely
accepted and citied definitions in more recent literature are: 1) a service encounter is an
interpersonal relationship between the organization and the customer (Price, Arnould &
Tierney, 1995) and 2) it is a critical moment of truth that involves either satisfying or
dissatisfying the customer (Albrecht & Zemke, 1995). In 1985, Czepiel, Soloman,
Suprenant and Gutman defined service as an encounter which involves any transaction or
exchange of products or services between the customer and a service organization. This
researcher�s definition of service is the moment of truth when employee training and
expertise is truly tested in an effort to meet or exceed the customer�s expectations of the
tangible and intangible components of the service encounter.
15
The United States economy has shifted from an economy dominated by the
manufacturing of tangible goods to an economy reliant upon the characteristics of the
service industry. In 2006, the Bureau of Labor Statistics released an analysis of the
service industry which stated that the service sector of the United States economy, at that
time, accounted for more than 75 percent of the United States Gross Domestic Product
and approximately 80 percent of all jobs in the United States. However, Namasivayam &
Hinkin (2003) warned that although the service industry has become a significant part of
the United States economy, customers are still experiencing dissatisfaction with the
quality of the service encounter received. Research on satisfaction and quality will be
thoroughly discussed in an upcoming section; however, the research presented in this
next section will demonstrate that customer expectations and demands on the service
provider are steadily increasing. On the contrary, the service provider continuously falls
short in meeting and/or exceeding customer expectations.
UNIQUE CHARACTERISTICS OF THE SERVICE INDUSTRY
In consideration of the increasingly competitive nature of the service industry,
especially the hospitality industry, service professionals must concern themselves with a
minimal increase in the market share in addition to maintaining their existing customer
base (O�Neill, 2001). As the service industry continues to expand, customers are
constantly presented with new opportunities to find a service provider that is capable of
fulfilling their demands and meeting their expectations. Lovelock (2001) believed that
the pressure placed on service organizations to achieve service excellence is truly
justified. In his research, Lovelock (2001) pointed out that 1) today, customers are more
demanding of the products and services they buy, 2) the development of sophisticated

16
technology has made it convenient for all service organizations, large and small, to offer
personalized services that are highly valued by the customer, and 3) in an increasingly
competitive and international marketplace, providing a quality service encounter is seen
as having the advantage over the competition.
In addition to the characteristics stated above, service has also been characterized
in four dimensions. One of the four, intangibility, has been discussed and defined in a
previous section; however, in addition to further discussion of intangibility, this section
will also focus on the distinguishing characteristics of inseparability, heterogeneity and
perishability. Intangibility once again is a fundamental characteristic of service. As
stated earlier, Zeithaml, Parasuraman and Berry (1990) claimed that intangibility is the
fundamental factor that differentiates service and goods. In consideration of the tangible
objects, i.e. products or goods, involved in a service encounter, a customer can use
physical attributes such as sight, touch, sound and taste, to evaluate the quality and to
determine their degree of satisfaction with the product or goods. However, a customer is
unable to utilize their physical attributes to judge the quality and their satisfaction with
the intangible aspect to the service encounter (Berry, 1995). Consequently, the intangible
aspect to the service is dependent upon the employee�s ability to interact with the
customer and satisfy the customer with the personalization and emotional element that
makes the service encounter exceptional.
In reference to the inseparability characteristic, in most service encounters, the
provider is present when the service is being delivered and consumed. Therefore,
customers are often physically involved and become a vital part of the service delivery
process. Thus, the quality of the service depends on the provider�s performance as well
17
as the customer�s participation (Kelly, Donnelly, & Skinner, 1990), and the delivery of
the service becomes a human performance that the customer is inseparable from
(Zeithaml, Parasuraman, & Berry 1990).
In service, the evaluation of past service encounters tends to influence the
customer�s attitude and intentions when preparing for an upcoming service encounter.
Zeithaml, Parasuraman & Berry (1995) refered to heterogeneity as a remarkable
phenomenon. The customer�s overall evaluation of a service encounter does not rest
solely on the processing of tangible attributes or the intangible elements from the service
provider but instead on a combination of the above, paired with the customer�s mood,
emotions and attitudes (Mantel & Kardes, 1999). The challenge to heterogeneity is the
fact that many service providers strive to engender loyalty by from their existing
customer base; therefore, service organizations tend to confuse customer satisfaction with
customer loyalty. However, in order to engender loyalty, a customer must be satisfied
with the service organization in good times and challenging times. Heskket, Jones,
Loveman, Sasser and Schilger (1994) found that relying on the customer�s satisfaction
with a specific service transaction does not necessarily mean that the customer will be
satisfied enough to return or recommend the service. In fact, their research on the
Service Profit Chain revealed that the weakest link in the chain was between satisfaction
and loyalty. Thus, suggesting that a satisfied customer does not necessarily develop into
a loyal customer.
The final characteristic of the service industry is perishability. Simply put,
perishability means that the services are time sensitive and service providers have a
small, distinct window of opportunity to delivery service excellence and meet the

18
customer�s expectations. Once again, Zeithaml, Parasuraman and Berry�s (1985)
definition of perishability stating that, unlike products that can be stored or reinvented for
future orders, services can not be returned, recaptured or recreated; only repeated.
Industry projections suggest that the service industry will continue to dominate
the United States workforce as well as the economy. In consideration of the above,
service providers must continuously strive to create a balance in their approach to service
excellence. A balance of the characteristics of the service industry seems to be the most
reliable approach to delivering quality service, creating satisfied customers and
maintaining a competitive advantage.
SATISFACTION
Satisfaction plays a key role in the service industry and especially in the
hospitality industry (Edvardsson, Johnson, Gustafsson & Strandvik, 2000). As the
service industry has evolved, researchers have made great strides to define and
understand satisfaction from the consumer�s perspective. The emphasis to comprehend
what truly creates satisfied customers has lead to an ever increasing body of literature
surrounding satisfaction, how service providers create satisfied customers and the effects
that satisfaction has on businesses today (Oliver, 1997; Barsky & Nash, 2002).
McKenna (1991) suggested that in order to achieve satisfied customers,
organizations must forget about market surveys, advertisements, and promotions and
focus on developing the right infrastructure that offers the right products and services that
meet the customer�s expectations. To a certain degree, relationships may keep the
customer loyal but the customer must be fulfilled on other levels too; thus, the customer
must be truly satisfied with the quality and value of the services and products. For

19
example, if a customer chooses to stay at a luxury hotel, he or she must receive
accommodations and services that correspond with other luxury properties and find value
in the price paid to truly be satisfied.
Scholars have contributed volumes of research to support the importance of
satisfaction in the service industry. Blodgett, Granbois, and Walters (1993) revealed that
satisfied customers are far more valuable to a service organization when compared to
dissatisfied customers; thus, the organization�s primary objective should be to satisfy the
customer. Through the years, research in professional, as well as trade publications, have
justified the importance of satisfaction. In response to the vast amounts of research,
service providers have slowly come to realize that satisfied customers are truly assets to
the organization. On the contrary, in 1996, Luchars and Hinkin acknowledged that
managers typically choose to ignore satisfaction and service quality research and
suggested techniques since direct operating costs could not be accurately measured or
associated with specific instances of good or bad service. This in turn, led justification
for a manager to rely on data collected from the tangible or quantifiable measurements in
order to make managerial decisions. However, in consideration of the ramifications,
when customers are satisfied, they are likely to participate in favorable behavior toward
the provider, i.e. positive word of mouth advertising, willingness to recommend, revisit
intentions, decreased price sensitivity over time and their willingness to participate in
research to help the organization revolutionize.
It is no surprise that satisfied customers are truly invaluable to an organization.
However, at the opposite end of the spectrum, service providers are still faced with the
negative consequences from the dissatisfied customer. One of the most significant

20
problems with dissatisfied customers is that some customers choose not to complain in
order to avoid confrontation or to save the employee from being reprimanded.
Nevertheless, with each dissatisfied customer who chooses not to complain, the service
provider losses the opportunity to rectify the situation and return the customer to a
satisfied state. In addition to possibly loosing the customer, the service provider also
misses the opportunity to fulfill a commitment to continuous quality improvement. The
quality and approach to service recovery will be discussed later in this chapter; however,
for now, it is important to recognize that dissatisfied customers can be far more damaging
to an organization than satisfied customers can be beneficial.
SATISFACTION DEFINED
Throughout the 1980s and the1990s, Oliver�s research and definitions of
satisfaction revolved primarily around transaction-specific satisfaction. As one of the
most widely accepted definitions, Oliver (1981) defined satisfaction as �an evaluation of
the surprise inherent in a product acquisition and/or consumption experience. Thus,
satisfaction is the summary psychological state resulting when the emotion surrounding
disconfirmation expectations is coupled with the consumer�s prior feelings about the
consumption experience� (p.27). In 1997, Oliver further clarified satisfaction when he
stated �satisfaction is the consumer�s fulfillment response. It is a judgment that a product
or service feature, or the product or service itself, provided (or is providing) a pleasurable
level of consumption-related fulfillment, including levels of under-or-over fulfillment�
(p.13).
Past research has also presented various theories, models and definitions to
explain and justify the importance of satisfaction. Opposed to a transaction-specific
21
approach to satisfaction, Fornell (1992) described satisfaction as the cumulative overall
evaluation of a customer�s purchase and consumption experience based on numerous
interactions between the customer and the service provider. To support the importance of
cumulative satisfaction, Olsen and Johnson (2003) found that customer loyalty and
repurchase intentions are based on a broader consumption history and are able to explain
more variation in loyalty; therefore, service providers must focus on satisfaction over the
course of the service provider-customer relationship.
SATISFACTION AND DISSATISFACTION
Edvardsson, Johnson, Gustafsson and Strandvik (2000) pointed out that as the
hospitality industry continues to grow, the need for having the competitive advantage
becomes more important. A dissatisfied customer can be one of the biggest liabilities to a
service organization. In 1993, Blodgett et al. reported that a dissatisfied customer told an
average of nine people about their negative experience. As a result, his research also
found that service organizations lost an average of twelve percent of their annual
customer volume each year due to poor quality service.
Unfortunately, a large majority of dissatisfied customers choose not to complain
and never seek redress for the failed service attempt; thus, leaving the organization
dissatisfied with intentions to never return and to share their negative experience with
others. Just as satisfied customers reward the organization with loyalty and positive
word-of-mouth advertisement the chain reaction of dissatisfaction can also create a ripple
effect.
Overall, satisfaction or dissatisfaction is typically determined by the combination
of various fundamentals. First, in order for the guest to decide if he or she is truly
22
satisfied with the product or service, the guest must process the activities surrounding the
service encounter as well as the quality of the service or product itself. In addition,
satisfaction typically is collective observations over a period of events. Thus, to
determine a customer�s satisfied or dissatisfied state a customer should experience a
product or service over a period of time and numerous service encounters.
DISCONFIRMATION THOERY
To summarize the various definitions of satisfaction; customer satisfaction starts
at the moment consumption begins and carries through during the entire service
encounter. In addition, satisfaction is also the end result of post-consumption evaluations
and judgments of a product or service over the service provider-customer relationship.
Martin (2007) also indicated that although a customer could be satisfied at the end of a
service encounter, the customer could still be unhappy with the end result, alluding to the
fact that expectations play a large role in the evaluation of customer satisfaction.
The determination of what truly satisfies a customer is a fundamental element to
successful service. For some service providers it appears that the organization has a
natural ability to satisfy customers. For some, lines of communication, pleasant gestures
and perfecting the intangible elements appears to be less cumbersome. For a service
provider capable of delivering this level of service, evaluating a customer�s degree of
satisfaction may seem to a valued practice of continuous quality improvement. Yuksel
and Rimmington (1998) justifed that service providers who evaluate a customer�s
satisfaction level and apply that knowledge to improve on service delivery are typically
positioned to have a greater advantage over the competition. In a more detailed
explanation, they continue by stating that the benefits of customer satisfaction evaluation

23
is central when identifying product and service differentiation, increasing customer
retention, creating intentions to recommend, and encouraging positive word of mouth
communication (Yuksel & Rimmington, 1998).
While early research considered the satisfaction construct a form of attitude,
considerable research in the late 1980s revealed that satisfaction is notably more complex
and that measurement issues are numerous (Cooper, Cooper & Duhan, 1989).
Researchers have developed various competing models and theories of measurement
approaches for satisfaction (Yuksel & Rimmington, 1998); however, the most commonly
used representation of customer satisfaction is the disconfirmation approach
(Ramaswamy, 1996).
Disconfirmation theory has shown that satisfaction is directly related to the
variation between a customer�s pre-purchase expectations and their post-purchase
perceptions of the actual service encounter. Festinger (1957) suggested that
Disconfirmation Theory is based on cognitive dissonance and the way people respond to
their level of dissonance. Festinger (1957) explained that dissonance is a psychological
state where a person feels uncomfortable with his or her decision or situation. When
dissonance is present in a service scenario, the service provider has the responsibility to
reduce the level of dissonance and reassure the customer that his or her decision was the
correct decision; and deliver a satisfactory experience. The researcher also explained that
dissonance tends to be a motivating factor; thus, new events or new information may
become apparent to a person; this could possibly defuse or magnify the level of
dissonance. This process aids a customer�s evaluation of the service scenario, which in
turn, determines the customer�s level of satisfaction or dissatisfaction.

24
Oliver�s (1997) perspective on disconfirmation theory is the extent of satisfaction
or dissatisfaction that a customer has with a particular service encounter. Thus, it is the
process the customer goes through to determine the disconfirmation between the
customer�s expectations of performance and the actual perceived performance of the
service encounter. Whether the product or service meets the customer�s expectations or
fails to meet expectations will determine the customer�s level of satisfaction or
dissatisfaction. Differences between the expected service and the actual service
experience are referred to as disconfirmation.
When comparing expectations with performance, three outcomes are possible; 1)
if the service experience exceeds the customer�s expectations, the customer will
experience positive disconfirmation; which in turn, high levels of satisfaction will be the
end result, 2) if the service experience simply meets the customer�s expectations and the
service provider does not have a unique or over-zealous approach to service; zero
disconfirmation occurs, and 3) if the service experience fails to meet the customer�s
expectations, the customer will experience negative disconfirmation; which in turn, some
degree of dissatisfaction will be the end result. The various components that correspond
with disconfirmation such as the degree of disconfirmation, a customer�s prior
experience, tolerance level and the attributes that surround service failures and recovery
efforts will be evaluated later in this chapter; however, it is important to recognize that
disconfirmation will differ from customer to customer and in the severity that surrounds
the disconfirmation. For example, a customer dissatisfied over a poor quality cup of
coffee will have a different degree of disconfirmation in comparison to a customer being
dissatisfied over the poor quality or cleanliness of a luxury hotel room.

25
As seen in Figure 1, Wirtz and Bateson (1999) demonstrated a model to signify
the path of disconfirmation and the zones of tolerance that accompany disconfirmation.
As stated earlier, the disconfirmation model is one of the most recognized representations
of customer satisfaction in literature today (Ramsaswany, 1996). Wirtz and Bateson
(1999) explain that �almost all customer satisfaction models are based on some sort of
comparison process, and the most widely used conceptualization, the disconfirmation-of-
expectations model, which compares pre-consumption expectations with performance
perceptions (p.83).
Figure1. Disconfirmation-of-Expectations Model
Source: (Wirtz & Bateson, 1999)
In addition to the disconfirmation theory, a customer�s demand for quality also hinges
greatly on the equity theory. Equity theory suggests that consumers evaluate service
experiences by assessing the balance between what they receive and what they expect
(Susskind, 2001). Since customer expectations play a significant role in service quality,
Expected Quality
Perceived Quality
Disconfirmation
Satisfaction

26
the disconfirmation theory and equity theory serves as key elements in measuring how
customer needs and expectations are changing in response to the changing market.
Customers enter into a service scenario, especially in the hospitality industry, with
predetermined expectations and interests. In addition to their predetermined
expectations, customers tend to evaluate a service organization based on various
attributes such as the quality of food, ambiance, décor, and personal attention. In many
situations, a customer tends to follow their own personal unwritten rules of service
quality, thus, if expectations are not fulfilled, a guest may consider the service encounter
to be lacking in quality; therefore, leaving dissatisfied.
ZONES OF TOLERANCE
The existing body of literature on satisfaction suggests that the customer�s
expectations prior to the service encounter are necessary factors in determining their
degree of satisfaction or dissatisfaction. The zones of tolerance are defined by Zeithmal
and Bitner (2000) as the level of service that each individual customer will accept in each
service scenario. For some customers, zones of tolerance may be minimal; demanding a
more perfected approach to service. Other customers may have a larger zone of tolerance
where he or she may be more tolerant to imperfections. Research suggested (Zeithmal &
Bitner, 2000; Hoyer & MacInnis, 2001) that customers with demanding schedules or who
are limited for time may have a minimal zone of tolerance compared to customers who
have more flexibility or who are seeking a relaxed service experience. In addition, Hoyer
and MacInnis (2001) cautioned that customers place more emphasis on certain service
encounters than others.

27
The underlying message to satisfaction research is that satisfaction plays a vital
role in the success of any service organization; especially in the hospitality industry. As
most organizations will attest, customer satisfaction is the key to repeat customer
visitation, customer loyalty, their willingness to recommend and the ability to obtain and
retain quality employees. In respect to the above, organizations would be remiss to
disregard the impact on the financial stability, additional resources, higher wages and,
last but not least, a healthy bottom line.
THE SERVICE PROFIT CHAIN
In the early 1990 researchers explored the impact of service quality, customer and
employee satisfaction and loyalty. As an end result the Service Profit Chain was created
and the relationship between satisfaction, dissatisfaction and the organization�s success
emerged. In 1994, researchers, Heskett, Jones, Loveman, Sasser and Schlessinger
researched the potential relationships between service quality, customer loyalty,
profitability, employee satisfaction and productivity. The end result of their research was
the creation of the Service Profit Chain. Their justification for the creation of the model
was as follows:
Heskett, Jones, Loveman, Sasser and Schlessinger (1994) stated:
�The economics of service requires innovative measurement techniques. These
techniques calibrate the impact of employee satisfaction, loyalty and productivity
on the value of products and services delivered so that managers can build
customer satisfaction and loyalty and assess the corresponding impact on
profitability and growth. In fact, the lifetime value of a loyal customer can be

28
astronomical, especially when referrals are added to the economics of customer
retention and repeat purchase of related products� (p.164).
The Service Profit Chain, featured in Figure 2, demonstrates the relationship
between profit and growth, customer satisfaction and loyalty, the value of services and
goods delivered to the customer, employee satisfaction, loyalty and productivity and what
is labeled as internal service quality signifying that employees have to deliver results to
customers in every service encounter.
Figure 2. The Service Profit Chain
Source: (Heskett, Jones, Loveman, Sasser and Schlessinger, 1994, p.19) Based on their research, the strongest link in the Service Profit Chain was that
between customer satisfaction and service value. Typically, customers tend to seek
service quality processes that correspond with the price paid. If the customer feels that
the value exceeds the price paid, the customer is, most often, satisfied with the service
Internal Service Quality
EmployeeSatisfaction
Employee Productivity
EmployeeRetention
ExternalService Value
Customer Satisfaction
Revenue Growth
Profit
CustomerLoyalty

29
encounter. From a different perspective, customer loyalty linked to customer satisfaction
exhibited to be the least reliable link in the Service Profit Chain. Reichheld (1996)
suggested that the services that satisfy customers may not always be the same services
that engender loyalty to service organizations.
Loyalty to the service organization will be covered later in this chapter; however,
once again, it is important to draw attention to Heskett�s et al. (1994) findings. Their
research revealed that short-term measures of the loyalty-satisfaction relationship could
be disrupted by situations such as competitive price reductions, special trail offers, or
even creative marketing schemes. This in turn, may entice customers to patronize the
competitor and remove the current service provider from their radar, regardless of the
level of satisfaction the customer has received in the past. Reichheld and Sasser (1990)
tested relationships between market share and profitability in service organizations and
found that service organizations with higher levels of customer loyalty also enjoyed
higher profitability in a given industry, and loyal customers also became more profitable
over time.
In conclusion, research regarding the Service Profit Chain also revealed that
employee productivity is linked to loyalty. Heskett et al. (1994) explains that traditional
measures of the losses incurred by employee turnover concentrate only on the cost of
recruiting, hiring, training and replacing employees. However, the focus of this study is
to explore the significant loss in quality and customer satisfaction.
QUALITY
Service providers have a direct influence and control over the customer�s degree
of satisfaction through the quality of the products and services provided. As global
30
competition and market saturation changes the expanding service sector, quality plays an
increasingly pivotal role in both attracting and retaining service customers (Jenson &
Markland, 1996). Service quality research has addressed a variety of fundamentals to
assist organizations in creating satisfied customers. Research topics have focused on the
implementation of a service quality strategy, anticipation of customer expectations and
perceptions, and customer satisfaction and dissatisfaction.
In addition to the above, researchers also continue to contribute to the body of
knowledge regarding the most effective and reliable forms of service quality
measurement. The object of this section is to reveal and discuss the various definitions
and models surrounding service quality. In addition, this section will also evaluate the
important role that quality plays in service failures and service recovery.
QUALITY DEFINED
Namasivayam and Hinkin (2003) revealed that the service industry has
experienced a continuous transformation over the past decade. As a part of the
transformation, creating a quality culture within the organization has become apart of the
core values and mission of many organizations. Although most strive to provide quality
service and products, customer dissatisfaction, developing customer relationships and
creating loyalty appears to be a momentous challenge; especially in the hospitality
industry. As customer demands steadily increase and new players in the industry
continue to raise the bar, the need for a quality approach to service and products
intensifies.
There are numerous definitions that facilitate service quality. The nature of a
service encounter is defined as the customer�s perception and expectations of all activities

31
involved in the service delivery process; therefore, defining quality can be relatively
challenging. O�Neill (2001) acknowledged that the definitions of quality can be united
into one concept of consumer-perceived quality, where quality can be defined only by
customers and occurs where an organization supplies goods and services to a
specification that satisfies their needs. The process involved in maintaining and
measuring the quality of goods can be easily defined and implemented. Goods quality is
tangible and can be measured by objective indicators like performance, features, and
durability (Najjar & Bishu, 2006). However, service quality is intangible; therefore, the
definition, strategic process and implementation of a service quality concept become
more complex in nature.
Lovelock (2001) suggested that the rationalization for defining and determining
levels of quality in service corresponds with the ever-changing customer perception and
expectations and how well the organization can accomplish service quality standards. In
addition to the above, research also suggests that successful organizations are able to
diagnose their customer�s expectations fully and satisfy them completely, during each
and every service encounter (Zemke & Schaaf, 1990; O�Neill, 2001). Oliver (1997)
explained that quality depends primarily on two aspects 1) the product or service being
evaluated and 2) the person who is evaluating. Thus, the evaluation and judgment of
quality lies in the eye of the beholder. Gronroos�s (2001) research presented a practicum
or hands-on approach to understanding quality, suggesting that quality is evaluated in two
forms 1) technical quality or what is delivered and 2) functional quality or how is it
delivered.
THE CHALLENGE WITH SERVICE QUALITY IN HOSPITALITY

32
Although research provides a plethora of ways to evaluate service or product
quality, the various definitions stated above shed light on the true challenge in evaluating
quality. The challenge in the process of service quality is that various customers,
organizations, researchers and educators utilize different fundamentals to assess quality.
In 1998, Zeithaml defined service quality as the consumer�s judgment of the overall
excellence and superiority of the service encounter. Although the approach to service
quality is constantly changing the essential foundation of service quality remains.
Managers need to understand quality and how to encourage their staff to implement
quality standards and services on a daily basis. However, given the complex nature of
quality, the challenge remains not only in the definition but in the approach and the
continuous process implemented to maintain quality. O�Neill (2001) explains that given
the increasingly competitive nature of the hospitality industry, professionals must
concern themselves with a minimal increase in the market share and ways to maintain
their existing customer base. The intense competition and market saturation deems
pressure placed on service organizations to strive for quality and excellence.
Nonetheless, Lockwood (1996) believed that the pressure on organizations to achieve
quality comes from three main sources; 1) consumers are more demanding of the
products and services they buy, 2) the development of sophisticated technology allows
organizations to offer convenient, personal services that are highly valued by the
customer, and 3) in an increasingly competitive and international marketplace, quality is
seen as providing the edge of competitive advantage.
In various sections throughout this chapter, as well as throughout this research,
the importance of the intangible elements in the hospitality industry has been discussed.
33
It has been suggested that a number of characteristics in tourism, hospitality and leisure
services distinguishes the intangible characteristics from physical goods (Berry, Zeithaml
& Parasuraman, 1985; O�Neill, 1992; Reisinger, 1992,). O�Neill (1992) continued by
stating that not only do these differences make the service industry unique, each entity
comes with its own set of challenges that must be overcome by the service organization.
As each entity is faced with the challenge of balancing the intangible characteristics
along with the physical goods, maintaining quality standards is more cumbersome.
Reisinger (1992) explains that one of the most significant implications for the
intangible nature of the hospitality industry is that the services can not be displayed,
sampled, tested or evaluated before coming in contact with the customer. The researcher
continues to explain that hospitality services are typically produced, sold and consumed
in the same location; thus, it is difficult to attain inseparability between production and
consumption. Many service organizations struggle when trying to deliver the same
quality service and product regardless of the time of day, employee or employees
responsible for the task or the manager on duty. In consideration of various attitudes
toward service and quality, in addition to the labor intensive environment, it is often
cumbersome to have every employee of a hotel or restaurant performing in unison; doing
things right the first time and every time (Berry, Zeithaml & Parasuraman, 1985;
Resinger, 1992).
As heterogeneity has been discussed in a previous section of this chapter, it only
seems fitting to revisit the heterogeneity characteristic once again in regard to quality.
O�Neill (1992) explained that the differences within each hospitality service entity are
unique in nature and are forced to confront their own quality service obstacles on a daily

34
basis. To add to the vast business or operation variations, heterogeneity forces hospitality
professionals and researchers to explore the quality dilemmas created by people. The
service industry, in particular the hospitality industry, has been built on people delivering
a service or creating a product for other people. Thus, since the service experience varies
from employee to employee and customer to customer each service experience is unique.
Just as the concept of perishability was discussed in service, it also applies to
service quality in the hospitality industry. Services in the hospitality industry can not be
reserved for a later date or frozen in time. Services, tangible or intangible, are time
sensitive and short-lived; thus, managers and employees have a small window of
opportunity to create the service quality experience, satisfy the guest and create a loyal
customer. The perishability characteristic makes the delivery of quality services and
products urgent to customer satisfaction, loyalty and a healthy bottom line. For example,
a hotel room that is not filled for the night or a seat on an airline flight not filled at the
time of take-off is lost potential profit.
SERVICE QUALITY AND SATISFACTION IN HOSPITALITY
Ramaswamy (1996) suggested that a lack of quality service or meeting
customers� expectations will result in a lack of customer satisfaction (O�Neill, 2001).
When customers are satisfied with the organization�s tangible goods and service efforts,
customers are more inclined to be loyal to the organization and continuously show their
support through repeat visits and positive word-of-mouth advertising. When service
quality and customer satisfaction are analyzed research tends to aim toward the
disconfirmation theory. As outlined in a previous section, the difference between the
customer�s expectations and perception is defined as positive or negative

35
disconfirmation. There appears to be an on-going debate in quality research today. Some
researchers suggest that service quality is a vital antecedent to customer satisfaction
(Berry, Zeithaml & Parasuraman, 1985; Cronin & Taylor, 1992; O�Neill, 1992).
However, on the opposite side of the debate, many researchers suggest that customer
satisfaction is a vital antecedent of service quality (Oliver, 1981; O�Neill, 1992). Either
way, it appears that both customer satisfaction and service quality are vital to the overall
success of today�s hospitality professionals (O�Neill, 1992).
In the hospitality industry today service quality and customer satisfaction are two
critical elements to most organizations. Professionals are constantly searching for new
and exciting ways to promise more than the competition and deliver on their promise.
O�Neill and Palmer (2004) explained that service quality and the degree of satisfaction
derived from service quality is becoming the single most important differentiating factors
in almost every hospitality environment. For the hotel industry, the increasing
competition and expansion of unique services and amenities has forced hoteliers to
continuously search for the competitive advantage. Today, customers have an abundance
of options when traveling. Customers are educated, well traveled and notorious for
conducting extensive research before selecting that perfect hotel, restaurant, resort, or
cruise line experience. Individual hospitality organizations face a significant challenge
when they attempt to deliver quality service to create satisfied customers; customers who
will hopefully demonstrate their loyalty to one exclusive brand.
In an effort to obtain service quality standards and strive for customer satisfaction,
many hospitality organizations have implemented continuous quality improvement
strategies to deliver on their promises. The measurement and testing of service quality

36
signifies the organization�s commitment of quality to the customer. Customers often
view service quality as the organization�s demonstration of respect and appreciation. In
cultivating a continuous quality improvement effort, one of the most important forms of
analysis is to focus on the customer�s opinions and feedback. An integral part of any
organization�s attempt to instill a �quality culture� is a commitment to a process of
�continuous improvement� (Witt & Muhlemann, 1995; O�Neill, 2001). In order to
remain competitive in the marketplace and to be recognized as a leader in service quality,
an organization must continue to utilize different forms of formal and informal
measurements. As O�Neill (1992) explained in detail,
�in an attempt to achieve a sustained competitive advantage, hospitality
organizations are inventing heavily into a host of service quality improvement
initiatives. Whether formal or informal styles of analysis, most initiatives stem
from the British Standards Institute, the European Quality Award, the Malcolm
Baldrige National Quality Award, the Edwards Deming Prize or derivatives
thereof. In addition, the hospitality industry has also been investing quite heavily
in raising quality standards through human resource development. Such
initiatives include the Investors in People Award, the Welcome Host initiative,
and various vocational qualification schemes� (p.167).
THE MEASUREMENTS OF SERVICE QUALITY
As the need for service quality escalates, the need for continuous quality
improvement measurement becomes prominent. Gronroos (1983) provided the
groundwork for service quality models utilized in research today. The Service Quality
Model consists of two main parts, technical quality and functional quality. Gronroos

37
(1983) explained that technical quality is what the customer actually receives from the
interactions with the service organization. Functional quality is the way in which the
technical quality is delivered to the customer. The two combine create Image or the
service organization�s reputation. Finally the three elements together create experienced
quality. The combination of technical quality, which is tangible in nature, paired with
functional quality, which are intangible in nature, leads to the overall satisfaction level
(Gronroos, 1983). Gronroos (1983) further explained that the overall level of satisfaction
depends on the customer�s expectations when entering into the service experience and
how the experienced quality measures up in the end. As expressed in Figure 3,
Gronroos�s (1983) Service Quality Model shows that technical quality and functional
quality are interrelated and directly affect the Image portrayed to the customer. This in
turn leads to Experienced Quality. Within experienced quality there are two areas; 1)
experienced service as it relates to technical quality and experienced service as it relates
to functional quality.
Figure 4. Service Quality Model
Experienced Service
Image
Functional Quality
TechnicalQuality
Experienced Service
Experienced Quality
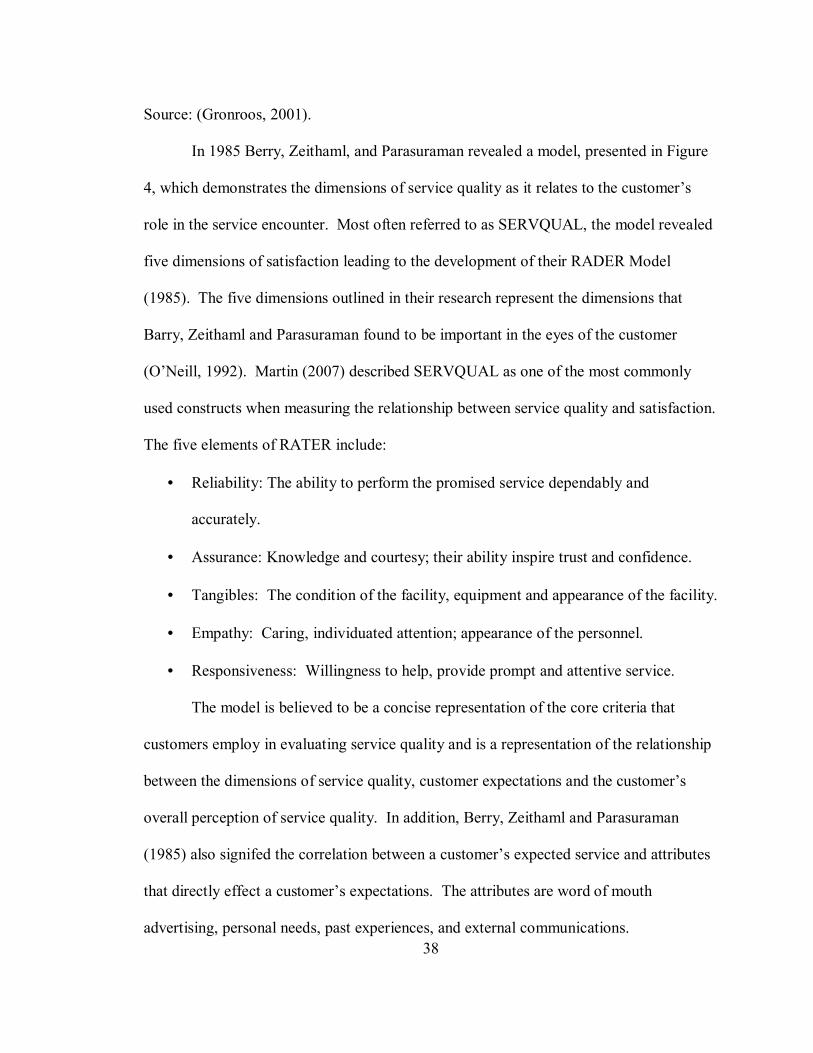
38
Source: (Gronroos, 2001).
In 1985 Berry, Zeithaml, and Parasuraman revealed a model, presented in Figure
4, which demonstrates the dimensions of service quality as it relates to the customer�s
role in the service encounter. Most often referred to as SERVQUAL, the model revealed
five dimensions of satisfaction leading to the development of their RADER Model
(1985). The five dimensions outlined in their research represent the dimensions that
Barry, Zeithaml and Parasuraman found to be important in the eyes of the customer
(O�Neill, 1992). Martin (2007) described SERVQUAL as one of the most commonly
used constructs when measuring the relationship between service quality and satisfaction.
The five elements of RATER include:
• Reliability: The ability to perform the promised service dependably and
accurately.
• Assurance: Knowledge and courtesy; their ability inspire trust and confidence.
• Tangibles: The condition of the facility, equipment and appearance of the facility.
• Empathy: Caring, individuated attention; appearance of the personnel.
• Responsiveness: Willingness to help, provide prompt and attentive service.
The model is believed to be a concise representation of the core criteria that
customers employ in evaluating service quality and is a representation of the relationship
between the dimensions of service quality, customer expectations and the customer�s
overall perception of service quality. In addition, Berry, Zeithaml and Parasuraman
(1985) also signifed the correlation between a customer�s expected service and attributes
that directly effect a customer�s expectations. The attributes are word of mouth
advertising, personal needs, past experiences, and external communications.

39
Figure 5. RATER Model
Source: (Zeithaml, Parasuraman & Berry, 1985).
Research suggests that SERVQUAL measurement is the most common method
used in academia and the service industry. According to Shahin (2005), SERVQUAL is
the most reliable option of service quality measurement for three reasons 1) it allows for
comparison before and after changes, 2) the location of quality related problems can be
identified, and 3) organizations can establishment clear standards for service delivery. In
addition, SERVQUAL has become the most often used form of measurement due to its
capabilities to examine the customer�s expectations before the service encounter and to
compare the customer�s expectations with their perception after the service encounter
(Shahin, 2005).
Dimensions of Service Quality Tangibility Reliability Responsiveness Assurance Empathy
Word of Mouth
External Communic
ations
Past Experience
Personal Needs
Expected Service
PerceivedService
Perceived Service Quality

40
Although SERVQUAL is applied in numerous studies, there appears to be
numerous challenges with the theory of SERVQUAL. As Parasuraman, Zeithaml and
Berry (1985) recognized in their research, SERVQUAL was developed with the belief
that the measurement of service quality in the eyes of the customer is paramount. When
customers evaluate the service process, they evaluate both the tangible and intangible
elements of their service experience; however, the ways in which customers evaluate the
two differ dramatically (Parasuraman, Zeithaml & Berry, 1985; Oliver, 1997).
Coulthard�s (2004) evaluation revealed that SERVQUAL has generated more criticism
that any other service quality model. The criticisms span across various elements
including: 1) conceptual basis, 2) process orientation, 3) dimensionality, 4) the use of gap
scores, 5) different scores, 6) problems in interpretation of the midpoint on Likert scales,
and 7) order effects (Coulthard, 2004). Coulthard (2004) continues by stating:
�it is apparent from recent research that SERVQUAL encapsulates only certain
aspects of service quality, and that it fails to capture other potentially less
controllable components that may have a greater impact upon evaluations of the
quality of the service provision� (p. 483).
To evaluate the challenges with SERVQUAL further, Cronin and Taylor (1992)
found that SERVQUAL confuses satisfaction with attitude. Their research revealed that
service quality can be conceptualized as attitude and can be operationalized by the
adequacy-importance model. In addition, they also found that performance-expectation
determines service quality opposed to performance alone. This in turn led to the
development of SERVPERF. Martin (2007) explains that where SERVQUAL appeared
to have a good fit in only two of four industries examined, SERVPERF had an excellent

41
fit across all four industries. Lee, Yoo and Lee (2000) found a similar result from their
regression analysis research on SERVPERF.
O�Neill and Wright (2002) revealed that when customer expectations are not met,
the customer will experience a gap between their experience and their expectations; thus,
resulting in a lower level of service satisfaction. O�Neill and Wright (2002) argued that
the gap between the customer�s expectations and the customer�s experience can directly
affect the customer�s desired level of satisfaction or force the customer to be completely
dissatisfied. As stated earlier, the perception of service quality is one of the most
prominent challenges in a continuous quality improvement process. This sheds light on
another common model applied in service quality research referred to as the Gap Model.
The Gap Model, Figure 6, was developed by Parasuraman, Zeithaml and Berry in 1985.
The model identifies five gaps or factors that define and explain problem situations in
service quality and customer satisfaction. Parasuraman, Zeithaml and Berry (1985)
presented the Gap Model as follows:
• Gap 1: Consumer Expectations � Management Perception. Gap 1 occurs when
management fails to properly perceive the customer�s service expectations.
Rosen (2003) outlines three situations that may create the Consumer Expectations
� Management Perception Gap. First, managers assume they understand the
customer�s needs without conducting the necessary market research. Second,
managers fail to dedicate the needed time to talk with the customer and truly
dissert their needs or expectations. Finally, with some service organizations, the
numerous layers of management often cause a communication breakdown; thus,

42
the right managers or employees are not truly aware of the customer�s needs or
expectations.
• Gap 2: Management Perception � Service Quality Specifications. Gap 2 occurs
when management has the wrong perception of the intended service quality
standards. Service organizations rely on the members of management to
implement and maintain service standards. Often service organizations struggle
with sub-standard expectations for tangibles, the service process or employee
qualifications; thus, managers may expect more of their employees than what they
are trained or qualified to deliver. Contrary to that theory, managers tend to focus
on short-term goals, profits and cost reduction opposed to quality standards and at
times this creates a lackadaisical approach to maintaining quality standards set by
the organization. Therefore, allowing employees to maintain lesser standards.
• Gap 3: Service Quality Specifications � Service Delivery Gap. Gap 3 constitutes
a breakdown in employee � management communication. Some organizations
suffer from significant communication breakdowns where employees are not
properly trained or qualified to meet the standards; therefore, employees do not
correctly translate the standards or guidelines into action. In addition to poorly
trained or qualified, problems with teamwork, poor or inadequate equipment, or
poor technology also lead to Gap 3 in the service quality breakdown.
• Gap 4: Service Delivery � External Communication Gap. Gap 4 represents a
breakdown in external communications between the service organization and the
customer. This is a service situation where the customer�s needs and expectations
are not truly understood and do not match the service delivery. Some

43
organizations have a tendency to over promise on their service quality ideals
through their mission statement, formal goals and objectives; however, they fall
short in delivering on their promises. Gap 4 can be created by two separate
breakdowns in communication. As discussed above, a communication
breakdown between the service organization and the customer is not the only
problem area to consider. In addition, Gap 4 refers to the communication
breakdown between the marketing and public relations departments and the front
line management or employees. Either interruption in communication or service
delivery can cause customer dissatisfaction.
Figure 6. Gap Model of Service Quality
Word-of-Mouth Communication
PerceivedService
ServiceDelivery
Translation of Perception into Service Quality
Management Perceptions of
Consumer
ExpectedService
Personal Needs
External Communications
to customer
PastExperience

44
Source: (Parasuraman, Zeithaml and Berry, 1985).
There are numerous reasons for evaluating the importance of service quality in a
hospitality setting. With the constantly changing demands and expectations of the
customer, many service organization focus on service and product quality as a way to
differentiae themselves from the competition. As a general rule, most service
organizations strive for service excellence in an effort to truly satisfy the customer, offer
value and become a leader within their segment of the industry. However, over the past
decade service organizations have repositioned their thinking on quality to include
customer satisfaction and loyalty (Johnson & Gustafsson, 2000). Johnson and
Gustafsson (2000) explained that quality, customer satisfaction and loyalty form a chain
of cause and effect that build on one another and can not be treated or managed
successfully as individual segments of the business.
LOYALTY
Many service organizations allocate substantial resources to measure and monitor
quality, satisfaction and loyalty in an effort to retain customers and improve service
offering. Yet, in the service industry, customer satisfaction and service quality does not
always lead to the ultimate aspiration of loyalty. Due to the benefits or retaining existing
customers, the development of customer loyalty has become an important focus for
marketing strategy research in recent years (Gwinner, Gremler, & Bitner, 1998; Hagen-
Danbury & Matthews, 2001; McMullan, 2005). According to Olorunniwo, Hsu and Udo
(2006), loyal customers impact the profitability and overall success of the organization in
three ways. First, a customer�s repeat business generates income for the company,
second, due to the cost of marketing and advertising, an organization makes less of a

45
financial commitment in retaining customers compared to recruiting new customers and
third, loyal and satisfied customers often spread the good news and recommend the
services to others.
Although the study of customer loyalty has been of interest over the past decade,
most service organizations� approach to measuring customer loyalty has changed
significantly. At one time, customer loyalty research concentrated primarily on buying
behavior; promoting the vast development of reward and points systems; however, more
recent research efforts focus on customer�s expectations, perceptions and attitudes toward
loyalty (Mason, Tideswell & Roberts, 2006). In the on-set of loyalty research, the
behavioral perspective of customer loyalty was less cumbersome to measure. However,
Reichheld (2003) explained that the problems associated with behavioral research are that
loyalty is much more than repeat purchases. Some customers may consider themselves
loyalty to an organization but their buying may be out of inertia, or exit barriers opposed
to loyalty. This in turn has created the need for researchers to explore the significance of
customer expectations, perceptions and attitudes and how the three directly influence the
customer�s future behavioral intentions.
In 1999, Shoemaker and Lewis introduced a concept that the service organization
must execute three functions of in order to engender customer loyalty. The contribution
of their research resulted in the introduction of The Loyalty Triangle; an equal lateral
triangle with each side representing one of the functions needed to execute loyalty.
Featured in Figure 7, a summary of Shoemaker and Lewis�s (1999) description is
explained below. The first side of the triangle is labeled as process or how the service
works. For the customer, the process includes everything that happens from the time they

46
enter into the service experience to the time the service experience ends or the customer
leaves the property. The second side of the triangle is Value Creation. Value Creation
has been divided into two components; value added and value recovery. Value added
includes strategies that increase the long-term value of the relationship with the service
organization. Value Recovery was designed to rectify a service problem or failure that
may occur during the service experience. The last side of the triangle is Database
Management and Communication. This side incorporates the importance of
communication between the service organization and the customer. Communication can
take many forms such as newsletters, advertisements, special promotions, or courtesy
calls to notify the customer of special events, featured favorites or limited availability.
Figure 7. The Loyalty Triangle
Source: (Shoemaker & Lewis, 1999)
LOYALTY DEFINED
There are many definitions of loyalty that make the overall concept and the ability
to measure customer loyalty somewhat burdensome. In 1969, Day revealed that the
concept of customer loyalty was the combination of repeat purchases from one service
CustomerProcess Value Creation
(Added and Recovery)
Database Management/
Communication

47
provider or brand coupled with the customers� psychological attachment toward the
provider. Newman and Werbel (1973) defined loyalty as those who repurchased a brand,
considered only that brand, and did no brand-related information seeking. In 1978,
Jacoby and Chestnut stated that the only way to understand brand loyalty was to examine
the belief, attitude, and conative structure of the customer�s orientation of the focal brand.
The basis of their research proposed that all three evaluative stages had to be in place for
true loyalty to exist; therefore, the customer was able to become loyal first in a cognitive
sense, then later in an affective (attitude) sense and finally in a conative or behavioral
sense. In 1994, Dick and Basu found that customer loyalty was viewed as the strength of
the relationship between a customer�s relative attitude and repeat patronage. Their
research examined relative and attitudinal loyalty in four dimensions; true loyalty, latent
loyalty, spurious loyalty and no loyalty. Although Dick and Basu�s research has been
citied in numerous textbooks and professional articles, their loyalty segmentation does
not appear to be applied in current research (East & Sinclair, 2000).
Just as Oliver has made significant contributions to satisfaction research, his
research interests and expertise also incorporate customer loyalty. In 1997, Oliver states:
�loyalty is described as a deeply held commitment to rebuy or repartonize a
preferred product or service consistently in the future, thereby causing repetitive
same-brand or same-brand set purchasing, despite situational influences and
marketing efforts having the potential to cause switching behavior� (p. 392).
To contradict Newman and Werbel�s definition of customer loyalty, Oliver (1997) further
stated that a customer could only be loyal to a service or brand when the customer is

48
aware of the competitor�s services, amenities, and value and yet �fervently desires to
rebuy a product or service; will have no other, against all odds and at all costs� (p. 392).
In addition to his differences in the definition of loyalty, Oliver�s (1997) research
successfully modified and applied the cognition-affect-conation pattern developed by
Jacoby and Chestnut. Oliver (1999) justified his modification by suggesting that
although Jacoby and Chestnut (1978) explored the psychological meaning of loyalty to
distinguish behavioral (repeat purchase) definitions. Jacoby and Chestnut (1978) analysis
concludes that consistent purchasing as an indicator of loyalty could be invalid because
of happenstance buying or a preference for convenience and that inconsistent purchasing
could mask loyalty if customers were miltibrand loyal. Oliver�s (1999) research differs
in his viewpoint that customers can progress in their degree of loyalty at each phase and,
in order for the customer to truly be loyal, the end result must be accompanied by a final
phase of action. Oliver (1999) suggested that customers first become loyal in a cognitive
sense, then in an affective sense, later in a conative manner and finally in a behavioral or
�action loyalty� manner. Action (behavioral) loyalty, or the fourth phase of loyalty, as
suggested by Oliver (1999), defined in 1985 by Kuhl and Beckmann, as the point in time
when a customer�s intentions are converted into actions; thus, the customer�s motivated
intentions in the previous loyalty state has transformed or progressed to the point where
the customer is ready to act upon their intentions. Action is perceived as a necessary
result of engaging three phases and is accompanied by an additional desire to overcome
obstacles that may prevent a customer from patronizing the service organization (Oliver,
1999).

49
McMullan and Gilmore (2003) explored the relationship between four phases of
customer loyalty described by Oliver. The researchers explored the customer�s attitude
over the four phases of loyalty despite the impact that marketing tactics or situational
influences have on customer loyalty. As outlined in Figure 8, McMullan and Gilmore
(2003) explained that a customer begins at level 0, when he or she holds no information
or have not developed an attitude toward the product or service. During level one, the
customer develops a set of beliefs that may find a certain product or service superior to
others. Level two is the point in which the customer develops a favorable or unfavorable
attitude toward the service or provider; which in turn, leads to the third phase; the
customer�s intention to return or recommend. The fourth and final phase requires the
customer to take action and act on his or her beliefs and attitude. McMullan and Gilmore
(2003) suggested that a customer may progress through each phase of loyalty,
disregarding situational and marketing tactics. Situational tactics include poor service,
quality or service failures. Marketing tactics include advertising, promotions or other
influences the competition may create to influence a customer�s purchase.
Figure 8. The Four Phases of Loyalty
Level 0
Level 4 Action
Level 3 Conative
Level 2 Affective
Level 1 Cognitive
Phase
SituationalInfluences
MarketingTactics

50
Source: (McMullan & Gilmore, 2003).
McMullan (2005) suggested that although numerous studies have distinguished
between attitudinal and behavioral dimensions of loyalty (Jacoby & Kyner, 1973; Jacoby
& Chestnut, 1978; Dick & Basu. 1994; Knox & Walker, 2001), �these have not
adequately explored the complex inter-relationships between the two dimensions and the
dynamic processes by which loyalty is initiated and sustained� (p. 470). As customers
progress through the phases of loyalty development, the sustainers and vulnerability
elements change to reflect the degree of involvement (McMullan, 2005). This in turn led
to the need to further explore and define this element of customer loyalty; therefore,
McMullan�s (2005) research sought to once again apply Oliver�s (1997) framework to
further explore and define the dimensions of customer loyalty and the process in which
customer loyalty is initiated and sustained. The findings of the research revealed that a
customer must have a sense of loyalty to the service organization during all four phases
of the cognition-affect-conation-action pattern in order to overcome vulnerabilities
introduced by the competition. In addition, McMullan (2005) highlighted the fact that a
customer may prefer one brand or service over the others; however, if an alternative
brand or offer is more appealing and the customer feels that the preferred service
organization is not worthy of their loyalty, the possibility of switching to the competition
increases. McMullan�s (2005) contribution led to the construction of a multi-item scale
to measure customer loyalty development. McMullan (2005) supported the belief of
Reichheld (2003) when he stated:
�a loyal customer is one who values the relationship with the company enough to
make the company a preferred supplier. Loyal customers do not switch for small

51
variations in price or service, they provide honest and constructive feedback, and
provide enthusiastic referrals� (p. 126).
CUSTOMER LOYALTY AND LOYALTY PROGRAMS
Differentiating between true customer loyalty and incentive loyalty poses another
challenge when trying to measure the effectiveness of customer loyalty. In recent years
there has been a rise in the use of loyalty programs by marketers and academic
professionals in measuring loyalty (Sharp & Sharp, 1997). Loyalty programs and
incentives were perceived to be one of the most successful marketing tools of the 1990s
and have received considerable attention in both trade and academic journals (O�Malley,
1998). Although numerous organizations in the service industry have experienced much
success with loyalty reward programs, formal loyalty reward programs have not proven
to be as beneficial in the hospitality industry.
Even though evidence suggests that hotel, restaurant, airline and cruise line
customers respond favorably to loyalty programs, the �hotel rewards� and �frequent flyer
programs� were developed around transactional tactics (Bowen & Shoemaker, 1998).
Unfortunately, research has acknowledged that true customer loyalty cannot be obtained
solely by rewarding customers with such monetary-based rewards (Dowling & Uncles,
1997; Duffy, 1998). Shoemaker and Lewis (1999) indicated that true customer loyalty is
earned through the development of nonmonetary strategies that focus on the
personalization of customer services, individual recognition of the customer, and the
formation of a level of trust and commitment between the service organization and the
customers.

52
Dube and Renagham (1999) extended the notion that essentially, for a service
organization to ensure continued commitment and patronage; customers need to feel that
they are receiving additional value in return for their loyalty. To support the
effectiveness of loyalty programs in the hospitality industry Gilbert (1996) and Bejou and
Palmer (1998) reviewed the effectiveness and development of frequent flyer programs in
the airline industry. Interestingly, both studies revealed that the expansive offerings of
loyalty programs among the major airlines paired with the limitations and difficulty in
using the loyalty program resulted in a decline in traveler loyalty (Bejou & Palmer,
1998).
LOYALTY IN THE HOSPITALITY INDUSTRY
Shoemaker and Lewis (1999) defined loyalty as it pertains specifically to the
hospitality industry:
�loyalty is when the customer feels so strongly that you can best meet his or her
relevant needs that your competition is virtually excluded from the consideration
set; these customers buy almost exclusively from the preferred service
organization- referring to the organization as their hotel or their restaurant� (p.
349).
Loyalty in the hospitality industry has been one of the most researched areas in recent
years (Tideswell & Fredline, 2004) and over the last two decades, customer loyalty in
hospitality research has focused on various aspects. Knutson (1988) investigated a
customer�s likelihood to return to a hotel property based on the most important features
offered at the hotel and found that a clean and comfortable room was the determining
factor. Even though their research considered the impact of return visitation, Knutson

53
(1988) failed to investigate the effects on other loyalty related attitudes such as the impact
on word of mouth or price sensitivity issues (Tideswell & Fredline, 2004). In terms of
service quality and its effect on customer loyalty, Dube and Renaghan (1999) explored
the effect of several functional areas of the hotel on customer loyalty outcomes and found
that service quality and the quality of the employees were two of the most important
factors effecting loyalty and intentions to repurchase and recommend.
In 1999, Shoemaker and Lewis reviewed a range of loyalty-generating strategies
used in the hotel industry. Their research revealed that for true loyalty to be achieved,
service organizations should focus on customer recognition, service quality, personalized
service, emotional rewards and tailor made offers. Once again, Shoemaker and Lewis
(1999) recognized that reward programs in the hospitality industry, specifically in the
hotel segment, result in loyalty to the frequency program opposed to the actual brand or
hotel. Further contributions of their research also revealed six types of value-added or
value-recovery strategies used when generating customer loyalty. The six loyalty-
generating strategies in the hotel industry are:
• Social: Interpersonal links with the hotel via regular communications.
• Emotional: Providing a sense of recognition using guest�s names.
• Experiential: Providing extra services such as turndown services.
• Functional: Providing extra facilities such as Internet access.
• Temporal: Time savings through quick check-in services.
• Financial: Monetary savings through discounts on services.
Although their loyalty-generating strategy research does not reveal the degree of loyalty
associated with each type of strategy listed, it is reasonable to assume that the highest

54
degree of loyalty is likely to result from the Social, Emotional and Experiential strategies
with the Functional, Temporal and Financial strategies generating a lesser degree of
loyalty (Tideswell & Fredline, 2004).
As stated previously in this chapter, service quality in a vital antecedent to
customer loyalty. In 2001, Fu and Parks analyzed the relationship between service
quality and customer loyalty in elderly restaurant customers in the United States. Their
findings revealed that elderly diners were more likely to revisit a specific restaurant
because of the friendliness and empathy of the restaurant employees opposed to the speed
of service or the quality of the product. Bowen and Shoemaker�s (1998) research on
service quality and customer loyalty revealed that customer�s searched for service quality
in terms of receiving hotel upgrades, being able to request a specific hotel room or being
advised when the hotel had a special event or limited availability.
MEASUREMENTS OF CUSTOMER LOYALTY
In 2003 Shoemaker and Bowen evaluated the evolution of customer loyalty as
practiced by organizations both inside and outside of the hospitality industry. When
loyalty efforts were first realized to add value to the organization, most service
organizations relied upon the sales and targeted promotion approach (Dube &
Shoemaker, 2000). This concept offered discounts and promotions with little to no effort
being made to track the overall effectiveness of the process. As time and research efforts
progressed, the origin of the frequency programs emerged. As outlined in a previous
section, although frequency programs are beneficial to some service organizations they
were not as well received in the hospitality industry.

55
Today, many service organizations focus their loyalty efforts on building and
strengthening relationships between the service organization and the customer
(Shoemaker & Bowen, 2003). When building relationships between the customer and the
service organization, knowledge of the customer comes from asking them to provide
information on their expectations and perception of the services and products (Shoemaker
& Bowen, 2003). This in turn sheds light on the numerous antecedents of customer
loyalty. For the purpose of this study, the appropriate antecedents of customer loyalty are
service quality, satisfaction and future behavioral intentions.
Research suggests that service quality, satisfaction and customer loyalty, together,
are invaluable to service organizations; thus, the three must be managed and measured as
a cause and effect operating strategy. In fact, Olsen (2002) presented a model, featured in
Figure 9, to signify the equality of quality performance and customer satisfaction with
customer loyalty. Although the relationship between quality and loyalty and satisfaction
and loyalty were positive, results varied across the various stages of the research. Also,
results of the study did not support customer satisfaction as a mediating variable between
quality performance and customer loyalty (Olsen, 2002).
Figure 9. The Satisfaction-Loyalty Model
Source: (Olsen, 2002).
Quality Performance
Customer Satisfaction
RepurchaseLoyalty
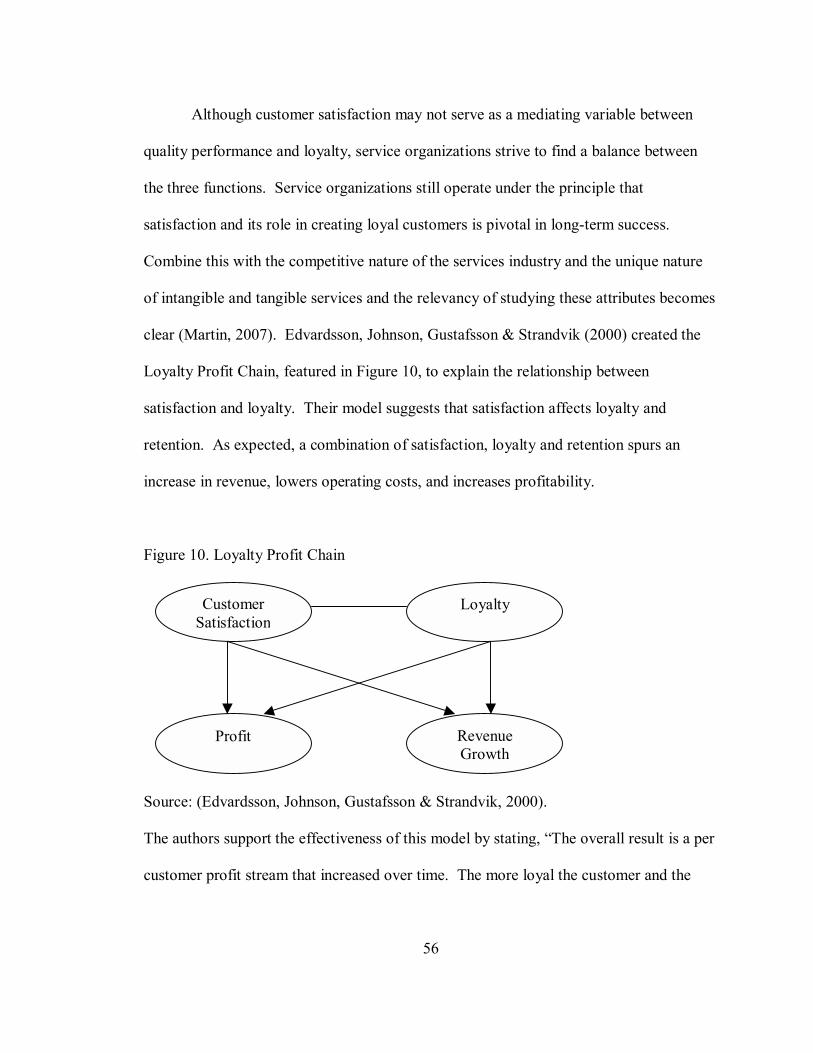
56
Although customer satisfaction may not serve as a mediating variable between
quality performance and loyalty, service organizations strive to find a balance between
the three functions. Service organizations still operate under the principle that
satisfaction and its role in creating loyal customers is pivotal in long-term success.
Combine this with the competitive nature of the services industry and the unique nature
of intangible and tangible services and the relevancy of studying these attributes becomes
clear (Martin, 2007). Edvardsson, Johnson, Gustafsson & Strandvik (2000) created the
Loyalty Profit Chain, featured in Figure 10, to explain the relationship between
satisfaction and loyalty. Their model suggests that satisfaction affects loyalty and
retention. As expected, a combination of satisfaction, loyalty and retention spurs an
increase in revenue, lowers operating costs, and increases profitability.
Figure 10. Loyalty Profit Chain
Source: (Edvardsson, Johnson, Gustafsson & Strandvik, 2000).
The authors support the effectiveness of this model by stating, �The overall result is a per
customer profit stream that increased over time. The more loyal the customer and the
Customer Satisfaction
Revenue Growth
Loyalty
Profit

57
longer the customers are retained, the more sales and profits the customer generates�
(Edvardsson, Johnson, Gustafsson & Strandvik, 2000, p. 919).
To review the importance of service quality, Zeithaml et al. (1990) stated service
quality has become a great differentiator and the most powerful competitive weapon
which many leading service organization strive to possess. Bell, Auh and Smalley (2005)
explored Gronroos�s (1983) quality model as it relates to customer loyalty. Their model,
presented in Figure 11, proposed technical service quality and functional service quality
were both antecedents to customer loyalty. In addition, Bell, Auh and Smalley (2005)
explored the effects of investment expertise and perceived switching costs.
Figure 11. The Quality-Loyalty Model

58
Source: (Bell, Auh & Smalley, 2005).
For the purpose of their study, investment expertise has been defined as the
customer�s cumulative knowledge about how a product or service should perform and a
general understanding of the competition�s performance of similar services or products
(Sharma & Patterson, 2000). Bell et al. (2005) defined switching costs as the financial or
psychological costs that a customer expects to endure if he or she would choose to
patronize a competitor. Switching costs form a significant challenge when trying to
measure true loyalty. Dick and Basu (1994) explained that switching costs can lead
service organizations into believing a customer is truly loyal to their organization, when
in reality, the customer is less than satisfied with the selected brand but fears the costs
endured in selecting a different service organization. The effect of switching costs has
been reviewed by researchers and marketers over the last decade (Patterson & Smith,
2003). Financial switching costs can be viewed by the customer as a way to trap the
customer; thus, giving the service organization the permission to practice poor service
Technical Service Quality
Perceived Switching
Costs
Investment Expertise
Customer Loyalty
Functional Service Quality

59
standards knowing that it is more difficult to lose their customer base (Jones,
Mothersbaugh & Beatty, 2002).
Many service organizations, maintaining a superior quality of service is their
number one effort to gain customer loyalty (Zeithaml & Bitner, 2000); thus, a service
organization�s long-term success in a market is essentially determined by its ability to
expand and maintain a large and loyal customer base (Kandampully, 1998). To a service
organization, customer loyalty is viewed as the customer�s commitment to patronize that
particular provider over the competition; however, customers expect a valued
commitment from the service provider in return. This statement is supported by
Kandampully (1998) when he explained while service organizations aim to gain customer
loyalty, customers on the other hand, seek an organization�s service loyalty. Service
loyalty has been defined as the organizations assurance of a consistent and superior
quality of service as proof of the organization�s commitment to offering superior service,
for both the present and the long term (Berry, Wall & Carbone, 2006).
Although at times the lines of customer satisfaction and customer loyalty become
indistinct, service organizations should be mindful of their drastic differences. Customer
satisfaction measures how well the customer�s expectations are met by a given
transaction or service experience whereas customer loyalty measures how likely a
customer is to return, recommend or help to improve the overall organization (Bowen &
Shoemaker, 1998). Although many researchers (Oliver, 1997; Bowen & Shoemaker,
1998; Gustafsson & Johnson, 2004) testify that satisfaction is a necessary step toward
customer loyalty; satisfaction does not always translate into loyalty (Oliver, 1999).

60
Bowen and Shoemaker (1998) outlined reasons that satisfaction does not always
translate into loyalty. The reasons discussed were: 1) travelers who do not return to a
specific area cannot be loyal to the organization, even if they were willing, 2) when
exploring luxury hotels, some hotels customers enjoy a variety of choices and service
offerings and do their best to experience as many different organizations as possible, 3)
no matter how satisfied, some customers still remain price sensitive; thus will shop for
the most reasonable price, and 4) some customers just expect to receive quality service
and be satisfied every time; therefore, those customers do not view those attributes as
reasons to earn their loyalty. Oliver�s (1999) contribution supported the above when his
loyalty research revealed that for satisfaction to affect loyalty, satisfaction would have to
be frequent and cumulative with the customer experiencing a deep commitment to
consistently repurchase and recommend despite situational influences. Oliver (1999)
continued by clarifying as the customer�s loyalty to a service organization strengthened,
the steps necessary to form loyalty (i.e. quality, satisfaction) became less significant.
One of the most sought after attributes of loyalty is the customer�s future
behavioral intentions toward their preferred service organization. Perhaps the most
common assessment of loyalty have been the behavioral measures of repurchase patterns
and the likelihood to recommend expressed over time (Bloemer & Kasper, 1995). While
the weakest link in the Service Profit Chain was the link between satisfaction and
customer loyalty, Cronin and Taylor (1992) found that satisfaction had a stronger and
more consistent effect on purchase intentions compared to service quality. However, the
loyalty construct is multidimensional and includes not only repeat buying, but also
considers other aspects such as decreased price sensitivity and word-of-mouth behavior

61
(Wangenheim & Bayon, 2004). Reichheld and Sasser (1990) found that a customer�s
repurchase intentions and likelihood to recommend the service organization determines
the lifetime value of the customer, and even small differences can have an impact on the
profitability of the organization (Bolton, 1998; Reichheld & Teal, 1996).
THE DIFFICULTY IN MEASURING CUSTOMER LOYALTY
Just as the definitions of customer loyalty can be problematic, the ways in which
to measure customer loyalty are just as difficult and complex. Mason, Tideswell and
Roberts (2006) outline the complications of customer loyalty measurement by explaining
that on one hand loyalty measurement is devised through the power of an object or a
program (i.e. rewards program) that is purposely designed to influence or control the
probability of a customer being loyal. On the other hand there is the customer�s
propensity to be attracted to the service organization and loyalty is measured through an
individual�s personal psychology. The attributes closely associated with customer loyalty
are repeat purchasing, a customer�s willingness to recommend the service or product and
the propensity to partner or be a positive influence on the growth and success of the
organization (Jones & Sasser, 1995). However, as Jones and Sasser (1995) recognized,
although repeat purchases are somewhat easy to observe and measure, repeat purchasing
approaches to loyalty measurement are vulnerable and infrequent. Mason et al. (2006)
clarified further by suggesting that there is a lack of structural evidence on how many
times a behavior has to be carried out to qualify as frequent or how much time between
service encounters is permissible.
Dick and Basu�s (1994) research attempted to quantify the number of service
encounters a customer must have to qualify as a loyal customer; however, their research

62
method resulted in categorizing low-frequency customers in the latent loyalty or no
loyalty category whereas high-frequency customers were grouped in the loyalty category.
Therefore, according to their research, Dick and Basu (1994) revealed that only high-
frequency customers were truly loyal to a service organization. In the hospitality and
tourism industry, Riley (2001) recognized that it could be years or decades between visits
to a destination, hotel or restaurant; however, the customer may have been showing signs
of true loyalty by harboring positive feelings and recommending the destination or
property to business associates, friends and family. Thus, the frequency of visits or the
time between service encounters is not a reliable form of measurement.
EMOTION
Supportive literature has contributed volumes of research to dissect the complex
nature of customer satisfaction and the constructs that surround customer satisfaction.
However, while the connection between emotions and satisfaction has been recognized
by managers and academics, most forms of satisfaction research do not address emotional
output (Liljander & Strandvik, 1997; Yu & Dean, 2001). To some degree the elimination
of emotion as it relates to customer satisfaction, future behavioral intentions and the
customer�s willingness to be loyal to an organization has been due in part to the
complexity of the construct and the challenges presented when measuring customer
emotion. Over the past decade researchers have made great strides with the development
of various scales to scrutinize the importance of emotion in a customer satisfaction
scenario; however, the most effective way to measure emotion is still debated
(Westbrook & Oliver, 1991; Mattila & Wirtz, 2000; Smith & Bolton, 2002).

63
Current literature serves evidence to the theory that the relationship between
satisfaction and loyalty is moderated by positive emotions in high involvement services;
that is, the stronger the positive emotions experienced during the service encounter, the
stronger the relationship between satisfaction and loyalty (Bloemer & de Ruyter, 1999;
Scanlan & McPhail, 2000). In addition to the above, previous research has
overwhelmingly focused on cognitive components of customer satisfaction and much of
this has used some form of disconfirmation to compare perceived levels of performance
with some form of benchmark standard (Liljander & Strandvik, 1997; Yu & Dean, 2001).
While these studies have concluded that there is a significant relationship between service
quality, customer satisfaction and future behavioral intention, the validity of the findings
is more closely related to the cognitive components of the satisfaction construct opposed
to the emotion construct (Liljander & Strandvik, 1997; Yu & Dean, 2001). Liljander and
Strandvik (1997) explain that service quality and satisfaction are believed to contain an
affective (emotional) component; thus, without the analysis of the customers� responses
the emotion component cannot be fully appreciated.
A growing body of literature clearly indicates that the positive and negative
emotions that customers associate with the service experience play an important role in
satisfaction and future behavioral intention (Allen, Machleit & Kleine, 1992; Oliver,
1993; Richins, 1997; Barsky & Nash, 2002). Without a doubt, it is widely accepted that
customer satisfaction, loyalty and future behavioral intentions are to some degree
influenced by pre-encounter emotions and post-consumption emotions (Oliver, 1997;
Cronin, Brady & Holt, 2000; Barsky & Nash, 2002).
EMOTION DEFINED

64
Related literature offers numerous definitions of emotions in the psychology and
marketing literature. Oliver (1997) ascertained that
�Emotion includes arousal and various forms of affect and cognitive
interpretations of affect that may be given a single description. One of the most
predominant problems in defining emotion is to understand where emotion stops
and where cognition begins. The greater the amount of cognitive interpretation
required, the more cognitive the emotion becomes� (p. 294).
To analyze the definition of emotion further, in 1991 Westbrook and Oliver stated that
emotion is a primary source of human motivation which exerts substantial influence on
satisfaction, loyalty and future behavior. In 1998, Bourne and Russo contributed to the
definition of emotions by stating that emotions are based on 1) a combination of
biological and cognitive factors, 2) are highly influenced by society and peers, and 3)
emotions often change drastically due to physiological changes in the customer�s
environment. In addition to the above, the authors also recognized that an individual�s
emotional state can change based on their perception of a situation (i.e. a service failure
or an effective service recovery experience). Although numerous definitions of emotion
exist, Desmet and Hekkert (2003) noted difficulties in defining emotion and suggests that
before one can measure emotions, one must first be able to characterize and distinguish
them from other states. While it has been hard for researchers to define emotions, many
specific definitions have been developed by researchers in regards to consumption
emotions.
CONSUMPTION EMOTION

65
For the scope of this study, it is most appropriate to review the significance of
marketing related definitions of emotion or consumption emotions, along with the role
that consumption emotions play in a service encounter.
Numerous researchers (Westbrook & Oliver, 1991; Matilla & Wirtz, 2000; Smith
& Bolton, 2002) have conducted research around consumption emotions in the service
industry and specifically in the hospitality industry. As a result of their research efforts,
consumption emotion has been defined as a set of emotional responses elicited
specifically during product usage or consumption experiences. Each of their research
efforts explores various elements of emotion as described either by the distinctive
categories of emotional experience, expression (joy, anger and fear), or by the structural
dimensions underlying emotional categories, such as pleasantness/unpleasantness,
relaxation/action, or calmness/excitement emotions (Westbrook & Oliver, 1991).
When looking at consumption emotion, recent literature clearly indicates that the
customer associates both positive and negative emotions with the service encounter;
which in turn, plays a significant role in the customer�s degree of satisfaction, loyalty and
future behavioral intention (Allen, Machleit & Kleine, 1992; Oliver, 1993; Richins, 1997;
Barsky & Nash, 2002). Research also lends evidence that customer satisfaction, loyalty
and future behavioral intentions are, to some extent, influenced by the customer�s
emotions prior to the service encounter and directly after the service encounter (Oliver,
1997; Cronin, Brady & Holt, 2000; Barsky & Nash, 2002). Mattila and Wirtz (2000)
recognized that in order to truly understand a customer�s emotional state, research should
be conducted in two phases; 1) the customer�s pre-consumption stimuli and emotion, and
2) the customer�s post-consumption stimuli and emotion. This would aid in an effort to

66
fully understand the cognitive process, on-going satisfaction, degree of loyalty and their
future behavioral intentions. In addition, Price, Arnould and Deibler (1995), indicated
that the customer is typically more engaged in a service encounter; therefore, the
customer has a time and emotional investment in that interaction. The researchers
suggest that the customer�s emotional attachment to a service encounter is greater when
compared to their emotional attachment to advertisements or product purchases.
In regards to the intangible nature of the service industry, it appears that a
customer�s emotional attachment to an organization is greatly attributed to the people and
intangible service elements in the service environment. In consideration of the above, the
impact of the relationship between the service provider and the customer plays a vital role
in analyzing emotion and the formation of satisfaction, loyalty and behavioral intentions.
Clearly the relationship between emotion, satisfaction, loyalty and behavior is crucial
when measuring the value of service quality.
MEASUREMENTS OF EMOTION
Mattila and Wirtz (2000) suggested that in order to truly understand the
characteristics of service, the measurement of feelings and emotions experienced during
the delivery process are necessary to adequately capture the experimental nature of the
service encounter. Although the measurement of emotion is a critical key, Ekinei and
Hosany (2006) criticize that there has been a lack of consistency when it comes to the
measurement of emotions in the service encounter
Three of the most popular scales to date that relate to this research include Izards�
(1992) Differential Emotions Scales; Sui & Baloglu�s (2003) research on emotional
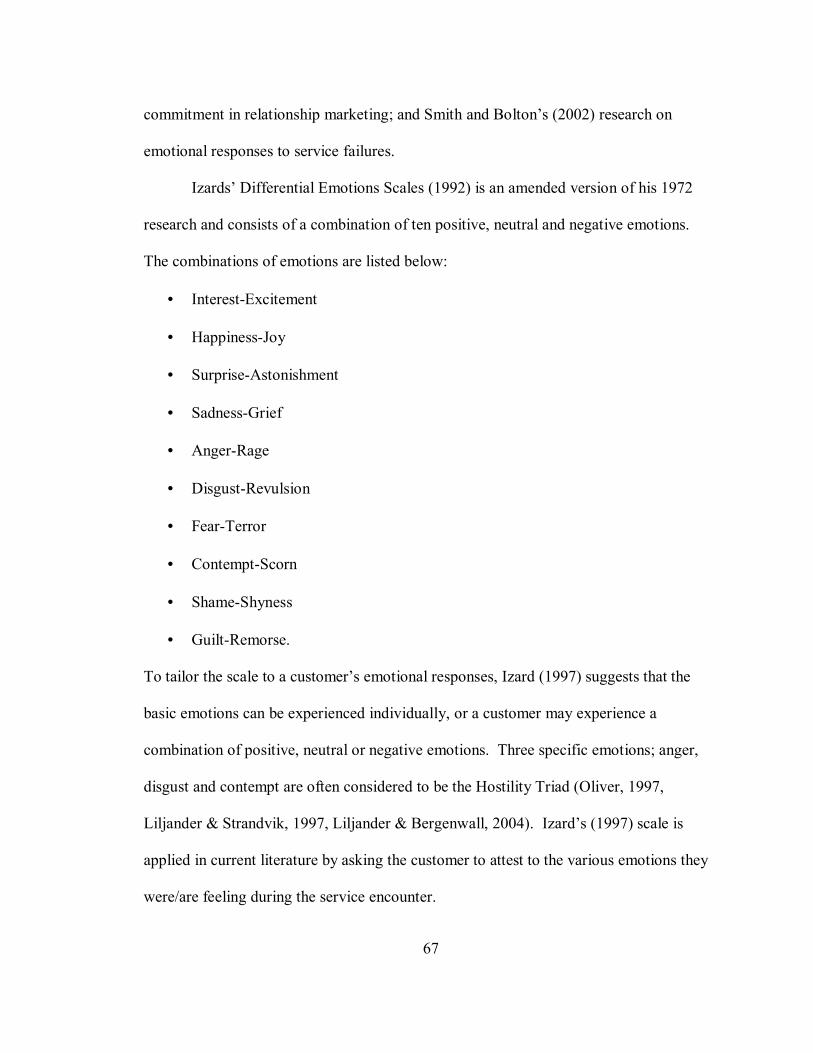
67
commitment in relationship marketing; and Smith and Bolton�s (2002) research on
emotional responses to service failures.
Izards� Differential Emotions Scales (1992) is an amended version of his 1972
research and consists of a combination of ten positive, neutral and negative emotions.
The combinations of emotions are listed below:
• Interest-Excitement
• Happiness-Joy
• Surprise-Astonishment
• Sadness-Grief
• Anger-Rage
• Disgust-Revulsion
• Fear-Terror
• Contempt-Scorn
• Shame-Shyness
• Guilt-Remorse.
To tailor the scale to a customer�s emotional responses, Izard (1997) suggests that the
basic emotions can be experienced individually, or a customer may experience a
combination of positive, neutral or negative emotions. Three specific emotions; anger,
disgust and contempt are often considered to be the Hostility Triad (Oliver, 1997,
Liljander & Strandvik, 1997, Liljander & Bergenwall, 2004). Izard�s (1997) scale is
applied in current literature by asking the customer to attest to the various emotions they
were/are feeling during the service encounter.

68
Current literature suggests that Izard�s scale is the most effective in customer
satisfaction studies (Oliver, 1997; Liljander & Strandvik, 1997; Liljander & Bergenwall,
2004); however, it is not free from criticism. First and foremost, this scale has been
criticized for the predominance of negative emotions. This is not an unrealistic criticism
considering that 7 out of 10 emotions are anchored by negative emotions adjectives.
Furthermore, because the outcome of the actual service encounter is either strongly
positive (a victory) or strongly negative (a loss) the imbalance of Izard�s scale towards
the negative leaves it unusable in this setting (Martin, 2007).
From a different perspective, Sui and Baloglu (2003) considered that creating
satisfied and loyal customers is based on the service organization�s relationship
marketing philosophies. Their research contributed to emotions literature by exploring
the role of emotion in customer loyalty and future behavioral intentions in the casino
industry. Their study set out to 1) evaluate the role of emotional commitment in
relationship marketing, 2) support the theory that a relationship exists between trust,
switching costs and emotional attachment on behavioral outcomes, and 3) to determine if
empirical linkages found in previous studies on service loyalty could be applied to the
casino industry.
Presented in Figure 12, Sui and Baloglu�s (2003) pointed out that a customer�s
emotional attachment to the service organization was based on the degree of trust he or
she felt toward the service organization and the emotional or financial switching costs
associated with patronizing the competition. Their model signified that a customer�s
emotional attachment toward the organization influenced five loyalty and behavioral

69
attributes; 1) word of mouth, 2) cooperation, 3) time spend, 4) revisit and 5) other product
usage.
Figure 12. Emotion in Relationship Marketing
Source: (Sui & Baloglu, 2003).
To analyze the importance of emotional attachment with relationship marketing
and future behavioral intentions, Smith and Bolton (2002) explored the effectiveness of a
customer�s service recovery satisfaction and the emotional effects in the up-scale food
and beverage industry and several luxury hotels. The nature of the hospitality industry
breeds service failures and reoccurring problems. When service failures occur, one of the
most important elements is to understand and control a customer�s emotional response to
the situation. In doing do, Smith and Bolton (2002) suggested that the organization
should 1) attempt to ensure overall satisfaction, 2) engender customer loyalty, and 3)
influence the customer�s future behavioral intentions.
Abrams and Pease (1993) proposed that in the event of a service failure, if
successfully resolved, customers may feel a stronger commitment and emotional
Trust
Switching Costs
Emotional Attachment
Use otherProducts
Revisit Intentions
Time Spent
Cooper- ation
Word of Mouth
70
attachment to the service organization than if no failure had occurred in the first place.
The scope of service failure and service recovery is presented in detail in the pages that
follow; however, for the significance of this section, Smith and Bolton (2002) believed
that a service failure presents two areas of opportunity for a service organization. First
and foremost, a service failure is an opportunity to truly test the provider�s service
philosophy to satisfy and keep the customer, and second, the service recovery experience
is a pivotal moment for the customer. Since customers tend to experience strong
emotional reactions in response to service failures, many customers rely on their
emotions as the deciding factor in whether or not to continue their relationship with the
organization (Smith & Bolton, 2002).
Presented in Figure 13, Smith and Bolton�s (2002) model is a result of their
investigation into the emotional responses surrounding a service failures and how
emotion influences satisfaction and behavioral intentions. The scope of their research
explored three questions; 1) do emotional responses to service failures influence
customer satisfaction with the service encounter?, 2) do emotional responses to service
failures influence how the recovery efforts are perceived?, and 3) do emotional responses
to service failures influence their overall degree of satisfaction with the service provider?
Figure 13. The Role of Emotion is Customer Satisfaction

71
Source: (Smith & Bolton, 2002).
As a result of their study, four common service recovery attributes emerged as the
main drivers of satisfaction: 1) compensation, 2) quality of response, 3) apology, and 4)
whether the service recovery process was controlled by the employee or by the customer.
In addition to the above, five negative emotions were identified as being the strongest
emotions experienced during the service failure; 1) anger, 2) discontent, 3)
disappointment, 3) self-pity, and 4) anxiety.
Although this research contributes to the understanding of emotion in the service
failure/service recovery context it is not free of criticism. Smith and Bolton�s (2002)
research found that when combining the responses collected from the selected restaurants
and hotels there was a significant relationship between emotion and satisfaction.
Consequently, when analyzing the two industries individually, there was no significant
relationship in the restaurant segment and a minimal relationship between emotion and
satisfaction in luxury hotels. This was attributed to two situations 1) the experimental
Emotional Response
CognitiveAntecedents
SatisfactionService Failure
ServiceRecovery

72
design for the restaurant segment did not control for heterogeneity where the hotel
segment did, and 2) more negative emotions and harsher comments were reported in the
responses collected from the hotels. Thus, the researchers concluded that the more
negative the emotion, the more important the recovery efforts.
Due to the similarity in research settings, the negative emotion scale applied in
Smith and Bolton�s (2002) research was applied for the purpose of this study; however,
the scale was modified to include positive emotions.
SERVICE FAILURE
To create and maintain satisfied customers, the primary goal of a service
organization in the hospitality industry should be to operate to a standard of quality and
excellence; therefore, doing things right the first time. However, it only stands to reason
that the intangible nature creates an environment where things can and frequently do go
wrong; thus, service failures can occur. When a service failure occurs, the service
organizations run the risk of jeopardizing the relationship between the organization and
the customer.
Kandampully (2002) cautioned �Of all the challenges facing hospitality
establishments today- including intense competition, globalization and technological
innovation- the single most pervasive and pressing challenge is the ever-increasing
demand of customers for service quality� (p. xi). Colgate and Norris (2001) recognized
that while a considerable volume of research has focused on the one best way to define
measure and operationalize the service quality construct, an increasing body of research
is now being targeted at the issue of service failure; complaint management and the
service recovery process. They continued that hospitality professionals now recognize
73
that a major factor that affects a customer�s perception of quality provision is the number
and extent of the problems they encounter, and more importantly how these problems are
handled when brought to the provider�s attention.
SERVICE FAILURE DEFINED
The concept of dissatisfaction in service has been researched extensively.
Dissatisfactory experiences have been labeled as negative incidents (Bitner, Booms &
Mohr, 1994; Bitner, Booms & Tetreault, 1990; Keaveney, 1995) or unsuccessful
processes that trigger failed encounters (Roos & Strandvick, 1997; Smith, Bolton &
Wagner, 1999; Coulter & Ligas, 2000); which in turn, cause the customer to realize that
the service has not met their expectations (Zeithaml, Berry, & Parasuraman, 1993; Oliver,
1997). Related literature has contributed numerous definitions and has scrutinized the
dimensions of a service failure. Bell and Zemke (1987) stated that a service failure
occurs when the service delivery falls short of the customers� expectations; which in turn,
necessitates the service provider�s response with recovery efforts. Mattila (2001)
recognized that in the service industry, especially the hospitality industry, there is a high
degree of human contact; thus, service failures are an inevitable element to service.
Although service failures are viewed as a defect or problem area within the organization,
Zemke and Bell (1990) believed that the true test of an organization�s commitment to
service quality is the way the organization responds to the service failure. To enhance
that concept, Mittal, Ross and Baldasare (1998) revealed that negative performances have
greater influence on satisfaction and purchase intentions compared to positive
performances.

74
When a service organization experiences a service failure, the organization is
faced with a unique window of opportunity to rebuild trust and commitment and satisfy
the customer. To reiterate the disconfirmation theory reviewed in a previous section of
this chapter, negative disconfirmation occurs when the service delivery falls short of the
customers� expectations (Bell & Zemke, 1987); which in turn necessitates the need for
the service provider�s service recovery efforts. Zemke (1993) continued that the object of
a service recovery effort is to move a customer from a state of dissatisfaction to a state of
satisfaction in an effort to engender loyalty and influence the customer�s behavioral
intentions.
Not surprisingly, many companies consider the development of a complaint
management system to be a vital component of their continuous quality improvement
efforts. Put simply, service organizations realize that an effective system is a vital means
to increasing customer satisfaction and establishing a long term relationship that leads to
customer loyalty and positive behavioral intentions (Tax, Brown & Chandrashekaran,
1998). Lovelock, Patterson and Walker (2001) added to the above when they suggested
that �customer satisfaction evaluations are linked not only to fault-free service, but also to
what transpires when something does go wrong� (p. 343).
This emerging ideal is a significant advancement from the more traditional
approach to handling a service failure. At one time, a service failure was more of an
embarrassment to a service organization opposed to an opportunity. Prior to this
paradigm, shift a service failure was something that a service organization would quickly
brush under the carpet; never to be discussed. However today, service failures are
regularly viewed as learning opportunities for service organizations; creating

75
opportunities for service organizations to achieve the competitive edge and understand
how to better satisfy the customer.
It is suggested that a majority of dissatisfied customers experience two different
forms of service encounters. The first is described as a core service failure; which
encompasses all actions that are involved in a failed delivery of service (Bitner, Booms &
Tetreault, 1990; Bitner, Booms & Mohr, 1994; Keaveney, 1995). The second form of
service failure includes negative and improper behaviors by the service provider or a lack
of personalized service (Keaveney, 1995; Roos & Strandvik, 1997). Similar to
disconfirmation, the amount of dissatisfaction will differ from customer to customer
based on the form of the failure, severity, and the customer�s zone of tolerance. The
challenge to service organizations today is undoubtly difficult: on one hand organizations
must create a non-threatening environment to make complaining easier, while at the same
time, design a recovery system around factors that 1) matter most to the customer, 2)
build a relationship between the service provider and the customer, 3) engender loyalty,
and 4) influence the customer�s future behavioral intentions.
One of the most significant factors that effect a customer�s perception of quality is
the number, and extent, of the problems they encounter, and more importantly how these
problems are handled when brought to the attention of the provider (Colgate & Norris,
2001). To create and maintain satisfied customers, the primary goal of organizations in
the service industry should be to operate to a standard of quality and excellence;
therefore, doing things right the first time. However, in the service industry, as well as
the hospitality industry, it only stands to reason that the intangible nature creates an

76
environment where things can and frequently do go wrong; thus, service failures can
occur; potentially jeopardizing the service provider�s relationship with the customer.
Although some organizations may view service failures as a devastating
experience, Zemke and Bell (1990) believe that the true test of an organization�s
commitment to service quality is not in the stylishness of the pledge it makes in the
mission statement or the marketing literature but in the way the organization responds to
the service failure. In the event of a service failure, measures and standards must be
established for the service provider to take immediate action to recover the failed service
attempt; thus the need for a quality systematic approach to service recovery is vital to
preserving the service provider-customer relationship.
SERVICE RECOVERY
When service failures occur the negative effects on profitability and customer
loyalty create drastic challenges for service organizations to overcome. Although at first
a service failure can be a devastating embarrassment for the organization, if handled
properly a service provider can counter act those negative effects and challenges by
responding to a customer�s complaint in an effective manner. This task can be
accomplished by the service organization�s approach to a quality service recovery
process. A service organization can create the ideal strategic plan for handling customer
complaints; however, a plan which is never implemented only looks pleasing on paper.
Thus, one of the most important keys to providing excellent service recovery is
convincing the customer to bring the failure to the provider�s attention and allow the
organization to implement the service recovery process.

77
Service recovery related literature attributes the social exchange theory and the
equity theory for providing the theoretical framework for studies exploring customer’s
evaluation of service recovery efforts (Adams, 1965; Ok, Back, & Sharklin, 2005).
According to Adams (1965), the two theories demonstrate that the exchange relationship
should be balanced between the service organization and the customer. Oliver (1997)
explained the significance of social exchange when he stated that the customer’s
satisfaction is based on their perception of equal partners during the service recovery
exchange. For example, the professionalism demonstrated between employees, managers
and employees, and between the service organization and the customer. Oliver (1997)
continued to explain that the equity theory; which is also a vital component, is the
customer’s perception of fair or unfair interpersonal relations or the amount of
compensation involved in correcting the problem. From this research, a distinction
between distributive justice, procedural justice and interactional or interpersonal justice
was developed, emphasizing differential effects of procedural elements on customer
satisfaction outcomes (Greenberg, 1987).
SERVICE RECOVERY AND THE JUSTICE THEORIES
Understanding the significance behind the justice theories is one of the most
essential elements in understanding service recovery satisfaction. Oliver (1997)
explained that distributive justice is described as the allocation of benefits and costs;
which relates to the degree of compensation associated with recovering the failed service
offering. For example, distributive justice would relate to the way in which a customer
evaluated the quality of the refunds, credits, charge corrections, replacements and
apologies associated with the organization�s service recovery efforts.

78
Procedural justice is related to the customer�s perception of the service recovery
process. For example, Wildes (2005) suggested that a uniform approach to service
policies and practices generated the highest degree of customer satisfaction through
employee knowledge and empowerment. Thus, procedural justice aims at resolving
conflicts by use of a formal approach in order to be consistent and maintain the customer
relationship- even if the outcome is unsatisfactory to one party. Finally, interactional or
interpersonal justice is degree to which people are treated (Oliver, 1997). This typically
refers to degree of politeness, dignity and respect displayed by the service organization
toward the customers.
Numerous studies have focused on the justice dimensions in service recovery
satisfaction. One study in particular by Smith, Bolton and Wagner (1999) proposed a
model, featured in Figure 14, which extended the notion that the service recovery
attributes (compensation, response speed, apology, and initiation) influenced at least one
of the three types of perceived justice in selected properties in the hotel and restaurant
industries.

79
Figure 14. Justice Theories in Service Recovery Satisfaction
Source: (Smith, Bolton & Wagner, 1999).
The findings of their research revealed several elements to help academia and
practitioners appreciate the relationship between the justice theories and service recovery
satisfaction. First and foremost, their research found that the customer�s satisfaction with
the service recovery process was positively related to their satisfaction with all three
justice theories in both the hotel and restaurant industries. Second, both hotel and
restaurant customers related the quality of compensation with distributive justice. Third,
the quality of the apology offered and the organization correcting the problem with little
effort or stress on behalf of the customer was related to interactional justice. Finally,
respondents in both the hotel and restaurant industries attributed the speed of the recovery
to procedural justice. Although their research made a significant contribution to service
recovery literature, the researchers suggest that the scope of the study could be enhanced
Type of Failure
Magnitude of Failure
Compensation
Response Speed
Apology
Initiation
Disconfir-mation
DistributiveJustice
ProceduralJustice
Satisfaction w/ Service
Interactional Justice

80
in two ways; 1) by reviewing the severity of the service failure, and 2) by classifying
failures as they relate to each individual justice theory.
SERVICE FAILURE AND SERVICE RECOVERY
Researchers suggest (Parasuraman, Berry & Zeithaml, 1991; Singh, 1991) that to
some degree, overall satisfaction in a service failure situation is determined by two
factors: 1) the outcome of the original service encounter based on specific service
attributes, and 2) attributes associated with the service recovery process. Although
service organizations strive to offer quality service and get things right the first time,
Mattila and Patterson (2004) explained that the hospitality industry is a high human
contact industry; thus, failures are inevitable. In 1996, Reichheld stated that the most
effective way to building a financially successful organization was to make efforts to
retain current customers opposed to continuously obtaining new customers. In an effort
to retain those customers, it appears that service organizations now recognize that long-
term relationships do not just happen; they are grounded in the organization�s delivery of
excellent service, value in the first instance, and complemented by an effective service-
recovery system when things do go wrong.
Blodgett, Wakefield and Barnes (1995) believed that customer�s selected their
retailers or service organization based on service quality; thus, according to their
research, getting things right is the best approach to service quality. But unfortunately,
mistakes are inherent to the features of the service industry (Ruyter & Wetzels, 2000).
Effective service recovery is a key ingredient to gaining an advantage over the
competition; thus, it is imperative that service organizations take advantage of

81
opportunities presented to improve upon their service quality. An effective, reliable
service recovery process is the best approach to that opportunity.
Lovelock�s (2001) Service Failure Response Choice model, presented in Figure
14, demonstrated the customer�s choice in the event of a service failure. In the event of a
service failure, customers are presented with numerous opportunities. To begin,
customers have a choice whether to report the failure to a manager or employee of the
organization or leave dissatisfied. Lovelock (2001) suggested that, at all costs, the
organization should encourage the customer to complain. Although service organizations
want the customer to lodge a complainant, for the organization to truly benefit, the
complaint must be lodged to the organization. Some of the avenues a customer could
explore after a service failure could be quite devastating to a service organization. For
example, a customer lodging a complainant with the Department of Health for poor
cleanliness could create different challenges for an organization to overcome. As
outlined in the model, organizations are faced with various opportunities to right the
wrong, preserve the relationship and, hopefully, engender loyalty and influence future
behavioral intentions. The ultimate goal of any service organization should be for the
customer to seek redress from the service organization. This in turn will give the
organization an opportunity to correct the problem and avoid the other negative outcomes
of a service failure.

82
Figure 15. Service Failure Response Choices
Source: (Lovelock, 2001).
In 1995, Keaveney found that the effects of switching behavior indicated that
service failures and failed service recoveries were a leading cause of customer switching
behavior in service organizations. Hart, Heskett and Sasser (2000) revealed that over
fifty percent of the customers who do complain are typically dissatisfied with the service
organization�s recovery efforts. Unfortunately, a large majority of customers choose not
to complain; thus, leaving the organization with intentions to never return and practice
negative word-of-mouth advertising. A study by Blodgett, Wakefield and Barnes (1995),
found that 77% of all non complainers engaged in negative word of mouth, while
conversely, only 48% of complainants engaged in negative word of mouth after
attempting to seek redress from the service provider. Thus, research has supported the
theory that customers who complain to the service organization are less likely to
participate in negative word of mouth activates compared to those that do not complain.
Encourage at all costs
Dissatisfaction Occurs
Take no action
Take someaction
PrivateAction
PublicAction
Negative word-of-mouth
Refuse to revisit
Complain to gov.t agency
Take legalaction
Seek redress from organization

83
Service organizations need to recognize that every customer�s problem is an
opportunity to prove its commitment to service- even if the provider is not to blame
(Hart, Heskett & Sasser, 2000). Halstead and Page (1993) found that the most critical
success factor to service recovery was to develop an environment where customers are
encouraged to complain. Hart, Heskett and Sasser (2000) suggested that service
organizations need to create an environment where customers feel confident that their
problem will be solved. They continued by stating that managers and employees should
actively evaluate customers to be sure their expectations are being met. Researchers have
consistently found that dissatisfied customers who perceive a high likelihood of success
are apt to seek redress (Day & Landon, 1976; Richins, 1997; Singh, 1991).
SERVICE RECOVERY DEFINED
Since the early 1990�s research surrounding satisfaction and service quality has
slowly transformed to focus on the customer�s reaction toward service failures and their
satisfaction or dissatisfaction with the organization�s approach to service recovery. As
enforced in the preceding literature review, an organization�s approach to service
recovery satisfaction should be equally important, if not more important, than their
overall approach to service quality and doing things right the first time. Research has
described service failure as one of the �pushing determinates� that, if handled improperly,
drives a customer�s switching behavior (Roos, 1999); thus effective service recovery
satisfaction has become an emerging area of interest in an effort to minimize failures and
retain customers.
In 1988, Gronroos suggested that a service recovery was an organization�s
response to poor quality service. Johnson (1995) enhanced that definition by stating that

84
a service organization must take some form of action and the action must be effectively
carried out to reduce the damage in the relationship and to transfer the customer from
dissatisfied to a satisfied state. In 2000, McCollough, Berry and Yadav recognized that a
successful recovery was an action that returned a customer to a satisfied state with the
service provider and the quality of the action could either destroy or enhance the
customer�s loyalty and future behavioral intention.
Although many definitions have been recognized in related literature, one of the
most widely accepted definitions of service recovery is by Zemke and Bell (1990) when
they defined service recovery as:
�a thought-out process for returning aggravated customers to a state of
satisfaction with the firm after a service or product has failed to live up to the
customer�s expectations� (p. 43).
Mattila and Patterson�s (2004) research led them to define service recovery as a process
which involved actions taken by a service provider to respond to a situation where a
failure occurred in the organization�s core or supplementary offerings. Boshoff�s (1999)
research acknowledged Zemke and Bell�s (1990) definition but contributed that an
effective service recovery process was one that was proactive in nature opposed to
reactive. The researcher stressed that a formal process for evaluating the effectiveness of
the service recovery process was critical for a service organization. He also distinguished
that positive service recovery tactics or strategies were more likely to return customers to
a state of satisfaction (Boshoff, 1999).
Nonetheless, for some service organizations, the service recovery process tends to
be transaction specific; thus, the organization fails to follow a formal service recovery

85
process. Instead, some service organizations tend to respond to each situation in a unique
and individual manner. While it is important to make each customer feel like the service
recovery process is tailored to meet their needs, Wildes (2005) suggested that in order to
achieve optimum levels of customer satisfaction employees must be well trained and
empowered to deal with all service situations. Therefore, suggesting that a formal,
documented approach to service recovery would aid in the training of employees and in
the consistent delivery of service quality.
Although an extensive body of literature exists on service recovery (Boshoff,
1997, 1999; Ruyter & Weltz, 2000; Strauss, 2002; Matilla, 2002 & 2003; Mueller,
Palmer, Mack, & McMullan, 2003) there appears to be areas of opportunity for additional
research and new contributions. For example, there is an emerging need for a systematic
approach to track and measure service failures and the overall performance of the service
recovery process within the hospitality industry; more specifically, within the luxury
segment of the hotel industry. In addition, the mediating roles of emotion and loyalty
should be explored in terms of recovery satisfaction, loyalty and the customer�s future
behavioral intentions toward the organization.
MEASUREMENTS OF SERVICE RECOVERY
In 2000, Tax and Brown identified service recovery as one of the key ingredients
to developing customer relationships, enhancing loyalty and influencing future behavioral
intentions. This in turn, enhanced Abrams and Pease (1993) suggestion that when service
failures are successfully resolved, customers may feel a stronger commitment to the
organization compared to if no failure had occurred in the first place. Thus, it only stands
to reason that in the event of a service failure, the service recovery experience is likely to

86
be the last experience the customer has with the organization. As a result, the
effectiveness of the service recovery effort may have a greater impact on loyalty and
repurchase intentions (Spreng, Harrell & Mackoy, 1995). Considerable evidence now
indicates that the customer�s evaluation of the quality service hinders greatly on the
organization�s approach to dealing with service failures.
By this rationale effective complaint handling, has a dramatic effect on customer
retention rates and employee satisfaction. This in turn directly affects customer�s
retention, employee performance issues, negative word-of-mouth and the financial
stability of the organization. (Fornell & Wernerfelt, 1987; Tax, Brown and
Chandrashekaran, 1998; Smith, Bolton, & Wagner, J, 1999). For example, a TARP study
(1996) found that the return on investment for handling complaints far exceeds the
consistent return on investment for more traditional investments, ranging from 15 percent
for packaged goods organizations to 100 percent for automotive and consumer durable
organizations. The results even showed that proper handling of complaints in the
banking industry yielded a 170 percent return on investment (Barsky, 1996).
In 2001, Mattila evaluated the impact of relationship types on customer loyalty in
the context of service failures. The scope of the research was to evaluate the relationship
that developed when the customer experienced repeated contact with the same service
organization. The study applied Gutek�s (1995) framework of social relationships to gain
a better understanding of the optimal level of interaction between a service organization
and its customers (Mattila, 2001). Gutek�s (1995) model demonstrated that service
encounters can be divided into three conceptually distinct mechanisms for delivering
service: true service relationships, pseudorelationships and service encounters. The study

87
found that in the case of a service failure, the customer�s degree of loyalty was
significantly higher for true relationship-type customers compared to peudorelationship
or service encounter customers. In addition, the study also revealed that the true
relationship type received high ratings in terms of the amount of special attention and
emotional bonding received from the service organization. The peudorelationship and
service encounter customers did not receive the same quality treatment.
In 1990, Bitner, Blooms and Tetreault studied the relationships between service
failures and employee behavior and what caused customers to distinguish between
satisfactory service encounters and dissatisfactory service encounters. Their study
revealed that 42 percent of the customer�s dissatisfactory encounters were due to the
employee�s response to the service failure. In addition, the study also revealed that when
the service failure occurred, customers expected the employee to respond immediately in
a friendly, efficient and professional manner (Bitner, Blooms and Tetreault, 1990). Thus,
supporting the idea that in order to effectively respond to a service failure, an
organization must have a standardized, consistent process in which employee�s are
trained to effectively handle the service recovery experience. In addition, research
suggests that service organizations should also rely on a measurement approach to ensure
consistent service recovery quality.
Craighead, Karwan and Miller (2004) explored effective service recovery
activities in the food service, auto repair and retail industries. Their model, presented in
Figure 15, shows that the antecedents of service recovery, in accordance with the severity
of the service failure, directly affect the customer�s perception of the service recovery
process. This ultimately led to the customer�s satisfaction or dissatisfaction with the

88
recovery process. Interestingly, their model reviewed the antecedents of service recovery
by exploring several elements; 1) the customer�s degree of loyalty prior to the service
failure, 2) their perception of quality 3) the severity of the failure, and 4) the service
guarantee. In each situation, a fair fix was the most important service recovery factor
across all three service organizations. This was followed by sincerity, apology and value.
Their findings also revealed that the expectations of loyal customers were more
demanding compared to dis-loyal customers. In addition, dis-loyal customers in severe
situations only expected a fair fix and were not as demanding of additional compensation.
The above study supports the theory that service profits are best bolstered by retaining
loyal customers, and there are two primary ways of doing this; 1) through having zero
defects, and 2) through an effective service recovery process (Reichheld & Sasser, 1990;
Craighead, Karwan & Miller, 2004).

89
Figure 16. Severity of Failure on Service Recovery Satisfaction
Source: (Craighead, Karwan & Miller, 2004).
In 2006, Kau and Loh explored the effects of justice on service recovery
satisfaction and behavioral outcomes in the cellular phone industry. Their research
investigated two dimensions. First their research reviewed the relationship between 1)
the complainant�s perception of the service recovery process as it related to the justice
theories, 2) their satisfaction or dissatisfaction with the recovery process, and 3)
customer�s degree of trust, word-of-mouth intentions and loyalty. Second their research
also explored the relationship between 1) non-complainants as satisfied or dissatisfied

90
customers, and 2) their degree of trust toward the organization, word-of-mouth intentions
and loyalty. The model is presented in Figure 17.
Figure 17. Complain vs. Non-Complaint Service Recovery Model
Source: (Kau & Loh, 2006).
Kau and Loh�s (2006) research is one of several which explored the justice
theories in service recovery satisfaction. Kau and Loh (2006) suggested that even if the
compensation is favorable to the customer, often times customers feel that they have been
unfairly treated. The findings of their research revealed that procedural and distributive
justice were the two most important elements in service recovery among cellular
customers. Their research also found that, among their respondents, service recovery
satisfaction led to high levels of trust and positive word of mouth endorsements; both
which are critical in retaining customers. Although their research provided theoretical
Cellular Service Providers
Non-Complainants
DistributiveJustice
ProceduralJustice
InteractionalJustice
Satisfied with Recovery
Dissatisfied with Recovery
Dissatisfied Non-Complaint
Satisfied Customers
Trust
Word ofMouth
Loyalty
Trust
Word ofMouth
Loyalty
Complainants

91
and empirical justification linking service recovery satisfaction with loyalty; the impact
did not appear to be as strong as anticipated.
RECOVSAT
Christo Boshoff (1999) explored the relationship between service recovery
attributes and the customer�s overall satisfaction with the service recovery process.
Boshoff�s (1999) exploratory research began with an instrument of 83 items which were
designed to measure the 15 original attributes of service recovery satisfaction. The 15
original attributes were identified based on related literature and the results of the
researcher�s qualitative analysis. The 83 items were measured on a 7-point Likert type
scale anchored by strongly agree (5) through to strongly disagree (1). A random sample
of 2,000 households were selected from a New Zealand based marketing firm. Potential
respondents were presented with hypothetical service failures and service recovery
scenarios based on events that commonly occur in restaurants and financial institutions.
Potential respondents were asked a series of questions regarding their service recovery
expectations. Of the random sample, 416 usable questionnaires were returned; a response
rate of 20.8% (Boshoff, 1999).
The next step in Boshoff�s research was to perform an exploratory factor analysis.
As a result, two factors were eliminated based on factor loadings and 13 attributes for
service recovery satisfaction emerged. In addition, of the original 83 items, 61 loaded to
a significant extent (.40) in the 13 factor solution; thus, based on suggestions by Nunnally
(1978) a Cronbach�s alpha of .50 was used as the cutoff point for retentions of factors
(Boshoff, 1999). The deletion of items with low correlations did not change the factor
structure; thus, the scale was reduced to 54 items (Boshoff, 1999). From there, two

92
additional exploratory studies were conducted. As an end result, Boshoff�s confirmatory
factor analysis confirmed a 6 factor structure measured by a 23 item scale. The 6 factor
that emerged as drivers of service recovery satisfaction were: communication, feedback,
explanation, atonement, empowerment, and tangibles. Boshoff referred to the 6 factor
structure as RECOVSAT, which proved to be a valid and reliable instrument.
ANTECEDENTS OF RECOVSAT
Several antecedents of service recovery (i.e. quality, satisfaction, loyalty, and
emotion) have been reviewed in great detail throughout this chapter; however, the
antecedents of service recovery identified in Boshoff�s research are critical elements to
this research. In consideration of the above, a detailed description will now be presented
on the antecedent of RECOVSAT.
The final factor structure, presented in Figure 18, was identified by Boshoff
(1999) as the attributes of service recovery satisfaction. The attributes are:
communication, feedback, explanation, atonement, empowerment, and tangibles.
Boshoff (1999, p. 238-239) defined the attributes as follows:
• Communication: the style and manner in which the service employee or manager
addresses the customer lodging a complaint.
• Feedback: the quality of the information the service organization provided about
the cause of the problem and the resolution process.
• Explanation: whether the service provider explained to the customer why the
problem occurred in a clear and concise manner.
• Atonement: value-added compensation to restore the ratio of inputs to outputs by
making it up to the customer for the inconvenience caused by the service failure.

93
• Empowerment: the authority to act and refers to the resources of which employees
have access and he decision they are permitted to make.
• Tangibles: the appearance of the service environment (i.e. equipment and physical
environment), as well as the appearance and standards of dress for employees.
Figure 18. RECOVSAT
Source: (Boshoff, 1999).
The intention of Boshoff�s (1999) study was to identify several dimensions of
transaction-specific service recovery satisfaction by analyzing customer expectations in
various segments of the service industry. Additionally, his study sought to develop and
validate an instrument to measure satisfaction with transaction-specific server recovery
based on the dimensions proposed (Boshoff, 1999). Subsequent statistical analyses
conducted during the development of RECOVSAT, led to the elimination of time as a
driver of service recovery satisfaction. However, research suggests that a timely response
Communication
Feedback
Atonement RECOVSAT
Empowerment
Explanation
Tangibles

94
to a service failure is imperative to the customer�s overall service recovery satisfaction.
Zemke and Bell (1990) found that a swift and effective service recovery enhanced the
customers� perception of quality products or services purchased. Miller, Craighead and
Karwan (2000) and Simmons (2004) contributed by stating that a successful service
recovery depended on how quickly the service organization responded to the problem
once they were made aware of the problem.
While Boshoff�s (1999) research has contributed to the development of service
recovery measurement literature, Strauss (2002) criticized that the measurement had yet
to be tested in an empirical nature and had not been tested across industry specific
organizations; such as airlines, restaurants or hotels. Significant studies have also
contributed to service recovery research; however, a majority of the research revolves
around hypothetical service scenarios, using convenience samples, with limited control
for heterogeneity. Although hypothetical research is beneficial in academia as well as
industry, measurements developed based on hypothetical data solely evaluate the
customer�s expectations opposed to their perception. Therefore, there appears to be a gap
in industry specific, empirical service recovery research in the hospitality industry.
HYPOTHESES AND THE RELATED LITERATURE
In addition to the findings in the qualitative analysis, the extensive literature
review above has lent justification to the central research hypotheses surrounding this
study. The significance of this final section is to introduce the hypotheses that will be
analyzed and discussed later in this document. First and foremost, in consideration of the
lack of empirical studies on Boshoff�s (1999) RECOVSAT, this study sought to evaluate

95
the psychometric performance of RECOVSAT to confirm or reject the factor structure in
the luxury hotel industry. Thus, hypothesis one is stated below.
• H1 - The six factor structure proposed for the RECOVSAT instrument will not be held up in the luxury hotel sector.
In response to the exploratory factor analysis conducted during the testing of
hypothesis one, factors were identified as being driving factors in explaining customer
on-going satisfaction in the luxury hotel segment. Thus, hypothesis two is stated below.
• H2 - Ongoing customer satisfaction will be driven by both �process� and
�approach� components of the service recovery process.
The degree of customer loyalty has been a key constituent in the exploration of
service recovery satisfaction, on-going satisfaction and the customer�s attitudinal and
behaviroal intentions toward the organization. Thus, the researcher deemed it necessary
to explore the following hypotheses.
• H3 - There is a strong positive correlation between a customers expressed
loyalty status at the time of the service failure and the degree of recovery
satisfaction felt.
• H3a � The degree of loyalty expressed toward an organization will serve
as a mediator to recovery satisfaction.
• H4 - An individual�s level of overall satisfaction will be positively
correlated to the degree of loyalty expressed for the organization post-
service recovery.
As supported in the literature above, a customer�s emotional connection to the
organization before, during and after the service failure has a direct reflect on the

96
customer�s attitudinal loyalty and their behavioral intentions toward the organization.
This study sought to explore the customer�s emotional state directly after the service
failure compared to the customer�s emotional state directly after the service recovery
efforts. Since the primary focus of this study are the issues surrounding the service
recovery process, this decision was made in an effort to scrutinize the organization�s
ability to influence the customer�s post-recovery emotions toward the organization.
Thus, lending justification to the fifth and final hypothesis.
• H5: An individual�s degree of emotional satisfaction will be positively
related to their overall satisfaction.
SUMMARY
In conclusion, this chapter has explored the surrounding literature that influences
on-going satisfaction with the service recovery process; which in turn, encourages
customer loyalty and influences future behavioral intentions. To begin, an extensive
review of the literature surrounding satisfaction, quality, loyalty and emotion was
presented. All of which are critical components when retaining customers; through both
satisfying and dissatisfying service encounters. Next, this chapter presented a detailed
analysis of the details surrounding the service failure and service recovery literature.
Finally, this chapter concluded with the introduction of the researcher hypotheses that
will be analyzed in the pages that follow.
While many researchers have contributed to the body of the literature, it is
obvious that few studies have examined actual customer perceptions of the service
recovery process. This is vital to the development of service recovery literature in the
hospitality industry, as well as the service industry. In consideration of the accelerating

97
competition, exceedingly high customer expectations and the duplication of service
amenities, higher expectations and demands are being placed on hospitality organizations
around the world; especially within the luxury segments. In consideration of the above,
there appears to be need for exploratory and confirmatory research aimed at operating to
a standard of excellence within the hospitality industry in good times and in bad.

98
CHAPTER III
METHODS
INTRODUCTION
Recent studies (McCollough, Berry & Yadav, 2000; Tax & Brown, 2000; Mattila,
2001; Craighead, Karwan & Miller, 2004; Mattila & Patterson, 2004; Kau & Loh, 2006)
have explored various forms of service failures, the organization�s approach to service
recovery, and the influence service recovery satisfaction has on FBI. Although research
has focused on various service recovery attributes, the effects of service recovery
satisfaction on on-going satisfaction, loyalty and future behavioral intentions have yet to
be explored in the luxury segment of the hotel industry. In addition, to this researcher�s
knowledge, the effects of post-recovery emotion as it relate to on-going satisfaction,
loyalty and future behavior has yet to be explored.
Therefore, the purpose of this study was to 1) empirically test the performance of
RECOVSAT in the luxury hotel segment, 2) explore the relationship between the
customer�s degree of pre-failure loyalty and their on-going satisfaction with the
organization, and 3) to explore the relationship between post-recovery emotion with on-
going satisfaction and 4) to explore the relationship between on-going satisfaction with
the customer�s post-recovery loyalty and FBI.
RESEARCH CONSIDERATIONS
In addition to profitability, the overall goal of most hospitality organizations is to
deliver quality service that is designed to engender loyalty and influence future

99
behavioral intentions. Although the hospitality industry strives to meet the customer�s
demands and expectations during every service encounter, the combination of the unique
characteristics in the service industry (i.e. perishability, heterogeneity and intangibility,
and inseparability) and the high human contact environment makes service failures
unavoidable. Over the years, the importance of service quality has increased
significantly. Accordingly, customers have become more experienced travelers,
competition has become more plentiful, and the standards of excellence have amplified.
In response to the rapidly changing environment, industry professionals are compelled to
mull over the importance of developing a complaint management system as a vital
component to their continuous quality improvement efforts.
In an effort to improve upon the service offerings, service providers have
experienced a paradigm shift from traditional attitudes toward complaint handling. In the
past, it was not uncommon that customer complaints, at times, were viewed as
antagonistic. Thus, service providers were more inclined to develop a negative opinion
toward a customer who voiced their dissatisfaction. Companies were prone to viewing
customer complaints in a negative light and some even believed that poor service
situations were to be concealed immediately to avoid damaging ramifications. However,
service organizations now realize that customer complaints present opportunities for the
service provider to identify problem areas and prevent future failures. Tax, Brown and
Chandrashekaran (1998) indicated that such systems are a vital component to increasing
customer commitment and establishing a long-term loyalty proposition.
In relation to this study, the goals of this research were to explore; 1) the selected
hospitality properties� approach to service recovery and the overall effectiveness of their
100
efforts, 2) the relationship between the customers� degree of loyalty prior to the service
failure and their on-going satisfaction, post-recovery loyalty and future behavioral
intentions, 3) to explore the effects of post-recovery emotion on on-going satisfaction and
4) to evaluate the psychometric performance of the six factor structure, RECOVSAT, in
the luxury segment of the hotel industry.
RESEARCH HYPOTHESES
In 1999, Boshoff�s research identified a six factor structure, RECOVSAT, as
attributes to service recovery satisfaction in the airline, banking and health care
industries. To date, the work of Christoff Boshoff (1997 & 1999) and the development of
his RECOVSAT scale have gained wide acceptance and prominence in the academic
press. However, Boshoff�s RECOVSAT instrument is a relatively new contribution to
service recovery literature and has only been challenged empirically in the banking and
finance industry. The result of the empirical research conducted by Boshoff (2003)
supported the six factor structure of RECOVSAT. This was not an unexpected finding,
considering that banking and finance customers of various institutions participated in the
hypothetical service failure studies during the developmental stages of RECOVSAT.
The supporting service recovery literature and the discussion during the
qualitative section of this research suggested that the six factors presented in
RECOVSAT might be mirrored in the luxury hotel industry. Such factors as
communication, atonement, honesty, reliability, employee empowerment and
professionalism were all topics of considerable discussion during the qualitative stage of
this research. However, the addition of various time oriented variables and the numerous
modifications required for this study bare reason to believe that Boshoff�s six factor

101
structure for RECOVSAT might not be supported. Thus, Hypothesis one (H1) can be
positioned as follows:
• H1 � The six factor structure proposed for the RECOVSAT instrument will not be supported in the luxury hotel sector.
According to the results of Boshoff�s (1999) study, of the six factor structure
identified, certain factors explained a larger percentage of the variance and made a unique
contribution in explaining service recovery satisfaction. Thus, those factors were
identified as the drivers of service recovery satisfaction for Boshoff�s study. This, in
turn, led to the justification for Hypothesis two (H2). Therefore, H2 is proposed as
follows.
• H2 � Of the factors identified during the exploratory factor analysis, some
factors will make a unique contribution to service recovery satisfaction in the
selected luxury hotels.
Tax and Brown (2000) identified service recovery as one of the key ingredients to
developing customer relationships, enhancing loyalty and influencing future behavioral
intentions. This in turn, enhanced Abrams and Pease�s (1993) suggestion that when
service failures are successfully resolved, customers may feel a stronger commitment to
the firm compared to if no failure had occurred in the first place. Thus, it only stands to
reason that in the event of a service failure, the service recovery experience is likely to be
the last experience the customer has with the company; as a result, the effectiveness of
the service recovery effort may have a greater effect on repurchase intentions (Spreng,
Harrell & Mackoy, 1995). Considerable evidence now indicates that recovering
effectively from service failures contributes significantly to customer evaluations of the

102
organization�s products and services; therefore, a greater influence on attitudinal and
behavioral intentions toward the service organization.
As expressed in the literature review, supporting literature provides theoretical
support to justify the evaluation of the customer�s degree loyalty and their satisfaction
with the service recovery process. Recent studies (McCollough, Berry &Yadav, 2000;
Tax and Brown, 2000; Craighead, Karwan and Miller, 2004; Kau and Loh, 2006) have
explored the severity of failure on loyalty and future behavioral intentions across the food
service, automotive and retail industries combine (Craighead, Karwan & Miller, 2004),
while others have explored the comparison between complainants and non-complainants
and justice on their degree of trust, loyalty and behavioral intentions in the cellular phone
industry (Kau & Loh, 2006). However, to the researcher�s knowledge current literature
has yet to explore the relationship between the pre-failure and post-recovery loyalty,
emotion and the customer�s behavioral intentions and how the variables relate to on-
going satisfaction. Therefore, in an effort to understand service recovery satisfaction
from a different point of view the customer�s degree of loyalty prior to the service failure
and the customer�s service recovery satisfaction, on-going satisfaction and their post-
recovery loyalty and behavioral intentions will be explored. Based on supporting
literature, three hypotheses were developed. First, H3 is positioned as follows:
• H3 - There is a strong positive correlation between a customers expressed loyalty
status at the time of the service failure and the degree of recovery satisfaction felt.
As an extension to H3, the customer�s degree of loyalty as a mediating variable
with service recovery satisfaction will be explored. In other words, the customer�s state
of loyal or disloyal at the time of the service failure will help to determine the customer�s
103
degree of satisfaction or dissatisfaction with the service recovery process. This
hypothesis will be explored based on the findings in Mattila�s (2001) research. She
revealed that foodservice industry customers who were truly loyal had significantly
higher expectations of the service recovery process compared to those who were disloyal.
Her research also revealed that truly loyal customers were not as satisfied after the
service recovery process. Therefore, H3a is poised as follows:
• H3a � The degree of loyalty expressed toward an organization will serve as a
mediator to recovery satisfaction.
In 1994, Heskett, Jones, Loveman, Sasser and Schlessinger suggested that the
weakest link in the Service Profit Chain was the link between satisfaction and loyalty.
Reichheld (1996) supported their finding and suggested that the services that satisfy
customers may not always be the same services that engender loyalty to service
organizations. However, Oliver (1997) stated that although satisfaction does not lead to
loyalty, a customer can not be loyal without being satisfied with the overall services and
products received. He continued by clarifying that as the customer�s loyalty to a service
organization strengthened, the steps necessary to form loyalty (i.e. satisfaction) became
less significant. Thus, H4 was proposed.
• H4 - An individual�s level of overall satisfaction will be positively correlated
to the degree of loyalty expressed for the organization post-service recovery.
Oliver (1981) suggested that emotion constitutes a primary source of human
motivation and exerts substantial influence on memory, loyalty and customer behavior.
Consequently, in the hospitality industry, where service failures often occur,
understanding and controlling a customer�s emotional response to the situation may be

104
the most important element in ensuring overall satisfaction and influencing the
customer�s willingness to return and recommend. Smith and Bolton�s (2002) research
evaluated a customer�s emotional response to a service failure and recovery by
comparing mid-scale hotels to mid-scale restaurants. Their research identified and
categorized the most common emotional responses reported among their sample
population and determined that certain emotional responses weight more heavily on
behavioral intentions. Smith and Bolton�s findings provided the foundation of the
emotion scale used in this study; however, in an effort to create a customized emotion
scale for the luxury segment of the hotel industry the following emotions were used;
anger, discontent, disappointment, self-pity, anxiety, gratitude, happiness and calmness.
This led to the justification for the H5.
• H5: An individual�s degree of emotional satisfaction will be positively related
to their overall satisfaction.
THEORETICAL MODEL
The model proposed consisted of eleven main variables. First and foremost, this
research sought to test the performance of the six factors identified in Boshoff�s (1999)
RECOVSAT as being attributed of service recovery satisfaction. In addition to the six
factors, this research also hypothesized that the customer�s degree of loyalty felt toward
the organization prior to the service failure was also an attribute of service recovery
satisfaction. Next, the theoretical model demonstrates that there will be a relationship
between the customer�s satisfaction with the service recovery process and on-going
satisfaction. The final two paths on the model suggest that there will be a relationship

105
between on-going satisfaction, post-recovery loyalty and post-recovery emotion. Thus,
the proposed model is presented below in Figure 19.
Figure 19. Proposed Theoretical Model
METHODS OVERVIEW
There were several obstacles to overcome during the developmental phases of this
research. The most prominent challenge to overcome was the need to administer the
questionnaire to a representative sample of the population. In an effort to truly measure
service recovery satisfaction and loyalty, in addition to empirically test Boshoff�s (1999)
RECOVSAT measurement, the sample population had to consist of 1) customers who
Communi-cation
Recovery Satisfaction
On-Going Satisfaction
Post-Recovery Loyalty
Tangibles
Explanati-on
Empower-ment
Pre-Fail. Loyalty
Atoneme-nt
Feedback
Post-Recovery Loyalty

106
stayed in one of the selected hotel properties during the previous year, 2) had experienced
a failure in service, 3) reported the problem to an employee or member of the
management team and 4) progressed through the hotel�s service recovery process and 5)
had provided contact information as their willingness to participate in future research.
The second most prominent challenge was to determine how to identify customers who
experienced a service failure from the general customer data base provided by the hotel.
To overcome these dilemmas, all registered guests who qualified though the hotels�
system (i.e. guest of selected property, within the past year, and willing to participate in
research) received a questionnaire. In addition, the first question on the questionnaire
was �While staying at (The Hotel) have you ever experienced a problem with the services
or products you received?� Respondents were given a choice between (1) �yes�, or (2)
�no� as a response to the question. Respondents who answered �yes� were guided
through a series of questions to evaluate the service failure situation, their perception of
the service recovery process, post-failure and post-recovery emotions, pre-failure and
post-recovery loyalty, future behavioral intentions and demographic information.
Respondents who selected �no� were guided through a series of questions surrounding
their service recovery expectations in the event of a service failure. For the purpose of
this study, the respondents who actually experienced a service failure will be analyzed
and discussed.
In order to effectively measure service recovery satisfaction, loyalty and future
behavioral intentions, the hotel properties were selected based on their approach to
service and the interrelationship shared with the primary research question. Thus, the
properties were selected due to the following 1) their location was conducive to repeat

107
visitors, 2) their ability to attract a variety of business and leisure customers; placing an
assortment of expectations on the service providers, 3) the properties� expectations for
delivering service excellence as part of their commitment to continuous quality
improvement, and 4) the properties� dedication to relationship marketing to engender
loyalty and influence future behavioral intentions. In the sections that follow, a detailed
analysis will be presented as to the design framework, research sample, the research
instrument, and research procedures surrounding the study.
QUALITATIVE AND QUANTITATIVE RESEARCH
Although predominantly quantitative in nature, the study was preceded by a
qualitative component. Leeds and Ormrod (2005) defines these two different research
methods in the following way:
�quantitative research is used to answer questions about relationships among
measured variables with the purpose of explaining, predicting and controlling
phenomena. In contrast, qualitative research is typically used to answer questions
about the complex nature of phenomena, often with the purpose of describing and
understanding the phenomena from the participants� point of view� (p. 95).
The qualitative component of this research was fulfilled in the form of conducting
a focus group with several customers staying in one of the selected hotel properties.
Although the final instrument administered for this study was modified and enhanced, the
core of the instrument was developed based on Boshoff�s (1999) RECOVSAT
measurement of service recovery satisfaction. In addition, various measures developed
by Zeithaml, Parasuraman, and Berry (1985) along with Shoemaker and Bowen (2003)
were modified to measure attitudinal and behavioral loyalty. Smith and Bolton�s (2000)

108
scale for emotion was enhanced in an effort to measure emotion directly after the service
failure and directly after the service recovery process. Given that the scales were
modified from preexisting measures, a focus group was not completely necessary;
however, the qualitative experience and feedback satisfied the face validity requirement
and aided in the development and modification of the instruments.
Upon completion of the qualitative component and the finalization of the
instrument, the next step was to begin with the quantitative analysis. The quantitative
analysis began in the summer, 2007. The quantitative research consisted of a cross-
sectional study of the effectiveness of service recovery performance within selected hotel
properties. Five main constructs were used in the evaluation of service recovery
satisfaction; loyalty, emotion, on-going satisfaction, future behavioral intentions and
service recovery satisfaction. Although Boshoff (1999) conducted several exploratory
and confirmatory factor analyses during the development of RECOVSAT, a factor
analysis was conducted to explore the potential relationship between service recovery
satisfaction and the added variable of pre-failure loyalty, in addition to testing that the
original six variables of RECOVSAT in the luxury segment of the hotel industry. Further
quantitative analysis was also applied in the form of reliability and validity testing,
univariate analysis, multivariate regression analysis, and structured equation modeling.
The above analyses were applied to either support or reject the hypotheses stated in this
research.
RESEARCH SETTING
In an attempt to gather a sufficient sample size, data was collected from five
luxury hotel properties across the United States. The hotel properties selected were

109
based on their affiliation with a hotel management company located in the Southeastern
region of the United States. Hotels were selected based on three criterion 1) their
commitment to service quality, 2) their commitment to service excellence, and 3) the
location of the hotel.
The questionnaire was administered as a Web-based survey through Survey
Monkey; a survey design and management website. The questionnaire was administered
to all five of the hotels� simultaneously. In addition to the information sheet required by
the Auburn University, Office of Human Subjects, an invitational electronic mail
message was delivered to all possible participants. The only specification stated in the
electronic message was that all respondents must answer the first question stated.
FOCUS GROUP
For the qualitative component of this research, one focus group was conducted
with 18 hotel customers and was held at one of the participating hotel properties. As
stated in a previous section, due to the use of a valid and reliable instrument, supported
by previous research, a focus group was not entirely necessary; however, the qualitative
research satisfied the requirement for face validity and presented the opportunity to
perfect the instrument
This qualitative task was accomplished in the early spring, 2007 during the focus
group stage of the research. Participants were drawn from one of the participating luxury
hotels and were brought together to discuss and refine the instrument to be used. Hotel
guests were randomly selected based on the length of their stay at the hotel and the time
the guest checked-in to the hotel. Hotel executives were notified of the focus group
approximately one week in advance.

110
The Director of Sales at the designated hotel property distributed an invitational
letter to all eligible participants, explaining the scope of the focus group and inviting each
customer to participate. Customers were asked to volunteer approximately one hour of
their time to discuss topics and issues surrounding the quality of service delivered at the
hotel. As compensation, The Hotel offered to treat each participant to a free entrée at
their fine dining restaurant located in the hotel as a gesture of appreciation for their time
and participation.
Focus group participants were brought together in a conference room at the
designated hotel. All discussions were recorded, subsequently analyzed and cross-
checked against independently recorded notes for accuracy. Although the participants of
the focus group were previously informed of the purpose of the meeting, the scope of the
study and the purpose of the focus group were discussed. To begin, each participant
received an Introduction Letter, (See Appendix A) approved by the Institutional Review
Board, and explaining the scope of the study. The letter outlined their responsibilities
and rights as participants in this research project. In addition, the letter also ensured their
confidentiality and the protection of the relationship between the customer and the
selected hotel properties.
The initial stage of the focus group was guided by questions surrounding service
expectations, failure and recovery expectations and complaint behavior. Several open-
ended questions were posed to facilitate discussion about dissatisfaction, complaint
management and service recovery expectations. The objective of the open-ended
questions was to identify similar expectations as what was outlined and measured in
RECOVSAT. Specific indicators such as communication, apology, professionalism,

111
empathy and empowerment were identified. Participants were also asked to highlight
those items in the recovery process that were of most importance to their on-going
satisfaction. The recording identified several important features that guided the
alterations of the instrument. The features are stated below.
Upon completion of the open-ended question phase, participants received a copy
of the questionnaire for review. As a result of the feedback from the focus group, several
changes were made regarding the layout of the questionnaire, wording and clarification
of several questions as well as the wording and clarification of the directions that
accompanied. Some questions were reworded or combined to scale down the length of
the questionnaire.
Based on the review of current literature and the results of the open-ended
questions, two questions were added in regards to the importance of time in service
recovery satisfaction and the questions surrounding loyalty were reworded to measure
attitudinal loyalty and behavioral loyalty. The initial intention of the study was to contact
possible participants by phone if they failed to respond after a predetermined period of
time. However, after much discussion, focus group participants did not agree with that
approach. Most focus group participants claimed that a courtesy telephone call would be
an invasion of privacy and would be counter-productive; thus, the only form of
communication between the researcher and possible respondent was by electronic mail.
RESEARCH SAMPLE
The selection of the respondents for this study was based on three criteria. First
the possible respondents had to be a customer at one of the selected hotel properties
within the past 12 months. The second was that possible respondents had to provide the

112
selected hotel with a current electronic mail address to be a recipient of the questionnaire.
Finally, possible respondents had to denote their willingness to participate in future
research conducted by the hotel management company, the individual hotel property or
by an affiliated partner.
The survey was administered by electronic mail invitation (See Appendix D)
through Survey Monkey, a web-based survey management website. Upon receiving the
electronic mail invitation, respondents were asked to select a link embedded in the
electronic message. Once selected, the electronic link directed the respondent to the
questionnaire. One of the numerous features of Survey Monkey is the management and
collection capabilities; thus, upon completion, all responses were automatically organized
and stored in a designated folder. From Survey Monkey, the research transferred all
responses in to a Statistical Package for the Social Sciences (SPSS) version 16.0.
ADEQUACY OF SAMPLE SIZE
The number of usable surveys collected for this study was critical to the overall
success of the research design and performance of the statistical procedures used to
analyze the data. In the design of this research, certain precautions were taken to control
for Type I and Type II statistical error. Meyers, Gamst and Guarino (2006) described
Type I error, or alpha, as �a statistical error that occurs when the researcher incorrectly
rejects the null, thus, incorrectly claiming that there is a significant group difference or a
significant correlation� (p. 38). In order to control for Type I error the researcher sets the
alpha level or the acceptable limits for error at .05. Type II error, or beta, is �a statistical
error that occurs when the researcher fails to find an effect that truly exists; thus, the
researcher may incorrectly conclude that the group means do not differ significantly or

113
that the correlation is not significantly different from zero� (Meyers, Gamst & Guarino,
2006, p.39). �A larger sample size or greater statistical power reduces the chances of
Type II error� (Meyers, Gamst & Guarino, 2006, p.39).
Hair, Anderson, Tatham and Black (1998), explained that Type I and Type II are
inversely related; thus, as Type I error moves closer to zero, or becomes more restrictive,
chances for Type II error increases. In addition to alpha, there are two additional factors
that contribute to the level of statistical power; the effect size and the sample size. As
stated above, alpha is the level at which the researcher is willing to be wrong in rejecting
the null hypothesis. Meyers, Gamst and Guarino (2006) stated as alpha becomes more
restrictive, power decreases; therefore, as the researcher reduces the chance of finding an
incorrect significant effect, the probability of finding a correct effect also decreases.
In terms of the effect size, Stevens (2002) defines effect size as �the extent to
which the groups differ in the population on the dependent variables� (p.6). The
probability of achieving statistical significance is based on the difference of means
between two groups or the correlation between variables in the population (Stevens,
2002). Mean differences are stated in terms of standard deviations, so that an effect size
of .5 indicates that the mean difference is one-half standard deviation. In terms of the
sample size, researchers typically achieve greater power by obtaining a large sample size
for the study. Larger samples sizes typically result in increasingly more stable and
precise estimates of the population parameters (Meyers, Gamst and Guarino 2006).
RESEARCH INSTRUMENT
The research instrument (See Appendix C) used to gather data for this study was a
Web-based survey. The survey was designed to evaluate the customer�s perception of the

114
service recovery process after he or she had experienced a failure in service. The service
failure questionnaire contained 47 questions that were presented in seven sections such as
1) Details Surrounding the Service Failure, 2) Pre-Failure Loyalty, 3) Post-Failure
Emotion, 4) Post-Recovery Emotion, 5) Service Recovery Details, 6) Post-Recovery
Loyalty and Future Behavioral Intentions, and 7) Demographics. The survey did not
contain identifying items that would jeopardize the respondent�s right to confidentiality.
A majority of the scale items used in this study were adopted and modified from
preexisting measurements. The loyalty and future behavioral intentions sections of the
survey were based on measures developed in the 1990 and 1993 studies by Zeithaml,
Parasuraman, and Berry and a study in 2003 by Shoemaker and Bowen surrounding
relationship marketing and loyalty in the hotel industry. To measure loyalty and future
behavioral intentions a pre-failure and post-recovery assessment was administered. Both
pre-failure and post-recovery were measured on a 5 point Likert type scale anchored by
(1) strongly disagree, through to (5) strongly agree. Questions for pre-failure loyalty
were 1) �I considered myself to be loyalty or would have been willing to be loyalty to the
hotel�, and 2) �I believed the hotel had my best interest at heart�. Questions for post-
recovery loyalty were 1) �I consider myself to be loyalty or I am willing to be loyalty to
the hotel�, and 2) I believe the hotel has my best interest at heart�.
To measure emotion, measures were adopted from Smith and Bolton�s (2002)
scale for emotions; however, their scale was enhanced to include both positive and
negative scales of emotion. Emotions listed were Anger, Discontent, Disappointment,
Self-Pity, Anxiety, Gratitude, Happiness and Calmness. The 5 point Likert type scale
contained a drop-down box for emotions directly after the service failure and the
115
emotions felt directly after the service recovery process. Emotion scales were anchored
in (1) extremely calm, through to (5) extremely intense. Items were stated as 1) �the
emotions and intensity felt directly following the service failure were�, and 2) �the
emotions and intensity felt directly following the service recovery efforts were�.
Boshoff�s (1999) scale used during the development phases of RECOVSAT was
applied to measure service recovery satisfaction. Each scale was measured by a 5 point
Likert type scale ranging from (1) extremely dissatisfied to (5) extremely satisfied.
SURVEY ADMINISTRATION
The survey was introduced to possible respondents by an electronic message and
accompanied by an informational letter (See Appendix B) approved by the Institutional
Review Board of Auburn University. The selected hotel properties consisted of five
luxury properties located around the United States. The survey was administered to
possible participants during the summer, 2007. Participants were given 45 days to
complete the survey. Approximately two weeks after the initial invitation, one friendly
electronic mail reminder was sent.
MEASUREMENT OF VARIABLES
The measurements of the variables were based on valid and reliable
measurements from previous research. RECOVSAT was selected and applied for several
reasons. First, RECOVSAT had proven to be a valid and reliable instrument in
hypothetical studies across the banking, retail and airline industries. Second,
RECOVSAT had never been tested empirically in the hospitality industry. Finally,
RECOVSAT was successfully tested empirically in the banking industry. Loyalty, future
behavioral intentions, and emotion measurements were derived from their reliable and

116
valid performance in previous studies; which had been previously applied in several
service organizations such as retail, airlines, hotels, restaurants, banks and retail service.
The measurements surrounding emotion were selected due to the fact that they
were specifically developed for the hotel and restaurant industries. In addition, the scale
was tested empirically in both industries and also proved to be a valid and reliable in the
hotel segment.
ETHICAL CONSIDERATIONS
The respondents� confidentiality and privacy was of the utmost importance to the
researcher. First and foremost, all correspondence between the researcher and the
possible respondents were approved by the Institutional Review Board (IRB) at Auburn
University (see Appendix A). Policies and guidelines set forth by the IRB were strictly
adhered to and all necessary written approval was granted to the researcher prior to the
launch of the study.
Neither of the surveys contained questions that would permit the researcher to
identify the respondents. Upon the completion of this study, surveys were disposed of
using the standard disposal methods of sensitive documents approved by Auburn
University.
SUMMARY
In conclusion, this chapter has provided a detailed description of the methods
applied during this study. Furthermore, this chapter contained a comprehensive
explanation and justification for the creation of the questionnaires and the related
literature that assisted in the developmental phases. Finally, this chapter concluded with
a thorough description of the research setting, and research sample.

117
CHAPTER IV
ANALYSIS OF RESULTS
This chapter presents the results of the research in five sections. Section one
provides a description of the returned questionnaires and a breakdown of the reporting
hotels. Section two provides a detailed breakdown of the sample demographic
characteristics and general information regarding the reporting and occurrence of the
service failure. Next, a univariate description of each of the measurements used in this
study will be presented. Section four will present statistics pertaining to the reliability
and validity of all scales employed and section five portrays a sequential analysis of the
results pertaining to each of the research hypotheses. All efforts shall be made to
separate the reporting of the results to chapter four, while a detailed discussion of these
results will be presented in chapter five.
DISCUSSION OF RETURNED QUESTIONNAIRES
In an attempt to gather a sufficient sample size, data was collected from five
luxury hotel properties located across the United States. Presented in Table 1, the
majority of respondents (46%) were guests of Hotel Property A with the second largest
group of participants (17%) representing Hotel Property B.

118
Table 1. Hotel Participation Hotel Property f % Hotel A 527 46 Hotel B 162 14 Hotel C 182 16 Hotel D 191 17 Hotel E 80 7
The sample for this study consisted of guests who experienced a failure in service
while staying at one of the selected hotel properties. A total of 3,519 guests received the
Survey Monkey based invitation requesting their participation. Of the total guest
database, 1,142 respondents or 32% responded to the questionnaire. Of the 1,142
questionnaires returned, 1,138 questionnaires were valid. Of the total, 553 respondents�
or 48.5%, attested to experiencing a failure in service during their stay at their hotel of
choice. For the purpose of this study, usable returns were defined as those respondents
that experienced a failure in service during their stay at one of the selected hotels. In
order to evaluate both the loyalty and emotion variables, questionnaires collected from
respondents who experienced a service failure were analyzed and discussed.
SAMPLE DEMOGRAPHIC CHARACTERISTICS
Presented in Table 2, of the 1,138 respondents to the survey, 553 or 48.5%
claimed to experience a service problem during their stay at one of the selected hotels.
Over 56% of respondents were male with the remaining 40% being female. The largest
age classification was ages 25-34, with almost 34% of respondents falling into this
classification. The second largest or 23% fell into the 16-24 age classification. Of the
553 respondents, 30% of respondents were traveling to visit friends and relatives while
24.6% were traveling for leisure. Only 16.3% of respondents claimed to be traveling for

119
business. This was not surprising considering that several of the selected hotels were
located in college towns or resort areas. Finally, respondents were asked about the most
important factor applied when selecting the hotel of choice. Thirty-three percent claimed
they selected the hotel due to a recommendation from a business associate, friend or
family member while 22% made their selection based on convenience.
Table 2. Demographic Profile of Respondents Gender f % Male 222 40.1 Female 313 56.6 Missing 18 3.3 Age 16-24 129 23.3 25-24 187 33.8 35-44 89 16.1 45-54 65 11.8 55-64 19 3.4 Missing 64 11.6 Purpose of Visit Business 90 16.3 Leisure 136 24.6 Visiting Friends/Family 167 30.2 Other 159 28.8 Missing 1 .2 Important Factor in Selecting Hotel Convenience 122 22.1 Recommendation 201 36.3 Previous Experience 48 8.7 Promotion/Advertisement 56 10.1 Missing 126 22.8
In addition to basic demographics, data was also collected on details surrounding
the service failure. In an effort to identify a pattern in communication breakdowns or
general problem areas within individual departments, respondents were asked: 1) �Who
was the problem was reported to�, 2) �the type of problem experienced�, and 3) �the

120
department within the hotel primarily responsible for the service failure�. As expressed
in Table 3, of the total sample size, 45.6% reported the service failure to a front office
employee with the second largest category of respondents, or almost 32% reporting the
problem to a manager. Over 37% of respondents experienced a problem with the service
delivery while over 27% filed a complaint with the quality control issues in the hotel.
Finally, respondents were asked to identify the department primarily responsible for the
service failure. Over 25% claimed they experienced a service failure with the check-
in/check-out process while the second largest category or 24% claimed that the problem
existed within the housekeeping department.
Table 3. Service Failure Details Reported Problem f % Management 176 31.8 Front Office Employee 252 45.6 Food & Beverage Employee 15 2.7 Housekeeping 14 2.5 Missing 96 17.4 Type of Problem Communication 66 11.9 Quality Control 153 27.7 Service 207 37.4 Technical 70 12.7 Missing 57 10.3 Area Responsible for Problem Check-In/Check-Out 141 25.5 Grounds/Parking 48 8.7 Housekeeping 133 24.1 Personnel 114 20.6 Restaurant 53 9.6 Missing 64 11.6

121
DESCRIPTION OF LOYALTY AND FUTURE BEHAVIORAL DATA
Section three entails a univariate analysis of the measurements used in this study.
The segment pertains to customer loyalty and the respondent�s future behavioral
intentions (FBI) toward the organization prior to the service failure and directly after the
service recovery experience. Thus, two sections of the questionnaire pertained to loyalty;
presented as pre-failure loyalty and post-recovery loyalty and two sections of the
questionnaire pertained to FBI; presented as pre-failure FBI and post-recovery FBI. Both
pre-failure and post-recovery loyalty and FBI were measured on a 5-point Likert type
scale anchored at (1) strongly disagree; through to (5) strongly agree. Each segment
comprised of four variables based on Shoemaker and Lewis (1999) research on
relationship marketing in the luxury segment of the hotel industry.
Pre-failure FBI consisted of two behavioral questions; 1) �I would have been
happy to recommend the hotel to family, friends and business associates�, and 2) �If in
the area, I would have been happy to revisit the hotel�. In addition, pre-failure loyalty
consisted of two attitudinal variables; 1) �I believed firmly that the hotel had my best
interest at heart�, and 2) �I considered myself to be loyal or would have been willing to
be loyal to the hotel�. Post-recovery FBI consisted of two behavioral variables as well;
1) �I would be happy to recommend the hotel to family, friends and business associates�,
and 2) �If in the area again, I would be happy to revisit the hotel�. Finally, post-recovery
loyalty measured the respondents attitude in two variables; 1)�I believe firmly that the
hotel has my best interests at heart�, and 2) �The hotel remains my first choice when
visiting the area�.

122
Table 4 presents the mean and standard deviations of each of the pre-failure
loyalty and FBI scale items.
Table 4. Descriptive Statistics for Pre-Failure Loyalty and FBI
Variable
Mean Std.
Deviation
Skewness I believed the hotel had my best interest at heart. I considered myself to be loyal to the hotel. I would have been happy to recommend. I would have been happy to revisit.
3.25
3.81
3.27
3.42
1.20
1.09
1.35
1.25
-.279
-1.03
-.404
-.499 Table 4 illustrates mean pre-loyalty values ranging from m=3.25 for respondents
who �believed that the hotel had their best interest at heart� to m=3.81 for respondents
who �considered themselves to be loyal to the hotel�. Pre-failure FBI values on the other
hand range from m=3.27 for respondents who �would have been happy to recommend� to
m=3.42 for respondents who �would have been happy to revisit�. This highlights a
positive picture for the respondents pre-failure loyalty and FBI toward the hotel
considering that a score of 2.4 or below on the satisfaction scale denotes below average
performance, while 2.5 or above denotes above average performance.
Featured in Table 5, the analysis will turn to the respondents� post-recovery
loyalty and FBI toward the organization.
Table 5. Descriptive Statistics for Post-Recovery Loyalty and FBI
Variable
Mean Std.
Deviation
Skewness I believe the hotel has my best interest at heart. The hotel remains my first choice. I would be happy to recommend. I would be happy to revisit.
2.73
2.42
2.69
2.7
1.28
1.29
1.31
1.30
.038
.517
.111
-.028

123
Table 5 illustrates a clear reduction in mean values across all variables. Looking firstly
at the attitudinal variables, values range from m=2.69 for �I would be happy to recommend�
through to m=2.79 for �I would be happy to revisit�. Similarly mean values across both
attitudinal variables range from m=2.42 for �The hotel remains my first choice� through to
m=2.73 for �I believe the hotel has my best interest at heart�. Table 6 indicates that this
decrease could not entirely be accounted for by random errors, with a series of paired samples t
tests revealing that differences in all three items were found to be significant at the 1% level
(p<0.001).
Table 6. Paired-Samples t Test for Loyalty Variables
Variable Pre-Loyalty Mean SD
Post-Loyalty Mean SD
Mean Diff. Sig. (2-tailed)
I believe the hotel has my best interest at heart. I would be happy to recommend. I would be happy to revisit.
3.30 1.33
3.38 1.26
3.21 1.24
2.69 1.31
2.80 1.30
2.74 1.30
-0.61
-0.58
-0.47
0.001
0.001
0.001
It should be noted that mean values for pre- and post- loyalty may differ somewhat
from those reported in Tables 4 and 5, due to the fact that difference scores can only be
computed for those cases were respondents have reported both pre- and post- loyalty variables
(n=397). Although considerably lower when compared to pre-failure loyalty and FBI, it
appears that respondents are still favourably pre-disposed toward the selected hotel group.
In an effort to shed further light on this key issue, further analysis was completed
comparing respondents� pre-failure and post-recovery loyalty and pre-failure and post-
recovery behavioral intentions. As stated above, the instrument presented questions about pre-
failure loyalty such as: �I believed the hotel had my best interest at heart� and �I considered

124
myself to be loyalty or was willing to be loyal to hotel�. Post-recovery attitudinal loyalty
questions were presented as: �I believe the hotel has my best interest at heart� and �The hotel
remains my first choice�. Table 7 features the pre and post loyalty analysis. Prior to the
service failure, over 40% of respondents either agreed or strongly agreed that the hotel had
their best interest at heart. To enhance that one step further, over 65% of respondents
considered themselves to be loyal or were willing to be loyal to the hotel. When the analysis
turned to post-recovery attitudinal loyalty, over 30% of respondents either disagreed or
strongly disagreed that the hotel had their best interest at heart. In addition, to the 30%,
another 17.5% claimed that they were unsure. Shifting to the question of the hotel remaining
the respondent�s first choice, over 40% of respondent�s claimed to either disagree or strongly
disagree with an additional 16% unsure.
Table 7. Pre and Post Customer Loyalty Variable Pre-Failure Loyalty Post-Recovery LoyaltyI believed/believe that the hotel has/had my best interest at heart.
Strongly Agree 13.9% 5.6% Agree 26.8% 17.7% Unsure 22.1% 17.5% Disagree 15.7% 13.0% Strongly Disagree 8.5% 17.5% I considered myself to be loyal or able to be loyal. / The hotel remains my first choice
Strongly Agree 25.3% 6.3% Agree 39.8% 9.4% Unsure 13.4% 16.1% Disagree 6.0% 17.7% Strongly Disagree 5.4% 23.1%
The analysis then turned to pre-failure and post-recovery behavioral intentions (FBI).
The instrument presented questions about pre-failure FBI such as: �I would have been happy to

125
recommend� and �I would have been happy to revisit�. Post-recovery FBI questions were
presented as: �I am happy to recommend� and �If in the area again, I am happy to revisit�.
Table 8 features the pre and post FBI analysis. Prior to the service failure, over 40% of
respondents either agreed or strongly agreed that they would have been happy to recommend
the hotel to family, friends and/or business associates. To enhance that one step further, over
50% of respondents claimed that if in the area again, they would have been happy to revisit the
hotel. When the analysis turned to post-recovery FBI, over 32% of respondents either
disagreed or strongly disagreed when asked if they were still willing to recommend the hotel to
family, friends and/or business associates; while 17.5% said they were unsure if they would
recommend. Shifting to the question of if in the area again, I would be happy to revisit, over
30% of respondent�s claimed to either disagree or strongly disagree that they would revisit the
hotel; while an additional 17.4% were unsure. However, on a more positive note, over 26%
claimed that they would revisit hotel.
Table 8. Pre and Post Future Behavioral Intentions Variable Pre-Failure FBI Post-Recovery FBII would have been happy to recommend. I am happy to recommend.
Strongly Agree 20.1% 6.5% Agree 31.6% 16.5% Unsure 18.1% 17.5% Disagree 13.2% 13.0% Strongly Disagree 15.6% 19.3% I would have been happy to revisit. I am happy to revisit.
Strongly Agree 19.7% 6.5% Agree 30.9% 20.4% Unsure 19.0% 17.4% Disagree 12.5% 13.2% Strongly Disagree 9.6% 17.7%
126
DESCRIPTION OF EMOTION DATA
A continuation of section three presents a detailed analysis of the emotional scales
employed. In addition to loyalty, two segments of the questionnaire pertained to the
issue of customer emotion in a post-failure and post-recovery sense. The expectation
being that there should be a significant correlation between a customer�s emotional status
and actual recovery satisfaction. In other words, both scales were designed to attest to
the degree to which the hotel group has been able to return a customer to a calm and
satisfied state as a result of their recovery process.
Presented as post-failure emotion and post-recovery emotion, scales were adopted
from Smith and Bolton�s (2002) scale for emotions and modified to account for both
positive and negative emotional extremes. All variable scale items were anchored at (1)
extremely calm through to (5) extremely agitated. Emotions listed were: Anger,
Discontent, Disappointment, Self-Pity, Anxiety, Gratitude, Happiness, and Calmness.
Table 9 summarizes the mean and standard deviations of each of the post-failure emotion
scale items. By way of interpretation, it is anticipated that where a problem was
experienced, customers would rate closer to five across all variables. For example,
m=4.00 for �anger� would indicate a good degree of agitation. Similarly, m=4.00 for
�calm� would indicate that a respondent is anything but calm. On reflection a �LO (1)
through to High (5)� anchored scale may have worked better for this analysis.

127
Table 9. Descriptive Statistics for Post-Failure Emotional Data
Variable
Mean Std.
Deviation
Skewness 1. Anger 2. Discontent 3. Disappointment 4. Self-Pity 5. Anxiety 6. Gratitude 7. Happiness 8. Calmness
2.98 2.36 2.11 3.85 3.06 3.35 3.42 3.42
1.13 1.07 1.05 .99 1.23 .93 .97 .98
-.164 .590 .939 -.587 -.012 -.132 -.374 -.490
Table 9 illustrates that a good degree of negative emotion ranging from m=2.11
for �disappointment� through to m=3.06 for �anxiety� and m=3.85 for �self pity� may
hint at the existence of a dissonant state of mind or arrest. These results are supported by
a low degree of calmness m=3.42, happiness m=3.42 and gratitude m=3.35.
The respondent�s post-recovery emotion data is listed below in Table 10.
Table 10. Descriptive Statistics for Post-Recovery Emotional Data
Variable
Mean Std.
Deviation
Skewness 1. Anger 2. Discontent 3. Disappointment 4. Self-Pity 5. Anxiety 6. Gratitude 7. Happiness 8. Calmness
3.14 2.77 2.59 3.78 3.35 3.28 3.37 3.49
1.14 1.17 1.21 1.02 1.11 1.00 1.00 .93
-.301 -.031 .215 -.613 -.045 -.311 -.452 -.524
Mean values range from m=2.59 for �Disappointment� to m=3.78 for �Self-pity� on
the negative emotional scales variables and m=3.28 for �Gratitude� through to m=3.49 for
�Calmness� on the positive emotional scales. Interestingly, while the results indicate a clear
increase in four out of the five negative emotions (anxiety experienced a slight decrease) post
recovery, they also point to a decrease in two out of the three positive emotions (gratitude and
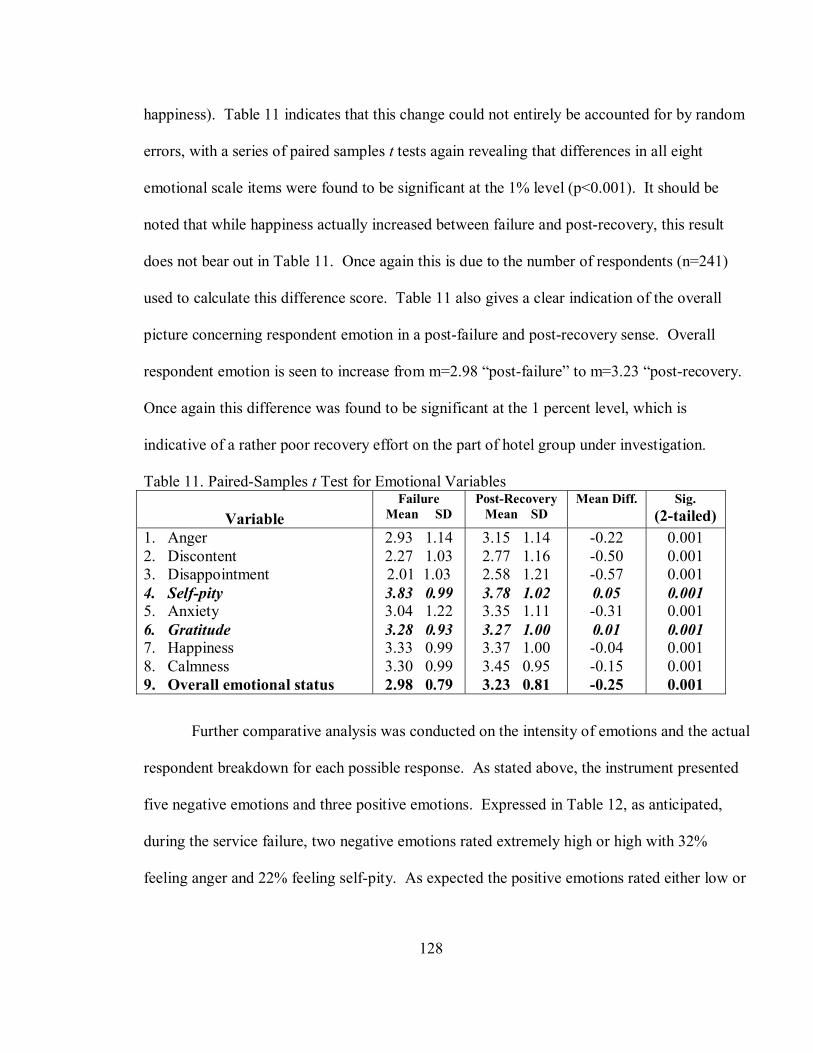
128
happiness). Table 11 indicates that this change could not entirely be accounted for by random
errors, with a series of paired samples t tests again revealing that differences in all eight
emotional scale items were found to be significant at the 1% level (p<0.001). It should be
noted that while happiness actually increased between failure and post-recovery, this result
does not bear out in Table 11. Once again this is due to the number of respondents (n=241)
used to calculate this difference score. Table 11 also gives a clear indication of the overall
picture concerning respondent emotion in a post-failure and post-recovery sense. Overall
respondent emotion is seen to increase from m=2.98 �post-failure� to m=3.23 �post-recovery.
Once again this difference was found to be significant at the 1 percent level, which is
indicative of a rather poor recovery effort on the part of hotel group under investigation.
Table 11. Paired-Samples t Test for Emotional Variables
Variable Failure
Mean SD Post-Recovery
Mean SD Mean Diff. Sig.
(2-tailed) 1. Anger 2. Discontent 3. Disappointment 4. Self-pity 5. Anxiety 6. Gratitude 7. Happiness 8. Calmness 9. Overall emotional status
2.93 1.14 2.27 1.03 2.01 1.03 3.83 0.99 3.04 1.22 3.28 0.93 3.33 0.99 3.30 0.99 2.98 0.79
3.15 1.14 2.77 1.16 2.58 1.21 3.78 1.02 3.35 1.11 3.27 1.00 3.37 1.00 3.45 0.95 3.23 0.81
-0.22 -0.50 -0.57 0.05 -0.31 0.01 -0.04 -0.15 -0.25
0.001 0.001 0.001 0.001 0.001 0.001 0.001 0.001 0.001
Further comparative analysis was conducted on the intensity of emotions and the actual
respondent breakdown for each possible response. As stated above, the instrument presented
five negative emotions and three positive emotions. Expressed in Table 12, as anticipated,
during the service failure, two negative emotions rated extremely high or high with 32%
feeling anger and 22% feeling self-pity. As expected the positive emotions rated either low or

129
extremely low intensity. Approximately 8% of respondents felt gratitude and happiness while
7% claimed they were calm during the service failure.
Table 12. Emotion Intensity During Failure Variable Extremely Low Low Unsure High Extremely High Anger 7% 22% 11% 28% 4% Discontent 15% 35% 7% 15% 1% Disappointment 22% 33% 7% 9% 2% Self-Pity 1% 3% 18% 2% 20% Anxiety 6% 21% 10% 20% 9% Gratitude 8% 16% 31% 4% 3% Happiness 8% 19% 27% 3% 3% Calmness 7% 25% 19% 8% 3%
Table 13 turns to the intensity of emotion felt directly after the service recovery
experience, it appears that a larger percentage of respondents felt gratitude (14%), happiness
(16%) and calmness (20%). However, these data also shows a large percentage, 21%, 15%
and 17% were uncertain about the intensity of gratitude, happiness and calmness, respectably.
Even though the positive emotion percentages do not represent a large majority of the sample
size, there was a significant change between positive failure emotion and positive post-
recovery emotion. However, the above is evidence that respondents� feelings were not
overwhelming negative or positive; thus, drawing attention to the quality of the service
recovery experience. When evaluating the negative emotions, it appears that the respondents�
level of anger and discontent remained relatively consistent across low, unsure and high levels
of intensity, while 28% of respondents� claim to feel a high or extremely high degree of
disappointment.

130
Table 13. Emotion Intensity after the Service Recovery Process Variable Extremely Low Low Unsure High Extremely High Anger 5% 20% 11% 12% 5% Discontent 3% 14% 11% 15% 8% Disappointment 2% 13% 9% 16% 12% Self-Pity 13% 16% 13% 3% 1% Anxiety 7% 19% 12% 8% 3% Gratitude 3% 5% 21% 14% 5% Happiness 3% 5% 17% 16% 5% Calmness 1% 5% 15% 20% 5%
DECRIPTION OF SERVICE RECOVERY DATA
The next stage of the analysis was to analyze the service recovery data. Table 14
presents the mean and standard deviation for each variable measured. Respondents were
asked to rate 18 variables measured on a 5 point Likert type scale anchored by (1) very
dissatisfied; through to (5) very satisfied. Two additional items (19 and 20) were
included to measure the customer�s �overall satisfaction with the products and services of
the hotel� and �overall satisfaction with the hotel�s ability to solve my problem�. Table
14 also includes a mean score (item 21) for overall satisfaction with the recovery effort.
This is a mean score calculated from all 18 recovery variables.

131
Table 14. � Descriptive Statistics for Service Recovery Data
Variable
Mean Std.
Deviation
Skewness1. Quality of communication during recovery. 2. Employee empathy and responsiveness. 3. Solicit relevant information. 4. Employee reliability during recovery. 5. Employee honesty and integrity. 6. Employee knowledge and ability. 7. Time it took to respond. 8. Time it took to resolve the problem. 9. Employee professionalism and discreet. 10. Informed about the problem resolution. 11. Hotel's apology. 12. Consideration of inconvenience. 13. Compensation package. 14. Degree of politeness and respect. 15. Explanation received as cause of problem. 16. Appearance of employee. 17. Professional environment. 18. Hotel did a great job keeping me informed. 19. Overall satisfaction with hotels products and
services. 20. Overall satisfaction with the hotels ability to
solve my problem 21. Overall recovery satisfaction
2.35 2.45 2.58 2.52 2.58 2.53 2.26 2.10 2.65 2.46 2.34 2.04 2.02 3.09 2.17 3.66 2.67 2.13 2.57
2.35
2.48
1.25 1.28 1.27 1.25 1.22 1.22 1.22 1.22 1.31 1.28 1.35 1.09 1.13 1.25 1.14 1.00 1.22 1.20 1.60
1.21
0.92
.580
.504
.392
.334
.217
.340
.628
.874
.085
.368
.569
.885
.738 -.313 .723
-1.139 .137 .773 .249
.465
.365
Table 14 illustrates mean values ranging from m=2.02 for �Compensation
Package� through to m=3.66 for �Appearance of Employees�. A total of eight (8) items
scored above the average benchmark of m=2.50, which denotes an above average
performance in terms of the employee�s professionalism and style in which he/she
responded to the situation. At the opposite end of the spectrum, several variables
performed below average, or below the benchmark of m=2.40. Variables in that category
encompassed quality, timeliness and communication; these variables appear to be
strongly related to the process of the complaint management systems in place. Further
analysis reveals that respondents were barely satisfied with the hotel�s products and

132
services (m=2.57); that they were less than satisfied with the hotels ability to resolve their
problems (m=2.37) and less than satisfied with the hotels recovery process (m.2.48).
Further analysis reveals a high degree of correlation between the two later variables; a
correlation of 0.575 was found to be significant at the 1% level (n=392; p=0.001).
EVALUATION OF VALIDITY AND RELIABILTY
Leedy (1993) stated that validity would raise the following questions. What does
the test measure? Does it, in fact, measure what it is supposed to measure? How well,
how comprehensively and how accurately does the test measure? Thus, for the purpose
of this study, the questions are best posed as follows. Does this measure truly identify the
most critical attributes of service recovery in the luxury hotel segment? Does this
measure truly assess the respondent�s attitudinal and behavioral loyalty to the
organization after progressing though the hotel�s service recovery experience?
In an attempt to answer these questions, the following section presents an
overview of the data available to assess the instrument�s validity. Both content or face
validity and construct validity will be reported in this section.
CONTENT VALIDITY
According to DeVellis (1991), the basic conceptual criterion a measurement scale
must meet is content or face validity. Simply stated, an instrument could be considered
to be high in face validity if the readability of the measurement appears to measure what
it is intended to measure. During the development of Boshoff�s (1999) RECOVSAT, the
service recovery scale had undergone the accepted process for scale development;
however, modifications were necessary for three reasons: 1) the measurement had to be
tailored to the luxury segment of the hotel industry, 2) scales were added to measure pre-

133
failure and post-recovery loyalty, and 3) scales were added to measure post-failure and
post-recovery emotion. In addition, the instrument underwent construct or face validity
by hotel professionals and guests. This process was applied in reference to Allen�s
(1995) view that since the criterion for face validity is the adequacy of items in terms of
content domain; review must be by appropriate experts. In summary, the hotel
executives and guests made an expert, qualitative judgment that the instrument appeared
to be a valid instrument.
This qualitative task was accomplished in the early spring, 2007 during the focus
group stage of the research. Participants were drawn from the designated hotel property
and were brought together to discuss and refine the instrument to be used. Hotel guests
were randomly selected based on the length of their stay at the hotel and the time the
guest checked-in to the hotel. Hotel executives were notified of the focus group
approximately one week in advance. Focus group participants were brought together in a
conference room at the designated hotel. All discussions were recorded, subsequently
analyzed and cross-checked against independently recorded notes for accuracy.
Although the participants of the focus group were previously informed of the purpose of
the meeting, the scope of the study and the purpose of the focus group were discussed.
To begin, participants were asked to share and discuss their expectations and experiences
of service failures and complaint management systems. Participants were also asked to
highlight those items in the recovery process that were of most importance to their on-
going satisfaction. The recording identified several important features that guided the
alterations of the instrument. The features are stated below.

134
• First and foremost, the majority of respondents felt that, at times, it was too
cumbersome to take the necessary steps to register a complaint. They also felt
that the service failure had to be a significant problem in order to take the time out
of their travel experience to complain. From this a discussion formed around
various ways to make it more convenient for a guest to register a complaint.
• Second, as a side bar to the above, a majority of respondents felt that it was too
time consuming to register a complaint and wait for a manager or employee to
take the necessary steps to correct the failure. There was an overwhelming
feeling that the service recovery process should not inconvenience the guest
further by having to explain the situation to several employees or managers or by
having to wait for the hotel to figure out how to solve the problem.
• Thirdly, emphasis was placed on the fact that employees should be
knowledgeable and confident in handling the problem on their own. Although it
was recognized that certain problems require a manager�s attention, the majority
of respondents felt that employees should be well trained and capable of solving
the problem.
• Finally, various attributes previously identified in RECOVSAT were also
identified during this session. The general consensus among the group was that
managers and/or employees should be genuinely interested in solving the
problem. Characteristics such as respectful, empathetic, understanding, and
honesty were all mentioned on numerous occasions. The majority also agreed
that an apologetic, respectful, friendly approach to solving the problem was more
important than compensation of a free room, free meal or discounted service.
135
Upon conclusion of the discussion, all participants were presented with an initial
draft of the survey instrument. Participants were given a brief overview of the aims and
objectives of the research project. Participants were also given an initial draft of the
electronic invitation prepared for distribution with the instrument. Discussion about the
instrument included the readability of the instrument, organization of the scale items, and
appropriateness of the scale items. Once again, the discussion was recorded and the
instrument was revised in accordance with the feedback received. The following items
resulted from the discussion:
• First, a majority of respondents recommended placing the loyalty and service
recovery scale items at the top of the instrument. Participants felt that more
respondents would be willing to complete the survey if the critical information
caught the respondent�s attention in the beginning. This lead to a reorganization
of the instrument, placing the pre-failure loyalty scales at the top, followed by
emotion, service recovery and post-loyalty scales. The instrument concluded with
the demographic questions.
• Second, participants were concerned about the complicated item wording,
particularly with respect to the use of industry jargon and the detailed description
of the scale items. As a result, the item wording and scale instructions and
descriptions were restated and simplified.
• Finally, participants were concerned about the number of variables on the
instrument and found that several items were measuring similar constructs.
Participants felt that this gave the impression that the same question was being
stated more than once. The notion was made that this may cause respondents to
136
become aggravated; thus, suggesting that the length of the survey may contribute
to a high abandon rate. As a result, several scale items were reworded and
clarified, three demographic questions were removed as deemed irrelevant to the
study and repetitive loyalty and future behavioral intention variables were
eliminated.
In summary, several improvements were made to the instrument based on the
qualitative analysis gathered during the focus group. In conclusion of the focus group,
the agreement was reached that the items included on the instrument were relevant and
useful to the domain of service recovery, on-going satisfaction, loyalty and future
behavioral intentions in the luxury segment of the hotel industry. The event was
concluded approximately two hours later and the participants were thanked for their time
and participation.
CONSTRUCT VALIDITY
According to Cohen, Swerdlik and Smith (1992), construct validity refers to a
judgment about the appropriateness of inference drawn from test scores regarding
individual standings on a certain kind of variable called a construct, where a construct is
described as an informed scientific idea constructed to describe or explain behavior.
Principally, the researcher investigating a test�s construct validity must formulate
hypotheses about the expected behaviour of high scorers and low scorers on the test. In
short, if the test is a valid measure of the construct, the high scorers and low scorers will
behave as predicted by the hypotheses. While a number of procedures may be used to
provide different kinds of evidence that a test has construct validity, the two principal
procedures relate to the provision of convergent and discriminant evidence. In turn, both
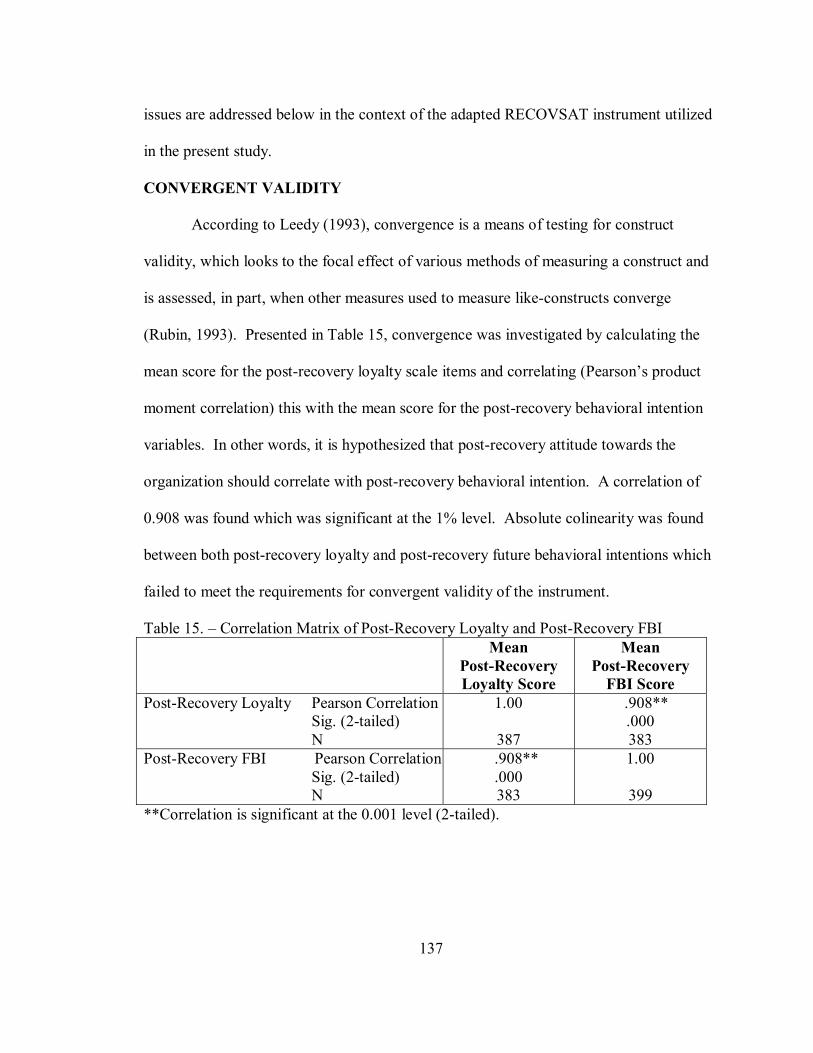
137
issues are addressed below in the context of the adapted RECOVSAT instrument utilized
in the present study.
CONVERGENT VALIDITY
According to Leedy (1993), convergence is a means of testing for construct
validity, which looks to the focal effect of various methods of measuring a construct and
is assessed, in part, when other measures used to measure like-constructs converge
(Rubin, 1993). Presented in Table 15, convergence was investigated by calculating the
mean score for the post-recovery loyalty scale items and correlating (Pearson�s product
moment correlation) this with the mean score for the post-recovery behavioral intention
variables. In other words, it is hypothesized that post-recovery attitude towards the
organization should correlate with post-recovery behavioral intention. A correlation of
0.908 was found which was significant at the 1% level. Absolute colinearity was found
between both post-recovery loyalty and post-recovery future behavioral intentions which
failed to meet the requirements for convergent validity of the instrument.
Table 15. � Correlation Matrix of Post-Recovery Loyalty and Post-Recovery FBI Mean
Post-Recovery Loyalty Score
Mean Post-Recovery
FBI Score Post-Recovery Loyalty Pearson Correlation Sig. (2-tailed) N
1.00
387
.908** .000 383
Post-Recovery FBI Pearson Correlation Sig. (2-tailed) N
.908** .000 383
1.00
399 **Correlation is significant at the 0.001 level (2-tailed).
138
DISCRIMINANT VALIDITY
Discriminability, on the other hand, means that the researcher should be able to
discriminate, or differentiate, the construct being studied from other similar constructs
(Leedy, 1993). According to Cohen et al., (1992, p.181), a validity coefficient �showing
a statistically insignificant relationship between test scores and/or other variables, with
which scores on the test being construct validated, should not theoretically be correlated
provides discriminant evidence of construct validity�. The question of discriminant
validity necessitated the computation of a further correlation coefficient (Pearson product
moment) between respondents� �Pre-failure Loyalty� to the hotel and the mean overall
�recovery satisfaction� score; calculated post failure. Both variables worked well for this
analysis as neither could be said to be related in any significant way given that pre-
failure, respondents had no idea that a failure was about to occur and therefore the loyalty
expressed should have been independent of any ensuing service recovery effort. The
results attest to the discriminant validity of the research measure in that they reveal a
statistically insignificant (0.05; p=0.230) correlation between respondents pre-failure
loyalty and their mean perception of the hotels recovery effort in a post-failure sense
(Cohen et al., 1992).
RELIABILITY SCORES OF THE MEASUREMENT INSTRUMENTS
The evaluation of reliability of a measurement procedure consists of estimating
how much of the variation in scores of different variables is due to chance or random
error. According to Billinton and Allen (1996), such reliability measures are necessary in
order to test the stability of any measure taken. Of the three traditional methods used to
estimate reliability (for example test-retest, alternative form and internal consistency),

139
only the internal consistency method shall be reported on within this analysis. Allen
(1995) stated that internal consistency reliability is established by correlating parts of the
test with each other. In other words, it will be used to test for the strength of linear
relationships between scale items for each of the key constructs included as part of the
research instrument. This approach relies upon Cronbach�s alpha; which calculates the
average of all possible split-half reliability coefficients. Cronbach�s alpha is viewed as a
more expedient indicator of internal consistency and, according to Nunnally (1978) the
benchmark that applies should be 0.6 or above. The higher the correlation coefficient
between scale items (closer to 1.0), the stronger the linear relationship of the items being
correlated and the higher the internal consistency of the research instrument.
Table 16 illustrates that internal reliability statistics were calculated for all scales
included in the measurement instrument including: pre-failure loyalty attitude, pre-failure
loyalty behavioral intention, post-failure emotion, post-recovery emotion, post-recovery
loyalty attitude and behavioral intention and the adapted RECOVSAT instrument.
Table 16. Internal Reliability Statistics for Measurement Scales Measure α Statistic # Variable # Cases Pre-failure loyalty Attitude .61 2 470 Pre-failure loyalty Behavioral Intention
.90 2 506
Post-failure Emotion .82 8 308 Post-recovery Emotion .84 8 348 Post-recovery loyalty Attitude
.96 2 399
Post-Recovery Behavioral Intention
.82 2 387
Adapted RECOVSAT .95 18 268
Analysis reveals that each of the scales performed well with co-efficient alpha ranging from α
= 0.61 for �Pre-failure loyalty attitude� through to α = 0.96 for �Post-recovery loyalty

140
attitude�. Scale items measuring the respondent�s loyalty in a behavioral sense ranged from α
= 0.90 �Pre-failure� to α = 0.82 �Post-failure�. Post-failure emotion was recorded at α = 0.82 ,
while post-recovery emotion was recorded at α = 0.84. The adapted RECOVSAT instrument
also performed well with α = 0.95.
DIMENSIONALITY OF THE LIKERT-TYPE SCALES
While the overriding goal of the research was to explore the relationship between
service recovery attributes, on-going satisfaction, customer loyalty and future behavioral
intentions and what if any influence loyalty plays as a mediator in the recovery process, it
was also deemed essential to test the psychometric performance of each of the scales
employed in the study; namely the emotional, loyalty and recovery satisfaction scales.
DIMENSIONALITY OF EMOTIONAL SCALES
As stated the measurement instrument sought to measure customer emotion across
two scales; the first scale was intent on measuring intensity of felt emotion post-failure
and the other measuring intensity of felt emotion post-recovery. Scales were adopted
from Smith and Bolton�s (2000) scale for emotions and modified to account for both
positive and negative emotional extremes. Respondents were asked to rate the intensity
of emotion felt on a five (5) point Likert scale anchored at (1) Extremely Calm through to
(5) Extremely Agitated. Actual emotions included: anger, discontent, disappointment,
self-pity, anxiety, gratitude, happiness and calmness.
Previous studies of emotion have proposed a three factor solution encompassing
positive, negative and neutral states (Lilijander & Strandvik, 1997; Yu & Dean, 2001)
others have uncovered a more easily explained two factor solution encompassing both
positive and negative aspects of emotion (Evrard & Aurier, 1996; Hausknecht, 1988;

141
Westbrook & Oliver, 1991). Given the very highly charged nature of the event under
investigation and the fact that it relates to a service failure, the researcher believes that the
possibility of experiencing a neutral state of emotion is highly unlikely.
An exploratory factor analysis using the principal component extraction technique
was performed on both emotional scales. The analysis made use of the VARIMAX
factor rotation procedure in SPSS version16. A component matrix was initially generated
to ensure that the analyzed variables had reasonable correlations (greater than or equal to
0.4) with other variables. Unrotated and rotated component matrices were inspected and
all variables were found to correlate well. Looking firstly at the post-failure emotional
scale; the result of the corresponding KMO of �sampling adequacy� was 0.790 and
Bartlett�s test for sphericity was 854.920; significant at the level of 1 percent
(sig.=0.001). The results of these tests rendered the data factorable and consequently the
factor analysis was generated. Table 17 illustrates strong factor loadings (item to total
correlations) along two dimensions with coefficient alpha (ά) scores ranging from 0.73
(POSITIVE EMOTION) to 0.78 (NEGATIVE EMOTION); explaining approximately
62% of the variance.

142
Table 17. Factor Analysis � Emotional Scales
Emotional Variables
Post-failure DIM 1 DIM 2 NEG POS
Post-recovery DIM 1 DIM 2 NEG POS
1. Anger 2. Discontent 3. Disappointment 4. Self-pity 5. Anxiety 6. Gratitude 7. Happiness 8. Calmness
.737 .845 .801 .514 .634 .864 .861 .552
.887 .917 .888 .437 .672 .878
.912 .559
Eigenvalue % of variation alpha (ά)
3.557 1.364 44.460 17.051 0.78 0.73
3.845 1.621 48.063 20.256 0.87 0.71
A further two factor solution (positive/negative) was uncovered for the post-
recovery scale. The corresponding KMO of �sampling adequacy� was 0.782 and
Bartlett�s test for sphericity was 884.613; significant at the level of 1 percent
(sig.=0.001). The results of these tests rendered the post-recovery emotional data
factorable and consequently the factor analysis was generated. Table 17 illustrates a
similar two factor structure with coefficient alpha scores ranging from 0.71 (POS) to 0.87
(NEG), which combined explain approximately 69% of the variance. These findings are
in keeping with other studies where a similar two factor (positive/negative) structure was
uncovered (Liljander & Strandvik, 1997; Yu & Dean, 2001).
DIMENSIONALITY OF LOYALTY SCALES
Both loyalty scales (pre-failure and post-recovery) were subject to a similar
degree of analysis, the results of which are shared in Table 18. Previous research (Dick
& Basu, 1994; Oliver, 1997; McMullan & Gilmore, 2003; McMullan, 2005) suggested
that the loyalty construct is have two key components: attitude and behavior. It is

143
anticipated, therefore, that this two factor structure should be replicated within the current
study.
Table 18. Factor Analysis � Loyalty Scales
Loyalty Variables Pre-failure
DIM 1 DIM 2 FBI ATT
Post-recovery DIM 1
LOYALTY 1. Recommend 2. Revisit 3. Best interests 4. Loyalty attitude
.944 .945 .827 .840
.961
.962
.874
.922 Eigenvalue % of variation alpha (ά)
1.840 1.433 45.995 35.823 0.90 0.61
3.464 85.597 0.94
Looking firstly at the pre-failure loyalty scale; the result of the corresponding
KMO of �sampling adequacy� was 0.496 and Bartlett�s test for sphericity was 594.170;
significant at the level of 1 percent (sig.=0.001). The results of these tests rendered the
data factorable and consequently the factor analysis was generated. Table 18 illustrates
strong factor loadings (item to total correlations) along two dimensions with coefficient
alpha (ά) scores ranging from 0.61 (ATTITUDE) to 0.90 (FBI); explaining approximately
82% of the variance. Interestingly the post-recovery factor rotation revealed a one factor
solution (LOYALTY) accounting for approximately 87% of the variance. The
corresponding KMO of �sampling adequacy� was 0.843 and Bartlett�s test for sphericity
was 1701.339; significant at the level of 1 percent (sig.=0.001). The results of these tests
rendered the post-recovery loyalty data factorable and consequently the factor analysis
was generated. The resulting one factor solution recorded a coefficient alpha (ά) score of
0.94 which does point to the reliability of the scale.

144
DIMENSIONALITY OF THE RECOVERY SATISFACTION SCALE
Attention next turned to the dimensionality of the recovery satisfaction measure
or adapted RECOVSAT. As previously stated, service recovery literature suggests that
understanding the dimensions of service recovery satisfaction is paramount in helping
service professionals satisfy customers when things go wrong and building relationships
that engender loyalty. The search for a reliable service recovery measure has generated a
healthy academic debate over the years, with a variety of measures being put forward.
That said, there is little consensus on an effective service recovery measure and even less
consensus as it relates to the hotel industry. To date, the work of Christoff Boshoff (1997
& 1999) and the development of his RECOVSAT scale have gained wide acceptance and
prominence in the academic press. His research produced an instrument that identified
six factors related to service recovery satisfaction in the health care, banking and finance
industries. Boshoff�s RECOVSAT instrument is a relatively new contribution to service
recovery literature and has only been challenged empirically in the banking and finance
industry. The result of the empirical research conducted by Boshoff (1999) suggested a
six factor structure called RECOVSAT. This was not an unexpected finding, considering
that banking and finance customers of various institutions participated in the
developmental stages of RECOVSAT and in the hypothetical service failure studies.
The supporting service recovery literature and the discussion during the
qualitative section of this research suggest that the six factors presented in RECOVSAT
might be mirrored in the luxury hotel industry. Such factors as communication,
atonement, honesty, reliability, employee empowerment and professionalism were all
topics of considerable discussion during the qualitative stage of the research. That said,

145
the addition of various time oriented variables and the numerous modifications required
for this study bare reason to believe that Boshoff�s six factor structure for RECOVSAT
might not be supported. Hypothesis one (H1) can thus be posited as follows:
• H1 � The six factor structure proposed for the RECOVSAT instrument will not be supported in the luxury hotel sector.
In order to test and validate this hypothesis, it was deemed necessary to conduct:
1. An exploratory factor analysis of the data across a random selection of
respondents to uncover the actual factor structure, and
2. In order to validate this finding, to expose the revealed factor structure to a
confirmatory factor analysis for all other responses.
Stage one of this analysis exposed 50% (randomly selected) of the respondent
data set to a VARIMAX factor rotation procedure in SPSS version 16. A component
matrix was initially generated to ensure that the analyzed variables had reasonable
correlations (greater than or equal to 0.4) with other variables. Unrotated and rotated
component matrices were inspected and variables that did not correlate or correlated
weakly with others were excluded (De Vaus, 1996).

146
Table 19. Exploratory Factor Analysis of Service Recovery Satisfaction Attributes
Variable Factor 1
APPROACH Factor 2
PROCESS Employee efforts to solicit information Employee reliability during problem resolve Employee knowledge and ability to deal with the situation Employee empathy and responsiveness Hotel�s efforts to keep me informed Honesty and integrity of approach Time it took to respond to the problem The hotel�s apology Employee�s ability to be professional and discreet Quality of communication from employees The appearance of hotel employees Consideration of inconvenience caused The compensation package Hotel did an excellent job of keeping me advised The explanation received as to cause of problem The professional environment Time it took to resolve the problem The degree of politeness and respect The appearance of hotel employees
.860
.859
.846
.814
.808
.791
.737
.686
.667
.654
.502
.834
.805
.793
.739
.748
.693
.645
.625
.419 Eigenvalue % of variation Co-efficient alpha
11.445 63.58%
0.95
1.373 7.62% 0.90
Note � all absolute values less than 0.4 have been suppressed for the purpose of analysis.
The result of the corresponding KMO of �sampling adequacy� was 0.948 and
Bartlett�s test for sphericity was 2296.134, which is considered a high Chi-Square, yet
significant at the level of 1 percent (sig. =0.001). The results of these tests rendered the
data factorable and consequently the factor analysis was generated.
Results of the factor analysis are presented in Table 19. This table expresses the item
number loading on each factor as well as the extent to which it correlates with each factor.
The results illustrate strong factor loadings along two dimensions with coefficient alpha scores
147
ranging from 0.95 (APPROACH) to 0.90 (PROCESS), which combined account for almost
69% of the explained variance. From the analysis, extracted component one is reflective of
what might best be described as the more human and relational oriented elements of the
service recovery process (APPROACH), while component two is reflective of the more
process (PROCESS) oriented aspects of the recovery process. These results demonstrate
clearly that the six factor component structure of RECOVSAT proposed by Boshoff (1999)
was not supported in the selected luxury hotel properties. Further, this finding also suggested
that the issue of recovery satisfaction might be a lot less complicated than first thought. When
looked at in greater detail, the two factor structure presented seems to support the notion that
customer satisfaction is achieved through a combination of what is done (PROCESS) as well
as how it is done (APPROACH). This in clearly in line with the service quality literature and
the earlier work of Gummesson (2000) and Gronroos (1988 &1989) amongst others who
define service quality in both technical and relational terms.
A detailed discussion of the findings and cross-loadings will be featured in chapter
five; however, at this time, it should be recognized that items 1, 7, 8, 10, 11, 14, 16 and 17
cross-loaded on two different factors. The degree of difference between the correlation
coefficients registered for each of the items was significantly different; therefore, based on
supporting literature and factor loadings, factors registering the highest correlation coefficient
were selected.
Stage two of this section of the analysis required that the two factor structure found as a
result of the preceding exploratory factor analysis be exposed to a confirmatory factor analysis
in order to confirm the exposed factor structure and whether it held up with the remaining
respondent group. This procedure was completed in AMOS 7 and the results, as shown in

148
Figure 19, confirm the existence of the two factor structure uncovered in the preceding
exploratory factor analysis.
Figure 19. � Confirmatory Factor Analysis for Service Recovery
The model was evaluated by four fit measures (1) the chi square (CMIN), (2) the
Comparative Fit Index (CFI), (3) the Root Mean Square Error of Approximation (RMSEA)
and (4) the Normed Fit Index (NFI). The CFI and NFI is a measure of relative fit comparing
the hypothesized model to the null model with an acceptable value of .95 and .94, respectively
(Hu & Bentler, 1999), while the RMSEA, measures the discrepancy between the sample
coefficients and the population coefficients with acceptable values below .10 to reflect a good
or moderate fit (Loehlin, 2004). While the chi square was found to be statistically significant
F1
v10e1
.71
v9e2
.70v8e3
.61v7e4.77
v6e5.81
v5e6 .77
v4e7.86
v3e8
.84
v2e9
.91
v1e10
.87
F2
v11 e11
.81 v12 e12.67
v13 e13.72
v14 e14.74
v15 e15.83
v17 e16
.57
v18 e17
.71
v16e18
.43
.74
Chi-square = 377.931; df = 81; p =.001 RMSEA = 0.081; CFI = 0.95; NFI = .94

149
(377.931; p< 0.05), indicating a lack of fit, the analysis revealed a very credible and supportive
fit in the CFI = .946, NFI = .94, and RMSEA = .081. All three are indicative of a good fit
between the proposed model and the data analyzed.
TESTING THE CENTRAL RESEARCH HYPOTHESES
Attention shall now turn to section five of the analysis and the testing of the key
research hypotheses as set within the original research framework. In short, the data
gathered during the quantitative stage of the research process will be scrutinized in order
to test for consistency with each of the research hypotheses. Figure 20 presents a revised
pictorial path representation of the key research hypotheses and the order in which they
will be addressed. This model has been revised from that originally proposed within the
theoretical framework section of the study due to the results uncovered in the preceding
analysis of instrument factor structure. The model as originally proposed suggested that
Boshoff�s six service recovery factors would best explain recovery satisfaction and that
this would in some way be mediated by the degree of expressed loyalty customers held
towards the hotel group under investigation. The preceding factor analysis however, has
proven that in this instance Boshoff�s six factor structure did not hold up; uncovering
instead a much less complicated two factor structure encompassing the more technical
and/or relational aspects of the recovery process. It is with this in mind that the following
revised theoretical model is presented.
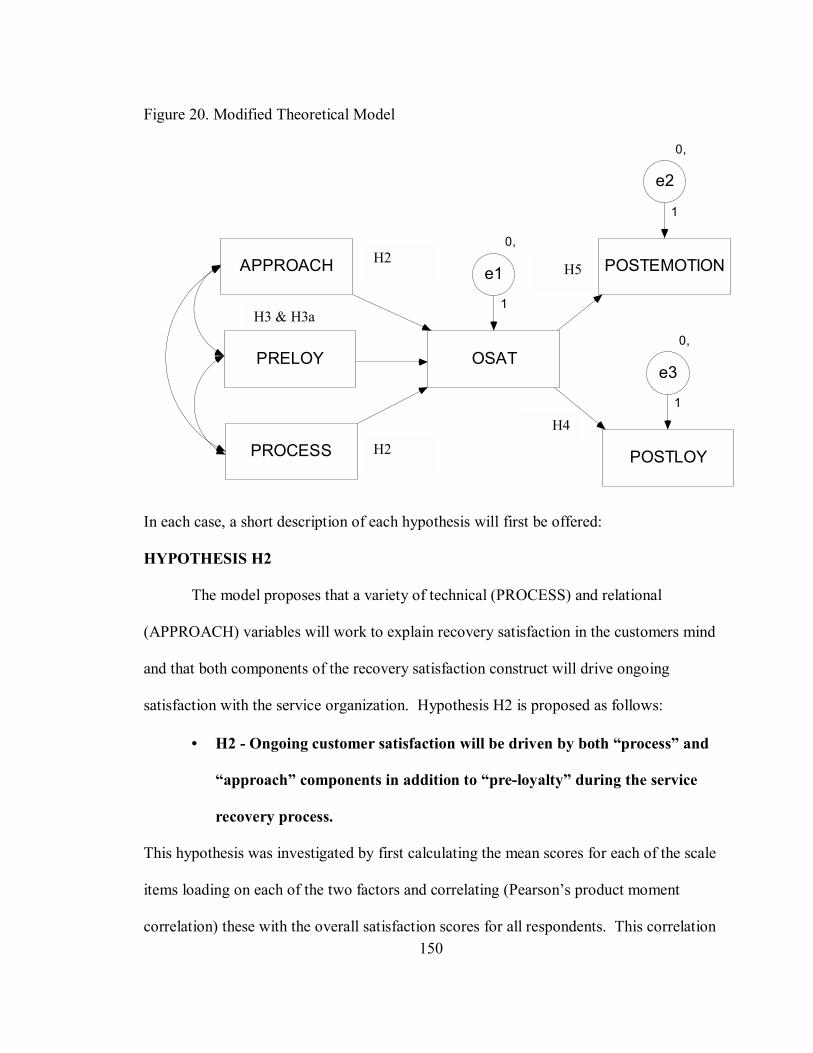
150
Figure 20. Modified Theoretical Model
APPROACH
PROCESS
PRELOY OSAT
POSTEMOTION
POSTLOY
0,
e1
1
0,
e2
1
0,
e3
1
In each case, a short description of each hypothesis will first be offered:
HYPOTHESIS H2
The model proposes that a variety of technical (PROCESS) and relational
(APPROACH) variables will work to explain recovery satisfaction in the customers mind
and that both components of the recovery satisfaction construct will drive ongoing
satisfaction with the service organization. Hypothesis H2 is proposed as follows:
• H2 - Ongoing customer satisfaction will be driven by both �process� and
�approach� components in addition to �pre-loyalty� during the service
recovery process.
This hypothesis was investigated by first calculating the mean scores for each of the scale
items loading on each of the two factors and correlating (Pearson�s product moment
correlation) these with the overall satisfaction scores for all respondents. This correlation
H2
H2
H3 & H3a
H4
H5

151
was used to give an indication of the direction and strength of the linear association
between both variables. The closer the correlation efficient (r) is to 1 or �1, the stronger
the association (+/-) between the variables.
Table 20. Correlation Index � Recovery Satisfaction Components and Ongoing Satisfaction
**Correlation is significant at the 0.01 level (2-tailed).
Results of this test (Table 20) indicate significant correlations between ongoing
satisfaction and all three components of the recovery satisfaction process. All components
were found to be moderate or strongly correlated and significant at the level of 1% (p=0.001).
Regression analysis was then employed to assess the degree to which recovery satisfaction is
explained by all three recovery components and which, if any, is the most important driver of
ongoing satisfaction with the company.
Ongoing satisfaction was to serve as the sole dependent variable, while the two factors
(APPROACH and PROCESS) uncovered during the preceding exploratory factor analysis, in
addition to Preloyalty served as the independent variables. The results point to an adjusted R2
= .51, and F (3, 367) = 141.848, sig. = .000. With just over 51% of the total variance
explained, the standardized beta coefficients (APPROACH = -.042, sig. 729; PROCESS =
O-SAT PROCESS APPROACH O-SAT Pearson Correlation Sig. (2 tailed) N
1.00 398
PROCESS Pearson Correlation Sig. (2 tailed) N
.488**
.000 388
1.000 448
APPROACH Pearson Correlation Sig. (2 tailed) N
.417**
.000 389
.655**
.001 425
1.000 434
PRELOY Pearson Correlation Sig. (2 tailed) N
.192**
.003 243
.209**
.001 260
.270**
.000 260

152
.526, sig. 000; and PRELOY = .079, sig.275) indicate that the more relational (PROCESS)
oriented component of recovery satisfaction is most important in explaining ongoing customer
satisfaction.
HYPOTHESIS H3
The literature provides strong theoretical support for the idea that the degree of
recovery satisfaction experienced will in some way relate to the degree of expressed loyalty
felt toward the failing organization at the time the failure took place. Hypothesis H3 may thus
be posited as follows:
• H3 - There is a strong positive correlation between a customers expressed
loyalty status at the time of the service failure and the degree of recovery
satisfaction felt.
This hypothesis was investigated by calculating the mean score for each of the
two recovery satisfaction components confirmed in the preceding analysis (APPROACH
and PROCESS) and correlating (Pearson�s product moment correlation) these this with
the mean scores for each of the two pre-loyalty components identified previously
(ATTITUDE and BEHAVIOR). Results of this test (Table 21) reveal a rather weak
correlation between both recovery components and loyalty as expressed as an attitude.
While weak, both correlations were nonetheless significant at the 1% level (p=0.001).
Results also reveal that neither component correlated well with the issue of loyalty as
expressed in behavioral terms.
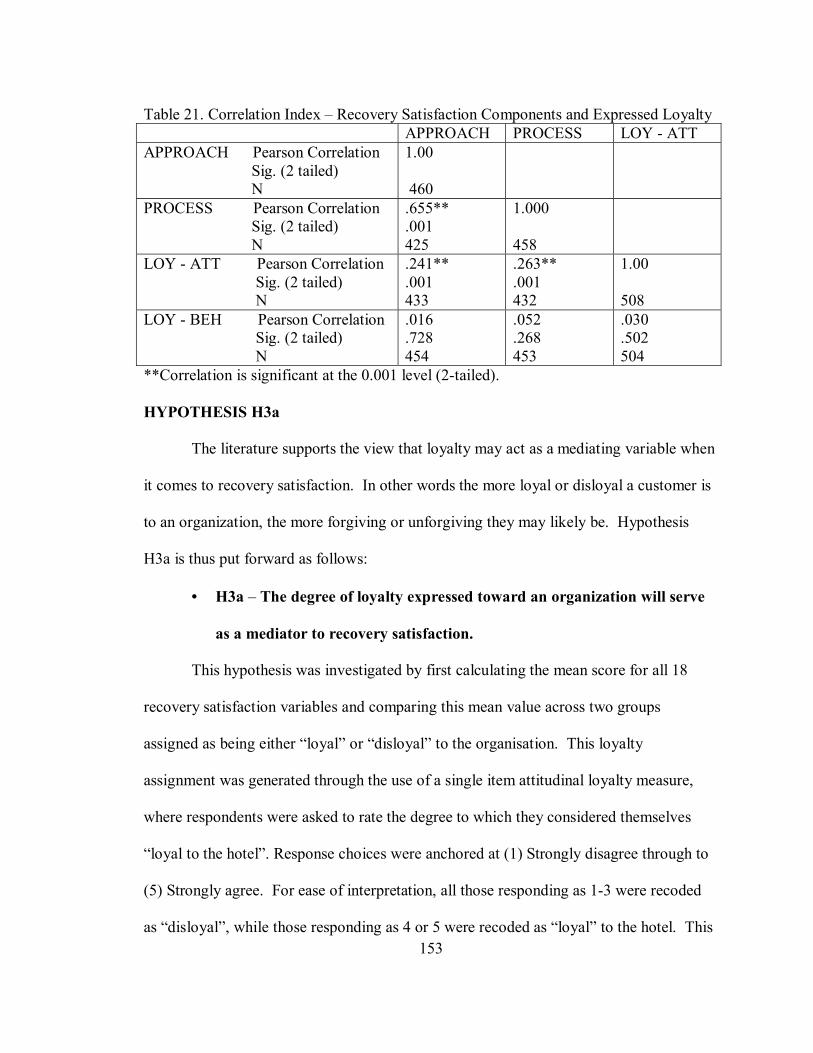
153
Table 21. Correlation Index � Recovery Satisfaction Components and Expressed Loyalty APPROACH PROCESS LOY - ATT APPROACH Pearson Correlation Sig. (2 tailed) N
1.00 460
PROCESS Pearson Correlation Sig. (2 tailed) N
.655**
.001 425
1.000 458
LOY - ATT Pearson Correlation Sig. (2 tailed) N
.241**
.001 433
.263**
.001 432
1.00 508
LOY - BEH Pearson Correlation Sig. (2 tailed) N
.016
.728 454
.052
.268 453
.030
.502 504
**Correlation is significant at the 0.001 level (2-tailed).
HYPOTHESIS H3a
The literature supports the view that loyalty may act as a mediating variable when
it comes to recovery satisfaction. In other words the more loyal or disloyal a customer is
to an organization, the more forgiving or unforgiving they may likely be. Hypothesis
H3a is thus put forward as follows:
• H3a � The degree of loyalty expressed toward an organization will serve
as a mediator to recovery satisfaction.
This hypothesis was investigated by first calculating the mean score for all 18
recovery satisfaction variables and comparing this mean value across two groups
assigned as being either �loyal� or �disloyal� to the organisation. This loyalty
assignment was generated through the use of a single item attitudinal loyalty measure,
where respondents were asked to rate the degree to which they considered themselves
�loyal to the hotel�. Response choices were anchored at (1) Strongly disagree through to
(5) Strongly agree. For ease of interpretation, all those responding as 1-3 were recoded
as �disloyal�, while those responding as 4 or 5 were recoded as �loyal� to the hotel. This

154
recoded variable was to serve as the grouping variable for the ensuing Independent
Samples t-test.
Diekhoff (1992) advocates the use of this test to compare the means of two
samples to determine if those means differ significantly. In short, the phrase
�independent-samples� refers to the fact that �the cases that comprise one sample
(disloyal respondents) are independent from, unrelated to, and in no way influenced by
the cases that complete the other sample (loyal respondents)�.
In this situation the t is used as the test statistic to measure and evaluate the
statistical significance of any difference between the means of both sample groups. If the
value for two-tail significance is less than 0.05 (p<0.05), then the difference between the
means is significant. According to Coakes and Steed (1999), such a level of output
would be indicative of the fact that a significant difference exists between the assigned
groups.
The results of this test as shown in Table 22 indicate that a statistically significant
difference exists between the two groups and the degree of recovery satisfaction
experienced.
Table 22. Independent-samples t Test for loyalty and recovery satisfaction
Variable
N
Mean
Std. Dev
Sig
(2-tailed) Disloyal Respondents Loyal Respondents
124 326
2.34 2.55
0.88 0.95
0.03 0.02
*At p < 0.05, a statistically significant difference was found between both groups
These results lend clear support to the view expressed in Hypothesis H3a that the
degree of loyalty felt for an organisation will in some way affect the degree to which the

155
customer is willing to forgive the organization following a service recovery process.
Both recovery satisfaction means were significantly different between the groups and
those customers classifying themselves as loyal appear much more forgiving.
HYPOTHESIS H4
The literature suggests clear and direct links between a customer�s ongoing
satisfaction with an organization and the degree of loyalty held toward the organisation,
whether expressed as an attitude or in the form of future behavioral intention. Similarly,
the literature also suggests that the degree of satisfaction held should correlate positively
with the customer�s emotional predisposition toward the organization. Hypothesis H4
may thus be stated as follows
• H4 - An individual�s level of overall satisfaction will be positively
correlated to the degree of loyalty expressed for the organization post-
service recovery.
This hypothesis was investigated by calculating the mean loyalty score for each of
the four post-recovery loyalty scale items and correlating (Pearson�s product moment
correlation) these with a single item measure of overall satisfaction. All four loyalty
variables were used in the calculation of this mean due to the results of the preceding
factor analysis which found loyalty to be a uni-dimensional construct in a post-recovery
sense. Results of this test show a significant positive correlation with the post-recovery
loyalty construct (0.875; Sig. = 0.001), thereby confirming the view taken in hypothesis
H4.

156
HYPOTHESIS H5
While it is widely accepted by hospitality professionals that emotion plays a
crucial role in determining customer satisfaction levels, there has been an almost
complete dearth of studies concerning the role of emotion in hospitality satisfaction
research (Barsky & Nash, 2002). Further, while many studies have concluded that there
is a significant relationship between satisfaction and future behavioral intention, the
validity of their findings is now being questioned in that they relate solely to measures of
the more cognitive component of the satisfaction construct (Liljander & Strandvik, 1997;
Yu & Dean, 2001). Much of this research has been focused around the disconfirmation
of some comparison standard or perceived service performance. Satisfaction however, is
also believed to contain an affective (emotional) component without which customers
responses cannot be fully accounted for (Oliver, 1997; Liljander and Strandvik, 1997). It
is therefore hypothesized that:
• H5: An individual�s degree of emotional satisfaction will be positively
related to their overall satisfaction.
This hypothesis was investigated by calculating the mean score for each of the
eight post-recovery emotional scale items and correlating (Pearson�s product moment
correlation) these with a single item measure of overall satisfaction. Results of this test
show a significant positive correlation with the post-recovery loyalty construct (0.388;
Sig. = 0.001), thereby confirming the view taken in hypothesis H5.
PATH ANALYSIS OF CENTRAL RESEARCH HYPOTHESES
Figure 21 shows the inter-correlations for all constructs at stage two of the
research. The proposed model was assessed using AMOS version 16. The results lend

157
further support to certain of the key research hypotheses associated with the model. As
with the preceding confirmatory factor analysis, the model was evaluated by three fit
measures (1) the chi square (CMIN), (2) the Comparative Fit Index (CFI) and (3) the
Root Mean Square Error of Approximation (RMSEA). While the chi square was found
to be statistically significant (36.70; p< 0.05), indicating a lack of fit, the CFI was .971
and the RMSEA = .088, indicating a good fit for data and model.
Figure 21. Path Analysis of Proposed Relationship
The initial results highlighted a number of questionable paths, which led to a re-
specification of the model shown above. This re-specification involved the removal of
the Post-Emotion variable, in addition to 1) the removal of the path between approach
and overall satisfaction, 2) the addition of the path between approach and post-loyalty,
and 3) the addition of a path between process and post-loyalty. The respecification of the
model lead to numerous favourable paths. The results led to a significant improvement in
the fit Indices. Upon making the changes, chi-square (CMIN = 8.68, p=0.01), which was
Process
Preloy
Approach
OSAT Postloy
.46
.27
.21
.81 .38
e1 e2.45
.04
.12

158
statistically significant and therefore indicative of a poor fit; however, a slight increase in
the CFI to .99, NFI to .98 and a marginal improvement of the RSMEA = .080 all revealed
that the model is a good fit of the data.
Both sets of results point to the fact that service recovery certainly does drive
ongoing customer satisfaction. Additionally, the model confirms the earlier regression
analysis which points to the unique contribution played by the softer and more
relationship oriented elements of the recovery approach in achieving ongoing
satisfaction. Similarly, the results offer further support as to the key links between
satisfaction, and the customers� post-recovery loyalty status. A question mark remains
however over the more process and/or mechanical aspects of the recovery process, which
may actually point to the fact that for most customers it is more about how they are
treated. While univariate statistics were provided to support the mediating role of
loyalty, the effects of service recovery satisfaction on post-customer emotion, and the
relationship between APPROACH and POST-LOYALTY, the results of the path analysis
raise a huge question mark over their exact role and influence.
SUMMARY OF FINDINGS
This chapter has addressed the research questions: What, if any, is the relationship
between an organization�s service recovery efforts; subsequent customer satisfaction and
customer loyalty? And what, if any, role does perceived loyalty play as a mediator in the
recovery process? In so doing, it has addressed a number of central and secondary
research hypotheses addressing the issue of recovery satisfaction, its constituent
properties, the role of loyalty as a mediating variable and its relationship to ongoing
satisfaction and loyalty. The study has shed light on how customers define recovery

159
satisfaction and through a series of statistical tests; it has demonstrated that recovery
satisfaction is influenced by the degree of loyalty a customer holds towards an
organization. The results also demonstrated that recovery satisfaction is a key driver of
ongoing satisfaction and loyalty. In addition, the results also show the important role of
the more relational aspect of the recovery process and the fact that above all it is about
the manner in which guest problems are attended to and resolved. In all cases, the results
were found to be statistically significant. The significance of these results shall now be
discussed with respect to their contribution to the literature, their implications for
practitioners and the wider academic community.

160
CHAPTER V
DISCUSSION AND CONCLUSION
RESEARCH OVERVIEW As outlined in the methods chapter, this research consisted of both qualitative and
quantitative analysis. To begin, the qualitative research consisted of an organized focus
group conducted with a selected panel of hotel guests and executives. The results of the
focus group were used to establish a basic understanding of guest�s expectations and/or
perception of service recovery; within organizations in the service industry. In addition,
the researcher also sought to identify a link between the guest�s service recovery
expectations and the expectations identified in previous service recovery measurement
research. The focus group was also used to improve the instrument used in collecting
data for the quantitative analysis of this research.
The quantitative research consisted of a cross-sectional study of the effectiveness
of service recovery performance within selected hotel properties. Five main constructs
were used in the evaluation of the service recovery experience; loyalty, emotion, on-
going satisfaction, future behavioral intentions (FBI) and service recovery satisfaction.
Four of the main constructs were measured based on modified scales from previously
developed, reliable and valid measurements. The service recovery satisfaction
measurement applied Boshoff�s (1999) RECOVSAT measurement, while loyalty and FBI
were measured based on Zeithaml, Parasuraman, and Berry (1995) and Shoemaker and

161
Bowen (2003). The emotion scales were based on Smith and Bolton�s (2002) research in
hotels and restaurants.
In order to support the cross-sectional design of this research, respondents were
selected based on three criteria. First the possible respondents had to be a guest at one of
the selected hotel properties within the past 12 months. Next, possible respondents had to
provide the selected hotel with a current electronic mail address to be a recipient of the
questionnaire. And finally, possible respondents had to denote their willingness to
participate in future research conducted by the individual hotel property, the hotel
management company or by an affiliated partner. Surveys were administered by
electronic mail invitation through Survey Monkey, a web-based survey management
website. Upon receiving the electronic mail invitation, respondents were asked to select
a link embedded in the electronic message. Once selected, the electronic link directed the
respondent to the questionnaire. Approximately two weeks after the initial electronic
message, respondents who had not completed the survey received a friendly reminder.
After the friendly reminder, possible respondents were given two additional weeks to
complete the survey.
One of the numerous features of Survey Monkey is the management and
collection capabilities; thus, upon completion, all responses were automatically organized
and stored in a designated folder. From Survey Monkey, the research transferred all
responses in to a Statistical Package for the Social Sciences (SPSS) version 16.0 for
analysis.
This chapter will be divided into five sections. First, a restatement of the research
hypotheses and the related findings will follow. Second, the service failure details, pre-

162
failure and post-recovery loyalty and FBI data, and post-failure and post-recovery
emotion data will be summarized and discussed. Third, the implications to the academic
and practitioner communities will be introduced. Next, the major contributions of the
study will be outlined. Finally, this chapter will conclude with a restatement of the
limitations and delimitations and recommendations for future research.
H1
Christoff Boshoff (1997 & 1999) and the development of his RECOVSAT scale
have gained wide acceptance and prominence in the academic press. As thoroughly
discussed in the literature review, theoretical framework and analysis sections, his
research produced an instrument that identified six factors related to service recovery
satisfaction in the health care, banking and finance industries. Boshoff�s RECOVSAT
instrument is a relatively new contribution to service recovery literature and has only
been challenged empirically in the banking and finance industry. Strauss (2000)
suggested, although RECOVSAT performed well in banking and finance, it had yet to be
tested empirically in other segments of the service industry.
Supporting service recovery literature and the results of the qualitative analysis
suggested that the six factors presented in RECOVSAT might be mirrored in the luxury
hotel industry. However, modifications were made during the preparation of the
instrument for this study. For example, first and foremost, in order to evaluate the
relationship between service recovery satisfaction and emotion, loyalty and FBI,
numerous scale items were added to correspond with the scope of this study. The next
significant modification was that pre-failure loyalty was evaluated as an attribute to

163
service recovery satisfaction. Consequently, it was apparent that Boshoff�s (1999) six
factor structure might not be supported.
Thus, Hypothesis one (H1) was posited as follows:
• H1 � The six factor structure proposed for the RECOVSAT instrument
will not be supported in the luxury hotel sector.
To test the hypothesis, an exploratory factor analysis of the data across a random
selection of respondents was conducted to uncover the actual factor structure. In order to
validate the findings, analysis exposed the revealed factor structure to a confirmatory factor
analysis for all other responses. The results of the factor analyses revealed strong factor
loadings along two dimensions with coefficient alpha scores ranging from 0.95 (APPROACH)
to 0.90 (PROCESS), which combined explained almost 69% of the variance. Interestingly, the
emerging factors are reflective of what might best be described as the human or interpersonal
elements of service recovery (APPROACH), while component two is reflective of the
technical or formal elements to service recovery (PROCESS). These results demonstrate
clearly that Boshoff�s (1999) six factor component structure, RECOVSAT, was not supported
in the selected luxury hotel properties. One of the most significant finding also suggested that
the issue of recovery satisfaction might not be as complex as expected. Based on the results, it
appears that the two factor structure suggests that customer satisfaction is achieved through a
combination of what is done (PROCESS) as well as how it is done (APPROACH). This in
turn, relates to the findings of Gummesson (2000) and Gronroos (1983, 1988 & 2001) who
defined service quality in both technical (what is done) and function (how it is done) terms.
At this time, it is important to recognize that several factors cross-loaded as a result of
the exploratory factor analysis. Items 1, 7, 8, 10, 11, 14, 16 and 17 cross-loaded on two

164
different factors. Interestingly, the first five items 1, 7, 8, 10, and 11 all directly related to the
�approach�, or in other words, the employee�s intangible role in the service recovery process.
Items related to: the time it took to respond, the quality of communication, ability to ask
questions, the quality of the apology, and the employee�s professionalism. In further
consideration, the degree of difference between the correlation coefficients registered for each
of the items was significantly different; therefore, based on supporting literature and factor
loadings, factors registering the highest correlation coefficient were selected. The three
additional items, 14, 16, and 17; all related to the �process�, or in other words, that the guest
was not further inconvenienced, received an explanation and was informed of the progress. In
addition, the degree of difference between the correlation coefficients registered for each of the
items was also significantly different; therefore, this decision was also made based on
supporting literature and factor loadings registering the highest correlation coefficient.
In an effort to confirm, the factor structure analysis then led to a confirmatory factor
analysis to see if the findings remained consistent across the remaining respondent group. This
procedure was completed in AMOS 7. While the chi square was found to be statistically
significant, which denotes a lack of fit, other fit indices indicated by the CFI = 0.95, NFI = .94
and the RMSEA = .081 suggested a good fit between the proposed model and the data
analyzed.
In summary, H1 was supported, in that the six factor structure of RECOVSAT is not a
valid measure of service recovery satisfaction in the selected luxury hotel properties.
However, of significant importance, instead a less complicated, two factor structure has been
confirmed.

165
H2
The preceding factor analysis revealed that Boshoff�s six factor structure did not
apply in the selected luxury hotel properties. Instead, a factor structure emerged which
was much less complicated encompassing two factors outlined as the approach or the
functional aspect of service recovery and the process or technical aspect of service
recovery. The proposed model outlined in the analysis chapter suggested that a variety of
technical (PROCESS) and relational (APPROACH) variables will work to explain
recovery satisfaction in the customers mind and, of those variables; one may make a
unique contribution as the driver of ongoing satisfaction with the service organization.
Hypothesis H2 was proposed as follows:
• H2 - Ongoing customer satisfaction will be driven by both �process� and
�approach� components in addition to �pre-loyalty� during the service
recovery process.
This research hypothesis was investigated using two forms of analyses. First, the mean
scores for each of the scale items were calculated. Then a correlation matrix (Pearson�s
product moment correlation) was conducted using both factors with the overall
satisfaction scores for all respondents. Next a multiple regression analysis was employed
to evaluate the degree in which each factor explains service recovery satisfaction and to
determine if one factor made a strong contribution compared to the others.
Just as anticipated, results showed that the Process, Approach and Pre-Loyalty
during a service recovery experience were highly correlated or associated with on-going
satisfaction. This in turn suggests that the method or the procedure used when correcting
the service failure is related to the style and professionalism of the employee or

166
manager�s interpersonal skills and both are directly related to the degree of loyalty the
customer felt prior to the service recovery process. All three correlated with on-going
satisfaction; suggesting that customers expect a service recovery process that is
accommodating, personalized, and pleasant but at the same time, organized and
progressive. Although all factors correlated with on-going satisfaction, results from the
multiple regression analysis revealed that the service organization�s process to correcting
the service failure made a unique contribution; thus, the tangible elements were truly the
determining factor in on-going satisfaction. This was a an unexpected finding.
Typically, guests at a luxury property place emphasis on professional, accommodating,
intangible elements of service; however, it is important to remain mindful that luxury
hotel guests may have higher standards and expectations. Thus, as a result, it appears that
a guest is not as willing to accept variations in the organization�s formal process and tend
to be more demanding of the employee or manager�s approach to solving the problem.
H3
The customer�s degree of loyalty prior to the service failure played a critical role
in dissecting service recovery satisfaction in this study. Tax and Brown (2000) identified
service recovery as one of the key ingredients to developing customer relationships,
enhancing loyalty and influencing future behavioral intentions. Suggesting that a
customer must be able to evaluate the service provider in good times and in bad.
Therefore, the customer�s willingness to be loyalty is based on a combination of
satisfying service and a service recovery process that diffuses the problem and restores
the customer�s trust and satisfaction. Therefore H3 was proposed as follows:

167
• H3 - There is a strong positive correlation between a customers expressed
loyalty status at the time of the service failure and the degree of recovery
satisfaction felt.
The loyalty scales used in the instrument were not designed to measure loyalty as
attitudinal and behaviour loyalty; however, a two factor structure did emerge during the
analysis. Interestingly, previous research (Dick & Basu, 1994; Oliver, 1997; McMullan
& Gilmore, 2000; McMullan, 2003) suggested that the loyalty construct comprised two
key components: attitude and behavior. Therefore, this hypothesis was investigated by
calculating the mean score for each of the two recovery satisfaction components
confirmed in the preceding analysis (APPROACH and PROCESS) and correlating
(Pearson�s product moment correlation) these this with the mean scores for each of the
two pre-loyalty components identified previously (ATTITUDE and BEHAVIOR).
Results of this test revealed a weak correlation between both recovery components and
loyalty as expressed as an attitude. While weak, both correlations were nonetheless
significant at the 1% level (p=0.001). Results also revealed that neither component
correlated well with the issue of loyalty as expressed in behavioral terms. The data not
supporting this hypothesis was an unexpected finding considering that over 65% of
respondents claimed to either be loyal or were willing to be loyal to the organization and
over 40% claimed to believe that the hotel had their best interest at heart. Also, over 50%
were both happy to recommend and happy to revisit. These findings could be attributed
to two fundamentals. First, Oliver (1999) stated that although customers enter into the
service encounter with expectations, many customers tend to evaluate a service failure
and service recovery process separate from previous service experiences; especially if it
168
was the first time the customer experienced a service failure. Second, this study did not
explore the degree of the customer�s loyalty prior to the service failure in great detail.
Thus, their loyalty at the time of the failure could be called into question.
H3a
As an extension to H3, the researcher explored the customer�s degree of loyalty as
a mediating variable with service recovery satisfaction. In other words, suggesting that
the customer�s state of loyal or disloyal at the time of the service failure would determine
the customer�s degree of satisfaction or dissatisfaction with the service recovery process.
This hypothesis was explored based on Mattila (2001). She revealed that customer�s in
the foodservice industry that were truly loyal had significantly higher expectations of the
service recovery process compared to those who were disloyal. Therefore, H3a was:
• H3a � The degree of loyalty expressed toward an organization will serve
as a mediator to recovery satisfaction.
In order to differentiate between loyal and disloyalty a single item attitudinal
loyalty measure, where respondents were asked to rate the degree to which they
considered themselves �loyal to the hotel�, was used. For ease of interpretation, all those
responding as 1-3 were recoded as �disloyal�, while those responding as 4 or 5 were
recoded as �loyal� to the hotel. Although �3� was labelled as �unsure�, all respondents
claiming �unsure� were grouped as disloyal. This decision was based on the ideal that
customers who are uncertain of their feelings or attitude toward the organization are,
most likely, not familiar with the organization enough to make a determination. The
results of the Independent Sample t-test revealed a significant difference between loyal
and disloyal state of service recovery satisfaction. Thus, H3a was supported. Results

169
suggested that customers� who considered themselves to be loyal to the organization were
more forgiving compared to customers� who were labelled as disloyal.
This could be justified in several ways. First, luxury hotel properties tend to place
a large emphasis on personalized service; therefore, efforts are put in place to build a
strong relationship between hotel guests and hotel employees or managers. In the event
of a service failure, service providers that know and understand their customer�s
expectations tend to be more successful in solving the problem. Lovelock, Patterson and
Walker (2001) stated that �customer satisfaction evaluations are linked not only to fault-
free service, but also to what transpires when something does go wrong� (p. 343).
Therefore, the better the organization understands the customer, the better able they are to
serve the customer. Also, luxury properties typically spend large sums of money to
produce well-trained, customer oriented employees who focus on building customer
relationships. Second, McKenna (1991) as well as Shoemaker and Bowen (2003) and
Shoemaker and Lewis (1999) revealed that a true emotional bond between the customer
and the organization was built on trust and commitment; therefore, customers tend to be
more forgiving of �their� hotel. The third consideration is the customer�s zone of
tolerance. Guests who prefer luxury accommodations tend to be seasoned travellers; and
a higher degree of expectations may exist.
H4
Hypothesis H4 was also related to customer loyalty. In 1994, Heskett, Jones,
Loveman, Sasser and Schlessinger suggested that the weakest link in the Service Profit
Chain was the link between satisfaction and loyalty. Reichheld and Teal (1996)
supported their finding and suggested that the services that satisfy customers may not

170
always be the same services that engender loyalty to service organizations. However,
Oliver (1997) stated that although satisfaction does not lead to loyalty, a customer can not
be loyal without being satisfied with the overall services and products received. He
continued by clarifying that as the customer�s loyalty to a service organization
strengthened, the steps necessary to form loyalty (i.e. satisfaction) became less
significant. Thus, H4 was proposed.
• H4 - An individual�s level of overall satisfaction will be positively
correlated to the degree of loyalty expressed for the organization post-
service recovery.
This hypothesis was investigated by calculating the mean loyalty score for each of
the four post-recovery loyalty scale items and correlating (Pearson�s product moment
correlation) these with a single item measure of overall satisfaction. All four of the
loyalty variables outlined in the methods section were used in the calculation of this
mean. This was due to the results of the preceding factor analysis which found loyalty to
be a multi-dimensional construct in a post-recovery sense. Results showed a significant
positive relationship between overall satisfaction and the post-recovery loyalty; thus, H4
was supported. This certainly supports previous findings by suggesting that, although
loyalty does not always lead to satisfaction, a customer must be satisfied with all
elements of the organization in order to truly be loyal. Reichheld (2003) stated that a
loyal customer was one who valued the relationship with the company enough to make
the company a preferred supplier; regardless of small variations in service.

171
H5
As outlined in the introduction, previous research has primarily focused on
hypothetical service scenarios to evaluate the customer�s service recovery expectations
opposed to their perception. Although that approach has contributed to the understanding
of service recovery satisfaction, the critical element of emotion has not been applicable.
Research suggests that without a doubt, customer satisfaction, loyalty and future
behavioral intentions are, to some degree, influenced by pre-encounter emotions and
post-consumption emotions (Oliver, 1997; Cronin, Brady & Holt, 2000; Barsky & Nash,
2002). Researchers� also recognized that satisfaction contains an affective (emotional)
component without which customers responses cannot be fully accounted for (Oliver,
1997; Liljander & Strandvik, 1997). Therefore, H5 was stated as follows:
• H5: An individual�s degree of emotional satisfaction will be positively
related to their overall satisfaction.
To test this hypothesis, a mean score was calculated for each of the 8 post-recovery
emotion scale items and a correlation matrix (Pearson�s product moment correlation) was
conducted with a single item measure of overall satisfaction. Results of this test revealed
a significant positive relationship between post-recovery emotion and post-recovery
loyalty, thereby confirming the view taken in hypothesis H5. The emotion expressed is
termed as consumption emotion; which was discussed in the literature review section. To
reiterate, a customer associates both positive and negative emotions with the service
encounter; which in turn, plays a significant role in the customer�s degree of satisfaction,
loyalty and future behavioral intention (Allen, Machleit & Kleine, 1992; Oliver, 1993;
Richins, 1997; Barsky & Nash, 2002). This finding suggests that a service organization�s

172
approach to service recovery should return the customer to a calm, satisfied state
immediately. As a result, influencing the customer�s positive emotions and defusing
negative emotions.
SUMMARY
In summary, four of the six research hypotheses presented in this research were
supported by the resulting analysis. Inherent to these hypotheses is the idea that 1) the
concept of service recovery satisfaction is not as complicated as anticipated in the
selected luxury hotel properties, 2) in the selected luxury hotel properties, it appears that
the customer�s degree of loyalty is a mediating variable to service recovery satisfaction,
3) the customer�s overall satisfaction directly influences the customer�s degree of loyalty
after the service recovery process, and 4) the customer�s post-recovery emotions directly
effect their overall satisfaction with the service organization. This does in fact lead to a
more detailed understanding of the vital role the quality of the service recovery process
plays in on-going satisfaction, loyalty and FBI. These findings support Johnson and
Gustafsson (2000) findings that quality, customer satisfaction and loyalty form a chain of
cause and effect that build on one another and can not be treated or managed successfully
as individual segments of the business.
PERFORMANCE OF THE MEASUREMENT INSTRUMENTS
As described in detail in the analysis section, the construct validity and reliability
of the instruments used in this study were all found to be well within the acceptable
ranges as prescribed by modern statistical methods. Although all scales performed well,
it is necessary to recognize that each scale made unique contributions to the study. The
following section will comprise the discussion of these factors.

173
This section will begin with a discussion of the RECOVSAT scale. First,
numerous modifications were made to the RECOVSAT scale. Primarily, scales to
measure pre-failure loyalty and FBI, post-recovery loyalty and FBI, and emotion were
added. Next, based on the qualitative research, scales to measure the importance of time
were also added. Finally, the pre-loyalty construct was added as a possible driver of
service recovery satisfaction. Consequently, as detailed in the previous section, the
qualitative findings of this research, in accordance with the supporting literature,
suggested that the six factor structure would be supported in the selected luxury hotel
properties. However, as criticized by Strauss (2002), RECOVSAT had not, prior to this
research, been tested empirically in service organizations other than banking and finance.
Thus, alluding to the fact that the drastic differences among service organizations, paired
with the modifications to meet the scope of this study, may alter the performance of the
instrument. Interestingly enough, the two factors structure that emerged makes its own
unique contribution in understanding service recovery satisfaction in the luxury segment
of the hotel industry.
The second set of scales applied in this study were the items designed to test
loyalty and future behavioral intention. The loyalty and FBI sections of the survey were
based on measures developed in 1993 by Zeithaml, Parasuraman, and Berry and a study
in 2003 by Shoemaker and Bowen surrounding relationship marketing and loyalty in the
hotel industry. Scales were positioned in two locations on the questionnaire in order to
denote pre-failure loyalty and FBI and post-recovery loyalty and FBI. The only
modification made to the scale items was the wording to reflect past-tense (i.e. pre-
failure) and future-tense (i.e. post-recovery). Although the scale items were designed to

174
measure a multi-dimensional construct, a post-recovery uni-dimensional construct
emerged. This contribution supports the findings of previous researchers (Dick & Basu,
1984; Oliver, 1997; McMullan & Gilmore, 2000; McMullan, 2003) in regards to pre-
failure; however, it appears that the customer�s attitude and behavior intentions toward
the organization are viewed as one construct after the service recovery experience.
Interestingly, prior to the service failure, a large percentage of respondents
claimed to be loyal or were willing to be loyal and felt that the hotel had their best
interest at heart. In accordance, a large percentage of respondents also planned to revisit
and/or recommend to business associates, family and friends. In reviewing the post-
recovery results, loyalty and FBI were viewed as a uni-dimensional construct, as a result
respondent�s willingness to be loyal, recommend, revisit and their perception of the
hotel�s interest declined drastically. When it comes to the hospitality industry, customers
tend to recommend and/or revisit those hotels, restaurants or tourism destinations that
leave a positive, lasting impression. Especially when recommending a property to
business associates, family or friends, customers tend to be selective in the type of hotel
they endorse. Therefore, minimizing the risk of being embarrassed of recommending a
property with a sub-standard service philosophy.
The emotion scales were adopted from Smith and Bolton (2000) research. The
five negative emotions identified in Smith and Bolton�s (2000) research applied;
however, three positive emotions were added. In retrospect, a balance between positive
and negative emotions should have been applied. While the positive and negative
emotions were not balanced, the emotion scale performed similarly to other emotion

175
scales employed by Izard, 1992, Liljander and Strandvik, 1997; Yu and Dean, 2001; and
Sui and Baloglu, 2003.
Although in retrospect changes could be made, the emotion scales revealed a clear
picture of the respondent�s emotional state directly after the service failure and directly
after the service recovery process. As anticipated, respondents claimed to experience a
vast amount of negative emotions directly after the service failure. While results showed
an increase in positive emotions directly after the service recovery experience, a large
percentage of respondents were not overwhelmingly pleased with the end result of the
recovery. Although respondents no longer claimed to feel anger, discontent, or anxiety; a
large percentage claimed to either be disappointed, or unsure of their feelings, while a
moderate percentage claimed to be calm, happy or grateful.
ACADEMIC IMPLICATIONS
One of the goals of this research was to make a unique contribution to supporting
literature that will lead to a greater understanding of service recovery satisfaction and the
related constructs. In academic terms, this means one of two things. First, that constructs
and hypotheses are re-tested and supported or second, a clarified, more elaborate
interpretation has emerged. Either way, a better approach to explaining a specific
relationship is revealed. The following section will highlight ways in which the results of
this study will hopefully add to the current body of literature.
This study makes several unique contributions. First and foremost, the research
design employed for this study sought the customer�s evaluation of the actual service
recovery process. In other words, customers who truly experienced a failure in service
had the opportunity to evaluate the service recovery process in place within each of the
176
selected hotel properties. To the best of the researcher�s knowledge, previous studies in
the luxury hotel industry have not explored the service recovery satisfaction construct as
a response to an actual failure in service. This in turn led to a refined, yet less
cumbersome, understanding of service recovery satisfaction and the relationship between
loyalty, emotion and FBI post-recovery in luxury hotels.
The role of loyalty in service recovery, on-going satisfaction and FBI made
another distinctive contribution which will hopefully lead to a clearer understanding in
related literature. Although the role of loyalty in a service recovery situation has been
explored in the past, this study revealed that prior to the service failure; customers tend to
view loyalty and FBI as a multi-dimensional construct and directly after the service
recovery process, customers view loyalty as a uni-dimensional construct. To reassess,
pre-failure loyalty findings showed that a customer viewed their attitude toward the
organization separate from their behaviour intentions (i.e. willingness to revisit or
recommend). This was an interesting yet expected finding, considering that previous
research (Dick & Basu, 1994; Oliver, 1997) suggested that the customer passes through
two distinct phases. First, in order for a customer to be loyal the customer had to pass
through the attitude phase and then be willing to take action. One could conclude that
although the customer had a positive attitude toward the organization, they may not be
willing to revisit or recommend or the customer may choose not to be loyal. Bowen and
Shoemaker (1998) outlined reasons why customers are not always willing to be loyal.
The reasons discussed were: 1) travellers who do not return to a specific area cannot be
loyal to the organization, even if they were willing, 2) when exploring luxury hotels,
some hotels customers enjoy a variety of choices and service offerings and do their best
177
to experience as many different organizations as possible, 3) no matter how satisfied,
some customers still remain price sensitive; thus will shop for the most reasonable price,
and 4) some customers just expect to receive quality service and be satisfied every time.
Therefore, some customers do not view quality and satisfaction as reasons to earn their
loyalty.
However, upon completion of the service recovery process, results showed that
loyalty and FBI were uni-dimensional. This could lend to the fact that the customer has
experienced the service provider in a negative light; thus, their perception of the service
quality either meets their approval and earns their loyalty and FBI or fails all together.
In regard to emotion, the findings correspond quite well with previous emotion
research. It appears that post-recovery emotion plays a pivotal role in the customer�s on-
going satisfaction and their attitude and behaviour intentions toward the organization.
Therefore, the need to further explore the role of emotion in academia is vital to
dissecting the service recovery construct within various service organizations. Price,
Arnould and Deibler (1995), indicated that the customer is typically engaged in a service
encounter; therefore, the customer has a time and emotional investment in that
interaction. In retrospect, if given the opportunity to evaluate emotion, the research
design should assess emotion directly after the event. Research lends evidence that
customer satisfaction, loyalty and future behavioral intentions are, to some extent,
influenced by the customer�s emotions prior to the service encounter and directly after
the service encounter (Oliver, 1997; Cronin, Brady & Holt, 2000; Barsky & Nash, 2002).
Unless the emotions felt during the failure and recovery experience were extremely
positive or extremely negative, the lapse of time between experience and the evaluation,

178
could call the emotion results into question. Therefore, the researcher is of the opinion
that emotion measurement should occur as close to the failure and recovery experience as
possible.
The final contribution to this study is the mediating role of loyalty in on-going
satisfaction. Results showed that customers who considered themselves to be loyal at the
time of the service failure were more forgiving and satisfied with the service recovery
process when compared to disloyal customers. Although the researcher hypothesized that
loyal customers were more likely to be satisfied, this was a pleasant, and somewhat
unexpected, finding. This lends evidence to several of the researcher�s ideas. First, a
strong relationship between the customer and the service provider does aid in the quality
of service the customer receives. Second, customers who share an emotional attachment
(i.e. trust and commitment) to the service organization are more willing to help the
organization improve upon their service offerings (i.e. the customer may be willing to
voice their service recovery expectations to help the organization solve the problem).
Finally, Reichheld (2003) stated a loyal customer was one who valued the relationship
with the company enough to make the company a preferred supplier; regardless of small
variations in service.
PRACTITIONER IMPLICATIONS
In an effort to explore the importance of service recovery satisfaction, emotion,
loyalty and FBI in the luxury hotel industry, several important fundamentals emerged as a
result of this research. This section will highlight how the findings of this research can
be applied in the industry.

179
First and foremost, the two factor structure for service recovery satisfaction
clearly indicated that customers expect a balance between the processes employed as well
as the approach taken. Additionally, between the two, process and approach, results
clearly showed that the customer placed higher expectations on the employee or
manager�s people skills. Therefore, suggesting that the intangible elements in the luxury
industry are more critical in the service recovery process.
Although at first glance this structure seems less cumbersome, it is important to
recognize the hefty expectations that lie within each factor. Various elements must meet
the customer�s approval for satisfaction to occur within the �approach�. For example, the
�approach� in service recovery satisfaction related to: 1) the quality of communication
and apology, 2) the time it took to respond and solve the problem, 3) the employee�s
ability to a) solve the problem, b) be respectful and empathetic and c) be knowledgeable,
honest and reliable. Lofty customer expectations were present in regards to the �process�
of service recovery as well. For example, the �process� related to 1) the customer was no
longer inconvenienced, 2) the compensation package was acceptable, 3) the environment,
as well as the employees, had a professional appearance, and 4) the customer was
informed of the progress being made.
The results of this section provide concrete evidence on ways in which luxury
hotels can improve upon their service recovery offerings. Primarily, standard operating
procedures and training manuals can be structure as the intangible or �approach� and
tangible or �process� elements to achieve service recovery satisfaction. Furthermore, the
various elements within each factor require a commitment to continuous quality

180
improvement, on-going employee training, evaluation, coaching and constant feedback
and consistent, timely customer evaluations.
The role of loyalty explored in this research is significant in the luxury hotel
segment. Clearly the loyalty results justify the importance of building relationships
between the customer and the service provider. To reiterate, loyalty results showed that
customers who considered themselves loyal were more satisfied with the service recovery
process compared to those who were disloyal. It is the opinion of the researcher that the
better the organization understands the customer, the better the organization can serve the
customer. Therefore, relationships between the customer and service provider tend to
influence personalized, more accommodating service; in both positive and negative
encounters.
Also, results showed the uni-dimensional evaluation of loyalty after the service
recovery experience. By that rational, the quality of the service recovery must leave a
positive, lasting impression on the customer for the he or she to be willing to revisit,
recommend and feel that the organization is worthy of their loyalty. In industry, this
issue could be addressed as another justification for 1) constantly improving upon the
employee or manager�s approach to failed service; as well as the formal process
employed, and 2) consistent evaluation of the customer�s perception of the recovery
process.
The evaluation of emotion is another area offering industry importance. As a
result of this study, it is apparent that post-recovery emotion truly plays a role in on-going
satisfaction with the organization. Thus, it only stands to reason that a customer feeling a
positive post-recovery emotion would be more inclined to feel more trust and/or

181
commitment toward the organization. While the evaluation of emotion made a
significant contribution, in an effort to truly understand the role emotion plays in service
recovery, practitioners should evaluate the customer�s perception of the service recovery
experience and related emotions immediately following the encounter.
SUMMARY OF THE CONTRIBUTIONS
In summary, this study made several important contributions in both the academic
and practical areas. Although the contributions were discussed above, this section will
present a brief summary.
First, the testing of a previously development service recovery measurement was
applied. This was based on a recommendation by Strauss (2002) where he suggested that
RECOVSAT should be tested empirically in various organizations within the service
industry. Although RECOVSAT did not apply in the selected luxury hotel properties; a
structure emerged that was unique to the selected hotel properties. While the critical
elements suggested in RECOVSAT were still present, it appears that guests in luxury
hotels view the service recovery process as the intangible and tangible elements
surrounding the event. This finding certainly clarifies the relationship between the
service recovery attributes and satisfaction in the luxury hotel industry. Plus, it may also
aid in the development of employee training programs and continuous quality
improvement efforts.
The need to understand loyalty and its role in service recovery satisfaction is
exceedingly important in hospitality. As stressed in the previous pages, the hospitality
industry in destined to be constantly challenged by competition, price wars, duplicated
services, and service failures. Thus, one of the most effective ways to triumph over the

182
challenges is to create an environment which engenders loyalty through personalized,
accommodating services that are tailored to meet the customer�s expectations.
Finally, the role of emotion signified the importance of emotion in the customer�s
evaluation of service recovery satisfaction. As outlined in the related literature section,
there are numerous components to the measurements of loyalty and emotion that may be
burdensome to an organization; however, as disclosed in this study, the loyalty and
emotion constructs are necessary measures to truly understanding service recovery
satisfaction.
FUTURE RESEARCH
This research opens the door to numerous areas of opportunity for future projects.
First, this study can be replicated across other luxury hotel properties, as well as other
segments of the hotel industry. It would also be a valuable contribution to academia and
industry to explore service recovery satisfaction in a similar fashion within the restaurant,
airline and cruise line industries.
Next, as stated earlier, it is in the opinion of the researcher that the emotion
construct could be more effectively measured if the evaluation was distributed
immediately following the service encounter. This would enable the researcher to
explore the customer�s emotional state prior to the service failure as well as gather a more
accurate analysis of post-failure and post-recovery emotion. In addition, although the
emotion scale performed admirably in this study, the emotion scale applied in future
research should be balanced between positive and negative emotions in an effort to not
influence the results in anyway.

183
Another area of opportunity for future research deals with one of the delimitations
to the study. One of the most significant delimitations to this study was the role of the
employee in the service recovery process. Employees and managers play a pivotal role in
customer service, satisfaction, engendering loyalty and influencing future behavioral
intentions toward the organization. In consideration, the employee and manager�s
attitude and opinion toward complaint behavior, the attributes surrounding service
recovery, and their perception of customer relationships could further clarify the service
recovery satisfaction construct.
Finally, research suggests that well-traveled or seasoned guests have a different
service expectation compared to guests who are not well traveled. Therefore, it would be
of interest to the researcher to explore the differences in service recovery expectations
between seasoned travelers and undeveloped travelers.
CONCLUSION
In conclusion, this chapter provided a discussion of the findings, contributions,
and future research considerations which materialized as a result of this study. Each
hypothesis was highlighted, the associated results were revealed and a detailed discussion
followed. From there, the performance of the instruments applied during the course of
this research was revealed. Afterward, a discussion of the academic and practical
implications from this research was presented. This chapter concluded with a discussion
of areas of opportunity for future research.

184
REFERENCES Abrams, M., & Pease, M. (1993). Wining and dining the whiners. Sales and Marketing
Management, February, 73-75. Adams, J.S. (1965). Inequity in social exchange, in Berkowitz, L. (Ed.), Advances in
Experimental Social Psychology. (pp. 267-297). New York, NY: Academic Press. Albrecht, K., & Zemke, R. (1995). Service America!. New York: Warner Books, Inc. Allen, C., Machleit, T., & Kleine, S. S. (1992). A comparison of attitudes and emotions
as predictors of behaviour at diverse levels of behavioral experience. Journal of Consumer Research,18, 493-504.
Andreassen, T. W. (1999). What drives customer loyalty with complaint resolution?
Journal of Service Research, 4, 39-49. Barksy, J. (1996). Building a program for world class service. Cornell Hotel and
Restaurant Administration Quarterly, 37(1), 17-27. Barsky, J., & Nash, L. (2002). Evoking emotion: affective keys to hotel loyalty. Cornell
Hotel and Restaurant Administration Quarterly, 43(2), 39-46. Bejou, D., & Palmer, A. (1998). Service failure and loyalty: An exploratory empirical
study of airline customers. Journal of Services Marketing, 12(1), 7-22. Bell, S. J., Auh, S., & Smalley, K. (2005). Customer relationship dynamics: Service
quality and customer loyalty in the context of varying levels of customer expertise and switching costs. Academy of Marketing Science Journal, 33(2), 169-183.
Bell, C. R., & Zemke, R. E. (1987). Service breakdown: the road to recovery.
Management Review, 10, 32-35. Berry, L. L., Wall, E. A., & Carbone, L. P. (2006). Service clues and customer
assessment of the service experience: Lessons from marketing. Academy of Management Perspectives. 20, 43-57.
Berry, L. L. (1995). Relationship marketing of services: Growing interests, emerging
perspectives. Journal of the Academy of Marketing Sciences, 23(4), 236-245.

185
Berry, L. L., Zeithaml, V. A., & Parasuraman, A. (1985). Quality counts in services, too. Business Horizons, May-June, 44-52.
Billinton, R. & Allen, R. N. (1996). Reliability evolution of power systems. (2nd. Ed.).
New York, NY: Plenum.
Bitner, M. J., Booms, B. H., & Mohr, L. A. (1994). Critical service encounters: The employee�s viewpoint. Journal of Marketing, 58(10) 95-106.
Bitner, M. J., Booms, B. H., & Tetreault, M. S. (1990). The service encounter:
Diagnosing favorable and unfavorable incidents. Journal of Marketing, 54(1), 71-84.
Blodgett, J. G., Granbois, D. H., & Walters, R. G. (1993). The effects of perceived justice
on complainants� negative word-of-mouth behavior and repatronage intentions. Journal of Consumer Research, 69(Winter), 399-428.
Blodgett, J. G., Wakefield, K. L., & Barnes, J. H. (1995). The effects of customer service
on customer complaining behavior. Journal of Services Marketing, 9(4), 31-42. Bloemer, J. M. M., & Kasper J. D. P. (1995). The complex relationship between
consumer satisfaction and brand loyalty. Journal of Economic Psychology, 311-329.
Bloemer J. M. M., & de Ruyter K. (1999). Customer loyalty in high and low involvement
settings: The moderating impact of positive emotions. Journal of Marketing Management, 315-330.
Bolton, R. (1998). A dynamic model of duration of the customers relationship with a
continuous service provider: The role of satisfaction. Marketing Science, 17, 45- 65.
Boshoff, C. (1997). An experimental study of service recovery options. International
Journal of Service Industry Management, 8(2), 110-130. Boshoff, C. (1999). RECOVSAT � An instrument to measure satisfaction with
transaction-specific service recovery. Journal of Services Marketing, 1(3), 236-249.
Boshoff, C., & Staude, G. (2003). Satisfaction with service recovery: Its measurement
and its outcomes. South African Journal of Business Management, 34(3), 9-16. Bourne, L. E., & Russo, N. F. (1998). Psychology: behaviour in context. New York:
W.W. Norton and Company, Inc.

186
Bowen, J. T., & Shoemaker, S. (1998). Loyalty: A strategic commitment. Cornell Hotel and Restaurant Administration Quarterly, (39)1, 12-25.
Bureau of Labor Statistics (online) (cited 20 May 2006). Available from <URL:
http://www. bls.gov/ Retrieved, January, 2007. Cohen, R. J., Swerdlik, M. E., & Smith, D. K. (1992). Psychological testing and
assessment: An introduction to tests and measurements. Mountain View, CA: Mayfield Publishing Company.
Colgate, M., & Norris, M. (2001). Developing a comprehensive picture of service failure. International Journal of Service Industry Management, 12(3), 215-233.
Conlon, D. E., & Murry, N. M. (1996). Customer perceptions of corporate responses to
product complaints: The role of explanations. The Academy of Management Journal, 39(4), 1040-1056.
Cooper, R. N., Cooper, B. M., & Duhan, F. D. (1989). Measurement instrument
development using two competing concepts of customer satisfaction. Journal of Consumer Satisfaction/Dissatisfaction and Complaining Behavior, (2), 28-35.
Coulter, R. A., & Ligas, M. (2000). The long good-bye: The dissolution of customer-
service provider relationships. Psychology and Marketing, 17(8), 669-695. Coulthard, L. (2004). Measuring service quality: A review and critique of research using
SERVQUAL. International Journal of Market Research, 46(4), 479-497. Claycomb, C., & Martin, C. L. (2002). Building customer relationships: An inventory of
service providers� objectives and practices. The Journal of Services Marketing, 16(7), 615-635.
Craighead, C., Karwan, K., & Miller, J. (2004). The effects of severity of failure and
customer loyalty on service recovery strategies. Production and Operations Management, 13(4), 307-321
Cronin, J. J., Brady, M. K., & Holt, G. T. (2000). Assessing the effect of quality, value
and customer satisfaction on consumer behavioral intentions in service environments. Journal of Retailing, 76(2), 193-218.
Cronin, J. J., & Taylor, S.A. (1992). Measuring service quality: A reexamination and
extension. Journal of Marketing, 56(7), 55-68. Cronin, J.J., & Taylor, S.A. (1994). SERVPERF versus SERVQUAL: Reconciling
performance-based and perceptions-minus-expectations measurement of service quality. Journal of Marketing 58(1), 125-131.

187
Czepiel, J. A., Solomon, M. R., Surprenant, C. F., & Gutman, E. G. (1985). Service
encounters: An overview. In J. A. Czepiel, M. R. Solomon, & C. F. Surprenant (Eds.), The Service Encounter: Managing Employee/Customer Interaction in Service Businesses (pp. 3-16). Lexington, MA: Lexington Books.
Day, G. S. (1969). A two-dimensional concept of brand loyalty. Journal of Advertising
Research, 9(3), 29-35. Day, R. L., & Landon, E. L. (1976). Collective comprehensive consumer complaint data
by survey research. In B. Anderson (Eds.), Advances in Consumer Research. Provo, UT: Association for Consumer Research.
Desmet, P. M. A., & Hekkert, P. (2002b). The basis of product emotions. In: W. Green
and P. Jordan (Eds.), Pleasure with Products, beyond usability (60-68). London: Taylor & Francis.
DeVaus, D. A. (Eds.). (1996). Surveys in social research. London: UCL Press. DeVellis, R. F. (1991). Scale Development: theory and applications: Applied Social
Research Methods Series. Newbury Park: Sage.
Dick, A. S., & Basu, A. (1994). Customer loyalty: Toward an integral framework. Journal of Academic Marketing Science, 22(2), 99-104.
Diekhoff, G. (1992). Statistics for the social and behavioral sciences: Univariate, bivariate, multivariate. Dubeque, IA: Wm. C. Brown.
Dowling, G., & Uncles, M. (1997). Do customer loyalty programs really work? Sloan
Management Review, 38(4), 71-83. Dube, L., & Renagham, L. M. (1999). Building customer loyalty: Guests perspectives on
the lodging industry�s functional best practices. Cornell Hotel and Restaurant Administration Quarterly, 40(5), 78-88.
Dube, L., & Shoemaker, S. (2000). Brand switching and loyalty for services. In T.
Swartz, D. Iacobucci, (Eds.), Handbook of Services Marketing and Management (pp. 381-400). Thousand Oaks, CA: Sage Publications.
Duffy, D. L. (1998).Customer loyalty strategies. Journal of Consumer Marketing, 15(5),
435-448. East, R., & Sinclair, J. (2000). Loyalty: Definition and explanation. Visionary Marketing
for the 21st Century: Facing the Challenge.

188
Edvardsson, B., Johnson, M. D., Gustafsson, A., & Strandvik, T. (2000). The effects of
satisfaction and loyalty on profits and growth: Products versus services. Total Quality Management, 11(7), 917-927.
Ekinei, Y., & Hosany, S. (2006). Destination personality: An application of brand
personality to tourism destinations. Journal of Travel Research, 45(2), 127-139. Evrard, Y. & Aurier, P. (1996). Identification and validation of the components of the
person-object relationship. Journal of Business Research, 37(2), 127-134. Festinger, L. (1957). A theory of cognitive dissonance, California: Stanford University
Press. Fornell, C. (1992). A national customer service barometer: The Swedish experience.
Journal of Marketing, 56(1), 6-21. Fornell, C., & Wernerfelt, B. (1987). Defensive marketing strategy by consumer
complaint management: A theoretical analysis. Journal of Marketing Research, 24(4), 337-346.
Fu, Y. Y., & Parks, S. C. (2001). The relationship between restaurant service quality and consumer loyalty among the elderly. Journal of Hospitality Tourism Research, 25(3), 320- 326.
Gilbert, M. (1996). Can loyalty schemes really build loyalty? Marketing Intelligence and Planning, 16(1), 47-55.
Gilmore, A. (2003). Services marketing and management. London: Sage Publications. Gittell, J. H. (2002). Relationships between service providers and their impact of
customers. Journal of Service Research, 4(4), 299-311. Goodwin, C., Ross, I. (1992), Consumer responses to service failure; influence of
procedural and interactional fairness perceptions. Journal of Business Research, 25 , 149-63.
Greenberg, J. (1987). A taxonomy of organizational justice theories. Academy of
Management Review, 12, 9-22. Gronroos, C. (1983). A service quality model and its marketing implications.
European Journal of Marketing, 73(4), 36-44. Gronroos, C. (1988). Service quality: The six criteria of good perceived service quality.
Review of Business, 9(1), 10-13.

189
Gronroos, C. (2001). A service quality model and its marketing implications. European
Journal of Marketing, 18(4), 36-44. Gummesson, E. (2000). Qualitative Methods in Management Research, (2nd. Ed.).
Thousand Oaks, CA: Sage. Gustafsson, A., & Johnson, M. D. (2004). Determining attribute importance in a service
satisfaction model. Journal of Service Research, 7(2), 124-141. Gutek, B. (1995). The dynamics of service: Reflections in the changing nature of
customer/provider interactions. San Francisco: Jossey-Bass. Gwinner, K., Gremler, D., & Bitner, M. J. (1998). Relational benefits in services
industries: The customer�s perspective. Journal of the Academy of Marketing Science, 26(Spring), 101-114.
Hagen-Danbury, A., Matthews, B. (2001). The impact of store image and shopping
involvement on store loyalty in a clothes purchasing context. Proceedings of the Annual Academy of Marketing Conference, Cardiff University.
Hair, J. F., Anderson, R. E., Tatham, R. L., & Black, W.C. (1998). Multivariate Data
Analysis. UpperSaddle River: Prentice Hall. Halstead, D., & Page, T. J. (1993). The effects of satisfaction and complaining behavior
on consumer repurchase intentions. Journal of Services Marketing, 7(1), 33-40.
Hart, C. W. L., Heskett, J. L., & Sasser, E., Jr. (2000). The profitable art of service recovery. Harvard Business Review, 68(4), 148-156.
Hausknecht, D. (1988). Emotional measures of satisfaction/dissatisfaction. Journal of
Consumer Satisfaction/Dissatisfaction and Complaining Behaviour, 1, 25-33. Heskett, J. L., Jones, T. O., Loveman, G. W., Sasser, W. E., & Schlesinger, L. A. (1994).
Putting the service-profit chain to work. Harvard Business Review, 9(2), 64-174. Heskett, J. L., Sasser, Jr. W. E., & Schlesinger, L. A. (1994). The service profit chain.
New York: The Free Press. Hoyer, W. D., & MacInnis, D. J. (2001). Consumer behavior. New York: Houghton
Mifflin Company. Hu, L. & Bentler, P. M. (1999). Cutoff criteria for fit indexes in covariance structure
analysis: Conventional criteria versus new alternatives. Structural Equation Modeling, 6, 1-55.

190
Izard, C. E. (1972). Pattern of emotions: A new analysis of anxiety and depression. New
York: Academic Press. Izard, C. E. (1992). Basic emotions, relations among and emotion-cognition relation.
Psychological Review, 99, 561-565. Jacoby, J., & Chestnut, R.W. (1978). Brand loyalty: measurement and management. New
York: J. Wiley.
Jacoby, J., & Kyner, D. B. (1973). Brand loyalty versus repeat purchase intentions. Journal of Marketing Research, 10, 1-9.
Jensen, J. B., & Markland, R. E. (1996). Improving the application of quality
conformance tools in service firms. Journal of Services Marketing, 10(1), 35-55. Johnson, M. D. & Gustafsson, A. (2000). Improving customer satisfaction, loyalty, and
profit : An integrated measurement and management system. New York: Jossey-Bass.
Johnson, R. (1995). Service failure and recovery: Impact, attributes and processes. Advances in Services Marketing and Management: Research and Practice, (4), 211-228.
Jones, M. A., Mothersbaugh, D. L., & Beatty, S. E. (2002). Why customers stay:
Measuring the underlying dimensions of services switching costs and managing their differential strategic outcomes. Journal of Business Research, 55, 441-450.
Jones, T. O., & Sasser, W. E. (1995). Why satisfied customers defect. Harvard Business
Review, November-December, 88-99. Kandampully, J. (1998). Service quality to service loyalty: A relationship which goes
beyond customer service. Total Quality Management, 9(6), 431-443. Kandampully, J. (2002). Services management � The new paradigm in hospitality. New
South Wales: Hospitality Press. Kau, A. K., & Loh, E. W. (2006). The effects of service recovery on customer
satisfaction; A comparison between complaints and non-complainants. Journal of Services Marketing, 20(2), 101-111
Keaveney, S. M. (1995). Customer switching behavior in service industries: An
exploratory study. Journal of Marketing, 59(4), 71-82.

191
Kelley, S. W., Donnelly, J. H. Jr., & Skinner, S. J. (1990). Customer participation in service production and delivery. Journal of Retailing, 66(3), 315-335.
Knox, S. & Walker, D. (2001). Measuring and managing brand loyalty. Journal of
Strategic Marketing, 9(2), 111-128. Knutson, B. J. (1988). Ten laws of customer satisfaction. Cornell Hotel and Restaurant
Administration Quarterly, 29(3), 14-17. Kuhl, J., & Beckmann, J. (1985). Historical perspectives in the study of action control. In
J. Kuhl and J. Beckmann (Eds.), Action control: From cognition to behavior (pp. 89-100). Berlin: Springer-Verlag.
Leedy, P. D. (1993). Practical research: Planning and design, (5th ed). Englewood Cliffs: MacMillan, Inc.
Lervik, L., & Johnson, M. D. (2000). Equity as a mediator of service quality on service
loyalty. In B. Edvardsson, S. Brown, E. Scheuing, & R. Johnston (Eds.), QUIS 7 � service quality in the new economy: Interdisciplinary and international dimensions (pp. 403-410). Jamaica, New York: International Service Quality Association.
Liljander, V., & Strandvik, T. (1997). Emotions in service satisfaction. International
Journal of Service Industry Management, 8(2), 148-169. Liljander, V., & Bergenwall, M. (2004). Consumption-based emotional responses related
to satisfaction. Swedish School of Economics and Business Administration, Department of Marketing.
Lovelock, C. (2001). Services Marketing People, Technology, Strategy. Upper Saddle
River: Prentice Hall Publishers. Lovelock, C., Patterson, P. G., & Walker, R. H. (2001). Services marketing: An Asia
Pacific Perspective. Sydney: Prentice Hall. Luchars, J. Y., & Hinkin, T. R. (1996). The service quality audit. Cornell Hotel and
Restaurant Administration Quarterly, 37(1), 34-41. Mantel, S. P., & Kardes, F. R. (1999). The role of direction of comparison, attitude-based
processing, and attitude-based processing in consumer preference. Journal of Consumer Research, 25(3), 335-352.
Martin, D. S. (2007). Exploring the effect of emotion on time-elapsed consumer
perceptions of service: A reexamination of the satisfaction construct. (Doctoral dissertation, Auburn University). AU Dissertation Services.

192
Mason, D. D. M., Tideswell, C., & Roberts, E. (2006). Guest perceptions of hotel loyalty. Journal of Hospitality & Tourism Research, 30(2), 191-206.
Mattila, A. S. (2001). The impact of relationship type on customer loyalty in a context of
service failures. Journal of Service Research, 4(2), 91-101. Mattila, A. S., & Patterson, P. G. (2004). Service recovery and fairness perceptions in
collectivists and individual contexts. Journal of Service Research, 6(4), 336-346. Mattila, A., & Wirtz, J. (2000). The Role of preconsumption affect in postpurchase
evaluation of services. Journal of Psychology & Marketing, 17(7), 587-605. McCollough, M. A., Berry, L. L., & Yadav, M. S. (2000). An empirical investigation of
customer satisfaction after service failure and recovery. Journal of Service Research, 3(2), 121-137.
McKenna, R. (1991). Relationship marketing; Successful strategies for the age of the
customer. Reading: Addison-Wesley. McMullan, R., & Gilmore, A. (2003). The conceptual development of customer loyalty
measurement: A proposed scale. Journal of Targeting, Measurement and Analysis for Marketing, 11(3), 230-243.
McMullan, R. (2005). A multiple-item scale for measuring customer loyalty
development. Journal of Services Marketing, 19(7), 470-481. Meyers, L. S., Gamst, G., & Guarino, A. J. (2006). Applied multivariate research; Design
and interpretation. Thousand Oaks: Sage Publications. Miller, J. L., Craighead, C. W., & Karwan, K. R. (2000). Service recovery: A framework
and empirical investigation. Journal of Operations Management, 18(4), 387-400. Mittal, V., Ross, W. T., & Baldasare, P. M. (1998). The asymmetric impact of negative
and positive attribute-level performance on overall satisfaction and repurchase intentions. Journal of Marketing, 62(1), 33-47.
Mueller, R. D., Palmer, A., Mack, R., & McMullan, R. (2003). Service in the restaurant
industry: An American and Irish comparison of service failures and recovery strategies. International Journal of Hospitality Management, 22, 395-418.
Najjar, L., & Bishu, R. R (2006). Service quality: A case study of a bank. The Quality
Management Journal, 13(3), 35-44.

193
Namasivayam, K., & Hinkin, T. R. (2003). The customer�s role in the service encounter: The impact of control and fairness. Cornell Hotel and Restaurant Administration Quarterly, 44(3), 26-36.
Newman, J. W. & Werbel, R. A. (1973). Multivariate analysis of brand loyalty for major
household appliances. Journal of Marketing Research, 10(4), 404-409. Nunnally, J. C. (Eds.).(1978). Psychometric theory. New York: McGraw-Hill. Ok, C., Back, K. J., & Shanklin, C. W. (2005). Modeling roles of service recovery
strategy: A relationship-focused view. Journal of Hospitality & Tourism Research, 29(4), 484-507.
Oliver, R. L. (1980). A cognitive model of the antecedents and consequences of
satisfaction decisions. Journal of Marketing Research, 17(11), 460-69. Oliver, R. L. (1981). Measurement and evaluation of satisfaction processes in retail
settings.Journal of Retailing, 57(1), 515-529. Oliver, R. L. (1993). Cognitive, affective, and attribute bases of the satisfaction
response. Journal of Consumer Research, 20(3), 418-430. Oliver, R. L. (1997). Satisfaction: A behavioral perspective on the consumer. London:
McGraw-Hill. Oliver, R. L. (1997). Varieties of value in the consumption satisfaction response.
Advances in Consumer Research, 23(7), 247-254. Oliver, R. L. (1999). Whence customer loyalty? Journal of Marketing, 63, 33-44. Olorunniwo, F., Hsu, M. K., & Udo, G. J.(2006). Service quality, customer satisfaction,
and behavioral intentions in the service factory. Journal of Services Marketing, 20(1), 59-72.
Olsen, L. L., & Johnson, M. D. (2003). Service equity, satisfaction and loyalty: From
transaction specific to cumulative evaluations. Journal of Service Research, 5(3), 184-195.
Olsen, S. O. (2002). Comparative evaluation and the relationship between quality,
satisfaction, and repurchase loyalty. Journal of the Academy of Marketing Science, 30(3), 240-249.
O�Malley, L. (1998). Can loyalty schemes really build loyalty? Marketing Intelligence
and Planning, 16(1), 47-56.

194
O�Neill, M. (1992). Service Quality Management in Hospitality, Tourism and Leisure. New York: Haworth Hospitality Press.
O'Neill, M. A. (2001). Measuring service quality and customer satisfaction. In J.
Kandampully., C. Mok, & B. Sparks, (Eds.) Service quality management in hospitality, tourism and leisure. New York: Haworth Hospitality Press.
O�Neill, M. A., & Palmer, A. (2004). The effects of survey timing upon visitor�s
perceptions of service quality. Journal of Travel Research, 24, 221-136.
O'Neill, M., & Wright, C. (2002). Service quality evaluation in the higher education sector: An empirical investigation of student perceptions. Higher Education Research and Development. 21(1), 23-40.
Parasuraman, A., Zeithaml, V. A, & Berry, L. L. (1985). A conceptual model of service
quality and its implications for future research. Journal of Marketing, 49 (Fall), 41-50.
Parasuraman, A., Zeithaml, V. A., & Berry, L.L. (1988). SERVQUAL: A multiple item
scale for measuring consumer perceptions of service quality. Journal of Retailing, 64, 12-37.
Parasuraman, A., Berry, L., & Zeithaml, V. A. (1991). Understanding customer expectation of service. Sloan Management Review, 32(1), 39-48.
Parasuraman A., Zeithaml V., & Berry, L. (1994). Reassessment of expectations as a
comparison standard in measuring service quality: Implications for future research. Journal of Marketing, 59(1), 111-124.
Patterson, P. G. & Smith, T. (2003). A cross cultural study of switching barriers and
propensity to stay with service providers. Journal of Retailing, 79, 107-120. Price, L. L., Arnould, E. J., & Tierney, P. (1995). Going to extremes: Managing service
encounters and assessing provider performance. Journal of Marketing, 59(4), 83-97.
Ramaswamy, R. (1996), Design and management of service processes: keeping
customers for life. New York: Addison Wesley. Ravald, A., & Gronroos, C. (1996). The value concept and relationship marketing.
European Journal of Marketing, 30(2), 19-30. Reichheld, F. F. (1996). Learning from customer defections. Harvard Business Review,
March-April, 56-69.

195
Reichheld, F. F. (2003). The one number you need to grow. Harvard Business Review, 82(6), 46-54.
Reichheld, F. F., & Sasser, E. W. (1990). Zero defects: Quality comes to service.
Harvard Business Review, 68(September-October), 105-111. Reichheld, F. F., & Teal, T. (1996). The Loyalty Effect. Boston: Harvard Business School
Press. Reisinger, Y. (1992). Unique Characteristics of Tourism, Hospitality and Leisure
Services, Service Quality Management in Hospitality, Tourism and Leisure, New York: Haworth Hospitality Press.
Richins, M. L. (1997). Measuring emotions in the consumption experience. Journal of
Consumer Research, 24, 75-92. Roos, I. (1999). Switching processes in customer relationships. Journal of Service
Research, 2(1), 68-85. Roos, I., & Strandvik, T. (1997). Diagnosing the termination of customer relationships
(pp.617-631). Dublin, Ireland: Three American Marketing Association Special Conferences: Relationship Marketing: American Marketing Association.
Rosen, L. D., Karwan, K. R. & Scribner, L. L. (2003). Service quality measurement and
the disconfirmation model: Taking care in interpretation. Total Quality Management & Business Excellence, 14(1), 3-12.
Rubin, D. B. (1993). Satisfying confidentiality constraints through the use of synthetic
multiplyimputed microdata. Journal of Official Statistics, 91, 461-468. Ruyter, J. C., & Wetzels, M. (2000). Customer equity considerations in service recovery:
A cross-industry perspective. International Journal of Service Industry Management, 11(1), 91-108.
Scanlan, L., & McPhail, J. (2000). Forming service relationships with hotel business
travelers: The critical attributes to improve retention. Journal of Hospitality & Tourism Research, 24(4), 491-513.
Shahin, A. (2002). SERVQUAL and model of service quality gaps: Framework for
determining and prioritizing critical factors in delivering quality service. Iran. University of Isfahan, Department of Management.
Sharma, N., & Patterson, P. (2000). Switching costs, alternative attractiveness and
experience as moderators of relationship commitment in professional, consumer services. International Journal of Service Industry Management, 11(5), 470-90.

196
Sharp, B., & Sharp, A. (1997). Loyalty programs and their impact on repeat-purchase
loyalty patterns. International Journal of Research in Marketing, 14, 473-486. Shoemaker, S., & Bowen, R. C. (2003). A commentary on Loyalty: A strategic
commitment. Cornell Hotel and Restaurant Administration Quarterly, 44(5/6), 47-52.
Shoemaker, S., & Lewis, R. C. (1999). Customer loyalty: The future of hospitality
marketing. International Journal of Hospitality Management, 18(4), 345-370. Singh, J. (1991). Understanding the structure of consumers� satisfaction evaluations of
service delivery. Journal of the Academy of Marketing Science, 19(4), 223-244. Simmons, J. V. (2004). Reliability-based analysis of service recovery. The International
Journal of Quality & Reliability Management, 21(1), 11-31. Smith, A. K., & Bolton, R. N. (1998). An experimental investigation of customer
reactions to service failure and recovery encounters: Paradox or peril? Journal of Service Research, 1(1), 65-81.
Smith, A. K., & Bolton, R. N. (2002). The effect of customers� emotional responses to
service failures on their recovery effort evaluations and satisfaction judgments. Journal of the Academy of Marketing Science, (30)5, 5-23.
Smith, A. K., Bolton, R. N., & Wagner, J. (1999). A model of customer satisfaction with
service encounters involving failure and recovery. Journal of Marketing Research, 36(8) 356-372.
Spreng, R. A., Harrell, G. D., & Mackoy, R. D. (1995). Service recovery: Impact on
satisfaction and intentions. Journal of Services Marketing, 9(1), 15-23. Stauss, B. (2002). The dimensions of complaining satisfaction: Process and outcome
complaint satisfaction versus cold fact and warm act complaint satisfaction. Managing Service Quality, 12(5), 397-415.
Sui, J., & Baloglu, S. (2003). The role of emotional commitment in relationship
marketing: An empirical investigation of a loyalty model for casinos. Journal of Hospitality & Tourism Research, 27(4), 470-489.
Stevens, J. P. (2002). Applied multivariate statistics for the social sciences (4th ed.).
Hillside, NJ: Erlbaum. Tax, S., & Brown, S. W. (2000). Recovering and learning from service failure. Sloan
Management Review, 40(1), 75-88.

197
Tax, S., Brown, S., & Chandrashekaran, M. (1998). Customer evaluations of service
complaint experiences: Implications for relationship marketing. Journal of Marketing, 62(2), 60-76.
Technical Assistance Research Program. (1996), Does the rhetoric of customer service
match the reality? Managing Service Quality, 6(3), 27-33. Tideswell, C., & Fredline, E. (2004). Developing and rewarding loyalty to hotels: The
guest�s perspective. Journal of Hospitality & Tourism Research, 28(2), 186-208. Wangenheim, F., & Bayon, T. (2004). Satisfaction, loyalty and word of mouth with the
customer base of a utility provider: Differences between stayers, switchers and referral switchers. Journal of Consumer Behavior, 3(3), 211-220.
Webster, F. E. Jr. (1992). The changing role of marketing in the corporation. Journal of
Marketing, 56(4), 1-17. Westbrook, R. A., & Oliver, R. L. (1991). �The Dimensionality of Consumption Emotion
Patterns and Consumer Satisfaction. Journal of Consumer Research, 18(3), 84-91. Wirtz, J., & Bateson, J. (1997). An experimental investigation of halo effects in
satisfaction measures of service attributes. Journal of Service Industry, 6(3), 84-102.
Wirtz, J., & Bateson, J. E. G. (1999). Consumer satisfaction with services: integrating the
environment perspective in services marketing into the traditional disconfirmation paradigm. Journal of Business Research, 44(1), 55-66.
Wirtz, J., & Bateson, J. E. G. (1999). Introducing uncertain performance expectations in
satisfaction models for services. International Journal of Service Industry and Management, 10(1), 82-99.
Witt, C., & Muhlemann, A. (1995). Service quality in airlines. Tourism Economics, 1(1),
1-12. Wildes, V. J. (2005). Attracting and retaining food servers: How internal service quality
moderated occupational stigma. International Journal of Hospitality Management, Retrieved January 13, 2006, from http://www.sciencedirect.com.spot.lib.auburn.edu/science
Yu, Y. T., & Dean, A. (2001). The contribution of emotional satisfaction to consumer
Loyalty. International Journal of Service Industry Management, 12, 234-250.

198
Yuksel, A., & Rimmington, M. (1998). Customer-satisfaction measurement. Cornell Hotel and Restaurant Administration Quarterly, 39(6), 60-70.
Zeithaml, V.A. (1998). Consumer perceptions of price, quality, and value: A means end
model synthesis of evidence. Journal of Marketing, 52(3), 2-22. Zeithaml, V. A., Berry, L. L., & Parasuraman, A. (1993). The nature and determinants of
customer expectations of service. Journal of the Academy of Marketing Science, 21(1), 1-12.
Zeithaml, V. A., & Bitner, M. J. (2000). Services Marketing: Integrating Customer Focus
across the Firm. New York: Irwin McGraw-Hill. Zeithaml, V. A., Parasuraman, A. & Berry, L. (1990). Delivering quality service:
Balancing Customer Perceptions and Expectations. New York: The Free Press. Zemke, R. (1993). The art of service recovery: Fixing broken customers and keeping
them on your side. The Service Quality Handbook, San Francisco: AMACOM. Zemke, R., & Bell, C. (1990). Service recovery. Training, 27(6), 42-48. Zemke, R., & Schaaf, D. (1990). The Service Edge. New York: Penguin.

199
APPENDIX A
Information Sheet For Research Study Entitled Service Recovery Satisfaction
Dear Participant: You are invited to participate in a research study to evaluate your satisfaction with the service recovery process at The Hotel at Auburn University and Conference Center (HAUCC) in Auburn, Alabama. This study is being conducted by Ms. Kristen Riscinto-Kozub, Doctoral Student, under the supervision of Dr. Martin O�Neill, Program Director. Ms. Riscinto-Kozub and Dr. O�Neill are representing the Hotel and Restaurant Management Program within the Nutrition and Food Science Department in the College of Human Sciences at Auburn University. As a result of this study, we hope to evaluate the effectiveness of the service recovery process implemented at the HAUCC and how the effectiveness of that experience will determine your willingness to return to the hotel for future visits or recommend the property to colleagues and friends. Following your previous stay at the hotel, you completed a web-based Customer Satisfaction Survey. At that time you expressed an interest in participating in future research conducted by the HAUCC; therefore, your history with the hotel has assisted the researcher in selecting you as a possible participant in this study. If you decide to participate, you will be asked to join a focus group. During our discussions, we will ask you to comment on a Service Recovery Satisfaction Survey. The questions are designed to access the details surrounding the service failure, the service recovery experience and a patron�s intentions to repurchase and/or recommend the HAUCC to colleagues and friends. Your time commitment should be approximately one hour. . Any information obtained in connection with this study will remain anonymous. Information collected through your participation will be used to fulfill Ms. Riscinto-Kozub�s educational requirements, in addition to publication in a scholarly journal and presented at professional meetings. Please be aware that you may withdraw from participating at any time without penalty; however, after you have provided anonymous information we will be unable to withdraw your data since there will be no way to identify your individual information. Your decision whether or not to participate will not jeopardize your future relations with Auburn University, the Hotel and Restaurant Management Program or The Hotel at Auburn University and Conference Center. If you have any questions prior to or upon completion of the survey, we invite you to contact Ms. Riscinto-Kozub via e-mail at [email protected]. For more information regarding your rights as a research participant you may contact the Auburn University Office of Human Subjects

200
Research or the Institutional Review Board by phone at (334) 844-5966 or via e-mail at [email protected] or [email protected]. Having read the information provided, you must decide whether to participate in the research project. If you decide to participate, the data you provide will serve as your agreement to do so. This letter is yours to keep. Thank you for your consideration. Your participation in this study is truly appreciated. ____________________________________ ____________________ Kristen Riscinto-Kozub, Investigator Date

201
APPENDIX B
Information Sheet For Research Study Entitled Service Recovery Satisfaction
Dear Participant: You are invited to participate in a research study to evaluate your satisfaction with the service recovery process at The Hotel at Auburn University and Conference Center (The Hotel) in Auburn, Alabama. This study is being conducted by Ms. Kristen Riscinto-Kozub, Doctoral Student, under the supervision of Dr. Martin O�Neill, Program Director in accordance with Mr. Ryan Magnon, Vice President of Quality for West Paces Hotel Group. Ms. Riscinto-Kozub and Dr. O�Neill are representing the Hotel and Restaurant Management Program within the Nutrition and Food Science Department in the College of Human Sciences at Auburn University. As a result of this study, we hope to evaluate the effectiveness of the service recovery process implemented at The Hotel and how the effectiveness of that experience will determine your willingness to return to the hotel for future visits or recommend the property to colleagues and friends. Following your previous stay at the hotel, you completed a web-based Customer Satisfaction Survey. At that time you expressed an interest in participating in future research conducted by The Hotel; therefore, your history with the hotel has assisted the researcher in selecting you as a possible participant in this study. If you decide to participate, you will be asked to complete one of two surveys. The questions on the surveys are designed to access the details surrounding the service experience, potential service failures, the service recovery experience and a patron�s intentions to repurchase and/or recommend The Hotel to colleagues and friends. Your time commitment should be approximately 5-7 minutes. Any information obtained in connection with this study will remain anonymous. Information collected through your participation will be used to fulfill Ms. Riscinto-Kozub�s educational requirements, in addition to publication in a scholarly journal and presented at professional meetings. Please be aware that you may withdraw from participating at any time without penalty; however, after you have provided anonymous information we will be unable to withdraw your data since there will be no way to identify your individual information. Your decision whether or not to participate will not jeopardize your future relations with Auburn University, the Hotel and Restaurant Management Program or The Hotel at Auburn University and Conference Center. If you have any questions prior to or upon completion of the survey, we invite you to contact Ms. Riscinto-Kozub via e-mail at [email protected]. For more information regarding your rights as

202
a research participant you may contact the Auburn University Office of Human Subjects Research or the Institutional Review Board by phone at (334) 844-5966 or via e-mail at [email protected] or [email protected]. Having read the information provided, you must decide whether to participate in the research project. If you decide to participate, the data you provide will serve as your agreement to do so. This letter is yours to keep. Thank you for your consideration. Your participation in this study is truly appreciated. Kristen Riscinto-Kozub, Investigator
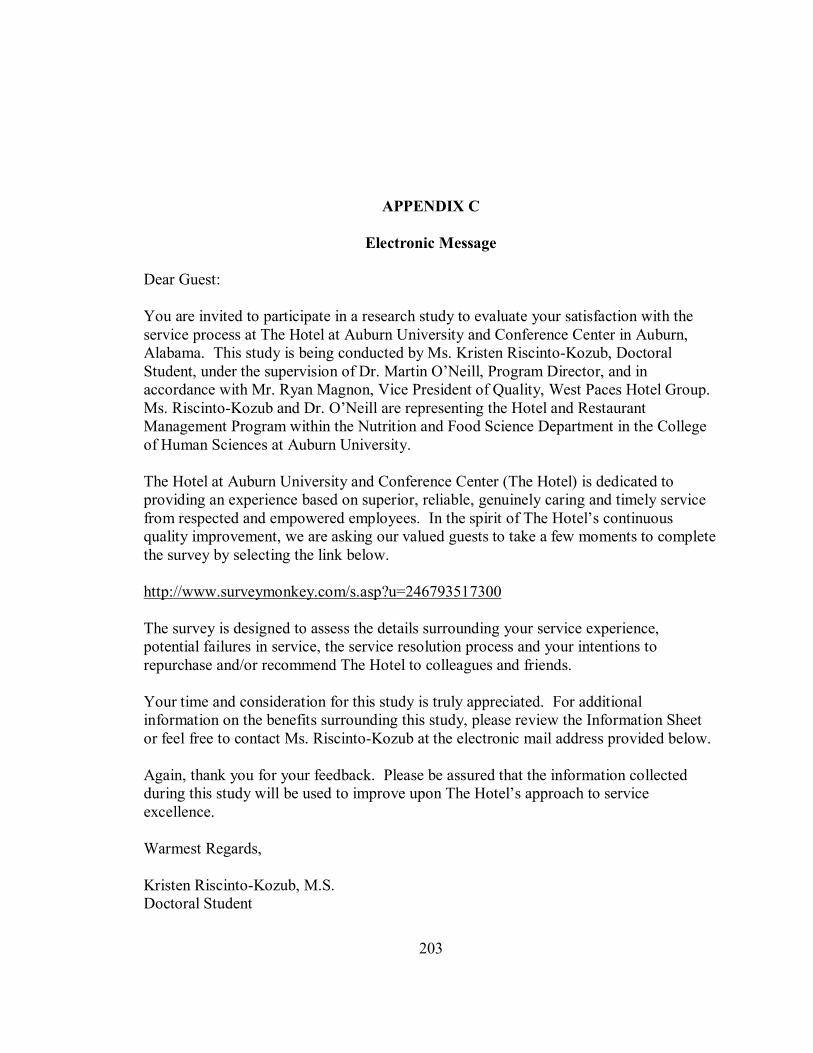
203
APPENDIX C
Electronic Message Dear Guest: You are invited to participate in a research study to evaluate your satisfaction with the service process at The Hotel at Auburn University and Conference Center in Auburn, Alabama. This study is being conducted by Ms. Kristen Riscinto-Kozub, Doctoral Student, under the supervision of Dr. Martin O�Neill, Program Director, and in accordance with Mr. Ryan Magnon, Vice President of Quality, West Paces Hotel Group. Ms. Riscinto-Kozub and Dr. O�Neill are representing the Hotel and Restaurant Management Program within the Nutrition and Food Science Department in the College of Human Sciences at Auburn University. The Hotel at Auburn University and Conference Center (The Hotel) is dedicated to providing an experience based on superior, reliable, genuinely caring and timely service from respected and empowered employees. In the spirit of The Hotel�s continuous quality improvement, we are asking our valued guests to take a few moments to complete the survey by selecting the link below. http://www.surveymonkey.com/s.asp?u=246793517300 The survey is designed to assess the details surrounding your service experience, potential failures in service, the service resolution process and your intentions to repurchase and/or recommend The Hotel to colleagues and friends. Your time and consideration for this study is truly appreciated. For additional information on the benefits surrounding this study, please review the Information Sheet or feel free to contact Ms. Riscinto-Kozub at the electronic mail address provided below. Again, thank you for your feedback. Please be assured that the information collected during this study will be used to improve upon The Hotel�s approach to service excellence. Warmest Regards, Kristen Riscinto-Kozub, M.S. Doctoral Student