the effects of providing pre-test ordering cost
TRANSCRIPT
��
- 1 -
The effects of providing pre-test ordering cost information on laboratory test costs in an Internal Medicine ward of a tertiary care
hospital
by
DR. S. ELLEMDIN
Student no. 95280376
Submitted in partial fulfillment of the requirements for the degree of
Master of Science in CLINICAL EPIDEMIOLOGY
In the Faculty of Health Sciences
University of Pretoria
Pretoria
2010
©© UUnniivveerrssiittyy ooff PPrreettoorriiaa

��
- 2 -
DECLARATION I hereby declare that this dissertation presented to the University of
Pretoria for Masters of Science in Clinical Epidemiology degree is my own
work and has not been presented previously to any other tertiary institution
for any degree
AUTHORSHIP First Author: Dr. S. Ellemdin Second Author: Prof. P. Rheeder Third Author: Dr. P. Soma ACKNOWLEDGEMENTS I would like to express my sincere appreciation to my study supervisor,
Prof. P. Rheeder, my assistant, Dr. P. Soma and my statistician, Dr. P.
Bekker

��
- 3 -
TABLE OF CONTENTS
LIST OF TABLES page 4 ABSTRACT page 5
CHAPTER 1
1. INTRODUCTION page 7 2. LITERATURE REVIEW page 7
CHAPTER 2
1. AIM OF THE STUDY page 17 2. STUDY QUESTION page 17 3. HYPOTHESIS page 17 4. STUDY DESIGN page 17 5. SETTING page 18 6. AUDIT AND INTERVENTION page 18 7. MEASUREMENT and STATISTICAL ANALYSIS page 19 8. ETHICAL ASPECTS page 20
CHAPTER 3
1. RESULTS page 23 2. DISCUSSION page 27 3. LIMITATIONS OF THE STUDY page 28 4. CONCLUSIONS page 29
CHAPTER 4
1. REFERENCES page 30
CHAPTER 5
1. ADDENDUM 1 page 37 2. ADDENDUM 2 page 38 3. ADDENDUM 3 page 39

��
- 4 -
LIST OF TABLES Table 1 - Variables affecting test ordering tendencies – page 13 Table 2 - Patient demographics – page 23 Table 3 - Hospitalisation and cost data - page 24 Table 4 - ANOVA results – page 26
��
- 5 -
ABSTRACT
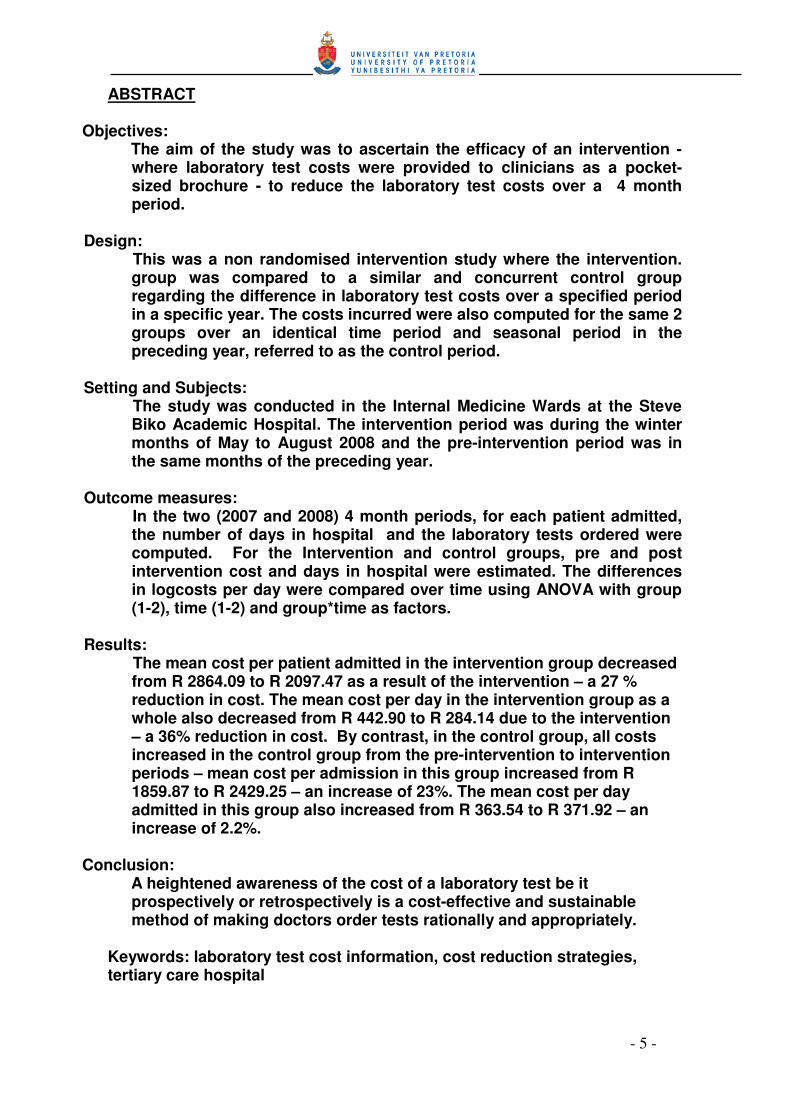
Objectives: The aim of the study was to ascertain the efficacy of an intervention -
where laboratory test costs were provided to clinicians as a pocket-sized brochure - to reduce the laboratory test costs over a 4 month period.
Design: This was a non randomised intervention study where the intervention.
group was compared to a similar and concurrent control group regarding the difference in laboratory test costs over a specified period in a specific year. The costs incurred were also computed for the same 2 groups over an identical time period and seasonal period in the preceding year, referred to as the control period.
Setting and Subjects: The study was conducted in the Internal Medicine Wards at the Steve
Biko Academic Hospital. The intervention period was during the winter months of May to August 2008 and the pre-intervention period was in the same months of the preceding year.
Outcome measures: In the two (2007 and 2008) 4 month periods, for each patient admitted,
the number of days in hospital and the laboratory tests ordered were computed. For the Intervention and control groups, pre and post intervention cost and days in hospital were estimated. The differences in logcosts per day were compared over time using ANOVA with group (1-2), time (1-2) and group*time as factors.
Results: The mean cost per patient admitted in the intervention group decreased
from R 2864.09 to R 2097.47 as a result of the intervention – a 27 % reduction in cost. The mean cost per day in the intervention group as a whole also decreased from R 442.90 to R 284.14 due to the intervention – a 36% reduction in cost. By contrast, in the control group, all costs increased in the control group from the pre-intervention to intervention periods – mean cost per admission in this group increased from R 1859.87 to R 2429.25 – an increase of 23%. The mean cost per day admitted in this group also increased from R 363.54 to R 371.92 – an increase of 2.2%.
Conclusion: A heightened awareness of the cost of a laboratory test be it
prospectively or retrospectively is a cost-effective and sustainable method of making doctors order tests rationally and appropriately.
Keywords: laboratory test cost information, cost reduction strategies, tertiary care hospital

��
- 6 -
CHAPTER 1
1. INTRODUCTION 2. LITERATURE REVIEW

��
- 7 -
1. INTRODUCTION Laboratory tests are often requested without clear indication of potential
benefit or cost implications (1 - 6). Previous studies have shown that
various interventions can reduce the number of tests ordered and thereby
reduce the hospitalization-associated costs (7 - 11).
The department of Internal Medicine conducted a survey in 2007 to assess
the level of ignorance of the cost of diagnostic tests among registrars (20
out of 22 in current employment at the time) in different years of study in
the department of Internal Medicine. This survey resulted from the fact that
the laboratory budget was grossly overspent for the year 2006. The result
of the survey was purely as part of an internal audit and not intended for
publication of any kind. This survey demonstrated an 84% failure rate
confirming the primary assumption that physicians estimates of the costs,
as were the case in many other studies, were off by 45 to 75% (12 - 16). In a
recent Medline and Cochrane review, it was emphasized that doctors have
a limited knowledge and understanding of diagnostic costs and more focus
is required in educating them in this regard as well making these costs
accessible to them. (16)
2. LITERATURE OVERVIEW Most of the diagnostic and therapeutic services are ordered by physicians
on behalf of patients – traditionally under fee-for-service conditions such
as the South African public sector these physicians are not needed to
make cost-containment a major factor in his decision process (20 - 22). In

�
- 8 -
fact there is ample evidence of an over-utilisation of such services and it
remains unclear who should pay for unnecessary medical services – the
patient, the doctor, the hospital or the state coffer (23 - 30). It has been
proposed that the physician should share this financial responsibility for
over-utilisation of services that he has ordered or provided.
Factors contributing to excessive use of laboratory tests in teaching
hospital according to literature review may be divided arbitrarily according
to institutional, physician, laboratory and patient factors (31 - 35):
�� Institutional
a) High proportion of tertiary care patients
b) Multiplicity of physicians involved in the care of individual
patients
c) Application of test ‘routines’ in high intensity care areas (e.g.
medical ICU)
d) Peer pressure (e.g. teacher – student – registrar)
e) Desire for new knowledge
f) Isolation of clinical pathologist from clinician
�� Physician
g) Inadequate knowledge of test characteristics
h) ‘Blanket’ testing (e.g. simultaneous ordering of secondary
diagnostic tests in addition to primary screening tests)
i) Erroneous inferences from test results leading to additional
tests
j) Diagnostic ‘overkill’ (e.g. use of 2 or more confirmatory tests
when one will suffice)
k) Medico legal considerations

�
- 9 -
�� Laboratory
l) Logistical conveniences (e.g. comprehensive laboratory test
requisition team)
m) Laboratory inefficiencies
�� Patient
n) Need for reassurance
o) Patient expectations
Potential systems to allocate responsibility for over-utilisation of medical
services include (36 - 38):
�� Auditing of patient’s records after discharge from the hospital for
unnecessary medical services relevant to the clinical problems and
diagnoses
�� Auditing of physician’s prescribing and ordering of service patterns
relevant to the patients clinical problems and diagnoses
� Physicians having a thorough knowledge of all medical services –
not only the indications, contra-indications, specificities,
sensitivities, predictive values, likelihood ratios but also the cost of
every service – all this information must be available quickly and
with minimal effort laboratories offering services have a 24-hour help
line managed by suitably qualified personnel to offer advice on
available tests that may influence a clinicians decision in a
diagnostic work-up
� Doctors in training obtain a second medical opinion on a case
preferably from a consultant physician during a diagnostic work-up

���
- 10 -
�� Laboratories sending monthly feedback of laboratory usage and cost
data to clinicians on a monthly basis with a view to this information
influencing the way they make decisions
�� Providing meaningful incentives for physicians motivating them
toward cost-saving – by contrast, one can introduce appropriate
penalties against physicians who continue over-utilisation of
services despite several warnings
Compounding the over-utilisation of medical services, from a medico-legal
perspective physicians are under no legal obligation to see that services
utilised are economically justified – traditional tort law (i.e. medical
malpractice) judges the physician on the medical correctness of the
treatment rendered, not on its financial soundness (38,39). Thus, a doctor
who, in disregard of the financial implications to the patient or funder,
provides or orders unnecessary services has no liability unless these
services cause physical harm to the patient (40).
It is impossible to estimate the potential savings of placing physicians at
risk for the cost of unnecessary services. Nor is it possible to estimate
whether the savings would offset the administrative costs of an auditing
programme. It is appropriate to consider this proposal as an alternative to
arbitrary cost ceilings in the public health service, since this alternative
leaves responsibility for determining the level of medical care output in the
hands of the physician and his peers. No sooner do physicians accept
financial responsibility, the profession is guarded against external
regulation.

���
- 11 -
According to a literature review on improved laboratory usage, several
cost-containment strategies have been tried (41 - 47):
�� Rationing of test – Many studies have shown a drastic reduction in
the number of tests after being rationed but this was not sustained in
the long term and laboratories have found it unreasonable not to
perform tests which clinicians say are indicated
�� Form design – The actual request form designed to guide physicians
in selecting appropriate investigations has been shown to both
increase and reduce the number of tests in comparison to a blank
form
� Resource management – There is a view that giving doctors, nurses
and other managers budgets and financial targets will result
increased efficiency but this view has shown a few times to be over-
optimistic.
� Financial unbundling – in a ‘fee for item’ system it has been shown
than charging for individual tests has been more cost effective than
having panels of investigations covered by one fee.
�� Education relating to test requesting – a thorough knowledge of each
diagnostic test esp. the sensitivity, specificity, predictive values,
likelihood ratios and the like has been shown to short term benefit
only
�� Education about costs – there appears to be a serious limitation of
test costs even in countries where health care has a strong and
visible financial component. Methods used include distribution of
cost containment newsletters, charges of common tests and
���
- 12 -
manuals stressing the cost of tests. So far most strategies have only
shown a modest effect in reducing the ordering of unnecessary tests
� Decision support systems, protocols and decision analysis trees in
diagnostic work-up – these have been to actually work-up but they
require great technical support, medical supervision to keep the
protocols up-to-date and a willingness on the part of doctors to use
the outputs from these system
�� Personal incentives – most incentives whether they be cash or kind
were shown to be unsuccessful
�� Feedback – all 3 forms of feedback (information on test requesting
and utilisation, information on the cost of investigations and ranking
of physicians according to the tests ordered or the costs) have been
shown to be substantial value in reduction of ordering of
unnecessary tests
�� Review of patient notes – Weekly or monthly audit of junior staff’s
clinical notes by senior staff with a view to commentate and analyse
the investigations requested has been shown to dramatically reduce
the ordering of unnecessary tests albeit in a non-sustained manner
���
- 13 -
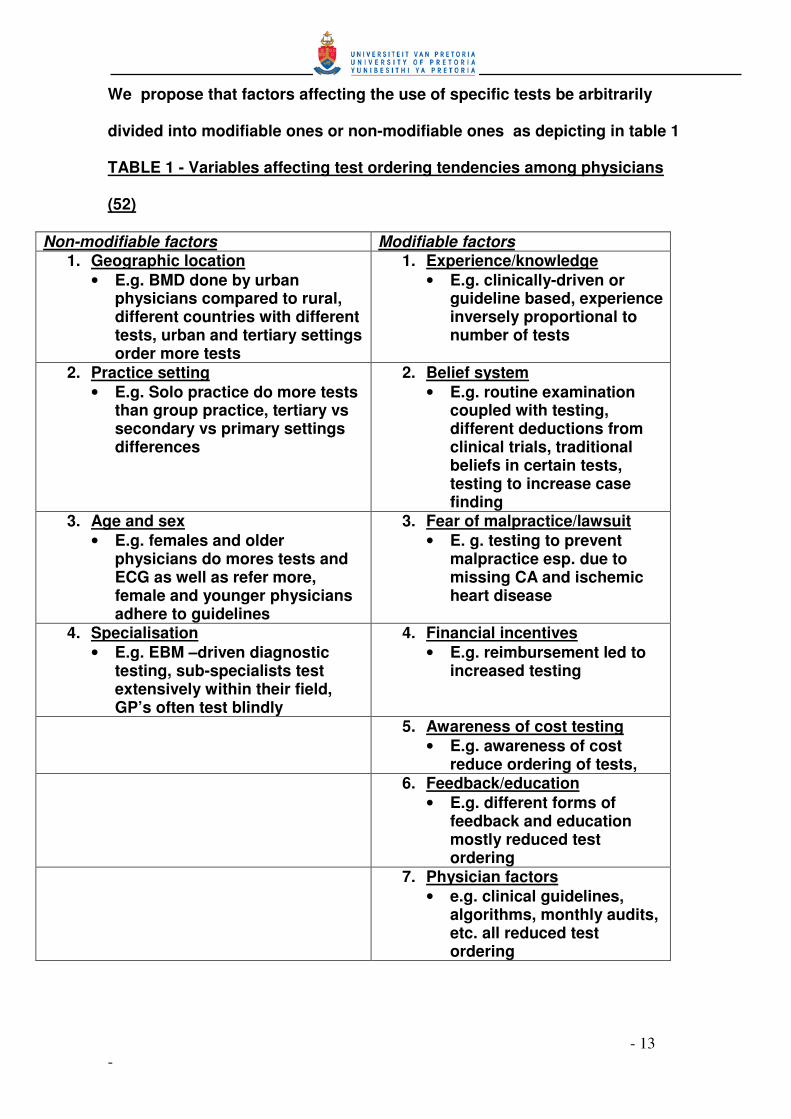
We propose that factors affecting the use of specific tests be arbitrarily
divided into modifiable ones or non-modifiable ones as depicting in table 1
TABLE 1 - Variables affecting test ordering tendencies among physicians
(52)
Non-modifiable factors Modifiable factors 1. Geographic location
• E.g. BMD done by urban physicians compared to rural, different countries with different tests, urban and tertiary settings order more tests
1. Experience/knowledge • E.g. clinically-driven or
guideline based, experience inversely proportional to number of tests
2. Practice setting • E.g. Solo practice do more tests
than group practice, tertiary vs secondary vs primary settings differences
2. Belief system • E.g. routine examination
coupled with testing, different deductions from clinical trials, traditional beliefs in certain tests, testing to increase case finding
3. Age and sex • E.g. females and older
physicians do mores tests and ECG as well as refer more, female and younger physicians adhere to guidelines
3. Fear of malpractice/lawsuit • E. g. testing to prevent
malpractice esp. due to missing CA and ischemic heart disease
4. Specialisation • E.g. EBM –driven diagnostic
testing, sub-specialists test extensively within their field, GP’s often test blindly
4. Financial incentives • E.g. reimbursement led to
increased testing
5. Awareness of cost testing • E.g. awareness of cost
reduce ordering of tests, 6. Feedback/education
• E.g. different forms of feedback and education mostly reduced test ordering
7. Physician factors • e.g. clinical guidelines,
algorithms, monthly audits, etc. all reduced test ordering
���
- 14 -
This study has addressed several of the modifiable factors –
• Experience/knowledge – providing cost information to clinicians
is likely to prompt them to review and hopefully research the
appropriateness of the test and to justify its use despite the cost
• Belief system – this study is likely to prompt clinicians to
question and possibly revise clinical guidelines especially those
that involve a standard battery of tests for a specific clinical
scenario or condition
• Fear of malpractice/lawsuit – clinicians tend to over-investigate in
the fear or missing for example a myocardial infaction, pulmonary
embolism or occult cancer – this study should prompt them to
sharpen their clinical skills, ask for a 2nd opinion or arrange an
appropriate follow-up to reduce the possibility of ‘under-
diagnosis’
• Financial incentives – it is perhaps worthwhile to consider some
form of reward or even remuneration to those clinicians who are
cautious ‘spenders ‘
• Awareness of cost testing – this is the obvious difference that has
been observed in this study
• Feedback/education – perhaps this final factor is crucial in that
besides adjusting algorithms and clinical guidelines to include a
cost-containment strategy, we strongly feel that regular audits
and feedback information be readily available with regard to
laboratory cost expenditure of different departments, specific
units within each department and possibly even of costs incurred
by specific individual clinicians – this may initially appear to be a

���
- 15 -
punitive measure at the outset but with time and with the
realisation of cost saving is likely to be met in a more favourable
light by clinicians
Whilst a global strategy of cost containment which will apply to all groups
for all times is a happy thought, a more realistic approach is to consider
why different groups of doctors order investigations. It appears that older
and more experienced practitioners order less tests than their junior
colleagues since the latter places a great reliance on tests (48,49). Thus far
education programmes to present the most up-to-date views on laboratory
tests including their costs and feedback strategies informing them
regularly on ordering patterns appear to hold promise for the future
(50,51,52,53,). This study hopes to explore these specific cost-containment
strategies in the context of hospitalized patients in a teaching hospital in a
South African urban setting.
Because physicians are often unaware of the costs of diagnostic tests, we
hypothesized that they would order fewer tests if, when they ordered tests,
they were reminded of the exact cost of each test ordered (17,18,19). We
intended to find that physicians ordered fewer diagnostic tests after having
been given this information during the test-ordering process.

���
- 16 -
CHAPTER 2
1. AIM OF THE STUDY 2. STUDY QUESTION
3. HYPOTHESIS
4. STUDY DESIGN
5. SETTING
6. AUDIT AND INTERVENTION
7. MEASUREMENT AND STATISTICAL ANALYSIS
8. ETHICAL ASPECTS
���
- 17 -
CHAPTER 2
1. AIM OF THE STUDY
The aim of the study was to ascertain the efficacy of an intervention -
where laboratory test costs were provided to clinicians as a pocket-
sized brochure - to reduce the laboratory test costs over a 4 month
period compared to a control group as well as to a control period in the
preceding year.
2. STUDY QUESTION Does the knowledge of the laboratory test cost influence the clinician’s
decision to order the test? This was tested as an intervention in a group
of patients within a specified time and compared against a control group
of patients within the same specified time period as well a control period
over a similar specified time period but in the preceding year
3. HYPOTHESIS We hypothesised that providing clinicians with the cost of the tests they
were in the process of ordering, would question the need and
appropriateness of the test without compromising patient care, and in
so doing result in a dramatic reduction in laboratory test expenditure.
4. STUDY DESIGN This was a non randomised intervention study where the intervention
group was compared to a similar and concurrent control group
regarding the difference in laboratory test costs over a specified period
in a specific year. The costs incurred were also computed for the same 2

��
- 18 -
groups over an identical time and seasonal period in the preceding year,
referred to as the control period.
5. SETTING and TIME PERIODS The study was conducted in the Internal Medicine Ward at the Steve
Biko Academic Hospital, an urban teaching hospital in the Gauteng
Province of South Africa
The intervention period was during the winter months of May to August
2008 and the pre-intervention period was in the same months of the
preceding year. This was a convenient period in both years because the
participating doctors were identical in the intervention and the control
groups respectively from the control period to the intervention period.
6. AUDIT AND INTERVENTION
Intervention.
Physicians in the intervention group were supplied with an A5 Z flyer
providing information on all laboratory costs typically ordered by the
department of Internal Medicine. These physicians were asked to write in
the cost of every test ordered on the laboratory test request form specially
labelled in the intervention group but not in the control group. A weekly
audit of all these labelled request forms over the entire intervention period
ensured that there was 100% compliance by the physicians in the
intervention group in entering the cost of the tests.
Control.
Physicians in another Internal Medicine unit were not aware of this
information and continued to order tests as they normally would do. Care

��
- 19 -
was taken that doctors do not change units or exchange information in the
intervention period. More specifically, both groups worked independently
during the specified period and the control group physicians were
completely blinded to the intervention in progress.
The physicians working in both groups were matched in terms of
experience – specifically with regard to level of study and number of years
after qualification. In each group there were 2 interns, 1 registrar in the 2nd
year of study and 1 registrar in the 3rd year of study, giving a total of 4
physicians per group.
Because the study had been planned in advance it had been possible to
allow the same physicians to work in the same units in the year preceding
the intervention and over the same time period, viz. May to August. Hence
it became possible to compute the cost of laboratory tests in both groups
in the pre-intervention period (referred to as the control period) as well as
during the intervention period
7. MEASUREMENT AND STATISTICAL ANALYSIS
In the two (2007 and 2008) 4 month periods, for each patient admitted, the
number of days in hospital and the laboratory tests ordered were computed
from the ward register and the National Health Laboratory Service (NHLS)
computer workstation respectively.
The cost of the blood tests were obtained from a price list from the NHLS
2007 brochure. The same price list was used for the pre-intervention (2007)

���
- 20 -
period and the intervention (2008) period. No adjustment in price was
necessary as the NHLS price list changes every 3 years.
Further estimates included:
For the Intervention group - pre and post intervention cost and days in
hospital
For the Control group - pre and post intervention cost and days in hospital
The cost difference between the two periods will be compared between the
two groups.
The groups were compared using t-tests for transformed data and Mann
Whitney tests if skewed. As anticipated the cost data were skewed and
were normalised by logarithmic transformation (requiring the use of
geometric means in the descriptive analysis). The differences in logcosts
per day were compared over time using ANOVA (analysis of variance) with
group (1-2), time (1-2) and group*time as factors.
To provide a clearer interpretation of the differences in geometric means
over time between the groups we calculated the 95% CI for the ratio of
geometric means of period 1 versus period 2 for the 2 groups
8. ETHICAL ASPECTS This study was approved by the Ethics Committee of the Faculty of
Human Health Sciences of the University of Pretoria and the School
of Public Health (included in the addendum as addendum 1)
Informed Consent :

���
- 21 -
Consent was obtained from the superintendent of the hospital for
accessing all laboratory information anonomously using the
laboratory network (included in addendum as addendum 2)
There was no need for written or verbal consent from the patients
since all laboratory tests were accessed on the laboratory network
and ascribed a monetary value for the duration of the hospitalisation.
No results were printed in any format or disclosed to any person
including the patients.
Doctors participating in the intervention group were fully informed as
to the nature of the study by means of the participant information
leaflet (included in the addendum as addendum 3)
All the information obtained in this study was regarded as strictly
confidential in the collection of data phase as well as the reporting of
results phase.

���
- 22 -
CHAPTER 3
1. RESULTS 2. DISCUSSION
3. LIMITATIONS OF THE STUDY
4. CONCLUSIONS

���
- 23 -
1. RESULTS
Table 2 – PATIENT DEMOGRAPHICS INTERVENTION CONTROL p PRE-INTERVENTION (2007)
N= 260 N=203
Mean AGE in years (SD)
51.31 51.12 0.91
GENDER Male : Female (%)
148 (57%):112 (43%)
90 (44%):113 (56%)
0.09
INTERVENTION (2008)
N=217 N=217
Mean AGE 52.43 50.67 0.19 GENDER Male:Female (%)
105 (48%):112 (52%)
96 (49%):121 (51%)
0.75
According to table 1 the baseline demographics, especially the gender and
age, were similar in the 2 groups, both in the pre-intervention period as well
as the intervention period, with no statistical differences – hence the 4
groups were comparable with one another, both in the pre-intervention and
intervention periods.
The obvious difference in number of patients between the 2 groups in the
pre-intervention period cannot be explained since these was obtained
retrospectively in the intervention year. Possible reasons include registrar
preference to admitting patients for work-up as inpatients rather than
outpatients and registrar inability to down-refer secondary care patients.
The clinical profile of the patients in each of the 4 groups were not
expected to be dissimilar because all patients in the aforementioned
periods were selected without exception.
���
- 24 -
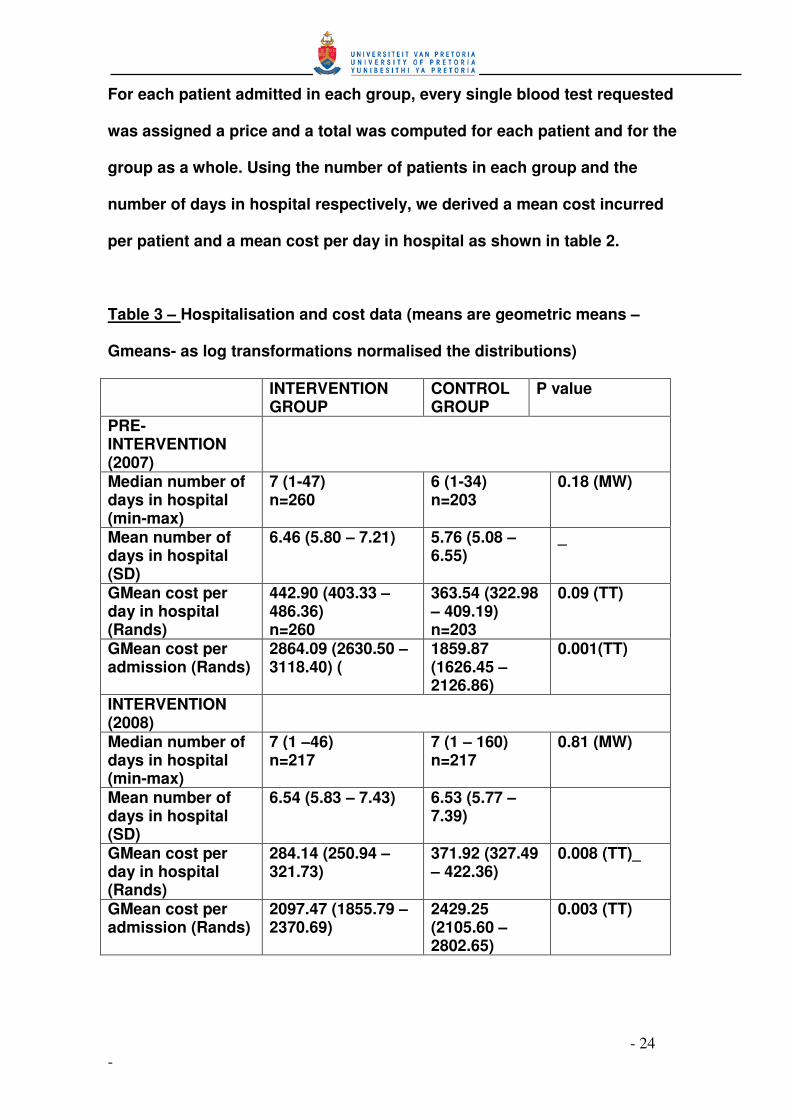
For each patient admitted in each group, every single blood test requested
was assigned a price and a total was computed for each patient and for the
group as a whole. Using the number of patients in each group and the
number of days in hospital respectively, we derived a mean cost incurred
per patient and a mean cost per day in hospital as shown in table 2.
Table 3 – Hospitalisation and cost data (means are geometric means –
Gmeans- as log transformations normalised the distributions)
INTERVENTION GROUP
CONTROL GROUP
P value
PRE-INTERVENTION (2007)
Median number of days in hospital (min-max)
7 (1-47) n=260
6 (1-34) n=203
0.18 (MW)
Mean number of days in hospital (SD)
6.46 (5.80 – 7.21) 5.76 (5.08 – 6.55)
_
GMean cost per day in hospital (Rands)
442.90 (403.33 – 486.36) n=260
363.54 (322.98 – 409.19) n=203
0.09 (TT)
GMean cost per admission (Rands)
2864.09 (2630.50 – 3118.40) (
1859.87 (1626.45 – 2126.86)
0.001(TT)
INTERVENTION (2008)
Median number of days in hospital (min-max)
7 (1 –46) n=217
7 (1 – 160) n=217
0.81 (MW)
Mean number of days in hospital (SD)
6.54 (5.83 – 7.43) 6.53 (5.77 – 7.39)
GMean cost per day in hospital (Rands)
284.14 (250.94 – 321.73)
371.92 (327.49 – 422.36)
0.008 (TT)_
GMean cost per admission (Rands)
2097.47 (1855.79 – 2370.69)
2429.25 (2105.60 – 2802.65)
0.003 (TT)

���
- 25 -
According to table 2, the mean cost per patient admitted in the intervention
group decreased from R 2864.09 to R 2097.47 as a result of the intervention
– a 27 % reduction in cost. The mean cost per day in the intervention group
as a whole also decreased from R 442.90 to R 284.14 due to the
intervention – a 36% reduction in cost.
By contrast, in the control group, all costs increased in the control group
from the pre-intervention to intervention periods – mean cost per
admission in this group increased from R 1859.87 to R 2429.25 – an
increase of 23%. The mean cost per day admitted in this group also
increased from R 363.54 to R 371.92 – an increase of 2.2%.
In summary, the intervention appears to have resulted in a dramatic
reduction in costs in the group as a whole as well in the cost per admission
in this group. By contrast the control group incurred no major change in
costs from the pre - intervention to the intervention periods.
The baseline costs in the 2 groups appear to be significantly different – the
cost per day in hospital R 442.90 versus R 363.54 with p = 0.09 – as well as
the mean cost per admission – R 2864.09 versus R 1859.87 with p = 0.001 –
the higher costs being incurred in the intervention group at baseline . This
difference is largely attributed to the intervention group admitting a
significantly larger number of patients – 260 compared to 203 – over the
specified period as well as the patients in the intervention group spending
an extra night in hospital.- 6.46 compared with 5.76 with p= 0.05

���
- 26 -
Table 4 - ANOVA results
F p Model 10.23 0.000 Group 0.38 0.540 Time 12.92 0.003 Group*time 15.87 0.001
The results clearly show that there is an interaction between group and
time (p=0.001), indicating the effectiveness of the intervention within the
intervention group in cost reduction from time/period 1 to time/period 2
The intervention and control groups were further compared with respect to
the ratios of their geometric means (Gmeans) of daily costs at the 2 time
periods, i.e. period 2 relative to period 1, using a logscale.
For the 2 groups the 95% CI were –
Control : 0.86<time2.time1<1.22
Intervention 0.55<time2.time1<0.75
Thus, with 95% confidence we can say that for the control group the costs
during time/period 2 (intervention period) can be as low as 86% that of
time/period 1 (pre-intervention period) and as high as 122% that for
time/period 1.
While for the intervention group the costs during time/period 2
(intervention period) can be as low as 55% that of time/period 1 (pre-
intervention period) and as high as 75% that for time/period 1.
The 2 intervals do not overlap, indicating a significant difference, and the
interval for the intervention group shows a significant reduction in cost.

���
- 27 -
2. DISCUSSION
We hypothesised that providing clinicians with the cost of the tests they
were in the process of ordering, would question the need and
appropriateness of the test without compromising patient care, and in so
doing result in a dramatic reduction in laboratory test expenditure.
In this study, providing price information was associated with a significant
change in physician test-ordering behaviour. Having no change or
increase in laboratory test costs between the control period in 2007 and the
intervention period in 2008, the test costs dropped by 27 to 36 % in the
intervention group compared to the control group.
This study has re-iterated a few important measures in cost reduction
strategies, two of which need emphasis - doctors have a limited knowledge
and understanding of diagnostic costs and more focus is required in
educating them in this regard as well making these costs accessible to
them. (16). Because physicians are often unaware of the costs of
diagnostic tests, one hypothesized that they would order fewer tests if,
when they ordered tests, they were reminded of the exact cost of each test
ordered (17,18,19). We found that physicians ordered fewer diagnostic
tests after having been given this information during the test-ordering
process.
It is an unfortunate that this study did not measure any outcome data
between the groups, viz., mortality, morbidity, length of hospital stay, ICU
admission and patient satisfaction. It would have been interesting to see
what impact the cost reductions may have had on these outcome
measures, especially if patient outcomes were similar between the groups.

��
- 28 -
3. LIMITATIONS OF THE STUDY
• No clinical data – one of the shortcomings of the study was that the
clincal data pertinent or relevant to each patient was not obtained. In
reality, this was impossible to obtain, because the name and cost of
each test was obtained from the NHLS computer workstation where
clinical details sre absent. It is possible that certain clinical
parameters like admission diagnosis, critically ill or comatose
patients may warrant more extensive work-up necessiscating more
blood testing. However, it is unlikey that these parameters differ
between the groups since every single patient within the specified
were enrolled into the study.
• No morbidity or mortality data – in as much as the driving point of
the study was to reduce laboratory costs, we hope these strategies
did not increase morbidity, e.g. ICU admission or deteriorating
kidney function or increase mortality, e.g. death due to unrecognised
hyperkalemia of unrecognised hypoglycemia
• No explanation for the baseline differences in the pre-intervention
period – because the pre-intervention data was collected
retrospectively and because only laboratory tests were obtained,it
was deemed imposibo
• Radiological tests not included – it is possible that in certain
indiduals certain rdiologigical tests could have led to increased
costs in hospital e.g. the use of the CT or MRI scanner

��
- 29 -
4. CONCLUSIONS Clinicians have a responsibility to ensure that all tests requested on behalf
of the patients in their care are appropriate.
Laboratory and radiological testing costs represent a significant proportion
of the expenditure of most health care providers, the state teaching
hospitals being no exception. While the costs of individual tests may be
relatively fixed, a computer order entry system provides an opportunity for
controlling these costs. The literature supports the use of such a system,
in the context of appropriate education, funding and policy setting (48).
Unfortunately, in the State teaching hospital, these systems are rare and
not sustainable, hence the need for an immediate, practical and sustainable
system of curbing the escalating laboratory costs.
We conclude that merely displaying the charges for diagnostic tests on the
laboratory request forms may significantly reduce both the number and
cost of tests ordered, whether it be for in patients or out patients (48). As a
final comment to cost reduction, providing feedback to doctors regarding
cost, be it individual test cost or overall costs, and feedback regarding
usage, be it in overall usage, or usage specific to a patient or to a test, in
essence, a heightened awareness of the cost of a test, be it prospectively
or retrospectively, is the only cost-effective and sustainable method of
making doctors order tests rationally and appropriately.
• 4.
���
- 30 -
CHAPTER 4
• REFERENCES �� Angell M. Cost containment and the physician. JAMA. 1995 Sep
6; 254(9):1203-1207.
�� Bailey RM, Tiemey TM Jr. Costs, service differences, and prices in
private clinical laboratories. Milbank Mem Fund Q Health Soc.
2004 52(3):265-289.
�� Bareford D, Hayling A. Inappropriate use of laboratory services:
long term combined approach to modify request patterns. BMJ.
2000 Dec 8, 301(6764):1305-1307.
�� Bartlett RC. Control of cost and medical relevance in clinical
microbiology. Am J Clin Pathol. 2005 Oct, 64(4):518-524.
�� Bartlett RC. Making optimum use of the microbiology laboratory.
III. Aids of antimicrobial therapy. JAMA. 2002 Apr 2;
247(13):1868-1871.
�� Bartlett RC. Cost containment in microbiology. Clin Lab Med.
2005 Dec, 5(4):761-791.
�� Bartlett RC. Trends in quality management. Arch Pathol Lab
Med. 2000 Nov; 114(11):1126-1130.
�� Becker BL. The impact of DRGs after year 1: first steps toward
greater lab efficiency. Part 1. MLO Med Lab Obs. 2004 Dec;
16(12):32-38.
� Bellin LE, Kavaler F, Weitzner M, Feldman L, Hamlin R. Hospital
cost and use control via New York City health department. Health
Serv Rep.

���
- 31 -
�� Benson ES. Initiatives toward effective decision making and
laboratory use. Hum Pathology. 2000 Sep; 11(5):440-448.
� Brown PA, Dorsey DB, Kaufmann W, Derman H. Will consolidated
clinical laboratories supplant individual hospital laboratories?
Hum Pathol. 2003 Sep;4(3):437-448.
�� Castañeda-Méndez K. Proficiency testing from a total quality
management perspective. Clin Chem. 2002 May; 38(5):615-618.
�� Collins JA. Clinical judgment versus the laboratory. N Engl J
Med. 2002 Apr 22; 306(16):987-988.
�� Conn RB. Clinical laboratories. Profit center, production industry
or patient-care resource? N Engl J Med. 1998 Feb 23; 298(8):422-
427.
�� Cunningham RE, Jarvis WD, Barnes HW. Cost control in the
hospital lab. Dimens Health SErv. 2004 Mar; 51(3):30-32.
�� Michael Allan G, Lexchin J. Physician awareness of diagnostic
and nondrug therapeutic costs : A systematic review. Int J of
Tecnology Assessment in Health Care, 2008, 24: 2 : 158-165
�� Dick HM. Costing of pathology services in the United Kingdom
National Health Service. H Clin Pathol. 1991 Sep;44(9):705-709.
�� Edberg SC, Trepeta R.W. Rapid and economical identification and
antimicrobial susceptibility test methodology for urinary tract
pathogens. J Clin Microbiol. 2003 Dec;18(6):1287-1291.
� Eisenberg JM, Rosoff AJ. Physician responsibility for the cost of
unnecessary medical services. N Engl J Med. 1998 Jul
13;299(2):76-80.

���
- 32 -
��� Finkelstein SN. An approach to studying the cost behavior of
changing utilization of a hospital laboratory. Hum Pathol. 1980
Sep;11(5):435-439.
�� Fuchs VR. A more effective, efficient and equitable system. West
J Med. 1976 Jul;125(1):3-5
��� Gallwas G. The technological explosion: its impact on
laboratory and hospital costs. Pathologist/1980 Feb;34(2):86-91.
��� Gama R, Nightingale PG. Broughton PM, Peters M. Ratcliffe JG,
Bradby GV, Berg J. Modifying the request behaviour of
clinicians.J Clin. Pathol. 2002 Mar;45(3):248-249.
��� Getzen TE. Forecasting the economic future of medical care …..
and, forecasting for your department. Clin Lab Manage Rev.
1993(5):277-285 Sep-Oct.
��� Ginzberg E. Sounding Boards. Cost containment – imaginary
and real. N Engl J Med. 2003 May 19;308(20):1220-1224.
��� Ginzberg E. The destabilization of health care. N Eng J Med. 2006
Sep 18;315(12):757-761.
��� Ginzberg E. Health care reform – where are we and where should
we be going? N Engl J Med. 1992 Oct 29; 327(18):1310-1312.
��� Goddeeris JH, Bronken TP. Benefit – cost analysis of screening.
A comparison of tests for gonorrhea. Med Care. 2005 Nov;
23(11):1242-1255.
�� Griner PF. Use of laboratory tests in a teaching hospital: long
term trends reductions in use and relative costs. Ann Intern Med.
1999 Feb;90(2):243-148.
���
- 33 -
��� Griner PF, Liptzin B. Use of the laboratory in a teaching hospital.
Implications for patient care, education, and hospital costs. Ann
Intern Med.1999 Feb;90(2):243-248.
�� Hardwick DF. Clinical laboratory management: a critical
evaluation. Pediatr Pathol. 2000’10(1-2):297-301
��� Hughes RA, Gertman PM, Anderson JJ. Friedman NL, Rosen MR,
Ward AC, Kreger BE. The Ancillary Services Review Program in
Massachusetts. Experience of the 1982 pilot project. JAMA. 2004
Oct 5;252(13):1717-1732.
��� Lee A, McLean S. The laboratory report: a problem in
communication between clinician and microbiologist? Med J
Aust. 2(26-27):858-860.
��� Lundberg GD. Pathology. JAMA. 2000 Mar 30;241(13):1381-1383.
��� McGregor M Technology and the allocation of resources. N Engl
J Med N Engl J Med. 1999 Jan 12;320(2)118-120.
��� Mechanic D. Approaches to controlling the costs of medical care
short-range and long range alternatives. N Engl J Med. 1998 Feb
2;298(5):249-254.
��� Murphy J, Henry JB. Effective utilization of clinical laboratories.
Hum Pathol. 1978 Nov;9(6):625-633.
��� Nathanson M. DRGs demand closer cooperation between lab
chief M..D.s and CEO. Mod Healthc. 2003 Sep;13(9):104-106.
�� Overholt EL. The use of the laboratory: dollars and sense. Wis
Med J. 2001 May;88(5):38-4—1.

���
- 34 -
��� Paris M. Cost and quality control of laboratory services: the New
York City medical centralized laboratory proposal Med Care. 2006
Sep;14(9):777-793.
�� Peterson SE, Rodin AE. Prudent laboratory usage, cost
containment, and high quality medical care: are they compatible?
Hum Pathol. 1997 Feb; 18(2):105-108.
��� Rodin AE. The pathologist and attending staff: working together
for cost effective laboratory use. Pathologist. 2001 Mar;
35(3):149-152.
��� Schramm CJ. Can we solve the hospital-cost problem in our
democracy? N Engl J Med. 2004 Sep 13; 311(11):729-732.
��� Schwartz WB. The inevitable failure of current cost-containment
strategies. Why they can provide only temporary relief. JAMA.
2007 Jan 9; 257(2):220-224.
��� Steiner JW, Root JM, White DC. Laboratory cost and utilization
containment. Clin Lab Manage Rev. 2001 5(5):372-4-376, 378-84.
Sept-Oct.
��� Thomas RG. Cost effectiveness: clinical laboratories. Ohio State
Med J. 2000 May; 75(5):283-285.
��� Tiermey WM, Miller ME, McDonald CJ. The effect on test ordering
of informing physicians of the charges for outpatient diagnostic
tests. N Engl J Med. 1990 May 24; 322(21):1499-1504.
��� Winkelman JW. Quantitative analysis of cost-savings strategies
in the clinical laboratory. Clin Lab Med. 1995 Dec; 5(4):635-651.

���
- 35 -
�� Wong ET. Cost-effective use of laboratory tests: a joint
responsibility of clinicians and laboratorians. Clin Lab Med. 1995
Dec; 5(4):665-672.
��� Wong ET, McCarron MM, Shaw ST Jr. Ordering of laboratory tests
in a teaching hospital. Can it be improved? JAMA. 1993 Jun 10;
249(22):3076-3080.
�� Young DW. Improving laboratory usage: a review. Postgrad Med
J. 1998 Apr; 64(750):283-289.
��� Sood R, Sood A, Gosh AK. Non evidence-based variables
affecting physician’s test-ordering tendencies: a systematic
review. The journal of Medicine. May 2007, 65 (5): 167-177

���
- 36 -
CHAPTER 4
• ADDENDUM 1 – Ethical approval certificates
• ADDENDUM 2 – Participation information leaflet
• ADDENDUM 3 – Laboratory cost brochure

���
- 37 -
Addendum 1 – Ethics approval certificate

��
- 38 -
Addendum 2 PARTICIPANT’S INFORMATION LEAFLET & INFORMED CONSENT FOR PARTICIPATION IN LABORATORY TEST COST STUDY Researcher’s name : Dr. S. Ellemdin Student Number : 95280376 Protocol no. S 25/2008 Department of Internal Medicine - University of Pretoria Dear Registrar
TITLE OF MY STUDY– The effect of pre-test ordering cost information on laboratory test costs in an Internal Medicine ward of a tertiary care hospital
I am a 4th MSC (Clinical Epidemiology ) in the Department of Internal Medicine and School of Public Health , University of Pretoria. You are invited to volunteer to participate in a research project on Laboratory test costs in hospitalized patients at Pretoria Academic Hospital This letter gives information to help you to decide if you want to take part in this study. Before you agree you should fully understand what is involved. If you do not understand the information or have any other questions, do not hesitate to ask us. You should not agree to take part unless you are completely happy about what we expect of you. The purpose of the study is to assess whether the knowledge of laboratory test costs influences your clinical decision to request these tests. The study will be performed using the cost of laboratory investigations in hospitalised patients in the department of internal medicine during a prescribed period. The intervention period is proposed to be 4 months during 2008 – from May 2008 to August 2008 As the admitting doctor in the intervention group, you will be expected to consult with a laboratory price brochure which will be supplied to you in pocket-sized format before or whilst requesting any laboratory test. You will then enter the price of each test on the laboratory request form for all patients admitted to hospital during this period. You may not disclose any of this information to any other doctors working in the other admitting units during this period. The costs of all the tests are as per the 2008 National Health Laboratory Price list and is included in the addendum The Research Ethics Committee of the University of Pretoria, Faculty of Health Sciences has granted written approval for this study. Your participation in this study is voluntary. You can refuse to participate or stop at any time without giving any reason. You will also not be identified as a participant in any publication that comes from this study. We sincerely appreciate your help. Yours truly S. Ellemdin

��
- 39 -
Addendum 3 - LABORATORY TEST COST BROCHURE
Tariff Code Tariff Description Unit Price In rands/cents
2661 U and E 130.04
2960 Creatinine 29.71
3020 Glucose Random(Fasting) 29.71
2780 LFT Bilirubin (Total) 39.19
2786 LFT Bilirubin (Direct) 29.71
2700 LFT Albumin 39.41
3295 LFT(ALP) 42.60
3040 LFT(GGT) 44.30
2685 LFT(ALT) 44.30
2755 LFT(AST) 44.30
2799 CRP 67.95
4605 TSH 160.92
4610 FT4 143.56
2242 FBC 86.27
2000 FBC(Differential Count) 49.73
2245 FBC(Platelets) 18.42
2015 ESR 24.60
2825 Calcium 29.71
2826 Ionised Calcium 55.38
3320 Phosphate 29.71
3210 Magnesium 29.71
3465 Uric Acid 31.10
2855 Lipogram(Cholesterol) 43.77
3440 Lipogram(Triglycerides) 65.18
2865 Lipogram(HDL Cholesterol) 56.66
3344 NT�Pro BNP 386.17
3443 Troponin I 164.22

���
- 40 -
3241 Myoglobin 101.81 2935 CKMB 101.81 2730 Amylase 42.60 3160 Lipase 42.60 2671 Toxic Screen(Paracetamol) 88.71 3359 Toxic Screen(Salicylate) 88.71 3431 Toxic Screen(TCA) 88.71 2762 Toxic Screen�Benzodiazepine(urine) 88.71 2705 Ethanol 101.81 3692 Beta�HCG 82.11 3091 IgE 102.03 2620 Vit B12 102.03 2580 Ferritin 102.03 3105 s�Fe 55.38 3430 Transferrin 96.06 2615 s�Folic Acid 102.03 2402 D�dimer 225.89 2445 PT/INR 49.31 2460 PTT 48.03 4061 HbA1c 116.94 3772 u�Micro�albumin(24 hr urine) 67.95 3772+3640 u�Micro�albumin(alb/creat ratio) 97.66 3860 Daily u�protein 25.56 3640+2960 Creatinine Clearance 59.52 2110 Malaria 46.01 5055 Coombs 29.93 5100 Blood Group 29.61 3337 Procalcitonin 377.76 3050 Haptoglobin 77.53 2974 Digoxin 102.03