the effects of price regulation on productivity in pharmaceuticals
TRANSCRIPT

This PDF is a selection from an out-of-print volume from the National Bureauof Economic Research
Volume Title: International and Interarea Comparisons of Income, Output,and Prices
Volume Author/Editor: Alan Heston and Robert E. Lipsey, editors
Volume Publisher: University of Chicago Press
Volume ISBN: 0-226-33110-5
Volume URL: http://www.nber.org/books/hest99-1
Publication Date: January 1999
Chapter Title: The Effects of Price Regulation on Productivity in Pharmaceuticals
Chapter Author: Patricia M. Danzon, Allison Percy
Chapter URL: http://www.nber.org/chapters/c8397
Chapter pages in book: (p. 371 - 418)

13 The Effects of Price Regulation on Productivity in Pharmaceuticals Patricia M. Danzon and Allison Percy
The purpose of this paper is to measure productivity growth over time and to compare productivity levels cross-nationally for the pharmaceutical industry in four major European markets and the United States. The pharmaceutical industry raises interesting issues for productivity measurement. The product mix includes thousands of different compounds, and the range available differs significantly across countries and over time. Research and development (R&D) is a very important input and determinant of productivity; however, the stock of R&D capital cannot be measured accurately because of inadequate data, long and variable lags between investments and product launch, and interna- tional spillovers. The high rate of technological change leads to potential bias in measuring price change. For example, Berndt, Griliches, and Rosett (1993) and Berndt and Greenberg (1996) show that the U.S. PPI for drugs has been seriously upwardly biased owing to delay in incorporating new drugs; Gril- iches and Cockburn (1996) illustrate the bias from treating generics as new drugs rather than as new forms of old drugs.
Measurement of price change and real productivity growth is complicated in many European countries by the fact that drug prices are regulated, either directly (France and Italy) or indirectly (the United Kingdom). Consequently, trends in drug prices over time deviate significantly from economywide price inflation, and these trends differ across countries (Danzon and Kim 1996).
Patricia M. Danzon is the Celia Moh Professor of Health Care Systems, Insurance, and Risk Management at the Wharton School of the University of Pennsylvania. She is associate editor of the Journal of Health Economics and the Journal of Risk and Insurance. Allison Percy is a Ph.D. candidate in the Health Care Systems Department of the Wharton School of the University of Pennsylvania. Her research interests include health insurance community rating laws, international health policy comparisons, and social insurance issues.
This research was supported by a grant from the Chair in Health Economics at the Institut #Etudes Politiques de Paris. The authors thank Ernst Berndt, Robert Lipsey, Jean Jacques Rosa, and participants at two NBER workshops for very helpful comments.
371

372 Patricia M. Danzon and Allison Percy
Regulation, nontariff barriers to trade, and other factors induce significant prices differences for the same drugs across countries, after conversion at ei- ther exchange rates or GDP purchasing power parities (PPPs). This paper dem- onstrates the sensitivity of estimates of country-specific productivity growth to the price indexes used to deflate nominal expenditure data. Similarly, the adjustment for cross-national price differences affects the estimates of cross- national productivity differences.
A second purpose of this paper is to show the effects of price regulation on input use and productivity and the implications of such regulation-induced distortions on the estimation of productivity growth. The price regulatory schemes in several European countries are designed to promote domestic em- ployment and investment in addition to their primary purpose of controlling drug expenditures.' For example, France and Italy grant higher prices for prod- ucts that are produced locally. The United Kingdom regulates the rate of return on capital invested in the United Kingdom, and the allowed rate of return for a firm depends on its contribution to the U.K. economy. Regulation that grants higher prices for use of certain inputs tends to distort resource allocation (Av- erch and Johnson 1962), leading to excessive costs and suboptimal productiv- ity. We show that, with input-distorting regulation, factor shares are biased proxies for output elasticities in measuring growth in multifactor productivity.
Our empirical analysis uses data for the pharmaceutical industry from the OECD Structural Analysis (STAN) database, for France, Germany, the United Kingdom, Italy, and the United States for the period 1970-90.* In order to distinguish the effects of regulation from other factors that may contribute to cross-national productivity differences, we compare pharmaceuticals to other industries (chemicals and total manufacturing) that are not subject to the same regulatory constraints. We report country-specific estimates of productivity growth using three country-specific price indexes: the GDP deflator, the offi- cial pharmaceutical PPI, and a Divisia price index constructed from IMS data (Danzon and Kim 1996)' For cross-national comparison of productivity lev- els, we report results both with GDP PPPs and with a drugs-specific Fisher price index (Danzon and Kim 1998) that is based on prices for all matching drugs in the countries under comparison.
The findings demonstrate that estimates of country-specific productivity growth and cross-national comparisons are very sensitive to the price indexes used and that none is perfect. At minimum, these findings confirm the impor- tance of using industry-specific price indexes for productivity measurement in an industry that is subject to heavy price regulation, such as pharmaceuticals.
1. The transparency rules of the European Union in principle constrain regulatory bias toward local firms, but, in practice, price setting for medical services has remained an area of national dis- cretion.
2. Germany in this paper refers to the former Federal Republic of Germany. 3. IMS International is a market research firm that collects data on pharmaceutical sales.

373 Price Regulation and Productivity in Pharmaceuticals
With these caveats, the empirical results are generally consistent with the hy- pothesized effect, that biased price regulation has increased input use and re- duced productivity in France. For the United Kingdom, pharmaceutical pro- ductivity is high, relative to other U.K. manufacturing and relative to other European pharmaceutical industries, despite the United Kingdom’s biased reg- ulatory system.
Note that the productivity measures analyzed here are GDP-based measures of value added for all firms operating in each country, including local subsidi- aries of multinational firms, since this corresponds to the scope of regulation. These GDP-based measures do not reflect productivity in the discovery of in- novative new drugs. Innovation in R&D is a critical component of the overall productivity of a particular country’s pharmaceutical industry but is beyond the scope of this paper.4 However, our results suggest that both the level and the returns to unobserved R&D capital are lower in France than in the United States and the United Kingdom. This is generally consistent with other evi- dence, that France has lagged the United States and the United Kingdom in pharmaceutical innovation (Barral 1995).
In this paper, section 13.1 briefly describes the regulatory regimes and their expected effects. Section 13.2 discusses measurement issues in cross-national comparisons of productivity for pharmaceuticals. Section 13.3 describes the data and methods used in this study. Section 13.4 compares within-country growth rates and cross-national levels of productivity for pharmaceuticals, compared to other manufacturing. Section 13.5 reports estimates of total factor productivity growth. Section 13.6 concludes.
13.1 Forms of Price Regulation and Previous Literature
We selected France, Italy, and the United Kingdom as examples of countries with biased regulation. Germany and the United States provide a benchmark of productivity in countries where price constraints are neutral with respect to location of production. The four European countries have similar populations and similar opportunities for export within the European Union (EU). Al- though the U.S. market is much larger than the domestic market of any single European country, the total EU market represents larger total sales volume than the U.S. market. Thus, opportunities to exploit economies of scale should be similar, absent regulatory inducements for domestic production and/or barriers to exports.
4. Comanor (1965) and Cocks (1973, 1981) analyze productivity in R&D, focusing on effects of safety and efficacy regulation (see also Peltzman 1973; and Thomas 1990, 1992, 1996). Hancher (1990) describes the regulatory systems in France and the United Kingdom.

374 Patricia M. Danzon and Allison Percy
13.1.1 Forms of Price Regulation
Biased Price Regulation: France and Italy
France and Italy regulate the manufacturer’s price as a condition of reim- bursement by the social insurance program. The criteria used for setting prices have included costs, therapeutic merit, and international comparisons. Con- tribution to the local economy is widely acknowledged to be a bargaining strategy for a higher price, notwithstanding the Treaty of Rome and other non- discrimination provisions of the European Union (see, e.g., Burstall 1991; Burstall and Reuben 1988).
Price regulation that favors domestic production is more likely to be a bind- ing constraint on multinational firms than on domestic firms that would volun- tarily locate a larger fraction of their operations in the home country. Domestic firms are therefore predicted to command a larger market share in countries with biased price regulation, other things equal.
Rate-of-Return Regulation: The United Kingdom
The U.K. pharmaceutical price regulation system (PPRS) regulates the rate of return on capital by comparing net revenues generated from sales to the National Health Service (NHS) to capital that contributes to sales to the NHS. Within this constraint, manufacturers can set prices freely for individual new products. Prices of generics are regulated. Simple rate-of-return regulation is predicted to induce substitution of capital for labor (Averch and Johnson 1962). However, this tendency is mitigated because the permitted return that each firm negotiates with the PPRS depends, within the range of 17-21 percent, on such factors as number of jobs created, innovation, and other contributions to the U.K. economy.
In general, the U.K. system favors domestic firms that would in any case locate corporate headquarters, R&D, and other overhead capital in the United Kingdom. The PPRS may also create incentives for multinationals to shift facilities to the United Kingdom from other countries if the permitted return is increasing in exports or if joint costs can be allocated to the U.K. rate base.
Reference Price Reimbursement: Germany
Prior to 1989, Germany permitted free pricing of drugs. Political concern over the level and growth of drug expenditures led manufacturers to adopt a voluntary price freeze from 1984 to 1989. In 1989, the government introduced a reference price system of reimbursement, focused initially on off-patent drugs.5 Although this system constrains prices for relatively high-priced (usu- ally originator) drugs, it is formally neutral with respect to input mix and loca-
5. Products are grouped on the basis of similarity of therapeutic effect, and all products in a group are reimbursed at a common reference price. The patient must pay any excess of the manu- facturer’s price over the reference price. In practice, most manufacturers have dropped their prices to the reference price level (Remit 1991; Danzon and Liu 1996).

375 Price Regulation and Productivity in Pharmaceuticals
tion of production, except that it indirectly favors low-priced drugs, which are typically generics produced by local firms. Since this system was phased in gradually starting in September 1989, our data are too early to show full ef- fects. Our data also do not show the effects of the much more stringent controls adopted in 1993.6
“Free” Pricing: The United States
Pharmaceutical firms may set prices freely in the United States, subject to market constraints. Since the late 1980s, managed care has expanded rapidly to pharmacy benefits, through health maintenance organizations (HMOs) and pharmacy benefit management companies (PBMs) that manage drug benefits for indemnity plans. Pharmacy benefit management has accelerated the growth in generic market share and led brand manufacturers to discount their drugs to managed care purchasers. Since 1990, Medicaid and other public programs demand similar discounts. These initiatives are neutral with respect to manu- facturer or country of origin, except to the extent that they favor generics, which are usually locally produced.
One potential distortion in the United States is the possessions tax credit, which reduces corporate tax rates based on employment and income generated in Puerto Rico.’ To show the effects of this tax incentive, we report results with and without Puerto Rico for the years with available data.
13.1.2 Previous Literature
Most previous cross-national comparisons of productivity are at the one- or two-digit SIC level (e.g., van Ark and Pilat 1993). The Bureau of Labor Statis- tics (BLS) publishes international comparisons of growth rates for two-digit industries but does not compare productivity levels. Since pharmaceuticals are a small fraction of chemicals and allied products (SIC 28), these analyses shed little light on pharmaceuticals. Cocks (1974, 1981) provides detailed estimates of total factor productivity growth for a single firm in the United States.
The only existing international comparison of productivity in pharmaceuti- cals is Burstall and Reuben’s (1988) study of potential savings from plant con- solidation in the European Community. Using industry interviews and OECD data for 1985, Burstall and Reuben conclude that scale economies in primary production (active ingredients) had already been realized since most multi- national firms operate primary plants in only one or two locations. However, secondary production (processing and packaging) was extremely decentral-
6. The 1993 controls included a price cut and a global limit on drug expenditures, with physi- cians at risk for exceeding the drug budget. This led to significant volume reduction and substitu- tion toward cheaper drugs (Danzon and Liu 1996).
7. Section 936 of the Internal Revenue Code, enacted in 1976, provides a tax credit equal to the federal tax liability on certain income earned in Puerto Rico. This was modified in 1982. The tax credit affects incentives to locate primary production of active ingredients in herto Rico since the value of R&D is realized as the value added to the raw ingredients. The mix of labor and capital within the production process should be unaffected.

376 Patricia M. Danzon and Allison Percy
ized, with many plants operating below capacity. Industry interviews attributed this in part to government pressure. Burstall and Reuben estimated that half to two-thirds of these plants could be closed.8 Their cross-national productivity comparisons are based on GDP PPPs. Thus, the question remains how much of any apparent cross-national differences in productivity in fact simply reflect price differences. Their study also did not attempt to model or estimate the effects of regulation on country-specific productivity growth.
13.2 Theory and Measurement Issues with Biased Regulation
13.2.1 Incentive Effects of Biased Regulation
Biased regulation that grants higher output prices as a reward for local pro- duction creates incentives for the pharmaceutical firm to deviate from cost- minimizing input levels. Consider a firm that produces output Q with two vari- able inputs, labor L and capital K, and a technology-related fixed input M , subject to the production function Q(L, K, M) and constant factor prices, w, and wK. With biased regulation, output price P(L, K ; M) is increasing in domes- tic employment of L and K with Px, > 0, PX,,,, 5 0, X , = L, K . For simplicity, assume that Q is independent of P.9 The firm selects L and K to maximize profits R:
(1) R = P(L , K ; M)Q(L, K ; M ) - W, - w,.
Taking first-order conditions for an interior maximum, and rearranging,
(2) PdQldX, = W, - dP/dX,Q, X , = L, K .
Equation (2) differs from the standard first-order condition owing to the last term, which reflects the distorting effect of biased regulation. Thus, employ- ment is expanded beyond the cost-minimizing level; this increase is greater the more responsive is the regulated price to increases in local employment or investment.
In a global context with trade, the net effect of regulatory bias depends on the costs to multinational corporations of shifting operations between coun- tries. If multinationals can costlessly shift production from countries with neu- tral or no regulation to countries with biased regulation that favors domestic production, the location of production is affected, but productivity and costs
8. Burstall and Reuben estimated the potential savings at only 3.5-4.5 percent of the total labor force. They concluded that value added per employee was relatively high in pharmaceuticals com- pared to manufacturing as a whole in France, contrary to the conclusions reached here.
9. This may be a reasonable assumption for the countries with price regulation for the period under study. Patient cost sharing was minimal in France and Italy owing to exemptions and supple- mentary insurance. In the United Kingdom, roughly 80 percent of scripts are exempt from cost sharing; for the remaining patients, cost sharing is a fixed amount per script, independent of the price of the drug.

377 Price Regulation and Productivity in Pharmaceuticals
would be unaffected. Capital investment, employment, and exports would in- crease in countries with biased price regulation, with an offsetting decrease in neutral countries.I0
However, if shifting production between countries is costly, for example, owing to nontariff barriers to trade" or regulatory demands in multiple coun- tries, then the profit-maximizing strategy subject to regulation may be to oper- ate an excessive number of plants at suboptimal scale or suboptimal capacity utilization. The effect on capitamabor ratios depends on the costs and political returns to increasing capital and labor, respectively. Even if capitalflabor ratios are unaffected, both labor productivity and multifactor productivity are pre- dicted to be lower if biased regulation induces the firm to forgo economies of scale or scope.
13.2.2 Productivity Measurement
Consider the simple production relation
(3)
where Q is real output, Xis a vector of real input flows, including labor, capital, energy, etc., t indicates time period, and A is an index of multifactor productiv- ity that reflects technology, unmeasured management skill, organization, and other factors. Productivity growth can be estimated from the dynamic version of equation (3). Under assumptions of perfect competition in output and input markets, Hicks neutral technical change, and constant returns to scale, the growth in multifactor productivity (MFP) is equal to the difference between the growth in output and the growth in the weighted sum of inputs:
(4) A = Q - c g , x t ,
where g, = d In Q/d In Xt is the output elasticity of input i, and . denotes the percentage time derivative of a variable. To obtain empirical estimates of out- put elasticities g,, a common assumption is that firms are in competitive, long- run equilibrium. The first-order conditions for profit maximization imply
( 5 ) dQldX, = Y I P ,
where wz is the price of the ith input, and P is the final output price. Substituting in (4), MFP is estimated as the residual:
10. In practice, until recently most trade has been in active ingredients, whereas each country's processing and packaging was done locally. This suggests greater economies of scale in primary production of active ingredients, which partly reflects the costs of compliance with environmental and safety requirements.
11. During the period analyzed here, each country retained a separate system of market approval for prescription drugs. Although the European Union has explicitly authorized so-called parallel importing of approved drugs and this does increasingly constrain price differences within the Eu- ropean Union, nontariff barriers to imports have been significant until recently.

378 Patricia M. Danzon and Allison Percy
(4’) A = Q - z s ix , , where the observable factor revenue share si = wiXi/PQ is used as a proxy for the unobserved output elasticity gi for factor i . In long-run equilibrium with perfect competition and constant returns to scale, Csi = 1. This implies that unobservable service flows from quasi-fixed inputs are proportional to-and hence can be measured by-observable stocks, and one unobservable factor share can be estimated as a residual.
The measure of MFP obtained using factor share approximations for output elasticities is inaccurate if firms are not in long-run, cost-minimizing equilib- rium (Berndt and Fuss 1986)12 or if firms have market power such that prices exceed marginal cost (Hall 1988, 1990). For pharmaceutical firms, the latter condition almost certainly applies: pricing at short-run marginal cost would not pay a normal return on sunk investments in R&D and so cannot be a sus- tainable equilibrium.
Biased regulation is an additional reason why observed factor shares provide a potentially biased measure of output elasticities in the pharmaceutical indus- try. To illustrate, write equation (2) in elasticity form:
or
(2”)
From equation (29, the measured factor share is equal to the output elasticity plus the elasticity of the regulated price with respect to input levels. Thus, the assumption commonly used in productivity measurement, that factor shares serve as a proxy for output elasticities, does not hold under biased regulation.
In addition, the existence of unobserved sunk investments in R&D capital, M, leads to bias in the standard procedure of estimating the share of physical capital as the residual, after subtracting the share of measured inputs. Assume that investments in M are committed before the regulatory regime is known and that variable inputs are adjusted to the regulatory regime, as in equation (2). Define the ex ante expected shadow user cost of M as
Z : = P*Q,(L*, K ” ) ,
where * denotes expected, optimized values in the absence of regulation. The ex post realized shadow user cost of M depends on politically constrained prices and variable factor inputs:
(7) Z, = P(L , K ; M)Q,(L, K ; M ) .
12. Under nonconstant returns to scale, long-run equilibrium is defined as output at the point of tangency between the SRAC and the LRAC curves.

379 Price Regulation and Productivity in Pharmaceuticals
By definition, the ex post factor shares, including the ex post return to the quasi- fixed factor, sum to one:
(8) s, + SK + s, = 1
or
(8') 1 - s, = SK + s,.
Thus, if the unobserved share of physical capital is estimated as the comple- ment of the labor share 1 - s,, the resulting estimate iK is upwardly biased for the true value sK; the upward bias is greater the greater the unobserved invest- ment in M and the greater its ex post return, 2,. However, this upward bias in iK is partially offset if the elasticity of regulated price with respect to labor is positive:
(9) .?, = S, + S, = 1 - i, = 1 - EQL - EpL.
From equations (8) and (2"):
(10) s, = 1 - ( S L + s,),
Thus, the more elastic is the regulated price with respect to variable inputs, EP,,,, the lower will be the observed ex post return to the quasi-fixed factor. Of course, investments in fixed factors will not be made in the long run if realized returns are systematically below expected returns. But products that are devel- oped by innovative pharmaceutical R&D are diffused worldwide; hence, the incentives for R&D depend on global revenues. The returns to unobserved in- tangible capital can thus differ significantly across countries. In particular, a country that is small relative to the global market can pay a less than competi- tive or even zero return 2, on the global R&D of multinational companies without affecting the supply of drugs, as long as it pays prices sufficient to cover its country-specific marginal costs.
13.3 Data and Methodology
13.3.1 Data
The data on outputs and input levels used here are from the OECD Structural Analysis (STAN) database (1994), described in appendix A, which also lists other sources. The STAN data are generally national accounts compatible. Where national accounts data were not available, STAN substitutes survey- based data. Since definitions for these survey data are not necessarily national accounts compatible, consistency across countries is not assured; however,

380 Patricia M. Danzon and Allison Percy
within-country trends should be con~istent.'~ We report within-country trends over time and cross-national comparisons of input levels and productivity. The cross-national comparisons should provide the best tests of the hypothesized effects of regulation. In addition, under the plausible assumption that regula- tion has become more stringent over the period studied, particularly in France and the United Kingdom, the differences in trends across countries may also provide evidence on the effects of regulation, assuming other factors un- changed.
The measure of productivity in this database is value added, defined as gross output minus the cost of materials, energy, supplies, and some contract work. Labor is reported as number of employees, unadjusted for hours worked, skill, age distribution, etc. The measure of capital is gross fixed capital formation. We apply a perpetual inventory calculation to estimate the stock of capital and assume that the flow of capital services is proportional to the stock.I4 Other inputs, such as contracted business services, advertising, licensing and royalty fees, etc., are reflected in value added. These data thus do not permit a gross production approach to productivity measurement. The potential bias from not netting out these intermediate inputs should not be great if they are competi- tively supplied. Data sources and definitions are described in more detail in appendixes A and B.
13.3.2 Data Limitations
Ideally, productivity measurement and comparison across countries would be based on a homogeneous set of products, with product-specific price in- dexes and quality-adjusted measures of all inputs. In that case, cross-national productivity differences for pharmaceuticals, relative to other manufacturing, would provide a pure measure of the effects of pharmaceutical regulation, after controlling for other country-specific factors that affect all industries in a coun- try, such as management skills.
The available data on outputs, prices, and inputs deviate from these ideal conditions in ways that may influence the productivity estimates. This section outlines the main data limitations that should be borne in mind in interpreting the empirical findings.
13. For the United States, STAN reports the aggregate of SICS 2833-2836. Of these, pharma- ceutical preparations account for 82 percent of total value of shipments. The remainder includes medicinals and botanicals, diagnostic substances, and biological products (1987 Census of Manu- facturing, ind. ser. table la-1).
14. The capital stock in year r is estimated as K, = (1 - d)K,_, + /, and K , = (l/d)/l+3, where is the mean of gross investment in the first three years with reported data. The results reported
here assume a uniform ten-year life of capital. We also made estimates based on the country- specific depreciation rates for equipment and structures reported in Bemdt and Hesse (1986), as- suming a weight of 0.66 for equipment and 0.37 for structures. For SIC 2383, depreciation charges were 7.8 percent of gross book value of depreciable assets in 1987 (Census of Manufacturing, table 3b), which implies a 12.8-year life of capital in steady state. Cocks (1974) assumes a fifteen- year life for equipment.

381 Price Regulation and Productivity in Pharmaceuticals
Heterogeneous Product Mix
Pharmaceutical markets in all countries comprise thousands of compounds, ranging from some truly global products, which are marketed in all major mar- kets of the world, to purely local products that are marketed in only one coun- try. Each product is available in a range of dosage forms, strengths, and pack sizes that change over time and differ across countries. The extent of global diffusion of a drug is a commonly used measure of its therapeutic value (e.g., Barral 1995) because manufacturers have incentives to launch a drug in any country where it could pass regulatory requirements for safety and efficacy and generate revenues sufficient to cover the country-specific marginal costs.
In 1992, products that were marketed in seven major markets of the world accounted for over two-thirds of sales in the United States, the United King- dom, and Canada but less than 50 percent of sales in France, Germany, Italy, and Japan.15 The diffusion of global products, either through outlicensing to local firms or direct marketing through multinational subsidiaries, implies common technologies across markets at least for those products. However, be- cause the key technologies of pharmaceuticals are product specific and are protected by patents, technology does not diffuse throughout the industry un- til patent expiration. Thus, cross-country differences in product mix in phar- maceuticals are likely to imply cross-national differences in available technol- ogy. These differences are likely to be greater the greater the share of local products.
Local products include herbal, homeopathic, and other medicines that typi- cally have less research content than global products. These local products complicate productivity measurement in part because differences in research content and production technologies may imply differences in true productiv- ity and in price-marginal cost margins. In addition, regulation-induced ineffi- ciencies may be different for local products that are produced by domestic firms than for global products produced by multinationals. Estimates of the effects of regulation may therefore be influenced by the market share of local products. Third, since local products are necessarily omitted from cross- national price indexes, these indexes yield a biased measure of overall relative price levels if regulation is more stringently applied to global than to local products. l6
Countries also differ in the market share of generic versions of originator products and in the share of over-the-counter (OTC) versus prescription-bound (Rx) sales. The available data include all pharmaceutical products, including originator, generics, Rx, and OTC products; thus, separate estimates based solely on global products cannot be made. The markup of price over short-run
15. The market share of local products reflects insurance coverage and medical norms as well
16. Systematic bias is plausible, even aside from regulatory favoring of local companies, if as regulatory requirements for proof of efficacy.
regulation focuses on high-priced products and global products have relatively high prices.
I
382 Patricia M. Danzon and Allison Percy
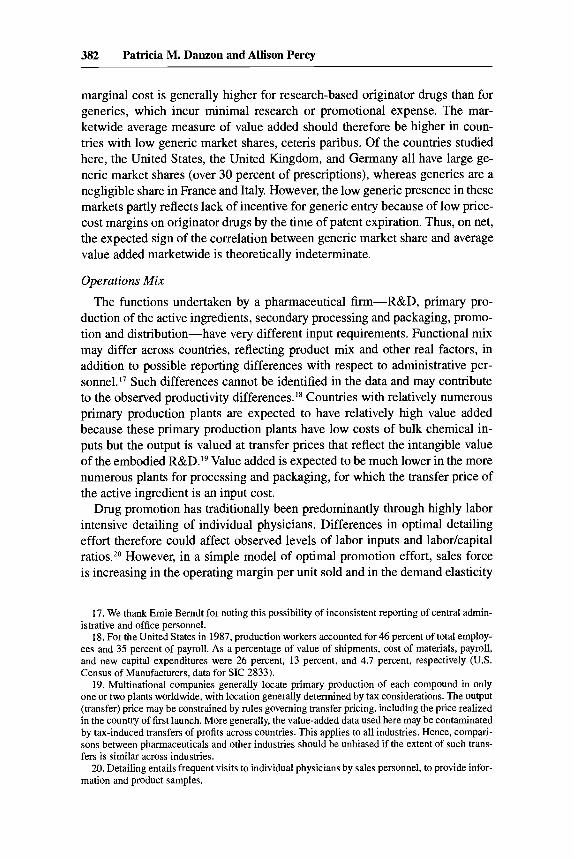
marginal cost is generally higher for research-based originator drugs than for generics, which incur minimal research or promotional expense. The mar- ketwide average measure of value added should therefore be higher in coun- tries with low generic market shares, ceteris paribus. Of the countries studied here, the United States, the United Kingdom, and Germany all have large ge- neric market shares (over 30 percent of prescriptions), whereas generics are a negligible share in France and Italy. However, the low generic presence in these markets partly reflects lack of incentive for generic entry because of low price- cost margins on originator drugs by the time of patent expiration. Thus, on net, the expected sign of the correlation between generic market share and average value added marketwide is theoretically indeterminate.
Operations Mix
The functions undertaken by a pharmaceutical firm-R&D, primary pro- duction of the active ingredients, secondary processing and packaging, promo- tion and distribution-have very different input requirements. Functional mix may differ across countries, reflecting product mix and other real factors, in addition to possible reporting differences with respect to administrative per- s0nne1.l~ Such differences cannot be identified in the data and may contribute to the observed productivity differences. ** Countries with relatively numerous primary production plants are expected to have relatively high value added because these primary production plants have low costs of bulk chemical in- puts but the output is valued at transfer prices that reflect the intangible value of the embodied R&D.I9 Value added is expected to be much lower in the more numerous plants for processing and packaging, for which the transfer price of the active ingredient is an input cost.
Drug promotion has traditionally been predominantly through highly labor intensive detailing of individual physicians. Differences in optimal detailing effort therefore could affect observed levels of labor inputs and laborkapital ratios.2o However, in a simple model of optimal promotion effort, sales force is increasing in the operating margin per unit sold and in the demand elasticity
17. We thank Ernie Bemdt for noting this possibility of inconsistent reporting of central admin- istrative and office personnel.
18. For the United States in 1987, production workers accounted for 46 percent of total employ- ees and 35 percent of payroll. As a percentage of value of shipments, cost of materials, payroll, and new capital expenditures were 26 percent, 13 percent, and 4.7 percent, respectively (U.S. Census of Manufacturers, data for SIC 2833).
19. Multinational companies generally locate primary production of each compound in only one or two plants worldwide, with location generally determined by tax considerations. The output (transfer) price may be constrained by rules governing transfer pricing, including the price realized in the country of first launch. More generally, the value-added data used here may be contaminated by tax-induced transfers of profits across countries. This applies to all industries. Hence, compari- sons between pharmaceuticals and other industries should be unbiased if the extent of such trans- fers is similar across industries.
20. Detailing entails frequent visits to individual physicians by sales personnel, to provide infor- mation and product samples.

383 Price Regulation and Productivity in Pharmaceuticals
with respect to detailing effort. Thus, if regulation depresses operating mar- gins, it should decrease labor inputs to promotion, other things equal. The U.K. regulatory system specifically limits the expenditure on promotion that can be included in the rate base.
Unobserved lid D
Investment in R&D as a percentage of sales is higher for pharmaceuticals than for any other industry (U.S. Congressional Budget Office 1994). How- ever, R&D stocks cannot be accurately estimated from the available data. The OECD-STAN data for labor and capital presumably include R&D inputs em- ployed in in-house research facilities. However, R&D inputs are not identified separately and would in any case provide an incomplete measure of R&D in- vestments. Omitted are payments to contractors engaged in clinical trials, li- cense fees and royalties for compounds licensed from abroad, and public in- vestments in R&D, which are a substitute for in-house research.
Estimates of R&D spending obtained from pharmaceutical trade associa- tions’ surveys of their members are reported here. These data should include payments to outside contractors but omit expenditures by nonmember firms, nonrespondents to the surveys, and public R&D expenditures. Expenditures on labor and capital are not reported separately. Thus, neither these trade- association data nor the OECD-STAN data provide a comprehensive, country- specific measure of R&D investment flows.
Even if country-specific investments in R&D could be accurately measured, conversion to a stock of knowledge available in each country, by year, would be problematic because of lags and international spillovers. The lag between initial investment in a target compound and final regulatory approval of a new drug averages about twelve years in the United States (DiMasi, Bryant, and Lasagna 1991). This cannot be extrapolated to other countries because of dif- ferences in product mix and regulatory systems. More generally, the interna- tional diffusion of knowledge through global products, sold under license or through multinational subsidiaries, severs any close link between a country’s domestic R&D expenditure, the cumulative stock of knowledge in that country, and the technology underlying the production process. For these reasons, we do not attempt to construct a country-specific measure of R&D stock.*] We discuss the effects of unobserved R&D stocks below.
13.3.3 Price Indexes
Country-Specific InjZation
Accurate measurement of real productivity growth requires accurate price indexes to convert the value-added data from current to constant local currency units. Price indexes for pharmaceuticals can diverge significantly from those
21. Cocks (1974) develops methods to estimate R&D stocks for a single firm in a single country.

384 Patricia M. Danzon and Allison Percy
for other goods and services because of regulation, insurance (which insulates consumers from price levels), and nontariff trade barriers. The country-specific GDP deflator reflects economywide inflation and hence can be interpreted as a measure of the opportunity cost of drug expenditures. We use the GDP de- flators to deflate all inputs-labor, capital, and R&D expenditures-under the assumption that inputs are purchased in economywide markets. The GDP de- flators are also used to adjust output measures for the nonpharmaceutical man- ufacturing industry.
For pharmaceutical output, we report results using the GDP deflator and two pharmaceutical price indexes. The ideal index would measure the rate of change of a quality-constant, representative basket of drugs sold through all relevant outlets since the expenditure data include both prescription and non- prescription drugs sold through retail pharmacies, hospitals, and other outlets. Given the rapid rate of technical change, the ideal index should use continually updated weights. The official PPIs for drugs may be imperfect because of lags in incorporating new products, inappropriate methods of incorporating new forms of old compounds, use of list rather than transactions prices, and nonrep- resentative sampling. The U S . PPI-drugs was upwardly biased by as much as 50 percent during the late 1980s (Berndt, Griliches, and Rosett 1993), primar- ily because of delay in incorporating new products. Similar or other biases may be present in the PPIs for other countries (Danzon and Kim 1996). For France, a national accounts price index for drugs is available only from 1988. For the prior years, we use a weighted average of manufacturer price indexes for reim- bursable and nonreimbursable drugs reported in SNIP (1993).22
Our Divisia pharmaceutical price indexes are based on IMS data for pre- scription and nonprescription products sold through retail pharmacies. They incorporate new compounds in their second year on the market through chained weights. These indexes nevertheless provide an imperfect deflator for total pharmaceutical output because the indexes exclude sales through hospi- tals, mail order, supermarkets, and other outlets, they exclude multimolecule drugs, and they exclude discounts; hence, they may overstate the growth in net manufacturer prices in the United States.
Defining a unit of pharmaceutical output is problematic because of the large and continually changing range of compounds, forms, strengths, and pack sizes. For the Divisia indexes used here, the unit of observation is the average price per standard unit for a specific molecule. A standard unit is defined by IMS as one tablet, one capsule, five milliliters of a liquid, etc. It is a rough proxy for a dose and has the advantage that it is defined for all dosage forms, packs, etc. such that the indexes can be based on the universe of data. This measure implicitly assumes that all forms of a given molecule are perfect sub- stitutes. To the extent that generics are in fact imperfect substitutes for origina-
22. These indexes presumably pertain only to outpatient drug sales. Hospital prices are not regulated in France and so may differ from outpatient prices. For the other countries, it is unclear whether the indexes include both prescription drugs and OTC sales and whether hospital sales are included.

385 Price Regulation and Productivity in Pharmaceuticals
tor drugs, these indexes understate price growth and overstate productivity growth; but, to the extent that line extensions and other new forms of old com- pounds offer real quality improvements, price growth is overstated and produc- tivity growth downwardly biased.23
These three indexes are reported in table 13.1 for the years for which all three are available. For all countries except the United States, pharmaceutical prices declined in real terms. The PPI and Divisia indexes are more similar to each other than to the GDP deflator and, on theoretical grounds, are likely to be more accurate. The subsequent discussion focuses on the drugs-specific in- dexes.
Cross-National Comparisons
For currency conversion for cross-national comparisons, we use GDP PPPs for all input prices and for nonpharmaceutical output. Since GDP PPPs reflect consumer prices rather than producer prices, they are not ideal for comparing productivity at manufacturer prices but are probably the best available measure for the nonpharmaceutical manufacturing sector. However, for pharmaceuti- cals, conversion at GDP PPPs can lead to systematic bias owing to regulation of manufacturer prices and other factors.
For the cross-national comparisons of pharmaceutical productivity, we therefore also report results using a drugs-specific Fisher price index for the years 1981-91 based on IMS data at manufacturer price levels. For each coun- try compared to the United States, these indexes include all compounds that are available in both countries (see app. B below; and Danzon and Kim 1998). Because these indexes necessarily omit nonmatching (local) drugs, they may be biased if prices for matching drugs, which include the global products pro- duced by multinational corporations, differ systematically from prices for non- matching local products."
We do not use the medical care PPPs or the pharmaceuticals PPPs reported by the OECD because both have severe limitations for productivity compari- sons. The medical PPPs, like the GDP PPPs, are intended to measure consumer price levels, whereas our output data are at manufacturer prices. Because gov- ernment expenditures are excluded from the medical PPPs, they may be seri- ously biased as a measure of average price levels in countries where govern- ments account for the majority of medical expenditures and may pay different prices from retail consumer prices.
Moreover, because many medical services are not reimbursed on a fee- for-service basis, the reported prices may not correspond even to list prices- for example, hospitals were paid global budgets in France, Germany, and the
23. These indexes are described in more detail in app. B and in Danzon and Kim (1996), which reports molecule and product indexes, using fixed weights and chained (Divisia) weights. Compar- isons between these indexes, the official PPI-drugs, and the OECD price indexes for pharmaceuti- cals are also discussed.
24. Danzon and Kim (1998) compare price indexes constructed using IMS data to the OECD medical PPPs and GDP PPPs.

Table 13.1 Measures of Pharmaceutical Price Idation (1980 = 100)
1980 1981 1982 1983 1984 1985 1986 1987 1988 1989 1990 1991
France" GDP price indexb Divisia price indexc PPI-drugsd
Germany' GDP price indexb Divisia price index' PPI-drugsd
Italy' GDP price indexb Divisia price index' PPI-drugsd
United Kingdom8 GDP price indexb Divisia price index'
United Statesh GDP price indexb Divisia price index'
PPI-dmgsd
PPI-drug9
100.0 100.0 100.0
100.0 100.0 100.0
100.0 100.0 100.0
100.0 100.0 100.0
100.0 100.0 100.0
111.3 105.5 110.1
104.1 104.0 104.1
118.9 113.3 118.9
111.4 106.3 107.0
110.0 111.3 109.0
124.7 112.8 116.6
108.8 107.0 107.2
139.4 128.4 137.5
119.8 112.9 115.5
116.8 123.7 117.0
136.8 146.7 155.3 163.5 168.5 173.8 179.8 185.2 191.0 117.4 124.1 128.8 133.6 138.2 142.8 146.9 149.0 149.7 121.9 126.6 129.4 131.7 134.1 135.1 135.1 136.7 137.9
112.4 114.8 117.4 121.2 123.6 125.6 128.8 133.2 138.7 112.4 116.6 117.6 118.7 118.4 118.1 118.0 115.3 116.0 112.3 116.1 119.6 121.4 122.4 123.8 125.9 126.2 128.0
160.4 179.1 194.9 210.3 222.8 237.6 252.4 271.3 291.0 145.4 157.5 170.3 184.0 191.4 199.0 202.5 205.7 216.7 156.6 166.6 189.5 190.2 210.5 219.3 223.0 227.3 238.0
126.2 131.9 139.5 144.4 151.6 161.5 172.9 183.8 196.2 120.1 121.2 123.3 125.5 130.6 135.9 141.0 142.9 143.5 121.0 124.8 131.4 128.5 134.2 135.9 136.8 141.4 144.7
121.6 127.0 131.6 135.1 139.5 144.9 151.3 157.9 164.2 137.8 151.5 161.8 172.8 182.1 191.8 206.7 227.9 247.0 128.0 137.9 149.1 160.9 172.9 185.2 200.6 214.7 229.2
"SNIP (1993). bFrom OECD HEALTH DATA (CREDES). c1980 base imputed from average growth rates from 1981-82 and 1982-83. From Danzon and Kim (1996) using IMS data. See app. B. dFor Germany, Italy, and the United Kingdom, the 1980 base imputed from the average for 1981-82 and 1982-83. 1981 index imputed from growth rate for June- December 1981. 1980 index imputed from the growth rate for June 1981-December 1982. 'Preise und Preisindizesfur gewerbliche Produkre, Statistisches Bundesamt. 'Eollettino mensile di srarisrica, Istitute Nazionale di Statistica. gAnnunl Abstract of Statistics, Central Statistical Office, H.M. Stationery Office, London. "Bureau of Labor Statistics, Producer Price Index, http://www.bls.gov/ppihome.htm.

387 Price Regulation and Productivity in Pharmaceuticals
United Kingdom during much of this period, physicians in the United King- dom are paid either a salary or a capitation per enrolled patient, etc. Even where physicians are paid fee for service, as in Germany, the duration and content of a “visit” tends to be reduced as the prices are reduced and may also change owing to technological change. Estimating an accurate, quality- constant price index is particularly difficult in medical care because of the rapid rate of technical change and hence in the real content of services that do not change in name. For example, the real content of a hospital day is very different today than twenty years ago, but this quality change is typically em- bedded in the reported measure of price change.25
In the case of the pharmaceutical PPPs, the sample is very small; retail prices may differ significantly from manufacturer prices;26 the index is unweighted; it includes medical devices; and it includes imputed values where prices are unavailable, which is inappropriate if unavailability reflects systematic differ- ences between the unavailable products and the available products, owing to preferences and regulation. The differences between the OECD PPPs and our pharmaceutical indexes based on IMS data are discussed further in Danzon and Kim (1998).
The Fisher indexes for the United States relative to each comparison country are reported in table 13.2. They show the differences that remain in pharma- ceutical prices after converting at exchange rates. Prices are lowest in France and decline steadily for most of the period, consistent with the hypothesis of increasing regulatory stringency. Italy has the second lowest prices, with con- siderable variation over the period that reflects exchange rate fluctuations as well changing regulatory stringency. The United Kingdom is third lowest and also shows declining prices over time, relative to the United States, which again suggests increasing regulatory stringency in the United Kingdom. Ger- many’s prices decline, relative to the United States, following the introduction of reference pricing in 1989.
These data indicate that regulation has constrained the level and growth of drug prices at the manufacturer level relative to the unregulated U.S. prices. This confirms the importance of using sector-specific prices indexes for cross- national comparisons of a heavily regulated industry such as pharmaceuticals. Note that the estimates of U.S. price levels and growth are upwardly biased owing to the omission of discounts to managed care and public purchasers, which increased during the late 1980s and 1 9 9 0 ~ . ~ ~
25. Cutler et al. (1996) discuss the upward bias in the U.S. CPI for medical care, relative to a true cost-of-living index.
26. Distribution margins account for up to half of purchaser price levels for pharmaceuticals in some European countries (Healy 1995).
27. The Fisher indexes conceal significant differences between the U.S.-weighted Laspeyres indexes and the foreign-weighted Paasche indexes. The Laspeyres indexes show Germany, Can- ada, and Japan with higher prices than the United States. The Paasche indexes show foreign prices uniformly lower than U.S. prices, by as much as 50 percentage points (see Danzon and Kim 1998; Danzon and Chao 1999).

Table 13.2 U.S. Relative to Foreign Prices for Pharmaceuticals, Fisher Price Indexes," Single Molecule Products, Retail Pharmacy: Matching by Molecule/ Therapeutic Category
1981 1982 1983 1984 1985b 1986 1987b 1988 1989 1990 1991 1992
France 1.66 1.84 2.13 2.52 2.38 2.24 2.35 2.46 2.81 2.68 2.65 2.06
Italy 1.84 2.11 2.06 2.39 2.21 2.04 2.00 1.95 2.25 2.13 1.93 1.79 United Kingdom 1.04 1.20 1.41 1.67 1.68 1.68 1.54 1.39 1.56 1.66 1.66 1.71
Germany .87 .99 1.09 1.26 1.24 1.23 1.18 1.13 1.42 1.39 1.35 1.44
"IMS data. See Danzon and Kim (1998). b1985 and 1987 values were estimated by taking the average of 1984 + 1986 and 1986 + 1988, respectively.

389 Price Regulation and Productivity in Pharmaceuticals
13.4 Empirical Results
13.4.1 Pharmaceutical Production
In all countries, growth in production of pharmaceuticals has far outpaced total manufacturing in the 1980s, regardless of the price index used (table 13.3). Using the Divisia indexes, pharmaceutical production increased 170 percent in Italy, 90 percent in France, 96 percent in the United Kingdom, 55 percent in Germany, and 18 percent in the United States. Relative to this bench- mark, the estimates based on the GDP deflator are downwardly biased by 40-50 percentage points for France, Italy, and the United Kingdom, but the U.S. estimate is upwardly biased by 52 percentage points. The slow growth in Germany, relative to the other European countries, supports the hypothesis that production has been diverted from Germany to countries whose regulatory en- vironments specifically reward local production, such as France, Italy, and the United Kingdom.
13.4.2 Employment
Between 1980 and 1990, employment in pharmaceuticals grew almost three times as rapidly in France (15.8 percent) as in the United States (5.8 percent) and the United Kingdom (3.5 percent) (table 13.4). By 1990, pharmaceutical employment was 2.0 percent of total manufacturing employment in France, compared to 1.4 percent in the United Kingdom, 1.2 percent in Germany, 1.3 percent in Italy, and 0.95 percent in the United States excluding Puerto Rico. Although this evidence is consistent with the hypothesis that regulation has stimulated employment in France and the United Kingdom since production has also grown rapidly in France, the alternative hypothesis of demand-driven expansion of production and sales force cannot be dismissed without evidence on productivity. Whether the growth in pharmaceutical employment is a net gain, as intended by industrial policy, or simply a diversion from other sectors remains an open question.
13.4.3 Value Added
Trends in value added are similar to trends in total production, with much more rapid growth in pharmaceuticals than in other manufacturing industries (table 13.5). Again, results are very sensitive to the price index.
To provide a measure that is independent of the price index, we calculated the cumulative growth in value added relative to the cumulative growth in pro- duction between 1980 and 1990. This ratio is 0.58 in Italy and 0.87 in France; by contrast, the ratio is 1.06 in the United States, 1.12 in the United Kingdom, and 1.13 in Germany. Thus, the ratio of value added to output declined in coun- tries with strict price regulation but increased in the other three countries. This is consistent with the hypothesis that biased price regulation reduced the rate of growth of productivity.

Table 13.3 Growth in Production, 1970-W (GDP deflator adjusted values unless noted; 1980 = 100) ~~~~ ~
1970 1975 1980 1981 1982 1983 1984 1985 1986 1987 1988 1989 1990
France Total manufacturing Chemical products Drugs & medicines Divisia price index
PPI-drugs
Germany Total manufacturing Chemical products Drugs & medicines Divisia price index
PPI-drugs
Italy Total manufacturing Chemical products Drugs & medicinesb Divisia price index
PPI-drugs
70.6 56.3 71.5 . . . . . .
81.1 61.8 71.1 . . . . . .
58.3 40.2 64.4 . . . . . .
81.8 72.8 87.4 . . . . . .
85.1 73.9
108.0 . . . . . .
82.9 81.0 76.4 ... . . .
100.0 100.0 100.0 100.0 100.0
100.0 100.0 100.0 100.0 100.0
100.0 100.0 100.0 100.0 100.0
99.2 101.3 107.2 113.1 108.4
100.1 104.6 102.9 103.0 102.9
98.3 101.0 107.7 113.0 107.7
98.6 97.2
108.6 120.1 116.2
97.2 99.5 99.8
101.5 101.3
96.3 100.8 111.0 120.5 112.5
96.9 95.4
113.7 132.5 121.6
96.7 99.9
107.0 107.0 107.1
92.7 100.3 118.6 130.8 121.5
98.7 99.6
116.2 137.4 134.7
101.0 106.4 112.0 110.3 110.7
97.8 111.9 131.6 149.7 141.5
98.6 99.2
121.6 146.6 145.9
104.8 109.0 113.1 112.9 111.1
100.0 118.0 149.5 171.1 153.8
93.4 82.5
125.2 153.2 155.4
101.2 93.1
116.2 118.7 116.0
95.8 109.2 152.2 173.9 168.3
93.2 80.7
126.6 154.4 159.0
99.5 89.7
116.7 121.8 117.8
97.8 117.4 164.9 191.9 174.5
97.7 83.8
138.2 168.1 177.8
103.5 93.5
124.7 132.6 126.5
105.0 126.9 177.1' 211.5 191.9
103.1 88.1
145.3 177.8 193.3
109.2 98.9
126.0 137.5 128.9
111.0 134.1 207.5' 258.6 234.9
103.8 88.3
152.6 189.8 206.8
113.1 99.8
134.0 154.8 141.4
106.9 129.1 204.6' 269.9 244.2

United Kingdom Total manufacturingb Chemical productsb Drugs & medicinesb Divisia price index
PPI-drugs
United States Total manufacturing Chemical products Drugs & medicinesb Divisia price index
PPI-drugs
96.2 105.2 65.9 94.5 88.5 85.8 . . . . . .
71.1 80.6 49.8 67.5 69.5 81.9
100.0 100.0 100.0 100.0 100.0
100.0 100.0 100.0 100.0 100.0
90.7 91.8 97.1
101.8 101.1
99.3 102.2 101.6 100.4 102.5
89.6 91.4 90.4 94.0
104.3 106.2 110.7 111.6 108.2 110.8
90.1 92.0 91.0 88.8
105.5 113.0 99.6 99.8
105.3 107.4
97.1 102.6 113.8 123.9 120.3
98.2 90.1
114.6 96.0
105.5
98.5 100.9 118.3 133.8 125.6
95.9 85.3
119.1 96.9
105.1
94.8 101.3 104.8 106.7 84.8 101.7 99.8 102.6
125.6 135.3 144.8 150.3 144.6 157.1 172.1 184.3 141.2 152.9 172.1 190.0
93.4 96.0 100.2 102.1 74.2 79.0 82.5 84.8
127.2 140.2 151.3 161.7 99.4 107.4 114.3 118.4
106.8 113.1 118.3 122.0
104.3 102.1 152.3 196.0 198.0
100.6 87.7
169.5 117.5 124.7
“Production is national accounts compatible (gross output). bSurvey-based data may not be national accounts compatible. “Figures are estimated using the ratio of Drugs and Medicines to Other Chemicals for the closest year for which data are available.

Table 13.4 Growth in Number of Employees, 1975-90 (1980 = 100)
1975 1980 1981 1982 1983 1984 1985 1986 1987 1988 1989 1990
France Total manufacturing Chemical products Drugs & medicines”
Germany Total manufacturing Chemical products Drugs & medicines
Italy Total manufacturing Chemical products Drugs & medicines”
United Kingdom Total manufacturing Chemical products Drugs & medicines”
United States Total manufacturing Chemical products Drugs & medicines”
106.2 105.2 101.9b
100.0 97.7
105.1b
94.7 99.0
101.4b
108.1 104.8 90.0
89.5 88.3 86.7
100.0 100.0 100.0
100.0 100.0 100.0
100.0 100.0 100.0
100.0 100.0 100.0
100.0 100.0 100.0
96.8 95.5 97.2 95.4
102.4 102.9
98.2 95.3 99.3 98.6
101.4 102.7
96.4 93.9 93.4 90.2 99.8 99.2
89.9 84.8 90.6 86.4 95.2 93.5
99.7 92.3 101.3 96.5 98.3 96.0
93.6 90.7 93.0 92.1
104.2 105.6
92.1 91.7 96.7 97.7
102.9 104.6
90.2 86.1 88.1 86.4 96.7 98.8
80.0 78.8 82.0 82.6 92.6 92.7
90.9 95.6 95.3 98.7 97.1 96.5
88.1 86.4 90.8 90.6
106.8 107.8
92.9 94.3 99.7 101.7
104.5 107.1
85.0 84.5 86.2 88.3 97.0 97.9
78.5 76.7 82.4 81.2 91.4 92.7
94.7 93.6 98.2 96.9 94.8 96.0
84.2 82.8 83.1 83.5 89.7 89.5 91.0 92.0
107.2 108.6 112.2 115.8
94.4 94.2 95.6 98.3 103.3 105.4 106.0 109.2 107.7 109.2 108.4 113.4
83.7 84.8 85.2 85.2 91.0 92.9 94.1 94.5 99.4 103.2 104.2b 104.2b
76.2 77.3 77.8 77.6 81.7 84.1 85.5 85.7
103.5 98.7 104.1 96.8
94.0 96.0 96.3 95.0 100.0 102.2 103.5 104.4 99.4 101.2 106.4 105.8
aSurvey-based data may not be national accounts compatible. bFigures are estimated using the ratio of Drugs and Medicines to Other Chemicals for the closest year for which data are available.

Table 13.5 Growth of Value Added, 1970-!MP (GDP deflator adjusted values unless noted; 1980 = 100)
1970 1975 1980 1981 1982 1983 1984 1985 1986 1987 1988 1989 1990
France Total manufacturing Chemical products Drugs & medicines Divisia price index
PPI-drugs
Germany Total manufacturing Chemical products Drugs & medicines Divisia price index
PPI-drugs
Italy Total manufacturing Chemical products Drugs & medicinesb Divisia price index
PPP-drugs
85.3 84.4 64.7 . . . . . .
90.8 84.0 81.4 . . . . . .
67.2 72.9 92.3 . . . . . .
95.5 89.1 79.2 . . . . . .
90.4 89.6 90.5 . . . . . .
79.2 88.7 92.8 . . . . . .
100.0 100.0 100.0 100.0 100.0
100.0 100.0 100.0 100.0 100.0
100.0 100.0 100.0 100.0 100.0
97.0 94.9
103.7 109.4 104.8
98.0 99.9
105.8 105.9 105.8
96.6 93.2
100.4 105.4 100.4
97.0 93.3
101.9 112.6 109.0
95.7 95.6
107.2 109.1 108.8
93.8 90.9
101.9 110.6 103.3
96.9 100.4 113.1 131.8 127.0
97.0 102.5 116.6 116.6 116.7
90.3 91.4
105.8 116.8 108.4
95.9 98.5
105.6 124.8 122.4
99.2 106.6 117.1 115.4 115.8
91.7 98.5
110.6 125.8 118.9
97.9 105.2 106.1 128.0 127.4
103.5 109.2 120.3 120.0 118.1
93.5 110.6 116.5 133.4 119.8
100.8 115.7 117.0 143.1 145.2
107.5 117.5 130.6 133.4 130.4
94.0 107.6 109.9 125.6 121.5
99.8 109.9 122.6 149.6 154.1
106.1 106.7 125.6 131.0 126.8
95.4 112.9 115.2 134.1 121.9
105.2 117.3 126.4 153.7 162.5
109.1 114.8 135.1 143.6 137.0
100.1 119.5 118.1' 141.0 128.0
108.8 117.2 123.7 151.4 164.7
111.8 116.7 148.9 162.6 152.4
102.8 123.7 127.2' 158.5 143.9
110.6 117.7 132.8 165.1 179.9
116.4 117.0 150.8 174.3 159.2
100.3 118.0 118.3' 156.1 141.2
(continued)

Table 13.5 (continued)
1970 1975 1980 1981 1982 1983 1984 1985 1986 1987 1988 1989 1990
United Kingdom Totalmanufacturing 100.8 101.1 100.0 91.3 91.7 91.7 92.1 97.3 101.1 101.9 106.6 108.9 106.2 Chemical products 81.4 96.7 100.0 89.4 90.6 95.2 100.7 106.8 114.4 118.7 124.1 127.6 124.6 Drugs & medicinesb 75.2 75.3 100.0 96.4 106.8 106.7 115.7 121.2 129.6 146.1 159.4 164.9 170.0 Divisia price index . . . . . . 100.0 101.0 113.4 112.2 125.9 137.1 149.2 169.6 189.4 202.2 218.7
PPI-drugs . . . . . . 100.0 100.4 110.8 111.3 122.3 128.6 145.7 165.0 189.4 208.5 221.0
United States Total manufacturing 88.3 89.4 100.0 100.7 93.6 96.7 104.5 103.3 104.6 105.4 109.0 109.1 106.0 Chemical products 84.9 91.8 100.0 105.8 106.3 113.3 118.7 116.6 125.8 126.9 139.0 139.7 140.2 Drugs &medicinesb 77.5 86.6 100.0 100.3 107.8 118.1 120.1 128.0 133.9 149.6 158.7 168.3 179.5 Divisia price index . . . . . . 100.0 99.1 101.8 104.2 100.6 104.0 104.7 114.6 119.9 123.2 124.4
PPI-drugs . . . . . . 100.0 101.2 107.6 112.2 110.6 112.9 112.4 120.7 124.2 127.0 132.0
Walue added is national accounts compatible value added. bSurvey-based data may not be national accounts compatible. <Figures are estimated using the ratio of Drugs and Medicines to Other Chemicals for the closest year for which data are available.
395 Price Regulation and Productivity in Pharmaceuticals
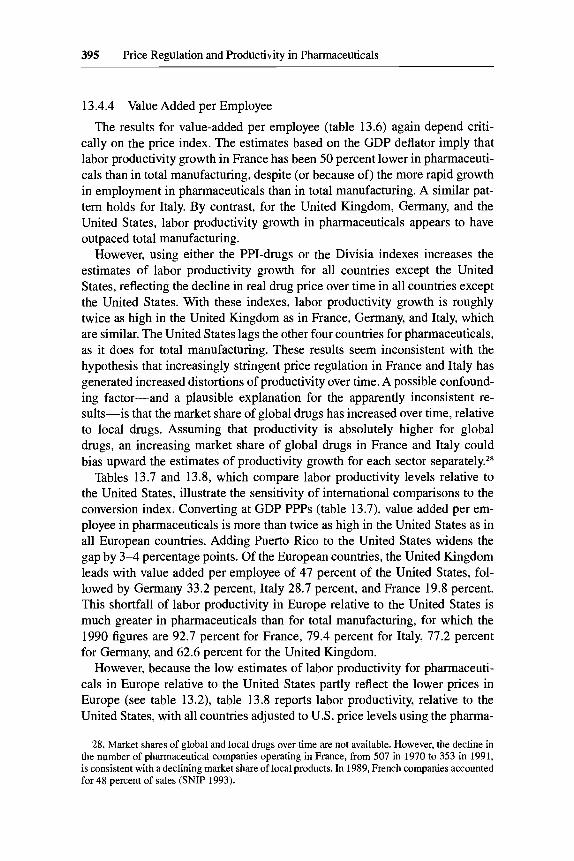
13.4.4 Value Added per Employee
The results for value-added per employee (table 13.6) again depend criti- cally on the price index. The estimates based on the GDP deflator imply that labor productivity growth in France has been 50 percent lower in pharmaceuti- cals than in total manufacturing, despite (or because of) the more rapid growth in employment in pharmaceuticals than in total manufacturing. A similar pat- tern holds for Italy. By contrast, for the United Kingdom, Germany, and the United States, labor productivity growth in pharmaceuticals appears to have outpaced total manufacturing.
However, using either the PPI-drugs or the Divisia indexes increases the estimates of labor productivity growth for all countries except the United States, reflecting the decline in real drug price over time in all countries except the United States. With these indexes, labor productivity growth is roughly twice as high in the United Kingdom as in France, Germany, and Italy, which are similar. The United States lags the other four countries for pharmaceuticals, as it does for total manufacturing. These results seem inconsistent with the hypothesis that increasingly stringent price regulation in France and Italy has generated increased distortions of productivity over time. A possible confound- ing factor-and a plausible explanation for the apparently inconsistent re- sults-is that the market share of global drugs has increased over time, relative to local drugs. Assuming that productivity is absolutely higher for global drugs, an increasing market share of global drugs in France and Italy could bias upward the estimates of productivity growth for each sector separately.28
Tables 13.7 and 13.8, which compare labor productivity levels relative to the United States, illustrate the sensitivity of international comparisons to the conversion index. Converting at GDP PPPs (table 13.7), value added per em- ployee in pharmaceuticals is more than twice as high in the United States as in all European countries. Adding Puerto Rico to the United States widens the gap by 3-4 percentage points. Of the European countries, the United Kingdom leads with value added per employee of 47 percent of the United States, fol- lowed by Germany 33.2 percent, Italy 28.7 percent, and France 19.8 percent. This shortfall of labor productivity in Europe relative to the United States is much greater in pharmaceuticals than for total manufacturing, for which the 1990 figures are 92.7 percent for France, 79.4 percent for Italy, 77.2 percent for Germany, and 62.6 percent for the United Kingdom.
However, because the low estimates of labor productivity for pharmaceuti- cals in Europe relative to the United States partly reflect the lower prices in Europe (see table 13.2), table 13.8 reports labor productivity, relative to the United States, with all countries adjusted to U.S. price levels using the pharma-
28. Market shares of global and local drugs over time are not available. However, the decline in the number of pharmaceutical companies operating in France, from 507 in 1970 to 353 in 1991, is consistent with a declining market share of local products. In 1989, French companies accounted for 48 percent of sales (SNIP 1993).

Table 13.6 Growth of Value Added per Employee, 1970-90" (GDP deflator adjusted values unless noted; 1980 = 100)
1970 1975 1980 1981 1982 1983 1984 1985 1986 1987 1988 1989 1990
France Total manufacturing Chemical products Drugs & medicinesb Divisia price deflator
Germany Total manufacturing Chemical products Drugs & medicines Divisia price deflator
Iraly Total manufacturing Chemical products Drugs & medicinesb.d Divisia price deflator
Unired Kingdom Total manufacturing Chemical products Drugs & medicinesb.d Divisia price deflator
United Stares Total manufacturing Chemical products Drugs & medicinesb.d Divisia price deflator
83.3 87.4 . . . . . .
81.6 82.7 . . . . . .
74.2 81.3 . . . . . .
84.3 75.8 76.7 . . .
92.9 95.3
102.4 . . .
90.0 84.6 77.8 . . .
90.4 91.7 86.1' . . .
83.6 89.6 91.5' . . .
93.6 92.2 83.7 . . .
99.9 104.0 99.9 . . .
100.0 100.0 100.0 100.0
100.0 100.0 100.0 100.0
100.0 100.0 100.0 100.0
100.0 100.0 100.0 100.0
100.0 100.0 100.0 100.0
100.2 97.6
101.3 106.1
99.8 100.6 104.4 106.2
100.3 99.9
100.6 107.5
101.6 98.7
101.3 106.1
101.0 104.4 102.0 101.6
101.5 97.7 99.0
109.2
100.4 97.0
104.4 108.4
99.9 100.8 102.8 115.7
108.1 104.9 114.2 121.0
101.4 110.1 112.3 107.4
103.6 107.9 108.5 126.9
105.3 106.0 113.4 116.4
100.1 103.7 109.4 128.0
114.6 116.1 115.2 121.3
106.4 118.8 121.6 109.9
105.7 106.9 100.0 119.8
108.2 109.1 112.0 114.7
106.4 114.1 112.0 138.1
116.9 122.0 124.8 136.8
109.3 120.3 124.4 107.4
111.1 115.9 99.4
122.3
111.5 109.5 115.1 120.5
110.0 128.4 120.1 151.8
123.9 129.6 132.6 152.1
109.1 118.7 135.0 113.5
116.7 127.7 108.6 136.5
113.9 115.6 121.9 131.8
111.3 121.9 112.2 144.0
131.9 140.9 139.8 164.1
111.7 129.8 139.6 113.1
118.6 122.4 114.4 144.5
112.4 103.3 116.6 129.1
114.0 124.0 115.9 152.9
133.8 145.4 150.9 179.8
112.2 126.8 150.5 120.2
127.0 131.1 116.3 147.6
115.8 108.9 123.7 139.9
118.0 128.6 114.5 156.3
137.9 147.5 161.5 198.4
113.6 136.0 156.9 124.2
131.0 128.8 110.3 141.5
117.0 110.1 137.4 159.7
120.6 130.7 122.1 175.4
139.9 149.2 158.5 203.0
113.2 135.0 158.3 122.1
132.4 127.9 114.6 150.4
118.4 107.2 133.0 163.5
117.7 124.8 113.6 174.2
136.8 145.4 164.2 221.4
111.5 134.3 169.7 125.4
"Value Added is national accounts compatible value added. bEmployment figures are survey-based data and may not be national accounts compatible. 'Figures are estimated using the ratio of Drugs and Medicines to Other Chemicals for the closest year for which data are available.

Table 13.7 Value Added per Employee relative to United States, GDP PPP Conversiona (United States = 100)
1970 1975 1980 1981 1982 1983 1984 1985 1986 1987 1988 1989 1990
France Total manufacturing Other chemicals Drugs & medicinesb Drugs & medicines
(including Puerto Rico)
Germany Total manufacturing Other chemicals Drugs & medicines Drugs & medicines
(including Puerto Rico)
70.5 71.7 79.4 78.5 79.3 76.9 76.1 79.9 81.9 82.7 87.5 90.5 92.7 46.6 45.7 63.2 62.5 53.5 53.4 48.1 48.6 47.8 49.0 49.8 51.5 53.4 . . . 23.2 29.8 29.5 26.2 26.5 23.7 21.7 22.9 22.3 21.8 20.4 19.8
. . . . . . . . . . . . . . . . . . . . . . . 23.7 . . . 20.5
63.9 66.3 73.3 72.3 72.3 72.3 72.0 74.3 74.3 72.1 74.1 75.1 77.2 43.7 48.1 45.7 59.4 49.8 51.4 49.1 48.8 49.0 45.2 46.9 48.2 46.2 . . . 3 6 3 42.7 43.6 39.5 39.7 38.2 36.2 37.1 32.8 33.4 36.8 33.2
. . . . . . 35.8 . . . . . . . . . . . . 30.1 . . .
(continued)

Table 13.7 (continued)
1970 1975 1980 1981 1982 1983 1984 1985 1986 1987 1988 1989 1990
Italy Total manufacturing 60.8 64.0 76.6 75.8 75.2 71.7 73.8 76.3 75.3 76.7 78.4 80.3 79.4 Other chemicals 56.7 48.5 65.9 56.2 50.1 46.3 50.2 54.1 46.1 47.5 48.7 52.6 46.9
Drugs & medicines (including Puerto
. . . . . . ... . . . . . . 30.5 Rico) . . . . . . 36.0 . . .
Drugs & . . . 39.9’ 43.7 42.9 39.8 39.1 39.0 38.4 34.7 33.1 31.4 33.2’ 28.7“
. . . . . . . . .
United Kingdom Total manufacturing 47.1 48.6 51.6 51.5 54.3 55.5 54.1 57.5 60.4 60.9 62.5 63.0 62.6 Other chemicals 27.7 29.4 37.1 34.4 32.5 31.5 32.5 34.7 34.9 35.0 36.3 36.4 35.2 Drugs & medicinesb,d 37.0 41.3 49.1 48.4 49.3 46.5 48.3 47.4 48.7 48.7 50.4 48.6 47.0 Drugs & medicines
(including h e r t o . . . . . . . . . . . . . . . ... 44.8 Rico) . . . . . . . . . . . . 44.6 . . .
Calculated using GDP PPPs. bSurvey-based employment data may not be national accounts compatible. ‘Figures are estimated using the ratio of drugs and medicines to chemicals for the closest year for which data are available. dSurvey-based value-added data may not be national accounts compatible.

Table 13.8 Value Added per Employee relative to United States, Fisher Price Indexes" (United States = 100)
1981 1982 1982b 1983 1984 1985 1986 1987 1987b 1988 1989 1990
Drugs & Medicines France' 50.7 43.5 39.3 46.3 44.2 38.0 50.2 59.2 54.4 60.5 60.1 64.2 Germany 39.2 37.1 33.5 38.7 37.8 34.0 46.7 47.3 43.5 46.1 58.6 59.6 Ita1yC.d 61.2 60.4 54.7 57.1 61.3 54.4 60.8 67.3 61.9 63.6" 74.8" 72.5" United 52.3 55.0 49.7 52.6 58.1 56.2 66.2 68.9 63.3 71.3 73.3 83.6 United Statesc.d 100.0 100.0 100.0 100.0 100.0 100.0 100.0 100.0 100.0 100.0 100.0 100.0
"For Fisher price indexes, see table 13.2, app. B below, and Danzon and Kim (1998). bFigures in these columns use the United States and her to Rico as base. %rvey-based employment data may not be national accounts compatible. dSurvey-based value added may not be national accounts compatible. 'Figures are estimated using the ratio of drugs and medicines to chemicals for the closest year for which data are available.

400 Patricia M. Danzon and Allison Percy
ceuticals-specific Fisher indexes. Although this dramatically improves the Eu- ropean productivity measures, Germany is still only 60 percent of the United States, France 64 percent, Italy 73 percent, and the United Kingdom 84 per- cent. All countries except the United Kingdom still show lower productivity for pharmaceuticals than for total manufacturing. This may understate the pro- ductivity shortfall in pharmaceuticals because of the exclusion of local prod- ucts from these Fisher indexes. If local products, which are produced by local firms and have relatively low prices, are less stringently regulated than global products that are produced by multinational corporations and are generally higher priced, then the Fisher indexes understate foreign prices and overstate foreign productivity, relative to the United States.
For the United States, the OECD data exclude Puerto Rico, which accounted for roughly 14 percent of U.S. production and 9 percent of employment in the 1980s. Adding Puerto Rico (where available) raises U.S. value added by about 3 percentage points (1987 data), as expected given the tax incentives to locate high-value-added operations in Puerto Rico.
Note that, for purposes of comparing productivity cross-nationally, pricing the output of different countries at a common price level is appropriate. The table 13.8 estimates, with all countries compared at U.S. prices using the Fisher indexes, therefore provide a more accurate comparison of labor produc- tivity in pharmaceuticals than the table 13.7 estimates that use GDP P P P S . ~ ~ However, for purposes of evaluating the efficiency of resource allocation to drugs relative to other sectors within each country, each country's output should be valued at local prices; thus, for this purpose, the table 13.7 compari- sons that use local prices and GDP PPP conversion are more appropriate. These show significantly lower labor productivity in pharmaceuticals than in other manufacturing in France and Italy, yet employment has grown more rap- idly in pharmaceuticals than in other manufacturing in these countries. We return to this below.
13.4.5 Capital Investment
Between 1980 and 1990, fixed capital investment in pharmaceuticals in- creased 150 percent30 in France, compared to roughly 60 percent in the United States and the United Kingdom and compared to 33 percent for total manufac- turing in France (table 13.9). Investment per employee increased 116 percent in pharmaceuticals in France, compared to 59 percent in total manufacturing (table 13.10), consistent with the hypothesis of biased regulation. The more
29. The use of the United States as the benchmark price level does not affect the results because the Fisher indexes are the geometric mean of the Laspeyres and Paasche indexes, which, respec- tively, use consumption patterns in the United States and the foreign country as weights. Ideally, inputs should also be measured at common price levels. This adjustment cannot be made with the available data.
30. The 1990 figure of 250 appears to be above trend; the three-year average for 1989-91 is 237. Using this lower figure would not affect the conclusions.

Table 13.9 Growth in Gross Fixed Capital Formation, 1975-90” (GDP deflator adjusted values; 1980 = 100)
1975 1980 1981 1982 1983 1984 1985 1986 1987 1988 1989 1990
France Total manufacturing Chemical products Drugs & medicinesh
Germany Total manufacturing Chemical products Drugs & medicines
Italy Total manufacturing Chemical products Drugs & medicines
United Kingdom Total manufacturing Chemical products Drugs & medicinesb
United States Total manufacturing Chemical products Drugs & medicinesb
83.3 79.3
100.0 100.0 100.0
93.3 91.3
114.1
88.4 85.3 86.2 82.0 76.9 72.7
141.5 131.3 135.4
94.4 85.1
156.7
97.9 85.7
183.7
102.6 91.8
204.9
113.3 96.6
205.6
120.7 105.7 232.5
132.6 117.9 250.1
76.2 97.2
100.0 100.0 100.0
94.2 97.6
105.6
85.4 86.1 84.8 89.9 88.7 85.9
100.4 112.0 115.5
96.4 95.7
119.5
103.0 105.3 134.4
107.7 117.1 132.3
109.7 116.9 111.1
120.1 127.7 125.3
132.6 137.9 136.2
70.3 74.8 . . .
77.7 89.4
85.2 102.0
92.7 88.0
82.2 199.1 . . .
100.0 100.0 . . .
89.2 86.1 . . .
80.9 71.9 75.6 80.1 73.0 77.1 . . . . . . . . .
69.6 78.0 . . .
. . .
. . .
95.9 89.8 76.2
100.0 100.0 100.0
76.8 75.0
113.5
74.4 73.9 87.7 69.2 72.8 80.6 93.0 94.6 97.8
100.8 100.2 131.5
93.7 94.3
135.1
99.1 103.3 136.0
105.7 99.6
153.6
114.8 104.2 158.1
108.3 102.0 161.9
75.3 93.0 76.8
100.0 100.0 100.0
106.2 110.7 106.1
96.0 73.9 85.3 113.5 80.0 80.5 118.9 108.7 125.1
93.4 84.2
123.9
80.2 68.2
109.5
86.1 76.7
139.3
85.2 86.5
157.8
100.6 107.3 175.7
101.7 106.2 160.4
“Gross fixed capital formation is national accountsxompatible gross fixed capital formation (land, buildings, machinery, and equipment). bSurvey-based data may not be national accounts compatible.

Table 13.10 Growth in Gross Fixed Capital Formation per Employee (GDP deflator adjusted values: 1980 = 100)
1984 1985 1986 1987 1988 1989 1990 1975 1980 1981 1982 1983
France Total manufacturing Chemical products Drugs &
Germany Total manufacturing Chemical products Drugs & medicines
Italy Total manufacturing Chemical products Drugs & medicinesb
United Kingdom Total manufacturing Chemical products Drugs &
United States Total manufacturing Chemical products Drugs &
78.5 100.0 75.4 100.0 . . . 100.0
96.4 92.6 91.1 93.9 85.9 82.7
111.5 137.5 126.0
94.9 107.2 113.3 78.9 93.8 94.6
128.3 146.8 170.4
121.9 102.3 191.2
136.8 108.0 189.3
145.3 116.1 207.2
158.8 128.2 215.9
76.1 100.0 99.5 100.0 . . . 100.0
95.9 89.6 93.4 98.3 91.1 91.7
104.2 97.7 108.8
92.4 103.8 109.2 87.9 96.0 103.6
110.4 114.3 125.5
114.1 113.4 122.9
116.4 110.9 101.7
125.6 120.5 115.5
134.9 126.3 120.1
86.8 100.0 201.1 100.0 . . . . . .
92.5 86.1 79.7 92.2 88.8 82.9 . . . . . . . . .
87.7 81.9 83.1 89.3 90.5 84.8 . . . . . . . . .
92.9 98.2 . . .
100.4 109.7 . . .
108.7 93.0 . . . . . .
88.8 100.0 85.7 100.0 84.4 100.0
85.4 87.8 92.4 82.8 80.1 88.7
119.2 99.5 102.1
111.3 128.3 122.1 97.7 121.7 116.0
105.4 143.9 145.7
130.1 126.4 140.4
136.7 118.5 155.6
147.4 121.9 151.9
139.7 119.0 156.3
84.1 100.0 105.3 100.0 88.6 100
106.5 104.0 81.3 109.2 117.5 83.9 107.9 123.9 112
89.2 98.7 85.7 81.6 85.8 70.3
129.6 130.7 114.1
91.6 76.7
140.1
88.7 84.7
156
104.4 103.7 165.2
107.1 101.8 151.7
"Survey-based data may not be national accounts compatible. bErnployment figures are survey-based data and may not be national accounts compatible.

403 Price Regulation and Productivity in Pharmaceuticals
rapid growth in labor productivity in the French pharmaceutical industry rela- tive to other French manufacturing (measured using the Divisia indexes) may thus in part reflect the increasing capitaVlabor ratio.
Between 1980 and 1990, the United Kingdom also experienced more rapid growth in capital investment, both absolutely and per employee, in pharmaceu- ticals than in total manufacturing, consistent with the predicted effects of rate- of-return regulation. The growth in capitaVlabor ratios may have contributed to the growth in value added per employee in pharmaceuticals relative to total manufacturing (64 vs. 37 percent) in the United Kingdom.
Lower capital/labor ratios in France and Germany may contribute to their lower labor productivity relative to the United States in pharmaceutical^.^' Capital formation per employee in pharmaceuticals, relative to the United States, is 57 percent for France, 49 percent for Germany, and 99 percent for the United Kingdom (table 13.11). By contrast, capital formation per employee for total manufacturing relative to the United States is 125 percent in France, 84 percent in Germany, and only 65 percent in the United Kingdom. For Ger- many, whereas capital formation per employee in total manufacturing has in- creased relative to the United States (from 61 percent in 1975 to 84 percent in 1990), for pharmaceuticals the trend is reversed, dropping from 79 percent of the U.S. level in 1975 to 40 percent in 1988 and 49 percent in 1989. These results are consistent with the hypothesis that pharmaceutical investments have been diverted from Germany to other European Union countries.
13.4.6 R&D
Table 13.12 reports estimates of R&D expenditures, using survey data from pharmaceutical trade associations (Centre for Medicines Research 1993). R&D expenditures in constant local currency units have grown most rapidly in the United States, both absolutely and relative to labor, and most slowly in Germany since the mid-1980s. R&D investment per employee is roughly twice as high in the United States as in other countries (table 13.12, panel C ) . As noted earlier, country-specific R&D stocks cannot be directly calculated from R&D investment flows because of lags in launch and international diffusion. However, assuming that R&D stocks are positively correlated with investment flows, these data suggest that stocks of unobserved R&D capital are significant and are probably larger in the United States than in other countries.
13.5 Multifactor Productivity Growth
Estimates of multifactor productivity growth require measures of output elasticities. As discussed earlier, the conventional use of factor shares as prox-
31. We compare capital formation rather than the estimated capital stock per employee because the capital stock estimates depend on the assumed life of capital for which we have no accurate data. With our base-case assumption of a ten-year life of capital in all countries, the capital forma- tion and capital stock estimates are highly correlated.

Table 13.11 Gross Fixed Capital Formation per Employee, 1975-90, Relative to the United States" (GDP PPP conversion; United States = 100)
1975 1980 1981 1982 1983 1984 1985 1986 1987 1988 1989 1990
France Total manufacturing Other chemicals Drugs & medicinesb.' Drugs & medicines
Germany Total manufacturing Other chemicalsb Drugs & medicines' Drugs & medicines
(including Puerto Rico)b,c
(including F'uerto Rico)"
Italy Total manufacturing Other chemicals Drugs & medicinesc Drugs & medicines
(including Puerto Rico)"
United Kingdom Total manufacturing Other chemicals Drugs & medicinesb.' Drugs & medicines
(including Puerto Rico)b,c
79.9 68.4 . . .
. . .
61.1 66.0 . . .
. . .
118.3 . . . . . .
. . .
53.6 57.4 93.1
. . .
85.4 59.3 40.8
. . .
67.4 67.1 62.1
. . .
114.9
. . .
. . .
50.6 57.4 97.2
. . .
77.1 60.7 42.0
. . .
60.6 57.4 59.9
. . .
99.4
. . .
. . .
40.3 48.4
106.7
. . .
75.8 54.7 45.1
43.2
57.8 47.6 48.8
46.8
94.7
. . .
. . .
42.1 44.5 77.0
73.9
95.3 66.0 45.6
. . .
77.2 57.5 60.2
. . .
111.9
. . .
. . .
57.4 52.9 88.5
. . .
90.1 57.8 40.0
. . .
69.3 54.8 52.5
. . .
111.9
. . .
. . .
61.9 51.3 77.6
. . .
91.8 63.7 45.3
. . .
70.4 62.7 53.9
. . .
94.3
. . .
. . .
64.7 65.5
105.3
. . .
111.5 77.6 60.1
. . .
85.4 78.3 67.9
. . .
110.0
. . .
. . .
71.5 70.0
123.1
. . .
112.0 59.3 54.8
51.8
83.1 62.8 53.9
51.0
114.7
. . .
. . .
71.1 57.4 96.5
91.2
129.8 71.6 48.8
. . .
87.7 57.9 40.1
. . .
128.1
. . .
. . .
77.7 52.7 96.7
...
117.1 66.8 50.4
. . .
80.4 61.9 43.1
. . .
117.8
. . .
. . .
70.5 52.5 88.4
...
124.5 78.6 57.0
. . .
84.3 64.0 48.8
. . .
. . .
. . .
. . .
65.3 52.6 99.2
...
"Gross fixed capital formation is national accounts-compatible gross fixed capital formation (land, buildings, machinery, and equipment). bFigures are survey-based data and may not be national accounts compatible. bEmployment figures are survey-based data and may not be national accounts compatible.

Table 13.12 Growth in Drugs and Medicines R&D
1981 1982 1983 1984 1985 1986 1987 1988 1989 1990 1991
Total R&D expendituresa,b France Germany Italy United Kingdom United States
R&D per Employeeb,' France Germany Italy United Kingdom United States
R&D per employee, relative to the United Statesc"
France Germany Italy United Kingdom United States
100.0 111.2 120.9 133.9 149.8 154.2 176.0 184.0 203.5 218.3 201.6 100.0 102.5 119.0 139.9 165.1 168.8 159.6 150.9 158.1 174.5 188.2 100.0 106.0 108.3 107.1 124.5 130.6 149.7 169.2 194.8 208.6 217.6 100.0 105.6 119.9 131.2 143.6 156.9 155.5 184.2 200.8 210.1 220.6 100.0 114.8 129.8 139.5 153.2 171.6 194.0 217.3 239.9 254.4 276.2
100.0 110.6 118.7 129.8 143.6 146.5 168.1 173.4 185.6 192.9 181.0 100.0 101.1 117.3 135.5 160.1 159.7 150.2 140.0 147.8 155.9 161.7 100.0 106.7 111.8 108.3 128.2 133.1 150.4 163.7 186.7 199.8 . . . 100.0 107.5 123.2 134.7 149.6 161.0 152.9 177.7 183.6 193.2 . . . 100.0 117.6 131.3 142.1 158.8 175.7 191.8 211.1 221.6 236.4 . . .
63.2 59.4 57.0 57.3 56.6 52.1 54.7 51.3 52.2 50.8 . . . 77.4 66.3 69.0 73.3 77.5 69.9 60.1 50.9 51.2 50.7 . . . 49.3 44.7 41.9 37.4 39.5 37.0 38.2 37.8 41.1 41.1 . . . 66.6 60.5 62.8 62.4 62.1 60.8 52.9 56.3 54.9 54.2 . . .
100.0 100.0 100.0 100.0 100.0 100.0 100.0 100.0 100.0 100.0 . . .
"R&D data from national trade associations (Center for Research in Medicines 1993). 'GDP deflator adjusted values; 1981 = 100. 'Number of employees for France, Italy, the United Kingdom, and the United States are survey-based data and may not be national accounts compatible. dGDP PPP conversion; United States = 100.

406 Patricia M. Danzon and Allison Percy
ies for output elasticities for pharmaceuticals is potentially biased for several reasons. First, patent protection could lead to prices that exceed long-run mar- ginal cost (including a competitive return to R&D), in which case factor shares of revenue or value added would be downwardly biased estimates of output elasticities (Hall 1988, 1990). On the other hand, if regulation constrains prices below long-run marginal cost, revenue-based factor shares will exceed output elasticities. Second, factor shares are upwardly biased measures of output elas- ticities for labor or physical capital if price regulation induces excessive factor inputs (see eq. [2”]). Third, if the output elasticity for physical capital is esti- mated as the complement of the labor share, this estimate will be upward bi- ased since it includes the unmeasured returns to the stock of intangible R&D capital, and MFP growth will be downward biased. Assume that there is no bias in prices, that both the stock of intangible capital M and its return s, are unobserved, and that s, is estimated as 1 - sL. In that case, the Solow residual reflects conventional TFP plus the contribution of this unobserved input:
Q - s ,L- S K K = A + S M M .
Since R&D investments are the main source of technical change in this indus- try, distinguishing between production function shifts due to A and M is con- ceptually problematic as well as infeasible given the data.
To illustrate the severity of potential measurement bias, table 13.13 reports revenue-based and cost-based estimates of factor shares for labor and physical capital. Labor share s, is labor compensation divided by either value added (revenue based) or estimated total variable cost (cost based). The first estimate of the share of capital sK is a residual income measure (1 - sL ). The second estimate of s, is a cost-based estimate of the rental cost of capital, (p + 6)K. The real cost of funds p is assumed to be 10 percent, and the depreciation rate 8 is also assumed to be 10 percent, assuming a ten-year life of capital.32
The revenue-based factor shares imply a much larger share of labor in France (71-92 percent, depending on the price deflator for value added), com- pared to 23-29 percent for the labor share in the United States, 30-36 percent in the United Kingdom, and 43 percent in Germany. The cost-based estimates are much closer, ranging from 82 percent in the United States to 86 percent in France. The two alternative estimates of s, are fairly similar for France. However, for other countries, the residual income measure of s, exceeds the rental cost measure; for the United States, this difference is greatest (77 vs. 5 percent). The difference presumably reflects the ex post return to unob- served R&D capital and other unmeasured services, including contractual pay- ments for R&D services and license fees that are appropriately subsumed into
32. Strictly, the rental price of capital reflects tax offsets as well as the real cost of funds and the depreciation rate (Hall 1990). Since we lack countryspecific data on tax offsets, these are ignored here. Myers and Shyam-Sunder (1996) estimate beta of roughly one and a real cost of capital of 9.9-10.7 percent for the period 1980-90. This is consistent with previous estimates (Grabowski and Vernon 1990).

Table 13.13 Share of Labor and Capital
Value-Added-Based Shares Cost-Based Sharesd
Labor Share (sL)* Capital Share ( s ~ , ) ~ Capital Share (s& Share of Labor (SJ Share of Capital ( s d '
1976-80 1981-85 1986-90 1976-80 1981-85 1986-90 1976-80 1981-85 1986-90 1976-80 1981-85 1986-90 1976-80 1981-85 1986-90
France Total manufacturing Chemical products Drugs & medicines
PPI-drugs
Germany Total manufacturing Chemical products Drugs & medicines
PPI-drugs
Italy Total manufacturing Chemical products Drugs & medicines
P P I - d ru g s
.66 .69 .62 .34 .3 1 .38 .26 .27 .26 .72 .72 .70 .28 .28 .30
.46 .5 1 .44 .54 .49 .56 .29 .31 .27 .62 .62 .62 .38 .38 .38
.94 .94 .92 .06 .06 .08 .12 .19 .20 .88 .83 .82 .12 .17 . I8
. . . 3 4 .7 1 . . . .16 .29 . . . .17 .16 . . . .83 .82 . . . .17 .18
.66 .69 .67 .34 .3 1 .33 .21 .22 .2 1 .76 .76 .76 .24 .24 .24 s o .54 .55 S O .46 .45 .24 .23 .22 .68 .70 .71 .32 .30 .29 .48 .46 .43 .52 .54 5 7 .20 .18 .16 .70 .72 .73 .30 .28 .27 . . . .46 .43 ... .54 .57 ... .18 .16 . . . .72 .73 . . . .28 .27
.60 .51 .54 .40 .43 .46 .37 .37 .34 .62 .61 .62 .38 .39 .38
.64 .58 .55 .36 .42 .45 .93 .I5 .52 .41 .43 .52 .59 .57 .48 . . . . . . . . . . . . . . . . . .
... . . . ... . . . . . . . . . . . . . . . . . . . . . . . . . . . . . .
(continued)

Table 13.13 (continued)
Value-Added-Based Shares Cost-Based Sharesd
Labor Share (sL)' Capital Share (sJ' Capital Share ( s ~ ) ~ Share of Labor ( s ~ ) ~ Share of Capital ( s ~ ) ~
1976-80 1981-85 1986-90 1976-80 1981-85 1986-90 1976-80 1981-85 1986-90 1976-80 1981-85 1986-90 1976-80 1981-85 1986-90
United Kingdom Total manufacturing Chemical products Drugs & medicines
PPI-drugs
United States Total manufacturing Chemical products Drugs & medicines
PPI-drugs
.78 .77 .72 .22 .23 .28 .25 .27 .24 .76 .74 .75 .24 .26 .25
.72 .7 1 .66 .28 .29 .34 .44 .46 .37 .62 .6 1 .64 .38 .39 .36
.36 .38 .36 .64 .62 .64 .19 .20 .I8 .65 .66 .67 .35 .34 .33
. . . .36 .30 . . . .64 .70 . . . .19 .15 . . . .66 .67 . . . .34 .33
.71 .72 .68 .29 .28 .32 .2 1 .23 .22 .77 .75 .76 .23 .25 .24
.59 .57 .50 .41 .43 .50 .a .37 .29 .60 .61 .63 .40 .39 .37
.30 .27 .23 .70 .73 .77 .I1 .11 .09 .73 .72 .7 1 .27 .28 .29
. . . .29 .29 . . . .71 .7 1 . . . . l l .12 ... .72 .7 1 . . . .28 .29
"sL = UQ where L = labor compensation (real), Q = value added (real). bs,, = 1 - sL.
"s, = K(r + d)lQ where K = capital stock (real), r = real cost of funds 10 percent, and d = depreciation rate 10 percent. Total cost = L + K(r + d). 'sL = U[L + K(r + 41. %K(r + d)l[L + K(r + 41.

409 Price Regulation and Productivity in Pharmaceuticals
R&D.33 Note that, using the more appropriate rental cost of capital, the shares of labor and physical capital sum to more than one in France, implying a nega- tive return to intangible capital, whereas the sum of these shares is 52 percent or lower in all the other countries.
Table 13.14 reports estimates of total factor productivity growth for 1975- 90, with alternative factor share proxies for output elasticities. The results are very sensitive to the price deflator and, to a lesser extent, to the estimates of output elasticity. Using the GDP deflator for value added, TFP growth in France is lower than in total manufacturing in France and much lower than pharmaceuticals in the United States or the United Kingdom. In other coun- tries, TFP growth is higher in pharmaceuticals than in total man~facturing.~~ Using the PPI-drugs estimates of value added reverses the conclusions for France and the United States.
13.6 Conclusions
This paper has demonstrated some of the problems in estimating productiv- ity growth and cross-national comparisons for an industry such as pharmaceu- ticals, which has a high rate of investment in R&D that is subject to cross- national diffusion, hence large stocks of unmeasured, intangible capital and a high rate of technological change. In addition, the pharmaceutical industry is subject to price regulation and safety and efficacy regulation; as a result, prices and product mix differ significantly across countries. Country-specific rates of price change, as measured by either the official PPI-drugs or our Divisia in- dexes, diverge significantly from economywide inflation. These two drugs- specific price indexes are more similar to each other than either is to the GDP deflator; however, they differ by enough to make estimates of productivity growth extremely tentative. The divergence of pharmaceutical prices cross- nationally means that the GDP PPPs do not provide an accurate basis for cross- national productivity comparisons. The drugs-specific Fisher price indexes used here are more accurate but are also imperfect.
Because of these measurement problems, conclusions on the cross-national comparisons are tentative. The evidence is generally consistent with the hy- pothesis that labor productivity is lower in the French pharmaceutical industry than in the French manufacturing sector generally, as predicted by the theory that biased regulation leads to excessive input use and suboptimal productivity. The relatively large market share of local drugs, which may have lower produc- tivity than global drugs, may be a contributing factor. For the United Kingdom, although capital investment has been very rapid, TFP growth in pharmaceuti-
33. Cocks (1974) estimates that sL = 0.6 and sK = 0.4 for a single U.S. firm for the period 1967-71, before adjusting for R&D; these are both revised to 0.5 after netting out labor that is devoted to R&D.
34. Unfortunately, TFP estimates are not available for Italy because data on labor compensation and capital are unavailable.

Table 13.14 Growth in Value Added, Number Employed, Capital Stock, and Total Factor Productivity (percentage changes)
% Change in Total Factor Productivity
Value-Added-Based Shares
Value Added Number Employed Capital Stock With sKIS With sXp Cost-Based Shares
1976-85 1981-90 1976-85 1981-90 1976-85 1981-90 1976-85 1981-90 1976-85 1981-90 1976-85 1981-90
France Total manufacturing Chemical products Drugs & medicines
PPI-drugs
Germany Total manufacturing Chemical products Drugs & medicines
PPI-drugs
Italy Total manufacturing Chemical products Drugs & medicines
PPI-drugs
-4.0 -4.6 18.9 . . .
- .6 2.5
12.7
-3 - 1.6 17.2
8.4 -9.7 17.4 -8.0 17.3 3.9 36.6 3.9
11.6 -4.6 11.5 1.3 21.9 2.9 24.9 2.9
5.7 -1.7 20.0 -11.8 10.0 -1.5 19.2 -1.5
-9.6 -3.4
5.7 5.7
1.4 6.8 5.8 5.8
-6.2 3.9 3.5 3.5
1.4 5.5 3.0 3.2
80.1 28.3 . . . 28.3
4.4 8.5 - .9 5.6 1.3 6.6
. . . 6.6
- .5 -4.1 -20.6 -17.9 . . . . . . . . .
2.1 -2.3 10.4
1.0 2.3
10.7 . . .
3.9 13.6
12.8 2.2 13.2 17.3 -1.6 18.0 10.1 2.6 6.5 25.6 . . . 21.6
8.0 1.6 8.9 5.2 2.1 6.5
15.6 11.1 18.2 18.6 . . . 21.2
11.0 3.9 10.6 25.6 23.0 29.0
. . . . . . ..
2.6 13.6 -.8 18.3 4.1 7.7
... 26.9
1.9 8.5 1.9 5.0
10.3 15.9 ... 18.9
4.1 11.1 15.3 27.5
. .

United Kingdom Total manufacturing Chemical products Drugs & medicines
PPI-drugs
United States Total manufacturing Chemical products Drugs & medicines
PPI-drugs
- 12.5 13.1 -8.7 26.2 15.3 40.8 . . . 62.1
-2.3 7.1 7.6 19.8
19.4 37.6 . . . 13.2
-20.7 - 17.9 -1.3 -1.3
-4.5 - .9 2.8 2.8
-6.4 -1.4
6.5 6.5
.4 3.5 5.4 5.4
-3.8 1.1 -4.6 .2 18.2 25.3
. . . 25.3
7.0 .6 1.7 -5.8
15.1 19.3 . . . 19.3
4.4 17.6 4.5 17.6 5.5 27.1 6.2 27.1 4.3 22.4 12.2 33.8
... 42.8 . . . 55.9
-1.1 6.6 -.7 6.7 7.4 20.6 7.4 19.8 7.8 21.7 16.9 34.4
. . . 2.1 . . . 9.4
4.0 17.6 4.1 27.0 9.8 28.0
. . 49.3
- .6 6.7 7.4 19.9
13.2 28.3 . . 3.9
Nore: Percentage changes for 1976-85 are between the mean values for the two five-year periods 1976-80 and 1981-85. Percentage changes for 197690 are between the mean values for the two five-year periods 1981-85 and 1985-90.
'sXI = 1 - sL, where sL = UQ, where L = labor compensation (real), Q = value added (real). 's, = K(r + dYQ, where K = capital stock (real), r = real cost of funds 10 percent, and d = depreciation rate 10 percent.

412 Patricia M. Danzon and Allison Percy
cals is as high as in the United States and higher than in other manufacturing in the United Kingdom. Value added per employee, relative to the United States, is higher for pharmaceuticals in the United Kingdom than for other manufacturing. One plausible explanation is that rate-of-return regulation in the United Kingdom has permitted high returns to R&D investments and that any tendency for excessive investment has therefore been in more productive forms of capital.
Appendix A Data Sources and Dejinitions
The primary source for this analysis is the OECD’s 1994 Structural Analysis (STAN) industrial database. STAN draws on the OECD’s Industrial Structure Statistics (ISIS) and four other databases, using national accounts-compatible data where available, supplemented by other industrial surveys. For the four- digit drugs and medicines category, the data for most countries are from indus- trial surveys, so strict comparability across countries is not assured. The R&D data from national trade associations may also not be strictly comparable.
Variable Definitions
Production. National accounts-compatible production (gross output), at producer prices, excluding VAT.
Value added. Gross output, less the cost of materials, fuels, electricity, and other supplies, contract and commission repair, and maintenance work done by others.
Exports. From the OECD’s Compatible Trade and Production database, which contains flows by ISIC revision 2 category. It has been converted from the Standard International Trade Classification (SITC) using a converter devel- oped by the OECD. These trade data are compatible across countries but may not be strictly comparable to trade flows published in other sources. Values f.0.b.
Imports. See exports. Values c.i.f. Employees (number engaged). Annual average number of workers, full-time
and part-time, including employees, self-employed, owner-proprietors, and un- paid family members. For France, data are from SNIP. The SNIP definition of the industry probably leads to downwardly biased counts of employees, com- pared to the STAN measures of production.
Grossfied capital formation. National accounts-compatible gross fixed cap- ital formation (land, buildings, machinery, and equipment). No data are re- ported for Italy for drugs and medicines.
Labor compensation. National accounts+ompatible labor costs, including wages and employers’ compulsory contributions to pension, medical care,

413 Price Regulation and Productivity in Pharmaceuticals
etc. This presumably omits voluntary employer contributions to pensions and health insurance in the United States and tax-financed medical care in the United Kingdom.
Research and development expenditures. National trade associations, as re- ported by Centre for Medicines Research (1993).
Appendix B Pharmaceutical Price Indexes
Fisher Index of Cross-National Price Differences
The methodology used to construct the Fisher indexes is described in Dan- zon and Kim (1998). Although that study pertains to cardiovascular drugs only, the same methods are applied to all therapeutic categories for the indexes used here. The indexes include all single-molecule drugs that are available in phar- macies in both the United States and the other country under comparison. Products are designated as matching across countries if they have the same active ingredient (molecule) and are in the same therapeutic category.
For each pair of countries, we computed four indexes: using U.S. quantity weights and foreign quantity weights and using price per gram of active ingre- dient and price per standard unit (a tablet or capsule etc.) as the unit of mea- surement. For each pricing measure-per gram or per standard unit-the Fisher indexes are the geometric mean of the indexes based on U.S. and for- eign weights. Here, we use the arithmetic average of these two Fisher indexes. The Fisher index is transitive and has other desirable theoretical properties (Diewert 1981).
Although these indexes provide a more accurate measure of relative prices than GDP PPPs, they are not perfect measures of pharmaceutical prices for several reasons. First, the price data for the United States overstate true transac- tions prices to manufacturers owing to omission of discounts and rebates, par- ticularly in the most recent years. Second, because the cross-national indexes necessarily include only products that are available in both of the two coun- tries, this may introduce bias if prices for these matching, global drugs are not representative of all drug prices. To the extent that regulation is biased against the global products that are included, either because they are produced dispro- portionately by foreign firms or because they have high potential prices or vol- umes, these indexes based only on matching products may understate overall price levels in countries with price regulation. If so, use of these indexes will lead to upwardly biased estimates of the U.S. dollar value of production in price-regulated countries.35
35. We use weights based on the sample included in the indexes rather than reweighting to reflect shares in overall drug consumption (van Ark and Pilat 1993). Such reweighting implicitly assumes that included products are representative of all products, which may not be true for

414 Patricia M. Danzon and Allison Percy
Divisia Price Indexes
The methodology used to construct the country-specific Divisia indexes is described in Danzon and Kim (1996). The sample includes all single-molecule drugs sold through retail pharmacies. The unit of observation is the standard unit for the molecule. Chained weights permit the incorporation of new com- pounds in their second year on the market. Line extensions and generic forms of existing molecules are incorporated in their first year on the market. The indexes for the United States are upwardly biased to the extent that discounts and rebates, which are omitted, have become more prevalent over time.
References
Averch, H., and L. L. Johnson. 1962. Behavior of the firm under regulatory constraint. American Economic Review 52, no. 5:1052-69.
Barral, P. E. 1995. Twenty years of pharmaceutical research results throughout the world. Antony: Rh6ne-Poulenc Rorer.
Berndt, E. R., and M. A. Fuss. 1986. Productivity measurement with adjustments for variation in capacity utilization and other forms of temporary equilibrium. Journal of Econometrics 33:7-29.
Berndt, E. R., and P. Greenberg. 1996. An updated and extended study of the price growth of prescription pharmaceutical preparations. In Competitive strategies in the pharmaceutical industv, ed. R. B. Helms. Washington, D.C.: American Enterprise Institute Press.
Berndt, E. R., Z. Griliches, and J. G. Rosett. 1993. Auditing the producer price index: Micro evidence from prescription pharmaceutical preparations. Journal of Business and Economic Statistics 11, no. 3:251-64.
Berndt, E. R., and D. M. Hesse. 1986. Measuring and assessing capacity utilization in the manufacturing sectors of nine OECD countries. European Economic Review 30:961-89.
Burstall, M. A. 1991. Europe after 1992: Implications for pharmaceuticals. Health Af- fairs 10, no. 3:157-71.
Burstall, M. A., and B. G. Reuben. 1988. The cost of non-Europe in the pharmaceutical industry. Economists Advisory Group. Luxembourg: Commission of the European Communities, Office of Publications.
Centre for Medicines Research. 1993. Trends in worldwide pharmaceutical R&D ex- penditure for the 1990s. Carshalton.
Cocks, D. L. 1973. The impact of the 1962 drug amendments on R&D productivity in the ethical pharmaceutical industry. PhD diss., Oklahoma State University.
. 1974. The measurement of total factor productivity for a large U.S. manufac- turing corporation. Business Economics 9, no. 4 (September): 7-20.
. 198 1. Company total factor productivity: Refinements, production functions and certain effects of regulation. Business Economics 16, no. 3 (May): 5-14.
drugs. Moreover, since the indexes reflect over 50 percent of sales in all countries (and over 80 percent in the United States and the United Kingdom), the case for reweighting is weaker here than in the van Ark and Pilat study, where the unit value ratios reflected less than 25 percent of sales in all countries.
415 Price Regulation and Productivity in Pharmaceuticals
Comanor, W. S. 1965. Research and technical change in the pharmaceutical industry. Review of Economics and Statistics 47: 182-90.
Cutler, D. M., M. McClellan, J. P. Newhouse, and D. Remler. 1996. Are medical prices declining? Working Paper no. 5750. Cambridge, Mass.: National Bureau of Eco- nomic Research.
Danzon, P. M., and L. W. Chao. 1999. Cross national differences in pharmaceutical prices: How large, and why? Working paper. University of Pennsylvania, Wharton School.
Danzon, P. M., and J. Kim. 1996. Price indexes for pharmaceuticals: How accurate are international comparisons? Working paper. University of Pennsylvania, Wharton School, Health Care Systems Department.
. 1998. International price comparisons for pharmaceuticals: Measurement and policy issues. Pharmacoeconomics 14, suppl. 1: 115-28.
Danzon, P. M., and H. Liu. 1996. Reference pricing and physician drug budgets: The German experience in controlling pharmaceutical expenditures. Working paper. Uni- versity of Pennsylvania, Wharton School, Health Care Systems Department.
Diewert, W. E. 1981. The economic theory of index numbers: A survey. In Essays in the theory and measurement of consumer behavior in honor of Sir Richard Stone, ed. A. Deaton. London: Cambridge University Press.
DiMasi, J. A., N. R. Bryant, and L. Lasagna. 1991. The cost of innovation in the phar- maceutical industry. Journal of Health Economics 10: 107-42.
Grabowski, H. G., and J. M. Vernon. 1990. A new look at the returns and risks to phar- maceutical R&D. Management Science 36:804-21.
Griliches, Z., and I. Cockburn. 1996. Generics and new good in pharmaceutical price indexes. In Competitive strategies in the pharmaceutical industry, ed. R. B. Helms. Washington, D.C.: American Enterprise Institute Press.
Hall, R. E. 1988. The relation between price and marginal cost in U.S. industry. Journal of Political Economy 96:921-47.
. 1990. Invariance properties of Solow's productivity residual. In Growth, pro- ductivity and employment: Essays to celebrate Bob Solow's birthday, ed. Peter Dia- mond. Cambridge, Mass.: MIT Press.
Hancher, L. 1990. Regulating for competition: Government, law, and the pharmaceuti- cal industry in the United Kingdom and France. Oxford: Clarendon.
Healy, B. 1995. Competition and regulation in health system reform: The experience with pharmaceuticals. Paper presented at OECD Business and Industry Advisory Committee conference, Paris, May.
Myers, S. C., and L. Shyam-Sunder. 1996. Measuring pharmaceutical industry risk and the cost of capital. In Competitive strategies in thepharmaceutical industry, ed. Rob- ert B. Helms. Washington, D.C.: American Enterprise Institute Press.
Peltzman, S. 1973. An evaluation of consumer protection legislation: The 1962 drug amendments. Journal of Political Economy 81, no. 5: 1049-91.
Remit Consultants. 1991. Cost containment in the European pharmaceutical market: New approaches. Final report prepared for the Pharmaceutical Manufacturers Asso- ciation, London.
Syndical National de l'hdustrie Pharmaceutique (SNIP). 1993. The realities of the pharmaceutical industry in France. Paris.
Thomas, L. G. 1990. Regulation and firm size: FDA impacts on innovation. RAND Journal of Economics 21, no. 4:497-517.
. 1992. Price regulation industry structure and innovation: An international com- parison of pharmaceutical industries. PharmacoEconomics 1, suppl. 1:9-12.
. 1996. Industrial policy and international competitiveness in the pharmaceutical industry. In Competitive strategies in the pharmaceutical industry, ed. R. B. Helms. Washington, D.C.: American Enterprise Institute Press.
U.S. Bureau of Labor Statistics. 1994. International comparison of manufacturing pro-

416 Patricia M. Danzon and Allison Percy
ductivity and unit labor cost trends, 1993. News Release USDL:94-403. Washington, D.C., 17 August.
U.S. Congressional Budget Office. 1994. How health care reform affects pharmaceuti- cal R&D. Washington, D.C.
van Ark, B., and D. Pilat. 1993. Productivity levels in Germany, Japan and the United States: Differences and causes. Brookings Papers on Economic Activity: Microeco- nomics, no. 2: 1-69.
Comment Ernst R. Berndt
Over the last few years, Patricia Danzon has contributed significantly to our empirical understanding of intercountry price comparisons for prescription pharmaceuticals and of the difficulties in interpreting differentials. In this pa- per, Danzon and Percy extend this price research in a different direction- analyzing the effects of differential price regulation among countries on the productivity of domestic pharmaceutical operations.
There are a great deal, indeed, almost an overabundance, of empirical find- ings in this paper; the paper includes, for example, fourteen tables summariz- ing detailed calculations. This is also an ambitious paper for it falls in between two traditional genres of international comparison studies-one very aggre- gated at perhaps the national or sectoral level and the other much more de- tailed, almost at the case-study level of specificity. Danzon and Percy pursue a middle ground, conducting an international comparison of the pharmaceutical industry among five countries: France, Germany, Italy, the United Kingdom, and the United States.
Drawing on the theory of regulation, Danzon and Percy structure their paper by outlining hypotheses that are then examined empirically. Specifically, Dan- zon and Percy hypothesize that price regulation biases upward levels of labor intensity (reduces average labor productivity), that price regulation also biases upward levels of capital intensity (reduces average capital productivity), and therefore that price regulation reduces levels of multifactor (capital and labor) productivity (MFP). Whether price regulation has a differential effect on capi- tal than on labor is also considered; to the extent that the United Kingdom has price regulation that is more like traditional rate-of-return regulation, Danzon and Percy conjecture and find some evidence tending to suggest that the U.K. productivity is more capital biased than labor biased. Finally, although Danzon and Percy are somewhat silent on this, their hypotheses and expectations ap- pear to refer more to levels of productivity than to their growth rates.
The data used in this paper come from several sources. Aggregate employ- ment, capital formation, and revenue data are taken from OECD-STAN (which
Ernst R. Berndt is professor of applied economics at the Sloan School of Management, Massa- chusetts Institute of Technology, and a research associate of the National Bureau of Economic Re- search.

417 Price Regulation and Productivity in Pharmaceuticals
may not be consistent with national income and product account data), as are aggregate GDP PPP data series; country-specific aggregate producer price indexes for pharmaceuticals are also drawn from OECD sources. However, Danzon and Percy have also undertaken a painstaking set of calculations to compute bilateral price comparisons for literally thousands of drugs (chem- ical compounds, not just brands) that are sold in both countries, for each pair of bilateral comparisons. This research has been reported on elsewhere. Finally, Danzon and Percy also address a difficult problem with U.S. data concerning offshore manufacturing in Puerto Rico.
Danzon and Percy find reasonable support for their hypotheses involving productivity levels for labor and capital, but the multifactor productivity (MFP) results, both in level and in growth-rate form, are much more ambigu- ous and in particular are found to depend critically on the choice of deflator.
In attempting to interpret Danzon and Percy’s findings, I would have found it useful had the paper contained a bit more discussion on three questions; these questions may have been addressed in other papers by Danzon.
First, what types of drug medications are produced in the five countries, and how does this composition vary among countries? What it is that constitutes a prescription drug, and what an over-the-counter product, can vary considerably across countries, except perhaps for psychotropic drugs. Do the countries dif- fer in the relative proportions of patent protected and generic drugs, or what variations are there in “world” and primarily local drugs? Is there a systematic difference in the proportion of herbal and homeopathic medications (more prevalent in Germany and the United Kingdom)? Finally, do pharmaceutical operations differ considerably among the five countries in terms of manufac- turing and (re)packaging? Although some of these issues are briefly noted, I would have found it helpful to have found a greater discussion of these issues as background to interpreting the observed productivity differentials.
Second, concerning the aggregate employment, capital formation, and reve- nue data by country, it is my impression that such data derive ultimately from establishment data and that what constitutes an establishment may differ across countries. In particular, in the United States, the establishment data taken from annual surveys of manufacturing refer only to production and manufacturing activities, not to central administrative and office (CAO) personnel. For the U.S. pharmaceutical industry, which is both research and development (R&D) and marketing intensive, the possible exclusion of CAO employees may have a critical effect on labor productivity findings. For example, how one interprets Danzon and Percy’s finding that the average number of employees per estab- lishment is about half as large in the United States as in France depends on what constitutes an establishment.
Third, some information on the size distribution of firms or establishments would also have been useful. Is the size distribution much more skewed in the United Kingdom and Italy than in the United States and France? How different are means from medians?
Let me now turn to some more specific comments. As always, MFP calcula-

418 Patricia M. Danzon and Allison Percy
tions depend on estimates of capital and labor shares. Danzon and Percy find substantial differences in MFF’ growth depending on whether one calculates the capital cost share using a residual property income notion or a measure of capital expenditures dependent on a rental price of capital.
Given that the MFP results are somewhat ambiguous and fragile, we might ask what else we know about manufacturing efficiency in the pharmaceutical industry. An MIT colleague in chemical engineering, Charles Cooney, has re- cently published results of a benchmarking study comparing manufacturing operations of pharmaceutical and biotech firms in several countries (see Cooney and Raju 1996). Cooney and Raju find significant variations among firms and countries, with one of the most significant sources of differences being practices involving inventories of chemical materials-while some firms follow “just-in-time” protocols, a surprising number instead appeared to fol- low the less efficient “just-in-case” practice. Unfortunately, Cooney and Raju cannot reveal the identities of the establishments and the countries in which they operate owing to confidentiality restrictions.
How else might one think of interpreting the productivity of pharmaceutical firms in various countries? One possible way is to compare them on the basis of the extent to which their products have worldwide markets or, related, on the basis of successful patent applications. While such comparisons could be informative, one should remember that, even within the United States, there are some very successful (in terms of stock price growth) pharmaceutical firms who have had few innovative new products. There are a variety of ways in which one might want to envisage productivity, and they could well be quite inconsistent with one another.
In summary, this paper brings into sharp focus the notions that international comparisons are quite difficult and are likely to render somewhat inconclusive findings when not all major differences can be properly taken into account. In the present context, Danzon and Percy are surely correct in noting that differ- ences in R&D among countries could have a significant effect on the interpre- tation of their results. It would be interesting to see if related problems emerge when other industries are compared across countries, such as the telecommuni- cations industry, which also has very high sunk costs and relatively small mar- ginal costs.
Reference
Cooney, Charles L., and G. K. Raju. 1996. “Benchmarking” pharmaceutical manufac- turing performance. Working paper. Massachusetts Institute of Technology, Program on the Pharmaceutical Industry, February.