the effects of pharmaceutical marketing and promotion on
TRANSCRIPT
University of Pennsylvania University of Pennsylvania
ScholarlyCommons ScholarlyCommons
Health Care Management Papers Wharton Faculty Research
11-2010
The Effects of Pharmaceutical Marketing and Promotion on The Effects of Pharmaceutical Marketing and Promotion on
Adverse Drug Events and Regulation Adverse Drug Events and Regulation
Guy David University of Pennsylvania
Sara Markowitz
Seth Richards-shubik
Follow this and additional works at: https://repository.upenn.edu/hcmg_papers
Part of the Health and Medical Administration Commons, and the Pharmacy Administration, Policy
and Regulation Commons
Recommended Citation Recommended Citation David, G., Markowitz, S., & Richards-shubik, S. (2010). The Effects of Pharmaceutical Marketing and Promotion on Adverse Drug Events and Regulation. Amrican Economic Journal: Economic Policy, 2 (4), 1-25. http://dx.doi.org/10.1257/pol.2.4.1
This paper is posted at ScholarlyCommons. https://repository.upenn.edu/hcmg_papers/68 For more information, please contact [email protected].

The Effects of Pharmaceutical Marketing and Promotion on Adverse Drug Events The Effects of Pharmaceutical Marketing and Promotion on Adverse Drug Events and Regulation and Regulation
Abstract Abstract This paper analyzes the relationship between postmarketing promotional activity and reporting of adverse drug reactions (ADRs) by modeling the interaction between a regulator (the FDA) and a pharmaceutical firm. Promotion-driven market expansions enhance profitability yet may involve the risk of inappropriate drug prescriptions, leading to regulatory actions against the firm. We empirically test the relationship between drug promotion and reporting of ADRs using an innovative combination of commercial data on pharmaceutical promotion and FDA data on regulatory interventions and ADRs. We provide some evidence that increased levels of promotion and advertising lead to increased reporting of ADRs for certain conditions.
Disciplines Disciplines Health and Medical Administration | Pharmacy Administration, Policy and Regulation
This journal article is available at ScholarlyCommons: https://repository.upenn.edu/hcmg_papers/68

1
American Economic Journal: Economic Policy 2 (November 2010): 1–25http://www.aeaweb.org/articles.php?doi=10.1257/pol.2.4.1
The market for pharmaceuticals is one of the most highly regulated markets in the nation. The US Food and Drug Administration (FDA) interacts with pharma-
ceutical manufacturers to ensure the safety and efficacy of drugs. The relationship between manufacturers and the FDA spans the lifecycle of drugs from pre-approval drug testing and development through post-approval activities. The interaction between the two that occurs in the pre-approval stage has received much attention in the literature (F. M. Scherer 2000). What is lacking is a thorough understanding of the post-approval interactions between manufacturers and the FDA. In this paper we study such interactions where a firm has to balance the profitable expansion of its product with the risk of future unfavorable regulatory actions. In particular, we emphasize the effects of advertising and promotion decisions by the firm, which while raising sales, may also trigger unfavorable regulatory actions against the firm due to the expansion of prescriptions to users who are poor matches for the drugs.
This project is motivated in part by recent, high profile safety lapses that led to severe regulatory actions against approved drugs.1 As a result, the Institute of
1 Between 1997 and 2005, eighteen drugs were withdrawn from the market, compared to only nine in the previ-ous twenty years (USFDA 2005). Many of these withdrawals were highly publicized. Also during this time period, numerous drugs in two major classes (NSAIDs and antidepressants) had black box warnings added to their labels.
*David: Health Care Management, The Wharton School, University of Pennsylvania, 202 Colonial Penn Center, 3641 Locust Walk, Philadelphia, PA 19104 (e-mail: [email protected]); Markowitz: Department of Economics, Emory University, Atlanta, GA 30322 (e-mail: [email protected]); Richards-Shubik: H. John Heinz, III College, Carnegie Mellon University, 5000 Forbes Ave., Pittsburgh, PA 15213 (e-mail: [email protected]). We are grateful to Patricia Danzon, Scott Harrington, Sean Nicholson, Mark Pauly, Stephen Propper, Steven Teutsch and participants at the second American Society of Health Economists meetings, the 2008 NBER Health Care Program meeting, and the 2008 annual meeting of the Southern Economic Association for helpful comments. Phil Saynisch provided exceptional research assistance. We would also like to acknowledge the Blanche and Irwin Lerner Center for Pharmaceutical Management Studies at the Rutgers University Business School for the IMS data. Financial support from the Merck Foundation to University of Pennsylvania is gratefully acknowledged.
† To comment on this article in the online discussion forum, or to view additional materials, visit the articles page at http://www.aeaweb.org/articles.php?doi=10.1257/pol.2.4.1.
The Effects of Pharmaceutical Marketing and Promotion on Adverse Drug Events and Regulation†
By Guy David, Sara Markowitz, and Seth Richards-Shubik*
This paper analyzes the relationship between postmarketing promo-tional activity and reporting of adverse drug reactions (ADRs) by modeling the interaction between a regulator (the FDA) and a phar-maceutical firm. Promotion-driven market expansions enhance prof-itability yet may involve the risk of inappropriate drug prescriptions, leading to regulatory actions against the firm. We empirically test the relationship between drug promotion and reporting of ADRs using an innovative combination of commercial data on pharmaceutical promotion and FDA data on regulatory interventions and ADRs. We provide some evidence that increased levels of promotion and adver-tising lead to increased reporting of ADRs for certain conditions. (JEL L51, L65, M31, M37)
ContentsThe Effects of Pharmaceutical Marketing and Promotion on Adverse Drug Events and Regulation† 1
I. A Model of Promotion and Safety 4A. Utility and Appropriateness 4B. Promotion and Demand 6C. Welfare and the Regulatory Process 7D. The Firm’s Problem 9E. Equilibrium and Predictions 10II. Empirical Estimation 12A. Data Sources 12B. Methodology 15III. Results 17IV. Conclusions 20Appendix A: Derivation of Modified Dorfman-Steiner Rule 22Appendix B: Equilibrium Predictions with Postmarketing Surveillance 23References 24

2 AmERicAN EcoNomic JouRNAL: EcoNomic PoLicy NovEmBER 2010
Medicine published a series of policy recommendations (Alina Baciu, Kathleen Stratton, and Sheila P. Burke 2007) to improve the oversight abilities of the FDA. These include a call for improvements in the postmarketing surveillance of prescrip-tion drugs and a recommendation for legislation to give the FDA new post-approval enforcement authority (Alina Baciu, Kathleen Stratton, and Sheila P. Burke 2007). The need for postmarketing surveillance is underscored by the inherent uncertainty that arises when a new drug enters the market. The randomized controlled trials, used by the FDA to approve new drug applications, are considered to be the gold standard for demonstrating the efficacy of drugs. However, the generalizability of these results to the “real world” is unclear since clinical trials do not encompass the uncontrolled, real-world conditions. Individuals represented in the clinical trials may be very different from those in the post-approval population, since these trials often exclude people with co-morbid conditions or who use other drugs concur-rently. The trials also tend to underrepresent elderly and ethnic minorities (Alina Baciu, Kathleen Stratton, and Sheila P. Burke 2007). Small sample sizes, and short-term exposure to the drugs in the trials, also make rare adverse events difficult to detect. Lastly, the implications of off-label use are unknown. Off-label use creates a “new” user population with a potentially different risk-benefit profile. All of these factors contribute to the limitations of clinical trials, and explain why the safety of drugs may still be in question even after they go through a rigorous approval process.
After receiving FDA approval, manufacturers have strong incentives to expand the population of users by advertising and promoting a new drug. The amount of money spent on such activities has been steadily increasing since the mid-1990s, with nominal expenditures rising from about $9.2 billion in 1996 to $27.7 billion in 2004 (Kaiser Family Foundation 2009). Promotional activities aimed at health professionals make up the bulk of expenditures, although the share of direct to con-sumer advertising (DTCA) has risen steadily over time. DTCA spending was $790 million in 1996 (8.6 percent of the total), and rose to $4.0 billion, 14.4 percent of total promotional spending, by 2004 (L. J. Sellers and Andra Brichacek 2001; Michael D. Lam 2004; Diane West 2007). Much of this growth can be attributed to new television and magazine advertising that emerged after the FDA changed the regulations regarding advertising in 1997.2
On the professional side, pharmaceutical companies’ promotional activities include detailing (meetings with sales representatives), gifts, free samples, trips to conferences, sponsorship of educational events, and advertising in medical journals (Joan Buckley 2004). It is unclear whether the informational benefits outweigh the potential for biased prescription practices (see Ashley Wazana 2000 for a complete review of this literature). John A. Rizzo (1999) and Frank Windmeijer et al. (2006) find that the presence of promotion reduces the price elasticity of demand for pre-scribed drugs, implying higher prices. In addition, Windemeijer et al. (2006) find
2 Prior to 1997, firms could either advertise the condition with no mention of the drug’s name, or advertise the drug’s name with no mention of the condition. These restrictions were lifted in 1997, allowing the firm to estab-lish a link between the drug advertised and the condition it treats, and hence to improve the effectiveness of their advertising.
voL. 2 No. 4 3DAviD ET AL.: PhARmAcEuTicAL mARkETiNg, PRomoTioN, sAFETy, AND REguLATioN
that promotion primarily expands market share, while Rizzo (1999) finds evidence that promotion expands the size of the market.
DTCA was found to be associated with increases in spending on prescrip-tions drugs, increased doctor visits, and increased prescribing rates (US General Accounting Office 2002; W. David Bradford et al. 2006; Toshiaki Iizuka and Ginger Zhe Jin 2005; Julie M. Donohue et al. 2004). But there are both pros and cons to the increased drug use. On the plus side, DTCA has the potential to edu-cate people about certain conditions, encourages them to seek professional help, and may result in the receipt of treatment that they otherwise would not have (A. Masson and P. H. Rubin 1985; Alan Lyles 2002; Blenda A. Chao 2005; Elizabeth A. Almasi et al. 2006). On the down side, the concern with DTCA is that the rapid uptake of new drugs may not necessarily be better than the use of existing drugs, and problems may arise when the new uptake is among patients who are not a good match for the drug (Richard L. Kravitz et al. 2005; Michele M. Spence et al. 2005). Because of the potential for mismatch, pharmaceutical advertising may be welfare decreasing when it expands the size of the market (Ernst R. Berndt 2007).3 Under the current US regulatory system, firms may be penalized for creat-ing a mismatch between patients and drugs on the basis of safety.4 Therefore, a firm has to balance the profitable expansion of its product with the risk of unfavor-able regulatory actions.
To capture this notion, our paper examines the incidence of adverse drug events associated with pharmaceutical promotion and advertising and their relation-ship with adverse events and regulatory action by the FDA. To do so, we present a newly developed theoretical framework that explicitly addresses the interaction between firms and their regulator, while incorporating the FDA’s problem of poor signal quality. This framework then guides an empirical analysis of adverse events, which examines two parts of the connection between pharmaceutical promotional activities and the FDA. The first seeks to measure the degree to which increases in reported adverse events lead to FDA actions. The second seeks to answer the ques-tion of whether increased levels of promotion lead to a worsening match of drugs with patients, and lead to increased reporting of adverse medical events. We study these relationships separately across four different medical conditions, because each provides important variation in disease prevalence, degree of generic competition, and the ability of patients and manufactures to influence physicians’ prescribing behavior.
There has been little previous research into the factors influencing the safety of drugs post approval, and much of this research has examined the influence of approval time on drug withdrawals (Nigel S. B. Rawson and Kenneth I. Kaitin 2003; Berndt et al. 2005), and adverse drug reactions (ADRs) that resulted in hospitaliza-tion and death (Mary K. Olson 2002; Niklas Rudholm 2004). This is the first study
3 When DTCA does not expand the market and only affects market shares, brand switching among consumers will be welfare enhancing when it improves the match. However, the current literature shows that DTCA is primar-ily market expanding (Narayanan et al. 2004; Iizuka and Jin 2005).
4 Note that when the regulatory system focuses on safety, firms have little incentive to improve the quality of the match on the basis of the benefit to patients.
4 AmERicAN EcoNomic JouRNAL: EcoNomic PoLicy NovEmBER 2010
to examine the interactions between pharmaceutical promotion (and advertising), ADRs, and regulatory actions.
The paper proceeds as follows: Section I presents a model of promotion and safety, in which a drug manufacturer chooses price and promotion, and a regula-tor chooses regulatory actions that may impact the demand for the drug. Section II describes the data and estimation, Section III discusses the results, and Section IV concludes.
I. A Model of Promotion and Safety
This model puts a theoretical foundation around the interactions between the FDA and pharmaceutical firms in terms of promotion and safety activities. Once a drug is approved for use, a welfare maximizing regulator (i.e., the FDA) and a profit maximizing drug manufacturer engage in a game. The FDA, having the power to recommend a withdrawal of a drug from the market (or reduce its demand through labeling restrictions and warnings), will offer the firm a scheme specifying regula-tory actions based on signals from persons taking the drug. The firm maximizes expected profits by expanding the number of prescriptions filled. The safety and benefit profile of people receiving the drug changes as demand for the drug expands. Demand is affected by promotional activities, which increase both revenues and the chance of a poor match between patients and the drug. A crucial aspect of the model is that regulation depends on distorted information about the utility impact of a drug, so we can analyze the effect of an overemphasis on drug safety as compared with the actual balance of safety and benefit.
We consider the simplest case, in which the firm is a monopoly, it produces only one drug (or the profits derived from different drugs are entirely separable), and the drug can treat only a single health problem. Under these assumptions the pro-motional activity taken by a firm has no effect on other firms. Hence, the relation-ship between the FDA and pharmaceutical firms can be reduced to an interaction between the agency and a single firm. In addition, we assume the FDA attempts to maximize welfare conditional on initially approving a drug.
We begin by specifying utility over two dimensions: safety and benefit. We relate this to a demand function for the drug which is mediated by physicians and influ-enced by promotional activities. We then turn to the FDA problem and derive the welfare maximizing regulatory rule, which relies on safety signals from persons taking the drug. The firm, in turn, chooses promotion to maximize expected profits incorporating the FDA’s regulatory rule. Unlike existing models of promotion under uncertainty, the firm’s choice of promotional activity affects the risk exposure to unprofitable regulatory interventions.
A. utility and Appropriateness
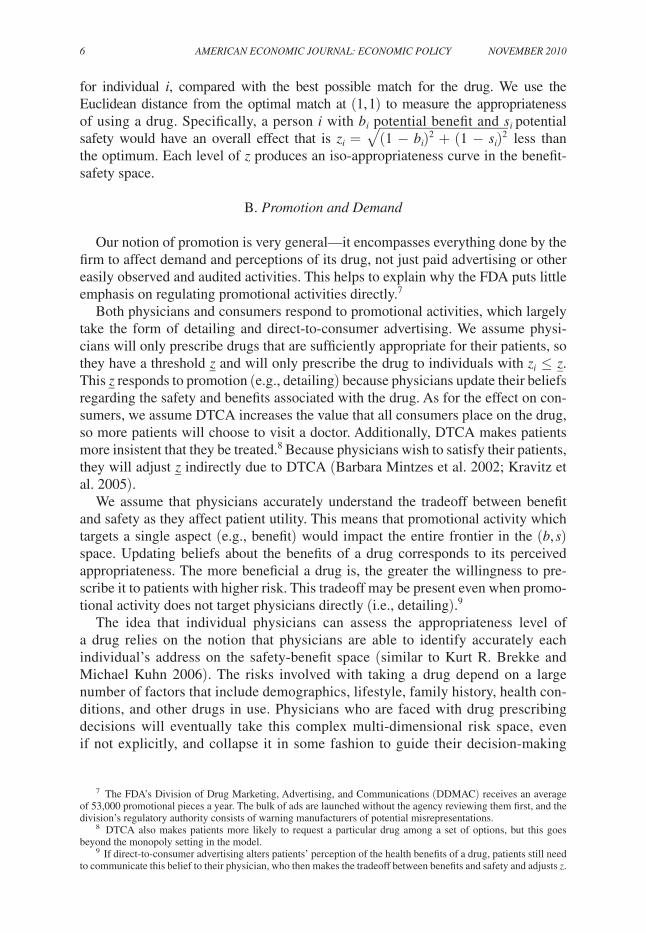
We model utility using a two-dimensional space of safety and benefit, as shown by Figure 1. The two dimensions allow for misaligned incentives or distorted infor-mation in the regulatory process, and in particular, address the difficult task faced by the FDA of balancing safety with efficacy when it considers regulatory actions. In

voL. 2 No. 4 5DAviD ET AL.: PhARmAcEuTicAL mARkETiNg, PRomoTioN, sAFETy, AND REguLATioN
the space, individuals are located throughout the unit square, meaning that the health benefit of a drug and its safety range from 0 to 1, with the point (1,1) representing the highest combination of benefit and safety attainable.5 Our measure of utility then comes from the concept of the “appropriateness” of a drug for an individual patient, which refers to an assessment of the balance between its potential risks and benefits to that patient. Appropriateness reduces the safety-benefit tradeoff to a single distance measure, so people with different positions in the space may have the same utility. For example, a sick but relatively fragile person who stands to benefit substantially from the drug, but has serious risk of harmful side effects or interac-tions (position B), could have the same expected utility as a more healthy person who also has the condition but would recover eventually without the drug (position C). Position A represents the same health benefit as position B, yet higher safety. Similarly, a person in A has the same safety level as one in C, yet higher health ben-efits. Therefore, we say that the drug is more appropriate for a person in position A than it is for either persons in positions B and C.
The utility for individual i taking the drug is u i = β – zi, where β is the value of the drug at the optimal match and can be thought of as the highest attainable utility from the drug.6 We normalize β to be between zero and one, so that no drug could benefit the entire population, even absent any safety concerns. zi is the difference in appropriateness
5 A person located at (1,1) will experience the maximum health benefits and minimal risk of an adverse reaction.6 β can be interpreted as the highest attainable benefit relative to other treatment options; however, in that case
this benefit might vary across patients with heterogeneous ranking of different therapeutic options.
Dru
g sa
fety
Health benefit
C A
B
1
1 (0,0)
z
z (1,1)
Figure 1. The Safety–Benefit Space for Patients
6 AmERicAN EcoNomic JouRNAL: EcoNomic PoLicy NovEmBER 2010
for individual i, compared with the best possible match for the drug. We use the Euclidean distance from the optimal match at (1, 1) to measure the appropriateness of using a drug. Specifically, a person i with bi potential benefit and si potential safety would have an overall effect that is z i = √
__ (1 − b i ) 2 + (1 − s i ) 2 less than
the optimum. Each level of z produces an iso-appropriateness curve in the benefit-safety space.
B. Promotion and Demand
Our notion of promotion is very general—it encompasses everything done by the firm to affect demand and perceptions of its drug, not just paid advertising or other easily observed and audited activities. This helps to explain why the FDA puts little emphasis on regulating promotional activities directly.7
Both physicians and consumers respond to promotional activities, which largely take the form of detailing and direct-to-consumer advertising. We assume physi-cians will only prescribe drugs that are sufficiently appropriate for their patients, so they have a threshold _ z and will only prescribe the drug to individuals with z i ≤ z _ .This _ z responds to promotion (e.g., detailing) because physicians update their beliefs regarding the safety and benefits associated with the drug. As for the effect on con-sumers, we assume DTCA increases the value that all consumers place on the drug, so more patients will choose to visit a doctor. Additionally, DTCA makes patients more insistent that they be treated.8 Because physicians wish to satisfy their patients, they will adjust _ z indirectly due to DTCA (Barbara Mintzes et al. 2002; Kravitz et al. 2005).
We assume that physicians accurately understand the tradeoff between benefit and safety as they affect patient utility. This means that promotional activity which targets a single aspect (e.g., benefit) would impact the entire frontier in the (b, s) space. Updating beliefs about the benefits of a drug corresponds to its perceived appropriateness. The more beneficial a drug is, the greater the willingness to pre-scribe it to patients with higher risk. This tradeoff may be present even when promo-tional activity does not target physicians directly (i.e., detailing).9
The idea that individual physicians can assess the appropriateness level of a drug relies on the notion that physicians are able to identify accurately each individual’s address on the safety-benefit space (similar to Kurt R. Brekke and Michael Kuhn 2006). The risks involved with taking a drug depend on a large number of factors that include demographics, lifestyle, family history, health con-ditions, and other drugs in use. Physicians who are faced with drug prescribing decisions will eventually take this complex multi-dimensional risk space, even if not explicitly, and collapse it in some fashion to guide their decision-making
7 The FDA’s Division of Drug Marketing, Advertising, and Communications (DDMAC) receives an average of 53,000 promotional pieces a year. The bulk of ads are launched without the agency reviewing them first, and the division’s regulatory authority consists of warning manufacturers of potential misrepresentations.
8 DTCA also makes patients more likely to request a particular drug among a set of options, but this goes beyond the monopoly setting in the model.
9 If direct-to-consumer advertising alters patients’ perception of the health benefits of a drug, patients still need to communicate this belief to their physician, who then makes the tradeoff between benefits and safety and adjusts z.

voL. 2 No. 4 7DAviD ET AL.: PhARmAcEuTicAL mARkETiNg, PRomoTioN, sAFETy, AND REguLATioN
process. For tractability, we assume that risk can be condensed into a single index, si. Our formulation rules out dynamic improvements in match quality by learning about the impact of risk factors.10
Moreover, absent from our model is the notion that promotion can be effectively tailored to subpopulations defined in terms of safety or benefit. Firms would ben-efit from switching a high benefit—high-risk individual with a low benefit—low risk individual, even when the drug is more appropriate for the former (i.e., replac-ing individual A in figure 1 with individual c). The reason is that the incentives provided by the regulator tracks safety closer than it tracks benefits. This behavior, that might be termed “defensive” tailoring, is consistent with both increasing the firm’s expected profits and decreasing social welfare. While the notion of ISO-appropriateness curves rules out defensive tailoring, it is important to notice that such tailoring of promotional activity would reduce the match quality even fur-ther as it leads to replacing sicker individuals, in need of treatment, with health-ier ones (i.e., lowering the average level of appropriateness). This highlights the regulatory problem of achieving incentive compatibility by relying on a single dimension—safety.11
For simplicity, we assume that demand function is given by α z _ ( p, A), where α is a parameter capturing market size for the drug, p is the price of the drug and A is the expenditure on promotional activities chosen by the firm. We make the standard assumption that z _ ( p, A) is concave in promotion, which has implications for the distribution of utility and the effectiveness of promotion.12 With regard to the effect of price on z _ ( p, A), we assume that physicians are perfect agents for their patients, and that they internalize the effect of price on consumer utility. An increase in price has two effects: the first is the usual lowering of the quantity demanded (through a reduction in the area under z _ ), the second is improving the average match (appro-priateness). This notion of conflicting welfare effects coincides with Nava Ashraf, James Berry, and Jesse M. Shapiro (forthcoming).
C. Welfare and the Regulatory Process
The regulatory goal is to maximize welfare, given by ∫0 z _ ([β − c] − z) f (z)dz ,
where c is the marginal cost and f (z) is the density of z in the population.13 In a
10 Learning over time, about the various risk factors for a specific drug, calls for repeated updating of each individual’s location on the benefit-safety space. However, for the purpose of our empirical analysis, this assump-tion is conservative insofar as any such learning will weaken the relationship between promotional activities and reporting of adverse events.
11 In a manner similar to “defensive” tailoring, warnings or restrictions on product labeling, which are common yet less severe regulatory actions, are represented by a safety level cutoff point, i.e., individuals with s < ̃ s will be advised not to use the drug (in this case the benefit dimension is not considered). Unlike withdrawal where the drug is removed from the market and patient access is blocked, labeling restrictions will not be totally effective so some fraction of people, θ, with s < ̃ s but z < z _ will still receive the drug. Interestingly, effective product labeling (i.e., small θ) could serve to shield the firm against drug withdrawals.
12 Because in general fewer people have a condition that is treated by a drug than not, the density of individuals with small zi (highly appropriate) would be less than those with large zi (poor match). Hence the density of individu-als would increase as zi increases. Therefore, for demand to be concave in promotion, it must become sufficiently more difficult to expand the frontier z _ to counter this increase in the density of potential consumers.
13 The resulting f (z) for the case that the distribution of individuals within the safety-benefit space is joint uniform is available from the authors.
8 AmERicAN EcoNomic JouRNAL: EcoNomic PoLicy NovEmBER 2010
perfect world, the regulator would observe the utility each user derives from the drug, i.e., β − zi, and take action against the firm if β − c < _ z .14 However, the FDA does not observe the universe of prescribing decisions made by physicians and, therefore, is unable to elicit and regulate on _ z . Instead, the FDA relies on adverse drug event reporting to produce a signal for regulatory actions. While this signal is imperfect, it is informative in that the probability of a bad signal increases as the appropriateness decreases.
The FDA relies primarily on the Adverse Event Reporting System (AERS) to generate this signal. The information coming from the AERS, regarding the appro-priateness of use, is noisy and bound to overemphasize safety. The FDA’s mission historically has been consumer protection from unsafe products, hence, the AERS is set up to receive reports of adverse events, not benefits. However, individuals are more likely to report an adverse reaction when the benefits from the drug are rela-tively small.15 Thus, the reporting propensity generated through the AERS involves both safety and benefit, but it constitutes a departure from the concept of appropri-ateness discussed earlier.16 For the purpose of maximizing consumer welfare, this can be viewed as a system design failure.
In addition to the noise resulting from the incorrect weighting of risks and ben-efits, the AERS also suffers from a potentially severe measurement error problem. Randomized clinical trials control for confounding factors, yet due to the small number of participants, can only detect common side effects. Rare and potentially serious side effects require a large population base, and only once a drug is approved for marketing is a large population base obtained. However, this is no longer a con-trolled study, and establishing a causal link between using the drug and its benefit and safety profile is difficult.
To capture these sources of noise, we model the signal obtained by the FDA as z _ + ε, where ε is a mean zero error term. The FDA uses this signal to take a regulatory action, w, which can be thought of as either the probability that a drug is withdrawn from the market, or the loss in the number of prescriptions filled due to labeling restrictions. To simplify our analysis, the regulatory action takes the form w = m ( z _ + ε), where m is the emphasis placed by the FDA on the signal. The larger m is, the greater the incentive provided to the firm to contain expansions in _ z through its choice of p and A. Therefore, from the firm’s perspective, m can be viewed as a penalty weight. On the other hand, the larger m is, the greater the FDA’s reliance on a noisy and potentially distorted signal. This may lead the FDA to take actions that may decrease welfare.
14 Note that society would benefit from a regulator who limits the use of drugs to only those users for whom the benefit exceeds the cost. Therefore, a welfare maximizing regulator takes action against a manufacturer who sells a drug to individuals for whom the drug is not cost-beneficial.
15 For example, a patient may decide to report minor side effects if the drug she takes is useless, and ignore these side effects if the drug adequately treats the condition for which it was originally prescribed.
16 For example, the individual’s reporting propensity can be written as y i = √ ___
2(1 − ϕ)(1 − b i ) 2 + 2ϕ(1 − s i ) 2 ,which may be larger, smaller or equal to z i depending on bi and si. Note that ϕ > 0.5 represents the overemphasis on safety.
voL. 2 No. 4 9DAviD ET AL.: PhARmAcEuTicAL mARkETiNg, PRomoTioN, sAFETy, AND REguLATioN
Given the information and actions available to it, the FDA maximizes expected welfare that takes the following form: E [(1 − w) ∫
0 z _ ([β − c] − z) f (z)dz ] , by
choosing m which is imbedded in w.
D. The Firm’s Problem
Following our discussion of promotion, demand, and the regulatory process, the expected demand function is given by (1 − mE [ z _ ( p, A) + ε])α z _ ( p, A). Note that high promotional expenditure will raise demand for the drug, but will also lower the average appropriateness of the drug for its population of users. In turn, a poorer match between patients and the drug will increase the likelihood of unfavorable regulatory interventions through the effect of _ z on w. Thus, the firm faces uncer-tainty which it can mitigate or reinforce with its choice of price and promotion level.
For a safety signal to exist, individuals must purchase and experience the drug first, and therefore generate initial revenue for the firm. While it is plausible that profits made by the firm initially (before the signal is formed) are important, we will assume that the signal is formed fast enough that a hit-and-run strategy is never profitable, mainly due to the high research and development (R&D) costs and costly lawsuits that follow a decision to withdraw a drug.
To fix ideas, we carry through the standard Robert Dorfman and Peter O. Steiner (1954) analysis in which the firm’s revenue is given by pα z _ ( p, A). Quantity decreases with price and increases with promotion. The Dorfman-Steiner rule for the monopoly case with no uncertainty is: A/pα z _ = − η A / η D , where the left-hand term is the advertising-to-sales ratio, a common industry measure of advertising intensity, and η A and η D are the elasticity of advertising and the elasticity of demand, respectively.
Similar to Ira Horowitz (1970), Pierre Dehez and Alex Jacquemin (1975), and Ivan E. Brick and Harsharanjeet S. Jagpal (1981), who introduced uncertainty to the advertising framework, the pharmaceutical firm maximizes expected profit by choosing price and promotion expenditures:
(1)
Max p, A
(1 − mE [ z _ ( p, A) + ε])[α z _ ( p, A)( p − c)] − A.
The Dorfman-Steiner rule applies here, as the expected advertising-to-sales ratio is positively associated with the demand responsiveness to advertising, and negatively associated with the firm’s market power.17
Combining the two first-order conditions, with respect to price and promotion, yields a modified Dorfman-Steiner condition (see Appendix A for derivation):
(2) A __ (1 − mE [ z _ + ε])α z _ p = − η A
_ η D .
17 Patent protection for their medicines often results in market power for pharmaceutical firms.

10 AmERicAN EcoNomic JouRNAL: EcoNomic PoLicy NovEmBER 2010
This expression in (2) includes the indirect effect of prices and promotion on profits via the probability of regulatory action. In essence, increasing promotional activities trades off higher likelihood of profit-lowering regulatory actions, with higher profits in the case that such regulatory action is not taken. For a more general regulatory action, the modified rule suggests that the expected advertising-to-sales ratio is a weighted average of demand, advertising, and regulatory elasticities.18
E. Equilibrium and Predictions
We model the postmarketing interaction between the firm and the FDA as a one-shot sequential game. This is a simplification as we leave out various types of itera-tive dynamics such as learning, reputation building, reinvestment of profits, etc. The timing of the game is as follows: In period 1, the FDA chooses m and announces it to the firm. To keep the exposition simple, we assume that the FDA cannot later renege on the choice of m. This choice is ex ante efficient when price and promotion are
more important than ε in producing the AERS signal. If containing A has little effect on the match quality, there is not much use for regulation. Similarly, when the signal is very noisy, the FDA will have little benefit from using the system as the basis for regulatory interventions.
In period 2, the firm incorporates the FDA’s regulatory rule, and chooses price and promotion expenditures to maximize its expected profits. The firm’s choice will determine the number of users and their safety-benefit profile. In period 3, some users, based on their safety-benefit location, will report adverse drug events to the FDA to form a reporting signal with noise. In period 4, the signal is observed by the FDA and translated into a regulatory action according to its pre-specified rule, w. Finally, the firm’s profits are realized.
The firm maximizes expected profits as given by the expression in (1). In order to obtain a closed form solution we specify z _ ( p, A) = γ √
_ A − p, with γ capturing the
effectiveness of promotional expenditures in increasing the number of prescriptions
18 In this case, (2) will be A/(1 − E [ w ])α z _ p = − ((1 − E [ w ]) η A − E [ w ] ς A )/((1 − E [ w ]) η D − E [ w ] ς D ) , where ςA and ςD represent the sensitivity (as an elasticity) of the regulatory action to the firm’s price and advertising expenditures, respectively. Derivations are available from the authors.
FDA announces a contract (i.e., m)
Firm chooses p and A
The FDA takes regulatory action
Signal is realized
Timing of the Game
period1 432

voL. 2 No. 4 11DAviD ET AL.: PhARmAcEuTicAL mARkETiNg, PRomoTioN, sAFETy, AND REguLATioN
filled, which may vary across medical conditions. In addition, we specify the distri-bution of z to be uniform. The solutions to the first-order conditions are denoted:19
(3) A * = A * (α, γ, m, c) ;
(4) p * = p * (α, γ, m, c).
Note that A * and p * are the best response functions to any level of m chosen by the regulator.
The FDA observes the firm’s best response functions in (3) and (4) and hence, uses A * and p * in its welfare maximization:20
(5)
Max m
(1 − m z _ ( p * (α, γ, m, c), A * (α, γ, m, c)) ∫ 0 z _ ( p * , A * )
([β − c] − z) f (z) dz
s.t. E[π] ≥ 0.
The first order condition with respect to m is:
(6) m * = m * (α, γ, β, c).
Comparative statics yields unambiguous signs on all four parameters, such that:d m * /dc < 0; d m * /dα > 0; d m * /dβ < 0; d m * /dγ > 0. The FDA is more likely to place a strong weight on the AERS signal when production costs (c) are lower, mar-ket size (α) for the drug application is larger, the value of the drug (β) is lower, and the effectiveness of promotion (γ) is large.
The model shows how the key parameters lead to different equilibrium outcomes (e.g., the strictness of regulation). For example, greater effectiveness of promotion has both a direct effect (promotional expenditures lead to higher revenue absent regulation), and an opposite indirect effect (making regulation more sensitive to the AERS signal). Thus there are offsetting effects for the relationship between the elasticity of promotion, and the likelihood of regulatory action, w, in equilibrium. Because the net effect may be quite different across drugs, our empirical analysis will be conducted separately by disease.
Thus far, we assume that the signal extraction is costless. In reality, the infra-structure needed to assess the safety of drugs post-approval is costly and claims resources. While it is debatable whether the cost of investing in FDA-based post-launch analysis is justifiable on economic grounds, an alternative regime exists. The FDA can charge the firm with the task of engaging in postmarketing surveillance. Under this regulatory mechanism, discussed in Appendix B, the FDA relies solely on a signal produced by the firm. While the comparative statics yield the same signs on the parameters of interest, equilibrium outcomes such as the average match qual-ity are potentially different.
19 The expressions and their derivations are available from the authors.20 This expression uses the fact that ε is mean zero.

12 AmERicAN EcoNomic JouRNAL: EcoNomic PoLicy NovEmBER 2010
II. Empirical Estimation
In this section, we empirically examine two of the main propositions in this paper. The first is whether adverse events do, in fact, translate into regulatory actions, and second, whether higher levels of pharmaceutical promotion and advertising lead to a worsening match with patients as reflected by increased reporting of adverse drug reactions. Equations (7) and (8) show these relationships:
(7) w jt c = f (AD R jt c
, X jt c , y t c ),
(8) AD R jt c = f ( ∑
t=0
t−2
A jt c , ∑
t=t−3
t−11
A jt c , X jt c
, D j c , y t c ) .
In equation (7), regulatory actions ( w jt c ) for drug j at month t and condition c
are a function of reported adverse drug reactions (AD R jt c ), observed characteristics
specific to each drug ( X jt c ), and indicator variables for the regulatory environment
at a particular time ( y t c ). In equation (8), adverse drug reactions are a function of expenditures on advertising and promotion ( A jt c
), observed characteristics specific to each drug ( X jt c
), unobserved time-invariant characteristics of each drug ( D j c ), and the regulatory environment at a particular time ( y t c ).
The drugs considered ( j ) are prescription drugs used to treat allergies, arthritis pain, depression, and high cholesterol. These particular drugs are chosen because of their popularity, and the high propensity of firms to advertise and promote them. We group drugs by their primary active ingredients. Our list of ingredients is based on the Web site drugdigest.org. A total of 65 distinct active ingredients are considered, and of these, 11 are for high cholesterol, 10 for allergies, 19 for arthritis pain, and 25 for depression.
Following our conceptual framework, the four conditions represent therapeutic classes that may vary in markup ( p–c), value (β ), market size (α), and elasticity of promotion (γ ). Because promotion and advertising may have differential effects on the utilization of the drug and resulting ADRs based on the condition for which the drug is prescribed, where possible, we estimate the equation separately for the four conditions.
A. Data sources
Regulation.—Information on safety-based actions ( w jt c ) comes from the FDA’s
MedWatch summaries. MedWatch lists monthly actions pertaining to five safety labeling changes: boxed warnings, contraindications, warnings, precautions, and adverse reactions. From this information, we generate a drug-specific dichotomous indicator for the month in which the FDA required the manufacturers of that drug to change the label to include any of the above listed changes. While drug withdrawals are an important FDA action, we do not consider withdrawals as an outcome since only one drug, Vioxx, was withdrawn from the market during our two-year sample.
Adverse Drug Reactions.—ADRs are a count of “very serious” reported adverse drug reactions for each drug j (i.e., active ingredient) at time t (months). Data on
voL. 2 No. 4 13DAviD ET AL.: PhARmAcEuTicAL mARkETiNg, PRomoTioN, sAFETy, AND REguLATioN
ADRs come from the FDA’s AERS, which was designed for postmarketing drug safety surveillance. Manufacturers are required to submit reports of adverse events to the AERS, while reports from doctors, consumers, and lawyers are voluntarily contributed. The FDA uses this database to inform its regulatory decisions regarding postmarket safety of drugs. The availability of these data, along with the availability of the advertising and promotion data (described below), limits time span of our data (t) to the 24 months of 2003 and 2004.
We define a “very serious” adverse event based on the FDA definition from the AERS reporting instructions, which includes: death; life-threatening injury; hospi-talization; disability or permanent damage; and congenital anomaly/birth defect. The unit of observation in the AERS is the event. Multiple drugs can be associated with each event, and we currently treat these as separate observations.21
The AERS data suffer from some drawbacks including a lack of data on the number of drug users in the population, recall bias, poor case documentation, and underreporting (Alina Baciu, Kathleen Stratton, and Sheila P. Burke 2007, p. 55). We generate user data to act as a denominator in the rate from the International Monetary Systems’ (IMS) National Prescription Audit (NPA) database. This source has national monthly counts of pharmacy sales of all prescription drugs. From this, we extract the sales (in thousands) of the same ingredients under consideration in the AERS data, and match by linking the drug names to the corresponding ingredi-ent on our list. From the NPA, we also include on the right hand side of the equation a variable with the percent of sales accounted for by generic drugs.
Measurement error in the AERS will be a problem only if the error is correlated with our variables of interest, dollars spent on advertising, and promotion. Recall bias and poor case documentation are not likely to be correlated with dollars spent. However, it is possible that reporting patterns for certain drugs are influenced by advertising—for example, if consumers are reminded to report an event based on a television commercial. We discuss the possible endogeneity further below.
Advertising and Promotion.—The vector A jt c in (8) represents measures of expen-
ditures on advertising and promotion. Data on direct to consumer advertising comes from the TMS Media Ad$pender database (formerly Competitive Media Reports). We use total dollars spent per month on television, magazines, billboards, and Internet advertising for each drug under consideration.22 Monthly data on professional promo-tion comes from IMS’s Integrated Promotion Service (IPS). We consider dollars spent on direct contact with physicians (termed “cost of contact”) and total dollars spent on professional promotion (termed “professional promotion”). The cost of contact is an estimate of the dollar value of time spent with physicians in the promotion of the product. Total dollars on promotion is the sum of the cost of direct contact with physicians, journal advertising, and the retail value of samples. As with the NPA data, the drug names in these data are linked with the corresponding ingredient on our list. Because of the overlap among the two measures of promotion expenditures, each one
21 In the relevant tables below, the observations for Vioxx occurring after the withdrawal date, 9/04, are excluded. Models were tested that exclude all observations for Vioxx and the results are similar to those presented below.
22 When a drug is not mentioned in this source, we assume the value of advertising is zero for that month.

14 AmERicAN EcoNomic JouRNAL: EcoNomic PoLicy NovEmBER 2010
enters separately into the models. There is much less correlation between promotion and advertising so each model contains a measure of promotion and advertising.
As shown in equation (8), we consider current quarter expenditures (the sum of month t, month t-1 and month t-2), along with the sum of expenditures for the pre-vious three quarters (months t-3 to t-11) to represent the existing stock of expendi-tures. Current quarter expenditures rather than current month are used for two reasons. First, ADRs are reported throughout the month so it is not clear that current month’s expenditures are appropriately matched to all observations. In some cases, the previ-ous month might be a better match. Second, there may be a time delay between the doctor visit and the filling of a prescription. Including the previous two months allows us to capture promotion and advertising exposure in the near past. For the stock, we do not specify a depreciation rate, rather, we let the coefficients on the stock reflect the product of the marginal effect on reported ADRs and the depreciation rate. 23
observed Drug characteristics.—The vector X jt c represents some characteristics
of the users of the drug that may influence reporting. Olson (2002) notes that adverse event reporting is influenced by the length of time a drug has been on the market with more reports made early in the life cycle of a drug. Drugs that are the first in their class may have more adverse events than older drugs, in part because doctors and patients lack experience with these drugs. To account for this, we include, in all models, indicators for categories of the length of time since approval date as reported in the NPA (0–6 months, 7 months to 2 years, 3–5 years, 6–10 years, with > 10 years as the omitted reference category).
The next set of drug characteristics are all generated from IMS Health’s National Disease and Therapeutic Index (NDTI) database. The NDTI is a nationally repre-sentative sample of office-based physicians in private practice in the United States. Each physician reports demographic and medical information on all patients seen during two consecutive workdays in each calendar quarter. The reports include pre-scriptions written, which allows us to examine and include the characteristics of users of a particular drug.
From the NDTI, we generate and include the following sets of variables for each drug under consideration: First, we include the share of prescriptions for the drug written for different age groups interacted with gender (ages 0–39, 40–64, 65 and up, with females and males age 0–39 as the omitted reference group). Second, we include the share of prescriptions paid for by government insurance. And third, we include the share of prescriptions written for smokers. Fourth, we have shares for Asian and black race, and Hispanic ethnicity. Finally, we have shares of prescrip-tions written for patients with prehypertension, stage 1 hypertension, and stage 2 hypertension. All of these variables are calculated per year to reduce sampling variability.
unobserved Drug characteristics.— D j c are fixed effects for the drug. These fixed effects should capture those drug-specific factors related to demand that would
23 Regressions that include just current expenditures, or include just the stock of expenditures, yield very similar results to those presented below for the corresponding coefficients.

voL. 2 No. 4 15DAviD ET AL.: PhARmAcEuTicAL mARkETiNg, PRomoTioN, sAFETy, AND REguLATioN
occur without promotion or advertising. Some examples might be the results of clinical trials, or whether the drug is fundamentally different than its predecessors.
B. methodology
Alternative specifications of equation (7) that examine the effects of adverse drug events reports on the regulator action are estimated. Initially, logit regressions are used to analyze the effects of reported ADRs on the probability of a new labeling change. However, since it is possible that reported ADRs will fall after a labeling change and generate a reverse causality problem, we also estimate a discrete time hazard model. The estimation of this model shows the effects of reported ADRs on the probability of the first labeling change occurring. The disadvantage to this model is that only the first change is considered, although it is not a severe concern since few drugs experience multiple labeling changes, with the bulk of these changes occurring in consecutive months.
Labeling changes are relatively rare events and occur in only 4 percent of the drug/month observations. Table 1 shows the means by condition. Just over half of the drugs in the sample experience a labeling change at some point, and these changes are concentrated most heavily among the allergy drugs (25 percent of the labeling changes) and the antidepressants (47 percent of the labeling changes). Cholesterol drugs and arthritis drugs account for 11 percent and 17 percent, respec-tively. Because of these characteristics, there is not enough variation in the labeling changes to estimate the logit models for each condition separately, or to include drug fixed effects. We instead run a pooled model allowing for condition-specific slopes (interactions between the indicators for each of the four conditions and ADRs), along with the time-varying drug and user characteristics and year/month indicators. In order to account for any cumulative effects of ADRs, we evaluate them monthly, quarterly, and yearly.
The characteristics of the ADR data necessitate a different approach when esti-mating equation (8) for the effects of advertising and promotion on ADRs. ADRs are relatively rare: 15 percent of the observations are zeros for arthritis drugs, with a median value of 11; 10 percent are zeros for depression drugs with a median of 18; 5 percent are zeros for cholesterol drugs, with a median value of 14; and 1 percent are zeros for allergy drugs, with a median value of 9. Given that the number of cases of adverse events tend to be small, and have many zeros, we use a count model to estimate the models. Specifically, we use a fixed effects Poisson method (Jeffrey M. Wooldridge 2002; A. Colin Cameron and Pravin K. Trivedi 1998). This estimator is a quasi-maximum likelihood estimator, that includes fixed effects to account for unobserved heterogeneity. Estimates are consistent regardless of whether the counts actually have a Poisson distribution (Wooldridge 2002). To permit overdispersion, a common feature of count data that is not accommodated by the Poisson maximum likelihood estimator, standard errors are adjusted for heteroskedasticity of unknown form (Cameron and Trivedi 2005).24
24 Alternative models were tested using a negative binomial regression with fixed effects. The results are similar to those presented in the tables below.

16 AmERicAN EcoNomic JouRNAL: EcoNomic PoLicy NovEmBER 2010
Table 1—Means, Standard Deviations by Condition
Variable
Arthritis pain(n = 429)
Depression(n = 540)
High cholesterol(n = 247)
Allergies(n = 240)
Mean SD Mean SD Mean SD Mean SD
Any labeling change 0.03 0.16 0.05 0.23 0.03 0.17 0.07 0.25
Very serious ADR 37.91 82.08 33.90 37.21 49.89 71.57 13.87 11.54
Total prescriptions 363.40 524.20 1,086.80 1,197.50 2,312.80 3,405.40 934.60 735.30
Very serious ADR rate 0.09 0.10 0.08 0.17 0.02 0.02 0.03 0.04
Current quarter total promotion and DTCA (real $1,000,000)
11.00 23.23 12.41 22.94 26.80 40.56 26.20 20.14
Stock total promotion and DTCA (real $1,000,000)
33.80 71.92 36.38 64.27 75.12 111.87 79.07 58.61
Current quarter professional promotion (real $1,000,000)
9.65 20.09 10.82 19.94 22.84 34.57 20.57 13.69
Stock of professional promotion (real $1,000,000)
30.21 63.58 31.83 55.39 64.70 96.00 61.12 40.49
Current quarter cost of contact (real $1,000,000)
3.02 6.17 2.87 5.39 4.47 4.96 6.68 4.85
Stock of cost of contact (real $1,000,000)
9.42 19.43 8.65 15.20 13.53 14.90 20.91 15.17
Current quarter DTCA (real $1,000,000)
1.35 4.05 1.59 4.49 3.96 7.84 5.62 8.45
Stock of DTCA (real $1,000,000)
3.58 10.46 4.55 12.30 10.42 17.18 17.95 21.69
Percent generics 0.71 0.41 0.57 0.45 0.28 0.44 0.17 0.34
Percent of drug prescribed to smokers 0.21 0.13 0.21 0.10 0.14 0.05 0.11 0.02
Percent of drug prescribed to prehypertension
0.48 0.15 0.51 0.19 0.51 0.05 0.47 0.05
Percent of drug prescribed to stage 1 hypertension
0.26 0.16 0.16 0.10 0.25 0.07 0.16 0.06
Percent of drug prescribed to stage 2 hypertension
0.08 0.12 0.05 0.07 0.07 0.06 0.04 0.03
Percent of drug w/government insured users 0.27 0.11 0.32 0.14 0.40 0.09 0.24 0.10
Percent of drug prescribed to Asians 0.02 0.03 0.01 0.02 0.04 0.02 0.04 0.01
Percent of drug prescribed to blacks 0.10 0.05 0.04 0.03 0.08 0.05 0.10 0.02
Percent of drug prescribed to Hispanics 0.07 0.05 0.03 0.02 0.05 0.02 0.07 0.02
Drug approval date 5 years – 10 years 0.04 0.20 0.19 0.39 0.24 0.43 0.57 0.50
Drug approval date 2 years – 5 years 0.15 0.36 0.02 0.14 0.11 0.31 0.05 0.23
Drug approval date 7 months – 2 years 0.03 0.17 0.03 0.18 0.03 0.17 0.05 0.21
Drug approval date <= 6 months 0.00 0.00 0.002 0.04 0.00 0.00 0.00 0.00
Percent of drug prescribed to females ages 40–64
0.25 0.10 0.36 0.14 0.19 0.03 0.20 0.04
Percent of drug prescribed to females ages 65 +
0.14 0.11 0.11 0.07 0.25 0.08 0.08 0.03
Percent of drug prescribed to males ages 40–64
0.20 0.11 0.16 0.08 0.24 0.09 0.13 0.02
Percent of drug prescribed to males ages 65 +
0.09 0.05 0.05 0.06 0.21 0.05 0.08 0.07
voL. 2 No. 4 17DAviD ET AL.: PhARmAcEuTicAL mARkETiNg, PRomoTioN, sAFETy, AND REguLATioN
Each model includes the log of the number of prescriptions for the drug in each month as a right-hand side variable to normalize for exposure in the population. The coefficient on prescriptions is constrained to equal one. This is equivalent to estimating the rate of adverse events. By doing so, we allow expenditures to affect both the population of users and the number of reported adverse events.
III. Results
Table 1 shows the means and standard deviations of all the variables based on the sample of drugs for each of the four conditions (arthritis pain, depression, high cho-lesterol, and allergies). It is clear from this table, that reported very serious adverse drug events are rare. The average monthly count ranges from a low of 13.87 for allergy drugs, to a high of 48.89 for cholesterol drugs. However, the rates of reported adverse events, which account for the size of the population of users, are very simi-lar for allergy and cholesterol drugs at 0.02 and 0.03 per 1,000 users, respectively. Arthritis pain and depression drugs have higher reported rates at 0.09 and 0.08 per 1,000 users, respectively.
Table 1 also shows that these pharmaceuticals are heavily promoted. Average cur-rent quarterly real expenditures on professional promotion, and direct-to-consumer advertising combined, total $11 million for arthritis pain drugs, $12.41 million for depression drugs, $26.8 million for cholesterol lowering drugs, and $26.20 million for allergy drugs. Note that the bulk of this total comes from professional promo-tion, which includes not only the cost of contact with the physician but also includes the retail value of samples and the cost of professional journal advertisements.
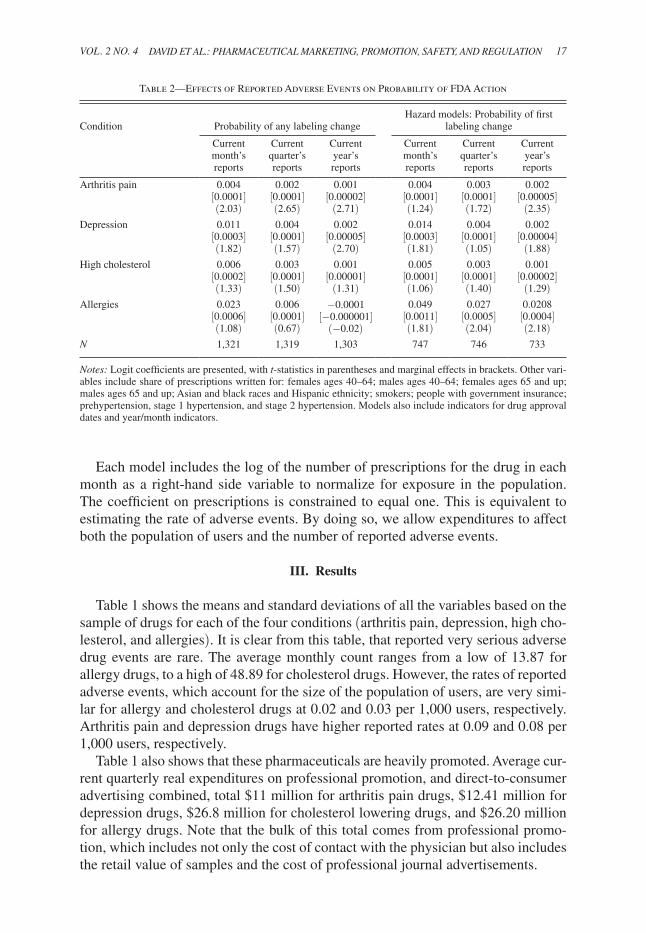
Table 2—Effects of Reported Adverse Events on Probability of FDA Action
Condition Probability of any labeling changeHazard models: Probability of first
labeling change
Current month’s reports
Current quarter’s reports
Current year’s reports
Current month’s reports
Current quarter’s reports
Current year’s reports
Arthritis pain 0.004[0.0001](2.03)
0.002[0.0001](2.65)
0.001[0.00002](2.71)
0.004[0.0001](1.24)
0.003[0.0001](1.72)
0.002[0.00005](2.35)
Depression 0.011[0.0003](1.82)
0.004[0.0001](1.57)
0.002[0.00005](2.70)
0.014[0.0003](1.81)
0.004[0.0001](1.05)
0.002[0.00004](1.88)
High cholesterol 0.006[0.0002](1.33)
0.003[0.0001](1.50)
0.001[0.00001](1.31)
0.005[0.0001](1.06)
0.003[0.0001](1.40)
0.001[0.00002](1.29)
Allergies 0.023[0.0006](1.08)
0.006[0.0001](0.67)
−0.0001[−0.000001]
(−0.02)
0.049[0.0011](1.81)
0.027[0.0005](2.04)
0.0208[0.0004](2.18)
N 1,321 1,319 1,303 747 746 733
Notes: Logit coefficients are presented, with t-statistics in parentheses and marginal effects in brackets. Other vari-ables include share of prescriptions written for: females ages 40–64; males ages 40–64; females ages 65 and up; males ages 65 and up; Asian and black races and Hispanic ethnicity; smokers; people with government insurance; prehypertension, stage 1 hypertension, and stage 2 hypertension. Models also include indicators for drug approval dates and year/month indicators.

18 AmERicAN EcoNomic JouRNAL: EcoNomic PoLicy NovEmBER 2010
Table 2 shows the effects of ADRs on the probability of regulatory action. The first three columns of Table 2 show the logit coefficients and marginal effects. Here, reported ADRs are positive and statistically significantly associated with the probability of a labeling change for arthritis pain and depression drugs. In general, the association holds whether the current month, current quarter, or current year is the relevant time span for reported ADRs. The association is also generally positive, but not statistically significant, for cholesterol and allergy drugs. The effects are substantial, considering the probability of a labeling change is 0.04. Consider a mar-ginal effect of 0.0001 for arthritis pain or depression drugs. This means that every 100 additional adverse drug reports increases the probability of a labeling change by one percentage point, a fourth of the baseline rate.
The last three columns of Table 2 show the results of the discrete time-hazard model. We find that increases in reported ADRs are associated with an increase in the probability of the first incidence of a labeling change. Here, statistical signifi-cance varies somewhat depending on the timing of the ADRs under consideration, however, all coefficients are positive. Only for cholesterol drugs are all coefficients statistically insignificant. The magnitudes of the effects are also similar to that of the first three models. The conclusion from these models is that firms do need to worry that increased adverse events will lead to a regulatory reaction by the FDA.
Tables 3 and 4 show results from the fixed effects Poisson estimation of the effects of advertising and promotion on reported adverse drug reactions for arthritis
Table 3—Effects of Promotion and Direct to Consumer Advertising on Adverse Drug Events Reports for Arthritis Pain and Depression
Arthritis pain(n = 429)
Depression(n = 540)
(1) (2) (3) (4) (5) (6)
Current quarter total promotion and DTCA (real $1,000,000)
−0.005(−1.67)
0.001(0.32)
Stock total promotion and DTCA (real $1,000,000)
0.007(3.12)
0.001(1.02)
Current quarter professional promotion (real $1,000,000)
−0.008(−1.57)
0.002(0.57)
Stock of professional promotion (real $1,000,000)
0.009(2.98)
−0.001(−1.26)
Current quarter cost of contact (real $1,000,000)
0.002(0.12)
0.027(1.67)
Stock of cost of contact (real $1,000,000)
0.031(2.46)
−0.002(−0.70)
Current quarter DTCA (real $1,000,000)
0.008(1.03)
0.005(0.49)
−0.001(−0.18)
−0.002(−0.76)
Stock of DTCA (real $1,000,000)
0.019(2.82)
0.015(2.19)
0.004(2.57)
0.003(2.16)
Notes: T-statistics in parentheses. Each column is a separate regression. Coefficients represent the percent change in the outcome resulting from one unit change in the independent variable. All models include share of prescrip-tions written for: females ages 40–64; males ages 40–64; females ages 65 and up; males ages 65 and up; Asian and black races and Hispanic ethnicity; smokers; people with government insurance; prehypertension, stage 1 hyper-tension, and stage 2 hypertension. Models also include share of generics, indicators for drug approval dates, year/month indicators and drug fixed effects. The log of total prescriptions is included on the right hand side with the coefficient constrained to one.
voL. 2 No. 4 19DAviD ET AL.: PhARmAcEuTicAL mARkETiNg, PRomoTioN, sAFETy, AND REguLATioN
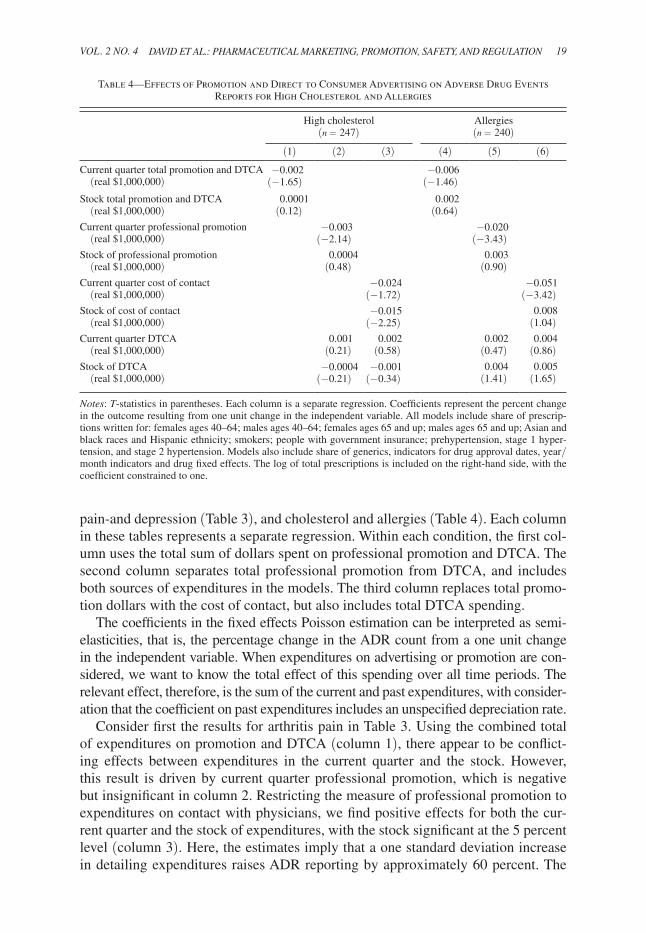
pain-and depression (Table 3), and cholesterol and allergies (Table 4). Each column in these tables represents a separate regression. Within each condition, the first col-umn uses the total sum of dollars spent on professional promotion and DTCA. The second column separates total professional promotion from DTCA, and includes both sources of expenditures in the models. The third column replaces total promo-tion dollars with the cost of contact, but also includes total DTCA spending.
The coefficients in the fixed effects Poisson estimation can be interpreted as semi-elasticities, that is, the percentage change in the ADR count from a one unit change in the independent variable. When expenditures on advertising or promotion are con-sidered, we want to know the total effect of this spending over all time periods. The relevant effect, therefore, is the sum of the current and past expenditures, with consider-ation that the coefficient on past expenditures includes an unspecified depreciation rate.
Consider first the results for arthritis pain in Table 3. Using the combined total of expenditures on promotion and DTCA (column 1), there appear to be conflict-ing effects between expenditures in the current quarter and the stock. However, this result is driven by current quarter professional promotion, which is negative but insignificant in column 2. Restricting the measure of professional promotion to expenditures on contact with physicians, we find positive effects for both the cur-rent quarter and the stock of expenditures, with the stock significant at the 5 percent level (column 3). Here, the estimates imply that a one standard deviation increase in detailing expenditures raises ADR reporting by approximately 60 percent. The
Table 4—Effects of Promotion and Direct to Consumer Advertising on Adverse Drug Events Reports for High Cholesterol and Allergies
High cholesterol(n = 247)
Allergies(n = 240)
(1) (2) (3) (4) (5) (6)
Current quarter total promotion and DTCA (real $1,000,000)
−0.002(−1.65)
−0.006(−1.46)
Stock total promotion and DTCA (real $1,000,000)
0.0001(0.12)
0.002(0.64)
Current quarter professional promotion (real $1,000,000)
−0.003(−2.14)
−0.020(−3.43)
Stock of professional promotion (real $1,000,000)
0.0004(0.48)
0.003(0.90)
Current quarter cost of contact (real $1,000,000)
−0.024(−1.72)
−0.051(−3.42)
Stock of cost of contact (real $1,000,000)
−0.015(−2.25)
0.008(1.04)
Current quarter DTCA (real $1,000,000)
0.001(0.21)
0.002(0.58)
0.002(0.47)
0.004(0.86)
Stock of DTCA (real $1,000,000)
−0.0004(−0.21)
−0.001(−0.34)
0.004(1.41)
0.005(1.65)
Notes: T-statistics in parentheses. Each column is a separate regression. Coefficients represent the percent change in the outcome resulting from one unit change in the independent variable. All models include share of prescrip-tions written for: females ages 40–64; males ages 40–64; females ages 65 and up; males ages 65 and up; Asian and black races and Hispanic ethnicity; smokers; people with government insurance; prehypertension, stage 1 hyper-tension, and stage 2 hypertension. Models also include share of generics, indicators for drug approval dates, year/month indicators and drug fixed effects. The log of total prescriptions is included on the right-hand side, with the coefficient constrained to one.

20 AmERicAN EcoNomic JouRNAL: EcoNomic PoLicy NovEmBER 2010
results in columns 2 and 3 show that DTCA expenditures for arthritis pain drugs are also positively related to ADR reporting, and the stock of DTCA is statisti-cally significant. Using the estimates in column 3, a one standard deviation increase in DTCA raises ADR reporting by approximately 20 percent. These results pro-vide support for our assertion that advertising and promotion can worsen the match between the drug and patients.
Depression drugs are also considered in Table 3. Here, professional promotion, measured either as the total expenditure or as the cost of contact with physicians, has no statistical relationship with reported adverse events (columns 5–6). By contrast, the coefficients on the stock of DTCA are positive and statistically significant, with a one standard deviation increase in DTCA raising ADR reporting by approximately 5 percent. These results imply that promotion to professionals has no harmful effects on patients, while DTCA may be detrimental.
The results in Table 4 are much different for cholesterol lowering drugs and allergy medications. With the exception of one coefficient on the stock of DTCA in the third allergy model (column 6), no other coefficient in any of these models is positive and statistically significant, suggesting there is no harmful effect of promo-tion and advertising for these types of drugs. For cholesterol drugs, higher expen-ditures on total professional promotion and direct contact with physicians may be helpful in that these expenditures are negatively associated with reported adverse events. For example, a 1 standard deviation increase in the stock of cost of contact lowers ADR reports by approximately 22 percent. The same can be said for allergy medications, where the current quarter expenditures on total promotion and cost of contact are negative and statistically significant.
We are concerned with the potential endogeneity of pharmaceutical advertising and promotion expenditures in the equation for reported ADRs. Endogeneity that stems from any unobserved, time-invariant, drug-specific characteristics should be accounted for by the drug fixed effects. However, it is possible that reports of adverse drug events may affect the firm’s decisions regarding the levels of professional pro-motion and DTCA, generating a reverse causality problem. In results available upon request, we checked for biases by first, using only past expenditures that should be predetermined, and second, by using instrumental variables.25 The results of these models suggest there is no substantial endogeneity bias.
IV. Conclusions
The growth of pharmaceutical promotion, particularly direct-to-consumer adver-tising, along with recent drug withdrawals and other regulatory interventions, calls for an understanding of the basic relationship between the promotion of a drug and
25 The instruments are the current quarter’s expenditures on total professional promotion (or cost of contact) for all drugs manufactured by a firm. For example, suppose a drug in our sample is made by only one manufacturer. The instrument is total spending on professional promotion across all drugs the firm produces, excluding the drug under consideration. If there are multiple firms that produce a drug in our sample, then the expenditures by these manufacturers are all considered as possible instruments. The idea here is that certain firms may, as a business practice, tend to promote more than other firms. Thus, promotion for all drugs predicts current expenditures for the specific drugs in our sample, yet is unrelated to reported adverse events.
voL. 2 No. 4 21DAviD ET AL.: PhARmAcEuTicAL mARkETiNg, PRomoTioN, sAFETy, AND REguLATioN
the benefit-risk profile of its users. In this paper, we have provided a theoretical framework for the behavior of a pharmaceutical firm under regulation by the FDA, and we have tested aspects of this model using an innovative combination of data on promotion, regulation, and adverse reactions. The model shows how product and market characteristics, such as the elasticity of promotion, would lead to different levels of promotion and regulatory oversight.
The empirical results confirm the basic assumptions and features of our model. We find that the FDA responds to high numbers of reported adverse drug reactions with a greater probability of regulatory action, and that direct-to-consumer adver-tising and promotion increase the rate of reported adverse drug reactions for cer-tain conditions. The differential results by condition likely arise from two sources. The first is the differential ability of physicians to function as effective gatekeepers across conditions, and the second stems from the degrees of severity of known side effects across drugs. In our framework, advertising and promotion first affect the quality of the patient match, which in turn affects the occurrence of adverse side effects, and adverse events, reported to the FDA. The effectiveness of gatekeeping across conditions is likely to be the result of the conclusiveness of the available diag-nostic tools. High cholesterol is easily detected with a simple diagnostic test, and this test is widely used to determine whether to prescribe a drug. Therefore, for this condition, any negative effect of promotion on the average match quality would be limited. Similarly, for allergies, diagnostic tests are relatively simple to perform and widely used. By contrast, the diagnosis of depression or pain is more subjective and relies much more on patient-provided information, which is inherently noisy. This increases the probability that a patient who is a poor match for the drug receives it.
The second effect links the match quality to the occurrences of side effects. Given a similar deterioration in the match quality across conditions, drugs such as antidepres-sants that have more severe known side effects, may produce higher rates of ADRs than other drugs. The result will be a larger effect of advertising and promotion on ADRs through the side effects, holding match quality constant. Note that the two effects described are not necessarily independent. Doctors may be more cautious about the match quality with drugs that have severe side effects, and less likely to report known side effects. Our empirical results cannot net out the source of the differential effects across conditions, but for our purposes, the total effects are informative.
It may not be surprising to see the effects of promotion and DTCA coming through the stock rather than current expenditures. Our “current” time period is defined as three months, and there are several steps that must occur between the promotion of a drug and an adverse reaction. First, patients and/or physicians must receive the pro-motion, then interact with one another such that the drug is prescribed. The patient must then fill the prescription and take the drug, and finally the unanticipated toxic-ity must accumulate to the point that it causes an adverse reaction. Depending on an individual’s circumstance, this process could be swift or take more than a few months.
Our analysis is limited by the fact that we do not model the strategic interactions among firms producing the same drug or drugs within the same class. However, given the complexity of our monopoly model, incorporating competition among firms seems prohibitive, and it is not of primary importance for this topic. The empirical work accounts for this issue by including the share of generics and the

22 AmERicAN EcoNomic JouRNAL: EcoNomic PoLicy NovEmBER 2010
age of the drug as variables, and our predictions hold with these controls in place. A limitation of the empirical results is that we use a simple form for the effect of promotion on ADRs, because we do not know the functional relationship between promotion and demand. For example, it is possible that promotion at the time of a drug’s introduction operates differently than later promotion.
An important conclusion from this analysis is that the relationship between pro-motion and ADRs depends greatly on the condition. Our estimates show that detail-ing is associated with a reduction in the adverse event rate for high cholesterol and allergy drugs, but is associated with an increase in the rate for arthritis pain. We also find that DTCA is associated with increases in the ADR rates for arthritis pain and depression. Conceptually, drug promotion can be beneficial or detrimental, and we believe the net effect depends critically on the role of physicians as mediators between promotion and use. The effect of promotion and advertising in improving communication between patients and physicians may be welfare increasing if physi-cians can identify who is the best match for treatment. This is facilitated in the case of cholesterol and allergy medications by the existence of more accurate diagnostic tools. Public policy on pharmaceutical advertising and promotion should take this into account. For conditions where physicians can perform their role as mediators, there is less need for concern about inappropriate use due to promotion, but for con-ditions where the diagnosis or risks are hard to assess there may be a need for greater oversight and investment in postmarketing surveillance.
Appendix A: Derivation of Modified Dorfman-Steiner Rule
(A1)
Max p, A
(1 − mE[ z _ ( p, A) + ε])[α z _ ( p, A)( p − c)] − A.
First order condition with respect to A:
(1 − m z _ ) [ ∂ z _ _ ∂A α( p − c)] − m
∂ z _ _ ∂A α z _ ( p − c) = 1,
(1 − m z _ ) [ ∂ z _ _ ∂A A _ z _
z _ _
A αp
p − c _
p ] − m
∂ z _ _ ∂A A _ z _
z _ _
A α z _ p
p − c _
p = 1,
[A] ( p − c
_ p ) (1 − 2m z _ ) ( ∂ z _
_ ∂A A _ z _
) = A _ α z _ p .
First order condition with respect to p:
(1 − m z _ ) [ ∂ z _ _ ∂p α( p − c) + α z _ ] − m
∂ z _ _ ∂A α z _ ( p − c) = 0,
(1 − m z _ ) [ ∂ z _ _ ∂p
p _ z _
p − c _
p + 1] − m
∂ z _ _ ∂p
p _ z _
p − c _
p z _ = 0,
( p − c
_ p ) [(1 − 2m z _ ) ( ∂ z _
_ ∂p p _ z _ ) ] + (1 − m z _ ) = 0,
voL. 2 No. 4 23DAviD ET AL.: PhARmAcEuTicAL mARkETiNg, PRomoTioN, sAFETy, AND REguLATioN
[ p] ( p − c
_ p ) = − 1 − m z _
__ (1 − 2m z _ ) ( ( ∂ z _
_ ∂p p _ z _ ) )
.
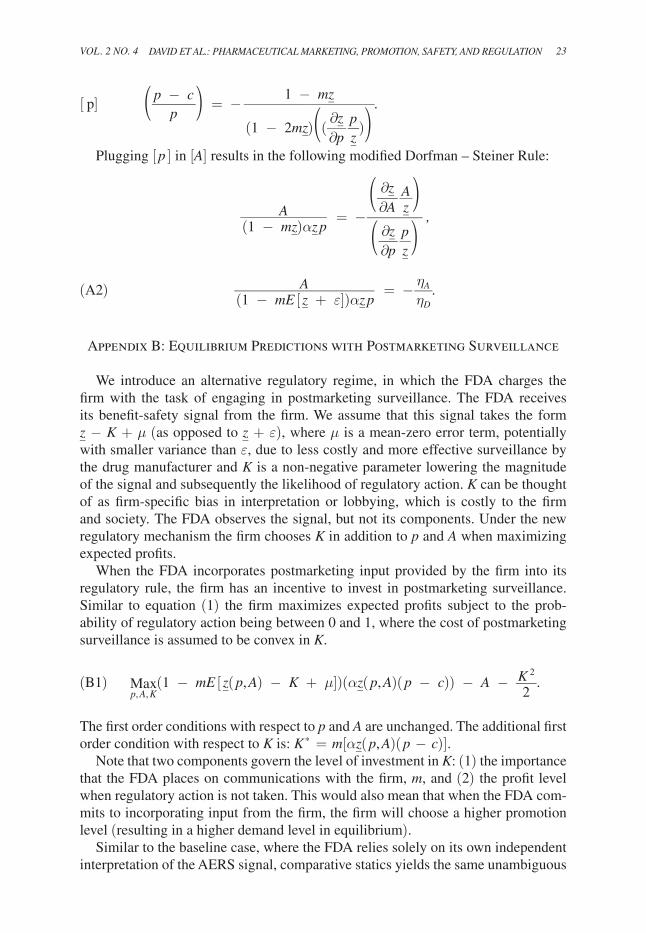
Plugging [ p ] in [A] results in the following modified Dorfman – Steiner Rule:
A __ (1 − m z _ )α z _ p = −
( ∂ z _ _ ∂A A _ z _
) _
( ∂ z _ _ ∂p p _ z _ )
,
(A2) A __ (1 − mE [ z _ + ε])α z _ p = − η A
_ η D .
Appendix B: Equilibrium Predictions with Postmarketing Surveillance
We introduce an alternative regulatory regime, in which the FDA charges the firm with the task of engaging in postmarketing surveillance. The FDA receives its benefit-safety signal from the firm. We assume that this signal takes the form z _ − k + μ (as opposed to z _ + ε), where μ is a mean-zero error term, potentially with smaller variance than ε, due to less costly and more effective surveillance by the drug manufacturer and k is a non-negative parameter lowering the magnitude of the signal and subsequently the likelihood of regulatory action. k can be thought of as firm-specific bias in interpretation or lobbying, which is costly to the firm and society. The FDA observes the signal, but not its components. Under the new regulatory mechanism the firm chooses k in addition to p and A when maximizing expected profits.
When the FDA incorporates postmarketing input provided by the firm into its regulatory rule, the firm has an incentive to invest in postmarketing surveillance. Similar to equation (1) the firm maximizes expected profits subject to the prob-ability of regulatory action being between 0 and 1, where the cost of postmarketing surveillance is assumed to be convex in k.
(B1)
Max p, A, k
(1 − mE [ z _ ( p, A) − k + μ] )(α z _ ( p, A)( p − c)) − A − k 2 _ 2 .
The first order conditions with respect to p and A are unchanged. The additional first order condition with respect to k is: k * = m[α z _ ( p, A)( p − c)].
Note that two components govern the level of investment in k: (1) the importance that the FDA places on communications with the firm, m, and (2) the profit level when regulatory action is not taken. This would also mean that when the FDA com-mits to incorporating input from the firm, the firm will choose a higher promotion level (resulting in a higher demand level in equilibrium).
Similar to the baseline case, where the FDA relies solely on its own independent interpretation of the AERS signal, comparative statics yields the same unambiguous
24 AmERicAN EcoNomic JouRNAL: EcoNomic PoLicy NovEmBER 2010
signs on all four parameters (i.e., c, α, β, γ). However, there is a social cost to delegating postmarketing surveillance to manufacturers. Under the firm-driven sig-nal regime (compared with the FDA-driven signal regime), the average quality of the match between drugs and users deteriorates; the FDA will place a higher penalty weight on the firm’s signal; the probability of regulatory action increases, but so does profitability conditional on survival; therefore, the effect on expected profit-ability is ambiguous. Even if the new regime results in lower profitability, choosing not to invest in postmarketing surveillance is not optimal and, therefore, not credible.
REFERENCES
Almasi,ElizabethA.,RandallS.Stafford,RichardL.Kravitz,andPeterR.Mansfield.2006. “What are the Public Health Effects of Direct-to-Consumer Drug Advertising?” PLos medicine, 3(3).
Ashraf,Nava,JamesBerry,andJesseM.Shapiro.Forthcoming. “Can Higher Prices Stimulate Product Use? Evidence from a Field Experiment in Zambia.”American Economic Review.
Baciu,Alina,KathleenStratton,andSheilaP.Burke,ed.2007. The Future of Drug safety: Promot-ing And Protecting The health of The Public. Washington, DC: The National Academies Press.
Berndt,ErnstR.2007. “The United States’ Experience with Direct-to-Consumer Advertising of Pre-scription Drugs: What Have We Learned?” In Pharmaceutical innovation: incentives, competition, and cost-Benefit Analysis in international Perspective, ed. Frank A. Sloan and Chee-Ruey Hsieh, 174–95. Cambridge, UK: Cambridge University Press.
Berndt, Ernst R.,Adrian H. B. Gottschalk,Tomas J. Philipson, and MatthewW. Strobeck. 2005. “Industry Funding of the FDA: Effects of PDUFA on Approval Times and Withdrawal Rates.” Nature Reviews Drug Discovery, 4(7): 545–54.
Bradford,W.David,AndrewN.Kleit,PaulJ.Nietert,TerrenceSteyer,ThomasMcIlwain,andSte-venOrnstein.2006. “How Direct-To-Consumer Television Advertising For Osteoarthritis Drugs Affects Physicians’ Prescribing Behavior.” health Affairs, 25(5): 1371–77.
Brekke,KurtR.,andMichaelKuhn.2006. “Direct to Consumer Advertising in Pharmaceutical Mar-kets.” Journal of health Economics, 25(1): 102–30.
Brick,IvanE.,andHarsharanjeetS.Jagpal.1981. “Monopoly Price-Advertising Decision-Making under Uncertainty.” Journal of industrial Economics, 29(3): 279–85.
Buckley,Joan.2004. “The Need to Develop Responsible Marketing Practice in the Pharmaceutical Sector.” Problems and Perspectives in management, 4: 92–103.
Cameron,A.Colin,andPravinK.Trivedi.1998. Regression Analysis of count Data. Cambridge, UK: Cambridge University Press.
Cameron,A.Colin,andPravinK.Trivedi.2005. microeconometrics methods and Applications. New York: Cambridge University Press.
Chao,BlendaA.2005. “Evaluating the Educational Content of Direct-to-Consumer Fulfillment Mate-rials.” American Journal of health-system Pharmacy, 62(6): 620–25.
Dehez, Pierre, andAlex Jacquemin. 1975. “A Note on Advertising Policy under Uncertainty and Dynamic Conditions.” Journal of industrial Economics, 24(1): 73–78.
Donohue,JulieM.,ErnstR.Berndt,MeredithRosenthal,ArnoldM.Epstein,andRichardG.Frank.2004. “Effects of Pharmaceutical Promotion on Adherence to the Treatment Guidelines for Depres-sion.” medical care, 42(12): 1176–85.
Dorfman,Robert,andPeterO.Steiner.1954. “Optimal Advertising and Optimal Quality.” American Economic Review, 44(5): 826–36.
Horowitz, Ira. 1970. “A Note on Advertising and Uncertainty.” Journal of industrial Economics, 18(2): 151–60.
Iizuka,Toshiaki,andGingerZheJin.2005. “The Effect of Prescription Drug Advertising on Doctor Visits.” Journal of Economics and management strategy, 14(3): 701–27.
TheKaiserFamilyFoundation.2009. “Trends in Promotional Spending for Prescription Drugs, 1996–2008.” http://facts.kff.org/chart.aspx?ch=225.
Kravitz,RichardL.,RonaldM.Epstein,MitchellD.Feldman,CarolE.Franz,RahmanAzari,MichaelS.Wilkes,LadsonHinton,andPeterFranks.2005. “Influence of Patients’ Requests for Direct-to-Consumer Advertised Antidepressants: A Randomized Controlled Trial.” Journal of the American medical Association, 293(16): 1995–2002.
voL. 2 No. 4 25DAviD ET AL.: PhARmAcEuTicAL mARkETiNg, PRomoTioN, sAFETy, AND REguLATioN
Lam, Michael D. 2004. “Spend Trends: A $20 Billion Bill and Plenty of Change.” Pharmaceuti-cal Executive, September 1. http://pharmexec.findpharma.com/pharmexec/PE+Features/Spend-Trends-A-20-Billion-Bill-and-Plenty-of-Chang/ArticleStandard/Article/detail/123004.
Lyles,Alan.2002. “Direct Marketing of Pharmaceuticals to Consumers.” Annual Review of Public health, 23: 73–91.
Masson,A.,andP.H.Rubin.1985. “Matching Prescription Drugs and Consumers––The Benefits of Direct Advertising.” New England Journal of medicine, 313(8): 513–15.
Mintzes,Barbara,MorrisL.Barer,RichardL.Kravitz,ArminéeKazanjian,KenBassett,JoelLex-chin,RobertG.Evans,RichardPan,andStephenA.Marion.2002. “Influence of Direct to Con-sumer Pharmaceutical Advertising and Patients’ Requests on Prescribing Decisions: Two Site Cross Sectional Survey.” British medical Journal, 324(7332): 278–79.
Narayanan,Sridhar,RamaraoDesiraju,andPradeepK.Chintagunta.2004. “Return on Investment Implications for Pharmaceutical Promotional Expenditures: The Role of Marketing-Mix Interac-tions.” Journal of marketing, 68(4): 90–105.
Olson,MaryK.2002. “Pharmaceutical Policy Change and the Safety of New Drugs.” Journal of Law and Economics, 45(2): 615–42.
Rawson,NigelS.B.,andKennethI.Kaitin.2003. “Canadian and US Drug Approval Times and Safety Considerations.” The Annals of Pharmacotherapy, 37(10): 1403–08.
Rizzo,JohnA.1999. “Advertising and Competition in the Ethical Pharmaceutical Industry: The Case of Antihypertensive Drugs.” Journal of Law and Economics, 42(1): 89–116.
Rudholm,Niklas.2004. “Approval Times and the Safety of New Pharmaceuticals.” European Journal of health Economics, 5(4): 345–50.
Scherer,F.M.2000. “The Pharmaceutical Industry.” In handbook of health Economics, Vol. 1B, ed. Anthony J. Culyer and Joseph P. Newhouse, 1297–1336. New York: North-Holland.
Sellers,L.J.,andAndraBrichacek.2001. “Flexing Their Budgets: Big Pharma Spend Trends.” Phar-maceutical Executive, September 1. http://pharmexec.findpharma.com/pharmexec/article/article-Detail.jsp?id=780&sk=&date=&pageID=3.
Spence,MicheleM.,StephanieS.Teleki,T.CraigCheetham,StuartO.Schweitzer,andMirtaMil-lares.2005. “Direct-to-Consumer Advertising of COX-2 Inhibitors: Effect on Appropriateness of Prescribing.” medical care Research and Review, 62(5): 544–59.
U.S.FoodandDrugAdministration.2005. center for Drug Evaluation and Research 2005 Report to the Nation: improving Public health Through human Drugs. Rockville, MD.
U.S. GeneralAccounting Office. 2002. Prescription Drugs: FDA oversight of Direct-to-consumer Advertising has Limitations. GAO-03-177. Washington, DC, October.
Wazana,Ashley.2000. “Physicians and the Pharmaceutical Industry: Is a Gift Ever Just a Gift?” Jour-nal of the American medical Association, 283(3): 373–80.
West,Diane.2007. “Spend Trends 2007: Hang 10, DTC Hits Its first Decade.” Pharmaceutical Execu-tive, May 1. http://pharmexec.findpharma.com/pharmexec/article/articleDetail.jsp?id=423215&sk=&date=&pageID=3.
Windmeijer,Frank,EricdeLaat,RudyDouven,andEstherMot.2006. “Pharmaceutical Promotion and GP Prescription Behaviour.” health Economics, 15(1): 5–18.
Wooldridge,JeffreyM.2002. Econometric Analysis of cross section and Panel Data. Cambridge, MA: MIT Press.
This article has been cited by:
1. Guy David, Sara Markowitz. 2016. The Effect of Regulated Competition on PharmaceuticalAdvertising and Promotion. Eastern Economic Journal 41:1, 24-39. [CrossRef]
2. Mary K. Olson. 2013. Eliminating the U.S. drug lag: Implications for drug safety. Journal of Riskand Uncertainty 47, 1-30. [CrossRef]
3. Peter Hilsenrath. 2011. Health expenditure efficiency: implications for pharmaceuticalmarketing. International Journal of Pharmaceutical and Healthcare Marketing 5, 118-134.[CrossRef]
4. Fiona Scott Morton, Margaret KyleMarkets for Pharmaceutical Products11The authors thankTom McGuire for editorial advice and improvements and participants at the Handbook conferencefor helpful suggestions 763-823. [CrossRef]