the effects of pay and benefits on recruiting … · au/acsc/049/1999-04 air command and staff...
TRANSCRIPT

AU/ACSC/049/1999-04
AIR COMMAND AND STAFF COLLEGE
AIR UNIVERSITY
THE EFFECTS OF PAY AND BENEFITS ON RECRUITING
AND RETENTION IN THE US ARMY
by
Scott A. Eisenhauer, Major, US Army
A Research Report Submitted to the Faculty
In Partial Fulfillment of the Graduation Requirements
Advisor: LTC Michael R. Burney
Maxwell Air Force Base, Alabama
April 1999

ii
Disclaimer
The views expressed in this academic research paper are those of the author(s) and do not
reflect the official policy or position of the US government or the Department of Defense. In
accordance with Air Force Instruction 51-303, it is not copyrighted, but is the property of the
United States government.

iii
Contents
Page
DISCLAIMER .................................................................................................................... ii
LIST OF ILLUSTRATIONS .............................................................................................. v
LIST OF TABLES ............................................................................................................. vi
PREFACE .........................................................................................................................vii
ABSTRACT....................................................................................................................... ix
INTRODUCTION............................................................................................................... 1ORIENTATION TO TOPIC......................................................................................... 1PURPOSE OF STUDY................................................................................................. 1METHOD AND PROCEDURES................................................................................. 2DEFINITIONS.............................................................................................................. 2LITERATURE REVIEW ............................................................................................. 2OVERVIEW ................................................................................................................. 3
MILITARY PAY STRATEGIC OBJECTIVES................................................................. 4EFFICIENCY ............................................................................................................... 5EQUITY........................................................................................................................ 5COMPLIANCE............................................................................................................. 6
DOES A PAY GAP EXIST? .............................................................................................. 7INTERNAL CONSISTENCY...................................................................................... 8EXTERNAL COMPETITIVENESS............................................................................ 8SOLDIER CONTRIBUTION..................................................................................... 10ADMINISTRATION.................................................................................................. 10
ANALYSIS OF THE RELATIONSHIP BETWEEN THE PAY GAP AND THEQUALITY/QUANTITY OF PERSONNEL ............................................................... 12RECRUIT QUALITY/QUANTITY........................................................................... 12RETENTION .............................................................................................................. 15
RETIREMENT PLANS.................................................................................................... 18
ANALYSIS OF THE RELATIONSHIP BETWEEN RETIREMENT AND THEQUALITY/QUANTITY OF PERSONNEL ............................................................... 20

iv
RECRUIT QUALITY/QUANTITY........................................................................... 21RETENTION .............................................................................................................. 22
CONCLUSION ................................................................................................................. 27
EMPLOYMENT COST INDEX ANALYSIS.................................................................. 29
DEFENSE EMPLOYMENT COST INDEX ANALYSIS ............................................... 31
RETIREMENT ANALYSIS............................................................................................. 33
GLOSSARY...................................................................................................................... 35
BIBLIOGRAPHY ............................................................................................................. 37

v
Illustrations
Page
Figure 1. The Pay Model..................................................................................................... 4
vi
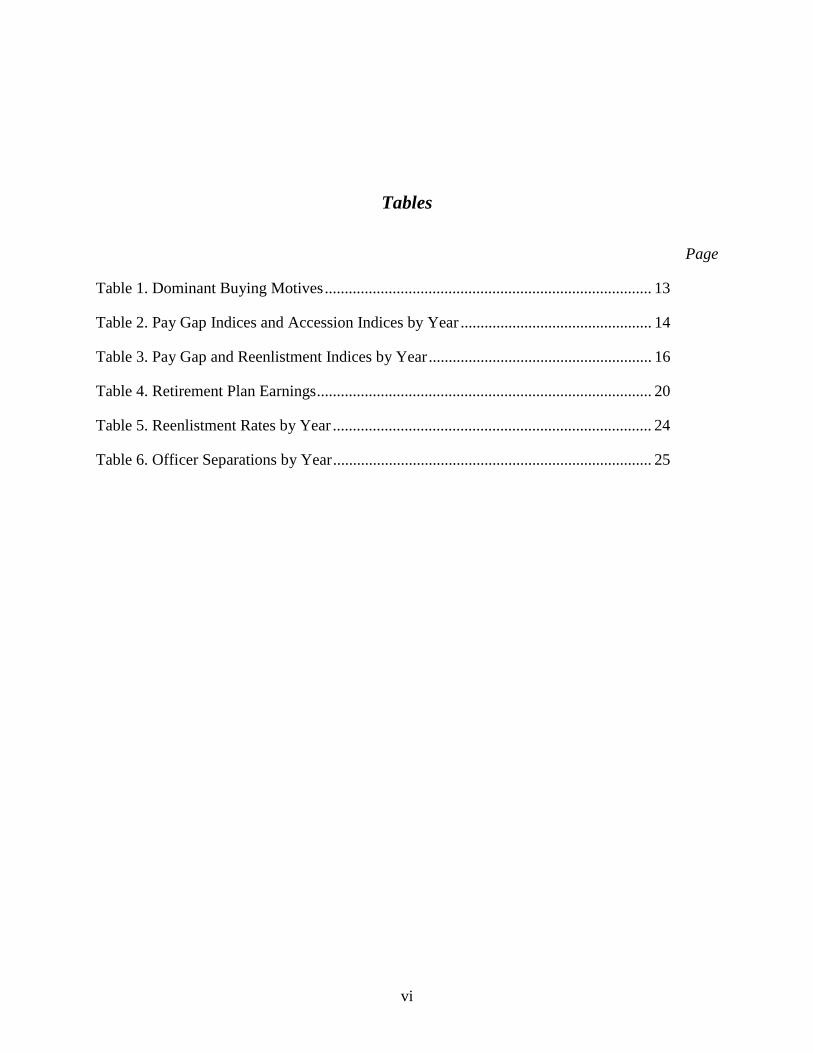
Tables
Page
Table 1. Dominant Buying Motives.................................................................................. 13
Table 2. Pay Gap Indices and Accession Indices by Year ................................................ 14
Table 3. Pay Gap and Reenlistment Indices by Year........................................................ 16
Table 4. Retirement Plan Earnings.................................................................................... 20
Table 5. Reenlistment Rates by Year ................................................................................ 24
Table 6. Officer Separations by Year................................................................................ 25
vii
Preface
This research was prompted by my interest in the relationship of pay and retirement benefits
to recruiting and retention, as well as, the recent increase in public debate concerning military
readiness and pay gaps. This paper will examine past research and examine whether the trends
indicated by previous reports still hold true today. These past trends indicated that military pay
and retirement benefits did have a negative effect on recruiting and retention. Further research
and a formal report has also been directed by Congress in the FY 99 Defense Budget to be
completed by summer 1999.
This work should be of interest to the Secretary of the Army, the Joint Chiefs, and the Army
personnel policy community. This research is currently under revision by RAND’s National
Defense Research Institute, a federally funded research and development center sponsored by the
Office of the Secretary of Defense.
This research would not have been possible without the assistance of Mr. James R. Hosek of
RAND who provided me with the most up-to-date pay gap data. I also would like to thank LTC
Hoscheit, Major Ayer and Richard Graham of the United States Army Recruiting Command for
providing accessions data and an analysis of the Youth Attitudes Tracking Surveys for the last
eight years. Additionally, I would like to thank MSG Barber and LTC Wilmer Sweetser of the
Office of the Deputy Chief of Staff for Personnel for providing the retention data for both
enlisted soldiers and officers over the last eight years. Finally, I would like to express my
viii
gratitude to LTC Michael Burney, Faculty Research Advisor, for providing me with the
necessary points of contact for gathering the data.
ix
AU/ACSC/049/1999-04
Abstract
The last several years there has been a growing concern over the increasing gap between
military and civilian pay. More recently, the relationship between retention and retirement
benefits has been of increasing interest to Members of Congress and Military Personnel officials.
Over the last 10 years, Military Pay and Retirement Benefits did not significantly influence
recruiting, but they become significant factors in the retention of soldiers beyond the initial
enlistment. This report argues that there is no pay gap as it is currently defined. Comparison of
military and civilian compensation as it relates to pay growth is not a true measure of any gap.
Analysis of the data indicates that as the pay gap has increased, there has been a slight increase
in recruiting and retention. This trend, while it negates part of my thesis, does not truly explain
the total relationship between pay and recruiting/retention. There are other factors, such as stop
loss, which during the early 1990’s prevented soldiers from leaving the service due to specialty
shortages and the Gulf War; and the drawdown that have artificially inflated enlisted
reenlistment rates and officer retention. Additionally, recruiting percentages are not an accurate
reflection of the impact of pay on attracting today’s young men and women. As Youth Attitudes
Tracking Surveys (YATS) indicate, the dominant buying motives for the last eight years are
training and education.
Additional factors that outweigh the current pay gap debate and that need serious study are
troop morale; health care; family care; housing, and other quality of life issues. These issues

x
upon further study may indicate the true nature of the Army’s retention problem and provide the
answers we seek.

1
Chapter 1
Introduction
ORIENTATION TO TOPIC
As the United States Army enters the 21st Century, there is a growing concern over the
deterioration of capabilities, specifically as a result of problems in manning the service.
Difficulties in recruiting qualified young men and women and the continuing departure of
experienced soldiers and officers have prompted stronger calls for increased military pay and
benefits. Military Pay and Retirement Benefits – What is the impact on recruiting and retention
in the U.S. Army? This is the major question that members of Congress and the Joint Chiefs are
wrestling with. To ensure the Pentagon looks to improve military pay and benefits,
congressional negotiators added a provision to the 1999 defense appropriations bill ordering a
comprehensive review of current programs.1
PURPOSE OF STUDY
The purpose of this study is to explore Military Pay and Retirement Benefits to determine
what impact they have on recruiting and retention in the U.S. Army. The last several years there
has been a growing concern over the increasing gap between military and civilian pay. As
questions of troop readiness, morale, and quality of life issues arise, several officials’ point to
pay and retirement benefits as the solution. Some argue that military pay has not kept pace with

2
the growth in civilian wages and as a result a “pay gap” exists. The existence of a pay gap and
the different retirement plans are often cited as the main reasons for problems with recruiting and
retention. It appears that pay and benefits do not significantly influence recruiting but they
become significant factors in the retention of soldiers beyond the initial enlistment.
METHOD AND PROCEDURES
This study will include an analysis of the relative pay gap and its’ relationship to recruiting
and retention. Raw data on recruiting and retention percentages have been collected from the
various agencies within the Office of the Secretary of Defense. The primary sources that will be
referred are past reports, current reports, books and newspaper articles.
DEFINITIONS
The pay gap is defined, as the percentage difference in military versus civilian pay growths
as measured from 1982 which is the benchmark year. Since 1992, the official index used to
determine the pay gap is the Employment Cost Index (ECI). Congressional analysts felt this was
a better index to compare military and civilian pay because it was updated quarterly and
provided a broad base for comparison. RAND Corporation developed an alternate index for pay
gap computation called the Defense Employment Cost Index (DECI). This index is believed to
be a better indicator because it utilizes a 5-way analysis that includes age, education, occupation,
gender and ethnicity as a basis for comparing wage trends in the civilian market.
LITERATURE REVIEW
The manner in which the pay gap is determined and its effect on recruiting and retention can
be questioned. A recent report by RAND for the Secretary of Defense indicates that the pay gap

3
is not as significant as it appears and that retirement benefits do not need to be changed.
However, the RAND report recommends a targeted pay raise for junior enlisted and mid-career
officers. This report also challenges the relevance of the military/civilian gap estimate of 13.5%
as it is currently measured. This pay gap estimate is determined by using the Employment Cost
Index (ECI). Congress, in 1992, established this as the official index for determining military
pay raises. Furthermore, this report also challenges the argument that pay and retirement
benefits are the reasons for the current personnel problems.
OVERVIEW
The second chapter will discuss the pay model used by Human Resource Managers and
identify military strategic objectives. Chapter three will investigate whether or not a pay gap
exists. It will look at the strategic policy decisions an organization must make and use them as a
lens to evaluate the existence of a pay gap. The fourth chapter will analyze the data over the past
10 years to see if there is a relationship between the pay gap and recruiting and retention.
Chapter five will discuss the variety of retirement plans that currently exist within the U.S.
Army. The sixth chapter will analyze the current data and determine if there is a trend between
retirement benefits and retention. Chapter seven will conclude with a summary of the overall
findings and results of the study.
Notes
1 Army Times. Clinton: Military needs more money. 5 October 1998, p. 3.
4
Chapter 2
Military Pay Strategic Objectives
In order to understand how Military Pay is determined we need to first understand the basic
pay model that is used by corporate America. Pay systems typically are designed to achieve
three goals: (1) recruit quality employees, (2) motivate them to better performance, and (3) retain
the best employees.
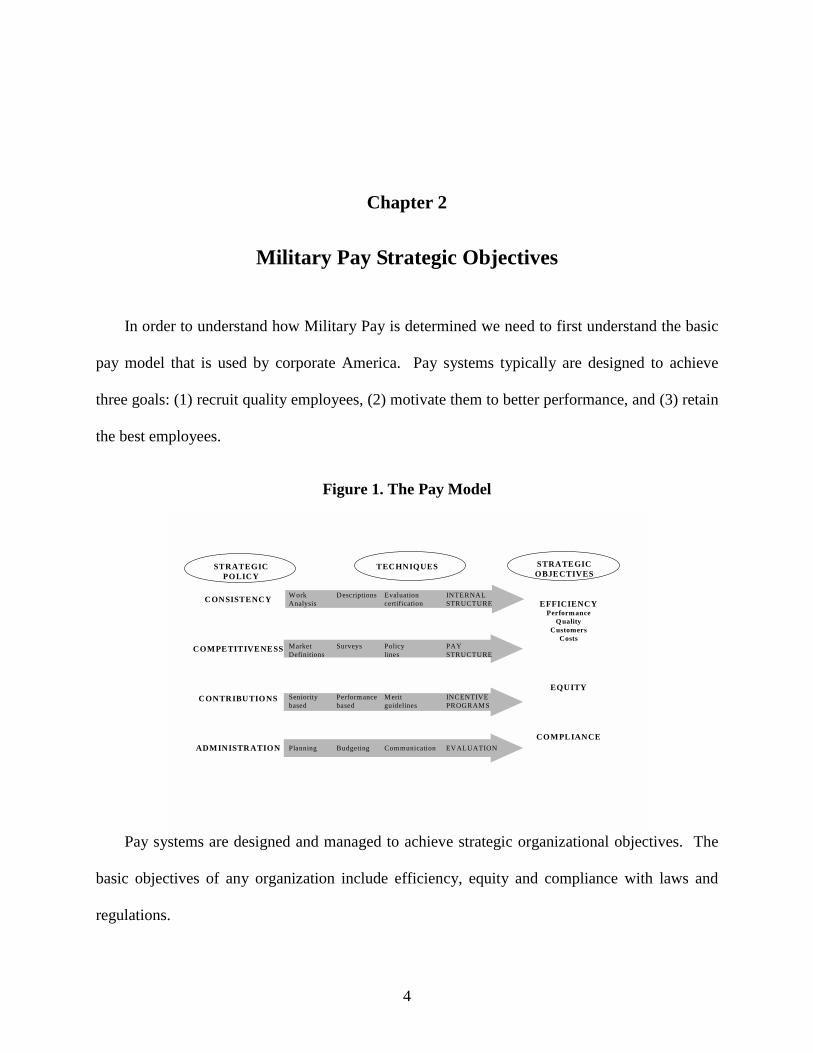
Figure 1. The Pay Model
STRATEGICPOLICY
TECHNIQUES STRATEGICOBJECTIVES
EFFICIENCYPerformance
QualityCustomers
Costs
EQUITY
COMPLIANCE
CONSISTENCY
COMPETITIVENESS
CONTRIBUTIONS
ADMINISTRATION
Work Descriptions Evaluation INTERNALAnalysis certification STRUCTURE
Market Surveys Policy PAYDefinitions lines STRUCTURE
Seniority Performance Merit INCENTIVEbased based guidelines PROGRAMS
Planning Budgeting Communication EVALUATION
Pay systems are designed and managed to achieve strategic organizational objectives. The
basic objectives of any organization include efficiency, equity and compliance with laws and
regulations.
5
EFFICIENCY
The efficiency objective of any organization can be stated more specifically as (1)
improving performance, quality, delighting customers, and (2) controlling costs.1 To improve
performance and quality the pay system must motivate employees by adequately compensating
them. At the same time entry level compensation should be set at levels that will attract the
quantity and quality of applicants that the organization is seeking. Delighting customers is a
function of controlling costs. The organization’s pay system should be set so that consumer
costs are kept to a minimum. This is the crux of the problem for many organizations. The pay
system must maintain that delicate balance between employee wages and customer satisfaction.
Compensation objectives of the Army consist of maintaining its military capability,
recruiting and retaining high quality soldiers, keeping America strong, and staying within it’s
budget as determined by Congress. Military pay is set by Congressional mandate and raises are
arbitrarily set a half a point below the Employment Cost Index (ECI). Many argue that the
current pay system is not adequate enough to attract the quantity and quality of applicants that
the Army needs to stay healthy. It is of interest to note that the Army missed its’ recruiting
mission in Fiscal Year 98 by 1%. However, this report does not attribute this to the growth in
the pay gap.
EQUITY
Equity is fundamental to all pay systems. Statements such as “fair treatment for all soldiers”
or “a fair day’s pay for a fair day’s work” reflect a concern for equity.2 The Army’s equity
objective focuses on designing a pay system that recognizes both soldier contributions
(performance or greater experience or training) and soldier needs (quality of life issues such as
housing or health care). The Army pay system is designed to provide equity by assessing how
6
the work is organized and performed, its relative value, and the knowledge, skills and abilities
(KSAs) required to perform the work. The Army's rank structure and pay schedule attempt to
ensure equity.
COMPLIANCE
Compliance as a pay objective involves conforming to various federal and state
compensation laws and regulations.3 Under law, military compensation is adjusted upward at the
same time and by the same percentage as the average overall percentage of the Federal Civil
Service General Schedule.4 The General Schedule is linked to U.S. Department of Labor’s
Bureau of Labor Statistics’ labor cost measures. Since 1992, the Employment Cost Index has
been the official index for determining the military pay raises within the government.
Notes
1 Milkovich and Newman, Compensation, 1999, p. 10.2 Ibid.3 Ibid, p. 12.4 Burrelli, David F., Military and Civilian Pay: Is There a Gap?, 1995, p.3.
7
Chapter 3
Does a Pay Gap Exist?
Is there really a pay gap or is this debate a politically feasible way to avoid discussing the
real reasons the Army is facing recruiting and retention problems? This report argues that there
is no pay gap as it is currently defined. Comparison of military and civilian compensation as it
relates to pay growth is not a true measure of any gap.
The pay gap is defined, as the percentage difference in military versus civilian pay growths
as measured from 1982 which is the benchmark year. Questions concerning the existence of a
pay gap can be viewed from several perspectives and is often emotional. In an attempt to
remove the emotion, we need to revisit the Pay Model introduced in the previous chapter. There
are three basic building blocks to the pay model: (1) the strategic objectives that form the
foundation of the compensation system, (2) the techniques of compensation, and (3) the
compensation objectives.1
Before Congress and the Department of Defense can effectively implement a pay system
they must address four fundamental policy decisions. These policy decisions are (1) internal
consistency, (2) external competitiveness, (3) soldier contributions, and (4) administration of the
pay system.

8
INTERNAL CONSISTENCY
Internal consistency refers to comparisons among jobs or skill levels inside a single
organization. Jobs and skills are compared in terms of their relative contributions to the
organization’s objectives.2 Service members may compare their pay to those in the same
Military Occupational Specialty (MOS) or to other members of similar rank. Generally, pay gap
discussions currently being held in Congress do not focus on this policy. However, pay
comparisons within the Army affect soldier decisions to stay in, to become more flexible by
investing in additional training, or to seek greater responsibility. By motivating soldiers to
choose increased training and greater responsibility, pay relationships indirectly affect the quality
and efficiency of the total force.
EXTERNAL COMPETITIVENESS
External Competitiveness refers to how an employer positions its pay relative to what
competitors are paying.3 Congress and the Department of Defense need to decide what strategy
they will take in this area. They must choose whether to (1) lead the market, (2) pay the market
rate, or (3) lag the market. This area is where the greatest amount of debate on the pay gap is
occurring. Increasingly, the Army and soldiers draw comparisons of relative growth in their pay
to their civilian counterparts.
The official index used to measure this pay gap is the Employment Cost Index (ECI).
Congressional analysts felt this was a better index to compare military and civilian pay because it
was updated quarterly and provided a broad base for comparison. RAND Corporation developed
an alternate index for pay gap computation called the Defense Employment Cost Index (DECI).
This index is believed to be a better indicator because it utilizes a 5-way analysis that includes

9
age, education, occupation, gender and ethnicity as a basis for comparing wage trends in the
civilian market.
It is important to note that both indices make comparisons of pay growth, not pay
comparability. Both assume that pay comparability was achieved beginning in 1982, after two
major pay hikes. Additionally, neither indices take into account nor discuss such things as
overtime pay, deployments, imminent danger pay, housing allowance, medical benefits, etc.
Both of these indices contain several analytical flaws that weaken the credibility of the pay gap
argument.4
The use of either the ECI or DECI assumes that the issues of military compensation are
“comparable” to those in the civilian sector. Is this a realistic comparison?
“If Proctor & Gamble requires more employees of a particular grade and skill, itcan just increase its incentives and obtain new workers from its competitors. Itdoes not work that way in the military.
Services cannot compete against TWA for more pilots or against Microsoft formore programmers. When a soldier is lost, that soldier is gone, requiringconsiderable dollars and time to develop a replacement.
The services operate in a closed environment, while corporate America operatesin an open one. If the services fail to adequately compensate their personnel whothen leave for greener pastures, entire specialties and grades “go hollow.” Thishas already happened with Air Force pilots, and there are indications it isbeginning to happen across the full spectrum of skills within the Army.”5
Comparable pay for similar work is another flaw of these indices. Neither index can begin
to compare work done in the civilian sector with that of the combat arms (i.e. Infantry, Armor,
Aviation, Field Artillery, etc).
“Those who created this yardstick could not find anyone in the civilian sectordoing work comparable to combat arms. A parenthetical note to the Rand reportstates ‘there is no civilian counterpart to combat arms occupations, so the averagewage growth across civilian occupations was used for personnel in combat arms.’

10
When jobs are scarce and any job will do, it isn’t tough to keep the combat armsfilled. But in a booming economy, the tough, thankless jobs require morecompensation.”6
SOLDIER CONTRIBUTION
The policy on employee contributions refers to the relative emphasis placed on
performance.7 Should one Sergeant or Major be paid differently from another if one has better
performance and/or greater seniority?
The degree of emphasis to be placed on performance and/or seniority is an important policy
decision since it directly affects soldier attitudes and work behaviors. It may be the source of
motivation that causes the soldier to improve performance and/or seek greater responsibilities.
The current Army pay system has seniority/longevity built into it. The pays scale shows
longevity pay increases every two years beginning at the fourth year of service. In addition, this
pay system includes a variety of other incentives.
ADMINISTRATION
The administration of the pay system is the last building block in the pay model. “While it
is possible to design a system that incorporates internal consistency, external competitiveness,
and employee contributions, the system will not achieve its objectives unless it is managed
properly.”8
Currently the Army does a poor job of managing its pay system. Proper management
includes effectively communicating how and in what way soldiers are paid. Many soldiers have
no understanding how their pay is calculated or what their retirement benefits truly are. For most
of them, their knowledge of the pay system is the annual publication of the pay chart. Effective
communication can reduce dissatisfaction among soldiers. Pay officials and commanders must

11
plan the elements of pay included in the system (e.g. base pay, short-term and long-term
incentives), communicate these to soldiers, and judge whether the system is achieving its
objectives.
Are we able to attract quality applicants? Can we keep them? Do our soldiers feel our
system is fair? Do they understand how their pay is determined?
These are just a few of the questions that we need to ask. The information that they provide
is necessary to tune or redesign the system, to adjust to changes, and to highlight potential areas
for further investigation.
Many Congressman and Personnel officials have asked such questions. As a result, we see
the current debate that has surfaced and the several new options that have been recommended for
fixing the system.
Notes
1 Milkovich and Newman, Compensation, 1999, p.10.2 Ibid, p.13.3 Ibid.4 Army Times, Pulling apart the Rand study – flaw by flaw, 28 December 1998, p.19.5 Ibid.6 Ibid.7 Milkovich and Newman, Compensation, 1999, p.14.8 Ibid.

12
Chapter 4
Analysis of the Relationship between the Pay Gap and TheQuality/Quantity of Personnel
The purpose of this chapter is to analyze the data over the last 10 years to see if a
relationship exists. If a relationship does exist, then what impact does it have on recruiting and
retention. Are there other factors that can be attributed to the erosion of readiness?
RECRUIT QUALITY/QUANTITY
The United States Army Recruiting Command (USAREC) uses the acronym TEAMS to
identify the dominant buying motive of applicants during the sales interview. This acronym
stands for Training, Education, Adventure/Travel, Money, and Service to Country. This
approach assists recruiters in structuring the interview to fit the applicants needs. It is also the
focus of recruiting advertisements.
Youth Attitudes Tracking Surveys are conducted yearly of 17 to 21 year olds across the
nation to assess their attitudes towards military service. A review of the dominant buying
motives from the YATS (Table 1) seems to indicate that the young men and women of today do
not view pay as a major concern. The two most prevalent buying motives over the past seven
years have been Training (Get a Skill) and Education (Money for College). We see that the
Army has increased the incentives in these two areas since early 1991 in an effort to continue to
attract high quality applicants. Increased bonuses have been applied to certain critical jobs and

13
the Army College Fund has grown from $20,000 to a new high of $50,000 for a 4-year
enlistment.1
Table 1. Dominant Buying Motives
FISCAL YEAR I-IIIA HIGH QUALITY Dominant Buying Motive1991 66.9 Money For College1992 70.2 Get A Skill1993 61.5 Get A Skill1994 69.5 Money For College1995 68.2 Get A Skill1996 66.8 Money For College1997 68.6 Something to be Proud of1998 67.6 Plan For My Future
Source: Graham, Richard, Review of Dominant Buying Motives Per YATS, Fax Data, Fort Knox,Kentucky: USAREC, October 7, 1998.
The YATS shows that the Army has consistently assessed a high percentage of I-IIIA High
Quality applicants. I-IIIA High Quality applicants are defined as those whom possess a high
school diploma, completed 15 semester hours of college or an adult education diploma and
scored in the upper 50% of the Armed Service Vocational Aptitude Battery (ASVAB). The
results of these surveys are the first indication that the debate over the pay gap and its impact on
recruiting is untenable.
Table 2 shows the growth of the pay gap over the last 10 years using both the ECI and DECI
calculations. It also provides the Army’s accessions data for comparison.
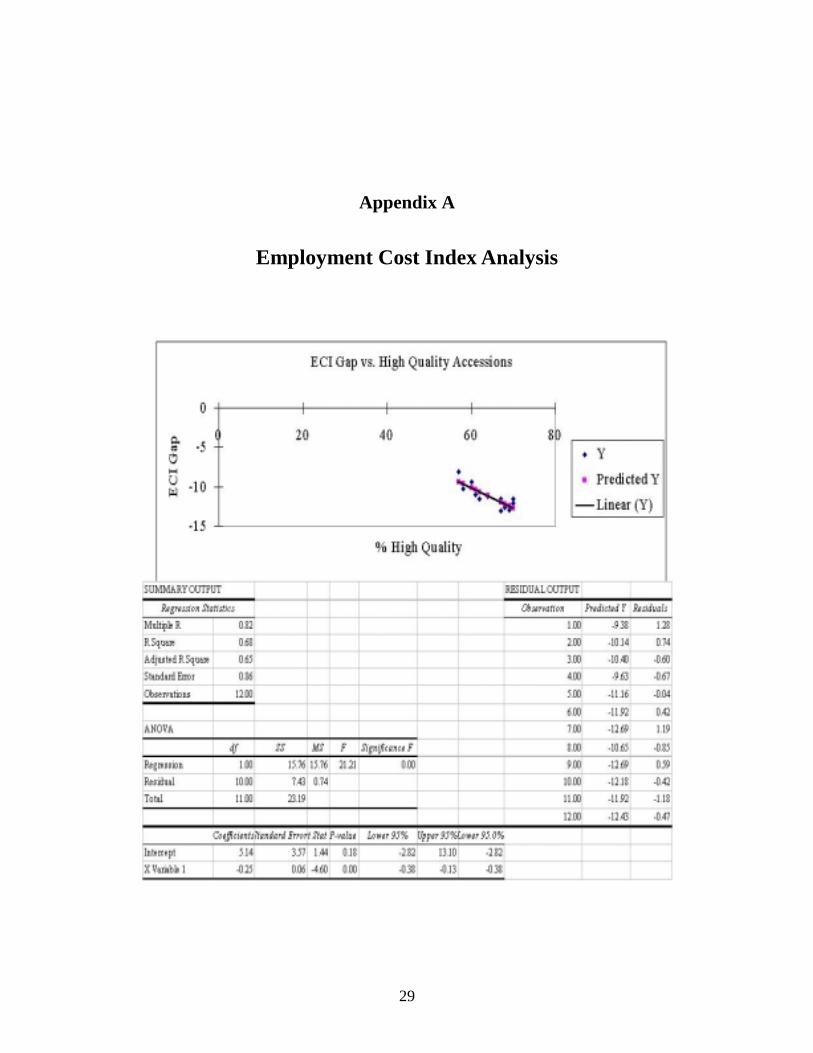
A cursory look at the data contained in the table tends to show an inverse relationship
between the growth in the pay gap and the percentage of High Quality accessions. Appendix A
contains a graphic representation, using regression analysis to compare the ECI Gap to High
Quality Accessions. The graph shows that as the pay gap has continued to grow the accessions
of high quality applicants have actually increased. The analysis of the data provides a reliability

14
coefficient (R2) of .68. This coefficient is sufficiently high enough to be confident in the data
and the trend that it indicates. This runs contrary to arguments that the pay gap has adverse
effects on recruiting.
Table 2. Pay Gap Indices and Accession Indices by Year
YEARECIGap
DECIGap
%HSDG
% AFQTI-IIIA
% HighQuality
1986 -8.1 -0.8 92 64 571987 -9.4 -2.9 93 67 601988 -11.0 -3.8 93 67 611989 -10.3 -6.3 92 64 581990 -11.2 -6.6 95 68 641991 -11.5 -4.8 97.8 66.9 671992 -11.5 -0.2 98.7 70.3 701993 -11.5 5.9 95.6 61.6 621994 -12.1 3.9 94.7 69.5 701995 -12.6 -.7 95.7 68.2 681996 -13.1 -2.2 93.8 66.8 671997 -12.9 -.4 90.1 68.6 69
Source: Pay Gaps calculated using Hosek, James R., ECI and DECI Pay Gap Data Update,Email File. Santa Monica, CA., RAND, October 1998. Accessions data from Graham, Richard,U.S. Army Production FY 1991-FY 1998, Fax Data. Fort Knox, Kentucky: USAREC, October1998.
How can the Army continue to maintain this increase in High Quality Accessions? The
answer is the drawdown. It must be remembered that over the last 10 years the Army has
consistently adjusted the recruiting objectives downward as it dealt with the drawdown. As a
recruiting company commander during the early 90’s, there were times that the overall mission
for the command was reduced. This resulted in the Army making its’ accession mission for the
year. However, Recruiting companies and battalions would still fail to achieve their yearly
accession numbers. This had a negative effect at the recruiter level. Many recruiters, especially
detailed recruiters, became disenchanted with a system that counseled them for failing while they
saw the command and the Army being praised for meeting or exceeding its’ mission

15
requirements. This reduction of the total requirements had the effect of increasing the overall
percentage of High Quality accessions.
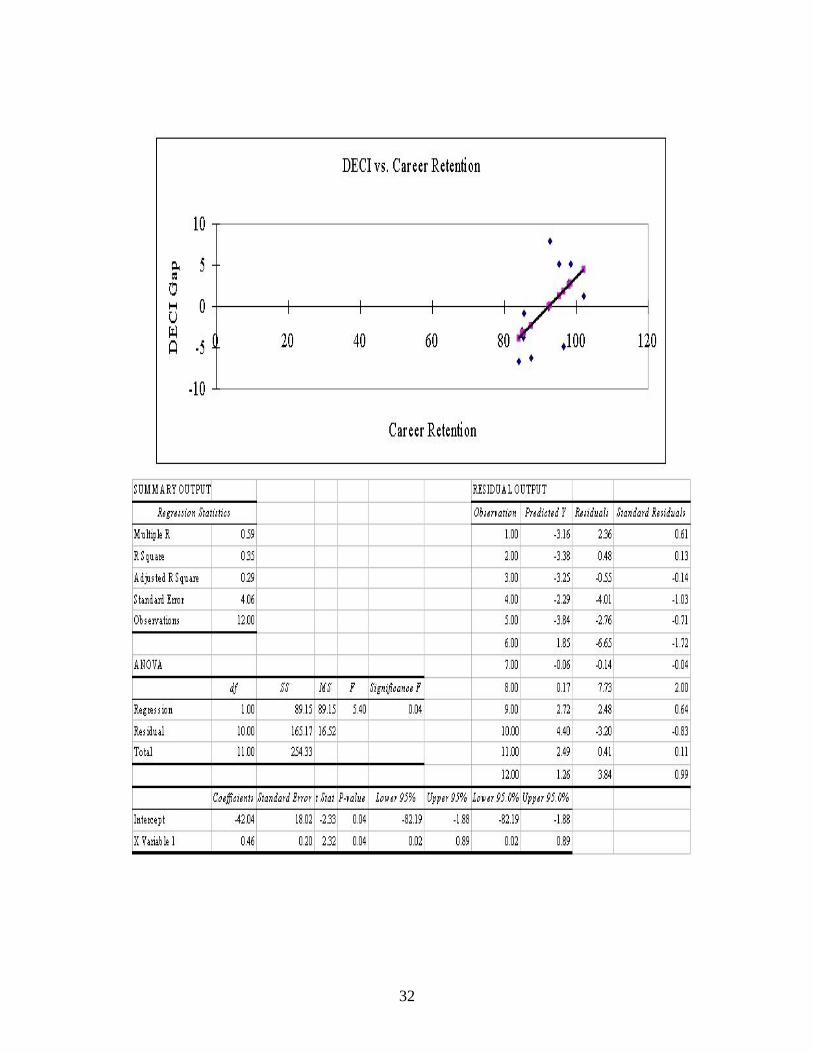
The ECI Gap was used for this analysis because it is the officially recognized basis for
determining pay raises for the military. There are those who would argue that the DECI Gap
should be used. An analysis of the DECI Gap vs. High Quality (Appendix B) would tend to
support the pay gap argument. The trend line indicates that as the pay gap improves so should
recruiting quality. However, the analysis is considered unreliable due to a reliability coefficient
of .15, which is a result of the wide dispersal of data.
The trend indicated by the use of the ECI Gap is further evidence that the pay gap growth
does not have an adverse effect on recruiting. There is no contrary evidence to show a direct link
between pay gap and recruiting.
RETENTION
Retention is the other concern the Army has. As the debate over the impact of the pay gap
continues, several officials both in Congress and DOD point to the gap as the main cause of
retention problems.
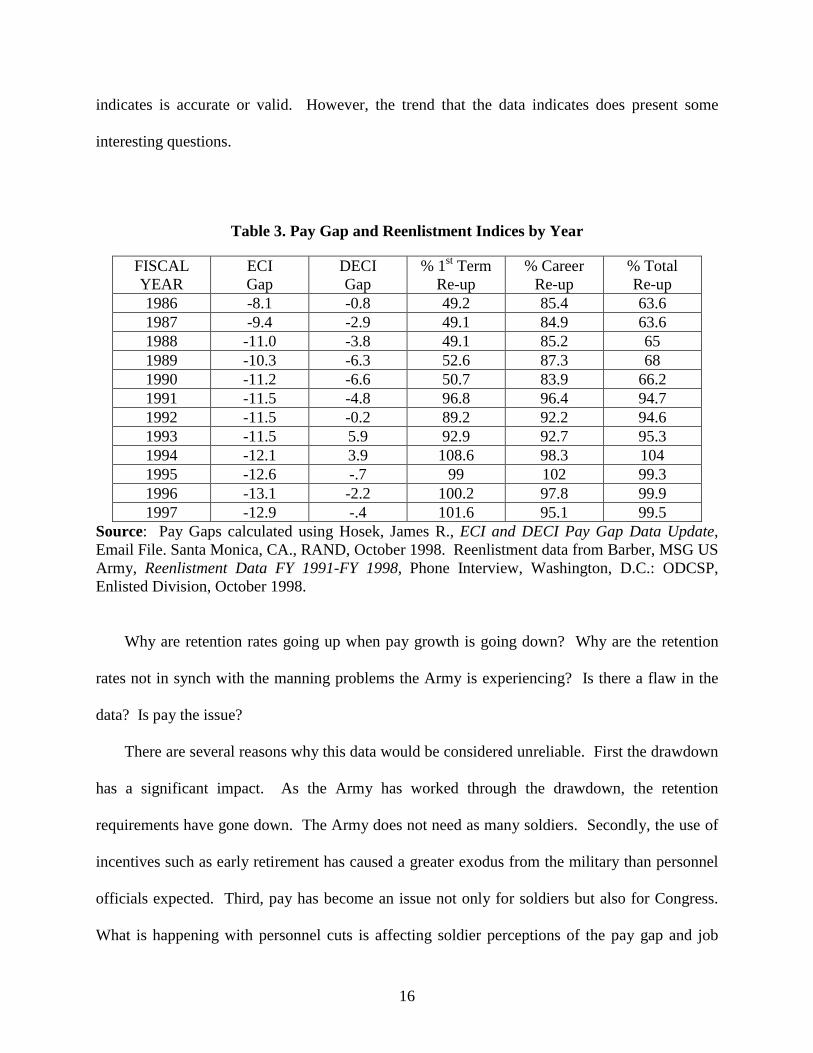
Table 3 provides a comparison of the pay gap growth and soldier reenlistment rates. As we
see by the table, as the ECI Gap has grown reenlistment rates in all categories (1st Term, Career
and Total) have also improved. Again, this inverse relationship runs contrary to the arguments
that are being presented by personnel officials.
Appendix A contains a graphical representation of this data, comparing the ECI Gap to
Career Reenlistment rates. Using regression analysis to plot the best-fit line this report finds a
reliability coefficient (R2) of .59. A r2 of .59 is not high enough to be confident that the trend it
16
indicates is accurate or valid. However, the trend that the data indicates does present some
interesting questions.
Table 3. Pay Gap and Reenlistment Indices by Year
FISCALYEAR
ECIGap
DECIGap
% 1st TermRe-up
% CareerRe-up
% TotalRe-up
1986 -8.1 -0.8 49.2 85.4 63.61987 -9.4 -2.9 49.1 84.9 63.61988 -11.0 -3.8 49.1 85.2 651989 -10.3 -6.3 52.6 87.3 681990 -11.2 -6.6 50.7 83.9 66.21991 -11.5 -4.8 96.8 96.4 94.71992 -11.5 -0.2 89.2 92.2 94.61993 -11.5 5.9 92.9 92.7 95.31994 -12.1 3.9 108.6 98.3 1041995 -12.6 -.7 99 102 99.31996 -13.1 -2.2 100.2 97.8 99.91997 -12.9 -.4 101.6 95.1 99.5
Source: Pay Gaps calculated using Hosek, James R., ECI and DECI Pay Gap Data Update,Email File. Santa Monica, CA., RAND, October 1998. Reenlistment data from Barber, MSG USArmy, Reenlistment Data FY 1991-FY 1998, Phone Interview, Washington, D.C.: ODCSP,Enlisted Division, October 1998.
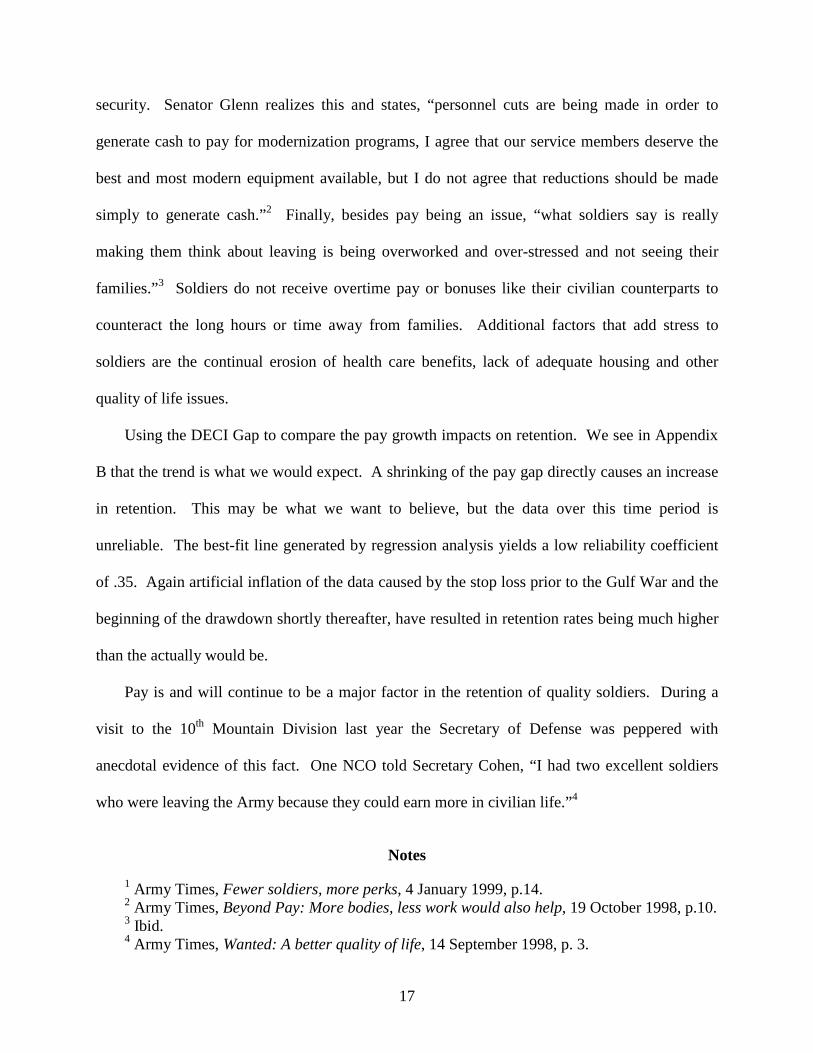
Why are retention rates going up when pay growth is going down? Why are the retention
rates not in synch with the manning problems the Army is experiencing? Is there a flaw in the
data? Is pay the issue?
There are several reasons why this data would be considered unreliable. First the drawdown
has a significant impact. As the Army has worked through the drawdown, the retention
requirements have gone down. The Army does not need as many soldiers. Secondly, the use of
incentives such as early retirement has caused a greater exodus from the military than personnel
officials expected. Third, pay has become an issue not only for soldiers but also for Congress.
What is happening with personnel cuts is affecting soldier perceptions of the pay gap and job
17
security. Senator Glenn realizes this and states, “personnel cuts are being made in order to
generate cash to pay for modernization programs, I agree that our service members deserve the
best and most modern equipment available, but I do not agree that reductions should be made
simply to generate cash.”2 Finally, besides pay being an issue, “what soldiers say is really
making them think about leaving is being overworked and over-stressed and not seeing their
families.”3 Soldiers do not receive overtime pay or bonuses like their civilian counterparts to
counteract the long hours or time away from families. Additional factors that add stress to
soldiers are the continual erosion of health care benefits, lack of adequate housing and other
quality of life issues.
Using the DECI Gap to compare the pay growth impacts on retention. We see in Appendix
B that the trend is what we would expect. A shrinking of the pay gap directly causes an increase
in retention. This may be what we want to believe, but the data over this time period is
unreliable. The best-fit line generated by regression analysis yields a low reliability coefficient
of .35. Again artificial inflation of the data caused by the stop loss prior to the Gulf War and the
beginning of the drawdown shortly thereafter, have resulted in retention rates being much higher
than the actually would be.
Pay is and will continue to be a major factor in the retention of quality soldiers. During a
visit to the 10th Mountain Division last year the Secretary of Defense was peppered with
anecdotal evidence of this fact. One NCO told Secretary Cohen, “I had two excellent soldiers
who were leaving the Army because they could earn more in civilian life.”4
Notes
1 Army Times, Fewer soldiers, more perks, 4 January 1999, p.14.2 Army Times, Beyond Pay: More bodies, less work would also help, 19 October 1998, p.10.3 Ibid.4 Army Times, Wanted: A better quality of life, 14 September 1998, p. 3.
18
Chapter 5
Retirement Plans
The U.S. Army currently has three very distinct retirement plans. First, is the original
retirement plan provides 50 percent of final basic pay after 20 years of service. Second, the
“High 3” which provides 50 percent of the average basic pay for the highest three years of
service. Third, “Redux” pays only 40 percent of the average final basic pay after 20 years of
service. Service members who have complained about the reduced value of their retirement
benefit have pointed primarily to the 40 vs. 50 percent difference according to military personnel
officials and congressional aides.1
Although the military has three retirement systems, depending on when a person entered the
service, the most significant change in retirement plans was implemented in 1986. That year
Congress implemented what would become the "Redux "retirement plan. Those who entered
service after July 31, 1986 are under a retirement system that pays just 40 percent of basic pay
for 20 years of service.
The Center on Budget and Policy Priorities, a civilian watchdog organization, argues that
there were good reasons for this reform. They stated, “There were sound reasons for the reforms
of the mid-1980’s in terms of controlling long-term entitlement costs, curbing excesses in a gold-
plated program and reducing disincentives for skilled personnel to leave the military in their
early 40’s.”2 They believed that this new plan would provide an incentive for soldiers to stay in
19
service longer. It is not having the desired effect. Secretary Cohen stated, “The change made in
1986 was intended to provide an incentive for personnel to remain in service longer. But it is
having just the opposite effect.”3 He was probably referring to the added benefits the retirement
system was to provide to those that stayed beyond 20 years. Those added benefits amounted to
an additional 3.5% of basic pay for every year over 20.
Notes
1 Army Times, 50% Retirement, 26 October 1998, p.4.2 Ibid.3 Army Times, Wanted: A better quality of life, 14 September 1998, p. 3.

20
Chapter 6
Analysis of the Relationship between Retirement and TheQuality/Quantity of Personnel
The sole focus of the debate over the impact of retirement benefits on retention centers on
the Redux retirement plan. Figure 2 shows the impact of this change on soldiers’ earnings.
These numbers are estimates of what each rank could expect to see upon retirement at the end of
20 years beginning in 2000.
Table 4. Retirement Plan Earnings
Rank Final Basic Pay High 3 Redux
O5 $31,667 $30,163 $24,130
O4 $27,399 $26,524 $21,219
E7 $14,882 $14,285 $11,428
E6 $13,035 $12,619 $10,095
So what is the impact of this on recruiting and retention? There is a vast amount of
anecdotal evidence that has been presented to Congress by the Joint Chiefs and Personnel
officials. Representatives have also heard a lot from soldiers during their visits.
21
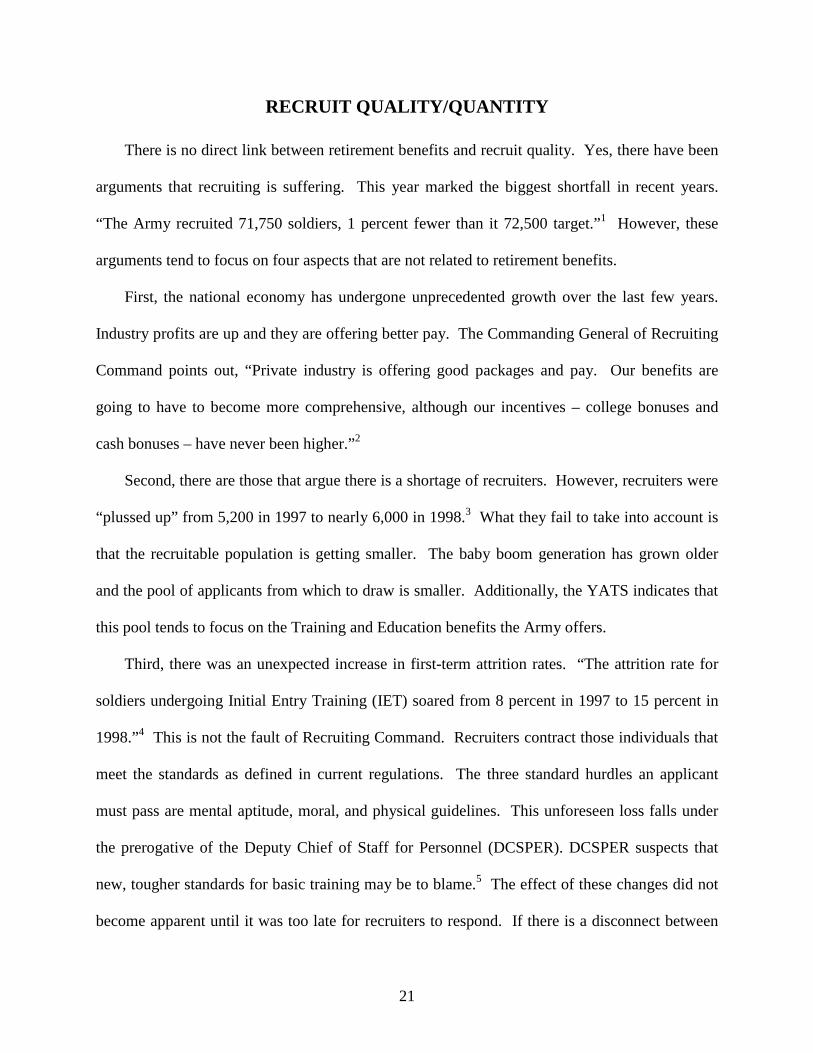
RECRUIT QUALITY/QUANTITY
There is no direct link between retirement benefits and recruit quality. Yes, there have been
arguments that recruiting is suffering. This year marked the biggest shortfall in recent years.
“The Army recruited 71,750 soldiers, 1 percent fewer than it 72,500 target.”1 However, these
arguments tend to focus on four aspects that are not related to retirement benefits.
First, the national economy has undergone unprecedented growth over the last few years.
Industry profits are up and they are offering better pay. The Commanding General of Recruiting
Command points out, “Private industry is offering good packages and pay. Our benefits are
going to have to become more comprehensive, although our incentives – college bonuses and
cash bonuses – have never been higher.”2
Second, there are those that argue there is a shortage of recruiters. However, recruiters were
“plussed up” from 5,200 in 1997 to nearly 6,000 in 1998.3 What they fail to take into account is
that the recruitable population is getting smaller. The baby boom generation has grown older
and the pool of applicants from which to draw is smaller. Additionally, the YATS indicates that
this pool tends to focus on the Training and Education benefits the Army offers.
Third, there was an unexpected increase in first-term attrition rates. “The attrition rate for
soldiers undergoing Initial Entry Training (IET) soared from 8 percent in 1997 to 15 percent in
1998.”4 This is not the fault of Recruiting Command. Recruiters contract those individuals that
meet the standards as defined in current regulations. The three standard hurdles an applicant
must pass are mental aptitude, moral, and physical guidelines. This unforeseen loss falls under
the prerogative of the Deputy Chief of Staff for Personnel (DCSPER). DCSPER suspects that
new, tougher standards for basic training may be to blame.5 The effect of these changes did not
become apparent until it was too late for recruiters to respond. If there is a disconnect between

22
recruiting and IET standards, then the Army needs to focus their attention on aligning the
standards and not by throwing more money at an already small recruiting pool.
Finally, there are arguments that “Our recruiters didn’t have all the equipment they should
have had.”6 This argument makes one wonder how the Army made its recruiting mission before
the age of technology. The better argument is we need to look at how we get our message out.
Are the national advertisements effective? Do we need to put more money into regional
advertising in order to influence the diversity within those populations?
As the arguments tend to point out, the shortfalls in recruiting are do to a robust economy,
competitive pay, and a lack of resources to do the job. There is no evidence to indicate that
retirement benefits have any impact on the Army’s ability to recruit.
RETENTION
The 40 percent plan “is increasingly perceived by our military members as simplynot good enough to justify making a career of the military.”
—Gen. Henry SheltonChairman of the Joint Chiefs
The epitaph above is just one example of the anecdotal evidence that Congressman and
Personnel officials use to link the manning problems of today’s Army with the continued
reduction in retirement benefits. While there is no evidence of exit surveys being done with
soldiers as they depart the Army, we can look to the enlisted retention rates and officer
separation rates and determine what trends may or may not support this argument.
Tables 4 and 5 show the enlisted reenlistment and officer separation rates for the last 10
years. A graphical representation of trends can be found in Appendix C. As we can see by
looking at the data both in the tables and in Appendix C, the trend is upward in both situations.
23
The enlisted retention rates show a steady increase in all categories reaching historical highs
in fiscal years 1994 and 1995. This runs contrary the argument that the Redux retirement plan is
having an adverse impact on retention.
There are two overriding reasons for this increase. First, the implementation of the stop loss
program prior to the Gulf War prevented several soldiers from leaving the service. At that time
many soldiers were becoming dissatisfied with the service and the continual erosion of their
retirement benefits. How many would have actually stayed is left for debate. However, during
discussions with several officers while preparing this report, many indicated that several of the
soldiers that had worked for them were looking to leave.
The second reason that can be attributed to the rise in retention rates occurs in the post-Gulf
War years. With Congressionally mandated end-strengths, the drawdown provided many
dissatisfied soldiers the opportunity to leave the service. This had the effect of reducing
retention goals. With smaller retention goals it became easier to find those soldiers who wanted
to stay and thus easier to meet or exceed those goals.

24
Table 5. Reenlistment Rates by Year
FISCALYEAR
% 1st TermRe-up
% CareerRe-up
% TotalRe-up
1986 49.2 85.4 63.61987 49.1 84.9 63.61988 49.1 85.2 651989 52.6 87.3 681990 50.7 83.9 66.21991 96.8 96.4 94.71992 89.2 92.2 94.61993 92.9 92.7 95.31994 108.6 98.3 1041995 99 102 99.31996 100.2 97.8 99.91997 101.6 95.1 99.5
Source: Reenlistment data from Barber, MSG US Army, Reenlistment Data FY 1991-FY 1998,Phone Interview, Washington, D.C.: ODCSP, Enlisted Division, October 1998.
An additional effect of the drawdown found the Army working against itself. On one hand
the Army was offering early retirement to those soldiers who qualified as a means to meet yearly
end-strength goals. However, this created more dissatisfaction among the soldiers because it was
only offered to certain MOSs. The flip side of this also caused the Army to boost reenlistment
bonuses because it created significant unforeseen shortfalls in these MOSs. We still see the
effects of this today as the Army continues to boost reenlistment bonuses for some MOSs to as
much as $20,000.
It is the belief of this report that removing the effects of these programs would truly show
the poor state of readiness of the U.S. Army. This lack of readiness is not only a factor of
retirement benefits but also to the increased OPTEMPO and reduced quality of life that is
associated with it. Some experts believe, “more people and fewer missions might give military
morale a bigger boost than higher pay and better retirement benefits.”7

25
Officer separation rates are no better. Table 5 shows the raw percentages for the last 10
years and a graphical representation can be found in Appendix C.
Table 6. Officer Separations by Year
FISCALYEAR
% O1-O4Separations
% O5-O6Separations
% TotalSeparations
1986 5.2 1.7 8.21987 6.1 1.8 9.01988 5.8 1.7 8.91989 5.4 2.2 9.01990 7.5 2.1 11.31991 5.0 1.5 8.11992 9.5 3.2 151993 9.5 3.3 14.91994 7.4 2.4 11.31995 6.6 2.3 10.61996 6.5 1.7 9.81997 6.6 2.0 10
Source: Separation data from Sweetser, Wilmer LTC, US Army, Officer Separation Data Files,FY 1986-FY 1998, Email Files, Washington, D.C., ODCSP: Officer Division, October 1998.
Again, we see the same upward trend as we saw with the enlisted soldiers. This trend can be
attributed to the same reasons that we saw for enlisted soldiers. The drawdown and restructuring
of the Army had the effect of reducing the number of required officers. To encourage officers to
leave, the Army again offered an early retirement plan.
Additionally, as officers in year groups 86 and later began to fully realize the impact of the
Redux retirement plan they began to weigh their commitment to military service against what
they could earn in the booming economy. This is evident by the almost twofold increase in
separations for Lieutenants through Majors during this time frame.
As deployments continually increased and enlisted soldiers left the Army, officers
continually found themselves trying to accomplish the same missions with fewer soldiers. There
are many units currently in the Army that are undermanned. Having to eliminate a squad from a
platoon in order to maintain the other squads at full strength does not give that platoon leader the
26
same capability. This has contributed to the frustrations experienced by many officers and has
led them to reconsider their choice of careers.
Notes
1 Army Times, Recruiting deficit looms larger, 9 November 1998, p. 12.2 Army Times, Coming Up Short, 9 November 1998, p. 13.3 Army Times, Recruiting deficit looms larger, 9 November 1998, p. 12.4 Army Times, Coming Up Short, 9 November 1998, p. 13.5 Ibid.6 Ibid.7 Army Times, Beyond pay: More bodies, less work would also help, 19 October 1998, p.
10.

27
Chapter 7
Conclusion
People are the most important enabler of our National Military Strategy. To recruit and
retain people, who meet high military standards, the quality of life of our military personnel must
be commensurate with the sacrifices we ask them to make.1 We must provide adequate
compensation, medical care, housing, and a stable retirement system. We must manage the
tempo of operations, deployments and personnel transfers to avoid adverse effects on our people
and their families.
Over the last 10 years, Military Pay and Retirement benefits have not had a significant
impact on recruiting. The YATS studies indicate that today’s youth predominately join the
Army for two reasons: Training and Education. Additionally, the stop loss program, the
drawdown, and the restructuring of the Army had the effect of reducing the mission of recruiters.
The Army needed fewer new enlistees to keep the ranks full.
Military Pay and Retirement Benefits become significant factors in retaining quality soldiers
and officers. Although analysis of the data negates this portion of my thesis, it is not a true
reflection of what is happening. It does matter what you pay soldiers. It matters what you pay
for and it matters how you pay. If the Army and Congress are to fix the retention problems, they
must develop a pay system that integrates both strategic and compensation objectives and apply
28
techniques that help them achieve them. This requires a thorough job analysis and a
determination of just what value they put on a soldier’s work.
Other factors that need serious study and must be incorporated into the current pay gap
debate are troop morale; health care; family care; housing, and other quality of life issues. These
issues upon further study may indicate the true nature of the Army’s retention problem and
provide the answers we seek. Perceptions may be stronger than reality. The increase in
Optempo is putting pressure on both service members and their families. If readiness is to
improve we need to rethink the commitment of forces worldwide.
Notes
1 National Military Strategy, 1997, p.28.
29
Appendix A
Employment Cost Index Analysis

30

31
Appendix B
Defense Employment Cost Index Analysis
32

33
Appendix C
Retirement Analysis

34
35
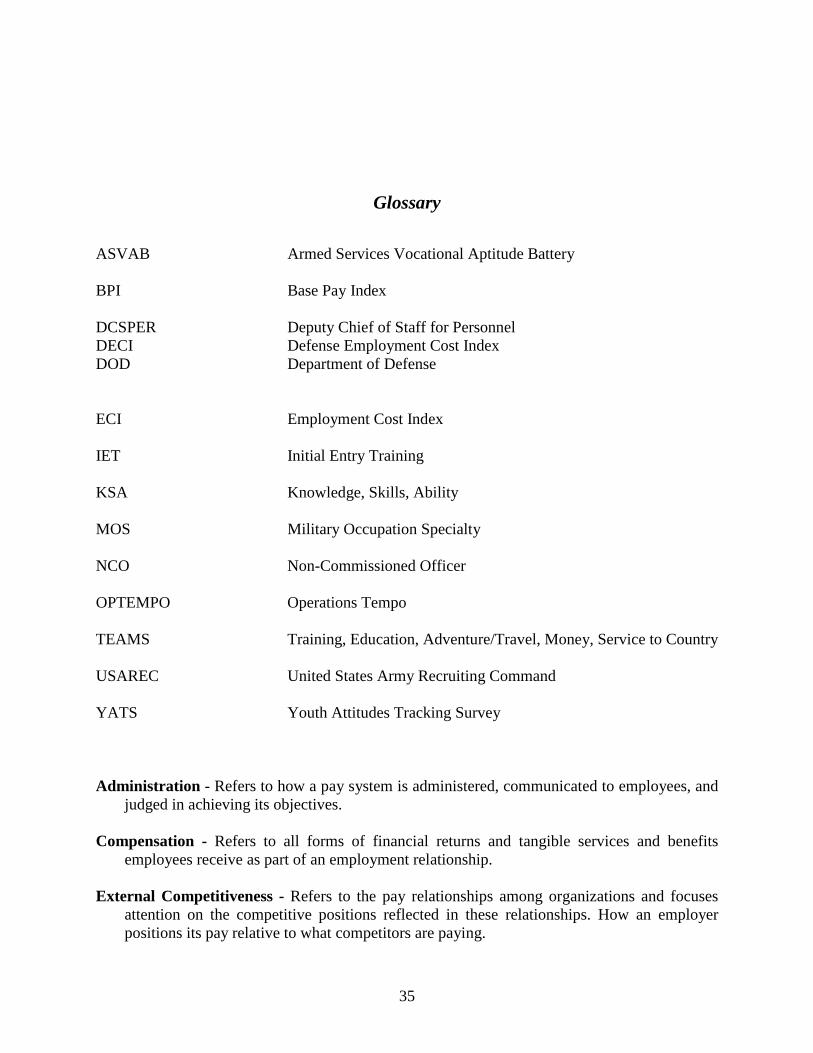
Glossary
ASVAB Armed Services Vocational Aptitude Battery
BPI Base Pay Index
DCSPER Deputy Chief of Staff for PersonnelDECI Defense Employment Cost IndexDOD Department of Defense
ECI Employment Cost Index
IET Initial Entry Training
KSA Knowledge, Skills, Ability
MOS Military Occupation Specialty
NCO Non-Commissioned Officer
OPTEMPO Operations Tempo
TEAMS Training, Education, Adventure/Travel, Money, Service to Country
USAREC United States Army Recruiting Command
YATS Youth Attitudes Tracking Survey
Administration - Refers to how a pay system is administered, communicated to employees, andjudged in achieving its objectives.
Compensation - Refers to all forms of financial returns and tangible services and benefitsemployees receive as part of an employment relationship.
External Competitiveness - Refers to the pay relationships among organizations and focusesattention on the competitive positions reflected in these relationships. How an employerpositions its pay relative to what competitors are paying.

36
Internal Consistency - Refers to the pay relationships among jobs or skill levels within a singleorganization and focuses attention on employee and management acceptance of thoserelationships. It involves establishing equal pay for jobs of equal worth and acceptable paydifferentials for jobs of unequal worth.
I-IIIA High Quality - Those applicants whom possess a High School Diploma, completion of15 semester hours of college, or an adult education diploma and score in the upper 50% onthe Armed Services Vocational Aptitude Battery.
Pay Gap. The percentage difference in military versus civilian pay growths as measured from1982 which is the benchmark year.
Soldier Contribution. Refers to comparisons among individuals doing the same job for thesame organization.

37
Bibliography
Army Times, October 5, 1998.Army Times, October 19, 1998.Army Times, October 26, 1998.Army Times, September 14, 1998.Army Times, November 9, 1998.Army Times, December 28, 1998.Army Times, January 4, 1999.Barber, MSG US Army. Reenlistment Data FY 1991-FY 1998. Phone Interview. Washington,
D.C.: Office of Deputy Chief of Staff for Personnel, Enlisted Division for Retention Policy,Oct 1998.
Binkin, Martin, and Irene Kyriakopoulos. Paying the Modern Military. Washington, D.C.: TheBrookings Institution, 1981.
Burrelli, David F. Military and Civilian Pay: Is There a Gap?. Washington, D.C.: Library ofCongress, Congressional Research Service, 1995.
Graham, Richard. U.S. Army Production FY 1991-FY 1998. Fax Data. Fort Knox, Kentucky:USAREC, October 7, 1998.
Graham, Richard. Review of Dominant Buying Motives Per YATS. Fax Data. Fort Knox,Kentucky: USAREC, October 7, 1998.
Helms, Richard O. Military Pay Comparability. Washington, D.C.: The Industrial College of theArmed Forces, 1993
Hosek, James R. ECI and DECI Pay Gap Data Update. Email File. Santa Monica, Calif.: RAND,October 5, 1998.
Hosek, James R., Christine E. Peterson, Joanna Zorn Heilbrunn. Military Pay Gaps and Caps.RAND Report (Santa Monica, Calif.: RAND, 1994).
Milkovich, George T. and Jerry M. Newman. Compensation.New York. The McGraw-HillCompanies, Inc., 1999.
Montgomery Advertiser, October 30, 1998.National Military Strategy of the United States, 1997.Sweetser, Wilmer LTC, US Army. Officer Separation Data Files, FY 1986-FY 1998. Email
Files. Washington, D.C.: Office of Deputy Chief of Staff for Personnel, Officer Division,Oct 1998.
DISTRIBUTION A:
Approved for public release; distribution is unlimited.
Air Command and Staff CollegeMaxwell AFB, Al 36112