the effects of parkinson’s disease … · mimetics on the proteasomal and neurofilament systems...
TRANSCRIPT

THE EFFECTS OF PARKINSON’S DISEASE
MIMETICS ON THE PROTEASOMAL AND
NEUROFILAMENT SYSTEMS IN
SH-SY5Y CELLS
Begoña Caneda-Ferrón
A thesis submitted in partial fulfilment of the requirements of
Nottingham Trent University for the degree of Doctor of
Philosophy
This research programme was carried out in collaboration with The School
of Biomedical Sciences, Nottingham University
November 2006

DECLARATION
This work has not been accepted for any other degree and is not concurrently being
submitted for any other degree.
We certify that the work submitted was carried out by the author. Due
acknowledgement has been made of any assistance received.
Signed…………………………………(candidate)
Signed…………………………………(Director of studies)

ACKNOWLEDGMENTS
I would like to truly thank my supervisors, Professor Ellen Billett, Dr. Luigi De Girolamo and Dr. Rob Layfield for all of their help, time and support. I would also like to thank everybody in lab 106 (past and present) for their support and for all the good times we have spent together: Julia, Aslι, Rich, Heidi, Teresa, Gino, Katy, Sheryl, Cristoph, Flo, David M., Michelle, Wayne, Alan and Debbie. I just can not imagine a better lab to work in. I take with me a bunch of good friends and my soul full of good memories. Thank you mates! Isn’t it great to work in such a good atmosphere? I would also like to thank all my friends here and back in Spain for their constant support in both good and rough times: Lee-Anne, Nati, Juncal, Alessandra, Shakthi, Carmina, Juancho, Paula, Tony, Lisa and Sonia. And from Tarragona: Loyda, Valentín, Peke, Jordi, David A., Nil, Anna, Sergi, Marta, Esther, Annabel i Rovi. I extend my thanks also to every single person who has shared or is sharing with me this wonderful trip through life. I wouldn’t be the same person without you. As I always say life is for sharing and friendship makes the trip nicer! Finally, I want to dedicate this thesis to my family, mamá, papá, abuelos, Ana, Raul, Maite, Nines my nephews and niece Pol, Jordi, Estanis and Paula. I give my biggest thank you to you for all your love, understanding and support. AGRADECIMIENTOS Me gustaría agradecer a mis tutores Professor Ellen Billet, Dr. Luigi de Girolamo y Dr. Rob Layfield su gran ayuda, tiempo y apoyo ofrecidos. También me gustaría dar las gracias a todos los miembros del laboratorio 106 (antiguos y actuales) por su apoyo y por los buenos momentos compartidos: Julia, Aslι, Rich, Heidi, Teresa, Gino, Katy, Sheryl, Cristoph, Flo, David M., Michelle, Wayne, Alan y Debbie. Simplemente me resulta imposible imaginar un laboratorio mejor que este. Me llevo un montón de buenos amigos y el alma llena de recuerdos maravillosos. Gracias! Es genial trabajar en tan buen ambiente. También me gustaría dar las gracias a mis amigos, en Nottingham y en Tarragona por su gran apoyo, tanto en los buenos como en los malos momentos: Lee-Anne, Nati, Juncal, Alessandra, Shakti, Carmina, Juancho, Paula, Tony, Lisa y Sonia. Y en Tarragona: Loyda, Valentín, Peke, Jordi, David A., Sancho, Nil, Anna, Sergi, Marta, Esther, Annabel i Rovi. De hecho le doy las gracias a cada una de las personas que han compartido o comparten conmigo el camino de la vida. No sería la misma persona sin vosotros. Y como siempre digo, la vida es compartir y la amistad hace el camino mas agradable! Para acabar, quiero dedicar esta tesis a mi familia: mamá, papá, Ana, Raul, Maite, Nines y mis sobrinos Pol, Jordi, Estanis y Paula. Os doy mis más sinceras gracias por vuestro cariño, comprensión y apoyo.
ii

ABSTRACT
The effects of Parkinson’s Disease mimetics on the proteasomal and the neurofilament
systems in SH-SY5Y cells
Mitochondrial impairment, glutathione depletion and oxidative stress have been implicated in
the pathogenesis of Parkinson’s disease, linked recently to proteasomal dysfunction. This study
analyses how these factors influence the various activities of the proteasome in SH-SY5Y
human neuroblastoma cells treated with the PD mimetics MPP+ (a complex I inhibitor) or
dopamine. Treatment with these toxins led to dose and time dependent reductions in ATP and
glutathione levels and also chymotrypsin-like and postacidic-like activities; however, trypsin-
like activity was unaffected. Antioxidants blocked the effects of dopamine but not MPP+,
suggesting that oxidative stress was more important in the dopamine-mediated effects. With
MPP+, ATP depletion was a pre-requisite for loss of proteasomal function.
This study also shows that addition of MPP+ or dopamine to purified samples of the human
20S proteasome also reduced proteasomal activities; with dopamine being most damaging. As
was the case with toxin-treated cells chymotrypsin-like activity was the most sensitive and
trypsin-like activity, the least sensitive. The direct effect of both compounds on proteasomal
activity was, at least, partly due to oxidative damage to the proteasome, since the antioxidant
vitamin C could partially alleviate the proteasomal impairment. Indeed, Western blot analyses
showed that some of the β- and α-subunits of the proteasome were modified by dopamine
treatment.
One of the hallmarks of Parkinson’s disease is the appearance of Lewy bodies, which are
protein inclusions containing α-synuclein, neurofilament proteins and ubiquitinated proteins. A
growing body of evidence suggests that the UPS might be involved in the formation of these
aggregates. This thesis, reports that neurofilaments can undergo proteasomal degradation and
that MPP+ and dopamine alter the expression/phosphorylation and distribution of these
cytoskeletal proteins in SH-SY5Y cells. Therefore aberrant changes in both neurofilament
profiles and proteasomal degradation may influence inclusion formation in dopaminergic
neurons.
iii

LIST OF ABBREVIATIONS
AD: Alzheimer’s disease
AOEs: Antioxidant enzymes
AP: Alkaline phosphatase
ATP: Adenosine 5’triphosphate
BCIP: 5-bromo-4-chloro-3-indolyl-phosphate (di-sodium salt)
BSA: Bovine serum albumin
BSO: L- buthionine-[S,R]-sulfoximine
CLA: Chymotrypsin-like activity
CDK-5: cyclin-dependent kinase 5
CNS: central nervous system
DA: Dopamine
DCHDF: 2,7-dichlorodihydrofluorescein diacetate
DHF: dichlorodihydrofluorescein
DMEM: Dulbecco’s Modified Eagle’s Medium
DMSO: Dimethyl sulfoxide
E1: Ubiquitin-activating enzyme
E2: Ubiquitin-conjugating enzyme
E3: Ubiquitin ligase
EDTA: Ethylenediamine
EGTA: Ethylene glycol bis(2-aminoethyl ether)-N,N,N'N'-tetraacetic acid
ERK: Extracellular signal related kinase
FBS: Foetal bovine serum
FITC: Fluorescein Isothiocyanate
GDR: Glutathione reductase
GSH: Reduced glutathione
GSH Px: Glutathione peroxidase
GSSG: Oxidised glutathione
GTP: Guanosine 5’triphosphate
HRP: Horseradish peroxidase
JNK: c-jun N-terminal kinase
iv
LB: Lewy Body
MAO: monoamine oxidase
MAPs: Microtubule associated proteins
MF: Microfilament
MPDP+: 1-methyl-4-penyl-2,3 dihydropyridinium
MPP+: 1-methyl-4-phenylpyridinium ion
MTP: Mitochondrial transition pore
MPTP: 1-methyl-4-phenyl-1,2,3,6 tetrahydropyridine
MT: microtubule
mtDNA: mitochondrial DNA
MTOC: Microtubule organizing centre
MTP: Mitochondrial transition pore
MTT: 3-[4-5-Dimethylthiazol-2-yl]-2,5-diphenyl tetrazolium bromide
NAC: N-acetylcysteine
NTB: Nitro blue tetrazolium
NF: Neurofilaments
NF-H: Neurofilament heavy-chain
NF-L: Neurofilament light-chain
NF-M: Neurofilament medium-chain
NADH: Nicotinamide dehydrogenase
NO: Nitric oxide
NOS: Nitric oxide synthase
6-OHDA: 6-hydroxydopamine
PBS: Phosphate buffered saline
PD: Parkinson’s disease
PLA: Postacidic-like activity
pNF-H: Phosphorylated neurofilament heavy chain
pNF-M: Phosphorylated neurofilament medium chain
ROS: Reactive oxygen species
SDS-PAGE: Sodium dodecylsulphate polyacrilamide gel electrophoresis
SEM: Standard error of the mean
SN: Substantia nigra
v

SNpc: Substantia nigra pars compacta
SOD: Superoxide dismutase
TBS: Tris buffered saline
Thr: Threonine
TLA: Trypsin-like activity
UCH-L1: Ubiquitin carboxyl-terminal hydrolase L1
UPS: Ubiquitin proteasomal system
vi

LIST OF CONTENTS
CHAPTER I
1. General introduction……………………………………………………... 2
1.1 Parkinson’s disease………………………………………………………… 2
1.1.1 Disease pathology and clinical features……………………………. 2
1.1.2 Factors involved in the disease……………………………………. 4
1.1.2.1 Mitochondrial dysfunction……………………………… 4
1.1.2.2 Oxidative stress: role of DA and loss of glutathione………. 5
1.1.2.2.1 Antioxidant defence systems in the brain………………….. 6
1.1.2.2.2 Role of DA in ROS formation in PD………………………. 7
1.1.2.2.3 Glutathione level is reduced in PD brains………………….. 8
1.1.2.3 Environmental factors……………………………………… 9
1.1.2.4 Genetic factors……………………………………………... 10
1.1.2.5 Defects in protein degradation and neurodegeneration……. 14
1.1.3 Lewy bodies………………………………………………………... 15
1.1.3.1 Protein aggregation and LB formation in PD……………… 16
1.2 The Ubiquitin Proteasomal system………………………………………… 17
1.2.1 Proteasome structure……………………………………………….. 20
1.2.1.1 20S catalytic core…………………………………………... 21
1.2.1.2 The 19S regulatory particle………………………………… 24
1.3 Toxins used in PD models…………………………………………………. 25
1.3.1 MPTP model……………………………………………………….. 25
1.3.1.1 Bioactivation and toxicity of MPTP……………………….. 26
1.3.1.2 Role of oxidative stress in MPTP toxicity…………………. 27
1.3.1.3 Species differences and formation of insoluble aggregates... 29
1.3.2 Rotenone…………………………………………………………… 30
1.3.3 6-hydroxydopamine (6-OHDA)……………………………………. 30
1.3.4 Dopamine.....……………………………………………………….. 31
1.4 The neuronal cytoskeleton…………………………………………………. 31
1.4.1 Microfilaments……………………………………………………... 32
1.4.2 Microtubules……………………………………………………….. 32
vii

1.4.3 Neurofilaments…………………………………………………….. 33
1.4.3.1 Neurofilament structure and assembly…………………….. 33
1.4.3.2 Post-translational modifications of NFs…………………….35
1.4.3.3 The role of NF in axons……………………………………. 36
1.4.3.4 Transport of NF proteins…………………………………… 37
1.5 Aims of project…………………………………………………………….. 38
CHAPTER II
2. Materials and Methods…………………………………………………... 41
2.1 Materials…………………………………………………………………… 41
2.1.1 Cell culture…………………………………………………………. 41
2.1.1.1 Reagents……………………………………………………. 41
2.1.1.2 Plastic ware………………………………………………… 41
2.1.2 Specialised laboratory reagents……………………………………. 41
2.1.3 Antibodies………………………………………………………….. 44
2.1.3.1 Primary Antibodies………………………………………… 44
2.1.3.2 Secondary Antibodies……………………………………… 44
2.1.4 Specialised equipment……………………………………………... 45
2.1.4.1 General laboratory reagents………………………………... 46
2.2 Methods……………………………………………………………………. 46
2.2.1 Cell culture…………………………………………………………. 46
2.2.1.1 Maintenance of SH-SY5Y cells……………………………. 46
2.2.1.2 Sub-culture…………………………………………………. 46
2.2.1.3 Viable cell counting and seeding…………………………... 47
2.2.1.4 Cryo-preservation of cells………………………………….. 47
2.2.1.5 Resuscitation of cryo-preserved cells……………………… 47
2.2.2 Assessment of cell viability: MTT tetrazolium salt assay for anchorage
dependent cells……………………………………………………………….. 47
2.2.3 ATP assay………………………………………………………….. 48
2.2.4 Preparation of cell lysates………………………………………….. 49
viii
2.2.4.1 Total protein extraction from cells for detection of ….......... 49
neurofilament proteins in response to proteases
inhibitors and toxins
2.2.4.2 Protein extraction from cells for measuring 26S/20S
proteolytic activity…………………...….……………….….49
2.2.5 Estimation of protein in cell extracts………………………………. 50
2.2.5.1 Mini-Lowry method………………………………………... 50
2.2.5.2 Bio-Rad protein assay……………………………………….50
2.2.6 Fluorogenic peptide assay for protease activity……………………. 50
2.2.6.1 20S/26S proteasomes activity ………………………………50
2.2.6.2 Fluorogenic peptide assay for calpain activity……………... 51
2.2.7 Measurement of total glutathione levels…………………………… 51
2.2.8 Denaturing polyacrylamide gel electrophoresis (SDS-PAGE).......... 52
2.2.8.1 Preparation of polyacrylamide resolving gels……………….52
2.2.8.2 Preparation of stacking gel…………………………………. 53
2.2.8.3 Preparation of samples for SDS-PAGE……………………. 54
2.2.8.4 Acetone precipitation of protein…………………………… 54
2.2.9 2D SDS- PAGE……………………………………………………. 54
2.2.9.1 IPG Strip Re-hydration…………………………………….. 55
2.2.9.2 Sample preparation………………………………………… 55
2.2.9.3 Isoelectric focusing (IEF)………………………………….. 55
2.2.9.4 2D SDS-PAGE…………………………………………….. 56
2.2.9.4.1 Preparation of resolving gel………………………………... 56
2.2.9.4.2 IPG strip equilibration………………………………………57
2.2.9.5 Silver staining of the 2D SDS-PAGE……………………… 57
2.2.10 Western blotting and immunoprobing of proteins…………………. 58
2.2.10.1 Western blotting……………………………………………. 58
2.2.10.2 Immunoprobing……………………………………………..58
2.2.10.2.1 Preparation of nitrocellulose for immunoprobing………….. 58
2.2.10.2.2 Blocking of non-specific antibody binding and …..……....58
immunoprobing with primary and secondary antibodies
2.2.10.3 Alkaline phosphatase development system………………... 61
ix

2.2.10.4 Enhanced chemiluminescence development system………. 61
2.2.10.5 Stripping and re-probing membranes……………………….62
2.2.10.6 Quantification of Western blots……………………………. 62
2.2.11 Detection of reactive oxygen species by confocal microscopy……. 62
2.2.12 Immunocytochemical analysis of proteins………………………….62
2.2.13 Statistical analysis………………………………………………….. 63
CHAPTER III
3. Effect of PD mimetics on proteasomal activity in SH-SY5Y cells……... 65
3.1 Introduction………………………………………………………………… 65
3.1.1 UPS involvement in PD pathogenesis……………………………... 65
3.1.2 Proteasomal impairment in PD cellular models……………………. 66
3.1.3 SH-SY5Y human neuroblastoma cell line…………………………. 67
3.1.4 Aims of chapter…………………………………………………….. 67
3.2 Results ………………………………………………………………………69
3.2.1 Characterisation of a proteasome activity assay for SH-SY5Y cells.. 69
3.2.1.1 Effect of protein content…………………………………… 69
3.2.1.2 Relative proteasomal activities in SH-SY5Y cells…..……… 70
3.2.1.3 Specificity of the different fluorogenic substrates…………..70
for proteasomal activity
3.2.2 Effect of MPP+ and dopamine on proteasomal activity……………. 77
3.2.2.1 Assessment of cell viability after exposure to toxins………. 77
3.2.2.2 Effect of MPP+ and dopamine on proteasomal activities….. 79
3.2.3 Direct effect of MPP+ and dopamine on SH-SY5Y cell extracts….. 83
3.2.4 Effect of MPP+ and dopamine on CLA, ATP and glutathione…….. 84
levels of SH-SY5Y cells
3.2.5 Effect of toxins on the proteasome is partly due to oxidative stress.. 88
3.2.5.1 Effect of N-acetyl cysteine on proteasomal activity after…..88
toxic insult
3.2.5.2 Assessment of reactive oxygen species (ROS) formation…..91
in SH-SY5Y cells by confocal microscopy
x

3.2.5.3 Effect of glutathione depletion in CLA and ATP levels…….94
on SH-SY5Y
3.2.5.3.1 Assessment of reactive oxygen species (ROS) formation….. 95
after glutathione depetion
3.2.5.3.2 Effect of glutathione depletion on CLA after 72 h toxic……...96
insult
3.2.6 Effect of chronic exposure to low doses of MPP+ and dopamine……..97
on proteasomal activity
3.3 Discussion……………………………………………………………………...99
3.3.1 Specificity of fluorogenic substrates for measuring proteasomal……...99
activities and protease inhibitors
3.3.2 Effects of MPP+ and dopamine on proteasome activity………………..101
3.3.3 Effects of PD mimetics on proteasome activity, glutathione and……. 102
ATP levels
3.3.3.1 Effects of MPP+ and dopamine on CLA………………………102
3.3.3.1.1 Mechanisms of MPP+-mediated CLA impairment……………103
3.3.3.1.2 Mechanism of dopamine -mediated CLA impairment………..104
3.3.3.2 Effect of BSO on CLA……………………………………......105
3.3.4 Chronic exposure to low levels of toxins impairs proteasomal……… 106
function
CHAPTER IV
4. MPP+, MPTP and dopamine direct effect on purified 20S proteasome……..108
4.1 Introduction…………………………………………………………………...108
4.1.1 The 20S proteasome…………………………………………………..108
4.1.2 Aims of chapter……………………………………………………….109
4.2 Results………………………………………………………………………...110
4.2.1 Effect of MPP+, MPTP and dopamine on 20S proteasomal activities...110
4.2.2 Effect of the antioxidants on toxin induced 20S proteasome…………112
impairment
4.2.2.1 Screening for the most suitable antioxidant…………………..112
xi
4.2.2.2 Protective effect of vitamin C on CLA from purified 20S……114
proteasome treated with various toxins
4.2.3 Effects of MPP+, MPTP and dopamine on trypsin enzyme activity….116
4.2.3.1 Effect of vitamin C on trypsin enzyme activity after toxic.......118
insult
4.2.4 Effect of toxins on purified 20S proteasomal subunits………………..119
4.3 Discussion…………………………………………………………………......127
4.3.1 MPTP/ MPP+ and dopamine have a direct effect on 20S ………….…127
proteolytic activities
4.3.1.1 Direct effect of the toxins on 20S proteasome is partly……….130
due to oxidative modification of the proteasome
4.3.1.2 The proteasome is slightly more sensitive to DA than………..130
a general protease
4.3.2 Structural modification of the 20 S α and β subunits by the toxins…..131
CHAPTER V
5. Effects OF PD mimetics on neurofilament turnover………………………135
5.1 Introduction…………………………………………………………………....135
5.1.1 Presence of NFs in LB…………………………………………………135
5.1.2 Effect of neurotoxins on NF expression and post-translational...……..136
modifications
5.1.3 Degradation of NFs…………………………………………………....137
5.1.4 Aims of chapter………………………………………………………..137
5.2 Results………………………………………………………………………....139
5.2.1 Neurofilaments can partly be degraded by the proteasome…………...139
5.2.2 Changes in NF profiles following exposure to MPP+ ………………...145
5.2.3 Changes in NF profiles following exposure to MPP+, dopamine……..149
and protease inhibitors
5.2.4 Effects of 100 μM and 2 mM MPP+ on NFs distribution……………..152
5.2.5 Changes in NF proteins in SH-SY5Y cells following chronic………..155
exposure to MPP+ and dopamine
xii
5.2.5.1 Western blotting analysis of NF profiles after 3 and………….155
7 weeks exposure to MPP+ and dopamine
5.2.6 Immunocytochemical analyses of NF proteins after 3 and 7 weeks…..158
exposure to MPP+ and dopamine
5.3 Discussion……………………………………………………………………..161
5.3.1 NFs can partly be degraded by the proteasome……………………….161
5.3.2 Changes in NF profiles after treatment with toxins…………………...162
5.3.3 Effect of chronic exposure to low levels of MPP+ and dopamine…….166
on NFs levels and distribution
CHAPTER VI
6. General discussion…………………………………………………………...170
6.1 Effects of MPP+ and dopamine on proteasome activity………………………170
6.1.1 Role of ATP and ROS in toxin-mediated proteasome impairment…...170
6.1.2 Direct effects of toxins on proteasome activity……………………….172
6.2 Effects of MPP+ and dopamine on the NF system……………………………174
6.3 Conclusions…………………………………………………………………...176
CHAPTER VI
7. Reference list…………………………………………………………………179
xiii

LIST OF FIGURES
CHAPTER I
Figure 1.1. Overview of the potential mechanisms involved in the development…....4
of PD
Figure 1.2. Reactive oxygen species produced by the mitochondria and…………..…6
associated antioxidant defence systems
Figure 1.3. Synthesis of glutathione…………………………………………………...9
Figure 1.4. The Ubiquitin-Proteasome System…………………………………….....20
Figure 1.5. 26S proteasome complex…………………………………………………21
Figure 1.6. Chemical structures of MPTP, MPP+, rotenone, 6-OHDA and…………..25
dopamine
Figure 1.7. Summary of the mechanisms involved in MPTP toxicity………………...27
Figure 1.1.8 Structure of NF proteins…………………………………………………35
CHAPTER III
Figure 3.1. Inhibitory effect of epoxomicin on TLA from SH-SY5Y cells, 20S……. 75
proteasome or calpain activity
Figure 3.2. Inhibitory effect of 10 μM epoxomicin on CLA, TLA and PLA ………...76
from SH-SY5Y cells
Figure 3.3. Assessment of cell viability in SH-SY5Y cells after MPP+, DA………….78
and BSO exposure over time
Figure 3.4. Direct effect of MPP+ and DA on 20 S proteasomal activity of ………….83
SH-SY5Y cell extracts.
Figure 3.5. Effect of MPP+ on CLA, ATP and glutathione levels of SH-SY5Y………86
over time
Figure 3.6. Effect of DA on CLA, ATP and glutathione levels of SH-SY5Y cell…….87
extracts
Figure 3.7. Effect of NAC on CLA from SH-SY5Y after 72h toxic insult with ……...88
MPP+ and DA
Figure 3.8. Morphological changes in SH-SY5Y cells after 72h treatment with ……..90
2 mM MPP+, 2 mM DA and 1 mM NAC
xiv

Figure 3.9. Assessment of ROS formation by confocal microscopy………………… 93
Figure 3.10. Effects of 2 mM BSO on CLA, ATP and glutathione levels of ………...94
SH-SY5Y over time.
Figure 3.11. Assessment of ROS formation by confocal microscopy………………...95
Figure 3.12. Effect of glutathione depletion on CLA, of SH-SY5Y after 72h………...96
toxic insult with 100 μM MPP+ and DA.
Figure 3.13. Effect of chronic treatment with 10 μM MPP+ and DA on ……………..98
proteasomal activities
CHAPTER IV
Figure 4.1. Effect of MPP+, MPTP and DA on CLA (A), TLA (B) and PLA (C)……111
of commercial 20S proteasome.
Figure 4.2. Effect of vitamin C on toxin induced proteasome impairment………........115
Figure 4.3. Effect of vitamin C on trypsin enzyme activity after toxic insult ………...118
with 2 mM DA.
Figure 4.4. Two- dimensional electrophoretic reference map of human 20S………....121
proteasome
Figure 4.5. Two-dimensional SDS-PAGE of 20S purified proteasome from…………121
human erythrocytes treated.
Figure 4.6. Two dimensional SDS-PAGE of 20S purified proteasome from…………124
human erythrocytes treated with 2 mM MPP+ and DA.
Figure 4.7. Western blot analysis of 20S core subunits after treatment with……….....126
2 mM MPP+ and DA
CHAPTER V
Figure 5.1. Morphological assessment of SH-SY5Y cells after 24 h treatment……….141
with cycloheximide (10 μg/ml), lactacystin (2.5 μM) and BSO (2mM).
Figure 5.2. Western blot analysis of NF proteins in mitotic cells after 24 h………….144
exposure to proteasome inhibitors and/or BSO.
Figure 5.3. Changes in NF profiles after 24, 48 and 72 h exposure to 100 μM ……....148
and 500 μM MPP+ in SH-SY5Y cells
xv

Figure 5.4. Effect of proteasome and calpain inhibition on NF profiles after toxic…..151
insult.
Figure 5.5. Immunocytochemical analysis of NF proteins in SH-SY5Y cells………..157
following 72 h treatment with MPP+.
Figure 5.7. Immunocytochemical analysis of NF proteins in SH-SY5Y cells ……….160
following chronic treatment with MPP+ and DA.
Figure 5.8. Overview of the effects of proteasome and calpain inhibition on the…….162
NF system in control SH-SY5Y cells.
Figure 5.9. Overview the effects of high levels of MPP+ (A) and DA (B)……………165
on the NF system.
Figure 5.10. Overview of the effects of chronic exposure to 10 μM MPP+ and….......167
DA on the NF system in SH-SY5Y cells
CHAPTER VI
Figure 6.1. Overview of MPP+ and DA effects on UPS and NF system as…………..177
detailed in this thesis and current literature
xvi
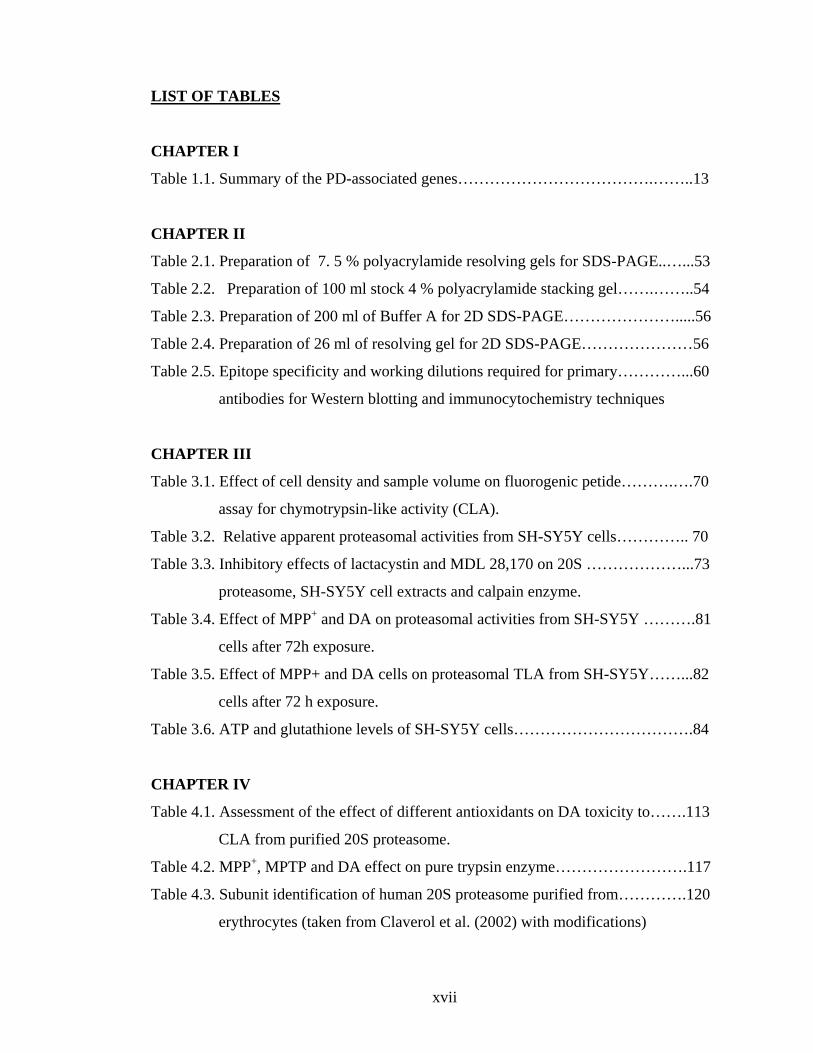
LIST OF TABLES
CHAPTER I
Table 1.1. Summary of the PD-associated genes……………………………….……..13
CHAPTER II
Table 2.1. Preparation of 7. 5 % polyacrylamide resolving gels for SDS-PAGE..…...53
Table 2.2. Preparation of 100 ml stock 4 % polyacrylamide stacking gel…….……..54
Table 2.3. Preparation of 200 ml of Buffer A for 2D SDS-PAGE………………….....56
Table 2.4. Preparation of 26 ml of resolving gel for 2D SDS-PAGE…………………56
Table 2.5. Epitope specificity and working dilutions required for primary…………...60
antibodies for Western blotting and immunocytochemistry techniques
CHAPTER III
Table 3.1. Effect of cell density and sample volume on fluorogenic petide……….….70
assay for chymotrypsin-like activity (CLA).
Table 3.2. Relative apparent proteasomal activities from SH-SY5Y cells………….. 70
Table 3.3. Inhibitory effects of lactacystin and MDL 28,170 on 20S ………………...73
proteasome, SH-SY5Y cell extracts and calpain enzyme.
Table 3.4. Effect of MPP+ and DA on proteasomal activities from SH-SY5Y ……….81
cells after 72h exposure.
Table 3.5. Effect of MPP+ and DA cells on proteasomal TLA from SH-SY5Y……...82
cells after 72 h exposure.
Table 3.6. ATP and glutathione levels of SH-SY5Y cells…………………………….84
CHAPTER IV
Table 4.1. Assessment of the effect of different antioxidants on DA toxicity to…….113
CLA from purified 20S proteasome.
Table 4.2. MPP+, MPTP and DA effect on pure trypsin enzyme…………………….117
Table 4.3. Subunit identification of human 20S proteasome purified from………….120
erythrocytes (taken from Claverol et al. (2002) with modifications)
xvii

Table 4.4. Subunit identification of human 20S proteasome purified from………….122
erythrocytes.
Table 4.5. Comparison of the effects of toxins on the different proteasomal………..129
activities from commercial 20S proteasome.
Table 4.6. Summary of changes in immunoreactivity of 20S proteasomal subunits…133
following toxin treatment revealed by immunoblotting.
CHAPTER V
Table 5.1. Inhibitory effect of lactacystin on endogenous CLA in SH-SY5Y cells… 139
Table 5.2. Treatments of SH-SY5Y cells for analysis of NF degradation via the……140
proteasome
Table 5.3. Summary of effects of toxins and/or protease inhibitors on NF profiles….163
Table 5.4. Summary of the effects of 3 and 7 weeks treatment with 10 μM MPP+ ….167
and DA on NF levels and phosphorylation
xviii

CHAPTER I
GENERAL INTRODUCTION
CHAPTER I- GENERAL INTRODUCTION
2
1. GENERAL INTRODUCTION
1.1 PARKINSON’S DISEASE
Parkinson’s disease (PD) is a severe, progressive motor disorder of the central nervous
system, which was first described by the English physician, James Parkinson in 1817. It
is reported to be the second most common neurodegenerative disease, the occurrence of
which increases with age, affecting about 1 % of the population over 65. PD is mostly
presented as a sporadic form, although in rare instances genetic forms of the disease
also exist (5-10 % of all cases; reviewed by Wood-Kaczmar et al., 2006; see section
1.1.2.4 for further information). Whilst the aetiology of sporadic PD remains
unresolved, its pathogenesis is understood to be a consequence of a multifactorial
cascade of deleterious events (Prezedborsky, 2005).
1.1.1 Disease pathology and clinical features
It is widely accepted that PD primary pathology is due to the degeneration of the
dopaminergic neurons of the substantia nigra pars compacta (SNpc). This results in low
levels of brain dopamine (DA) in the striatum, responsible for the motor symptoms.
Although it is commonly thought that the neuropathology of PD is characterised solely
by dopaminergic neuron loss, the neurodegeneration extends well beyond dopaminergic
neurons. Indeed, non-nigral lesions lead to cognitive and psychological impairments ie.
dementia, sometimes seen in PD (reviewed by Blum et al. 2001 and Dauer and
Przedborsky, 2003).
Another neuropathological feature of the disease is the appearance of Lewy bodies
(LB), which are prominent intracytoplasmic inclusions of proteinaceous material
containing mainly lipids, neurofilaments, α-synuclein, ubiquitinated proteins and
proteasome subunits (Forno, 1996; Floor and Wetzel, 1998; Good et al. 1998; Kowal et
al 2000; Lopiano et al. 2000; McNaught and Ollanow, 2006). However, the role of
Lewy bodies in the parkinsonian brain remains controversial (Chung et al., 2001a; Mc
Naught et al., 2001; Barzilai and Melamed, 2003; Dauer and Pzredborsky, 2003;
Shoesmith and Paulson, 2003; see section 1.1.3 for further details).
The mechanisms responsible for the specific death of dopaminergic neurons remain
unresolved; however, age, genetic factors and the action of environmental and intrinsic
CHAPTER I- GENERAL INTRODUCTION
3
The clinical manifestations of PD include bradykinesia (slowness of movement), gait
abnormalities, resting tremor, postural instability and muscular rigidity (reviewed by
Beal M.F. 2001 and Wood-Kaczmar et al., 2006). Symptoms appear only after loss of
50-70% of nigral DA neurons; this can be explained by the fact that the brain contains
an excess of DA fibers (reviewed by Blum et al. 2001 and Barzilai and Melamed,
2003).
Disease is normally treated by administration of the DA precursor L-dopa (L-3, 4-
dihydroxyphenylalanine) which can cross the blood-brain barrier boosting DA synthesis
in the cells that remain alive in the substantia nigra, thus alleviating most of the
symptoms (Beal, 2001). Unfortunately, over the years L-dopa provokes involuntary
movements (termed “dyskinesias”) in patients, which significantly impair their quality
of life. All current treatments for PD address the symptoms, although present research
is focused on the prevention of DA neuron degeneration. However, it is a difficult goal
due to the ignorance of the specific molecular events that provoke neurodegeneration in
PD (Dauer and Przedborsky, 2003).
CHAPTER I- GENERAL INTRODUCTION
4
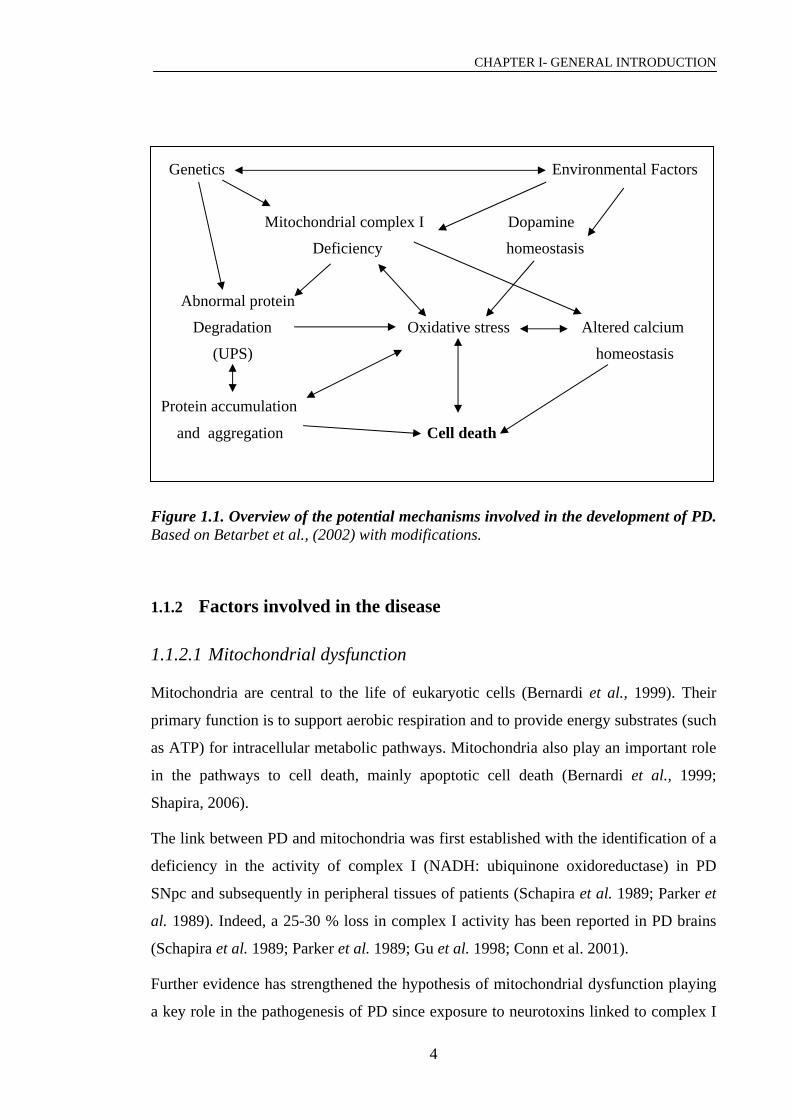
Genetics Environmental Factors
Figure 1.1. Overview of the potential mechanisms involved in the development of PD. Based on Betarbet et al., (2002) with modifications.
1.1.2 Factors involved in the disease
1.1.2.1 Mitochondrial dysfunction
Mitochondria are central to the life of eukaryotic cells (Bernardi et al., 1999). Their
primary function is to support aerobic respiration and to provide energy substrates (such
as ATP) for intracellular metabolic pathways. Mitochondria also play an important role
in the pathways to cell death, mainly apoptotic cell death (Bernardi et al., 1999;
Shapira, 2006).
The link between PD and mitochondria was first established with the identification of a
deficiency in the activity of complex I (NADH: ubiquinone oxidoreductase) in PD
SNpc and subsequently in peripheral tissues of patients (Schapira et al. 1989; Parker et
al. 1989). Indeed, a 25-30 % loss in complex I activity has been reported in PD brains
(Schapira et al. 1989; Parker et al. 1989; Gu et al. 1998; Conn et al. 2001).
Further evidence has strengthened the hypothesis of mitochondrial dysfunction playing
a key role in the pathogenesis of PD since exposure to neurotoxins linked to complex I
Mitochondrial complex I Dopamine
Deficiency homeostasis
Abnormal protein
Degradation Oxidative stress Altered calcium
(UPS) homeostasis
Protein accumulation
and aggregation Cell death
CHAPTER I- GENERAL INTRODUCTION
5
inhibition, such as 1-methyl-4-phenyl-1,2,3,6-tetrahydropyridine (MPTP) or rotenone,
can lead to parkinsonism in humans or animal models (Beal, 2001, Betarbet et al.,
2000).
Complex I is the largest of the electron transport chain macrocomplexes and consists of
46 subunits, seven of which are coded for by mitochondrial DNA (mtDNA). The
remaining 39 subunits are coded by nuclear genes, imported into mitochondria, and
assembled with the mtDNA-encoded subunits in a complicated process (Keeney et al.,
2006). Decreased complex I activity primarily results in ATP depletion in cells but also
in an increase of free radicals which may be responsible for the oxidative mediated
damage observed in PD. Reciprocally, free radicals may also damage the mitochondria
(reviewed by Schapira, 2006).
Recent studies from Keeney and co-workers (2006) provide further understanding of the
nature of mitochondrial dysfunction in PD since they report that reduced complex I
activity in PD brain mitochondria appears to arise from oxidation of its catalytic
subunits from internal processes (reproduced by using NADH to drive electrons through
complex I and blocking the transfer of electrons with rotenone at the quinone reduction
site), not from external oxidative stress (reproduced by exposure to H2O2), and this
correlates with complex I misassembly. They argue that complex I auto-oxidation may
derive from abnormalities in mitochondrial or nuclear encoded subunits, assembly
factors, rotenone-like complex I toxins or some combination (Keeney et al., 2006).
1.1.2.2 Oxidative stress: role of DA and loss of glutathione
As introduced earlier, oxidative stress accompanied by a reduction in glutathione
content are also believed to contribute to PD pathogenesis (Jenner and Olanow, 1996;
Schulz et al., 2000; Jha et al., 2002; Mytilineou et al., 2002). Floor and Wetzel (1998)
found that oxidative stress is elevated in SNpc in comparison with other regions
resulting in elevated oxidative damage which may contribute to the degeneration of
nigral dopaminergic neurons in ageing and in PD.

CHAPTER I- GENERAL INTRODUCTION
6
1.1.2.2.1 Antioxidant defence systems in the brain
ROS are generated in the brain as products of normal cell metabolism (eg. normal 02
intake, aerobic respiration and oxidative metabolism of DA and other substrates) but
also in response to internal and external toxins (reviewed by Prasad et al., 2000).
Particularly, the electron transport chain is an important source of ROS derived from
oxidative phosphorylation (Hughes et al., 2005).
Cellular damage occurs when production of ROS exceeds the available antioxidant
defence system. The antioxidant defence system of cells include the enzymes
superoxide dismutase (SOD), catalase, glutathione peroxidase (GSH Px) and
glutathione reductase (GRD). An overview of the generation of ROS and the action of
the antioxidant enzymes (AOEs) is included in Figure 1.2. Since energy production in
neurons (ie. ATP) depends mainly on oxidative phosphorylation, and the brain contains
lower amounts of antioxidant molecules and AOEs than other tissues, neurons are
usually more exposed to oxidative damage (reviewed by Mytilineou et al., 2002).
Electron Transport Chain → 4 free e- + 4O2 → 4 O2-•
Lipid peroxidation DNA hydroxylation
2H2O + O2 2H2O + O2
GSSG 2GSH
CATALASE
GRD
GSH Px
← 2OH• ← 2H2O2 + 2O2 2 Fe2+
DA MAO SOD + 4 H+
Figure 1.2. Reactive oxygen species produced by the mitochondria and associated antioxidant defence systems (taken from Cassarino and Bennett, 1999 with modifications). Normal aerobic respiration produces ROS, some of it is caused by leakage of partially reduced O2 within the electron transport chain. Leakage of electrons (e-) onto molecular O2 produces the superoxide anion (O2
-•). Superoxide dismutase (SOD) can react with O2
-• to form H2O2 and O2. H2O2 can also be formed from the oxidation of DA via the enzyme monoamine oxidase (MAO; see 1.1.2.2.2). Iron can react with H2O2 to give a highly reactive hydroxyl radical (OH•). Glutathione peroxidase (GSH Px) detoxifies H2O2 produced from O2
-• by oxidising reduced glutathione (GSH), which also acts as an antioxidant enzyme. Oxidised glutathione (GSSG) is then reduced back to GSH by glutathione reductase (GRD). Alternatively H2O2 is detoxified by catalase, a peroxisomal enzyme.
CHAPTER I- GENERAL INTRODUCTION
7
1.1.2.2.2 Role of DA in ROS formation in PD
Increased oxidative stress in PD may be initiated by a decline in the antioxidant defence
system (mainly a depletion in glutathione within SNpc; see next section) but may also
be due to the fact that DA-containing neurons are believed to be more prone to
oxidative stress due to DA oxidation (either through its auto-oxidation or via the
enzyme monoamine oxidase (MAO)), which subsequently generates free radicals and
other ROS within SNpc (Jha et al., 2000; Schulz et al., 2000; Stokes et al., 2000; Yoo et
al., 2003).
Indeed, auto-oxidation of DA leads to the formation of neuromelanin and can generate
quinone and semiquinone species and other ROS, whilst MAO-mediated DA oxidation
can generate H2O2, as well as deaminated DA metabolites such as 3,4-dihydroxybenzoic
acid (DOPAC) and homovanillic acid (HVA). DA-quinone formation can also be
formed through the action of enzymes like tyrosinase, cyclooxygenase or peroxidase, as
well as by metals (Mn or Fe; Stokes et al., 2000). Detoxification of cytosolic and
mitochondrial peroxides depends predominantly on glutathione peroxidase and
reductase since catalase is compartmentalised into peroxisomes (reviewed by Schulz et
al., 2000; Mytilineou et al., 2002). H2O2 can react with ferrous iron (Fe2+) to form
highly reactive hydroxyl radical (OH•) via the fenton reaction. Interestingly, iron levels
are increased in the SN of PD patients along with elevations in various indices of
oxidative damage (Jha et al., 2000; Berg et al., 2001). Hydroxyl radicals can damage
proteins, nucleic acids and membrane phospholipids (Jha et al., 2000; Schulz et al.,
2000). Indeed, Schulz et al. (2000) discussed that in PD, the loss of dopaminergic
neurons, which results in decreased DA levels, may lead to a compensatory increase in
DA turnover, with increased formation of H2O2 and increased demands on glutathione
synthesis in the remaining neurons. This hypothesis is supported by experimental
studies showing that enhanced DA turnover is associated with increased formation of
oxidised glutathione (GSSG) which in turn can be prevented by inhibitors of DA
metabolism (Spina et al., 1989).
CHAPTER I- GENERAL INTRODUCTION
8
1.1.2.2.3 Glutathione level is reduced in PD brains
The most significant alteration in the antioxidant defence in PD is a reduction in GSH
levels in SNPc of patients (30-40% reduction compared to controls; Sofic et al., 1992;
Dringen, 2000; Schulz et al. 2000) and it has been reported that the degree of the disease
correlates with the extent of GSH loss (Riederer et al., 1989). Since glutathione is an
important natural antioxidant, a deficiency of GSH in the SN could make this region
more vulnerable to oxidative injury (Perry et al., 1982). However, in the brain most of
the glutathione is localised in the glia, so the decrease in GSH levels in SNpc may not
only occur in dopaminergic neurons, which only make up 1-2 % of the total cell
population, but also in glial cells (Schulz et al., 2000).
Depletion of GSH in PD substantia nigra, as for the complex I deficiency, appears to be
selective for this brain area (Gu et al. 1998) and may occur early in the development of
PD causing a cascade of events, which ultimately result in cell death (Dringen, 2000;
Schulz et al. 2000). The cause of the loss of GSH in PD is not clear but since it is not
accompanied by the corresponding increase in GSSG it may not be wholly the
consequence of oxidative stress (Sofic et al., 1992). The activity of γ−glutamyl-cysteine
synthetase (an enzyme involved in glutathione synthesis; see Figure 1.3) is normal in
PD, thus it would seem that no failure of glutathione synthesis occurs. Indeed, an
increase in the activity of this synthetase has been reported in PD brains; this may be an
attempt of dopaminergic neurons to compensate GSH depletion (Sian et al., 1994;
Schulz et al. 2000).
Studies show that an early event following glutathione depletion in mesencephalic cell
cultures is the release of arachidonic acid (AA), whose metabolism may contribute to
cell damage and death via the generation of oxygen free radicals (Mytilineou et al.
2002; Kramer et al.; 2004). Indeed, Kramer et al. (2004) suggested that the release of
AA is phospholipase-2-dependent, thus involving inflammation processes.
Furthermore, decreases in glutathione availability and oxidative stress in the brain are
also believed to promote mitochondrial damage via increased ROS and produce a toxic
cellular environment capable of attacking a variety of biomolecules as well as inhibiting
energy production (Materson et al., 1991; Schapira et al., 1994). Indeed, Jha et al.
(2000) found that in PC12 cells depletion of glutathione levels results in selective
inhibition of mitochondrial complex I.

CHAPTER I- GENERAL INTRODUCTION
9
synthesase
Glutathione
γ-Glutamylcysteine
GLUTATHIONE
synthesase
γ-Glutamylcysteine
Glutamate
Figure 1.3. Synthesis of glutathione. Glutathione is a tripeptide synthesised in vivo by the consecutive action of the enzymes: γ-glutamylcysteine synthetase which uses glutamate and cysteine as substrates to form γ-glutamylcystein and glutathione synthetase which catalyses the addition of glycine to the dipeptide γ-glutamylcystein to form glutathione. ATP hydrolyses is required in both enzymatic steps (Dringen. 2000).
1.1.2.3 Environmental factors
Environmental factors have also been linked to PD aetiology, combined with genetic
susceptibility (reviewed by Moyal-Segal and Soreq, 2006; Betarbet et al., 2006) but the
relative contributions of environmental versus genetics factors are still being debated
(Langston, 2002; Moyal-Segal and Soreq, 2006). Despite the increase in the number of
genes implicated in PD, recent twin studies suggest that genetics do not have a major
role in PD aetiology and that non-genetic risk factors, like prolonged exposure to
environmental toxins, are more important (discussed by Di Monte, 2003). Data from
epidemiologic studies linked residence in rural areas and thus, exposure to pesticides to
higher risk of developing PD (Di Monte 2001, 2003; Dauer and Przedborsky, 2003).
Indeed, most of these studies agree that pesticides have a dose and time dependent
effect, with a higher risk of developing PD in agricultural workers exposed to the
pesticides over the long term (reviewed by Di Monte, 2003). Paraquat, a commonly
used pesticide has been strongly associated with PD risk in a study performed in Taiwan
(Liou et al., 1997). However, epidemiologic studies are controversial and report
different degrees of association between pesticide exposure and risk in developing PD,
probably due to the different methodology utilised (Di Monte, 2003). The
environmental hypothesis for PD is supported by in vitro studies which show that
CHAPTER I- GENERAL INTRODUCTION
10
certain pesticides including paraquat, dieldrin and maneb can cause degeneration of the
DA neurons (Mc Cornmack et al., 2002; Uversky, 2004). Moreover, exposure to
transition metals (e.g. iron and copper) can also cause nigrostriatal damage and
subsequently, contribute to PD. These metals can accumulate in the SNpc and catalyse
harmful chemical reactions which can generate free radicals (Dexter et al., 1989; Di
Monte, 2001, 2003).
However, not all environmental factors increase the risk of developing PD. Coffee
drinking and smoking are inversely associated with the risk of developing PD (Ascherio
et al., 2001; Hernan et al., 2002; Tanner et al., 2002). Indeed, several compounds
present in the tobacco might inhibit MAO reducing both the formation of hydrogen
peroxide, a product formed from MAO-mediated DA oxidation, and the metabolic
activation of toxicants like MPTP (Fowler et al., 1996).
1.1.2.4 Genetic factors
Although PD is generally idiopathic the discovery of some rare familial cases linked to
genetic mutations has revealed novel clues about the aetiology of PD (Vila et al., 2001;
McNaught et al., 2001; Chung et al., 2001a; Shimura et al., 2001).
To date, ten genetic markers have been identified in familial cases of PD (named
PARK1-10). Some of these mutations have been extensively characterised and are
associated with protein aggregation and degradation (reviewed by Huang et al., 2004
and Le and Appel, 2004). Other mutations are associated with mitochondrial
components including, phosphatase and tensin homologue (PTEN)-induced kinase-2
(PINK1) and Leucine-rich repeat kinase-2 (LRRK2), or with proteins involved in
oxidative stress response (eg. DJ-1 and HtrA serine peptidase 2 (HTRA or OMI)). Table
1.1 summarises some of the most relevant PD- linked mutations for this study.
For example, mutations in the gene coding for α-synuclein, one of the major
components of Lewy bodies, lead to an autosomal dominant form of PD. Three point
mutations A53T, A30P and E46K have been reported (Polymeropoulos et al., 1997;
Kruger et al., 1998, 2002; Zarranz et al., 2004) alongside duplications and triplications
of the gene in familial PD (reviewed by Abou-Sleiman et al., 2006). The function of α-
synuclein is still uncertain; however it has been reported to be involved in synaptic
vesicle formation (Abou-Sleiman et al., 2006). Several proteins have been described as

CHAPTER I- GENERAL INTRODUCTION
11
At least ten mutations have been reported in the gene that encodes parkin resulting in an
autosomal recessive form of early-onset PD referred as autosomal recessive juvenile
Parkinsonism (AR-JP; reviewed by Wood-Kaczmar et al., 2006). Except for one
positive case (Pramstaller et al., 2005), the consensus is that parkin mutations do not
lead to LB formation (Hyun et al., 2002; Shimura et al., 2001, McNaught et al., 2002a).
Parkin is expressed primarily in the nervous system and has been reported to function as
an ubiquitin protein ligase (E3) within the UPS (Kitada et al., 1998; Zhang et al., 2000;
Shimura et al., 2001; Barzilai and Melamed, 2003; Huang et al., 2002). Several proteins
have been described to act as regular substrates for parkin, including parkin-associated
endothelial-receptor-like receptor called Pael receptor (Imai et al., 2001), a synaptic
vesicle-associated protein termed CDCrel-1 (Zhag et al., 2000), a 22-KD glycosylated
form of α-synuclein referred as αSp22 (Shimura et al., 2001) and synphilin-1 (Chung et
al., 2001b) both of which are proteins that are involved in PD (Wood-Kaczmar et al.,
2006). Of interest is that parkin is found in LBs and has been reported to colocalise with
α-synuclein in the brain (Schlossmacher et al., 2002). Moreover, parkin is reported to
undergo proteasomal degradation, so parkin also ubiquitinates itself and promotes its
own proteasomal degradation, and the turnovers of mutant-parkins are slower than the
wild-type equivalent (Hyun et al., 2002). Therefore, parkin mutations may impair
CHAPTER I- GENERAL INTRODUCTION
12
proteasomal degradation and lead to a dysfunction in neuronal homeostasis.
Interestingly, in vivo recent studies have shown that parkin protects against α-synuclein-
induced toxicity in drosophila (Haywood and Staveley, 2004), rats (Yamada et al.,
2005) and also against 6-hydroxyldopamine (6-OHDA) in an in vivo rat model
(Vercammen et al., 2006).
Another autosomic dominantly inherited case of PD is due to a missense mutation
(Ile93Met) in the gene coding for ubiquitin carboxyl-terminal hydrolase L1 (UCH-L1;
Leroy et al., 1998). UCH-L1 is involved in the conversion of polyubiquitin chains back
into ubiquitin monomers within the ubiquitin-dependent protein degradation pathway.
This mutation has been found to decrease the activity of the enzyme. How this is linked
to PD is not clear but decreased UCH-L1 activity may impair the ubiquitin UPS and, as
in mutant α-synuclein cases, may provoke a reduction in protein metabolism (Barzilai
and Melamed, 2003; Chung et al., 2001b; McNaught et al., 2001). UCH-L1 has been
found to also have an ubiquitin ligase activity, which takes place when the enzyme is
present as a dimer and attaches ubiquitin via K63 and not the typical K48 linkage that
promotes ATP dependent proteasome degradation. The genetic evidence for its
pathogenicity is weak as only a single mutation has been identified in one family
(Abou-Sleiman et al., 2006). A common polymorphism (S18Y) in the same gene was
later found linked to a decreased susceptibility to PD (Maraganore et al., 1999: Facheris
et al., 2005). This S18Y variant has reduced ligase activity but comparable hydrolase
activity as the wild enzyme. The UCH-L1 S18Y polymorphism encodes a UCH-L1
which is unable to form dimers, thus favouring proteasomal degradation, event which
might explain the fact that S18Y mutations reduce susceptibility to PD (Liu Y.C et al.,
2002).
In conclusion, although it is not clear how mutations in α-synuclein, parkin or UCH-L1
genes cause DA cell death, these mutants support the premise that the ubiquitin
proteasomal system (UPS) may play an important role in the pathogenesis of idiopathic
PD due to a reduction in protein catabolism (McNaught et al., 2001; Alves-Rodrigues et
al., 1998; David et al., 2002; Davies 2001; Ding et al., 2001b; Le and Apple, 2004). In
addition to this, it is evident that several of these mutations also point to the role of
oxidative stress in PD pathogenesis (eg. PARK6 and PARK7, see Table 1.1).

CHAPTER I- GENERAL INTRODUCTION
13
Interestingly, an increasing number of mutations in several genes are being identified in
sporadic PD cases. Some of these genes are associated with DA transmission and
metabolism and with the metabolism of xenobiotics. However, the positive or negative
linkage of these mutations with PD in these studies vary depending on the ethnic origin
of the patients (reviewed by Moyal-Segal and Soreq, 2006). Also, several authors have
discussed the possible relation between abnormalities in mtDNA and defects in
mitochondrial function in at least a proportion of PD patients (Gu et al. 1998; review by
Schapira 2006 and Abou-Sleiman et al 2006).
Locus Location Inheritance Function Onset LB
PARK 1/ 4 α-synuclein AD Involved in synaptic vesicle formation 30-60 years + +
PARK 2 Parkin AR An E3 ligase ~ 30 years - / + in one case
PARK 5 UCH-L1 AD Ubiquitin hydrolase and ligase Late ?
PARK 6 PINK1 AR Mitochondrial kinase 30-50 years ?
PARK 7 DJ-1 AR Involved in
oxidative stress response
20-40 years ?
PARK 8 LRRK2 AD A protein kinase 40-60 years + variable pathology
Unmapped HTRA2 or OMI AD? predisposition
A serine protease and/ or involved in
stress response 44-70 years ?
Table 1.1. Summary of the PD-associated genes. The table shows some of the most studied mutations associated with familial PD. AD=autosomal dominant; AR= autosomal recesive ++= fulminant LB pathology; += LB are present; ?= unknown.
CHAPTER I- GENERAL INTRODUCTION
14
1.1.2.5 Defects in protein degradation and neurodegeneration
Normal cellular functions generate significant levels of abnormal proteins. This is a
particularly important event within the central nervous system (CNS), where high levels
ROS and other free radicals are generated due to the enzymatic and auto-oxidation of
several neurotransmitters, including DA, which is relevant to PD (McNaught and
Olanow, 2006). It is essential to the cell to tightly regulate the production and clearance
of these abnormal proteins, since they are prone to misfold and aggregate and are
detrimental to the cell (Kopito, 2000). Indeed, proteolysis declines with age (Szweda et
al., 2002; Terman and Brunk, 2004) and in certain neurodegenerative disorders (Carrard
et al., 2002; Szweda et al., 2002).
Mammalian cells possess two major systems for general protein degradation, lysosomal
proteases and the UPS (Ding and Keller, 2001; Ciechanover, 2005). The UPS is
involved in the degradation of abnormal and soluble intracellular proteins within the
cytosol, nucleus or endoplasmic reticulum (for further details see section 1.1.3). This
system has been reported to be impaired in SNpc from PD patients (Mc Naught and
Jenner, 2001; Mc Naught et al., 2001). Indeed, as earlier introduced, mutations in
several genes encoding for components of the UPS are linked to several forms of
inherited PD (Le and Appel, 2003; Krüger et al., 2002) and several toxins or pesticides
which induce parkinsonism have been reported to impair proteasomal function (Keller
et al., 2000; Elkon et al., 2004; Höglinger et al., 2003; Shamoto-Nagai et al., 2003;
Betarbet et al., 2006; Wang et al., 2006; Zeng et al., 2006). All these findings suggest
the involvement of the UPS in PD (further discussed in sections 3.1.1 and 3.1.2).
On the other hand, lysosomal degradation involves cathepsins, which degrade
membrane and extracellular components following endocytosis into the lysosome
(Nakanishi, 2003; Ciechanover, 2005; McNaught and Olanow, 2006). Cathepsins are
also involved in cellular destruction during cell death (necrosis and apoptosis). Aspartyl
(cathepsin D) and cysteinyl (cathepsin B, H and L) proteases are the most implicated
lysosomal enzymes in neurodegeneration (reviewed by Artal-Sanz and Tavernarakis,
2005).
Other proteases have also been linked to neurodegeneration, for instance caspases and
calpains (Artal-Sanz and Tavernarakis, 2005). The latter are cytosolic calcium-activated
cysteine proteases, which exist mainly as two isoforms: μ-calpain (also known as
CHAPTER I- GENERAL INTRODUCTION
15
calpain I) or m-calpain (calpain II). These isoforms are respectively activated by low
(micro-molar) and high (milli-molar) levels of calcium (Mendhi, 1991; Goll et al.,
2003; Costelli et al., 2005). Calpains are involved in cell proliferation, differentiation,
migration and apoptosis (Nixon, 2003) and in neurons in growth cone motility and
guidance (Artal-Sanz and Tavernarakis, 2005). They activate or alter the regulation of
certain enzymes, including key protein kinases and phosphatases, and regulate
cytoskeleton organisation (Saido et al., 1994; Gryspan et al., 1997). Indeed, calpains
can degrade several cytoskeletal proteins (e.g. spectrin, tau or NFs) and several
constituents of myelin (Stys and Jiang, 2002). Both calpain activity and intracellular
calcium levels have been reported to increase with ageing (Costelli et al., 2005).
Moreover, calpains have been linked to several neurodegenerative conditions (Chard et
al., 1995; Moldoveanu et al., 2002). For example, calpains have been reported to be
increased in Alzheimer’s disease (AD; Gryspan et al., 1997) and in animal models of
Huntinton´s disease (Bizat et al., 2003 a, b) and PD (Crocker et al., 2003). Interestingly,
α-synuclein, the major component of LBs, has recently been reported to be a substrate
for calpains (Mishizen-Eberz et al., 2005). In addition to this, the implication of
calpains in PD is further supported by the fact that overexpression of m-calpain has
been detected in brain of PD patients (Mouatt-Prigent et al., 1996).
1.1.3 Lewy bodies
One of the pathological hallmarks of PD is the presence of neuronal cytoplasmic
filamentous inclusions known as LBs. However, LBs are not specific for PD and are
also found in AD, dementia with LBs and even in normal individuals of advanced age at
a higher frequency than the prevalence of PD (Dauer and Przedborsky, 2003). These
inclusions were first described by the German neuropathologist Frederich H. Lewy in
1912 (Wakabayashi et al., 2005). LBs are widely distributed in the CNS, and in cases of
idiopathic PD are found within the brain stem nuclei, which includes SN, locus
coeruleus and dorsal motor vagal glanglus, and to a lesser extent within the cerebral
cortex (Gai et al., 2000). LBs are spherical cytoplasmic protein aggregates that are
mainly composed of α-synuclein and its interacting partner synphilin-1 but also parkin,
ubiquitin, neurofilaments (Forno et al. 1996; Spillantini et al. 1998; Gai et al., 2000)
and also proteasomal subunits and other components (Alves-Rodrigues et al., 1998;
McNaught and Jenner, 2001; Mc Naught and Olanow, 2006). LBs are located within the

CHAPTER I- GENERAL INTRODUCTION
16
perikarya or within neurites (Wakabayashi et al, 1992). Morphologically, LBs are
concentric inclusions that typically possess a dense eosinophilic core and peripheral
halo of radially arranged filaments comprised of fibillar α-synuclein and neurofilaments
(Forno et al., 1986; Wakabayashi et al, 1992 Spillantini et al., 1998).
1.1.3.1 Protein aggregation and LB formation in PD
Defects in protein handling could be a crucial factor in the pathogenesis of PD (Alves-
Rodrigues et al., 1998; Chung et al., 2001a; Shoesmith-Berke and Paulson, 2003).
Indeed, abnormal proteins which are constantly produced due to normal cell
metabolism, are normally cleared by the UPS in association with molecular chaperones,
thus avoiding their accumulation (Betarbet et al., 2005; McNaught and Olanow, 2006).
However, ageing and impaired proteasomal function (McNaught and Jenner, 2001,
Carrard et al., 2002) accompanied by high levels of oxidative stress (Keller et al.,
2004), may lead to the accumulation of these proteins which eventually may be
damaging to the cell (McNaught et al., 2002; Chung et al., 2001a,b). Moreover,
intrinsic features of certain proteins such as α-synuclein might make them more prone
to aggregation and more resistant to proteasomal degradation (Alves-Rodrigues et al.,
1998). Indeed, several authors report that proteasomal inhibition results in accumulation
of α-synuclein, the main component of LBs and a substrate for the UPS (Tofaris et al.,
2003; Mc Naught et al., 2002a; Demasi and Davies, 2003; Sawada et al., 2004). In
addition to this, the high occurrence of ubiquitinated protein species within the LBs and
the observation that parkin functions as an E3 ubiquitin-ligase make it plausible that
proteins within the LBs are objects of parkin mediated ubiquitination so, the UPS
appears to be an intersection of whether a toxic protein is degraded or it is packaged into
an inclusion (Chung et al., 2001b). At the same time protein aggregates have been
reported to impair proteasomal function since heavily oxidised and cross-linked proteins
present in these aggregates are poor substrates for the proteasome that prefers unfolded
proteins as substrates (Wojcik and DeMartino, 2003; Grune et al., 2004).
The current consensus points to LB formation as an aggresome-related process (Olanow
et al., 2004). Indeed, oxidised and damaged proteins are relatively resistant to
degradation by normal proteolytic mechanisms and therefore are transported to
centrosomes (i.e. perinuclear microtubule-organising centres) where they become
associated with components of the UPS and are encapsulated by intermediate filaments

CHAPTER I- GENERAL INTRODUCTION
17
(IF’s) to form large structures called aggresomes. Aggresomes are sites of enhanced
proteolysis whose formation may serve to protect the nucleus and other organelles from
exposure to the cytotoxic effects of abnormal proteins. By this means, LBs could be
specialised aggresome-related structures that are formed in DA neurons as a way of
sequestering and compartmentalisating those proorly degraded proteins and, ultimately,
as a means of controlling excessive levels of abnormal proteins. Therefore, LBs may
play a cytoprotective role that delays the onset of neuronal degeneration (reviewed by
the following authors: Kopito, 2000; Olanow et al., 2004; McNaught and Olanow,
2006). This idea is supported by the relatively severe neurodegeneration and early onset
of symptoms in patients suffering from mutant-parkin-linked-PD, which lack LBs
(Chung et al., 2001b; McNaught et al., 2001). Although the current theories point to a
protective role of LBs some authors suggest that LBs are cytotoxic, at least in the later
stages of the disease (reviewed by Ardley et al., 2005; Harrower et al., 2005; Mc
Naught and Olanow, 2006).
Interestingly, Meredith et al. (2004) suggest that lysosomes might also be involved in
LB formation based on α-synuclein accumulation in a MPTP animal model. These
authors hypothesise that since ATP levels and UPS activity are decreased in damaged
neurons, accumulated proteins are translocated to the lysosomes, a process assisted by
molecular chaperones, for degradation. In the lysosome lipofucsin granules, lipids and
neuromelanin accumulate until the lysosome collapses resulting in release of its
contents into the cytoplasm where lipofucsin granules might provide nucleation centres
for LB formation (Meredith et al., 2004).
1.2 THE UBIQUITIN PROTEASOMAL SYSTEM (UPS)
The UPS plays an essential role in the degradation and clearance of short-lived, mutant,
misfolded or damaged proteins in eukaryotes and ultimately in the regulation of crucial
processes such as the cell cycle, transcription, antigen processing or signal transduction
(Goldberg et al 1995; Ding and Keller, 2001). In neurons, the UPS plays an essential
role in the control of normal neuronal function and homeostasis through the selective
degradation of neuronal proteins (Ehlers, 2003). This system is soluble, has a slightly
alkaline optimum pH and is ATP dependent, thus requiring magnesium as a cofactor
(Ding and Keller, 2001b). Speese et al., (2003) show that the UPS tightly controls levels

CHAPTER I- GENERAL INTRODUCTION
18
of presynaptic proteins and that the rate of UPS-dependent protein degradation is a
primary determinant of neurotransmission strength.
Figure 1.3 illustrates the successive enzymatic steps involved in the UPS; firstly,
ubiquitin, a heat stable 76-residue polypeptide, is activated by ubiquitin-activating
enzyme (E1) in an ATP-dependent manner (Hersko and Ciechanover, 1998; Pickart,
2001). E1 forms a thiol ester linkage between a cysteine residue and carboxyl-terminal
glycine in ubiquitin. Activated ubiquitin is then transferred to an ubiquitin-conjugating
enzyme (E2; via another thiol linkage), which in conjunction with E3, an ubiquitin-
protein ligase, identifies and mediates the attachment of polyubiquitin chains to the
substrate. This process is referred to as ubiquitination and is the signal for degradation
of the tagged protein by the 26S proteasome. The polyubiquitin chain is recognised by
the proteasome, and the proteasome complex then rapidly degrades the labelled protein
in an ATP dependent manner. This process produces short peptide fragments that are
further degraded by peptidases to single aminoacids that can be recycled for new protein
synthesis (Saric et al., 2004).
Polyubiquitinated chains are attached via an isopeptide bond between the conserved C-
terminal glycine residue of ubiquitin and the ε-amino group of the lysine (Lys or K)
residue of the substrate (Hersko and Ciechanover, 1998; Verma and Deshaies 2000).
However, there are also reports of proteins that are ubiquitinated without the
requirement of Lys residues (Bloom et al., 2003). Polyubiquitinated chains are formed
by the sequential addition of mono-ubiquitin to a Lys residue of ubiquitin (isopeptide
bonds between Gly76 and Lys48) which is already bound to the substrate (Chau et al.,
1989). A chain elongation factor (E4) may be required for the polyubiquitination of
some proteasome substrates (Hartmann-Petersen et al. 2003).
Ubiquitin has seven lysine residues each of which can potentially bind the C-terminal
glycine of the next ubiquitin moiety in the multi-ubiquitin chain, however, not all these
linkages occur naturally (Chung. et al., 2001a,b; Hartmann-Petersen et al. 2003). The
most common ubiquitin linkage for targeting proteins for degradation by the proteasome
is through Lys48 (Chau et al., 1989), although Lys29-linked chains may also serve as
degradation signals (Johson et al., 1995). Other alternative linkages, for example at
Lys63 are not recognised as a signal for proteasomal degradation, instead regulating

CHAPTER I- GENERAL INTRODUCTION
19
processes such as DNA repair, endocytosis or translational regulation (Hicke, 2001;
Welchman et al., 2005).
There is a range of different E2 enzymes that can associate with a variety of E3
enzymes, incorporating substrate specificity to the process (Ferrel et al., 2000; Chung et
al., 2001a; Hartmann-Petersen et al., 2003). Indeed, since the number of E3 ligases
exceeds the number of E2s, substrate specificity is mostly mediated by ligases (Ross
and Pickart, 2004; Pines and Lindon, 2005). Multi-polyubiquitination is a reversible
process. Several deubiquitinating enzymes appear to take part in the regulation and
selectivity of the substrate targeted for degradation (Chung. et al., 2001b; McNaught
and Jenner, 2001; Hartmann-Petersen et al., 2003).
Although the proteasome was initially characterised for its role in ATP and ubiquitin
dependent proteolysis there is a significant amount of evidence that an ATP and/ or
ubiquitin independent version of the proteasome also exists (Alves-Rodrigues et al.,
1998). Indeed, the first protein shown to be degraded by the 26S proteasome in an
ubiquitin independent manner was ornithine descarboxylase (Murakami et al., 1992).
Other examples of proteins degraded in an ubiquitin-independent manner by the
proteasome are c-Jun, calmodulin, troponin and p53 (reviewed by De Vrij et al., 2004).
CHAPTER I- GENERAL INTRODUCTION
20
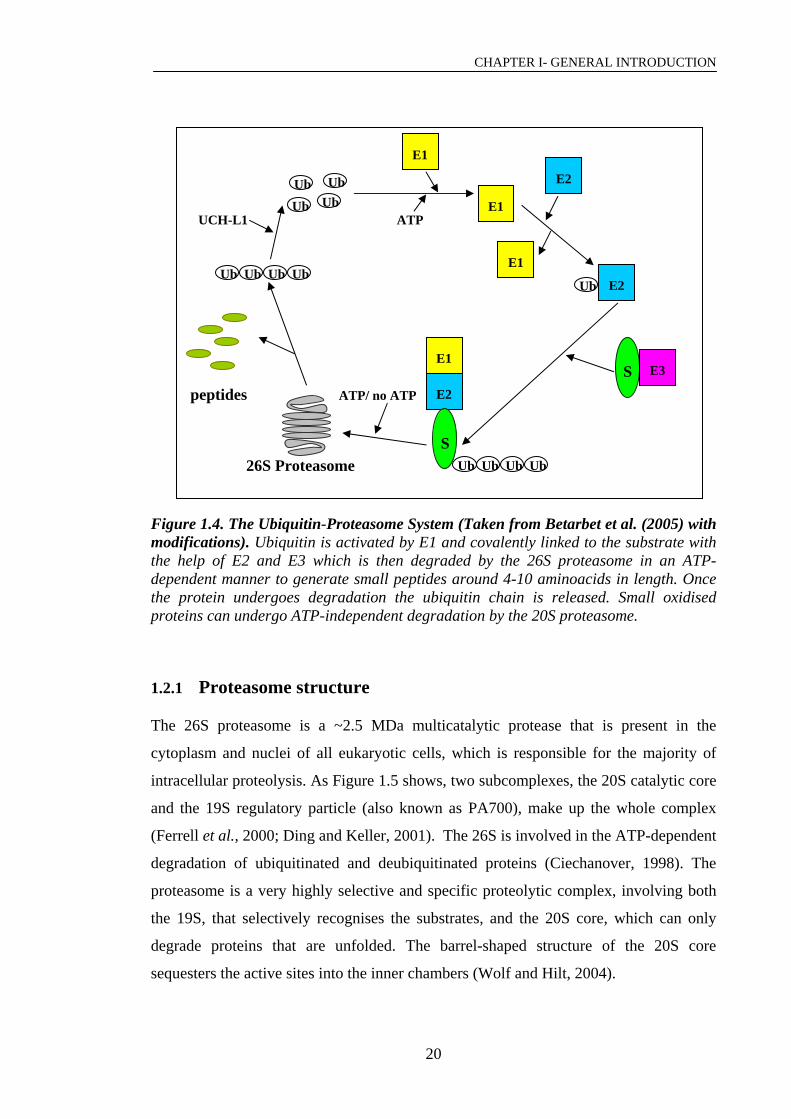
Figure 1.4. The Ubiquitin-Proteasome System (Taken from Betarbet et al. (2005) with modifications). Ubiquitin is activated by E1 and covalently linked to the substrate with the help of E2 and E3 which is then degraded by the 26S proteasome in an ATP-dependent manner to generate small peptides around 4-10 aminoacids in length. Once the protein undergoes degradation the ubiquitin chain is released. Small oxidised proteins can undergo ATP-independent degradation by the 20S proteasome.
1.2.1 Proteasome structure
The 26S proteasome is a ~2.5 MDa multicatalytic protease that is present in the
cytoplasm and nuclei of all eukaryotic cells, which is responsible for the majority of
intracellular proteolysis. As Figure 1.5 shows, two subcomplexes, the 20S catalytic core
and the 19S regulatory particle (also known as PA700), make up the whole complex
(Ferrell et al., 2000; Ding and Keller, 2001). The 26S is involved in the ATP-dependent
degradation of ubiquitinated and deubiquitinated proteins (Ciechanover, 1998). The
proteasome is a very highly selective and specific proteolytic complex, involving both
the 19S, that selectively recognises the substrates, and the 20S core, which can only
degrade proteins that are unfolded. The barrel-shaped structure of the 20S core
sequesters the active sites into the inner chambers (Wolf and Hilt, 2004).
E2
E1
E1
Ub E2
Ub
UCH-L1 ATP Ub
Ub Ub Ub Ub
Ub
E1
Ub
peptides ATP/ no ATP
E1
E2
Ub Ub Ub Ub
E3 S
S
26S Proteasome
CHAPTER I- GENERAL INTRODUCTION
21
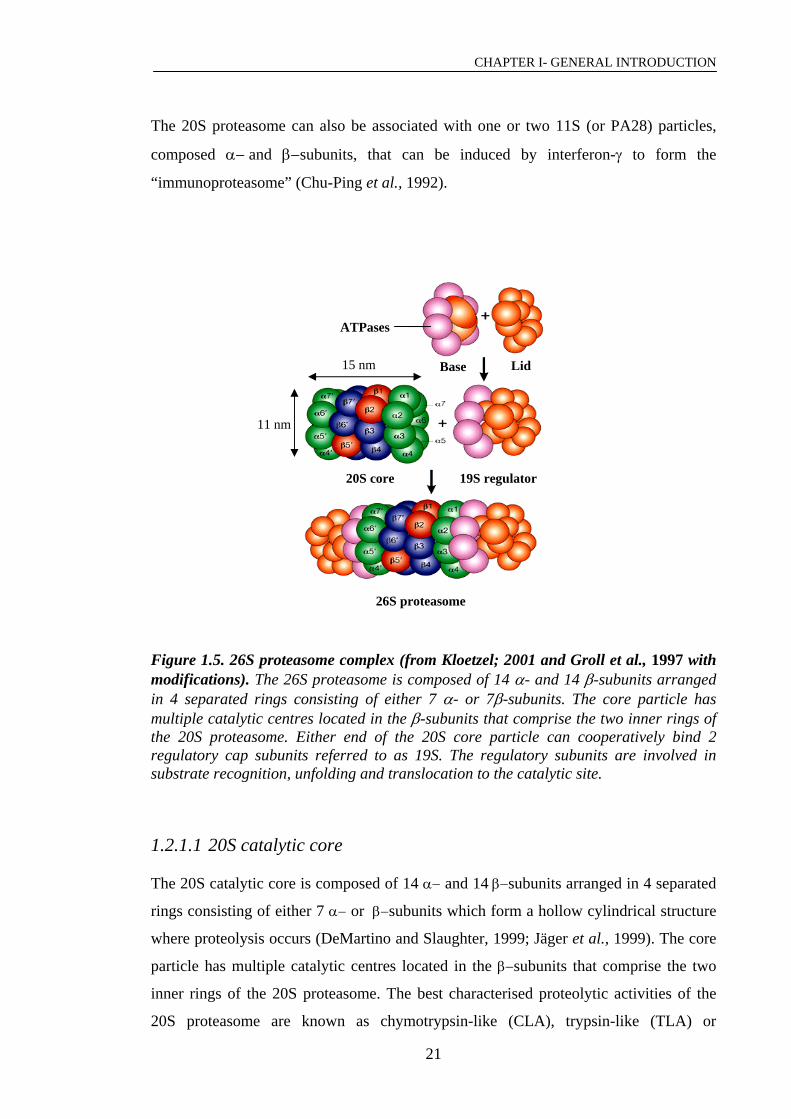
The 20S proteasome can also be associated with one or two 11S (or PA28) particles,
composed α− and β−subunits, that can be induced by interferon-γ to form the
“immunoproteasome” (Chu-Ping et al., 1992).
ATPases
Base 15 nm
26S proteasome
Lid
20S core 19S regulator
Base
11 nm
Figure 1.5. 26S proteasome complex (from Kloetzel; 2001 and Groll et al., 1997 with modifications). The 26S proteasome is composed of 14 α- and 14 β-subunits arranged in 4 separated rings consisting of either 7 α- or 7β-subunits. The core particle has multiple catalytic centres located in the β-subunits that comprise the two inner rings of the 20S proteasome. Either end of the 20S core particle can cooperatively bind 2 regulatory cap subunits referred to as 19S. The regulatory subunits are involved in substrate recognition, unfolding and translocation to the catalytic site.
1.2.1.1 20S catalytic core
The 20S catalytic core is composed of 14 α− and 14 β−subunits arranged in 4 separated
rings consisting of either 7 α− or β−subunits which form a hollow cylindrical structure
where proteolysis occurs (DeMartino and Slaughter, 1999; Jäger et al., 1999). The core
particle has multiple catalytic centres located in the β−subunits that comprise the two
inner rings of the 20S proteasome. The best characterised proteolytic activities of the
20S proteasome are known as chymotrypsin-like (CLA), trypsin-like (TLA) or

CHAPTER I- GENERAL INTRODUCTION
22
postacidic-like activity (PLA; also known as peptidyl glutamyl peptide hydrolase or
caspase-like activity) which preferentially recognise and cleave tyrosine or
phenylalanine (hydrophobic residues), arginine or lysine (basic residues) and glutamate,
respectively. Some biochemical data demonstrate that each catalytic activity is linked
with a specific β−subunit. Thus three of the different β−subunits (present as
duplicates) are presumably catalysts whereas the remaining subunits are of unknown
function (De Martino and Slaughter, 1999; Brooks et al. 2000; Ferrell et al. 2000). In
higher eukaryotes each of these three catalytic subunits are termed as β1 (PLA), β2
(TLA) and β5 (CLA). However, mutational studies on the different β-subunits
suggested that each of the three active sites is formed by two subunits, the active
subunit and a complementary non-catalytic subunit, whose inactivation results in
reductions of the proteolytic activities. Therefore β4 and β5 form the CLA site, β2
together with β6 form the TLA site, and β1 and β7 form the PLA site (further
information in table 4.3; Dick et al., 1992; Hilt et al., 1993; Arendt and Hochstrasser,
1997; Heinemeyer et al., 1997). On the other hand, the two outer rings of the catalytic
barrel, composed exclusively of α−subunits, which form two axial pores, ensure that
only unfolded substrates can entry the catalytic chamber (Groll et al., 2000) and play
important roles in maintaining 20S stability and provide scaffolding for 20S binding
proteins (De Martino and Slaughter, 1999; Brooks et al., 2000; Ferrell et al., 2000).
Structural and genetic studies identified the proteasome as an N-terminal nucleophile-
hydrolase (Ntn) with a threonine (Thr) residue acting as the catalytic nucleophile
(Fenteany et al., 1995). Activation of the hydroxyl group of the Thr requires a proton
acceptor at the active site. The surrounding area of the Thr contains a conserved lysine
group, which at the neutral pH conditions in the active site environment of proteasomes
is likely to be in a charged state, thus making it an unsuitable candidate for accepting a
proton. Instead Lys is thought to lower the pKa of the N-terminal amino group of Thr1
by its electrostatic potential, so that this group can act as the proton acceptor in
proteolysis (Groll et al., 1997; Groll and Huber, 2003).
Proteolysis of substrates by the proteasome occurs in a sequential manner and substrates
are cut at many sites to yield small oligopeptides of between four and fourteen amino
acids (Wolf and Hilt, 2004). This progressive mode of degradation might help to ensure
that proteins are rapidly eliminated without retaining any biological function that could
CHAPTER I- GENERAL INTRODUCTION
23
be deleterious for the cell (Kisselev et al., 1999). Even though the precise mechanism
involved in such degradation is unclear it may involve conformational changes in the
proteasome resulting in the opening of its central cavity and/or allosteric modifications
of the catalytic sites (DeMartino and Slaughter, 1999, Ding and Keller, 2001b). Indeed,
allosteric interactions between CLA and PLA have been described since substrates for
the PLA appear to non-competitively inhibit CLA via binding non-catalytic sites
(Kisselev et al., 1999; Myung et al., 2001). Proteasome allosterism is not fully
understood but might be a very precise and diverse form of proteasomal regulation
(reviewed by Gaczynska et al., 2006). The proteasome subunit composition and the
spacing between the individual proteolytic sites dictate the length and type of peptides
generated by the proteasome (DeMartino and Slaughter, 1999, Ding and Keller, 2001b).
Interestingly, genetic studies revealed that the chymotrypsin-like activity (harboured by
β5) is the most important proteolytic activity for proteasomal function and also for cell
growth, followed by trypsin-like (β2) and postacidic-like (β1) activities, since β5β1 and
β5β2 double mutants of yeast are viable, whilst β2β1 mutants are not (Jäger et al.,
1999).
Initial studies suggested that the 20S proteasome rarely functioned as an isolated
enzyme, the 26S proteasome being the major form in vivo. However, subcellular
localization and stoichiometry of the different complexes showed that free 20S particles
exceed the 19S or 11S (free or bound to 20S) over 3 to 4-fold (Rivett, 1998; Brooks et
al., 2000). Moreover, the 20S proteasome itself can degrade proteins without ubiquitin
or ATP (Davies K.J.A., 2001; Grune et al., 2003). Indeed, the 20S proteasome plays a
major role in the degradation of mildly oxidised soluble proteins in the cytoplasm,
nucleus and endoplasmic reticulum, a process which is ATP and ubiquitin independent
(Davies, 2001; Grune et al., 2003). The mechanism by which oxidised proteins are
recognised by the 20S protesome involves the partial denaturation and unfolding of the
protein which will lead to the exposure of hydrophobic patches of aminoacids at the
surface of the oxidised proteins. These hydrophobic patches are able to bind to the α-
subunits at the entrance of the core particle which in turn will result in the opening of
the pores in the 20S particle helping it access into the catalytic chamber (Davies, 2001;
Grune et al., 2003). This is supported by Ding et al. (2003) who found that low levels of
oxidative stress increased the amount of protein oxidation without affecting proteasome

CHAPTER I- GENERAL INTRODUCTION
24
activity. Of interest is the fact that the 20S complex has been reported to be 4-fold more
resistant to oxidative stress than the 26S (Reinheckel et al., 1998).
1.2.1.2 The 19S regulatory particle
Either end of the 20S proteasome can bind, in a cooperative and ATP dependent
manner, an additional cap-like structured regulatory protein, known as 19S or P700, to
form the 26S. The binding of the regulatory subunit to the catalytic 20S core enhances
the ability of the proteasome to degrade both ubiquitinated proteins and non-
ubiquitinated peptides (DeMartino and Slaughter, 1999; Ferrell et al., 2000).
The 19S complex is universally composed of two different subcomplexes referred to as
“lid”, of unknown structure, and “base”. The latter consists of a hexameric ring of 6
different non-redundant ATPases and three additional non-ATPase subunits whilst the
lid is built up from eight different non-ATPase subunits (see figure 1.4; Chu-Ping et al.,
1994; Ferrell et al., 2000; Glickman and Raveh, 2005). The 19S particle is involved in
several ATP-dependent functions including (a) substrate recognition (recognition of the
ubiquitin chain of the substrates) and unfolding, (b) disassembly of polyubiquitin chains
from the substrate, (c) opening of the gates formed by the 20S α-subunits and (c)
translocation of the unfolded sustrate to the catalytic chamber via the reverse-chaperone
activity present in the base of the particle (reviewed by Hartmann-Petersen et al., 2003).
Molecular chaperons also cooperate with the UPS, facilitating and enhancing the correct
folding and placement of the protein, as well as preventing proteins to aggregate or
missfold (Imai et al., 2003; Muchowski and Wacker, 2005).
These ATP dependent functions are not required for the hydrolysis of short peptides and
the regulatory complex may activate that process by allosteric modification of the active
centres (DeMartino and Slaughter, 1999; Ferrell et al., 2000; Ding and Keller, 2001).

CHAPTER I- GENERAL INTRODUCTION
25
1.3 TOXINS USED IN PD MODELS
Certain pharmacological agents and environmental toxins cause lesions in specific cell
populations and thereby mimic the pathological and symptomatic features of some
neurodegenerative disorders. Such experimental models are useful for understanding the
pathophysiology of PD and thus for assessing and developing new therapeutic strategies
(Beal, 2001; Sanchez-Pernaute et al., 2005; Shimohama et al., 2003). Some of the most
common toxins used in PD models include MPTP/ MPP+, rotenone, 6-OHDA and DA.
The structure of these compounds is illustrated in figure 1.5.
MPTP MPP+ Rotenone
Dopamine 6-OHDA
Figure 1.6. Chemical structures of MPTP, MPP+, rotenone, 6-OHDA and dopamine.
1.3.1 MPTP model
One of the best-studied models of PD, the 1-methyl-4-phenyl-1,2,3,6-tetrahydropyridine
(MPTP) model, was first described to induce a human parkinsonism state after being
injected as a narcotic analgesic (Davis et al., 1979). Its use was later reported in a group
of north-Californian drug addicts who developed strong parkinsonism symptoms after
intravenously injecting a MPTP-contaminated “synthetic heroin” (Langston et al.,
1983). To date MPTP is one of the best experimental models of PD (Przedborski and

CHAPTER I- GENERAL INTRODUCTION
26
Vila, 2001). Indeed, many models exist for investigation of MPTP toxicity which range
from whole animals to cell culture systems (Forno et al., 1988).
1.3.1.1 Bioactivation and toxicity of MPTP
MPTP toxicity is believed to be mediated by at least two metabolic steps (see figure
1.6). Firstly, MPTP, which is highly lipophilic, readily crosses the brain blood barrier
and can be taken up non-specifically by glial cells where it is oxidised, via monoamine
oxidase B (MAO-B), to an intermediate, 1-methyl-4-phenyl-2, 3-dihidropyridium ion
(MPDP+), which is then auto-oxidised (non-enzymatically) to 1-methyl-4-
phenylpyridinium ion (MPP+), the active neurotoxin (Langston et al., 1983; D’Amato et
al., 1986; Vidaluc, 1996; Speciale, 2002; Beal, 2001). Once produced, MPP+ is taken up
selectively by the DA transporter into DA neurons and can either (a) enter the
mithochondria and inhibit the mitochondrial electron transport chain (Ramsay and
Singer, 1986), (b) be sequestered into cytoplasmic vesicles by actions of the vesicular
monoamine transporters (VMAT; Del Zompo et al., 1993) or (c) remain in the cytosol
where it can interact with different cytosolic enzymes (Klaidman et al., 1993). MPP+
toxicity is inversely proportional to the capacity of the cell to sequester the toxin via the
VMAT (Takahashi et al., 1997).
Mitochondrial dysfunction is mainly caused by direct inhibition of the electron transport
enzyme NADH: ubiquinone oxidoreductase, also known as complex I; however MPP+
has also been reported to inhibit complex III and IV of the electron transport chain.
Blockage of mitochondrial function leads to decreased ATP levels, loss of
mitochondrial membrane potential and possibly the formation of ROS, all of which may
be contributing to the selective degeneration of the DA containing neurons (Langston et
al., 1983; Song et al., 1998; Vidaluc, 1996; Bernardi et al., 1999; Cassarino and
Bennett, 1999; Conn et al., 2001; Sherer et al., 2001).

CHAPTER I- GENERAL INTRODUCTION
27
Figure 1.7. Summary of the mechanisms involved in MPTP toxicity (taken from Blum et al., 2001 with modifications). MPTP can cross the blood brain barrier and be taken up by glial cells were it is bioactivated via MAO to MPP+, where upon it is transported inside the DA neuron via the DA transporter. Once inside the cell, MPP+ is accumulated inside the mitochondria where it inhibits complex I activity and thus ATP synthesis. MPP+ also releases DA from the endogenous stores. Both events result in increased ROS which together with complex I inhibition increases cytoplasmic calcium levels and provokes the release of cytochrome c. All these events ultimately result in cell death.
1.3.1.2 Role of oxidative stress in MPTP toxicity
Johannessen et al., (1985) were the first authors to suggest that oxidative stress may
contribute to MPP+ toxicity. This hypothesis is supported by several authors. Indeed, it
has been reported that MPP+ induces the release of DA from endogenous stores, which,
as detailed in previous sections, can be subsequently oxidised generating hydrogen
peroxide, superoxide (O2-•), quinone species and hydroxyl radicals (OH•) which are able
to modify cellular macromolecules (Graham, 1978; Chiueh et al., 1992; Vidaluc, 1996).
The deleterious effects of DA release might actually precede mithochondrial
dysfunction (Chan et al., 1991). Indeed, Lotharius and O’Malley (2000) propose that
the formation of ROS following MPP+ treatment of mesencephalic cultures is not
MPTP(Periphery of
Nervous system)
Blood brain barrier
GLIAL CELLS
MPTP MPDP+
MAOMPP+
DOPAMINE
TRANSPORTER
MPP+
DA release
ROS
DOPAMINERGIC NEURON
CELL
DEATH
OXIDATIVE
STRESS
Mitochondrial dysfunction:
- Complex I inhibition
- ATP ↓
- Ros production
- ning
- Cytoplasmic Ca 2+ ↑
- Cytochrome c releaseMPT opeMTP
CHAPTER I- GENERAL INTRODUCTION
28
initiated in the mitochondria but results from DA vesicular displacement within the
cytoplasm that results in its oxidation. Another source of O2-• comes from the
autooxidation of MPDP+ which can be further catalysed to OH• (Zang and Misra, 1992)
and also from the leakage of reducing equivalents onto molecular oxygen due to
mitochondrial dysfunction. Involvement of oxidative stress in MPTP neurotoxicity is
further supported by the protection of several antioxidative agents (Lai et al., 1993;
Gonzalez-Polo et al., 2004). For instance, Cassarino et al., (1997) showed that MPP+
induced ROS formation and increased the activity of the antioxidant enzymes
superoxide dismutase (SOD) and catalase in SH-SY5Y cells and in an in vivo model.
However other researchers place in doubt this hypothesis. Indeed, Lee et al. (2000a)
suggested that MPP+ toxicity is not primarily driven by oxygen free radicals in human
neuroblastoma SH-SY5Y cells although it may exacerbate the vulnerability of the cells
to oxidative damage. This was concluded after finding that toxic concentrations of
MPP+ did not increase lipid peroxidation and co-treatment with antioxidants did not
attenuate MPP+ toxicity. Consistently, MPP+ toxicity was also found to be primarily due
to the impairment in energy metabolism and not due to oxidative stress in a rat cell
model (PC12 cells). As in the human cell line, MPTP/MPP+ did not increase lipid
peroxidation and again antioxidant administration did not protect the cells from toxic
insult (Fonck and Baudry, 2001).
MPP+ has also been shown to affect calcium homeostasis. Inhibition of complex I and
subsequent ATP depletion can impair the plama membrane Ca2+-ATPase which is
involved in removing Ca2+ from the cell; this results in increased levels of free cytosolic
calcium (Chen et al., 1995). However, calcium can also accumulate in the cytosol via an
impairment of the mitochondrial transition pore (MTP). MTP is a non-selective, high
conductance pore which facilitates the passage of solutes between the mitochondrial
matrix and cytoplasm (Cassarino and Bennet, 1999). The involvement of the MTP in
MPP+ toxicity was confirmed by Kass et al. (1988) who reported increased calcium
levels after MPP+ treatment of isolated hepatocytes with no involvement of the plama
membrane Ca2+-ATPase suggesting that the MTP was involved in the process. Indeed,
MPP+ via complex I inhibition is reported to induce the opening of brain MTPs, an
event that results in the release of calcium but also cytochrome c (Cassarino et al.,
1999). Release of calcium may lead to the activation of kinases, proteases and nitric
acid synthase which contribute to cell death (reviewed by Blum et al., 2001).
CHAPTER I- GENERAL INTRODUCTION
29
Interestingly, MPP+ binds with high affinity to neuromelanin, which is present in high
concentrations in the SNpc of primates; this can provide partial explanation to
selectivity of the toxicant towards DA neurons (D’Amato et al., 1986).
1.3.1.3 Species differences and formation of insoluble aggregates
The MPTP model is performed in a wide range of species including vertebrates and
invertebrates (eg. frogs, leeches or planaria) but it has also been used in cell cultures
(reviewed by Shimohama et al., 2003). Differences in species susceptibility to the toxin
have been observed. For instance, rodents show variable sensitivity to MPTP; rats are
resistant to the toxin whilst mice show different susceptibility and behavioural effects
dependent on the strain utilised (Brownell et al., 1998; Hamre et al., 1999). In contrast,
in humans and other primates MPTP causes a severe irreversible PD-like syndrome due
to the degeneration of nigral DA neurons (Kopin and Markey, 1988; Langston and
Irwin, 1986). Although there is only limited evidence for the presence of insoluble
inclusions in MPTP models, this may be because chronic treatment has not been
intensely studied (Beal, 2001). Indeed, chronic exposure of the toxin performed in
macaques reproduced all the symptoms of PD but without the appearance of LB
(Brownell et al., 1998; 2003). Recently, Shimoji et al. (2005) also report the absence of
inclusion body formation in adult wild-type C57BL6 mice following acute, semi-
chronic and chronic exposure to MPTP. On the other hand, some proteinaceous
inclusion bodies have been reported in MPTP-treated aged-monkeys although these
inclusions were structurally different to the typical LB (Forno et al., 1988). In addition
to this, Meredith et al. (2002) report that chronic treatment of mice with MPTP and
probenceid (a compound that retards MPTP and its metabolites clearance) results in the
formation of LB-like inclusions which are immunoreactive for α-synuclein. This is
consistent with Fornai et al. (2005) who report the formation of nigral inclusions
following continous administration of MPTP in a mouse model, a process which was α-
synuclein-dependent.

CHAPTER I- GENERAL INTRODUCTION
30
1.3.2 Rotenone
Epidemiologic studies give evidence of the involvement of pesticide exposure in PD
pathogenesis. Moreover some pesticides, like rotenone or paraquat are currently used in
in vivo and in vitro PD models and have been useful tools in giving a better
understanding of the causes of the disease (Betarbet et al., 2006; Brown et al., 2006).
Rotenone is a naturally occurring compound derived from the roots of certain plants,
which is commonly used as an insecticide. Its hydrophobic nature allows it to readily
cross biological membranes (Perier et al., 2003). Chronic exposure to rotenone in a rat
model has been shown to specifically inhibit complex I of the electron transport chain,
to produce selective nigrostriatal degeneration with the appearance of cytoplasmatic
inclusions similar to Lewy bodies, which contained α-synuclein and ubiquitin.
Moreover, exposure to this insecticide led to motor symptoms characteristic of PD
(Betarbet et al., 2000).
1.3.3 6-hydroxydopamine (6-OHDA)
6-OHDA, the hydroxylated analogue of DA, was the first agent used in an animal
model of PD (Ungerstedt, 1971). This toxin selectively accumulates in DA neurons,
leading to their death (Lotharius and O’Malley, 2000; Beal, 2001). 6-OHDA can not
cross the blood brain barrier therefore, DA cell loss can only occur after direct
intracerebral administration; in PD models injections are preferably given into the
striatum or SN (Blum et al., 2001). Since 6-OHDA can be generated by non-enzymatic
reactions between DA, hydrogen peroxide and free iron, all present in the brain, this DA
derivate can be considered as an endogenous neurotoxin (Jellinger et al., 1995).
As with DA, free radical generation is involved in 6-OHDA toxicity (Blum et al., 2001,
Betarbet et al., 2002). This is supported by the protection that antioxidants conferred
against the toxin (Blum et al., 2000). 6-OHDA lesions do not result in Lewy body
formation and can produce non-specific damage to other neurons (Beal, 2001).
However, this toxin can reproduce the motor deficits seen in PD and has in the past
been considered useful as a PD model for screening therapeutic strategies (Ungerstedt,
1971; Beal, 2001). A recent study suggests that 6-OHDA abolished both aerobic and
anaerobic cell functions. Moreover, its autooxidation produces H2O2 which may

CHAPTER I- GENERAL INTRODUCTION
31
contribute to loss of anaerobic glycolysis likely via inhibition of lactic acid
dehydrogenase (Mazzio et al., 2004).
1.3.4 DA
DA is a natural neurotransmitter of the brain whose concentration in DA neurons
oscillates from 0.1 to 1 mM. However, within dopaminergic neurons DA is normally
sequestered into vesicles, which regulates its concentration in the cytoplasm and also in
the synaptic cleft. Increased DA levels can be deleterious to the cell and have been
reported in conditions like hypoxia or ischemia (reviewed by Blum et al., 2001). As
indicated earlier, loss of DA due to a loss of the DA neurons within the SNpc occurs in
PD and is responsible for most of its motor symptoms (Barzilai and Melamed, 2003;
Beal, 2001; Blum et al., 2001).
DA itself is believed to be directly involved in the initiation of DA cell
neurodegeneration (Zilkha-Falb et al., 1997). As introduced earlier, DA is a source of
ROS generation unique to DA neurons through its oxidation (reviewed by Blum et al.,
2001).
DA neurotoxicity has indeed been reported in vivo, in primary cultures and in several
cell lines (Michel and Hefti, 1990; Filloux and Townsend 1993; Junn and Mouradian,
2001; Gomez-Santos et al., 2003) and can cause cell death via both apoptotic and non-
apoptotic mechanisms (Blum et al., 2001). DA has also been reported to inhibit
mitochondrial complex I (Ben-Shachar et al., 2004). Interestingly extracellular
concentrations of DA ranging from 100-500 μM have been reported to induce death of
SH-SY5Y cells and to increase α-synuclein expression, a major component of LB
(Gomez-Santos et al., 2003).
1.4 THE NEURONAL CYTOSKELETON
The cytoskeleton is a dynamic and complex network of filamentous proteins that
extends throughout the cytoplasm. In higher eukaryotes the cytoskeleton is composed of
three distinct interacting filamentous systems known as microtubules (MTs),
microfilaments (MFs) and intermediate filaments (IFs) formed from tubulin,
neurofilament (NF; in the case of neuronal cells) and actin proteins respectively (Alberts
et al., 1994; Siegel 1999, Janmey, 1998). MTs and MFs, are composed of

CHAPTER I- GENERAL INTRODUCTION
32
phylogenetically very conserved proteins, whilst IFs are differentially expressed in
different tissues (Nixon and Lewis, 1986). The cytoskeletal network is involved in
many cellular processes, it provides mechanical strength to the cell, and is also involved
in movement, adhesion, polarity and intracellular trafficking. Several proteins also
associate with the cytoskeleton helping to organise and accomplish specialised roles of
the individual filament systems (Yang et al., 1999).
1.4.1 Microfilaments
MFs are composed of filamentous actin (F-actin) and a complex set of actin binding
proteins (ABPs), which regulate the intrinsic polymerisation capacity of actin (Alberts
et al., 1994; Sayas et al., 2002). F-actin results from the polymerisation of monomeric
subunits of globular actin (G-actin), a process, which requires ATP as well as both
monovalent and divalent cations (usually K+ or Mg 2+; Alberts et al., 1994; Carlier et
al., 2001). Polymerisation requires ATP binding but not ATP hydrolysis; in fact, ATP
hydrolysis on F-actin results in weakening the bonds in the polymer and promotes
depolymerisation (Carlier, 1991). MFs are polar structures composed of two
structurally different ends, a slow-growing (“minus”) end and a fast growing (“plus”)
end. MFs are also dynamic structures, indeed, actin molecules are continuously added
and removed to and from the “plus” and “minus” end, respectively. Thus, no net change
in the filament length occurs. This process is known as “Treadmilling” (reviewed by
Alberts et al., 1994).
1.4.2 Microtubules
MTs are composed of α- and β-tubulin heterodimers which align end to end to form
protofilaments. α- and β-tubulin are ~ 450 amino acids highly homologous proteins. In
vivo, usually, 13 protofilaments join laterally to form a hollow cylinder with an outer
diameter of 25 nm. As with MFs, binding of GTP but not its hydrolysis, is necessary for
MT polymerisation (reviewed by Siegel 1999; Carvalho et al., 2003). A variety of MT-
associated proteins (MAPs) can bind the microtubule wall (Alberts et al., 1996; Siegel
1999; Downing and Nogales 1998).
Microtubules are constantly undergoing polymerisation/depolymerisation (a process
known as dynamic instability; Mitchison and Kirschner, 1984) and are intrinsically
polar structures. This means that the two ends of the MT exhibit different properties.

CHAPTER I- GENERAL INTRODUCTION
33
Indeed, this polarity is important to the cellular functions of MTs, which include cell
movement, vesicle transport and chromosome segregation during mitosis (Downing and
Nogales 1998; Dammerman et al., 2003). In neuronal cells, MTs, in combination with
MAPs are involved in neurite outgrowth and axon stabilisation (Nixon, 1998), and in
intracellular transport (Shea and Flanagan, 2001). Also motor proteins can bind MTs,
these proteins belong to two families: kinesins and dyneins. Each type of MT-depedent–
motor protein carries a distinct cargo with it as it moves (Alberts et al., 1996). MT
polarity is also central to the ability of motor proteins to move unidirectionally on the
polymer lattice and accomplish their diverse functions (Dammerman et al., 2003).
MTs, but not free tubulin molecules can be covalently modified (e.g. acetylation or
detyrosination). MTs modification gives an idea of the time that has elapsed since a
particular MT polymerised, thus post-translational modifications mark MTs as mature.
Although, the function of these modifications remains unresolved, it is thought that they
provide sites for the binding of specific MAPs that further stabilise mature MTs
(Laurent and Fleury, 1993; reviewed by Alberts et al., 1996; Liao and Gundersen,
1998).
1.4.3 Neurofilaments
1.4.3.1 Neurofilament structure and assembly
There are six different classes of IFs classified according to amino acid sequence
similarity and the intron structure of their genomic sequence (Xiao et al., 2006).
Neurofilaments (NFs), which are specific for neurons, belong to the fourth group of IFs
and are composed of three subunit proteins: NF-L, NF-M and NF-H (Hirokawa and
Takeda, 1998; Nixon R.A. 1998; Yabe et al., 2001). The NF-L molecular weight (MW)
corresponds to 61 kDa; however due to postranslational modifications (ie.
phosphorylation and glycosylation) NF-L is detected at 68 kDa, when separated by SDS
electrophoresis. Similarly, although the MWs of NF-M and NF-H are 102.5 and 111
KDa, respectively, phosphorylation of the carboxyl terminal tail domains, make NF-M
and NF-H run at 150 and 190-210 kDa in polyacrylamide SDS gels (reviewed by
Petzold, 2005).
Neurofilaments are composed of a short amino-terminal head domain rich in arginine
and serine, a coiled-coil rod domain of approximately 310 amino acids, and a carboxyl-
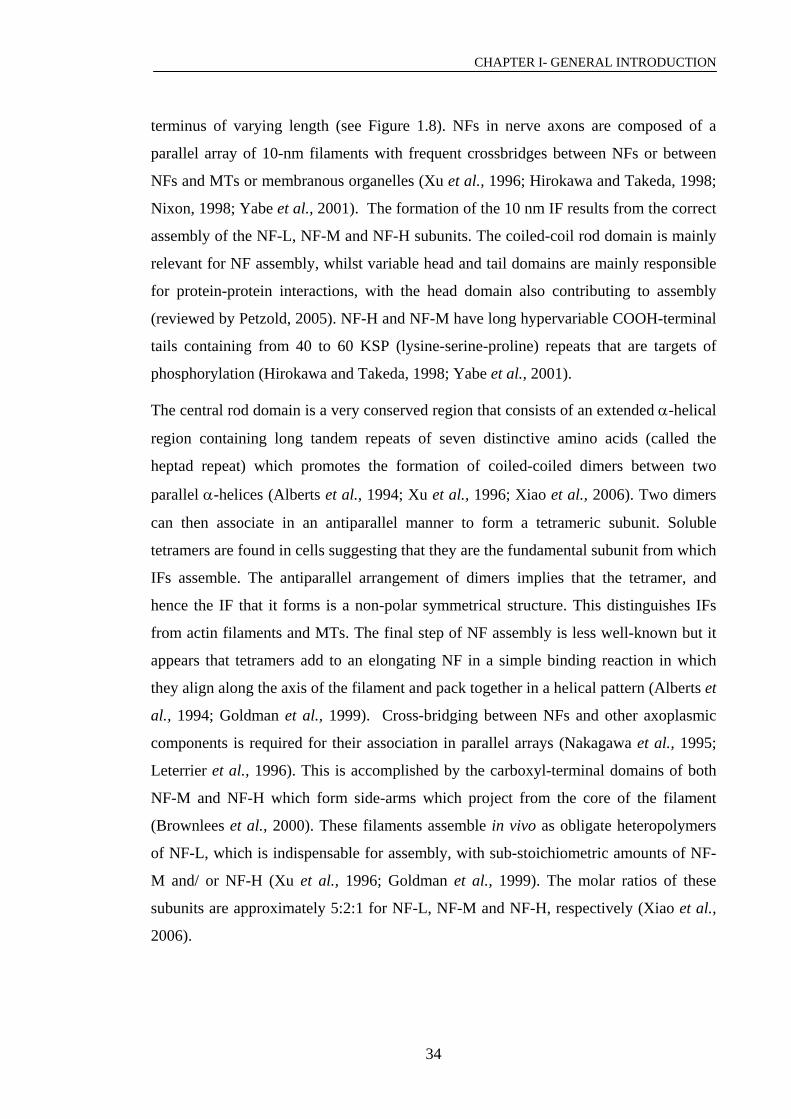
CHAPTER I- GENERAL INTRODUCTION
34
terminus of varying length (see Figure 1.8). NFs in nerve axons are composed of a
parallel array of 10-nm filaments with frequent crossbridges between NFs or between
NFs and MTs or membranous organelles (Xu et al., 1996; Hirokawa and Takeda, 1998;
Nixon, 1998; Yabe et al., 2001). The formation of the 10 nm IF results from the correct
assembly of the NF-L, NF-M and NF-H subunits. The coiled-coil rod domain is mainly
relevant for NF assembly, whilst variable head and tail domains are mainly responsible
for protein-protein interactions, with the head domain also contributing to assembly
(reviewed by Petzold, 2005). NF-H and NF-M have long hypervariable COOH-terminal
tails containing from 40 to 60 KSP (lysine-serine-proline) repeats that are targets of
phosphorylation (Hirokawa and Takeda, 1998; Yabe et al., 2001).
The central rod domain is a very conserved region that consists of an extended α-helical
region containing long tandem repeats of seven distinctive amino acids (called the
heptad repeat) which promotes the formation of coiled-coiled dimers between two
parallel α-helices (Alberts et al., 1994; Xu et al., 1996; Xiao et al., 2006). Two dimers
can then associate in an antiparallel manner to form a tetrameric subunit. Soluble
tetramers are found in cells suggesting that they are the fundamental subunit from which
IFs assemble. The antiparallel arrangement of dimers implies that the tetramer, and
hence the IF that it forms is a non-polar symmetrical structure. This distinguishes IFs
from actin filaments and MTs. The final step of NF assembly is less well-known but it
appears that tetramers add to an elongating NF in a simple binding reaction in which
they align along the axis of the filament and pack together in a helical pattern (Alberts et
al., 1994; Goldman et al., 1999). Cross-bridging between NFs and other axoplasmic
components is required for their association in parallel arrays (Nakagawa et al., 1995;
Leterrier et al., 1996). This is accomplished by the carboxyl-terminal domains of both
NF-M and NF-H which form side-arms which project from the core of the filament
(Brownlees et al., 2000). These filaments assemble in vivo as obligate heteropolymers
of NF-L, which is indispensable for assembly, with sub-stoichiometric amounts of NF-
M and/ or NF-H (Xu et al., 1996; Goldman et al., 1999). The molar ratios of these
subunits are approximately 5:2:1 for NF-L, NF-M and NF-H, respectively (Xiao et al.,
2006).

CHAPTER I- GENERAL INTRODUCTION
35
Nt
Nt
Nt
Rod domain
Rod domain
Rod domain
NF-L Tail
Tail domain
Tail domain
COOH
COOH
NF-L
NF-M
NH2 Highly conserved KSP repeat regiom Carboxyl
terminus α- helical region terminus
COOH
Figure 1.8 Structure of NF proteins. NF-L, NF-M and NF-H share a tripartite structure composed of an amino terminal head domain, a highly conserved coiled-coil rod domain and a carboxyl terminus tail of varying length. NFs undergo post-translational modifications. Indeed, the carboxyl- tail domain of NF-M and mainly NF-H contain several KSP repeats that are target to phosphorylation (taken from Schmidt et al. 1991 with modifications).
1.4.3.2 Post-translational modifications of NFs
It was first suggested by Gard and Lazarides (1982) that neurofilament function might
be regulated by phosphorylation. The steady-state phosphate content of each NF subunit
is regulated by a dynamic balance between the processes of phosphorylation and
selective dephosphorylation. This balance is regulated differently in various sites within
the neuron (Hirokawa and Takeda, 1998; Nixon, 1998; Yabe et al. 2001).
Indeed, NF-M and NF-H are some of the most highly phosphorylated proteins in the
nervous system (Xiao et al., 2006). As introduced earlier, the extensively
phosphorylated carboxyl-tail domains project outward from the filament core in a way
that phosphates are exposed on the surface of the NFs, thereby, suggesting that
phosphorylation may regulate not only NF functions and assembly but the different
interactions between the different cytoskeletal components during neurogenesis and
axon radial growth (Nixon and Sihag, 1991; Hirokawa and Takeda, 1998; Grant et al.,
2001; Yabe et al. 2001).

CHAPTER I- GENERAL INTRODUCTION
36
NFs are phosphorylated at the Ser and Thr residues in both the amino-terminal domain
and the KSP repeats in the carboxyl-tail domain. Phosphorylation and
dephosphorylation are regulated by several protein kinases and phosphatases which are
tightly regulated and interconnected (Petzold, 2005). N-terminal head phosphorylation
is performed by secondary messenger-dependent kinases (PKA and PKC) whilst
secondary–messenger independent kinases (proline-directed kinases eg. cyclin-
dependent kinase-5, glycogen synthase kinase-α3; extracellular signal regulated kinases
ERK 1 and ERK 2, stress activated protein kinases p38α, c-jun N-terminal kinase 1
(JNK 1) and 3 (JNK3)) are responsible for phosphorylation of the carboxyl-tails
(reviewed by Xiao et al., 2006). Phosphorylation of the carboxyl-tail domain of NFs is
associated with axonal development and maturation (Shea et al., 2003). Studies seem to
agree in the fact that phosphorylation of NFs can occur in the cell perikaryon but also as
they travel along the axon, consequently promoting incorporation into the cytoskeleton
(Shea et al., 1990, 1998). Although the serine residues of the KSP repeats within the
carboxyl-terminal domain are heavily phosphorylated in axons, they are largely non-
phosphorylated in perikarya and more proximal regions of axons (Sternberger and
Sternberger 1983). Of importance is the fact that NF subunits express different levels of
phosphorylation, even in the same axon but also between different axonal bundles and
nerve tracks.
NF-L and NF-M head domain and NF-H KSP repeats can also suffer glycosylation
(linked to serine and threonine residues). The role of this post-translational modification
is not fully understood, however it might be implicated in NF trafficking and function
(reviewed by Petzold, 2005).
1.4.3.3 The role of NFs in axons
During maturation axons elongate to establish a physical contact with their target
followed by radial growth (up to 10-fold in diameter; Xu et al., 1996). Axons are
enriched with NFs, which extend along their length and form the primary cytoskeletal
component, especially in mature nerve cells. The major function of NFs is to provide
mechanical stability to neurons (reviewed by Alberts et al., 1994; Nixon, 1998). In fact,
NFs in conjunction with MTs, MAPs, actin and associated motor proteins constitute the
dynamic axonal cytoskeleton (Grant et al., 2001). The relative proportion of NF
subunits varies during neuronal development. During embryonic neurogenesis NF-L

CHAPTER I- GENERAL INTRODUCTION
37
and NF-M are co-expressed whilst NF-H expression occurs later in development (Nixon
and Sihag, 1991; Shea and Beermann, 1994; Julien 1999).
NFs determine axonal calibre, which in turn is responsible for determining the
conduction velocity at which nerve impulses are propagated along the axon (Xu et al.,
1996; Hirokawa and Takeda, 2003). This was proven with two animal models in which
a lack of NFs resulted in severe inhibition of radial growth (Ohara et al., 1993; Eyer and
Peterson, 1994). Indeed, phosphorylation of NF-H and NF-M side arms (Xu et al.,
1996; Siegel, et al.; 1999) and cross bridges between NFs are thought to be crucial in
determining and maintaining axonal calibre (Nakagawa et al., 1995). However, it is
now proposed that NF-L and NF-M stoichiometrics are more important for axonal
growth than NFs phosphorylation. Indeed, NF-M is the “preferred” subunit for NF-L
copolymerisation and main regulator of axonal calibre (Elder et al., 1998; Rao et al.,
1998).
Of importance is the fact that NFs may also bind actin filaments, thus associating MFs,
NFs and MTs with the cell membrane (Leterrier et al., 1996). Indeed, Shea and
Beermann (1994) suggested that NFs role in stabilising the axonal cytoskeleton results
from interactions between NFs and MTs, which are mediated by NF-H and MAPs.
1.4.3.4 Transport of NF proteins
NFs, as all the cytoskeleton components, are synthesised within the neuronal perikaryon
and then delivered to the axon by a process known as axonal transport, which can be
divided into “fast axonal transport” and “slow axonal transport”. The first one includes
the transport of membranous organelles and the second, the transport of the cytoskeletal
proteins (such as, NFs, MTs and associated proteins; Yabe et al., 1999). In fact, the MT
system in association with its complementary motor proteins is required to transport the
cellular components (Terada, 2003). Roy et al., (2000) reported that NFs spend a
maximum of 20 % of the time moving and the rest of the time are paused. Thus, these
findings suggest that slow and fast transport may involve a unique system in which
proteins simply spend different lengths of time associated with their motors (Shea and
Flanagan, 2001).
For a long time, the form in which NFs were transported along the axon (ie. monomers
or polymers) remained unclear; however, it is now accepted that NFs are transported in

CHAPTER I- GENERAL INTRODUCTION
38
different formats, including insoluble hetero-oligomers, short filaments as well as
subunits (Lasek et al., 1993; Roy et al., 2000; Terada, 2003; Yuan et al., 2006).
Transport is most rapid during neurogenesis and slows into the adults as axons undergo
radial growth and myelination; this is when NF-H phosphorylation is maximal (Grant et
al., 2001).
It is been suggested that phosphorylation/dephosphorylation of the carboxyl-terminal
domains of NF-H and NF-M determines axonal transport rate (Prahlad et al., 2000; Roy
et al., 2000; Shea et al., 2003) and also regulates the interactions between NFs and the
anterograde and retrograde axonal motor proteins kinesin and dynein (Shea and
Flanagan, 2001; Shea et al., 2003; Jung et al., 2005). However, two studies by the
same research group challenges the “classical” hypothesis that carboxyl-terminal tail
phosphorylation of NFs regulates axonal transport, since they show that axonal
transport rate along the optic nerve of mice lacking the hyperphosphorylated tail domain
NF-H was unaltered (Rao et al., 2002; Yuan et al., 2006).
It is of interest the fact that normal segregation of highly phosphorylated NFs in axons
has been found to be disrupted in some neurons in pathological states associated with
perikaryal accumulation of neurofilaments (Hirokawa and Takeda, 1998; Nixon R.A.
1998; Yabe et al. 2001). This is further discussed in section 5.1.1 and 5.1.2.
1.5 AIMS OF PROJECT
Mitochondrial impairment, glutathione depletion and oxidative stress have been
implicated in the pathogenesis of Parkinson’s disease, linked recently to proteasomal
dysfunction (reviewed by Betarbet et al., 2005). The initial aim of this study was to
investigate how these factors influence the various activities of the proteasome in
human SH-SY5Y neuroblastoma cells treated with the PD mimetics MPP+ or DA. The
project also investigated the effects of glutathione depletion on proteasome activity of
human neuroblastoma cells either following or not toxin treatment. It is worth noting
that most of previous work in that area was performed in rodent cells. Moreover, little
information is available on PD mimetics on the three proteasomal activities.
Another aim was to determine whether treatment with neurotoxins caused a direct effect
on proteasome activity of commercial, purified 20S proteasome or in the cell extracts.
The effect of antioxidants on proteasomal activity of both toxin-treated cells and

CHAPTER I- GENERAL INTRODUCTION
39
purified 20S, was also studied. Moreover, modifications or losses of several
proteasomal subunits have been reported with ageing (Bulteau et al., 2001) and in PD
(McNaught et al., 2003), thus possible changes on the individual 20S proteasomal
subunits following treatment with MPP+ and DA were also investigated.
Finally, given that NFs, ubiquitinated proteins and proteasomal subunits are found in
proteinaceous inclusions, such as LBs and, the UPS activity is impaired in SNpc of PD
brains (McNaught and Jenner, 2001), this project also aimed to investigate whether NFs
can undergo proteasomal degradation. Additionally, the post-translational modifications
and distribution of the NF network after toxin treatment of SH-SY5Y cells were also
studied.

CHAPTER II
MATERIALS AND METHODS

CHAPTER II- MATERIALS AND METHODS
41
2. MATERIALS AND METHODS
2.1 MATERIALS
2.1.1 Cell culture
2.1.1.1 Reagents
Dulbecco´s Modified Eagle’s medium (DMEM; 12-614F), foetal bovine serum (14-
801-F), penicillin/ streptomycin (17-603E), L-glutamine (17-603E), trypsin/EDTA
solution (02-007E), were all purchased from Cambrex, Berkshire, UK.
DMEM/HAM´s F12 medium (D6421), MEM non-essential amino acids solution
(M7145), Trypan blue solution 0.4 % (v/v; T8154), from Sigma-Aldrich Chemical
Company, Poole, UK
2.1.1.2 Plastic ware
All sterile plastic were supplied by Sarstedt, Leicester, UK.
- Cryotube vials (Nunc brand products), Merk Ltd., Leicester, UK.
- Microtitre plates, 96-well flat-bottomed non sterile, black (015-210190W), Fisher
Scientific UK.
- Nunc Lab-Tech CC chamber slides (permanox, 177445), Scientific Laboratory
Supplies, Ltd., Nottingham, UK.
2.1.2 Specialised laboratory reagents
- Acrylogel 3 solution Electran (containing 2.5% NN´-methylenebisacrylamide, final
ratio 29:1:0.9; 443735T), VWR International Ltd., Poole, UK.
- Adenosine 5’-triphosphate (ATP; A3377), Sigma-Aldrich Chemical Company, Poole,
UK.
- Ascorbic acid (vitamin C; A5960), Sigma-Aldrich Chemical Company, Poole, UK.
- Bio-Rad protein assay dye reagent concentrate (500-0006), Bio-Rad Laboratories Ltd.,
Hemel Hempstead, UK.
- 5-Bromo-4-chloro-3-indolyl-phosphate (di-sodium salt; BCIP; MB1018), Melford
Laboratories Ltd. Ipswich, UK.

CHAPTER II- MATERIALS AND METHODS
42
- L-buthionine-[S,R]-sulfoximine (BSO; B2515), Sigma-Aldrich Chemical Company,
Poole, UK.
- Cycloheximide (C-7698), Sigma-Aldrich Chemical Company, Poole, UK.
- Dimethlsulfoxide (DMSO; D/4120/PB08), Fisher Scientific UK Ltd., Loughborough,
UK.
- 5,5’- Dithio-bis(2-nitrobenzoic acid), (DTNB; D-8130), Sigma-Aldrich Chemical
Company, Poole, UK.
- 2D gel starter kit- (163-2105), Bio-Rad Laboratories Ltd., Hemel Hempstead, UK.
- ECL Western Blotting detection Reagents (RPN2109), GE Healthcare Bio-Sciences,
Bucks, UK.
- Folin-Ciocalteu´s phenol Reagent (J/4100/08), Fisher Scientific UK, Leicester, UK.
- GBX developer/replenisher (P7042), Sigma-Aldrich Chemical Company, Poole, UK.
- GBX fixer/replenisher (P7167), Sigma-Aldrich Chemical Company, Poole, UK.
- Glutathione (G-4251), Sigma-Aldrich Chemical Company, Poole, UK.
- Glutathione reductase (EC 1.6.4.2; G3664), Sigma-Aldrich Chemical Company,
Poole, UK.
- Igepal CA-630 (I3021), Sigma-Aldrich Chemical Company, Poole, UK.
- MPP+ Iodide (D048), Sigma-Aldrich Chemical Company, Poole, UK.
- 3-(4,5-dimethylthiazol-2-yl)-2,5-diphenyltetrazolium bromide (MTT; M2128), Sigma-
Aldrich Chemical Company, Poole, UK.
- N-acetyl cysteine (A7250), Sigma-Aldrich Chemical Company, Poole, UK.
- β- nicotinamide adenine dinucleotide phosphate, reduced form (β- NADPH; N1630),
Sigma-Aldrich Chemical Company, Poole, UK.
- Nitro Blue Tetrazolium (NBT; MB1019), Melford Laboratories Ltd., Ipswich, UK.
- Nitrocellulose 0.22 μM pore size (WP2HY00010), Genetic Research Instrumentation,
Essex, UK.
- Precision Plus protein dual colour standards (161-0374), Bio-Rad Laboratories Ltd.,
Hemel Hempstead, UK.
CHAPTER II- MATERIALS AND METHODS
43
- Pre-stained SDS molecular weight standard mixture (SDS-7B), Sigma-Aldrich
Chemical Company, Poole, UK.
- Ready IPG strip, pH 3-10, non-linear, 7cm (163-2002), Bio-Rad Laboratories Ltd.,
Hemel Hempstead, UK.
- Silver staining kit, Protein (17-1150-01), GE Healthcare Bio-Sciences, Bucks, UK.
- ± α- Tocopherol (vitamin E; T3251), Sigma-Aldrich Chemical Company, Poole, UK.
- XAR-5 Kodak Film (F5388), Sigma-Aldrich Chemical Company, Poole, UK.
- Vialight bioassay kit (HS Plus; RT07-221) , Cambrex, Berkshire, UK.
Enzymes
- 20S proteasome (mammalian; EC 3.4.25.1; PW8729), Biomol International, Exeter,
UK.
- Trypsin (EC 3.4.21.4) Type II-S, porcine pancreas, Sigma-Aldrich Chemical
Company, Poole, UK.
- Calpain-2 (EC 3.4.22.53), rat, recombinant, high purity, E. coli (208718), Calbiochem,
Nottingham, UK. .
Fuorogenic substrates
- Boc-Leu-Arg- Arg-AMC·HCl (I1585), Bachem, Merseyside, UK.
- Suc-Leu-Leu-Val-Tyr-AMC, (I1395), Bachem, Merseyside, UK.
- Z-Leu-Leu-Glu-AMC (539141), CN Biosciences, Nottingham, UK.
Protease Inhibitors
- MDL 28,170 (208722), Calbiochem, Nottingham, UK.
- Lactacystin Proteasome inhibitor (sc-3575), Autogen Bioclear UK Ltd., Calne, UK.
- Protease Inhibitor cocktail (P8340), Sigma-Aldrich Chemical Company, Poole, UK.

CHAPTER II- MATERIALS AND METHODS
44
2.1.3 Antibodies
2.1.3.1 Primary Antibodies
- Anti-ERK (K23) antibody (sc-94), Santa Cruz Biotech, Santa Cruz, California, USA.
- Neurofilament 200KDa monoclonal antibody (clone N52) (N0142), Sigma-Aldrich
Chemical Company, Poole, UK.
- SMI 31 anti-phospho-neurofilaments, Sternberger Monoclonals Inc, Maryland, USA.
- Proteasomal subunit β4, Rabbit polyclonal antibody (PW8890), Biomol International,
Exeter, UK.
- Proteasomal subunit β5, Rabbit polyclonal antibody (PW8895), Biomol International,
Exeter, UK.
- Proteasomal subunit β6, Rabbit polyclonal antibody (PW900), Biomol International,
Exeter, UK.
- Proteasomal subunit β2, mouse monoclonal antibody (clone MPC168; PW8145),
Biomol International, Exeter, UK.
- Proteasomal “core subunits” (α5/α7/β1, β5,β5i,β7), Rabbit polyclonal antibody
(PW8155), Biomol International, Exeter, UK.
- Proteasome subunits α 1, 2, 3, 5, 6 and 7 mouse monoclonal antibody (clone MPC231;
PW8195), Biomol International, Exeter, UK.
2.1.3.2 Secondary Antibodies
- Goat anti-mouse immunoglobulins alkaline phosphatase conjugated (D0486).
- Goat anti-mouse immunoglobulins horseradish peroxidase conjugated (P0447).
- Goat anti-rabbit immunoglobulins alkaline phosphatase conjugated (D0487).
- Goat anti-rabbit immunoglobulins horseradish peroxidase conjugated (P0448).
- Rabbit anti-mouse immunoglobulins FITC conjugated (F0261).
- Rabbit anti-mouse immunoglobulins alkaline phosphatase conjugated (D0487).
All purchased from DAKO Ltd., Cambridgeshire, UK.

CHAPTER II- MATERIALS AND METHODS
45
2.1.4 Specialised equipment
- Bio-Rad mode 680 microplate reader, Bio-Rad Laboratories Ltd., Hemel Hempstead,
UK.
- Bio-Rad protean IEF Cell System, Bio-Rad Laboratories Ltd, Hempstead, UK.
- Bio-Rad power Pac 300, Bio-Rad Laboratories Ltd., Hemel Hempstead, UK.
- Bio-Rad Trans-Blot electrophoretic transfer system, Bio-Rad Laboratories Ltd,
Hempstead, UK.
- Cell scraper (C2808), Sigma-Aldrich Chemical Company, Poole, UK.
- Leica CLMS confocal laser microscope, Leica, Germany.
- Fluostar optima plate reader, BMG Labtech Ltd., Bucks, UK.
- Fujifilm FLA-5100 gel scanner, Fujifilm Life Sciences Products, Sheffield, UK.
- Fujifilm intelligent dark box, Fujifilm Life Sciences Products, Sheffield, UK.
- MIKRO 22R microfuge, Hettich, Germany.
- Mini- PROTEAN III system, Bio-Rad Laboratories Ltd., Hemel Hempstead, UK.
- Nikon Eclipse TS 100 inverted microscope, Nikon, Japan.
- Neubauer double cell clear sight haemocytometer (AC1000), Weber Scientific
International (Division of Hawksley Technology), West Sussex, UK.
- Sanyo CO2 incubator MCO-17AIC, Sanyo Gallenkamp PCL, Leicestershire, UK.
- Sanyo Harrier 18/80 refrigerated centrifuge, Sanyo Gallenkamp PCL, Leicestershire,
UK.
- Soniprep 150, MSE scientific instruments, UK.
- Tecan SPECTRA Fluor plate reader, Tecan, UK Ltd., Reading, UK.
- Walker class II microbiological safety cabinet, Walker safety cabinets Ltd.,
Derbyshire, UK.

CHAPTER II- MATERIALS AND METHODS
46
2.1.4.1 General laboratory reagents
All general laboratory reagents were of the highest grade and purchased from Sigma-
Aldrich Chemical Company, Poole, UK, unless otherwise specified in the text.
2.2 METHODS
2.2.1 Cell culture
A clone of human SH-SY5Y neuroblastoma cell line was obtained from European
Collection of Animal and Cell Cultures (ECACC).
2.2.1.1 Maintenance of SH-SY5Y cells
Cell culture was carried out in a class II safety cabinet using aseptic technique. Cells
were cultured in 25 cm2 (T25), 75 cm2 (T75) and 175 cm2 (T175) flasks in Dulbecco´s
Modified Eagles Medium (DMEM)/HAMS F12 (1:1) containing: 10% (v/v) heat
inactivated foetal bovine serum (heat inactivated at 60 ºC for 30 min), 2mM L-
glutamine, 100 units/ml penicillin, 100 μg/ml streptomycin and 1 % (v/v) non essential
aminoacids (“growth medium”).
Cells were maintained as a monolayer and incubated at 37 oC in a humidified
atmosphere of 95 % (v/v) air / 5 % (v/v) carbon dioxide until 70-90 % confluent.
2.2.1.2 Sub-culture
When cells required subculturing, growth medium was removed using a Pasteur pipette
and the cell monolayer was washed twice with pre-warmed DMEM (37 oC). Cells were
detached from the growing surface using trypsin (100 μg/ml) / Ethylenediamine
(EDTA; 40 μg/ml) in DMEM at 37 oC (trypsinisation). Trypsin activity was quenched
by the addition of growth medium (ten times the volume of trypsin solution). The
suspension was transferred to a sterile centrifuge tube and centrifuged at 150 x g for 5
min. The supernatant was removed and the pellet re-suspended in 1ml of fresh growth
medium. Following cell count, a volume of cell suspension (dependent on the number
of cells required) was transferred to an appropriate sterile flask containing fresh growth
medium. Cells were then incubated as described in section 2.2.1.

CHAPTER II- MATERIALS AND METHODS
47
2.2.1.3 Viable cell counting and seeding
To seed cells at a given density a volume (typically 20 μl) of cell suspension was
diluted 1:10 in Trypan blue solution (0.4% (v/v)). A viable cell count was performed in
five fields of Neubauer haemocytometer using light microscopy. Cell density was
calculated as follows:
Cell/ml = average cell number (from five fields) x 104 x dilution factor
This was then used to calculate the volume of cell suspension required to achieve a
specific cell density in a known volume of fresh growth medium. Once seeded cells
were incubated as described in section 2.2.1.
2.2.1.4 Cryo-preservation of cells
Long-term storage of cells was achieved in the gaseous phase of liquid nitrogen in
freezing medium containing, 95 % (v/v) FBS and 5 % (v/v) sterile dimethyl sulphoxide
(DMSO). Cells were grown as described in section 2.2.1, harvested by trypsinisation, a
viable count performed (see section 2.2.1.3) and cells resuspended in ice-cold freezing
medium at a density of 2 x 10⁶cells/ml. The suspension was immediately transferred to
cryovials on ice (1 ml aliquots) and stored at -80 oC overnight before transferring to
liquid nitrogen for long term storage.
2.2.1.5 Resuscitation of cryo-preserved cells
Cryovials were removed from liquid nitrogen storage and rapidly thawed in a 37 oC
water bath. Cell suspensions were immediately transferred to a sterile centrifuge tube
containing 10 ml of fresh growth medium. Suspensions was centrifuged 150 x g for 5
min. The supernatant was removed and cells re-suspended in 1 ml fresh growth medium
using a Pasteur pipette before transfer to a sterile T25 flask containing 10 ml of growth
medium. Cells were incubated as described section 2.2.1 and sub- cultured as described
in section 2.2.1.2.
2.2.2 Assessment of cell viability: MTT tetrazolium salt assay for
anchorage dependent cells
3-[4-5-Dimethylthiazol-2-y1]-2,5-diphenyl tetrazolium bromide (MTT) is a substrate
that is taken up by cells and reduced by mitochondrial and endoplasmic reticulum
CHAPTER II- MATERIALS AND METHODS
48
dehydrogenase enzymes, to a purple formazan product that accumulates within viable
cells (Cookson et al., 1995). In general, cell viability was assessed in 96-well plates.
Typically, 10 μl of 5mg/ml MTT in DMEM were added to the culture medium of
growing cells and incubated at 37 oC in a humidified atmosphere of 95 % (v/v) air / 5 %
(v/v) carbon dioxide for 1 hour. After this time medium was carefully removed from the
cells and the formazan product solubilised in 100μl DMSO. The plate was agitated on
an orbital shaker to aid dissolution of the formazan product prior to reading the
absorbance at 570 nm. Absorbance results were expressed as mean percentage cell
viability compared to controls ± standard error of the mean (SEM).
2.2.3 ATP assay
The ViaLight HS plus kit was used according to the manufacturer´s guidelines. The kit
is based upon the bioluminescent measurement of ATP that is present in all
metabolically active cells. The method utilises an enzyme, luciferase, which catalyses
the formation of light from ATP and luciferin according to the following reaction:
LUCIFERASE
ATP + Luciferin + O2 Oxyluciferin + AMP + PPi + CO2 + LIGHT
Mg++
Cells were cultured in 96-well plates as described in section 2.2.1. To assay ATP, 50 μl
of cell lysis reagent was added to each well (containing 100 μl of medium). After 10
min, 100 μl of extracts or ATP standards (containing 0, 12.5, 50, 250, 500, 5000, 5000,
25000 pmols) were transferred to a white walled microtitre plate where 100 μl of ATP
monitoring PLUS reagent were added to each well. The emitted light intensity
(directlyproportional to ATP concentration) was measured (365nm) and the ATP
content calculated from the ATP calibration graph. The assay was conducted at ambient
temperature (18-22 ºC). Results were calculated as pmols ATP/ μg protein and
converted to mean % of ATP (in comparison to control samples) ± SEM.

CHAPTER II- MATERIALS AND METHODS
49
2.2.4 Preparation of cell lysates
2.2.4.1 Total protein extraction from cells for detection of neurofilament
proteins in response to protease inhibitors and toxins
Cells (1.5x10⁶) were seeded in T25 flasks and left 24 h to allow attachment and
recovery. Medium was carefully removed from each flask and replaced with 5 ml of
fresh growth medium supplemented with or without different treatments depending on
the specific experiment. After the required time (normally 24, 48 and 72 h) cells were
detached by trypsinisation (see section 2.2.1.2) and the resultant pellet lysed in 250 μl
extraction buffer (50 mM Tris, pH 6.8; 150 mM NaCl; 5 mM EDTA; 1 % sodium
dodecyl sulphate (SDS); 0.2 % (v/v) protease inhibitor cocktail) and transferred to an
eppendorf tube on ice. For experiments where a significant number of cells were
floating, these were harvested and included in the extraction; medium and DMEM
washes were collected and centrifuged at 150 x g for 5 min. The resultant pellet was
added to the adherent cell extract. Total extracts were sonicated (6 x 3 seconds) on ice
and heated at 100oC for 5 min. Aliquots of samples were stored at -20 ºC prior to
protein estimation by the Lowry method (see section 2.2.5.1)
2.2.4.2 Protein extraction from cells for measuring 26S/20S proteolytic
activity
Cells were seeded at a density of 500,000 cells/well in 6-well plates and incubated for
24 h to allow attachment and recovery. Medium was carefully removed from each well
and replaced with 2 ml of fresh growth media supplemented with the treatment. After
the required time period, cells were washed twice with 1ml of DMEM and detached
using a cell scraper in 250 μl ice-cold homogenisation buffer [20 mM Tris/HCl, pH 7.2;
0.1 mM EDTA; 1 mM 2-mercaptoethanol; 5 mM ATP; 20 % (v/v) glycerol; 0.04 %
(v/v) Igepal CA-630]. Cell lysates were transferred to an eppendorf tube on ice. For
experiments where a significant number of cells were floating, these were harvested and
included in the extraction; medium and DMEM washes were collected and centrifuged
at 150 x g for 5 min. The resultant pellet was added to the adherent cell extract. Finally,
total extracts were vigorously vortex mixed and kept on ice for immediate analysis of
CHAPTER II- MATERIALS AND METHODS
50
2.2.5 Estimation of protein in cell extracts
2.2.5.1 Mini-Lowry method
The protein content of samples was estimated using the Lowry method (Lowry et al.,
1951, with modifications). A calibration graph was constructed using bovine serum
albumin (BSA) to represent 0-80 μg protein. Equal volumes of extraction buffer used in
the samples were added to each standard (typically 10-30 μl) and standards made up to
a final volume of 100 μl in distilled water.
The working Lowry reagent [1ml; 2 % (w/v) NaCO3, 0.01 % (w/v) CuSO4, 0.027 %
(w/v) NaK tartrate in 0.1 M NaOH] was added to each standard and sample, vortex
mixed and incubated at room temperature for 15 min. The reaction was developed over
30 min at room temperature by adding 100 μl Folin Ciocalteu´s phenol reagent diluted
1:1 in distilled water. All samples were vortex mixed and absorbance measured at 750
nm.
2.2.5.2 Bio-Rad protein assay
The Bio-Rad protein assay was used in accordance with the manufacturer´s guidelines.
A calibration graph ranging from 0-50 μg was prepared from BSA as detailed in section
2.2.5.1) Samples and standards were diluted to 800 μl in distilled water. 200 μl of Bio-
Rad dye reagent were added to each standard and sample, vortex mixed and after an
incubation period of 5 min, absorbances were read at 595 nm.
2.2.6 Fluorogenic peptide assay for protease activity.
2.2.6.1 20S/26S proteasomes activity
Proteasome specific substrates are typically three to four amino acid residue peptides
with a fluorogenic tag at the C terminus. The proteasome cleaves an amido bond
between an amino acid and the fluorogenic tag, resulting in the realease of a highly
fluorescent product. From the different fluorophores used in these substrates, 7-amino-
4methylcoumarin (AMC) has the highest fluorescence and is the most commonly used
CHAPTER II- MATERIALS AND METHODS
51
fluorogenic reporter group in proteasome substrates. Substrates chosen for the assay
were Suc-LLVY-AMC (50 μM), Boc-LRR-AMC (100 μM) and Z-LLE-AMC (37.5
μM) for chymotrypsin-like (CLA), trypsin–like (TLA) and post acidic-like (PLA)
proteasomal activities, respectively. (Canu et al. 2000; David et al. 2002, Kisselev and
Goldberg 2005). 100μl of SH-SY5Y cell lysates (∼ 20-30 μg protein; see section
2.2.4.2) or 0.05 μg of purified human 20S proteasome were incubated at 37oC with a
fluorogenic substrate in assay buffer (50 mM HEPES, 5mM EGTA pH 8.0) in a total
volume of 200μl. Readings were taken every 5-10 min for 3h (360nm excitation; 465
nm emission). Results were calculated as ΔFU/s/ μg protein and then converted to %
activity in comparison to control samples.
2.2.6.2 Fluorogenic peptide assay for calpain activity.
Calpain activity was measured with the method described by Sasaki et al. (1984) with
modifications. Rat, recombinant calpain-2 was utilised in this fluorogenic assay. 0.36
μg/μl of calpain-2 were pre-incubated at 37oC in assay buffer (60 mM imidizole pH 7.3,
5 mM L-cysteine, 2.5 μM 2-mercaptoethanol, 5 mM CaCl2 and 4 % (v/v) DMSO) for
15 min before the addition of the fluorogenic substrate Suc-Leu-Tyr-AMC (1 mM) in a
100 μl total assay buffer volume. Fluorescence was measured (360 nm excitation; 465
nm emission) every min for 20 min. Results were calculated as ΔFU/s/μg protein and
then converted to % activity in comparison to control samples.
2.2.7 Measurement of total glutathione levels
Total glutathione levels were determined using the DTNB-GSSG reductase-recycling
assay, based on the method of Anderson (1985) with minor modifications. The assay
works on the basis of the following reactions:
2 GSH + DTNB → GSSG +TNB
↑ ↓
2 GSH + NADP+← GSSG + NADPH + H+
Cells were plated out in T25 flasks at 80 % cell density, incubated overnight for
recovery, then medium was removed and treatments were added. Following treatment,
CHAPTER II- MATERIALS AND METHODS
52
2.2.8 Denaturing polyacrylamide gel electrophoresis (SDS-PAGE)
2.2.8.1 Preparation of polyacrylamide resolving gels
The Bio-Rad mini protean III apparatus was assembled according to the manufacturer´s
guidelines. In brief two glass plates were held, typically 1.5mm apart, by vertical
spacers.
For each gel, 10 ml gel mix were prepared as detailed in Table 2.1 and degassed under
vacuum for 10 min. For each 10 ml gel mix, 100μl 10 % (w/v) ammonium persulphate
(APS) and 10 μl N, N, N’, N’-tetramethyl-ethylenediamine (TEMED) were used as
polymerisation agents and added immediately before the gel was poured.
Gels were poured with a 2.5 cm space at the top of the glass plates to allow the addition
of a stacking gel and covered with a layer of distilled water. The gel mix was allowed to
polymerise at room temperature for 30-45 min.
Table 2.1 details the methods for preparation of polyacrylamide resolving gels.
Separation of proteins within a sample can be varied depending on the percentage of
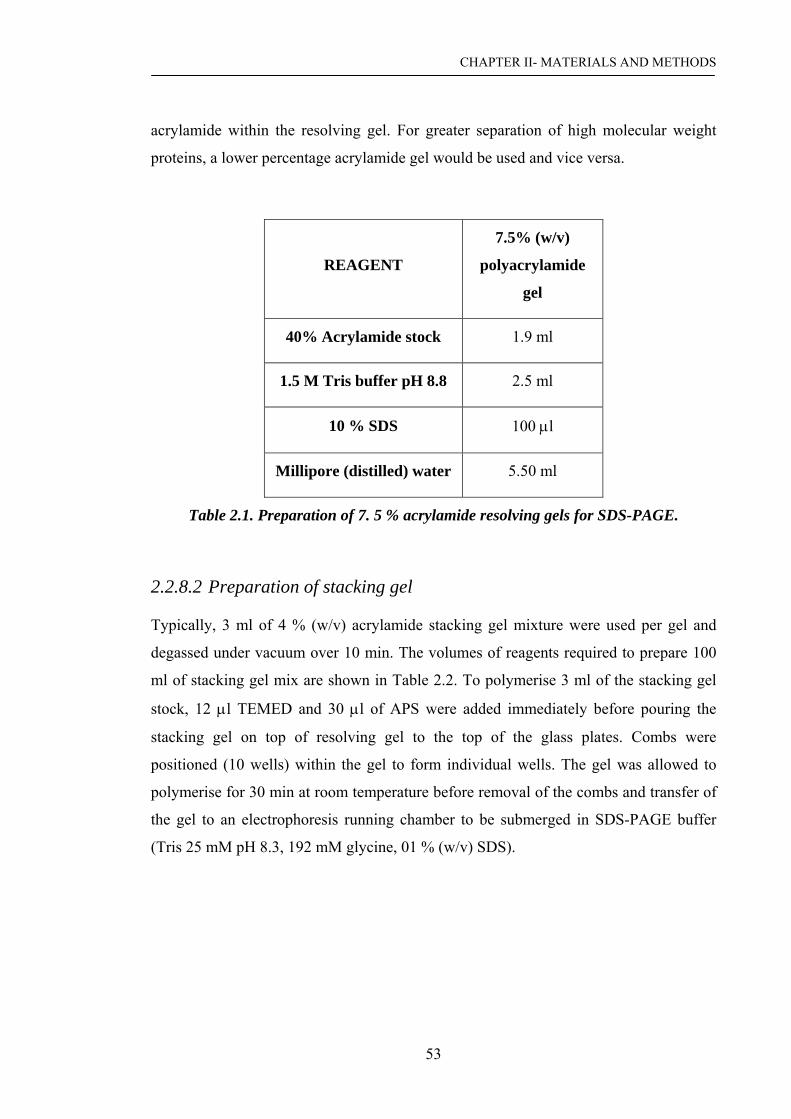
CHAPTER II- MATERIALS AND METHODS
53
acrylamide within the resolving gel. For greater separation of high molecular weight
proteins, a lower percentage acrylamide gel would be used and vice versa.
REAGENT
7.5% (w/v)
polyacrylamide
gel
40% Acrylamide stock 1.9 ml
1.5 M Tris buffer pH 8.8 2.5 ml
10 % SDS 100 μl
Millipore (distilled) water 5.50 ml
Table 2.1. Preparation of 7. 5 % acrylamide resolving gels for SDS-PAGE.
2.2.8.2 Preparation of stacking gel
Typically, 3 ml of 4 % (w/v) acrylamide stacking gel mixture were used per gel and
degassed under vacuum over 10 min. The volumes of reagents required to prepare 100
ml of stacking gel mix are shown in Table 2.2. To polymerise 3 ml of the stacking gel
stock, 12 μl TEMED and 30 μl of APS were added immediately before pouring the
stacking gel on top of resolving gel to the top of the glass plates. Combs were
positioned (10 wells) within the gel to form individual wells. The gel was allowed to
polymerise for 30 min at room temperature before removal of the combs and transfer of
the gel to an electrophoresis running chamber to be submerged in SDS-PAGE buffer
(Tris 25 mM pH 8.3, 192 mM glycine, 01 % (w/v) SDS).
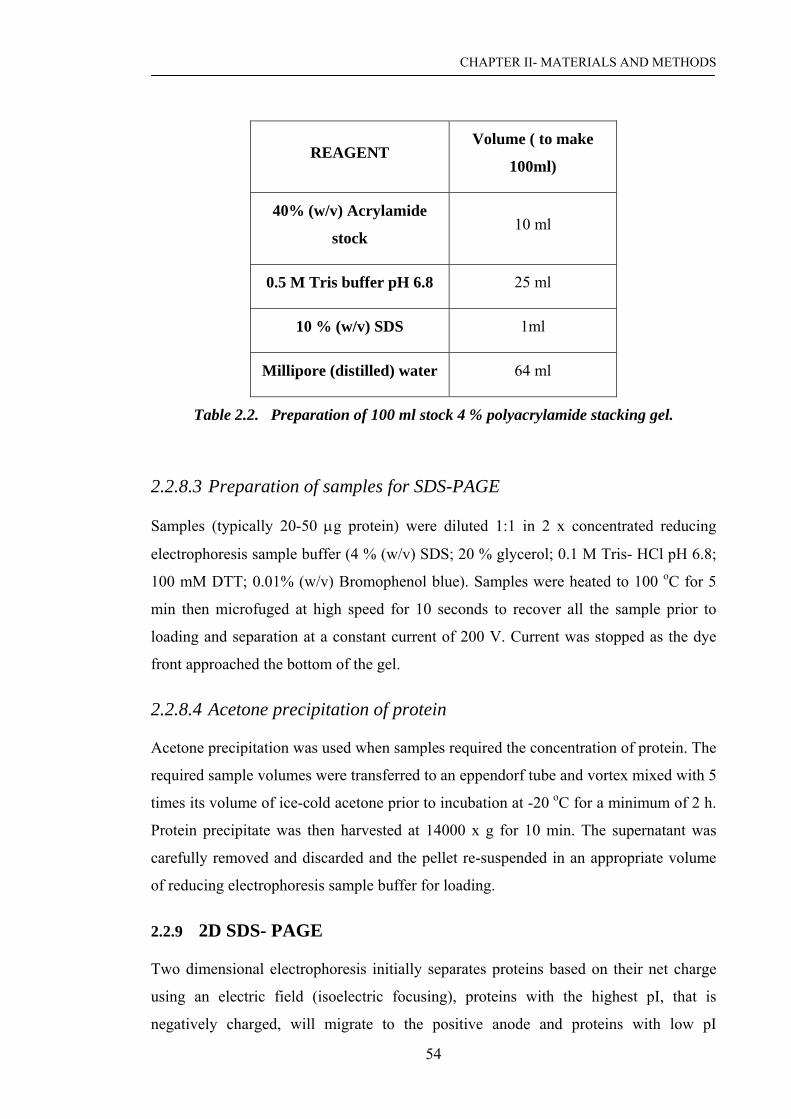
CHAPTER II- MATERIALS AND METHODS
54
REAGENT Volume ( to make
100ml)
40% (w/v) Acrylamide
stock 10 ml
0.5 M Tris buffer pH 6.8 25 ml
10 % (w/v) SDS 1ml
Millipore (distilled) water 64 ml
Table 2.2. Preparation of 100 ml stock 4 % polyacrylamide stacking gel.
2.2.8.3 Preparation of samples for SDS-PAGE
Samples (typically 20-50 μg protein) were diluted 1:1 in 2 x concentrated reducing
electrophoresis sample buffer (4 % (w/v) SDS; 20 % glycerol; 0.1 M Tris- HCl pH 6.8;
100 mM DTT; 0.01% (w/v) Bromophenol blue). Samples were heated to 100 oC for 5
min then microfuged at high speed for 10 seconds to recover all the sample prior to
loading and separation at a constant current of 200 V. Current was stopped as the dye
front approached the bottom of the gel.
2.2.8.4 Acetone precipitation of protein
Acetone precipitation was used when samples required the concentration of protein. The
required sample volumes were transferred to an eppendorf tube and vortex mixed with 5
times its volume of ice-cold acetone prior to incubation at -20 oC for a minimum of 2 h.
Protein precipitate was then harvested at 14000 x g for 10 min. The supernatant was
carefully removed and discarded and the pellet re-suspended in an appropriate volume
of reducing electrophoresis sample buffer for loading.
2.2.9 2D SDS- PAGE
Two dimensional electrophoresis initially separates proteins based on their net charge
using an electric field (isoelectric focusing), proteins with the highest pI, that is
negatively charged, will migrate to the positive anode and proteins with low pI

CHAPTER II- MATERIALS AND METHODS
55
(positively charged) will migrate to the negative cathode. Then SDS-PAGE
electrophoresis separates these proteins based on their denatured molecular weight,
higher molecular weight proteins will experience higher resistance in the gel so will
migrate less distance than low molecular weight proteins.
For 2D SDS-PAGE a Bio-Rad readyPrep 2D-starter kit and the Bio-Rad protean IEF
Cell System were used following the manufacturer’s instructions.
2.2.9.1 IPG Strip Re-hydration
The required number of 7 cm ready IPG strips (pH 3-10) were removed from the -20 ºC
freezer. 100 μl of isoelectric (IGF) buffer were pipetted into the required lanes of a
disposable re-hydration tray and IPG strips (backing plastic removed) were gently
placed, gel side down, onto the IGF buffer avoiding air bubbles to form. Then the tray
was covered and left overnight at room temperature to allow strip re-hydration..
2.2.9.2 Sample preparation
2-5 μg of purified 20S proteasome (in 50 mM HEPES, 5mM EGTA pH 8.0) were
incubated with 2mM MPP+ or DA in phosphate buffer saline (PBS; 137 mM NaCl, 2.68
mM KCl, 8.1 mM Na2HPO4, 1.47 mM KH2PO4 pH 7.4) for 2 h at 37º C prior to
solubilisation in IGF buffer to cup loading samples onto the strips .
2.2.9.3 Isoelectric focusing (IEF)
IEF tray was cleaned with ethanol and then water prior to positioning damped electrode
wicks over each electrode wire. Each IPG strip was transferred to the corresponding
lanes of the focussing tray, gel side down and + end of the strips to the anode end of the
tray, avoiding air bubbles underneath the strip. IPG strips were then covered with
mineral oil and samples were cup-loaded under the cathode (-) end of each IPG strip.
The tray was then placed in the protean IEF cell and focussing was run at 50 μΑ / strip
at 20 ºC and linear ramping of 250 V/ 20 min (step 1) followed by linear ramping of
4000 V/ 2 h (step 2) and linear ramping of 4000V /10000V-h (step 3, total process time
5 h). After electrofocussing mineral oil was drained off, strips placed into a clean
disposable tray and stored at -20 ºC until ready to run second dimension electrophoresis.
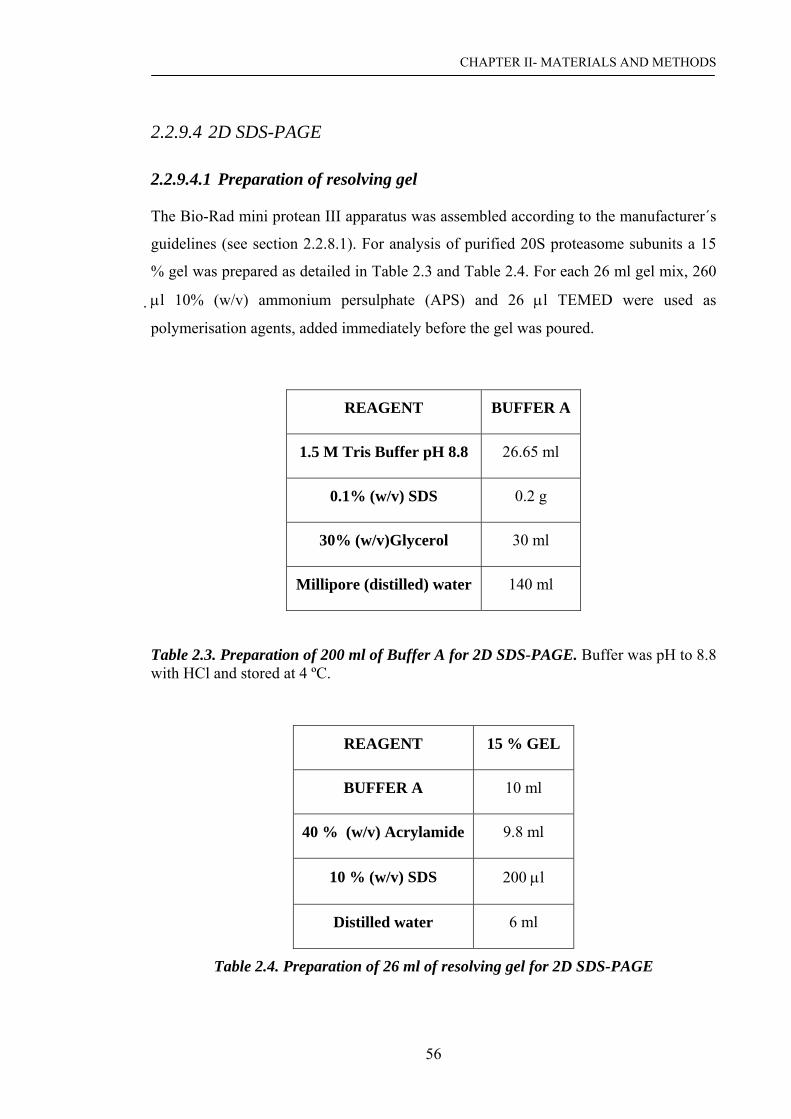
CHAPTER II- MATERIALS AND METHODS
56
2.2.9.4 2D SDS-PAGE
2.2.9.4.1 Preparation of resolving gel
The Bio-Rad mini protean III apparatus was assembled according to the manufacturer´s
guidelines (see section 2.2.8.1). For analysis of purified 20S proteasome subunits a 15
% gel was prepared as detailed in Table 2.3 and Table 2.4. For each 26 ml gel mix, 260
μl 10% (w/v) ammonium persulphate (APS) and 26 μl TEMED were used as
polymerisation agents, added immediately before the gel was poured.
REAGENT BUFFER A
1.5 M Tris Buffer pH 8.8 26.65 ml
0.1% (w/v) SDS 0.2 g
30% (w/v)Glycerol 30 ml
Millipore (distilled) water 140 ml
Table 2.3. Preparation of 200 ml of Buffer A for 2D SDS-PAGE. Buffer was pH to 8.8 with HCl and stored at 4 ºC.
REAGENT 15 % GEL
BUFFER A 10 ml
40 % (w/v) Acrylamide 9.8 ml
10 % (w/v) SDS 200 μl
Distilled water 6 ml
Table 2.4. Preparation of 26 ml of resolving gel for 2D SDS-PAGE

CHAPTER II- MATERIALS AND METHODS
57
2.2.9.4.2 IPG strip equilibration
This step ensures that cysteines are reduced and alkylated to minimise vertical streaking
in the second dimension.
To reduce cysteine residues, 1 ml of equilibrium buffer I [6 M urea, 2 % (w/v) SDS,
0.375 M Tris-HCl pH 8.8, 2 % (w/v) DTT and 20 % (v/v) glycerol] was added to each
lane containing an IPG strip (gel side down) and samples placed on an orbital shaker for
10 min. This procedure was repeated 3 times using fresh equilibration buffer I. Strips
were then washed in 1 ml of equilibration buffer II [6M urea, 2 % (w/v) SDS, 0.375 M
Tris-HCl pH 8.8 and 20 % (v/v) glycerol] to alkylate free residues. This procedure was
repeated 3 times using fresh equilibration buffer II.
Once resolving gels and strips were equilibrated, strips were removed from the
disposable equilibration tray and dipped briefly into SDS-PAGE buffer [Tris 25 mM pH
8.3, 192 mM glycine, 0.1 % (w/v) SDS] and laid, gel side up, onto the back plate of the
resolving SDS-PAGE gel. Strips were overlaid with melted agarose and the gels
submerged in SDS-PAGE running buffer. 20S subunits were separated at a constant
current of 200 V. Separation was stopped as the dye front approached the bottom of the
gel.
2.2.9.5 Silver staining of the 2D SDS-PAGE (mass spectroscopy
compatible)
For this purpose the GE healthcare silver staining kit was used following the
manufacturer´s instructions. All glassware used was previously washed with detergent,
rinsed with distilled water and immersed in 5 % (v/v) nitric acid for a minimum of one
hour. In brief, 2D gels were first fixed in 40 % (v/v) ethanol and 10 % (w/v) glacial
acetic acid for 30 min, and then washed three times in millipore distilled water for 5
min. Gels were sensitised in 30 %(v/v) ethanol, 0.2 % (w/v) sodium thiosulphate and
0.83 M sodium acetate for 30 min and then washed with millipore distilled water once
for 15 min prior to a second wash left overnight. The following day, silver reaction was
conducted with 0.25 % (w/v) silver nitrate; no formaldehyde was added at this step to
allow mass spectroscopy compatibility. Gels were rinsed twice in millipore distilled
water for 1 min before developing the gels in 0.236 M sodium carbonate and 0.0148 %
(w/v) formaldehyde for the required time. Development of the gels was stopped with
CHAPTER II- MATERIALS AND METHODS
58
43.2 mM EDTA-Na2·2 H2O for 10 min. Gels were stored at 4oC in millipore distilled
water. Pictures of the gels were taken on a Fujifilm FLA 5100 gel scanner.
2.2.10 Western blotting and immunoprobing of proteins
2.2.10.1 Western blotting
Proteins separated by SDS-PAGE were transferred electrophoretically onto a
nitrocellulose membrane by Western blotting using the Wet blotting (Bio-Rad Trans-
Blot electrophoretic) system method. Four pieces of filter paper and one piece of
nitrocellulose were cut to the same size as the gel and pre-saturated with electroblotting
buffer [48 mM Trizma base, 39 mM glycine, 20 % (v/v) methanol, 0.0375 % (w/v)
SDS]. The gel was laid on the top of the sheet of nitrocellulose. This was sandwiched
on each side with two pieces of filter paper and two fibre pads. Care was taken during
this procedure to ensure no air pockets. The nitrocellulose sandwich was held in a
plastic case submerged in electroblotting buffer in a tank. For overnight blotting 30 V
were applied over 16 h at room temperature. The process could also be carried out in 1 h
30 min at 100 V according to the manufacturer’s instructions.
2.2.10.2 Immunoprobing
2.2.10.2.1 Preparation of nitrocellulose for immunoprobing
Protein transferred to nitrocellulose during the blotting process was stained with copper
pthalocyanine 3,4’,4’’,4’’’ tetrasulphonic acid tetrasodium salt (0.05 % (w/v) in 12 mM
HCl) to ensure adequate transfer and to allow for imaging (Fujifilm intelligent dark
box). The nitrocellulose was then cut as required for immunoprobing and de-stained in
12 mM NaOH and washed in distilled water.
2.2.10.2.2 Blocking of non-specific antibody binding and immunoprobing
with primary and secondary antibodies
Non–specific antibody binding was prevented by blocking of nitrocellulose for 1 h in
3 % (w/v) marvel milk / Tris saline buffer (50 mM Trizma base, 200 mM NaCl, pH 7.4;
TBS) with gentle shaking. Nitrocellulose sections were incubated with primary antibody
diluted in blocking agent overnight at 4 oC with gentle shaking. Information regarding
the epitope specificity and required dilutions of primary monoclonal antibodies used are

CHAPTER II- MATERIALS AND METHODS
59
detailed in Table 2.5. Unbound primary antibody was removed by washing with TBS /
0.1 % (v/v) Tween 20 for 6 x 10 min washes with vigorous shaking. Nitrocellulose
sections were incubated with an alkaline phosphatase or horseradish peroxidase (HRP)
conjugated secondary antibody diluted 1:1000 in 3 % Marvel/TBS to allow
development via colorimetric or enhanced chemiluminescence methods respectively
(see sections 2.2.10.3 and 2.2.10.4). Secondary antibodies were incubated for 2 h at
room temperature with gentle shaking. Unbound antibody was again washed with TBS /
0.1 % (v/v) Tween 20 for 6 x 10 min.
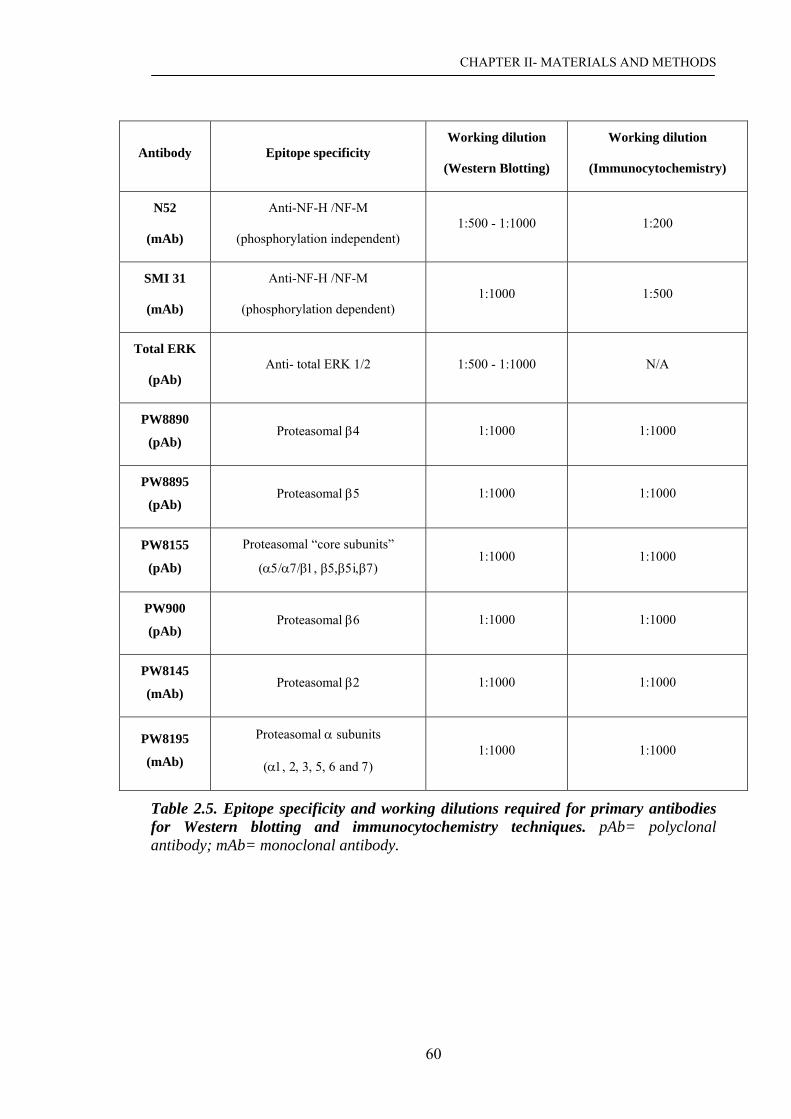
CHAPTER II- MATERIALS AND METHODS
60
Antibody Epitope specificity Working dilution
(Western Blotting)
Working dilution
(Immunocytochemistry)
N52
(mAb)
Anti-NF-H /NF-M
(phosphorylation independent) 1:500 - 1:1000 1:200
SMI 31
(mAb)
Anti-NF-H /NF-M
(phosphorylation dependent) 1:1000 1:500
Total ERK
(pAb) Anti- total ERK 1/2 1:500 - 1:1000 N/A
PW8890
(pAb) Proteasomal β4 1:1000 1:1000
PW8895
(pAb) Proteasomal β5 1:1000 1:1000
PW8155
(pAb)
Proteasomal “core subunits”
(α5/α7/β1, β5,β5i,β7) 1:1000 1:1000
PW900
(pAb) Proteasomal β6 1:1000 1:1000
PW8145
(mAb) Proteasomal β2 1:1000 1:1000
PW8195
(mAb)
Proteasomal α subunits
(α1, 2, 3, 5, 6 and 7) 1:1000 1:1000
Table 2.5. Epitope specificity and working dilutions required for primary antibodies for Western blotting and immunocytochemistry techniques. pAb= polyclonal antibody; mAb= monoclonal antibody.

CHAPTER II- MATERIALS AND METHODS
61
2.2.10.3 Alkaline phosphatase development system
Blots were washed for 5 min in distilled water then equilibrated for a further 5 min in
substrate buffer (0.75 M Tris pH 9.5). Antibody reactivity was developed in the dark by
addition of alkaline phosphatase substrate solution [20 ml substrate buffer; 44 μl NTB
(75 mg/ ml in 70% (v/v) DMF); 33 μl BCIP (50 mg/ ml)] prepared immediately prior to
use. The reaction was allowed to proceed until bands appeared. To stop the reaction the
substrate was poured off and the nitrocellulose rinsed with distilled water.
Nitrocellulose was dried between sheets of filter paper for further analyses and storage.
2.2.10.4 Enhanced Chemiluminescence (ECL) development system
ECL was performed using a kit from Amersham Pharmacia Biotech UK Ltd., according
to manufacturer’s instructions. In brief, equal volumes of solution A and solution B
were mixed to a final volume of 1ml / 9 x 6 cm2 nitrocellulose then immediately
incubated with the nitrocellulose for 1 min.
ECL substrate was drained and the nitrocellulose was placed protein-side down onto
SaranWrap and sealed. Care was taken to avoid trapping air pockets. The nitrocellulose
was placed protein-side up into a film cassette and held in place with masking tape prior
to overlaying with photographic film. Film was exposed to nitrocellulose in the dark for
the required time, dependent on the primary antibody used and then removed from the
cassette and placed immediately into developing solution (diluted 1:5 in water) for 1
min. Exposed film was then rinsed in water and transferred to fixing solution (diluted
1:5 in water) for a further minute. The film was washed again and then allowed to dry at
room temperature.
When ECL was performed using a Fujifilm Intelligent dark box system, the process was
similar except for the fact that no film was required. Instead, after one minute
incubation of the nitrocellulose with the kit solution, the nitrocellulose was placed
directly into the dark box and chemiluminescence revealed digitally following the
manufacturer’s instructions.

CHAPTER II- MATERIALS AND METHODS
62
2.2.10.5 Stripping and re-probing membranes
In most cases, primary and secondary antibodies could be completely removed from
membranes and re-probed several times. Nitrocellulose membranes were submerged in
stripping buffer [SDS 100 mM, 2-mercaptoethanol, 2 % (w/v), 6.25 mM Tris-HCl pH
6.7] and incubated at 50 oC for 30 min with occasional agitation. The membrane was
washed 3 x 10 min in TBS/0.1 % (v /v) Tween-20, then blocked and re-probed as
detailed in section 2.2.10.2.
2.2.10.6 Quantification of Western blots
To allow for quantitative comparison of protein band intensity following Western
blotting and immunoprobing, a process of band quantification was performed using the
Aida Image Analyser v.4.03, according to the manufacturer’s guidelines. In brief pixel
intensity of equal sized areas around bands were obtained and quantified based on the
number of pixels in each area multiplied by the grey shade value of each pixel.
2.2.11 Detection of reactive oxygen species by confocal microscopy
Cells were seeded in Nunc Lab-Tech CC chamber slides at 10,000 cells per well and
allow to attach and grow. On addition of treatments cells were left incubating at 37 oC
for the required time. Medium was then carefully removed and 100 μM 2,7-
dichlorodihydrofluorescein diacetate (DCDHF) in DMEM loaded onto cells for 50 min.
The dye was removed and cells washed with Hanks buffered salt solution (HBSS; 140
mM NaCl, 5 mM KCl, 1.2 mM CaCl2, 20 mM HEPES pH 7.4, 5 mM NaHCO3, 5.5 mM
glucose) prior to immunocytochemical analyses.
2.2.12 Immunocytochemical analysis of proteins
SH-SY5Y cells were seeded in 300 μl growth media into an eight well permanox
chamber slide at a density of 10,000 cells/well. After overnight recovery, treatments
were added and cells incubated for the required time.
With care, medium was removed, cells washed three times in DMEM to remove serum
and fixed in 200 μl ice-cold 90 % methanol / TBS at -20 ºC for 10 min. Methanol was
removed and cells were washed three times with TBS. Cells were further permeabilised

CHAPTER II- MATERIALS AND METHODS
63
in 200 μl Triton X- 100 / TBS for 10 min at room temperature and washed in TBS as
before prior to immunoprobing them.
Non-specific antibody binding was prevented by blocking with 3 % (w/v) bovine serum
albumin in TBS (BSA/TBS) for 1h at room temperature with gentle shaking. Cells were
incubated with primary antibody diluted in BSA/TBS overnight at 4 oC. Cells were
washed with TBS for 3 x 5 min then incubated with Fluorescein Isothiocyanate (FITC)
conjugated secondary antibody diluted 1:50 for 2h at room temperature in the dark.
Excess secondary antibody was removed by 3 x 5 min washed in TBS in the dark.
Slides were carefully air-dried. Vectasheld preservative solution ± propidinium iodide
was applied to the slide before a cover slip was placed over the cells and sealed into
place. The slide was then stored at -20 oC in the dark to prevent bleaching of
fluorescence signal prior to viewing by confocal laser microscopy.
2.2.13 Statistical analysis
Data were presented as ± the standard error of the mean (SEM) at a 95 % confidence
limit. Statistical analysis was performed using a two-tailed, homoscedastic, Student’s t-
test. Statistical significance was accepted at p < 0.05 (*) or 0.01 (**).

CHAPTER V- EFFECTS OF PD MIMETICS ON NF TURNOVER IN SH-SY5Y CELLS
64
CHAPTER III
EFFECT OF PD MIMETICS ON
PROTEASOMAL ACTIVITY IN A SH-
SY5Y HUMAN NEUROBLASTOMA
CELL MODEL

CHAPTER III- EFFECT OF PD MIMETICS ON PROTEASOMAL ACTIVITY
65
3. EFFECT OF PD MIMETICS ON PROTEASOMAL ACTIVITY IN
SH-SY5Y CELLS
3.1 INTRODUCTION
3.1.1 UPS involvement in PD pathogenesis
As further detailed in the general introduction, mammalian cells appear to possess two
major pathways for general protein degradation, lysosomal proteases and the
proteasome complex. The latter is a component of the UPS, which plays an essential
role in the degradation and clearance of short-lived, mutant, misfolded or damaged
proteins in eukaryotes and ultimately in the regulation of crucial processes such as the
cell cycle, transcription, antigen processing and signal transduction (Goldberg et al
1995; Ding and Keller, 2001).
The presence of missfolded and aggregated proteins and ubiquitin-positive inclusions
within the specific brain region affected in many neurodegenerative diseases, including
PD, suggest that the UPS might be crucial in their pathogenesis (reviewed by McNaught
and Olanow, 2006). So far, of all neurodegenerative disorders, PD is most directly
associated with UPS dysfunction (discussed by Ardley et al, 2005). As introduced in
section 1.1.2.5 this is supported by the finding that proteasomal activity is decreased in
SNpc from PD patients event which may contribute to neurodegeneration of
dopaminergic neurons and LB formation in sporadic PD (Mc Naught et al., 2001, 2002;
Mc Naught and Jenner 2001), and the discovery of some rare mutations in genes coding
for components and substrates of the UPS which give rise to familial forms of PD
(Huang et al., 2004; Betarbet et al., 2005; further detailed in section 1.1.2.4).
Accumulation of aberrant proteins can occur when the cell proteolytic systems of the
cell (e.g. UPS) are impaired or when the amount of these proteins exceeds the cell’s
capacity (reviewed by Betarbet et al., 2005). Indeed, oxidatively damaged proteins
(mostly ubiquitin-conjugated) have been reported to accumulate with age and age
related diseases like PD. Moreover, proteasome activity has been shown to be decreased
with age (Carrad et al., 2002). On the other hand, aggregated proteins have been found
to bind to the 20S proteasome leading to its irreversible inhibition (Bence et al., 2001;
Davies, 2001). Interestingly, certain proteins are more prone to aggregation; this is the
CHAPTER III- EFFECT OF PD MIMETICS ON PROTEASOMAL ACTIVITY
66
case for α-synuclein (reviewed by Maries et al., 2003). In fact, oxidative damage can
enhance α-synuclein’s ability to misfold and aggregate (Giasson et al., 2000). Although
controvertial, α-synuclein is thought to be a substrate for the proteasome. Indeed,
proteasome inhibition can lead to accumulation of α-synuclein in several in vitro
models (reviewed by Betarbet et al., 2005). Miwa et al. (2005) showed that proteasome
inhibition in the nerve terminals of nigrostriatal DA neurons in the SNpc led to neuronal
degeneration and the formation intracytoplasmic inclusions rich in α-synuclein.
Interestingly, synphilin-1 one of α-synuclein’s binding partners has been reported to
undergo proteasomal degradation and cells over-expressing synphilin-1 are more
susceptible to proteasomal dysfunction (Lee et al., 2002). Moreover, futher supporting a
key role of the UPS in PD pathogenesis, proteasome inhibition has been shown to cause
selective loss of dopaminergic neurons in both an in vivo and in vitro rat model (Fornai
et al., 2003).
Besides UPS impairment, mitochondrial complex I inhibition is also repeatedly
implicated in the pathogenesis of the disease (reviewed by Abou-Sleiman et al., 2006).
Indeed, there is increasing evidence that these two events interact with each other in the
complex multifactorial cascade of deleterious processes underlying PD pathology (Duke
et al., 2006).
3.1.2 Proteasomal impairment in PD cellular models
Several studies link mitochondrial impairment with the UPS in PD since toxins which
can inhibit mitochondrial complex I activity can lead to proteasome impairment. For
instance, exposure of rat primary mesencephalic cultures to rotenone and MPP+ for 6 h,
has been reported to reduce proteasome activity via ATP depletion and not via ROS
production (Höglinger et al., 2003). Shamoto-Nagai et al. (2003) reported that rotenone
impaired proteasomal activity, in SH-SY5Y human cells after 72 h, however through
oxidative modification of the proteasome itself. Very recently, a number of related reports
have been published. Rotenone-infused rats were shown to exhibit selective loss of the
nigrastriatal pathway with proteasomal activities reduced in ventral midbrain region of
rats with lesions, whilst proteasomal activities were increased in rats without lesions
(Betarbet et al. 2006). The same authors also report rotenone treated SK-N-MC
neuroblastoma cells exhibit increased proteasomal activity prior to a reduction in
activities over a 4 week period. Using the same cell line, Wang et al., (2006) studied the

CHAPTER III- EFFECT OF PD MIMETICS ON PROTEASOMAL ACTIVITY
67
effect of 6 pesticides, including rotenone, ziram or dieldrin on the 26S proteasome
activity using a 26S proteasome reporter system. They showed that some of these
pesticides inhibited proteasomal activity at low concentrations with rotenone also
inducing oxidative stress.
3.1.3 SH-SY5Y human neuroblastoma cell line
Animal models are useful tools for revealing links between symptoms and pathological
defects that result following exposure to neurotoxins such as MPTP/ MPP+ or rotenone.
However, their application is limited for a number of reasons, including ethical
concerns, species differences and complex cellular interactions occurring at organ and
tissue level. On the other hand, in vitro cell models allow the investigation of sub-
cellular biochemical processes with a tighter control of the environmental conditions of
a specific cell type. Employment of a neuroblastoma human cell line may allow
development of a model with analogy to dopaminergic neurons in vivo. Thus a study of
the effects of neurotoxins on cultures of human neuroblastoma cells may allow a more
detailed analysis of changes in the UPS.
The SH-SY5Y cell line is the third cloned sub-line from a parent neuroblastoma cell
line SK-N-SH. SK-N-SH was established in 1970 from the mestastatic bone tumour of a
young female (Biedler et al., 1973). SH-SY5Y human neuroblastoma cells are a useful
in vitro model for the study of MPTP neurotoxicity since this cell line contains the
necessary components for the synthesis, metabolism and transport of DA. Furthermore,
SH-SY5Y cells predominantly express MAO-A and only low levels of MAO-B
(Fitzgerald et al., unpublished) and contain the DA uptake system (Song and Ehrich,
1998; Storch et al. 2000). The uptake of DA and MPP+ by this cell line is a dose and
time dependent process (Song and Ehrich, 1997; Song and Ehrich, 1998).
3.1.4 Aims of chapter
At the time this study started, little information was available about the mechanisms by
which decreased proteasomal function occurred in SNpc of PD patients, or whether
toxins linked to mitochondrial dysfunction such as MPTP and its active metabolite
MPP+ could impair the UPS.
The aim of this chapter is to determine whether treatment of SH-SY5Y human
neuroblastoma cells with the neurotoxins MPP+ and DA leads to an alteration in

CHAPTER III- EFFECT OF PD MIMETICS ON PROTEASOMAL ACTIVITY
68
extracted proteasome activity. Although it is fully recognised that DA is primarily a
neurotransmitter, since treatment with DA leads to cell damage, for convenience I will
refer to both MPP+ and DA as (neuro)toxins. The toxins chosen for this study are of
relevance for PD since MPP+ inhibits mitochondrial complex I and is the active
metabolite of MPTP, a neurotoxin commonly used in PD models; DA relevance resides
in the fact that DA-containing neurons are selectively lost in PD and DA metabolism
generates a vast amount of oxidative stress which may make neurons within SNpc more
prone to damage. All three proteasomal activities (CLA, the focus of most previous
work, TLA and PLA) were studied.
Moreover, the concomitant effects of the neurotoxins on ATP, glutathione levels, and
cell viability are also monitored because these parameters are known to influence the
UPS and are relevant for PD. In order to mimic the situation in vivo (see introduction
section 1.1.2), glutathione levels were also reduced using L- buthionine-[S,R]-
sulfoximine (BSO), an specific inhibitor of γ-glutamylcysteine synthetase, the rate
limiting enzyme in GSH biosynthesis (Stokes et al., 2000). Thus, analysis of the
possible implications of oxidative stress in the mechanisms underlying toxin-induced
proteasomal impairment in our cell system were performed by (a) the use of a precursor
for the synthesis of the antioxidant glutathione, N-acetyl-cysteine (NAC; also a mild
antioxidant on its own right), and (b) further stressing the toxin-treated cells by
depleting glutathione levels with BSO.
Finally, since PD is a chronic disorder, the effects of 3 and 7 weeks treatments with low
levels of toxins on proteasomal activity were also monitored.
CHAPTER III- EFFECT OF PD MIMETICS ON PROTEASOMAL ACTIVITY
69
3.2 RESULTS
3.2.1 Characterisation of a proteasome activity assay for SH-SY5Y
cells
3.2.1.1 Effect of protein content
The fluorogenic peptide assay for proteasomal activity (described in the methods
section 2.2.6.1) had not been used before for SH-SY5Y cell extracts in my laboratory.
Therefore, a preliminary study was performed to determine the amount of protein (and
thus cell number) to give a representative activity rates.
SH-SY5Y cells were plated out in 6-well plates at different densities (i.e 250,000,
300,000, 400,000 and 500,000 cells per well), left incubating overnight and extracted
into 250 μl of homogenisation buffer as described in section 2.2.4.2. A fluorogenic
peptide assay for CLA was performed as described in section 2.2.6.1.
With 300,000 - 500,000 cells/well activity rates/μg protein were similar, irrespective of
whether 25 μl or 100 μl sample were used (Table 3.1); using 250,000 cells/ well, rates
were lower. Based on these results a cell density of 400,000-500,000 cells/ well and 100
μl of assay volume (corresponding to 24-33 μg protein/well) were chosen as suitable for
use in the assay.

CHAPTER III- EFFECT OF PD MIMETICS ON PROTEASOMAL ACTIVITY
70
25μl 100μl
CELL DENSITY ΔFU/s ΔFU/s/ μg SEM ΔFU/s ΔFU/s/ μg SEM
250,000 0.0272 0.0063 0.0098 0.1282 0.0116 0.0039
300,000 0.0818 0.0193 0.0275 0.2694 0.0238 0.0173
400,000 0.1358 0.0227 0.0089 0.5669 0.0236 0.0304
500,000 0.1814 0.0217 0.0112 0.7156 0.0213 0.0212
Table 3.1. Effect of cell density and sample volume on fluorogenic peptide assay for chymotrypsin-like activity (CLA). Cells were plated out in 6 well plates at different densities (ie. 250,000, 300,000, 400,000 and 500,000) and CLA of cell extracts monitored as detailed on section 2.2.6.1. Two different volumes of the samples, 25 and 100 μl were tested in order to determine the optimal parameters of the assay. Results are presented as ΔFU/s and ΔFU/s/μg ± SEM. Data are from a representative experiment with assays replicated three times.
3.2.1.2 Relative proteasomal activities in SH-SY5Y cells
The fluorogenic substrates used for measuring the three proteasomal activities chosen in
our laboratory were Suc-LLVY-AMC, Boc-LLR-AMC and ZLLE-AMC for CLA, TLA
and PLA respectively.
Table 3.2 illustrates apparent fluorescence rate values for CLA, TLA and PLA; results
indicate that TLA is greatest, followed by CLA and finally PLA in our cell line.
ΔFU/s/μg SEMCLA 0.0289 0.0068
TLA 0.2446 0.0204
PLA 0.0165 0.0012
Table 3.2. Relative apparent proteasomal activities from SH-SY5Y cells. Cells were grown in 6-well plates and after overnight recovery and extracted in 250 μl homogenisation buffer (section 2.2.4.2). Then cell extracts were incubated with Suc-LLVY-AMC, Boc-LLR-AMC and ZLLE-AMC to monitor CLA, TLA and PLA respectively in a fluorogenic peptide assay (section 2.2.6.1). Results are presented as ΔFU/s ± SEM (n=3).

CHAPTER III- EFFECT OF PD MIMETICS ON PROTEASOMAL ACTIVITY
71
3.2.1.3 Specificity of the different fluorogenic substrates for proteasomal
activity
To determine the specificity of the three substrates towards proteasomal activity, an
irreversible proteasome inhibitor (lactacystin) and a calpain inhibitor (MDL 28,170)
were used in the fluorogenic peptide assay as described before.
Final concentrations of 1 μM and 10 μM lactacystin and 0.1 μM and 1 μM of MDL
28,170 were added to control cell extracts and proteasomal activities were measured.
Both inhibitors were also tested on purified 20S proteasome and calpain enzyme;
calpain activity was measured as detailed in section 2.2.6.2.
Table 3.3 shows the inhibitory effects of lactacystin and MDL 28,170. Lactacystin
inhibited CLA of purified 20S proteasome in a dose dependent manner; with 0.1, 1 and
10 μM lactacystin, inhibiting the enzyme by 40 %, 78 % and 95 % respectively. With
10 μM lactacystin, TLA of 20S samples was partally inhibited (70% inhibition cf.
controls) but PLA was unaffected. In cell extracts, lactacystin inhibited CLA in a dose
dependent manner; however, none of the other proteasomal activities were inhibited by
lactacystin. Finally, 1 and 10 μM lactacystin also inhibited calpain, altought to a lesser
extent than MDL 28,170 (25 % and 40 %, respectively). The assay was performed with
0.36 μg/μl of calpain, concentration which was found to give consistent activity rates in
the fluorogenic assay.
On the other hand, calpain was inhibited by 51 % with 0.1 μM MDL 28,170, whilst
higher doses of the inhibitor (1 and 10 μM) virtually abolished the activity. MDL
28,170 also inhibited CLA and TLA from purified 20S proteasome by 25 % and 58 %
respectively when used at 10 μM, but had no effect on PLA. In cell extracts, MDL
28,170 did not inhibit CLA or PLA; however TLA was inhibited by 67 % with 1 μM
MDL 28,170.

CHAPTER III- EFFECT OF PD MIMETICS ON PROTEASOMAL ACTIVITY
72
% Inhibition
SAMPLE Inhibitor Concentration (μM) CLA TLA PLA
0.1 40 * 0 0
1.0 78 ** 0 0 Lactacystin
10.0 95** 72 * 0
0.1 0 0 0
1.0 0 0 0
20S
MDL 28,170
10.0 25 ** 58** 0
1.0 70 ** 0 0 Lactacystin
10.0 94 ** 0 0
1.0 0 0 0 Extracts
MDL 28,170 10.0 0 67 ** 0
Concentration (μM) Calpain
0.1 0
1.0 25 ** Lactacystin
10.0 39 **
0.1 51 **
1.0 99 **
Calpain
MDL 28,170
10.0 98 **
CHAPTER III- EFFECT OF PD MIMETICS ON PROTEASOMAL ACTIVITY
73
Table 3.3. Inhibitory effects of lactacystin and MDL 28,170 on 20S proteasome, SH-SY5Y cell extracts and calpain enzyme. Cell extracts (20-25 μg), 0.05 μg of 20S protease or 0.036 μg of calpain were utilised in a fluorogenic petide assay as described in sections 2.2.6.1 and 2.2.6.2. Lactacystin or MDL 28,170 (0.1, 1 and 10 mM) were directly added to the assay to assess specificity of the substrates and inhibitors. Results were calculated as ΔFU/s/μg and converted to % activity cf. controls. Statistical analysis was carried out using a two-tailed t-test. Data are from a representative experiment with assays replicated three times. The experiment was repeated 3 times. Statistical significance was accepted when *= p<0.05 or ** = p< 0.01 in comparison to untreated control.
CHAPTER III- EFFECT OF PD MIMETICS ON PROTEASOMAL ACTIVITY
74
Although lactacystin is a widely used and fairly specific proteasome inhibitor, it did not
inhibit PLA activity in cell extracts or purified 20S whilst TLA was only inhibited at the
highest concentration used (ie. 10 μM). Thus, a different proteasome inhibitor,
epoxomicin, was utilised to investigate the specificity of the TLA substrate in particular
for measuring (TLA) proteasomal activity. The specificity of epoxomicin was also
determined by using commercial calpain.
Figure 3.1 shows that 1, 10 and 20 μM epoxomicin all inhibited TLA in purified 20S
proteasomes by 65 % (panel A; similar to lactacystin) and TLA in cell extracts by 25 %
(panel B). Since the effect of epoxomicin was not dose dependent, a 10 μM dose was
used in subsequent experiments with cell extracts.
Finally, the effect of 10 μM epoxomicin on CLA and PLA (in addition to TLA) from
SH-SY5Y cell extracts was investigated in order to correlate TLA data shown in figure
3.1 with the other two proteasomal activities. Figure 3.2 shows CLA was particularly
sensitive to epoxomicin. As before, TLA was only partly inhibited by epoxomicin
(~ 30 %) but PLA was inhibited by 74 % in comparison to controls.

CHAPTER III- EFFECT OF PD MIMETICS ON PROTEASOMAL ACTIVITY
75
0.0
20.0
40.0
60.0
80.0
100.0
EPOX 1uM EPOX 10uM EPOX 20uM
% A
ctiv
ity c
a. c
ontr
ol
TLA
0.0
20.0
40.0
60.0
80.0
100.0
EPOX 1uM EPOX 10uM EPOX 20uM
% A
ctiv
ity c
a. c
ontro
l
TLA
0.0
20.0
40.0
60.0
80.0
100.0
120.0
140.0
EPOX 1uM EPOX 10uM EPOX 20uM
% A
ctiv
ity c
a. c
ontrol
Calpain activity
Figure 3.1. Inhibitory effect of epoxomicin on TLA from SH-SY5Y cells, 20S proteasome or calpain activity. Cells extracts (20-25 μg), purified 20S proteasome (0.05 μg) or calpain-2 (0.036 μg) were utilised in a fluorogenic peptide assay as detailed in sections 2.2.6.1 and 2.2.6.2 respectively. 1, 10 and 20 μM epoxomicin were directly added to control cell extracts, purified 20S proteasome or calpain-2 to assess the specificity of the substrates utilised in the assay towards TLA. Specificity of epoxomicin towards proteasome was also assessed by testing the effect of this inhibitor on calpain enzyme. Results were calculated as ΔFU/s/μg ± SEM and then converted in mean % in comparison to control samples. The data are from a representative experiment with assays replicated three times. Statistical analysis was carried out using a two-tailed t-test. Statistical significance was accepted when *= p<0.05 cf. control.
* *
*
*
*
*
A) Purified 20S
B) 20S/ 26S SH-SY5Y
C) Calpain enzyme
Act
ivity
(% c
ontr
ol)
Act
ivity
(% c
ontr
ol)
Act
ivity
(% c
ontr
ol)

CHAPTER III- EFFECT OF PD MIMETICS ON PROTEASOMAL ACTIVITY
76
20S/ 26S SH-SY5Y
0.010.020.030.040.050.060.070.080.090.0
100.0
EPOX 10 uM
% A
ctiv
ity c
a. c
ontro
l
CLATLAPLA
Act
ivity
(% c
ontr
ol)
**
**
**
Figure 3.2. Inhibitory effect of 10 μM epoxomicin on CLA, TLA and PLA from SH-SY5Y cells. Cells extracts were utilised in a fluorogenic peptide assay as detailed in section 2.2.6.1. Epoxomicin (10 μM) was directly added to control cell extracts to assess the specificity of the substrates utilised in the assay and epoxomicin towards proteasome activity. Results were calculated as ΔFU/s/μg ± SEM and then converted in mean % in comparison to control samples. The data are from a representative experiment with assays replicated three times. Statistical analysis was carried out using a two-tailed t-test. Statistical significance was accepted when * = p<0.05 or ** = p<0.01 of control.

CHAPTER III- EFFECT OF PD MIMETICS ON PROTEASOMAL ACTIVITY
77
3.2.2 Effect of MPP+ and DA on proteasomal activity
3.2.2.1 Assessment of cell viability after exposure to toxins
Before studying the effect of toxins on proteasomal activity, concentrations of the toxins
that were highly and mildly cytotoxic to mitotic SH-SY5Y cells over a 72-h period were
established using a MTT reduction assay (see section 2.2.2). This assay is dependent on
cell integrity and viability and is, more specifically, a measure of metabolic activity.
Figure 3.3 shows that MPP+ and DA reduced cell viability in a dose dependent manner.
MPP+ (100 μM) did not reduce cell viability until 48 h (29 % reduction ca. control
samples) and, similarly, cell viability was reduced by 30 % at 72 h. Increasing MPP+ to
2 mM reduced cell viability by 51 %, 53 % and 63 % after 24, 48 and 72 h, respectively.
DA at 100 μM did not affect cell viability until 72 h, whilst 500 μM concentration of
the latter toxin led to a 64 %, 70 % and 73 % decrease in cell viability after 24, 48 and
72 h respectively (ca. control samples), similar to 2 mM MPP+. 2 mM DA reduced cell
viability by 35 %, 30 % and 15 % in comparison to controls after 24, 48 and 72 h
respectively. Therefore, high doses of DA appears more damaging to the cells than
MPP+.
Finally, BSO toxicity was also assessed. Although, 2mM BSO lead to a 90% reduction
in glutathione levels as early as 24 h (see Figure 3.3), cell viability was not affected over
72 h.
In subsequent experiments, 100 μM MPP+ and DA were selected for use in SH-SY5Y
cells as a mildly toxic dose (~20-30 % reduction in cell viability after 72 h) and 2 mM
MPP+ and 500 μM DA as a highly toxic dose (~60- 70 % cell viability reduction ca.
controls).
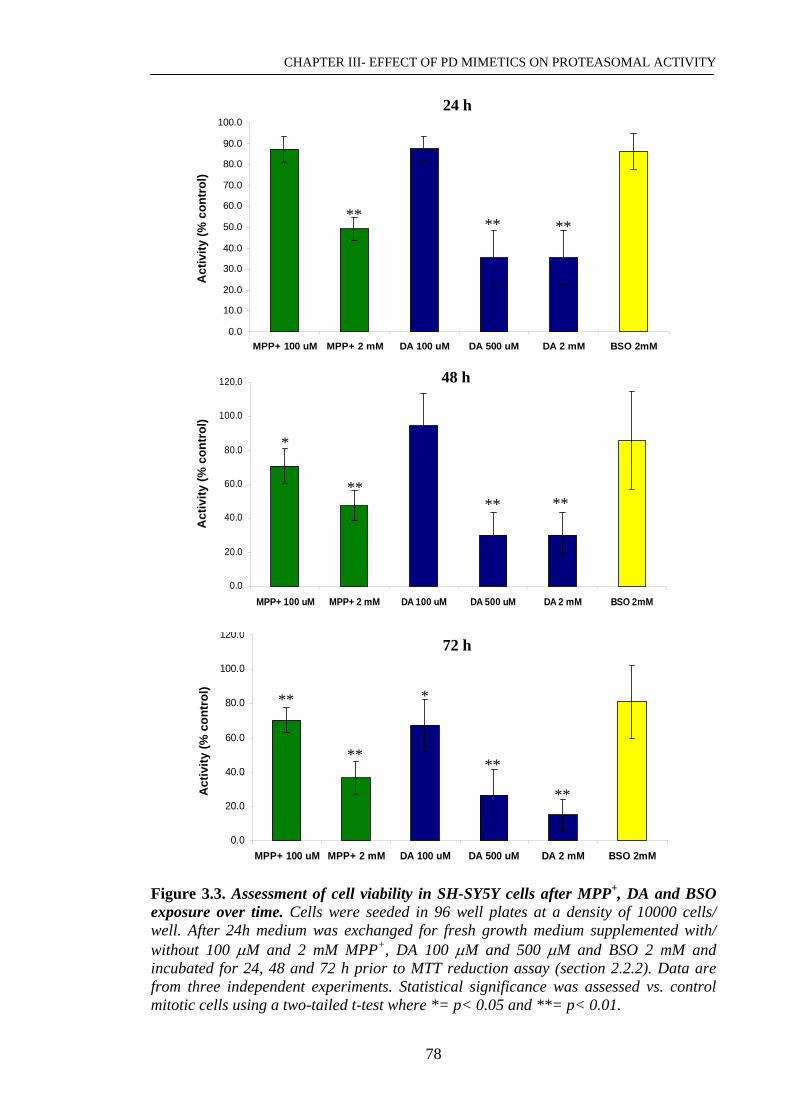
CHAPTER III- EFFECT OF PD MIMETICS ON PROTEASOMAL ACTIVITY
78
0.0
10.0
20.0
30.0
40.0
50.0
60.0
70.0
80.0
90.0
100.0
MPP+ 100 uM MPP+ 2 mM DA 100 uM DA 500 uM DA 2 mM BSO 2mM
% c
ell v
iabi
lity
ca. c
ontro
ls
0.0
20.0
40.0
60.0
80.0
100.0
120.0
MPP+ 100 uM MPP+ 2 mM DA 100 uM DA 500 uM DA 2 mM BSO 2mM
% c
ell v
iabi
lity
ca. c
ontr
ols
24 h
48 h
0.0
20.0
40.0
60.0
80.0
100.0
120.0
MPP+ 100 uM MPP+ 2 mM DA 100 uM DA 500 uM DA 2 mM BSO 2mM
% c
ell v
iabi
lity
ca. c
ontr
ols
Figure 3.3. Assessment of cell viability in SH-SY5Y cells after MPP+, DA and BSO exposure over time. Cells were seeded in 96 well plates at a density of 10000 cells/ well. After 24h medium was exchanged for fresh growth medium supplemented with/ without 100 μM and 2 mM MPP+, DA 100 μM and 500 μM and BSO 2 mM and incubated for 24, 48 and 72 h prior to MTT reduction assay (section 2.2.2). Data are from three independent experiments. Statistical significance was assessed vs. control mitotic cells using a two-tailed t-test where *= p< 0.05 and **= p< 0.01.
** ** **
Act
ivity
(% c
ontr
ol)
Act
ivity
(% c
ontr
ol)
Act
ivity
(% c
ontr
ol)
*
** ** **
72 h
* **
** **
**
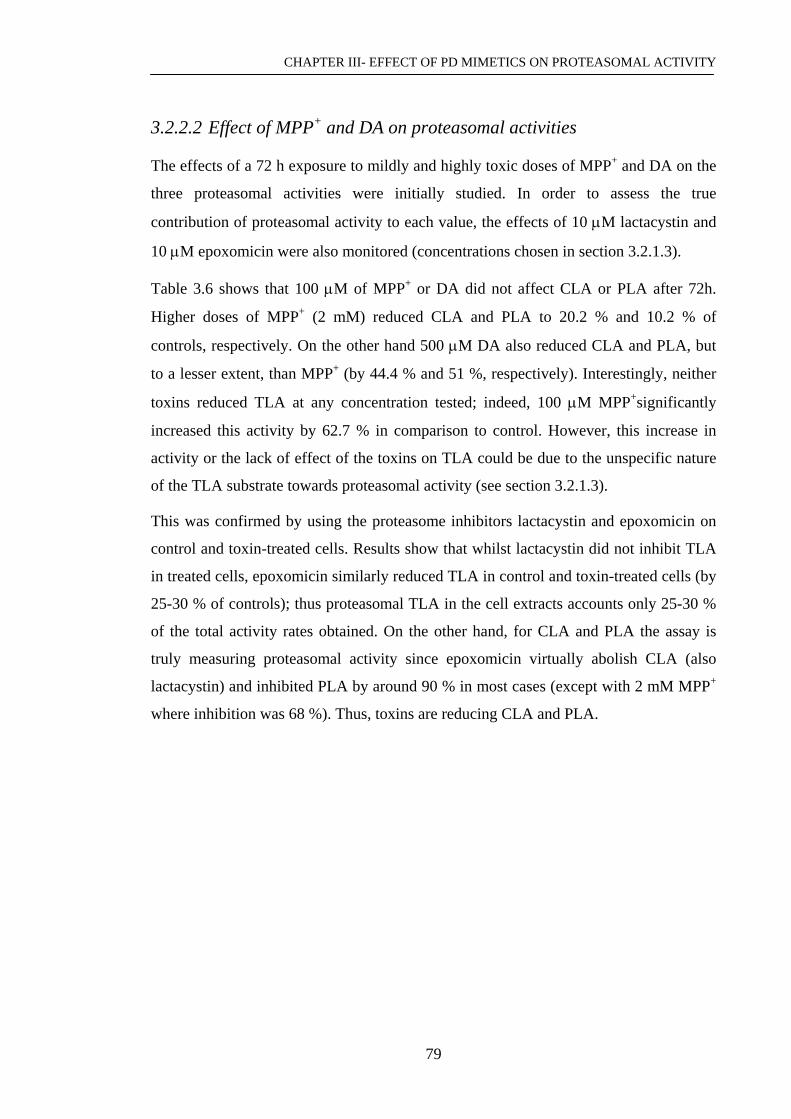
CHAPTER III- EFFECT OF PD MIMETICS ON PROTEASOMAL ACTIVITY
79
3.2.2.2 Effect of MPP+ and DA on proteasomal activities
The effects of a 72 h exposure to mildly and highly toxic doses of MPP+ and DA on the
three proteasomal activities were initially studied. In order to assess the true
contribution of proteasomal activity to each value, the effects of 10 μM lactacystin and
10 μM epoxomicin were also monitored (concentrations chosen in section 3.2.1.3).
Table 3.6 shows that 100 μM of MPP+ or DA did not affect CLA or PLA after 72h.
Higher doses of MPP+ (2 mM) reduced CLA and PLA to 20.2 % and 10.2 % of
controls, respectively. On the other hand 500 μM DA also reduced CLA and PLA, but
to a lesser extent, than MPP+ (by 44.4 % and 51 %, respectively). Interestingly, neither
toxins reduced TLA at any concentration tested; indeed, 100 μM MPP+significantly
increased this activity by 62.7 % in comparison to control. However, this increase in
activity or the lack of effect of the toxins on TLA could be due to the unspecific nature
of the TLA substrate towards proteasomal activity (see section 3.2.1.3).
This was confirmed by using the proteasome inhibitors lactacystin and epoxomicin on
control and toxin-treated cells. Results show that whilst lactacystin did not inhibit TLA
in treated cells, epoxomicin similarly reduced TLA in control and toxin-treated cells (by
25-30 % of controls); thus proteasomal TLA in the cell extracts accounts only 25-30 %
of the total activity rates obtained. On the other hand, for CLA and PLA the assay is
truly measuring proteasomal activity since epoxomicin virtually abolish CLA (also
lactacystin) and inhibited PLA by around 90 % in most cases (except with 2 mM MPP+
where inhibition was 68 %). Thus, toxins are reducing CLA and PLA.

CHAPTER III- EFFECT OF PD MIMETICS ON PROTEASOMAL ACTIVITY
80
Activity Treatment ΔFU/s/μg SEM % Activity
ca. control
% Activity with
lactacystin 10μM
% Activity with
epoxomicin 10μM
Control 0.0289 0.0041 100.0 3.3 * 1.1 *
MPP+ 100 μM 0.0238 0.0024 82.5 6.0 * 0.0 **
MPP+ 2 mM 0.0058 0.0034 20.2 * 0.0 * 0.0 **
DA 100 μM 0.0302 0.0072 104.5 27.3 ** 0.0 *
CLA
DA 500 μM 0.0160 0.0060 55.6 * 8.2 ** 0.0 **
Control 0.245 0.0077 100.0 78.9 74.6 *
MPP+ 100 μM 0.398 0.0116 162.7 ** 90.0 68.7 *
MPP+ 2 mM 0.212 0.0155 86.9 70.5 72.6 *
DA 100 μM 0.274 0.0118 112.2 100.0 77.1 *
TLA
DA 500 μM 0.283 0.0168 115.8 93.1 67.8 **
Control 0.0165 0.0008 100.0 76.2 12.8 *
MPP+ 100 μM 0.0162 0.0009 98.6 83.0 10.7 *
MPP+ 2 mM 0.0017 0.0018 10.2 ** 100.0 36.6 *
DA 100 μM 0.0165 0.0017 100.3 80.0 8.9 *
PLA
DA 500 μM 0.0079 0.0009 48.2 ** 100.0 0.0 **

CHAPTER III- EFFECT OF PD MIMETICS ON PROTEASOMAL ACTIVITY
81
Table 3.4. Effect of MPP+ and DA on proteasomal activities from SH-SY5Y cells after 72h exposure. Cells were grown in 6-well plates and after overnight recovery; cells were treated with MPP+ and DA. After 72h incubation cells were extracted in 250 μl homogenisation buffer and cell extracts were incubated with Suc-LLVY-AMC, Boc-LLR-AMC and ZLLE-AMC to monitor CLA, TLA and PLA respectively in a fluorogenic peptide assay (section 2.2.6.1). 10 μM lactacystin or epoxomicin (final concentrations) were directly added to the extracts in the assay in order to assess substrate specificity for proteasomal activity. Results are presented as ΔFU/s ± SEM and then converted in mean % in comparison to control samples. The data are from a representative experiment with assays replicated three times. Statistical analysis was carried out using a two-tailed t-test. Statistical significance was accepted when *= p<0.05 or ** = p< 0.01 cf. control.
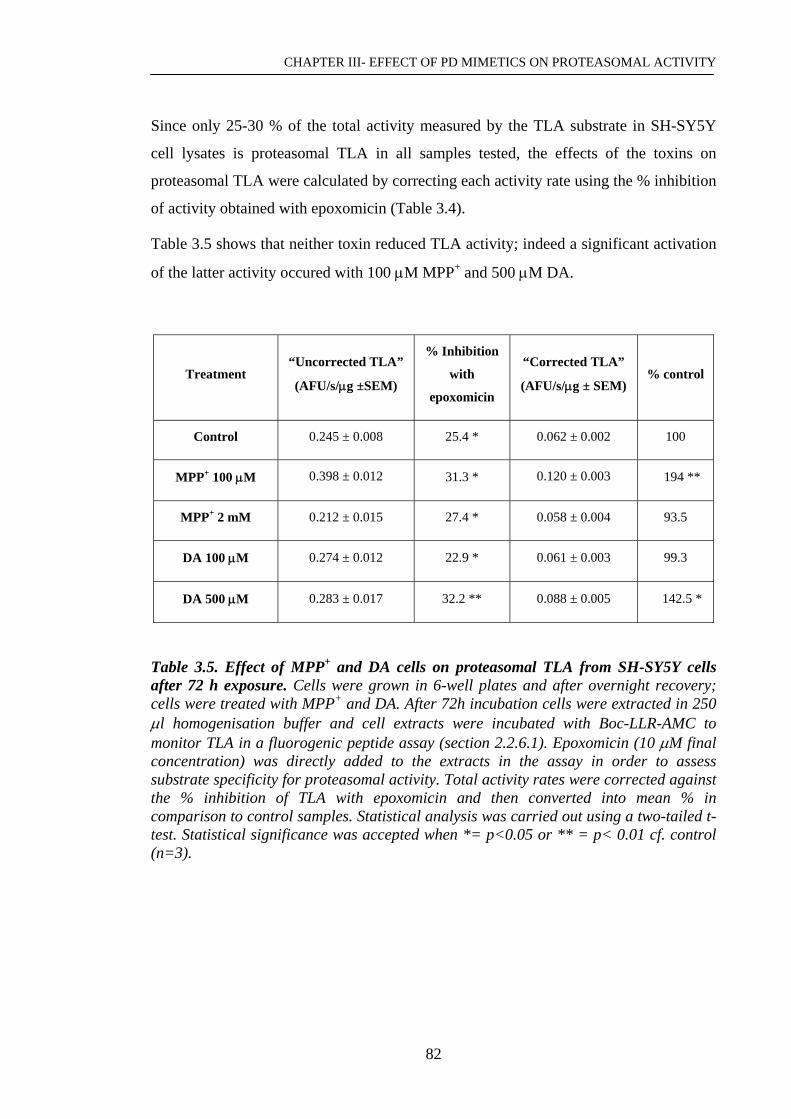
CHAPTER III- EFFECT OF PD MIMETICS ON PROTEASOMAL ACTIVITY
82
Since only 25-30 % of the total activity measured by the TLA substrate in SH-SY5Y
cell lysates is proteasomal TLA in all samples tested, the effects of the toxins on
proteasomal TLA were calculated by correcting each activity rate using the % inhibition
of activity obtained with epoxomicin (Table 3.4).
Table 3.5 shows that neither toxin reduced TLA activity; indeed a significant activation
of the latter activity occured with 100 μM MPP+ and 500 μM DA.
Treatment “Uncorrected TLA”
(AFU/s/μg ±SEM)
% Inhibition
with
epoxomicin
“Corrected TLA”
(AFU/s/μg ± SEM) % control
Control 0.245 ± 0.008 25.4 * 0.062 ± 0.002 100
MPP+ 100 μM 0.398 ± 0.012 31.3 * 0.120 ± 0.003 194 **
MPP+ 2 mM 0.212 ± 0.015 27.4 * 0.058 ± 0.004 93.5
DA 100 μM 0.274 ± 0.012 22.9 * 0.061 ± 0.003 99.3
DA 500 μM 0.283 ± 0.017 32.2 ** 0.088 ± 0.005 142.5 *
Table 3.5. Effect of MPP+ and DA cells on proteasomal TLA from SH-SY5Y cells after 72 h exposure. Cells were grown in 6-well plates and after overnight recovery; cells were treated with MPP+ and DA. After 72h incubation cells were extracted in 250 μl homogenisation buffer and cell extracts were incubated with Boc-LLR-AMC to monitor TLA in a fluorogenic peptide assay (section 2.2.6.1). Epoxomicin (10 μM final concentration) was directly added to the extracts in the assay in order to assess substrate specificity for proteasomal activity. Total activity rates were corrected against the % inhibition of TLA with epoxomicin and then converted into mean % in comparison to control samples. Statistical analysis was carried out using a two-tailed t-test. Statistical significance was accepted when *= p<0.05 or ** = p< 0.01 cf. control (n=3).

CHAPTER III- EFFECT OF PD MIMETICS ON PROTEASOMAL ACTIVITY
83
3.2.3 Direct effect of MPP+ and DA on SH-SY5Y cell extracts
To determine whether toxins can directly impair proteasome function, control cell
extracts were incubated with a range of MPP+ and DA concentrations (0.1-20 mM)
during the assay.
Figure 3.5 shows that toxins at 100 μM did not reduce CLA in cell extracts; however, 2
mM MPP+ and DA significantly reduced CLA to 87.0 % of controls. Whilst 20 mM DA
had a similar effect to 2 mM DA, 20 mM MPP+ reduced CLA by a much greater extent
(to 16 % of controls) than 2 mM MPP+.
0.0
20.0
40.0
60.0
80.0
100.0
120.0
MPP+ 100uM MPP+ 2 mM MPP+ 20 mM DA 100uM DA 2 mM DA 20 mM
% A
ctiv
ity c
a co
ntro
l
CLA
Act
ivity
(% c
ontr
ol) * * *
**
Figure 3.4. Direct effect of MPP+ and DA on 20 S proteasomal activity of SH-SY5Y cell extracts. Cells were grown in 6-well plates and after overnight recovery, extracted in 250 μl homogenisation buffer. Cell extracts were incubated with Suc-LLVY-AMC to monitor CLA in a fluorogenic peptide assay (section 2.2.6.1). 100 μM, 2 and 20 mM MPP+ and DA (final concentrations) were directly added to the extracts in the assay in order to assess direct effect of the toxins on CLA activity. Results were calculated as ΔFU/s/μg ± SEM and then converted in mean % in comparison to control samples. The data are from a representative experiment with assays replicated three times. Statistical analysis was carried out using a two-tailed t-test. Statistical significance was accepted when *= p<0.05 or ** = p< 0.01 cf. control.

CHAPTER III- EFFECT OF PD MIMETICS ON PROTEASOMAL ACTIVITY
84
3.2.4 Effect of MPP+ and DA on CLA, ATP and glutathione levels of
SH-SY5Y cells.
CLA is the most well characterised proteasomal activity and its substrate is very
specific (see section 3.2.1.3) since 10 μM lactacystin and epoxomicin virtually
abolished its activity in both cell extracts and pure 20S proteasome. Therefore, future
studies will focus on CLA. The next aim was to assess whether the reduction in CLA in
response to MPP+ and DA treatment was associated with changes in ATP and
glutathione levels.
ATP and glutathione levels from SH-SY5Y cells were determined by enzymatic
methods detailed in sections 2.2.3 and 2.2.7, respectively. Control SH-SY5Y cells
typically contain 5.504 nmols of ATP and 20.798 pmols of glutathione per μg of protein
(Table 3.6).
Value ±SEM
pmols ATP / μg protein 5.504 ± 1.173
pmols glutathione / μg protein 20.798 ± 3.702
Table 3.6. ATP and glutathione levels of SH-SY5Y cells. Cells were seeded in either, 96-well plates or T25 flasks and after overnight recovery ATP and glutathione levels were monitored as described sections 2.2.3 and 2.2.7, respectively. Data are from three independent experiments with assay replicated three times.
Figure 3.5 and Figure 3.6 represent a time course of CLA, ATP and glutathione levels
after treatment with MPP+ and DA, respectively, in comparison to controls.
Figure 3.5 shows that MPP+ affects CLA, ATP and glutathione levels in a dose and
time-dependent manner. 100 μM MPP+ had no significant effect on CLA activity at 24 h
and 48 h; however it reduced CLA by 30 % at 72h. This reduction in CLA was
preceded by a 30% decrease in glutathione levels after 24 h, which further decreased
after 72h. Finally, 100 μM MPP+ did not reduce ATP levels after a 24-h exposure, but,
after 48 h and 72 h, ATP levels were reduced by approximately 20 %.

CHAPTER III- EFFECT OF PD MIMETICS ON PROTEASOMAL ACTIVITY
85
With 2 mM MPP+, CLA was not affected at 24 h but was significantly reduced by 46 %
and 78% at 48 and 72 h, respectively. Similarly, ATP levels were not affected until 48 h
treatment with 2 mM MPP+ (48 % reduction ca. controls), which further decreased at
72h (69 % reduction ca. controls). Glutathione levels, on the other hand were reduced
earlier (31 %, 67% and 82 % after 24 h, 48 and 72 h, respectively in comparison to
control samples).
Figure 3.6 shows that 100 μM DA did not reduce CLA nor glutathione levels till 72 h
treatment (30 % and 23 % reduction ca. controls, respectively). However, 100 μM DA
resulted in a significant increase (76 % ca. controls) in glutathione levels at 24h. ATP
levels were not affected by this dose of DA at any time tested. With 500 μM DA, again,
CLA was only reduced after 72 h. As before glutathione levels increased in comparison
to controls after 24 h, but were significantly decreased by 17 % and 77 % after 48 and
72h, respectively. Finally, this high dose of DA virtually abolished ATP levels as early
as 24 h.

CHAPTER III- EFFECT OF PD MIMETICS ON PROTEASOMAL ACTIVITY
86
MPP+ 100uM
0.0
20.0
40.0
60.0
80.0
100.0
120.0
140.0
0 20 40 60 80Time (h)
MPP+ 100 μM
% c
a. C
ONT
ROLS
s
% CLA
% GLUT
%ATP
MPP+ 2mM
0.0
20.0
40.0
60.0
80.0
100.0
120.0
140.0
0 20 40 60 80
Time (h)
% c
a. C
ONT
ROLS
% CLA
% GLUT
%ATP
Figure 3.5. Effect of MPP+ on CLA, ATP and glutathione levels of SH-SY5Y over time. Cells were seeded in either, 6-well plates, T25 flasks or 96-well plates and treated, after overnight recovery, with 100 μM and 2mM MPP+ for 24, 48 and 72h. After required time CLA, ATP and glutathione levels were monitored as described sections 2.2.6.1, 2.2.3 and 2.2.7 respectively. Results are presented as mean % in comparison to controls. The data are from five independent experiments. Statistical analysis was carried out using a two-tailed t-test. Statistical significance was accepted when *= p<0.05 or ** = p< 0.01 cf. control.
**
*
*
*
** **
MPP+ 2mM
**
**
**
*
*
Act
ivity
(% c
ontr
ol)
Act
ivity
(% c
ontr
ol)
**

CHAPTER III- EFFECT OF PD MIMETICS ON PROTEASOMAL ACTIVITY
87
Dopamine 100uM
0.0
50.0
100.0
150.0
200.0
250.0
0 20 40 60 80
Time (h)
DA 100 μM
* %
ca
CONT
ROLS
% CLA
% GLUT
%ATP
Dopamine 500 uM
0.0
50.0
100.0
150.0
200.0
250.0
0 20 40 60 80
Time (h)
% c
a. C
ONT
ROLS
% CLA
% GLUT
%ATP
Figure 3.6. Effect of DA on CLA, ATP and glutathione levels of SH-SY5Y cell extracts. Cells were seeded in either, 6-well plates, T25 flasks or 96-well plates and treated, after overnight recovery, with 100 μM and 500 μM DA for 24, 48 and 72h. After required time CLA, ATP and glutathione levels were monitored as described sections 2.2.6.1, 2.2.3 and 2.2.7, respectively. Results are presented as mean % in comparison to controls. The data are from five independent experiments. Statistical analysis was carried out using a two-tailed t-test. Statistical significance was accepted when *= p<0.05 or ** = p< 0.01 cf. control.
** **
**
*
** ** **
* **
**
DA 500 μM
Act
ivity
(% c
ontr
ol)
Act
ivity
(% c
ontr
ol)
CHAPTER III- EFFECT OF PD MIMETICS ON PROTEASOMAL ACTIVITY
88
3.2.5 Effect of toxins on the proteasome is partly due to oxidative
stress.
3.2.5.1 Effect of N-acetyl cysteine on proteasomal activity after toxic insult
To determine whether the decrease in proteasomal activity caused by the toxins could
be partly due to oxidative stress, the effect of N-acetyl cysteine (NAC; at 1 mM) on
proteasomal activity of SH-SY5Y cells after 72-h exposure to 2mM MPP+ and DA was
monitored.
Figure 3.7 shows 1 mM NAC itself did not affect CLA after 72h but that MPP+ and DA
decreased CLA to 13.7 % and 0.5 %, respectively after the same time period. In the case
of DA, the decrease in proteasomal activity was partly reversed by 1 mM NAC (activity
increasing from 0.5 % to 52.3 % of control). However, 1 mM NAC did not significantly
protect CLA from MPP+ toxicity.
0102030405060708090
100
NAC 1mM MPP+ 2mM MPP+ NAC DA 2mM DA NAC
% A
ctiv
ity c
a. c
ontro
ls
Act
ivity
(% c
ontr
ol)
**
**
**
Figure 3.7. Effect of NAC on CLA from SH-SY5Y after 72h toxic insult with MPP+ and DA. Cells were grown in 6-well plates and after overnight recovery, were treated with 2 mM MPP+ or DA+/ - 1 mM NAC. After 72h incubation cells were extracted in 250 μl homogenisation buffer and cell extracts were incubated with Suc-LLVY-AMC to monitor CLA in a fluorogenic peptide assay (section 2.2.6.1). Results were calculated as ΔFU/s/μg ± SEM and then converted in mean % in comparison to control samples. The data are from a representative experiment with assays replicated three times. Experiment performed 3 times. Statistical analysis was carried out using a two-tailed t-test. Statistical significance was accepted when ** = p< 0.01 cf. untreated and toxin-treated control.

CHAPTER III- EFFECT OF PD MIMETICS ON PROTEASOMAL ACTIVITY
89
The protection afforded by NAC against DA was also observed at the morphology
level. Figure 3.8 shows that control cells (panel A) and cells treated with NAC (panel
B) are flat and elongated and have some axon-like structures. On the other hand, when
treated with 2mM MPP+ or DA cells were rounded and many were floating (panel C
and E, respectively). NAC had no effect on the morphology of cells treated with MPP+,
but blocked the effect of DA on cell morphology (panel D and F, respectively).

CHAPTER III- EFFECT OF PD MIMETICS ON PROTEASOMAL ACTIVITY
90
A) Control B) 1 mM NAC
C) 2 mM MPP+ D) 2mM MPP+ + 1 mM NAC
E) 2 mM DA F) 2mM DA + 1 mM NAC
Figure 3.8. Morphological changes in SH-SY5Y cells after 72h treatment with 2 mM MPP+, 2 mM DA and 1 mM NAC. Images were taken with a Nikon eclipse TS100 inverted microscope (x 400 magnification). Scale bar= 25 μm.
CHAPTER III- EFFECT OF PD MIMETICS ON PROTEASOMAL ACTIVITY
91
3.2.5.2 Assessment of reactive oxygen species (ROS) formation in SH-SY5Y
cells by confocal microscopy
To confirm the possible implication of ROS in MPP+ and DA toxicity in our model,
DCHDF was used as a general indicator of ROS formation (Crossthwaite et al., 2002).
Following enzymatic or base-catalysed cleavage of the diacetate group, DCFDH is
readily oxidised to the highly fluorescent product dichlorofluorescein (DHF). Formation
of DHF can be monitored by confocal laser microscopy (see section 2.2.11).
Results show that 2 mM MPP+ increased ROS in SH-SY5Y cells after 48 and 72 h
(Figure 3.9). Despite using a lower dose of DA (100 μM) than MPP+, ROS levels were
much higher in the DA samples, even after 24 h.
The effect of NAC on MPP+ and DA 72 h treatment was also monitored. Results show
that NAC reduced ROS formation in control and also in toxin-treated cells.
Interestingly, with DA samples NAC appeared to virtually abolish ROS formation.

CHAPTER III- EFFECT OF PD MIMETICS ON PROTEASOMAL ACTIVITY
92
24h
Control MPP+ 2mM DA 100 μM
48h
Control MPP+ 2mM DA 100 μM
72h
Control MPP+ 2mM DA 100 μM
Control MPP+ 2mM DA 100 μM
NAC 1 mM MPP+ 2mM + NAC DA 100 μM + NAC
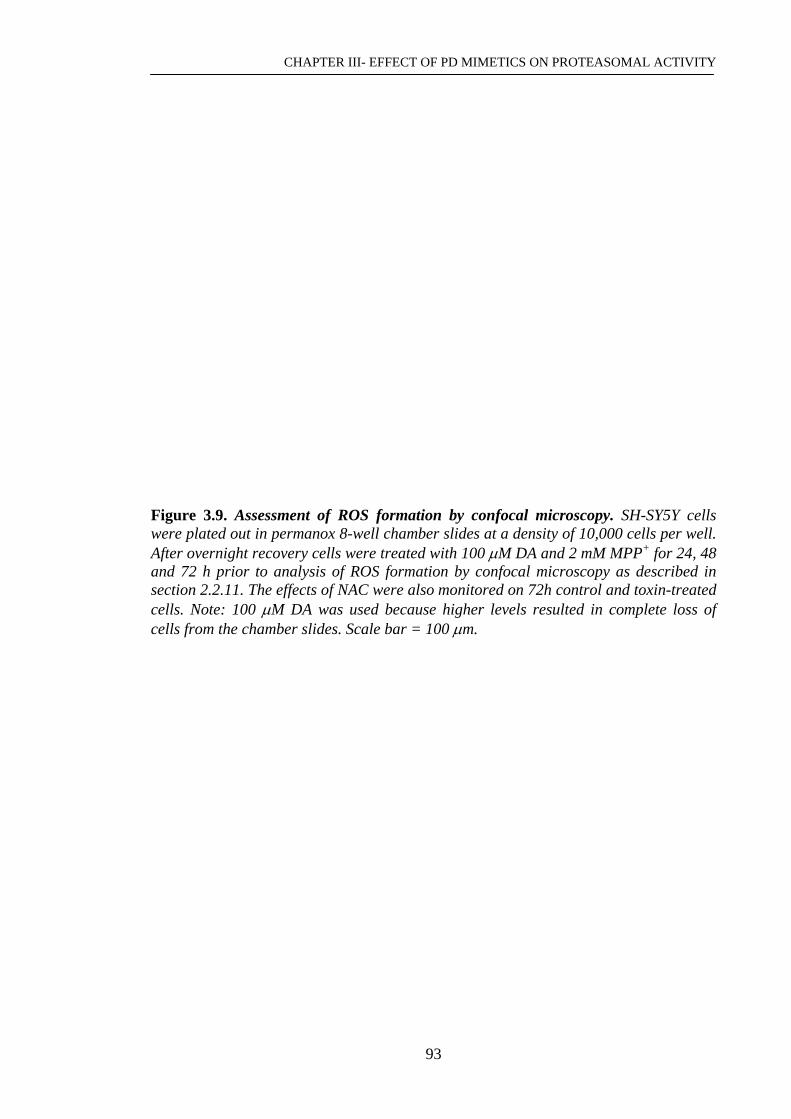
CHAPTER III- EFFECT OF PD MIMETICS ON PROTEASOMAL ACTIVITY
93
Figure 3.9. Assessment of ROS formation by confocal microscopy. SH-SY5Y cells were plated out in permanox 8-well chamber slides at a density of 10,000 cells per well. After overnight recovery cells were treated with 100 μM DA and 2 mM MPP+ for 24, 48 and 72 h prior to analysis of ROS formation by confocal microscopy as described in section 2.2.11. The effects of NAC were also monitored on 72h control and toxin-treated cells. Note: 100 μM DA was used because higher levels resulted in complete loss of cells from the chamber slides. Scale bar = 100 μm.
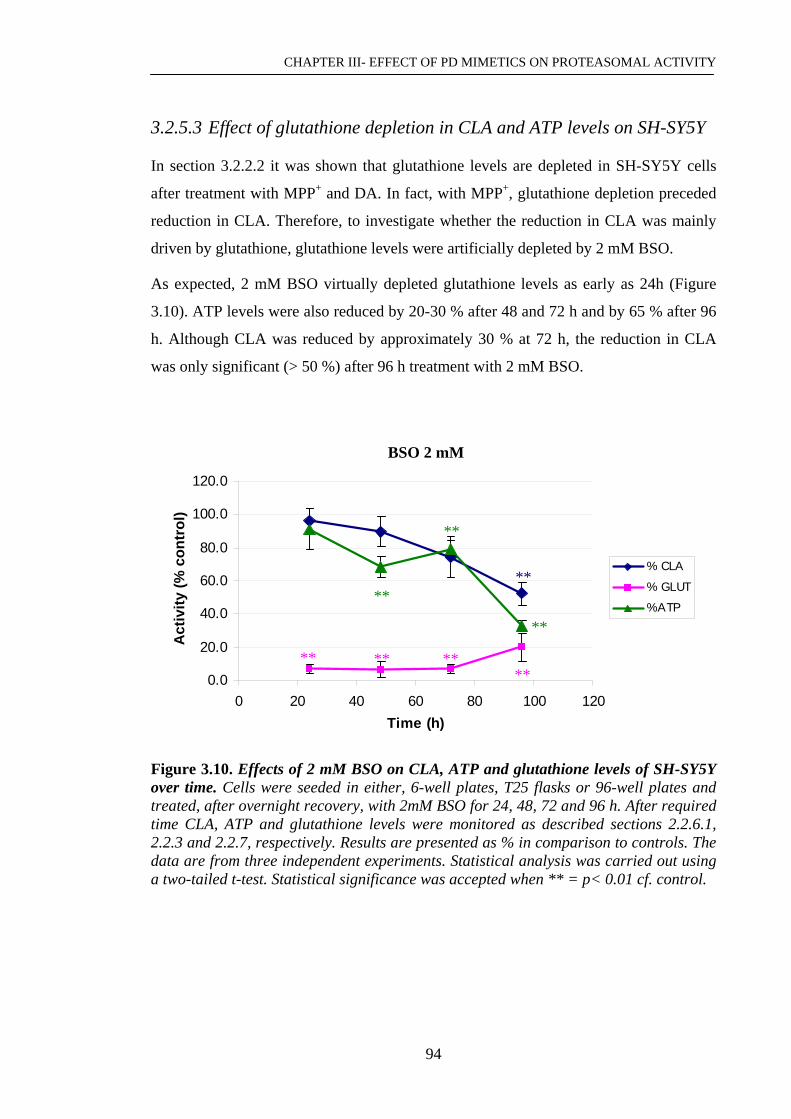
CHAPTER III- EFFECT OF PD MIMETICS ON PROTEASOMAL ACTIVITY
94
3.2.5.3 Effect of glutathione depletion in CLA and ATP levels on SH-SY5Y
In section 3.2.2.2 it was shown that glutathione levels are depleted in SH-SY5Y cells
after treatment with MPP+ and DA. In fact, with MPP+, glutathione depletion preceded
reduction in CLA. Therefore, to investigate whether the reduction in CLA was mainly
driven by glutathione, glutathione levels were artificially depleted by 2 mM BSO.
As expected, 2 mM BSO virtually depleted glutathione levels as early as 24h (Figure
3.10). ATP levels were also reduced by 20-30 % after 48 and 72 h and by 65 % after 96
h. Although CLA was reduced by approximately 30 % at 72 h, the reduction in CLA
was only significant (> 50 %) after 96 h treatment with 2 mM BSO.
BSO 2 mM
0.0
20.0
40.0
60.0
80.0
100.0
120.0
0 20 40 60 80 100 120Time (h)
% c
a. C
ONT
ROLS
% CLA
% GLUT
%ATP
BSO 2 mM
Act
ivity
(% c
ontr
ol)
**
**
**
**
**
****
**
Figure 3.10. Effects of 2 mM BSO on CLA, ATP and glutathione levels of SH-SY5Y over time. Cells were seeded in either, 6-well plates, T25 flasks or 96-well plates and treated, after overnight recovery, with 2mM BSO for 24, 48, 72 and 96 h. After required time CLA, ATP and glutathione levels were monitored as described sections 2.2.6.1, 2.2.3 and 2.2.7, respectively. Results are presented as % in comparison to controls. The data are from three independent experiments. Statistical analysis was carried out using a two-tailed t-test. Statistical significance was accepted when ** = p< 0.01 cf. control.

CHAPTER III- EFFECT OF PD MIMETICS ON PROTEASOMAL ACTIVITY
95
3.2.5.3.1 Assessment of reactive oxygen species (ROS) formation after
glutathione depetion
Figure 3.11 shows that 2 mM BSO increased ROS in comparison to controls by 24 h.
ROS were not further increased after this time point.
24h
48h
Control BSO 2mM
72h
Control BSO 2mM
Control BSO 2mM
Figure 3.11. Assessment of ROS formation by confocal microscopy. SH-SY5Y cells were plated out in permanox 8-well chamber slides at a density of 10,000 cells per well. After overnight recovery cells were treated with 2 mM BSO for 24, 48 and 72 h prior to analysis of ROS formation by confocal microscopy as described in section2.2.11. Scale bar = 100 μm.

CHAPTER III- EFFECT OF PD MIMETICS ON PROTEASOMAL ACTIVITY
96
3.2.5.3.2 Effect of glutathione depletion on CLA after 72 h toxic insult
To investigate whether glutathione reduction can further exacerbate proteasome
impairment caused by MPP+/ DA, 2 mM BSO was used to deplete glutathione in cells
treated with 100 μM MPP+ or DA for 72 h. Cells were extracted and a fluorogenic
peptide assay was performed as explained in sections 2.2.4.2 and 2.2.6.1, respectively.
Figure 3.12 shows that, although BSO further reduced CLA in the MPP+ treated cells,
the reduction was not significant. In the presence of DA, on the other hand, BSO
resulted in a significant increase in CLA.
0.0
20.0
40.0
60.0
80.0
100.0
120.0
140.0
BSO 2mM MPP+ 100uM MPP+ 100uMBSO 2mM
DA 100uM DA 100uMBSO 2mM
% C
LA c
a. c
ontro
ls
** **
*
Act
ivity
(% c
ontr
ol)
*
Figure 3.12. Effect of glutathione depletion on CLA, of SH-SY5Y after 72h toxic insult with 100 mM MPP+ and DA. Cells were seeded in 6-well plates and after overnight recovery, treated with 100 μM MPP+ and DA supplemented with or without 2 mM BSO for 72h. Then, cells were extracted as detailed in section 2.2.4.2 prior to CLA measurement as described section 2.2.6.1. Results were calculated as ΔFU/s/mg and transformed into % in comparison to the relevant control (untreated control or BSO control). The data are from six independent experiments. Statistical analysis was carried out using a two-tailed t-test. Statistical significance was accepted when *= p<0.05 or ** = p< 0.01 cf. untreated or toxin-treated control.

CHAPTER III- EFFECT OF PD MIMETICS ON PROTEASOMAL ACTIVITY
97
3.2.6 Effect of chronic exposure to low doses of MPP+ and DA on
proteasomal activity
Finally, proteasomal activity was monitored after chronic exposures (3 and 7 weeks) to
low doses of MPP+ and DA. Figure 3.13 shows that 10 μM MPP+ significantly reduced
CLA by 9 % and 30 % in comparison to controls after 3 and 7 weeks, respectively.
TLA and PLA were not reduced until 7 weeks treatment with MPP+ (14 % and 47 %
reduction respectively ca. controls). 10 μM DA reduced CLA by 49 % and 17 % after 3
and 7 weeks, respectively. Interestingly, TLA was considerably increased with 10 μM
DA at both times tested. Finally, 10 μM DA reduced PLA by 74 % and 19 % in
comparison to controls after 3 and 7 weeks, respectively.
CHAPTER III- EFFECT OF PD MIMETICS ON PROTEASOMAL ACTIVITY
98
***
*
**
10 μM MPP+
Act
ivity
(% c
ontr
ol)
** *
**
** *
*
10 μM DA
Act
ivity
(% c
ontr
ol)
Figure 3.13. Effect of chronic treatment with 10 mM MPP+ and DA on proteasomal activities. Cells were seeded in 6-well plates and after overnight recovery, treated with 10 μM MPP+ and DA for 3 or 7 weeks. Proteasomal activities were monitored as described section 2.2.6.1. Results were calculated as ΔFU/s/μg + SEM and transformed into % in comparison to controls. The data are from three independent experiments. Statistical analysis was carried out using a two-tailed t-test. Statistical significance was accepted when * = p<0.05 cf. toxin control or ** = p< 0.01 cf. control.

CHAPTER III- EFFECT OF PD MIMETICS ON PROTEASOMAL ACTIVITY
99
3.3 DISCUSSION
3.3.1 Specificity of fluorogenic substrates for measuring proteasomal
activities and protease inhibitors
As detailed in the main introduction, the eukaryotic proteasome possesses three
proteolytic activities, known as chymotrypsin-like, trypsin-like and post-acidic-like
(also termed PGPH) activities with distinct specificities against peptide substrates
(Rodgers and Dean, 2003 and Kisselev and Goldberg, 2005). A convenient and
sensitive way to monitor the activity of proteasomes in cells or tissues is the incubation
of cell lysates or tissue homogenates with fluorogenic peptide substrates, which are
three or four amino acid residue peptides with a fluorogenic reporter group at the C
terminus. The proteasome cleaves an amido bond between an aminoacid and the
reporter group, resulting in the release of a highly fluorescent product which can be
measured. There are different fluorophores but substrates containing 7-amino-4-
methylcoumarin (AMC) are the most commonly used. Despite being used widely,
relatively little information is available on how specific these substrates are for
proteasomal activity when used in biological samples which may contain many other
proteases (Kisselev and Goldberg, 2005). Furthermore, the specificity of proteasome
inhibitors and substrates towards the proteasome may vary between different cell lysates
and tissue homogenates (Rodgers and Dean, 2003; Kisselev and Goldberg, 2005).
To attempt to assess the specificity of the assays in SH-SY5Y cell lysates, the ability of
the proteasome inhibitors lactacystin and epoxomicin, and also the calpain inhibitor MDL
28,170 to inhibit the production of a fluorescent product was compared in SH-SY5Y cells
lysates and purified 20S proteasome samples. In this study fluorogenic substrates chosen
for measuring proteasomal activity were Suc-LLVY-AMC, Boc-LRR-AMC and Z-
LLE-AMC for CLA, TLA and PLA, respectively.
Epoxomicin is claimed to inhibit exclusively proteasomal activity (Kisselev and
Goldberg, 2001) whilst lactacystin is known to be more active against CLA than TLA
and PLA (Rodgers and Dean, 2003; Kisselev and Goldberg, 2006). Indeed, lactacystin
covalently binds to the terminal Thr of the chymotrypsin–like subunit β5 (Groll and
Huber, 2004). On the other hand, MDL 28,170 is a short hydrophobic N-blocked
dipeptidyl aldehyde lacking charged residues which is able to penetrate cell membranes
CHAPTER III- EFFECT OF PD MIMETICS ON PROTEASOMAL ACTIVITY
100
by passive diffusion. This calpain inhibitor is reported to also inhibit cathepsin B, and
very weakly α-chymotrypsin (Mehdi, 1991).
Lactacystin inhibited CLA in a dose dependent manner in pure 20S; inhibition was
virtually complete at the highest concentration (10 μM). On the other hand, 20S-TLA
was only inhibited by high doses of lactacystin (10 μM) and PLA was not inhibited at
any concentration tested. Epoxomicin reduced PLA to a great extent whilst TLA was
only partly inhibited even at the highest concentration of the inhibitor tested (i.e 20
μM). Thus, results suggest that epoxomicin is specific for CLA and to a lesser extent
PLA followed by TLA, whilst lactacystin is most specific for CLA followed by TLA.
Lactacystin does not inhibit PLA. This is consistent with Kisselev and Goldberg (2005)
who report that epoxomicin is the most specific inhibitor for the three proteasomal
activities and with Rodgers and Dean, (2003) who showed that lactacystin is most
active for CLA. Limited data is available about the specificity of inhibitors against PLA
but it is known that PLA is less well inhibited by lactacystin or epoxomicin that CLA
(Rodgers and Dean, 2003). On the other hand, MDL 28,170 virtually depleted calpain
activity when used at 1 μM or over. Since 10 μM MDL 28,170 also partly inhibited
TLA and to a lesser extent CLA our results suggest this inhibitor losses specificity for
calpain when used at high concentrations (Rodgers and Dean, 2003).
Specificity of the fluorogenic substrates was tested using the inhibitors with cell
extracts. Again, lactacystin inhibited CLA from SH-SY5Y cell lysates in a dose-
dependent manner with 10 μM abolishing this activity. Similarly 10 μM epoxomicin,
also depleted CLA in cell lysates; these data and the fact that CLA in the 20S and cell
extracts was only weakly/ not inhibited by MDL 28,170 would suggest that Suc-LLVY-
AMC was fairly specific for CLA. This is consistent with the studies of Rodgers and
Dean (2003) who found Suc-LLVY-AMC the most specific substrate to measure CLA.
Indeed, this activity was inhibited by more than 75 % with lactacystin in THP1 and
J774 cell lysates and in liver cytosol homogenate (Rodgers and Dean, 2003). On the
other hand, since lactacystin did not inhibit TLA in cell extracts and epoxomicin only
partially inhibited TLA (~ 25 % ca. controls), results would suggest that the TLA
substrate is less specific than the CLA substrate for proteasomal activity. Our results are
supported by Kisselev and Goldberg (2001), who found that the contribution of non-
proteasomal proteolysis to the cleavage of substrates of TLA is always higher than to

CHAPTER III- EFFECT OF PD MIMETICS ON PROTEASOMAL ACTIVITY
101
the cleavage of PLA and CLA sites. They showed that substrates utilised to measure
TLA present a high Km (>0.5 mM) and the specific activity at low concentrations of the
substrates is low (Kisselev and Goldberg, 2001). Rodgers and Dean (2003) also found
TLA was weakly inhibited by the proteasome inhibitors and that TLA substrate
measured other proteases activities. Finally, since PLA was markedly inhibited by
epoxomicin (87.2 % inhibition ca. controls) but not by MDL 28,170 our results suggest
that Z-LLE-AMC is a fairly specific substrate towards proteasomal PLA.
It would have been of interest to measure calpain activity in our cell system to further
confirm a possible activation of these proteases with MPP+ and DA. However, the
protocol used (from Sasaki et al., 1984 with modifications) did not give reproducible
activity rates. In fact, although calpains are calcium activated proteases, the assay gave
decreasing activity rates with increasing concentrations of calcium, suggesting that it
was not reliable.
3.3.2 Effects of MPP+ and DA on proteasome activity
Our data indicate that MPP+ and DA reduced CLA and PLA from SH-SY5Y cells in a
dose dependent manner after 72 h. The use of proteasomal inhibitors in control and toxin-
treated cell lysates confirmed that the activities affected by the toxins were proteasomal.
CLA and PLA were similarly reduced by the toxicants, whilst proteasomal TLA (obtained
from inhibition assays with epoxomicin) was not reduced by MPP+ or DA; in fact a
significant increase in TLA was observed with 100 μM MPP+ and 500 μM DA.
The decrease in CLA and PLA after toxic insult with MPP+ and DA in our cell system
is consistent with data reported by several authors. For instance, Keller et al. (2000)
found that DA toxicity induced a time and dose-dependent decrease in proteasome
activity in the PC12 cell line. Elkon et al. (2004) also found a decrease in the three
proteasomal activities in PC12 cell line, this time caused by 6-hydroxy-DA (6-OHDA),
a derivate of DA widely used in animal models of PD. Interestingly, they also report an
increase of the proteasomal activities with low doses of the toxin. This is in accordance
with the increase in TLA activity in our cell system with 100 μM MPP+ and 500 μM
DA which might be a cellular compensatory effect to mild oxidative stress. Moreover,
some studies also showed that toxins that inhibit mitochondrial complex I, like rotenone
and other pesticides also lead to proteasome inhibition (Shamoto-Nagai et al. 2003;
Höglinger et al. 2003; Wang et al. 2006). Finally, MPTP has also been reported to impair

CHAPTER III- EFFECT OF PD MIMETICS ON PROTEASOMAL ACTIVITY
102
the three different proteasomal activities in the SN of common marmosets (Zeng et al.,
2006). Controversially, in our cell system TLA was not reduced by MPP+ or DA despite
the use of the same fluorogenic substrate (Z-LLE-AMC) as used by several authors who
show a decrease in this activity after rotenone (Betarbet et al., 2006) or MPTP (Zeng et al.,
2006) treatment. This suggests that in our human cell system, TLA is less sensitive to
MPP+ and DA treatment than CLA or PLA.
3.3.3 Effects of PD mimetics on proteasome activity, glutathione and
ATP levels
As indicated earlier, mitochondrial dysfunction linked to energetic failure and oxidative
stress (ROS formation), accompanied by a depletion of both reduced and oxidised
gluthatione content, are well documented contributors to the disease state (Cassarino
and Bennet, 1999; Beal M.F. 2001; Buhmann et al. 2004, Chinta et al. 2006). It is
therefore important to understand the contribution of these factors on proteasome
activity in the cells following treatement with the PD mimetics MPP+ and DA.
3.3.3.1 Effects of MPP+ and DA on CLA
MPP+ and DA reduced proteasomal CLA in a dose and time dependent manner.
Proteasomal activities were corrected by protein content in order to eliminate any
possible decrease in activity due to cell death. The results, as further detailed in the last
section, are consistent with several studies showing that some pesticides, including
rotenone (Betarbet et al., 2001; Betarbet et al., 2006 and Wang et al., 2006), MPTP/
MPP+ and DA or derivates can lead to proteasome reduction (Keller et al., 2000; Elkon
et al. 2004; Shamoto-Nagai et al. 2003; Höglinger et al. 2003 and Zeng et al., 2006).
The link between these toxins, which inhibit mitochondrial function, and proteasome
impairment further strengthens the potential role of the proteasome in the pathogenesis
of PD. Indeed, proteasomal function has been reported to be decreased in SNpc from
PD patients (McNaught and Jenner 2001; McNaught et al., 2003).
Contrary to previous reports, this thesis reports that CLA activity could be also directly
impaired by addition of the toxins to the cell extracts. Concentrations of 2 mM of MPP+
and DA led to a reduction in CLA, MPP+ being more damaging than DA over a 2 h
incubation period. This disagrees with Höglinger et al. (2003) who exclude a direct
reduction of CLA after incubating primary mesencephalic cell lysates with 30 μM

CHAPTER III- EFFECT OF PD MIMETICS ON PROTEASOMAL ACTIVITY
103
MPP+ (and also 30 nM rotenone) for ten min. However, this approach is limited since
time exposure might be too short to affect proteasome activity with low concentrations
of the toxins. Also Wang et al. (2006) report that no direct effect on 20S proteasome
activity in SK-N-MC cells lysates treated with 6 different pesticides, including the
complex I inhibitor rotenone. Therefore, to my knowledge, this study is the only one
showing direct effect of MPP+ and DA on proteasome activity.
3.3.3.1.1 Mechanisms of MPP+-mediated CLA impairment
MPP+ decreased glutathione levels prior to reducing CLA or ATP levels; indeed, CLA
was only reduced if ATP was also reduced. These findings, suggest that MPP+-induced
proteasomal impairment in my system may be mainly driven by ATP levels. This is
supported by the fact that the antioxidant, NAC, failed to protect the cells from MPP+
effects on the proteasome. This is similar to Höglinger et al. (2003) who found that in
rat primary mesencephalic cultures, ATP levels needed to be reduced to a threshold low
level by MPP+ or rotenone prior to induce cell death linked with a 30-60 % reduction in
UPS activity. Furthermore, these authors found that restoring ATP levels up to 40 % by
glucose supplementation, restored proteasomal activities. However, in my cell system
only a 20 % reduction in ATP levels in comparison to controls was required for MPP+
to induce proteasome dysfunction. This suggests that human cells are more sensitive
than rat cells. On the other hand, Betarbet et al. (2006) found that chronic exposure of
human SK-N-MC cells to rotenone impaired the UPS without decreasing ATP levels
whilst α-tocopherol protected the cells from rotenone insult indicating that oxidative
stress is involved in the toxicity of this complex I inhibitor.
It is important to note that, glutathione levels may also play a role in MPP+-mediated
proteasomal impairment in SH-SY5Y cells, since a sustained reduction in glutathione
levels precede the decrease in CLA. Some evidence that depletion in glutathione levels
by BSO may exacerbate the effect of MPP+ on CLA is presented in this thesis.
Moreover, confocal microscopy analysis showed that addition of NAC to MPP+-treated
cells (2 mM) could counteract the increase of ROS caused by the toxin, however as
stated before without rescuing CLA or cell morphology. Indeed, oxidative stress (ie.
free radical formation) has been proposed by several authors to contribute to MPTP/
MPP+ toxicity (Conn et al., 2001; Song et al., 2004) and, contrary to the results obtained
in this thesis, is supported in some systems by the protection afforded by anti-oxidant

CHAPTER III- EFFECT OF PD MIMETICS ON PROTEASOMAL ACTIVITY
104
agents (Lai et al., 1993; Gonzalez-Polo et al. 2004; Chinta et al. 2006). Interestingly,
Cassarino et al. (1997) found that MPTP treatment of mice and MPP+ exposure of SH-
SY5Y human neuroblastoma cells increased oxygen free radical production and also
antioxidant enzyme activities. However, involvement of ROS in MPP+ toxicity is
controversial. Lee et al. (2000) found that MPP+ did not increase levels of lipid
peroxidation at toxic concentrations in SH-SY5Y cells. Moreover, they also found that
pre-treatment of the cells with antioxidants or antioxidant enzymes did not reduce MPP+
cytotoxicity, concluding that that MPP+ increased the vulnerability of cells to oxidative
stress rather than inducing cell death directly from oxygen free radicals generation. In
addition, Lotharius and O’Malley (2000) reported that MPP+-induced ROS formation is
not mitochondrial in origin but results from vesicular DA displacement and intracellular
DA oxidation.
In conclusion, it appears that ROS might not be the main factor controlling MPP+-
induced proteasome impairment; glutathione depletion combined with either ATP
depletion and/or oxidative stress are needed before proteasomal activity is reduced.
3.3.3.1.2 Mechanism of DA-mediated CLA impairment
With regards to DA, low levels of this toxin (100 μM) did not reduce ATP levels at any
time tested, whilst CLA and glutathione levels were reduced after 72 h. With higher
doses of DA, ATP levels were virtually abolished as early as 24 h, presumably via
complex I inhibition (Gluck and Zeevalk 2004; Ben-Shachar et al. 2004; Gimenez-
Xavier et al., 2006), but CLA was not reduced until 72 h treatment; this was after
glutathione levels were decreased (by 48h). Thus, it is hypothesised that DA toxicity
may be primarily driven by oxidative stress within the cells and not via ATP depletion.
This was supported by the fact that the antioxidant NAC, could significantly reduce the
effect of dopamine on CLA and also on cell morphology. Indeed, confocal microscopy
studies revealed that low doses of DA (100 μM) induced vast amounts of ROS in SH-
SY5Y cells, which could be markedly alleviated by the NAC. Moreover, consistent with
my findings, Elkon et al. (2004) found that a reduction in proteasome activity caused by
6-OHDA in PC12 cells was alleviated by the addition of the antioxidant NAC. This
glutathione precursor also rescued cells from protein oxidation and abolished the
activation of caspase-3 (ie. apoptosis; Elkon et al., 2004). Additionally, data supporting
a key role for glutathione on DA toxicity and UPS impairment was shown by Jha et al.
CHAPTER III- EFFECT OF PD MIMETICS ON PROTEASOMAL ACTIVITY
105
(2002), since a reduction of total glutathione levels after treatment of PC12 cells with
the DA metabolite, 6-OHDA, led to reduced ubiquitin conjugated levels suggesting that
ubiquitination of proteins is inhibited in a glutathione-dependent fashion.
Surprisingly, BSO appeared to protect proteasome from DA insult; CLA was
significantly increased to virtually control levels when BSO was added to DA. This
could be explained by a similar transient compensatory response to that observed by
others with 6-OHDA (Elkon et al., 2004). On the other hand, Stokes et al. (2000) found
that in SK-N-SH neuroblastoma cells, DA toxicity was enhanced when GSH was
depleted; but only when glutathione levels were virtually depleted (98 % reduction with
2mM BSO), suggesting that GSH stores are in excess in neuroblastoma cells.
Finally it is important to note that although DA concentrations used in this study (100-
500 μM) would be considered as being above normal physiological values, since
extracellular concentrations are reported to be of the order of nM in the SN and
striatum, the intracellular striatum concentration is estimated to be around 70 μM,
whilst the concentration in neuronal endings can be in the mM range (Blum et al., 2001;
Gimenez-Xavier et al., 2006; Morikawa et al., 1996). Thus it would seem likely that
extracellular DA concentrations in the present study would lead to intracellular
concentrations that are found in vivo in dopaminergic neurons with disrupted vesicles or
vesicles not storing DA efficiently.
In conclusion, reduction in glutathione levels and the subsequent increase in oxidative
stress might be a critical parameter on DA-induced proteasomal impairment.
3.3.3.2 Effect of BSO on CLA
It has been suggested that low levels of oxidative stress increases proteasome activity
but higher levels can inhibit proteasomal fuction (Reinheckel et al., 1998). Indeed,
depletion of glutathione levels (with BSO) in my cell system led to impaired CLA.
However, although ROS levels were greatly increased after 24 h treatment with BSO,
proteasomal function only decreased after 96 h. BSO also reduced ATP levels in the
cells (by 48 h), suggesting that other factors, like ATP, might also be contributing in the
process. Therefore, ROS by itself might not be sufficient to cause proteasomal
impairment.

CHAPTER III- EFFECT OF PD MIMETICS ON PROTEASOMAL ACTIVITY
106
3.3.4 Chronic exposure to low levels of toxins impairs proteasomal
function
Chronic exposure to low levels of MPP+ reduced CLA levels after 3 weeks treatment,
and TLA and PLA after 7 weeks treatment with the toxin. In contrast, DA was more
damaging to the proteasome, reducing CLA and PLA after 3 weeks treatment. These
data are consistent with Betarbet et al. (2006) who found that chronic exposure to
rotenone also decreased the three proteasomal activities in SK-N-MC cells after 4
weeks. As reported before in this thesis, TLA appears to be the least sensitive of the
three activities. Interestingly, TLA was increased after 3 and 7 week exposure of cells to
DA. It has been suggested that activation of the proteasome can occur under mild
oxidative stress conditions (Reinheckel et al., 1998). This might be a compensatory
mechanism in order to help the cells to cope with oxidatively damaged proteins. Indeed,
treatment of PC12 cells with 6-OHDA, a naturally occurring DA analogue (Blum et al.,
2001), increases proteasome activity at low doses (10-100 μM) with a reduction in
activity with higher doses discussed (Elkon et al., 2004). This is in agreement with
Höglinger et al. (2003) who showed that 6-OHDA also transiently increased all three
proteasomal activities in rat mesencephalic cell cultures. Recent data from Betarbet et
al. (2006) also showed compensatory increases in proteasomal activities in
neuroblastoma cells prior to a reduction in activities over a 4 week period. However, as
discussed in section 3.3.1, the TLA substrate is unspecific for measuring proteasomal
TLA. My previous data suggest that calpains may contribute to the activity measured in
the TLA assay since MDL 28,170 inhibited measured TLA by 67 % of control cells.
Nevertheless, further studies with different types of proteases inhibitors are needed to
elucidate true proteasomal TLA in these experiments.

CHAPTER V- EFFECTS OF PD MIMETICS ON NF TURNOVER IN SH-SY5Y CELLS
107
CHAPTER IV
MPP+, MPTP AND DA DIRECT
EFFECT ON PURIFIED 20S
PROTEASOME

CHAPTER IV- MPP+, MPTP AND DA EFFECT ON PURIFIED 20S PROTEASOME
108
4. MPP+, MPTP AND DA DIRECT EFFECT ON PURIFIED 20S
PROTEASOME
4.1 INTRODUCTION
4.1.1 The 20S proteasome
As explained in the general introduction, the 20S proteasomal catalytic core is a 28
subunit multicatalytic particle consisting of four heptameric rings. The two outer rings
consist of seven α-subunits each and the two inner rings consist of seven β-subunits.
The multiple catalytic centres are located in three β−subunits (β5, β 2 and β1; Koop et
al., 1997; De Martino and Slaughter, 1999; Ferrell et al., 2000; Kisselev and Goldberg,
2001; De Vrij et al. 2004).
In vivo, 20S proteasomes exist not only as a part of the 26S complexes but also as free
particles (Kisselev et al., 1998) and comprise about 1 % of cell proteins (Lee and
Goldberg, 1998). Indeed, although initial studies suggested that the 26S was the major
proteasomal form in vivo, subcellular localization and stochiometrics of the different
complexes showed that the number of free 20S particles exceeds that of the 19S and
11S (free or bound to 20S) by 3 to 4-fold. Moreover, the 20S proteasome itself degrades
proteins without a requirement for ubiquitin or ATP, including oxidized and damaged
proteins (Davies et al., 2001; De Vrij et al., 2004). Oxidised proteins are particularly
relevant to neurodegenerative disorders, such as PD, and seem to be degraded via the
20S in an ubiquitin-independent manner (Davies, 2001; Grune et al., 2003).
A growing body of evidence suggests that proteasome activity declines with age and is
involved in certain pathologies (Bulteau et al., 2001; Carrard et al., 2002; Farout et al.,
2006). This has been attributed, at least in part, to oxidative stress since it has been
shown that the proteasome can undergo modification by 4-hydroxy-2-nonenal (HNE), a
lipid peroxidation product, during these situations (Bulteau et al., 2001; Carrard et al.,
2002). Moreover, recent data have been published reporting that HNE oxidatively
modified specific subunits of the 20S proteasome (Farout et al., 2006).
CHAPTER IV- MPP+, MPTP AND DA EFFECT ON PURIFIED 20S PROTEASOME
109
4.1.2 Aims of chapter
As introduced in the last chapter there is an increasing number of studies which link
complex I inhibition to proteasomal impairment. However, limited data is available
about the possible direct effects of complex I toxins on the proteasome itself. Data
presented in last chapter indicates that direct incubation of SH-SY5Y cell lysates with
MPP+ and DA leads to reduced CLA; however, recent work suggests no direct effects of
some mitochondrial toxins, such as MPP+ or rotenone, on the proteasome (Höglinger et
al., 2003; Betarbet et al., 2006; Wang et al., 2006). It is important to note that the
approach of these authors was incomplete since relatively low concentrations of toxins
with short time exposures were utilised when assaying 20S activity of cell lysates.
Therefore it was considered important to further monitor the direct effects of the
neurotoxins MPTP, MPP+ and DA on the activities of the commercial 20S proteasome
purified from human red blood cells and in particular on TLA, which was shown to be
less sensitive to the toxins in the previous chapter. Indeed, the use of purified 20S
proteasome will assure that substrates (particularly TLA substrate) are specifically
measuring proteasomal activity. In addition, the protective capacity of vitamin C
(ascorbic acid) was examined to establish whether the neurotoxins caused free radical
damage. Additionally, for comparison, the effects of these toxins on purified trypsin
enzyme were also monitored to establish whether a general protease was affected in a
similar manner to the proteasome. Finally, 2D SDS-PAGE techniques were utilised in
order to separate the 20S subunits and analyse whether specific proteasome subunits
were affected; this was monitored using silver-staining and antibodies directed against
various β-subunits (to help define the exact catalytic subunits affected) and α-subunits
on Western blots (Brooks et al. 2000).

CHAPTER IV- MPP+, MPTP AND DA EFFECT ON PURIFIED 20S PROTEASOME
110
4.2 RESULTS
4.2.1 Effect of MPP+, MPTP and DA on 20S proteasomal activities
Figure 4.1 (A) shows that all toxins reduced CLA in a dose dependent manner, with the
effects of 2 mM MPTP and MPP+ being similar, resulting in 72 % and 54 % reductions,
respectively. On the other hand, DA had a greater effect and completely abolished
activity at 2 mM whilst a low concentration (10 μM) reduced CLA by 70 %.
On the other hand, TLA was not affected by MPTP at all concentrations tested (Figure
4.1B). However, MPP+ significantly reduced TLA by 30% and 42% at 500μM and
2mM respectively. DA had a more potent effect on this activity, and completely
abolished activity when used at 500 μM or 2 mM. Again, the pattern shown by MPP+
and DA was dose dependent.
As for CLA, PLA was reduced by all toxins (Figure 4.1C). Indeed, PLA was more
sensitive to high doses of MPP+ and MPTP than CLA since PLA was completely
abolished at the highest toxin concentration. Although, DA was the most damaging,
abolishing PLA at 500 μM, the effects of the three toxins were very similar.

CHAPTER IV- MPP+, MPTP AND DA EFFECT ON PURIFIED 20S PROTEASOME
111
A
0.0
10.0
20.0
30.0
40.0
50.0
60.0
70.0
80.0
90.0
100.0
0 0.5 1 1.5 2 2.5 3 3.5
CLA
% A
ctiv
ity (c
a. c
ontro
ls)
Act
ivity
(% c
ontr
ol)
MPP+MPTPDA
0.0
20.0
40.0
60.0
80.0
100.0
120.0
0 0.5 1 1.5 2 2.5 3 3.5
% A
ctiv
ity (c
a. c
ontr
ols)
MPP+MPTPDA
0.0
10.0
20.0
30.0
40.0
50.0
60.0
70.0
80.0
90.0
100.0
0 0.5 1 1.5 2 2.5 3 3.5Toxin (uM) log 10
% A
ctiv
ity (c
a. c
ontr
ols)
MPP+MPTPDA
Figure 4.1. Effect of MPP+, MPTP and DA on CLA (A), TLA (B) and PLA (C) of commercial 20S proteasome. Suc-LLVY-AMC, Boc-LRR-AMC and Z-LLE-AMC were used to monitor proteasomal CLA, TLA and PLA, respectively as described in section 2.2.6.1. Results were calculated as ΔFU/s/μg ± SEM and converted to mean % in comparison to controls. The data are from three independent experiments with assays replicated four times. Statistical analysis was carried out using a two-tailed t-test. Statistical significance was accepted when ** = p< 0.01 cf. control.
**
****
** **
** **
******
B TLA
Act
ivity
(% c
ontr
ol)
**
10 μM 100 μM 500 μM 2 mM
C
**
*
** **
PLA
**
Act
ivity
(% c
ontr
ol) **
****
**
** ** ** ****

CHAPTER IV- MPP+, MPTP AND DA EFFECT ON PURIFIED 20S PROTEASOME
112
4.2.2 Effect of the antioxidants on toxin induced 20S proteasome
impairment
4.2.2.1 Screening for the most suitable antioxidant
Different antioxidants were used: glutathione (GLUT), N-acetyl cysteine (NAC),
vitamin E (α-tocopherol) and vitamin C. Firstly, the effect of these antioxidants against
DA toxicity towards proteasomal chymotrypsin- like activity was screened, in order to
select a suitable antioxidant for further studies. Table 4.1 shows that 100 μM DA
reduced CLA to 39 % of controls and this reduction was partly reversed by100 μM
vitamin C (68 % in comparison to vitamin C control). In contrast, none of the other
antioxidants tested offered protection to the proteasome against DA toxicity. Therefore,
vitamin C was selected for further studies with the other toxins.

CHAPTER IV- MPP+, MPTP AND DA EFFECT ON PURIFIED 20S PROTEASOME
113
ΔFU/s/μg SEM % Activity cf. control
Control 2.215 0.031 100
GLUT 100 μM 2.266 0.109 102.3
NAC 100 μM 2.225 0.056 100.4
VI T E 100 μM 2.050 0.092 92.5
VIT C 100 μM 2.663 0.115 120.2
DA 100 μM 0.870 0.075 39.3 **
DA/ GLUT 1.042 0.074 46.0 **
DA/ NAC 0.736 0.076 33.1 **
DA/ VIT E 0.883 0.124 43.1 **
DA/ VIT C 1.811 0.119 68.0 **/ ••
Table 4.1. Assessment of the effect of different antioxidants on DA toxicity to CLA from purified 20S proteasome. DA and antioxidants were directly added to the 20S (0.05 μg) proteasome in a black 96-well plate and preincubated for 15 min before the addition of the CLA substrate, Suc-LLVY-AMC. CLA was monitored as described in section 2.2.6.1. Results were calculated as ΔFU/s/μg ± SEM and converted to mean % in comparison to controls or antioxidant controls. Statistical analysis was carried out using a two-tailed t-test. Statistical significance was accepted when ** = p< 0.01 cf. untreated and antioxidant-treated control or •• = p< 0.01 cf. DA (n=3). Important note: variations in activity between control 20S are due to the fact that different batches of commercial purified proteasome produce different basal activities due to source differences (ie. different individuals). This is specified in the data sheet of the product (code PW8729) purchased from Biomol International, Exeter, UK.

CHAPTER IV- MPP+, MPTP AND DA EFFECT ON PURIFIED 20S PROTEASOME
114
4.2.2.2 Protective effect of vitamin C on CLA from purified 20S proteasome
treated with various toxins
Figure 4.2 shows vitamin C protected the 20S proteasome from 2 mM MPTP, MPP+
and DA to different extents. 100 μM vitamin C was required to protect CLA against
DA, restoring activity from 1 % of controls to 46 % of controls; with 500 μM and 1 mM
vitamin C, CLA was increased to 62 % and 70 % of controls, respectively. Low doses
of vitamin C (10μM) protected CLA against MPP+ and MPTP, restoring CLA from 47
% and 7.5 % to 67 % and 62 % of controls, respectively; protection improved when the
vitamin C dose was increased to 100 μM (to 78 % and 87 % for MPP+ and MPTP,
respectively).

CHAPTER IV- MPP+, MPTP AND DA EFFECT ON PURIFIED 20S PROTEASOME
115
A
0.0
20.0
40.0
60.0
80.0
100.0
_ VIT C 10 uM VIT C 100 uM VIT C 500 uM VIT C 1mM
% A
ctiv
ity c
a. to
xins
s
Dopamine 2 mM
Act
ivity
(% to
xin
cont
rol)
B
0.0
20.0
40.0
60.0
80.0
100.0
_ VIT C 10 uM VIT C 100 uM VIT C 500 uM VIT C 1mM
% A
ctiv
ity c
a. to
xins
s
MPP+ 2 mM
C
0.0
20.0
40.0
60.0
80.0
100.0
_ VIT C 10 uM VIT C 100 uM VIT C 500 uM VIT C 1mM
% A
ctiv
ity c
a. to
xins
s
MPTP 2 mM
****
**
Act
ivity
(% to
xin
cont
rol)
* ** ***
****
Act
ivity
(% to
xin
cont
rol)
****
Figure 4.2. Effect of vitamin C on toxin induced proteasome impairment. DA (A), MPP+ (B) or MPTP (C) were added directly to 0.05μg commercial 20S with or without 10, 100, 500 μM and 1 mM vitamin C. Suc-LLVY-AMC was used to monitor CLA (as explained in section 2.2.6.1). Results were calculated as ΔFU/s/μg ± SEM and converted to mean % in comparison to controls or antioxidant controls. Statistical analysis was carried out using a two-tailed t-test. Statistical significance was accepted when * = p<0.05; ** = p< 0.01 cf. toxins (n=3).
CHAPTER IV- MPP+, MPTP AND DA EFFECT ON PURIFIED 20S PROTEASOME
116
4.2.3 Effects of MPP+, MPTP and DA on trypsin enzyme activity
Next, the effect of toxins on trypsin enzyme (EC 3.4.21.4) were compared to the effects
on its proteasomal counterpart, 20 S trypsin-like activity.
Firstly, different dilutions (1:5000; 1:10000; 1:20000; 1:40000 and 1:80000; in 50 mM
HEPES, 5mM EGTA, pH 8.0) of trypsin enzyme (1mg/ml) were tested to determine an
amount of the pure enzyme that provided a fluorescence rate similar to the 20S
proteasome (section 4.2.1). 10 μl of 1:10000 dilution per assay (ie. 1 ng pure trypsin)
were found to be suitable for the experiment. The procedure was as described
previously for the 20S proteasome except 10μl of the diluted enzyme were added as
opposed to commercial 20S.
The data presented in Table 4.2 show 20S TLA to be more sensitive to DA than trypsin
enzyme, with 500 μM DA completely inhibiting 20S-TLA whilst reducing trypsin
activity by only 71 %. In contrast, MPP+ had a similar effect on both activities.
Consistent with previous data (see section 4.2.1) MPTP had no significant effect on
proteasomal TLA and similarly had no adverse effect on trypsin enzyme activity.

CHAPTER IV- MPP+, MPTP AND DA EFFECT ON PURIFIED 20S PROTEASOME
117
20S Trypsin
Treatments ΔFU/s/μg ±
SEM
% Activity ca.
control ΔFU/s/μg ± SEM
% Activity ca.
control
Control 4.504 ± 0.176 100.0 8.679 ± 0.351 100.0
MPP+ 100 μM 4.135 ± 0.280 91.8 8.192 ± 0.425 94.4
MPP+ 500 μM 3.658 ± 0.209 81.2* 7.208 ± 0.420 83.1*
MPP+ 2 mM 3.473 ± 0.118 77.1** 6.690 ± 0.310 77.1**
MPTP 100 μM 4.090 ± 0.065 90.8 7.781 ± 0.664 89.7
MPTP 500 μM 3.842 ± 0.259 85.3 9.135 ± 0.198 105.3
MPTP 2 mM 4.156 ± 0.111 92.3 7.881 ± 0.444 90.8
DA 100 μM 1.914 ± 0.355 42.5** 4.558 ± 0.332 52.5**
DA 500 μM 0.000 ± 0.408 0.0** 2.483 ± 0.437 28.6**/ •
DA 2 mM 0.000 ± 0.489 0.0** 1.594 ± 1.594 18.4**/•
Table 4.2. MPP+, MPTP and DA effect on pure trypsin enzyme. 1 ng of pure trypsin enzyme/HEPES-EGTA and 0.05 μg of 20S proteasome were used in a fluorogenic substrate assay, as described before, to compare the effect of the toxins on both enzymes. The data are from a representative experiment with assays replicated three times. Results were calculated as ΔFU/s/μg protein ± SEM and then converted to % reduction in comparison to control samples. Statistical analysis was carried out using a two-tailed t-test. Statistical significance was accepted when * = p<0.05; ** = p< 0.01 ca. controls or • = p<0.05 cf. the same DA treatment on TLA vs. trypsin enzyme.

CHAPTER IV- MPP+, MPTP AND DA EFFECT ON PURIFIED 20S PROTEASOME
118
4.2.3.1 Effect of vitamin C on trypsin enzyme activity after toxic insult
Figure 4.3 shows that concentrations of vitamin C ≥100 μM almost completely reversed
the DA-mediated effect on trypsin enzyme activity.
0.0
20.0
40.0
60.0
80.0
100.0
120.0
DA 2 mM DA+VIT C10uM
DA+VIT C100uM
DA+VIT C500uM
% A
ctiv
ity c
a. d
opam
ine
Trypsin enzyme
* *
Act
ivity
(% c
ontr
ol)
Figure 4.3. Effect of vitamin C on trypsin enzyme activity after toxic insult with 2 mM DA. 1 ng of pure trypsin enzyme/HEPES-EGTA was used in a fluorogenic substrate assay, as described in section 2.2.6.1., to compare the effect of the toxins on both enzymes. The data are from a representative experiment with assays replicated four times. 2 mM DA was added directly to the trypsin enzyme in the presence or absence of (10-500 μM) vitamin C. Results were calculated as ΔFU/s/μg ± SEM and converted to mean % in comparison to controls or antioxidant controls. Statistical analysis was carried out using a two-tailed t-test. Statistical significance was accepted when * = p<0.05 cf. toxins.

CHAPTER IV- MPP+, MPTP AND DA EFFECT ON PURIFIED 20S PROTEASOME
119
4.2.4 Effect of toxins on purified 20S proteasomal subunits
DA and MPP+ have been shown to reduce 20S proteasome activity when either added
directly to purified proteasome (section 4.2.1) or to SH-SY5Y cells (section 3.3.2). This
section investigated whether any specific core subunit of the 20S proteasome is
particularly affected by MPP+ and DA.
Purified 20S proteasome (2 μg in 50 mM HEPES, 5mM EGTA pH 8.0) was incubated
with 2mM MPP+ or DA in phosphate buffer saline (PBS) for 2 h at 37º C prior to
fractionation by 2D-SDS PAGE as described in section 2.2.9.5. Gels were then silver
stained (see section 2.2.9.5) or analysed by Western blotting/ immunoprobing (see
sections 2.2.10.1 and 2.2.10.2) using specific antibodies against 20S proteasome core
subunits. Membranes were probed/ stripped several times as detailed in section 2.2.10.5.
Table 4.3 gives a summary of the molecular masses and isoelectric points (pI) of the
fourteen 20S subunits whilst Figure 4.4 is a 2D electrophoretic reference map for 20S
subunits (blots taken from Claverol et al., 2002). As can be seen, the pI values range
from 4.8 to 8.7 and the molecular masses are from 22 to 30 kDa.

CHAPTER IV- MPP+, MPTP AND DA EFFECT ON PURIFIED 20S PROTEASOME
120
20S subunit Theoretical
molecular mass (Da) Theoretical pI Function
α5 26,469 4,86 Catalyse a proteasome
RNAase activity
β1 21,862 5,15 PLA active site
α7 28,302 5,43 Unknown
β2 25,295 6,09 TLA active site
β7 24,379 5,76 PLA active site
complementary subunit
α6 29,556/ 30,108ª 6,90/ 7,28 Unknown
α1 27,339 7,01 Unknown
β3 22,930 6,81 Unknown
α3 29,483 7,95 Unknown
α2 25,767 7,74 Unknown
β4 22,836 7,31 CLA active site
complementary subunit
α4 22,458 8,67 Unknown
β6 27,887 8,38 TLA active site
complementary subunit
β5 23,548 8,66 CLA active site
Table 4.3. Subunit identification of human 20S proteasome purified from erythrocytes. The above table shows the theoretical molecular weights and isoelectric points of the 14 subunits of the human proteasomal 20S catalytic core. Table taken from Claverol et al. (2002) with modifications. Most of the subunits (12 of 14) exhibit several isoforms (from 2 to 4). Only subunits α5 and β3 appear as one single spot (see Figure 4.4). ª = short and long isoform of α6 subunit.

CHAPTER IV- MPP+, MPTP AND DA EFFECT ON PURIFIED 20S PROTEASOME
121
Figure 4.4. Two- dimensional electrophoretic reference map of human 20S proteasome (Picture taken from Claverol et al., 2000). 20S proteasome from erythrocytes (40μg) was separated using a pH 3-10 non linear IPG strip in the first dimension followed by a 12.5 % polyacrylamide SDS gel in the second dimension. The 2D gel was stained with Coomassie Brilliant Blue. All labelled spots were identified by MALDI-TOF mass spectrometry and database search.
Figure 4.5 and Table 4.4 show some of the spots which were identified in the 2D-gel by
MALDI-TOF mass spectroscopy and data base search (performed by Kevin Bailey and
John Kyte from School of Biomedical Sciences, University of Nottingham Medical
School, Nottingham, UK). The rest of the spots mapped in Figure 4.6 were identified by
theoretical molecular weights and pI of the different subunits together with a
comparison with the refence map available from Claverol et al., (2002; see Figure 4.4).
CONTROL
Figure 4.5. Two-dimensional SDS-PAGE of 20S purified proteasome from human erythrocytes. 2μg of 20S proteasome were separated using a pH 3-10 non-linear IPG strip (1st dimension) followed by a 15 % polyacrylamide SDS gel electrophoresis (detailed in section 2.2.9.4). The 2D gel was silver stained as detailed in section 2.2.9.5. and all labelled spots were identified by MALDI-TOF mass spectrometry and database search.
1
23
5
4 25 KDa
20 KDa 6
3 pH gradient 10
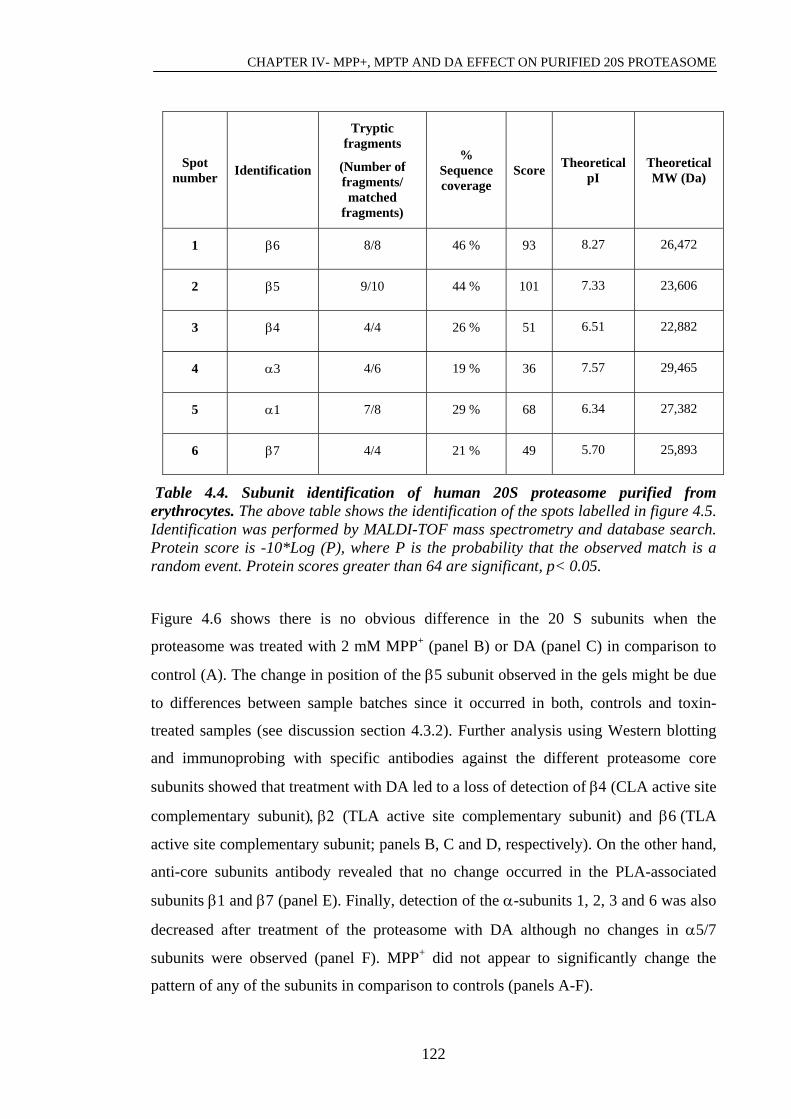
CHAPTER IV- MPP+, MPTP AND DA EFFECT ON PURIFIED 20S PROTEASOME
122
Spot number Identification
Tryptic fragments
(Number of fragments/ matched
fragments)
% Sequence coverage
Score Theoretical pI
Theoretical MW (Da)
1 β6 8/8 46 % 93 8.27 26,472
2 β5 9/10 44 % 101 7.33 23,606
3 β4 4/4 26 % 51 6.51 22,882
4 α3 4/6 19 % 36 7.57 29,465
5 α1 7/8 29 % 68 6.34 27,382
6 β7 4/4 21 % 49 5.70 25,893
Table 4.4. Subunit identification of human 20S proteasome purified from erythrocytes. The above table shows the identification of the spots labelled in figure 4.5. Identification was performed by MALDI-TOF mass spectrometry and database search. Protein score is -10*Log (P), where P is the probability that the observed match is a random event. Protein scores greater than 64 are significant, p< 0.05.
Figure 4.6 shows there is no obvious difference in the 20 S subunits when the
proteasome was treated with 2 mM MPP+ (panel B) or DA (panel C) in comparison to
control (A). The change in position of the β5 subunit observed in the gels might be due
to differences between sample batches since it occurred in both, controls and toxin-
treated samples (see discussion section 4.3.2). Further analysis using Western blotting
and immunoprobing with specific antibodies against the different proteasome core
subunits showed that treatment with DA led to a loss of detection of β4 (CLA active site
complementary subunit), β2 (TLA active site complementary subunit) and β6 (TLA
active site complementary subunit; panels B, C and D, respectively). On the other hand,
anti-core subunits antibody revealed that no change occurred in the PLA-associated
subunits β1 and β7 (panel E). Finally, detection of the α-subunits 1, 2, 3 and 6 was also
decreased after treatment of the proteasome with DA although no changes in α5/7
subunits were observed (panel F). MPP+ did not appear to significantly change the
pattern of any of the subunits in comparison to controls (panels A-F).

CHAPTER IV- MPP+, MPTP AND DA EFFECT ON PURIFIED 20S PROTEASOME
123
A) Control
3 pH gradient 10
α7 β2 α5 α6 α3
B) 2 mM MPP+
C) 2 mM DA
25 KDa
20 KDa α2
α4 α3
β5
α3 α1
α1
β6 β7 β3 β1 β4
25 KDa
20 KDa
25 KDa
20 KDa
β6
α1
α4 α3 α3 α3 α5 α1
β1 β4
α7 β2
β7
α1
β3
α6
α2 25 KDa
20 KDa
25 KDa
20 KDa
β5
α4 α3
β5
β6
α3 α3 α5
α1
β1 β4
α7 β2
β7
α1
β3
α6
α2
α6 β2 α3 α3 α3 α7 α5 α4 α1
β6 α2 β7 β3 β4 β1 β5
α4 α3
β5
β6
α3 α3 α5
α1
β1 β4
α7 β2
β7
α1
β3
α6
α2
α2
α4 α3
β5
β6
α3 α3 α5
α1
β1 β4
α7 β2
β7
α1
β3
α6 25 KDa
20 KDa

CHAPTER IV- MPP+, MPTP AND DA EFFECT ON PURIFIED 20S PROTEASOME
124
Figure 4.6. Two dimensional SDS-PAGE of 20S purified proteasome from human erythrocytes treated with 2 mM MPP+ and DA. 2 μg of untreated (A), 2 mM MPP+ treated (B) and DA treated (C) 20S proteasome were separated using a pH 3-10 non-linear IPG strip (1st dimension) followed by a 15 % SDS polyacrylamide gel electrophoresis (detailed in section 2.2.9.4). The 2D gel was silver stained as detailed in section 2.2.9.5. All labelled spots were identified by MALDI-TOF mass spectrometry and database search or by comparison with established reference maps of human 20S proteasome. The experiment was repeated three times obtaining similar spot patterns; samples presented in duplicates to demonstrate the reproducibility obtained.

CHAPTER IV- MPP+, MPTP AND DA EFFECT ON PURIFIED 20S PROTEASOME
125
A) β5 SUBUNIT (CLA active site)
Sample 1
MPP+ Control DA
Sample 2
B) β4 SUBUNIT (CLA active site supplementary subunit)
Sample 1
MPP+ Control DA
Sample 2
C) β2 SUBUNIT (TLA active site)
Sample 1
MPP+ Control DA
Sample 2
D) β6 SUBUNIT (TLA active site supplementary subunit)
Sample 1
Control MPP+ DA
Sample 2

CHAPTER IV- MPP+, MPTP AND DA EFFECT ON PURIFIED 20S PROTEASOME
126
E) CORE SUBUNITS α5/α7, β1, β5i, β5, β7
F) ALPHA SUBUNITS α1, 2, 3, 6, 5/7
Figure 4.7. Western blot analysis of 20S core subunits after treatment with 2 mM MPP+ and DA. 2 μg of 20S proteasome (untreated or treated with 2 mM MPP+ /DA) were separated using a pH 3-10 non-linear IPG strip (1st dimension) followed by a 15 % SDS polyacrylamide gel electrophoresis (detailed in section 2.2.9.4). Then protein was transferred to nitrocellulose membrane by Western blotting and probed with antibodies against 20S subunits β5, β4, β2, β6, core subunits (α5/α7, β1,β5i, β5 β7) and alpha subunits (α1, 2, 3, 5, 6 and 7). For further information on the antibodies utilised in this section see Table 2.5 in section 2.2.10.2.2. Primary antibody binding was detected by ECL method as detailed in section 2.2.10.4. All labelled spots were identified by comparing antibodies staining with the theoretical molecular weight and pI from established reference maps of human 20S proteasome. The experiment was repeated three times obtaining similar spot patterns.
MPP+
MPP+
Control β1
DA
DA
Control α5 α3
α2 α1
α6
β5
β5 β
β5
β5
β5
α7
α7
β1
α7
β β7
α5
β7
α7
7
β1 β7
α7
β1 β7
α7
β1 β7
α7
1
α7
Sample 1 Sample 2
α5
α1
α6
α5
α1
α6
α5
α1
α6
α3 α7
α2
α3 α6 α3
α2
α5 α1 α2
α5 α3
α2
α6
α1 α3
α2 Sample 1 Sample 2

CHAPTER IV- MPP+, MPTP AND DA EFFECT ON PURIFIED 20S PROTEASOME
127
4.3 DISCUSSION
4.3.1 MPTP/ MPP+ and DA have a direct effect on 20S proteolytic
activities
Table 4.5 shows a summary of the relative effects of MPP+, MPTP and DA on the
different 20S proteasomal activities with full statistical analysis. Data confirm that
toxins can directly affect 20S activity. Overall, the relative sensitivities of the activities
on the proteasome are as follows:
MPP+: CLA > PLA > TLA
MPTP: PLA > CLA > TLA
DA: CLA > PLA > TLA
However, PLA was more sensitive to high concentrations of MPP+ (ie. 0.5-2 mM) than
CLA. Importantly, TLA appeared to be the least sensitive activity to the toxins. This is
consistent with results in the last chapter (see section 3.2.2) which show a lower
sensitivity of TLA activity in SH-SY5Y cells when treated with MPP+ and DA over a
period of 72 h. Indeed, TLA from purified 20S was unaffected by MPTP. Overall,
toxins decreased proteasomal activity in a dose-dependent manner and DA appeared
more damaging than MPP+ or MPTP to the purified enzyme. In fact, the highest dose of
DA tested ie.2 mM abolished the three proteasomal activities. This is not surprising
since DA and its derivates from autooxidation are strong oxidants and it is well-known
that proteins, and therefore enzymes, can easily be modified resulting in a loss of
function (Szweda et al., 2002; Grune et al., 2003; Elkon et al., 2004). In contrast, the
effects of MPP+ and DA on CLA and PLA were similar in the SH-SY5Y cell model and
overall MPP+ had a greater effect on these activities than DA, suggesting that the non-
direct effects of MPP+on the proteasome are very deleterious to the cells (see section
3.2.2).
To date, this is the first study showing that DA and MPP+ added directly to the 20S
proteasome can cause a reduction in proteasomal activity. Several studies refute direct
effects of certain toxins on the proteasome. For instance, Höglinger et al. (2003)
excluded a direct inhibition of the proteasome by MPP+ and rotenone by measuring
CLA in cell extracts exposed for 10 min to low doses of these toxins. However, their
approach seems incomplete, since the high content of other proteins in the cell extract
CHAPTER IV- MPP+, MPTP AND DA EFFECT ON PURIFIED 20S PROTEASOME
128
may be quenching the effect of the toxins on the proteasome ie. the actual amount of
free toxin in contact with the proteasome might be too low and also the exposure time
of the lysate to the toxin was very short. This is also the case in very recent study, which
reports that treatment of a human neuroblastoma cell line (containing a 26S reporter
system) with several pesticides, including rotenone, reduced 26S proteasome but none
of these pesticides result in direct impairment of 20S activity (Wang et al., 2006).
However, the authors again used cell lysates to monitor the direct effect of these
pesticides. In addition to the fact that the pesticides were used at low concentrations (ie.
1-10μM), one could also argue that since cell lysates will contain 26S proteasomes, they
might not truly be checking the direct effects on the 20S proteasome. Betarbet et al.
(2006) also found that direct incubation of SK-N-MC cell lysates to 10 μM rotenone
had no direct effect on proteasomal activity.
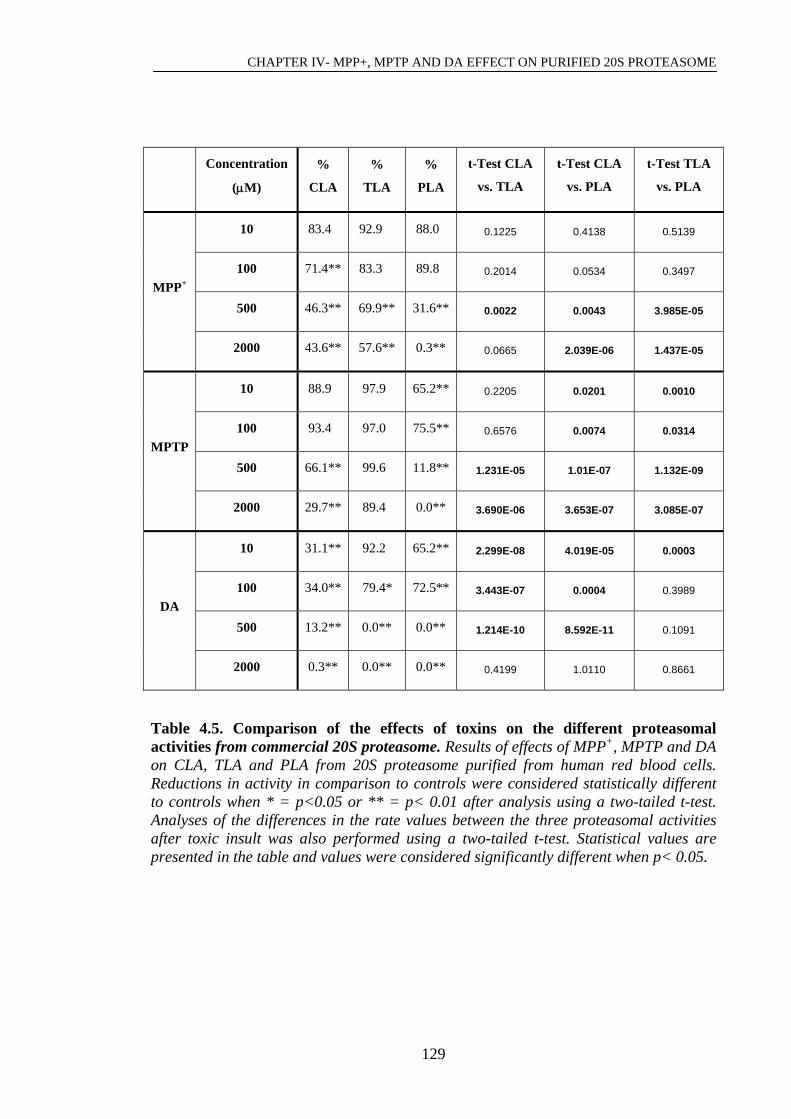
CHAPTER IV- MPP+, MPTP AND DA EFFECT ON PURIFIED 20S PROTEASOME
129
Concentration
(μM)
%
CLA
%
TLA
%
PLA
t-Test CLA
vs. TLA
t-Test CLA
vs. PLA
t-Test TLA
vs. PLA
10 83.4 92.9 88.0 0.1225 0.4138 0.5139
100 71.4** 83.3 89.8 0.2014 0.0534 0.3497
500 46.3** 69.9** 31.6** 0.0022 0.0043 3.985E-05
MPP+
2000 43.6** 57.6** 0.3** 0.0665 2.039E-06 1.437E-05
10 88.9 97.9 65.2** 0.2205 0.0201 0.0010
100 93.4 97.0 75.5** 0.6576 0.0074 0.0314
500 66.1** 99.6 11.8** 1.231E-05 1.01E-07 1.132E-09
MPTP
2000 29.7** 89.4 0.0** 3.690E-06 3.653E-07 3.085E-07
10 31.1** 92.2 65.2** 2.299E-08 4.019E-05 0.0003
100 34.0** 79.4* 72.5** 3.443E-07 0.0004 0.3989
500 13.2** 0.0** 0.0** 1.214E-10 8.592E-11 0.1091
DA
2000 0.3** 0.0** 0.0** 0.4199 1.0110 0.8661
Table 4.5. Comparison of the effects of toxins on the different proteasomal activities from commercial 20S proteasome. Results of effects of MPP+, MPTP and DA on CLA, TLA and PLA from 20S proteasome purified from human red blood cells. Reductions in activity in comparison to controls were considered statistically different to controls when * = p<0.05 or ** = p< 0.01 after analysis using a two-tailed t-test. Analyses of the differences in the rate values between the three proteasomal activities after toxic insult was also performed using a two-tailed t-test. Statistical values are presented in the table and values were considered significantly different when p< 0.05.

CHAPTER IV- MPP+, MPTP AND DA EFFECT ON PURIFIED 20S PROTEASOME
130
4.3.1.1 Direct effect of the toxins on 20S proteasome is partly due to
oxidative modification of the proteasome
It is plausible that the direct effect of the toxins on the 20S proteasome could be due to
oxidative damage to the proteasome. This was confirmed by incubating the proteasome
with the toxins in the presence of vitamin C, a well known antioxidant. Since vitamin C
protected CLA from MPTP, MPP+ and DA toxic insult it is hypothesised that the direct
effects of the toxins on 20S proteasome is partly due to direct oxidative damage to the
proteasome itself. Our findings support the study by Shamoto-Nagai et al. (2003), who
found a decrease in proteasome activity in rotenone-treated cells together with oxidative
modification of the proteasome itself and aggregation with other proteins. Nevertheless,
this study did not look at the direct effect of rotenone on 20S activity per se. Moreover,
Reinheckel et al. (1998) found that several oxidants that appear to play major roles in
biological systems inhibited the activity of the 20S proteasome in a concentration-
dependent manner. It is noteworthy that in our studies, low doses of vitamin C (10 μM)
were enough to protect the proteasome from MPTP/MPP+ toxicity whilst higher doses
(ie. 100 μM) were required to protect the 20S from DA, indicating that DA is a stronger
oxidant.
4.3.1.2 The proteasome is slightly more sensitive to DA than a general
protease
As discussed before, proteins and therefore proteases are inheritently susceptible to
oxidative damage but, is the proteasome more susceptible to toxic insult and oxidative
damage than other proteases? Our results comparing proteasomal TLA with its
counterpart, trypsin enzyme, indicates that although MPP+ had a similar effect on both
enzymes, the proteasome was more susceptible to DA insult than trypsin. Since DA is a
stronger oxidant than MPP+ and MPTP, it seems that the proteasome is more sensitive to
oxidative damage than the trypsin enzyme. Studies also showed that vitamin C
protected trypsin enzyme from DA toxicity. It is possible that either the β-subunits
themselves, the α−subunits, or local factors surrounding the trypsin-like active centre of
the 20S proteasomal core are more affected by oxidative damage than trypsin.

CHAPTER IV- MPP+, MPTP AND DA EFFECT ON PURIFIED 20S PROTEASOME
131
4.3.2 Structural modification of the 20 S α and β subunits by the
toxins
Further analysis using 2D-SDS-PAGE fractionation and silver staining did not reveal
major changes in the position of subunits following exposures to toxins in vitro. Some
changes were found in the relative position of the β5 subunit, however this change also
occurred in the control sample suggesting that different batches of 20S proteasome to be
responsible (as stated in the data sheet of the product (code PW8729; purchased from
Biomol International, Exeter, UK) batches will vary in their exact composition and
activities).
The subunit mapping performed in our 2D gels was initially purely theoretical and
based on previous data available regarding isoelectric points and molecular weights of
the different 20S proteasomal subunits. However, the identity of some of the spots was
confirmed by MALDI-TOF mass spectroscopy (ie. subunits β4-7, α1 and α3).
Western blotting analysis using specific antibodies against the different subunits of the
core proteasome complex revealed that several α- and β-subunits were modified by DA
in a way that the antibodies no longer recognised the epitopes of the proteins. Table 4.5
summarises the changes in immunoreactivity of the proteasomal subunits following
toxin treatment. Treatment of the 20S proteasome with 2 mM DA caused a loss in the
detection of the CLA-related subunit β4; in the TLA-related subunits β2 and β6 but not
in the PLA subunits (β1 and β7). In contrast, MPP+ caused no change in detection of
any of the subunits. Thus loss of reactivity did not match loss of activity since all three
activities were abolished by 2 mM DA and CLA and PLA were abolished by MPP+. DA
decreased the detection of α1, α2, α3 and α6, whilst no change occurred on α5 and α7.
Since the α-subunits are thought to play an important role in maintaining the stability of
the enzymatic complex (DeMartino and Slaughter, 1999; Ferrell et al., 2000),
modification of these subunits might also be responsible for the loss of activity of the
20S proteasome. On the other hand, no change in any α-subunit was observed after
treatment of the proteasome with MPP+.
The above data suggest that the approach used might either not be detecting more subtle
changes which may be occurring in the subunits or, such changes occurred in epitopes
that are not recognised by the antibodies,. Moreover, it was shown in section 4.2.2.2

CHAPTER IV- MPP+, MPTP AND DA EFFECT ON PURIFIED 20S PROTEASOME
132
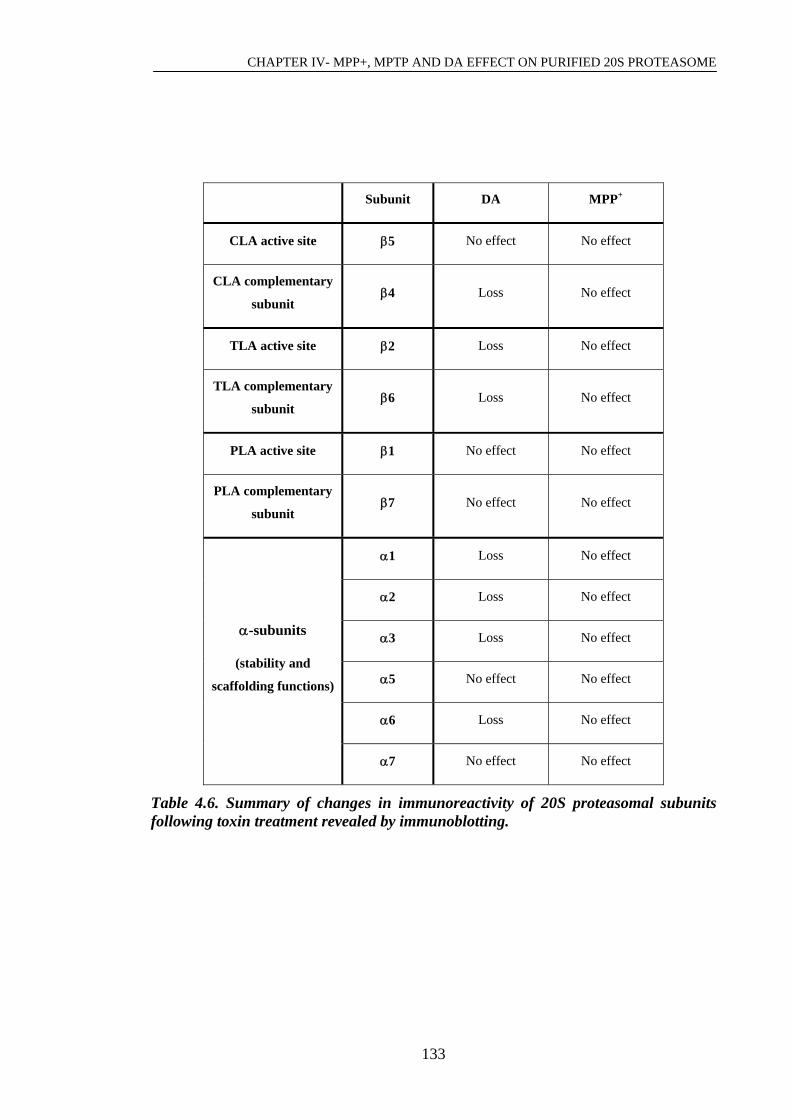
CHAPTER IV- MPP+, MPTP AND DA EFFECT ON PURIFIED 20S PROTEASOME
133
Subunit DA MPP+
CLA active site β5 No effect No effect
CLA complementary
subunit β4 Loss No effect
TLA active site β2 Loss No effect
TLA complementary
subunit β6 Loss No effect
PLA active site β1 No effect No effect
PLA complementary
subunit β7 No effect No effect
α1 Loss No effect
α2 Loss No effect
α3 Loss No effect
α5 No effect No effect
α6 Loss No effect
α-subunits
(stability and
scaffolding functions)
α7 No effect No effect
Table 4.6. Summary of changes in immunoreactivity of 20S proteasomal subunits following toxin treatment revealed by immunoblotting.

134

CHAPTER V
EFFECTS OF PD MIMETICS ON
NEUROFILAMENT TURNOVER IN
SHSY-SY CELLS
CHAPTER V- EFFECTS OF PD MIMETICS ON NF TURNOVER IN SH-SY5Y CELLS
135
5. EFFECTS OF PD MIMETICS ON NEUROFILAMENT
TURNOVER
5.1 INTRODUCTION
5.1.1 Presence of NFs in LB
As indicated in the main introduction, LBs contain α- synuclein (Giasson et al., 2000),
ubiquitin and ubiquitinated proteins (Lowe et al., 1988) and also misfolded tubulin
(Galloway et al., 1992), components of the UPS (e.g. proteasomal subunits,
ubiquitination/ de-ubiquitination enzymes and proteasome activators; McNaught et al.,
2002a) and all three NF subunits (Forno et al., 1986, Galloway et al., 1988; Galvin et
al., 1997). Of the three NF proteins, NF-H and NF-M are most commonly associated
with LBs (Pollanen et al., 1993), with an abundance of the phosphorylated forms of
these proteins (Forno et al., 1986; Smith et al., 1991).
Axonal transport is essential for normal neuronal function, therefore its impairment may
be damaging to the cell. Indeed, blockage of axonal transport can lead to the
development of aberrant inclusions within the cell body, typical of several
neurodegenerative disorders such as dementia with Lewy bodies, AD or PD (Petzold,
2005). The presence of both cytoskeletal proteins and ubiquitin / ubiquitinated proteins
within the LB suggests that impaired protein catabolism (ie. the UPS) might also be
linked to the abnormal accumulation of these proteins in neurological diseases and in
particular PD. Indeed, it has been found that normal segregation of highly
phosphorylated NFs in axons is disrupted in some neurons in pathological states
associated with perikaryal accumulation of neurofilaments (Hirokawa and Takeda,
1998; Nixon R.A. 1998; Yabe et al. 2001). Interestingly, phosphorylation of NFs
promotes their dissociation from kinesin motors (Yabe and Shea, 2000).
A direct link between aberrations in the cytoskeleton and PD was provided by the
identification of a point mutation in the gene coding for NF-M in a patient with early-
onset severe PD (Lavedan et al., 2002). However, the relevance of this mutation in PD
is not clear since Kruger et al. (2003) reported that mutations in the NF-M gene may
increase susceptibility to develop PD but do not play a major role in the disease.
CHAPTER V- EFFECTS OF PD MIMETICS ON NF TURNOVER IN SH-SY5Y CELLS
136
5.1.2 Effect of neurotoxins on NF expression and post-translational
modifications
As introduced earlier, aberrant cytoskeletal expression and altered post-translational
modifications in cytoskeletal proteins are associated with neuropathological processes
(discussed by D’Andrea et al., 2001) linked with changes in cell morphology and
possibly with the appearance of protein aggregates (reviewed by Xiao et al., 2006).
Most current in vitro studies investigating LB-like inclusions are focused on α-
synuclein (Gomez-Santos et al., 2002, 2003, 2005; Matsuzaki et al., 2004) or parkin
accumulation (Zhao et al., 2003; Muquit et al., 2004); however, very little data are
available regarding aberrant NF accumulation and phosphorylation in in vitro PD
models.
Nevertheless, several in vitro studies have reported that certain toxins can induce
abnormal accumulation and phosphorylation of NFs. For example, treatment with
acrylamide and 2,5-hexadione resulted in the accumulation of NFs in the perikarya of
non-differentiated SH-SY5Y cells (Hartley et al., 1997). Shea and his co-workers
reported that aluminium treatment of neuronal cells led to extensive NF-H
phosphorylation (Shea et al., 1995) forming filamentous inclusions in the perikaryon of
the cell (Shea et al., 1997).
Of relevance to PD, Masaki et al. (2000) reported that proteasome inhibition with
lactacystin over a period of 24 h resulted in an increase in phosphorylated NF-H and
NF-M, which was associated with increased activities of the stress activated kinases
JNK but no change in CDK-5 activity in PC12h cells. In addition, in our laboratory, De
Girolamo et al. (2000) showed that treatment of differentiated mouse N2a
neuroblastoma cells with subcytotoxic concentrations of MPTP (ie. 10 μM) led to
increased levels of pNF-H; moreover immunofluorescence analyses revealed that pNF-
H accumulate in the perikaryon suggesting that MPTP treatment altered NF-H
distribution concomitant with a change in cell morphology. More recently, this has
been reported to be associated with a transient increase in JNK activity in the presence
of sustained ERK activity (De Girolamo and Billett, 2006). However, with high
concentrations of MPTP (ie. 5 mM) JNK activation is sustained whilst ERK is inhibited
(De Girolamo and Billett, 2006).

CHAPTER V- EFFECTS OF PD MIMETICS ON NF TURNOVER IN SH-SY5Y CELLS
137
5.1.3 Degradation of NFs
Estimates of the half life of NFs vary between approximately 20 days (Nixon and
Logvinenko, 1986) and 0.5-1.0 year (Lee and Cleveland, 1996). Their long life makes
NFs more prone to a build up of damage by oxidative stress and possibly their
accumulation in pathological states. Phosphorylation of NFs has been reported to
decrease the susceptibility of NFs to degradation (Sternberg and Sternberg, 1983),
perhaps due to the fact that pNFs are are poorer substrates for calpain (Pant et al.,
1988).
Indeed, calcium-activated neutral proteases (i.e. calpains) that locate along the axon are
thought to be the proteolytic enzymes which primarily mediate NF breakdown,
suggesting that calpains might play a crucial role in neurodegeneration (Kupina et al.,
2003; Kunz et al., 2004). Both μ- and m-calapins are present in axons (Stys et al., 2002;
Kupina et al., 2003) and are involved in NF degradation (Nixon, 1986). This is further
supported by studies suggesting that NFs are degraded by calpains in axons undergoing
Wallerian degeneration (discussed by Nixon and Logvinenko 1986).
Lysosomal degradation of NF proteins has also been reported. Indeed, cathepsin D has
been shown to degrade NFs in rat, bovine and human tissue (Nixon and Marotta, 1984).
Moreover, it has also been reported that NFs can be cleaved by trypsin and α-
chymotrypsin (Chin et al., 1983; Fasani et al., 2004).
Finally, limited evidence also involves the UPS with NFs degradation. Gou and
Leterrier (1995) showed that incubation of purified radiolabeled NFs with a soluble rat
brain fraction containing the enzymes necessary for ubiquitin dependent degradation of
proteins resulted in degradation of NFs when ATP and ubiquitin were added.
5.1.4 Aims of chapter
Since NFs are one of the major components of LBs and the activity of the UPS is
reduced in PD, the first aim of this study was to determine whether NFs undergo
proteasomal degradation, either under normal or under stressed conditions in human
dopaminergic SH-SY5Y cells. The limited data available about the possible
proteasomal degradation of NFs were achieved using rat brain homogenates (Gou and
Leterrier, 1995) and no information is available in human tissues/cells.

CHAPTER V- EFFECTS OF PD MIMETICS ON NF TURNOVER IN SH-SY5Y CELLS
138
The role of the proteasome in NF turnover was examined using the specific proteasome
inhibitor lactacystin and Western blotting. In order to simplify the analysis new protein
synthesis was inhibited by cycloheximide. The effects of artificially reducing
glutathione levels to promote a more oxidative environment on NF turnover were also
studied.
In previous chapters it is clear that complex I inhibition leads to proteasome
dysfunction. Previous published work has indicated that (a) complex I inhibition alters
NF phosphorylation and distribution in a manner that may be relevant for PD (De
Girolamo et al, 2000; De Girolamo and Billett, 2006) and (b) proteasome inhibitors can
also affect NF phosphorylation (Giasson and Mushynski, 1995; Masaki et al., 2002).
Thus the second aim was to study the effect of different concentrations of MPP+ and
also DA on NF levels and phosphorylation in my human cell model. Moreover, since
calpain is reported to be the major protease involved in the degradation of NF proteins
(Stys and Jiang, 2002; Kupina et al., 2003; Kunz et al., 2004) the effect of calpain
inhibition on mitotic SH-SY5Y cells exposed to high doses of MPP+ and DA was also
studied.
Finally, since neurodegeneration is a chronic process and recent work with rotenone
indicates that, following long-term exposure, insoluble inclusions of synuclein
accumulate (Sherer et al. 2001), it is of interest to study the effect of chronic exposure
to low levels of DA and MPP+ on NF profiles and post-translational modifications.
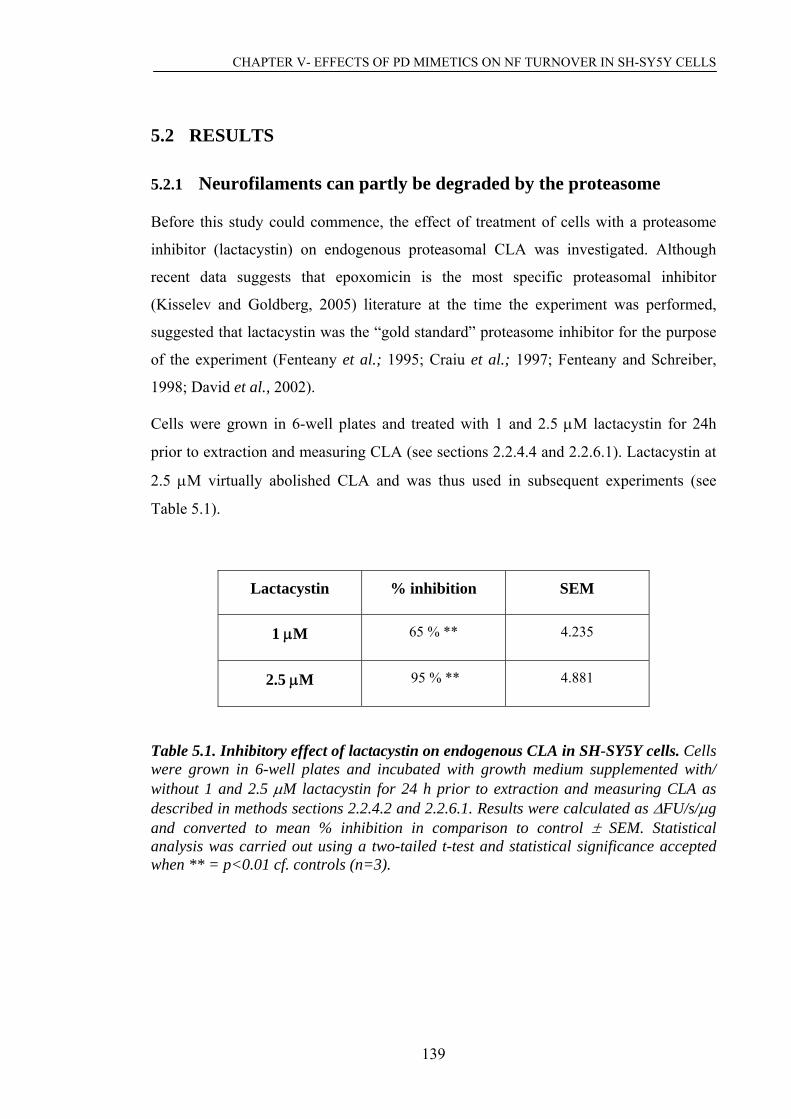
CHAPTER V- EFFECTS OF PD MIMETICS ON NF TURNOVER IN SH-SY5Y CELLS
139
5.2 RESULTS
5.2.1 Neurofilaments can partly be degraded by the proteasome
Before this study could commence, the effect of treatment of cells with a proteasome
inhibitor (lactacystin) on endogenous proteasomal CLA was investigated. Although
recent data suggests that epoxomicin is the most specific proteasomal inhibitor
(Kisselev and Goldberg, 2005) literature at the time the experiment was performed,
suggested that lactacystin was the “gold standard” proteasome inhibitor for the purpose
of the experiment (Fenteany et al.; 1995; Craiu et al.; 1997; Fenteany and Schreiber,
1998; David et al., 2002).
Cells were grown in 6-well plates and treated with 1 and 2.5 μM lactacystin for 24h
prior to extraction and measuring CLA (see sections 2.2.4.4 and 2.2.6.1). Lactacystin at
2.5 μM virtually abolished CLA and was thus used in subsequent experiments (see
Table 5.1).
Lactacystin % inhibition SEM
1 μM 65 % ** 4.235
2.5 μM 95 % ** 4.881
Table 5.1. Inhibitory effect of lactacystin on endogenous CLA in SH-SY5Y cells. Cells were grown in 6-well plates and incubated with growth medium supplemented with/ without 1 and 2.5 μM lactacystin for 24 h prior to extraction and measuring CLA as described in methods sections 2.2.4.2 and 2.2.6.1. Results were calculated as ΔFU/s/μg and converted to mean % inhibition in comparison to control ± SEM. Statistical analysis was carried out using a two-tailed t-test and statistical significance accepted when ** = p<0.01 cf. controls (n=3).
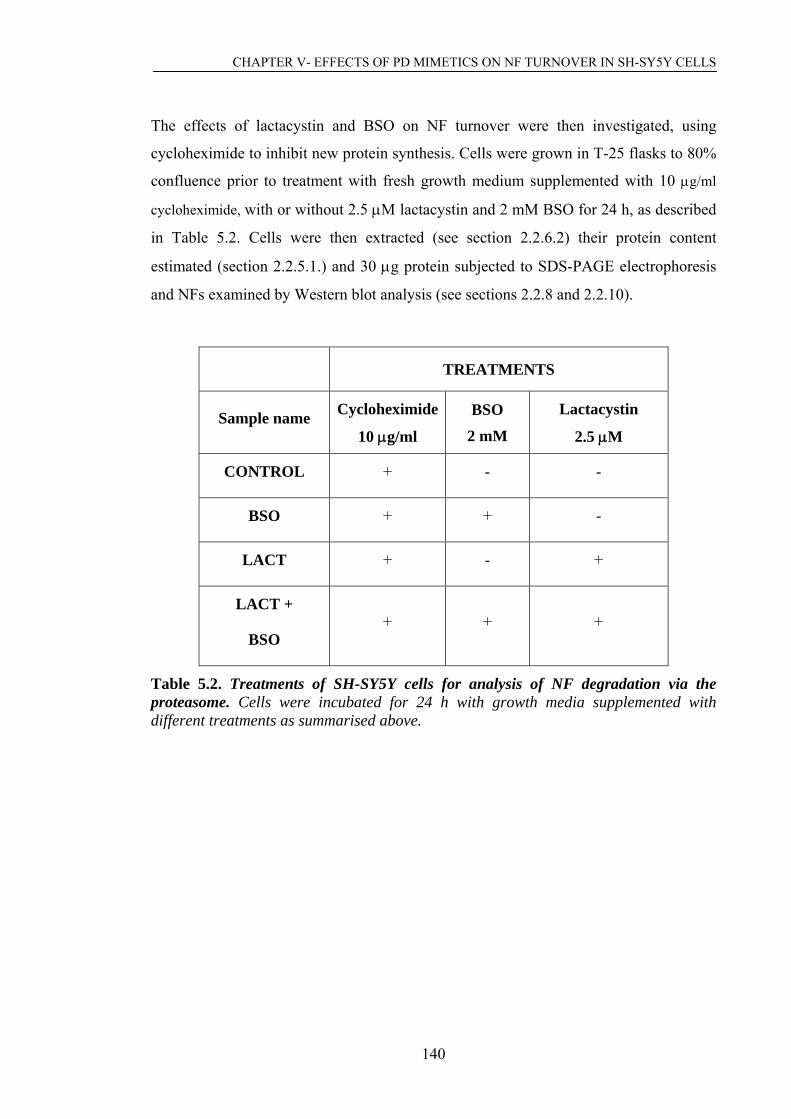
CHAPTER V- EFFECTS OF PD MIMETICS ON NF TURNOVER IN SH-SY5Y CELLS
140
The effects of lactacystin and BSO on NF turnover were then investigated, using
cycloheximide to inhibit new protein synthesis. Cells were grown in T-25 flasks to 80%
confluence prior to treatment with fresh growth medium supplemented with 10 μg/ml
cycloheximide, with or without 2.5 μΜ lactacystin and 2 mM BSO for 24 h, as described
in Table 5.2. Cells were then extracted (see section 2.2.6.2) their protein content
estimated (section 2.2.5.1.) and 30 μg protein subjected to SDS-PAGE electrophoresis
and NFs examined by Western blot analysis (see sections 2.2.8 and 2.2.10).
TREATMENTS
Sample name Cycloheximide
10 μg/ml
BSO
2 mM
Lactacystin
2.5 μM
CONTROL + - -
BSO + + -
LACT + - +
LACT +
BSO + + +
Table 5.2. Treatments of SH-SY5Y cells for analysis of NF degradation via the proteasome. Cells were incubated for 24 h with growth media supplemented with different treatments as summarised above.
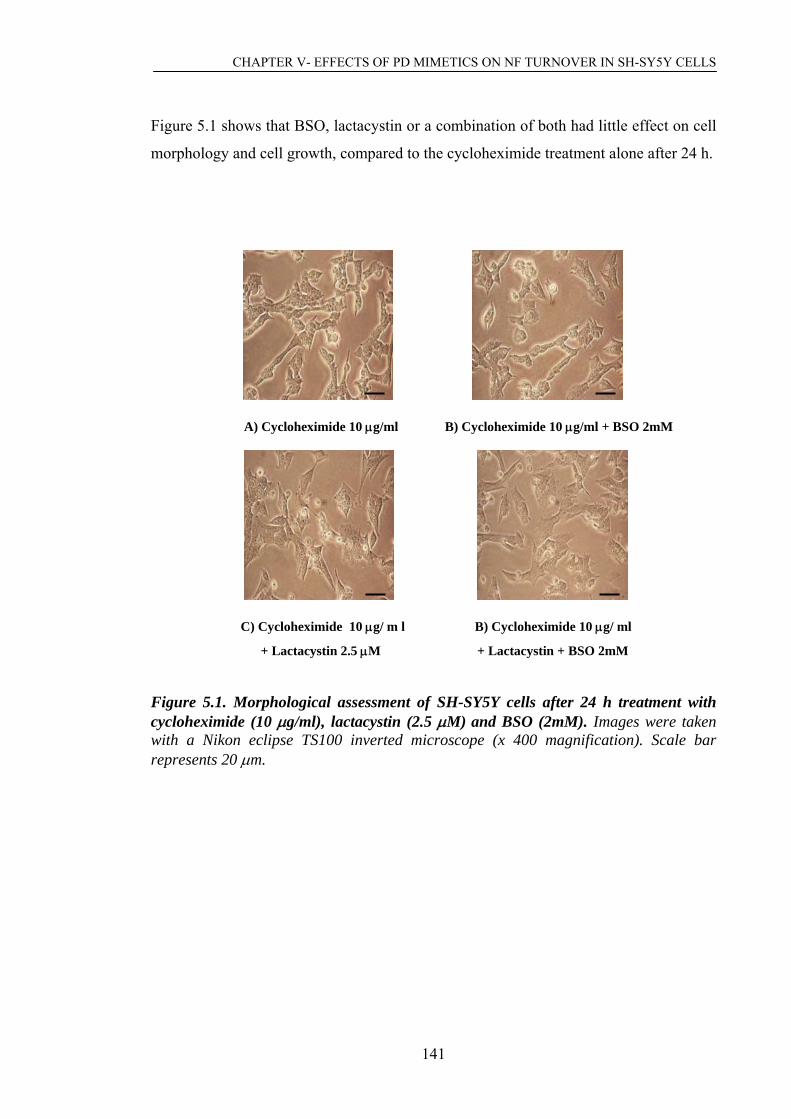
CHAPTER V- EFFECTS OF PD MIMETICS ON NF TURNOVER IN SH-SY5Y CELLS
141
Figure 5.1 shows that BSO, lactacystin or a combination of both had little effect on cell
morphology and cell growth, compared to the cycloheximide treatment alone after 24 h.
A) Cycloheximide 10 μg/ml B) Cycloheximide 10 μg/ml + BSO 2mM
C) Cycloheximide 10 μg/ m l B) Cycloheximide 10 μg/ ml
+ Lactacystin 2.5 μM + Lactacystin + BSO 2mM
Figure 5.1. Morphological assessment of SH-SY5Y cells after 24 h treatment with cycloheximide (10 μg/ml), lactacystin (2.5 μM) and BSO (2mM). Images were taken with a Nikon eclipse TS100 inverted microscope (x 400 magnification). Scale bar represents 20 μm.
CHAPTER V- EFFECTS OF PD MIMETICS ON NF TURNOVER IN SH-SY5Y CELLS
142
Total NF-H status was studied using the commercial neurofilament 200 monoclonal
antibody (clone N52). It is said to be phosphorylation independent and therefore does
not discriminate between phosphorylated and de-phosphorylated epitopes of NF-H. The
N52 antibody gives rise to a doublet in which the two bands do not always separate. On
the other hand, specific neurofilament phosphorylation was assessed using SMI 31,
which detects hyperphosphorylated NF-H and NF-M epitopes (pNF-H and pNF-M,
respectively).
Proteasome inhibition by lactacystin led to an increase in total NF-H after 24 h; such
accumulation was further increased when both lactacystin and BSO were added (Figure
5.2A). However, proteasome inhibition with lactacystin in the presence or absence of
BSO did not increase phosphorylated NF-M and NF-H levels or change significantly
the ratio between these two phosphorylated subunits. In mitotic SH-SY5Y cells the
normal ratio of pNF-H to pNF-M in control cells averaged at 0.7 (panel B).
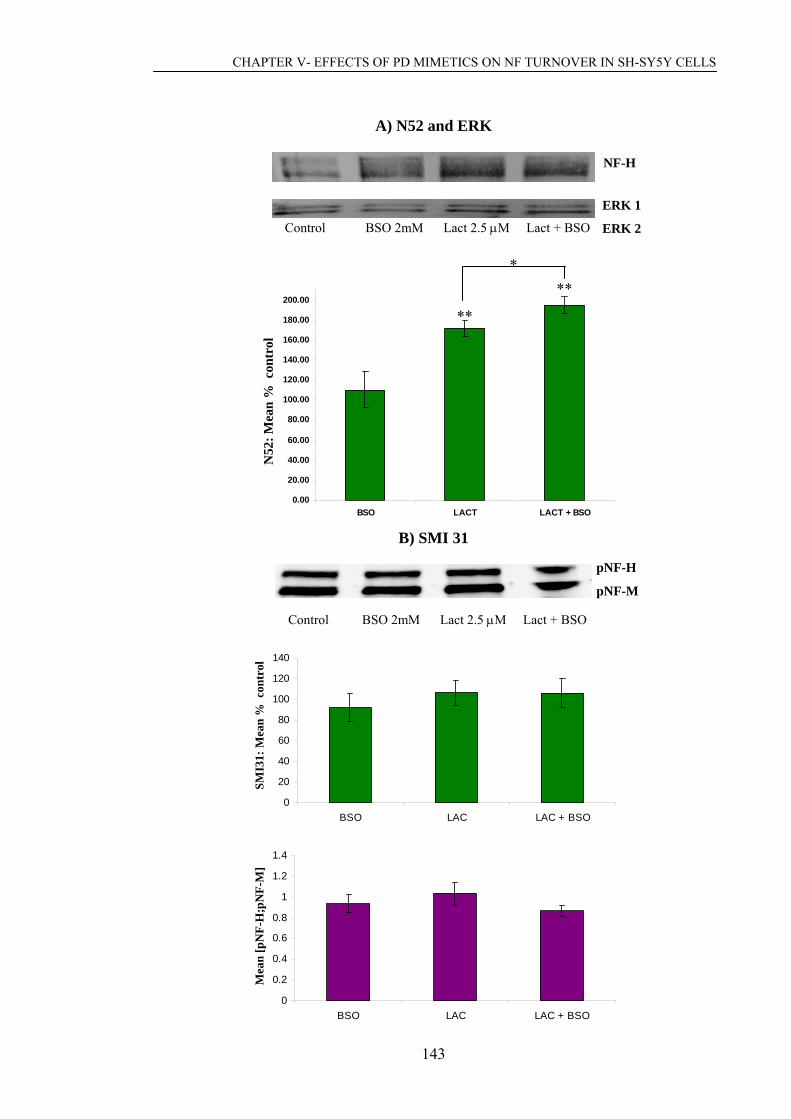
CHAPTER V- EFFECTS OF PD MIMETICS ON NF TURNOVER IN SH-SY5Y CELLS
143
A) N52 and ERK
NF-H
ERK 1
ERK Control BSO 2mM Lact 2.5 μM Lact + BSO 2
0.00
20.00
40.00
60.00
80.00
100.00
120.00
140.00
160.00
180.00
200.00
BSO LACT LACT + BSO
N52
: % m
ean
ca. c
ontr
ols
B) SMI 31
0
20
40
60
80
100
120
140
BSO LAC LAC + BSO
Mea
n %
SM
I 31
ca. c
ontr
ols
0
0.2
0.4
0.6
0.8
1
1.2
1.4
BSO LAC LAC + BSO
Mea
n [N
F-H:
NF-M
]
**
** *
pNF-H
pNF-M
Control BSO 2mM Lact 2.5 μM Lact + BSO
N52
: Mea
n %
con
trol
SM
I31:
Mea
n %
con
trol
M
ean
[pN
F-H
;pN
F-M
]

CHAPTER V- EFFECTS OF PD MIMETICS ON NF TURNOVER IN SH-SY5Y CELLS
144
Figure 5.2. Western blot analysis of NF proteins in mitotic cells after 24 h exposure to proteasome inhibitors and/or BSO. Cells were grown in T-25 flasks, treated as detailed in table 5.2 for 24h and extracted as detailed in section 2.2.4.1. Proteins were separated by SDS-PAGE, transferred to nitrocellulose by western blotting (see sections 2.2.8 and 2.2.10) and probed with N52 (1:500), SMI 31 (1:1000) and anti total ERK 1/ 2 (1:500). Primary antibody binding was detected by alkaline phosphatase(N52 and total ERK; see section 2.2.10.3) and ECL (SMI 31; see section 2.2.10.4, respectively) Bands were corrected against total ERK (N52 blot) or protein copper staining (SMI31 blot) for differences in protein loading and band intensity was quantified as detailed in section 2.2.10.6. Results are presented as mean % of controls ± SEM or ratio between pNF-H: pNF-M ± SEM. Statistical analyses were carried out using a two-tailed t-test and statistical significance accepted when * = p<0.05 cf. controls (n=3). Control samples were assigned an intensity value of 100 % for N52 or SMI 31 reactivity or 1 for the ratio of pNF-H: pNF-M.

CHAPTER V- EFFECTS OF PD MIMETICS ON NF TURNOVER IN SH-SY5Y CELLS
145
5.2.2 Changes in NF profiles following exposure to MPP+
In this section, the effects of different concentrations of MPP+ on NF profiles are
analysed by Western blotting (see sections 2.2.8 and 2.2.10) and immunoprobing of the
samples with antibodies against NF proteins (N52 and SMI 31, see sections 2.1.3.1 and
3.3.10.2). BSO was also used together with the toxin in order to mimic the glutathione
depletion that occurs in PD. In these experiments cycloheximide was included in the
growth medium.
Figure 5.3A shows that BSO, 100 μM MPP+ or both together did not affect either total
NF-H levels or total phosphorylated NF-H + NF-M levels in comprison to controls at
any time tested (ie. 48 and 72 h). However, 100 μM MPP+ increased the ratio of pNF-H:
pNF-M in comparison to controls; the addition of BSO did not further increase this ratio
in comparison to the MPP+ treatment.
When MPP+ was used at 500 μM (Figure 5.3B), in the presence or absence of BSO,
there was no significant change in total NF-H in comparison to control over 72h. As
before, BSO alone did not affect NF profiles. However, 500 μM MPP+ with and without
BSO increased the levels of total phosphorylated NF-H in comparison to controls after
72h exposure and also the ratio between pNF-H: pNF-M after 48h and 72h.

CHAPTER V- EFFECTS OF PD MIMETICS ON NF TURNOVER IN SH-SY5Y CELLS
146
A) 100 μM MPP+ i) BLOTS
Antibodies N52
NF-H
SMI
Total
ii) QUANTIFICATION
0.0
20.0
40.0
60.0
80.0
100.0
120.0
140.0
Control BSO 2mM MPP+ 100uM BSO + MPP+
mea
n %
N52
ca.
con
trol
48 h72 h
0.0
20.0
40.0
60.0
80.0
100.0
120.0
140.0
Control BSO 2mM MPP+ 100uM BSO + MPP+
mea
n %
SM
I 31
ca. c
ontro
l
48 h72 h
0.0
0.2
0.4
0.6
0.8
1.0
1.2
1.4
1.6
Control BSO 2mM MPP+ 100uM BSO + MPP+
mea
n [p
NF-
H: p
NF-M
]
48 h72 h
* ***
**
48 h 72 h
Total NF-H (N52)
100 μM + BSO Control BSO 2mM MPP+ MPP+ Control BSO 2mM MPP+ MPP+
ERK
pNF-H
pNF-M
ERK 1
ERK 2
100 μM + BSO
N52
: Mea
n %
of
cont
rol
N52
: Mea
n %
of
cont
rol
pNF-H+ pNF-M (SMI31)
pNF-H: pNF-M (SMI31)
SMI3
1: M
ean
% o
f co
ntro
l M
ean
[pN
F-H
;pN
F-M
] SM
I31:
Mea
n %
of
cont
rol
Mea
n [p
NF-
H;p
NF-
M]
N52
: Mea
n %
con
trol
M
ean
[pN
F-H
;pN
F-M
] SM
I31:
Mea
n %
con
trol

CHAPTER V- EFFECTS OF PD MIMETICS ON NF TURNOVER IN SH-SY5Y CELLS
147
ii) BLOTS
ii) QUANTIFICATION
0.0
20.0
40.0
60.0
80.0
100.0
120.0
140.0
160.0
Contro SO + MPP+
ca.
con
trol
s
l BSO 2 mM MPP+ 500 uM B
N52
Mea
n %
24 h48 h72 h
0.0
50.0
100.0
150.0
200.0
Control BSO 2 mM MPP+ 500 uM BSO + MPP+
SMI 3
1 M
ean
% c
a. c
ontr
ols
24 h48 h72 h
0.000
0.300
0.600
0.900
1.200
1.500
1.800
2.100
Control BSO 2 mM MPP+ 500 uM BSO + MPP+
Mea
n [p
NF-H
: pNF
-M]
24 h48 h72 h
24 h
NF-H
pNF-H
pNF-M
48 h 72 h
ERK 1
ERK 2
* * *
**
**
N52
SMI 31
Control BSO MPP+ MPP+ Control BSO MPP+ MPP+ Control BSO MPP+ MPP+ 500 500 μM + BSO 500 μM + BSO
Total ERK
Antibodies
Total NF-H (N52)
pNF I31)
pNF-H: F-M
B) 500 μM MPP+
μM + BSO
*
-H + pNF-M (SM
pN
N52
: M %
con
trol
SM
I31:
Mea
n %
con
trol
M
ean
[pN
F-H
;pN
F-M
] ea
n
CHAPTER V- EFFECTS OF PD MIMETICS ON NF TURNOVER IN SH-SY5Y CELLS
148
Figure 5.3. Changes in NF profiles after 24, 48 and 72 h exposure to 100 μM and 500 μM MPP+ in SH-SY5Y cells. Cells were grown in T-25 flasks, treated with cycloheximide (10 μg/ml; control) +/- 100 M (panel A) or 500 μM (panel B) MPP+ and/ or BSO for 24, 48 and 72 h. Proteins were extracted (section 2.2.4.1) and eparated by SDS-PAGE, transferred to nitrocellulose by western blotting (see sections .2.8 and 2.2.10) and probed with N52 (1:500), SMI 31 (1:1000) and anti total ERK 1/
2 (1:500). Primary antibody binding was detected by alkaline phosphatase (N52 and tal ERK) and ECL (SMI31; section 2.2.10.3 and 2.2.10.4, respectively) and band
intensity was quantified as detailed in section 2.2.10.6. Bands were corrected against tal ERK for differences in protein loading. Results are presented as mean % of
controls ± SEM or ratio between pNF-H: pNF-M ± SEM. Statistical analyses were arried out using a two-tailed t-test and statistical significance accepted when * =
p<0.05 or ** = p< 0.01 cf. controls (n=3).Control samples were assigned an intensity alue of 100 % for N52 or SMI31 reactivity or 1 for the ratio of pNF-H: pNF-M .
μ
s2
to
to
c
v
CHAPTER V- EFFECTS OF PD MIMETICS ON NF TURNOVER IN SH-SY5Y CELLS
149
5.2.3 Changes in NF profiles following exposure to MPP+, DA and
protease inhibitors
In this section, the effects of proteasome and calpain inhibitors on NF profiles treated
with high doses of MPP+ and DA were investigated. As before, cycloheximide was
included in the growth medium.
Figure 5.4 shows that inhibition with 2.5 μM lactacystin led to the accumulation of total
NF-H, this time, after a 72 h treatment. As before, phosphorylated NF-M and NF-H did
not accumulate with lactacystin and the ratio between pNF-H: pNF-M did not change
either. Since it was not possible to optimise the fluorogenic assay for measuring calpain
activity in our cell system, MDL 28,170 (10 μM) was utilised to inhibit endogenous
calpain activity (based on Wang et al., 1996; who used MDL 28,170 to inhibit calpain
in SH-SY5Y cells). As for lactacystin, calpain inhibition with MDL 28,170 resulted in
accumulation of total NF-H but not phosphorylated NF-M and NF-H.
Figure 5.4 also shows that 2 mM MPP+ not only increased total levels of pNF-M +
pNF-H but also the ratio between pNF-H: pNF-M as seen previously with 500 μM
MPP+. However, 2 mM MPP+ also increased the levels of NF-H, contrary to the
situation with 500 μM MPP+. Treatment with 500 μM DA decreased both
phosphorylated and total NF levels. Interestingly, with N52, a smear of NF-H can be
seen up to the top of the gel in the DA lane, probably due to protein aggregation.
Addition of lactacystin or MDL 28,170 did not further increase total NF-H , [pNF-H +
pNF-M] or the ratio between pNF-H:pNF-M in MPP+ treated-cells. However, in DA-
treated cells addition of MDL 28,170 increased total NF-H levels in comparison to the
DA control.
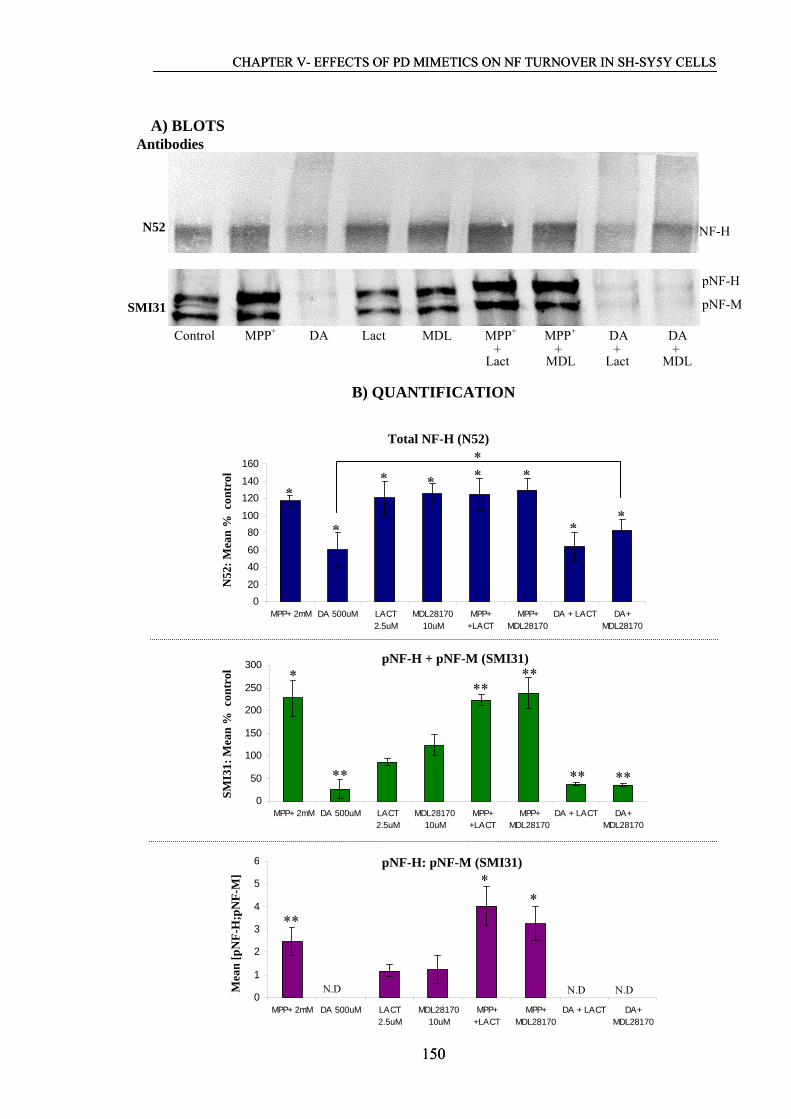
CHAPTER V- EFFECTS OF PD MIMETICS ON NF TURNOVER IN SH-SY5Y CELLS
150
CHAPTER V- EFFECTS OF PD MIMETICS ON NF TURNOVER IN SH-SY5Y CELLS
150
A) BLOTS
Antibodies
B) QUANTIFICATION
020
4060
80100
MPP+ 2mM DA 500uM LACT2.5uM
MDL2817010uM
MPP++LACT
MPP+MDL28170
DA + LACT DA+MDL28170
Mea
n %
N52
ca.
120140
160
ontro
l c
0
250
MPP+ 2mM DA 500uM LACT2.5uM
MDL2817010uM
MPP++LACT
MPP+MDL28170
DA + LACT DA+MDL28170
n
50
100
150
200
Mea
% S
MI 3
1 ca
. co
300
trol
n
0
1
2
3
4
5
6
MPP+ 2mM DA 500uM LACT2.5uM
MDL2817010uM
MPP++LACT
MPP+MDL28170
DA + LACT DA+MDL28170
Mea
n [N
FH
:NF
M]
Control MPP+ DA Lact MDL MPP+ MPP+ DA DA + + + +
Lact MDL Lact MDL
NF-H
N.D N.D N.D
** *
*
**
****
**
** ** **
**
pNF-H
* **
pNF-M
* Total NF-H (N52)
31
pNF-H + pNF-M (SMI31)
N
SMI
Mea
n [
pN
F-H
:pN
F-M
]
pNF-H: pNF-M (SMI31)
52 M
ean
[pN
F-H
;pN
F-M
] t
con
trol
ro
l N
52: M
ean
%SM
I31:
Mea
n %
con

CHAPTER V- EFFECTS OF PD MIMETICS ON NF TURNOVER IN SH-SY5Y CELLS
151
Figure 5.4. Effect of proteasome a ition on NF profiles after toxic insult. Cells were grown in T-25 flasks, treated with cycloheximide 10 μg/ml (control cells) and 2 mM MPP+ or 500 μM DA with or without 2.5 μM lactacystin or 10 μM MDL 28,170 for 72 h and extracted as detailed in section 2.2.4.1. Proteins were separated by SDS-PAGE, transferred to nitrocellulose by western blotting (see sections 2.2.8 and 2.2.10) and probed with N52 (1:500) and SMI 31 (1:1000). Primary antibody binding was detected by alkaline phosphatase (N52) and ECL (SMI31; section 2.2.10.3 and 2.2.10.4, respectively) and band intensity was quantified as detailed in section 2.2.10.6. Bands were corrected against copper staining of the proteins for differences in protein. Results are presented as mean % of controls ± SEM or ratio between pNF-H: pNF-M ± SEM. Statistical analyses were carried out using a two-tailed t t and statistical significance accepted when * toxin-treated control =3). Contr tensity value of 100 % for N52 or SMI31reactivity or 1 for the ratio of F-H NF-M . N.D= not detected
nd calpain inhib
-tes= p<0.05 or ** = p< 0.01 cf. untreated or
ol samples were assigned an ins (n pN : p

CHAPTER V- EFFECTS OF PD MIMETICS ON NF TURNOVER IN SH-SY5Y CELLS
152
5.2.4 Effects of 100 μM and 2 mM MPP+ on NFs distribution
munocytochemistry was performed on cells treated with MPP+ for 72 h. Cells were
xed in methanol and then permeabilised using triton X-100 as detailed in section
.2.12. The distribution of phosphorylated NF-H and NF-M was visualised by probing
ith SMI 31.
efore visualising the NF proteins on the confocal microscope (section 2.2.11), cell
orphology was studied using a phase contrast microscope. As Figure 5.5A shows,
orphology between control cells (panel A, top) and
aining following MPP+ treatment (panel B middle and bottom).
munocytochemical analysis of cells stained with SMI31 revealed that phosphorylated
Im
fi
2
w
B
m
there were no gross changes in m
cells rem
Im
NF-M and NF-H were evenly distributed in both the cell body and axon-like processes
(Figure 5.5, top right panel). However, treatment of the cells with either 100 μM or 2
mM MPP+ resulted in a greater staining in the cell body compared to axon-like
processes and concentration around the nucleus (Figure 5.5B middle and bottom right
panel, yellow stain indicates NFs and nuclei to be closely associated).

CHAPTER V- EFFECTS OF PD MIMETICS ON NF TURNOVER IN SH-SY5Y CELLS
153
A) MORPHOLOGY B) SMI31
(FITC+propidium iodide)
Control
MPP+
2 mM
MPP+
100 μM
CHAPTER V- EFFECTS OF PD MIMETICS ON NF TURNOVER IN SH-SY5Y CELLS
154
Figure 5.5. Immunocytochemical analysis of NF proteins in SH-SY5Y cells following 72 h treatment with MPP+. Figure 5.5A represents cells visualised using phase contrast microscopy whilst Figure 5.5B represents confocal laser microscopy analysis. Cells were grown and treated with 100 μM or 2 mM MPP+ for 72 h in permanox 8-well chamber slides at a density of 10,000 cells per well. Following treatment cells were fixed, permeabilised and immunocytochemistry performed as detailed in section 2.2.12 using SMI 31 (1:500). Scale bar represents 10 μm.
CHAPTER V- EFFECTS OF PD MIMETICS ON NF TURNOVER IN SH-SY5Y CELLS
155
5.2.5 Changes in NF proteins in SH-SY5Y cells following chronic
exposure to MPP+ and DA
the previous section the effects of short exposure to mildly and highly cytotoxic
oncentrations of MPP+ and DA on NF proteins profiles were investigated.
this section, the effects of chronic exposure (3 and 7 weeks) to low concentrations
0 μM) of MPP+ and DA on the expression and post-translational modification of NF
roteins are analysed. This may provide a greater resemblance to neurodegeneration in-
ivo. Western blotting/ immunoprobing and immunocytochemical techniques were
mployed to provide both quantitative analysis of protein expression and distributional
igure 5.6 shows no significant change in total NF-H levels (N52) following exposure
10 μM MPP+ over 7 weeks, whilst DA led to a transient decrease (~17 % in
omparison to control) in total NF-H levels (N52) after 3 weeks. On the other hand,
both toxins led to a significant decrease in pNF-M + pNF-H (SMI 31). MPP+ decreased
mparison to control after 3 and 7 weeks
spectively. Similarly, DA reduced total NF-H to 59 % and 52 % after 3 and 7 weeks,
spectively. Finally, no change in the ratio of pNF-H: pNF-M was observed after 3 or 7
ent with either toxin. The observed ratio between pNF-H and pNF-M was
1.4 and 2.3 for 3 and 7 week control cells, respectively.
In
c
In
(1
p
v
e
changes in proteins.
5.2.5.1 Western blotting analysis of NF profiles after 3 and 7 weeks
exposure to MPP+ and DA
The results obtained were different from those reported earlier with shorter exposure
times.
F
to
c
total pNF-M + pNF-H to 62 % and 68 % in co
re
re
weeks treatm

CHAPTER V- EFFECTS OF PD MIMETICS ON NF TURNOVER IN SH-SY5Y CELLS
156
CHAPTER V- EFFECTS OF PD MIMETICS ON NF TURNOVER IN SH-SY5Y CELLS
156
A) BLOTS
N52
NF-H
pNF-
A) QUANTIFICATION
H
pNF-MSMI 31
Control MPP+ 10 μM DA 10 μM
3 WEEKS 7 WEEKS
Control MPP+ 10 μM DA 10 μM
0
20
40
Mea
n
60
80
100
120
%
MPP+ DA
N52:
ca.
con
trols
3 WEEKS7 WEEKS
0.0
20.0
40.0
60.0
80.0
100.0
MPP+ DA
SMI 3
1: M
ean
% c
a. c
ontro
ls
3 WEEKS7 WEEKS
0.0
0.2
0.4
0.6
0.8
1.0
1.2
MPP+ DA
Hyp
er p
NF-H
/ pN
F-H
3 WEEKS7 WEEKS
**
** * ** **
Total NF-H (N52)
pNF-H: pNF-M
N52
: Mea
n %
con
trol
pNF-H + pNF-M (SMI31)
SMI3
1: M
ean
% c
ontr
ol
Mea
n [p
NF-
H;p
NF-
M]

CHAPTER V- EFFECTS OF PD MIMETICS ON NF TURNOVER IN SH-SY5Y CELLS
157
Figure 5.6. Effect of chronic exposure to MPP+ and DA on NF turnover in SH-SY5Y cells. Cells were grown in T-25 flasks, treated with 10 μM MPP+ and DA for 3 and 7 weeks and extracted as detailed in section 2.2.4.1. Proteins were separated by SDS-PAGE, transferred to nitrocellulose by western blotting (see sections 2.28 and 2.2.10) and probed with N52 (1:500) and SMI 31 (1:1000). Primary antibody binding was detected by alkaline phosphatase (N52) and ECL (SMI31; section 2.2.10.3 and 2.2.10.4, respectively) and band intensity was quantified as detailed in section 2.2.10.6. Bands were corrected against copper staining of the proteins for differences in protein. Results are presented as mean % of controls ± SEM or ratio between pNF-H: pNF-M ± SEM. Statistical analyses were carried out using a two-tailed t-test and statistical significance accepted when * = p<0.05 or * ls (n=3). Control samples were assigned an intensity value of 100 % for N52 or SMI31reactivity or 1 for the ratio of pNF-H: pNF-M.
* = p< 0.01 cf. contro
CHAPTER V- EFFECTS OF PD MIMETICS ON NF TURNOVER IN SH-SY5Y CELLS
158
5.2.6 Immunocytochemical analyses of NF proteins after 3 and 7
weeks exposure to MPP+ and DA
munocytochemistry was performed on control, MPP+- and DA- treated cells (7 weeks
eatment) fixed in methanol and then permeabilised using triton X-100 as detailed in
ection 2.2.12. The distribution of phosphorylated NF-H and NF-M was visualised by
robing cells with SMI 31.
ed using phase contrast microscopy and
onfocal laser analysis, respectively. There were no significant changes in morphology
etween control cells (Figure 5.7A top panel) and cells treated with MPP+ (Figure 5.7A
anels middle and bottom), all containing some axon-like structures.
Im
tr
s
p
Figure 5.7A and B represent cells visualis
c
b
p
Immunocytochemical analysis of cells showed that distribution of pNF-M and pNF-H
were uniform in both the cell body and axon-like structures in control cells (Figure 5.7B
top panel), whilst in cells treated with 10 μM MPP+ and DA, pNF-M and pNF-H
accumulated in the cell body and there was virtually no staining within the axon-like
processes (Figure 5.7B middle and bottom panels).

CHAPTER V- EFFECTS OF PD MIMETICS ON NF TURNOVER IN SH-SY5Y CELLS
159
A) MORPHOLOGY B) SMI31
Control
MPP+
10 μM
DA
10 μM

CHAPTER V- EFFECTS OF PD MIMETICS ON NF TURNOVER IN SH-SY5Y CELLS
160
Figure 5.7. Immunocytochemical analysis of NF proteins in SH-SY5Y cells following chronic treatment with MPP+ and DA. In fig 5.8A mitotic cells were visualised using phase contrast microscopy. Fig 5.8B represents confocal laser microscopy analysis of mitotic cells. SH-SY5Y cells were grown in T-25 flasks and treated for 7 weeks with 10 μM MPP+ and DA and then transferred to permanox 8-well chamber slides at a density of 10,000 cells per well. After overnight recovery cells were fixed, permeabilised and immunocytochemistry performed as detailed in section 2.2.12 using SMI 31 (1:500). Scale bar represents 10 μM.
CHAPTER V- EFFECTS OF PD MIMETICS ON NF TURNOVER IN SH-SY5Y CELLS
161
5.3 DISCUSSION
.3.1 NFs can partly be degraded by the proteasome
this study we report that inhibition of proteasomal activity in human dopaminergic
H-SY5Y cells led to an accumulation of total NF-H levels suggesting that NF can be
egraded via the proteasome. Furthermore, depletion of glutathione, an event which is
een widely reported to occur within the dopaminergic neurons of PD patients, led to
rther accumulation of total NF-H levels after proteasome inhibition. Thus,
luthatione depletion might generate high levels of ROS within the cells which in turn
ay be modifying NFs making them better substrates for the proteasome. In fact, it has
een reported that the proteasome complex is responsible for the selective degradation
Phosphorylated NF-M and NF-H (pNF-M and pNF-H, respectively) did not accumulate
after proteasome inhibition with lactacystin nor when glutathione levels were depleted,
suggesting that these phosphoepitopes are not degraded via the proteasome, at least in
control cells. Previous reports indicated that the main proteolytic pathway involved in
the degradation of NF proteins to be calpains (Schlaepfer et al., 1985; Ray et al., 2000;
Stys and Jiang, 2002). However, in my system the calpain inhibitor MDL 28,170 had no
effect on phosphorylation, suggesting that the phosphoepitopes are not degraded via the
calpain system either. Indeed, it has been reported that calpains degrade phosphorylated
NFs at slower rates than dephosphorylated NFs (Pant et al., 1988). Nevertheless my
results show an increase in total NF-H when calpain activity was inhibited with MDL
28,170. This was expected since it is well-documented that NFs undergo calpain
degradation in vivo (Schlaepfer et al., 1985; Ray et al., 2000; Stys and Jiang, 2002;
Kunz et al., 2004).
5
In
S
d
b
fu
g
m
b
of modified cytoplasmic, nuclear and endoplasmic reticulum proteins (Davies 2001) and
that oxidised non-ubiquitinated proteins might be degraded by the 20S proteasome
(Grune et al., 2003). Thus my data would support the involvement of the UPS in the
degradation of NFs, in agreement with Gou and Leterrier (1995). Figure 5.8 is an
attempted overview of the effects of proteasome inhibition on the NF system in SH-
SY5Y cells.
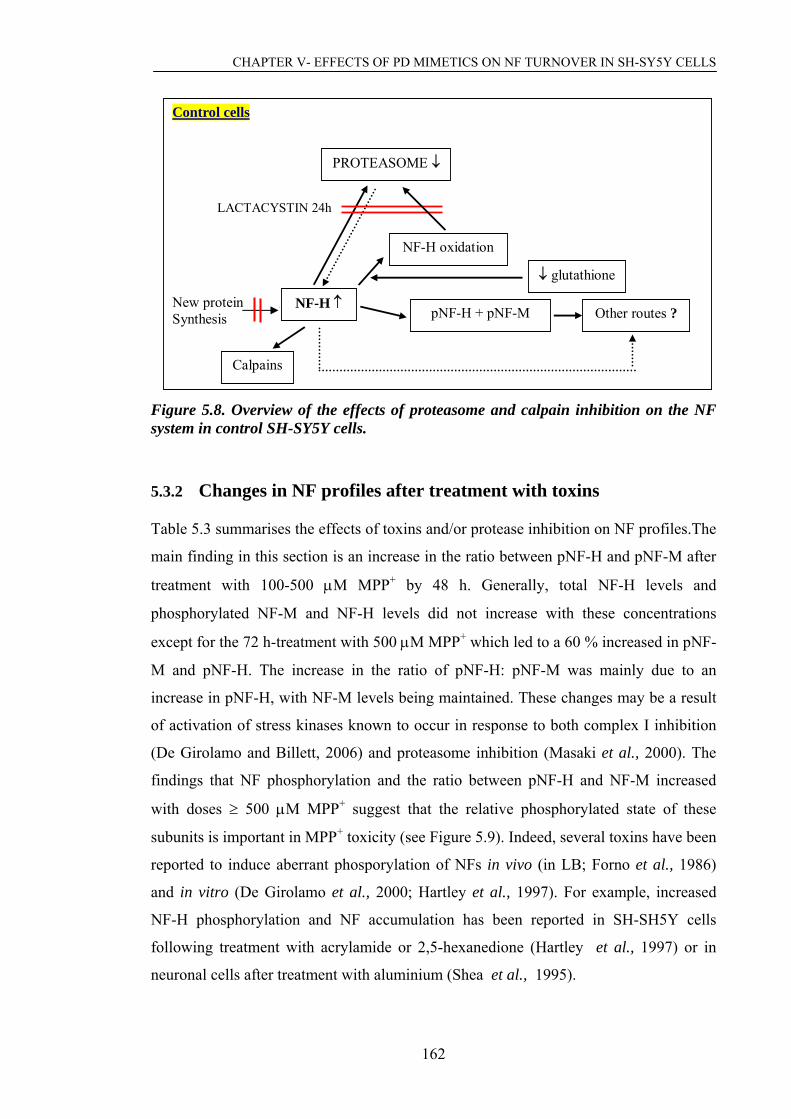
CHAPTER V- EFFECTS OF PD MIMETICS ON NF TURNOVER IN SH-SY5Y CELLS
162
th 100-500 μM MPP+ by 48 h. Generally, total NF-H levels and
with acrylamide or 2,5-hexanedione (Hartley et al., 1997) or in
euronal cells after treatment with aluminium (Shea et al., 1995).
Figure 5.8. Overview of the effects of proteasome and calpain inhibition on the NF system in control SH-SY5Y cells.
5.3.2 Changes in NF profiles after treatment with toxins
Table 5.3 summarises the effects of toxins and/or protease inhibition on NF profiles.The
main finding in this section is an increase in the ratio between pNF-H and pNF-M after
treatment wi
Control cells
LACTACYSTIN 24h
PROTEASOME ↓
New protein Synthesis
NF-H oxidation
↓ glutathione
Other routes ? pNF-H + pNF-M NF-H ↑
Calpains
phosphorylated NF-M and NF-H levels did not increase with these concentrations
except for the 72 h-treatment with 500 μM MPP+ which led to a 60 % increased in pNF-
M and pNF-H. The increase in the ratio of pNF-H: pNF-M was mainly due to an
increase in pNF-H, with NF-M levels being maintained. These changes may be a result
of activation of stress kinases known to occur in response to both complex I inhibition
(De Girolamo and Billett, 2006) and proteasome inhibition (Masaki et al., 2000). The
findings that NF phosphorylation and the ratio between pNF-H and NF-M increased
with doses ≥ 500 μM MPP+ suggest that the relative phosphorylated state of these
subunits is important in MPP+ toxicity (see Figure 5.9). Indeed, several toxins have been
reported to induce aberrant phosporylation of NFs in vivo (in LB; Forno et al., 1986)
and in vitro (De Girolamo et al., 2000; Hartley et al., 1997). For example, increased
NF-H phosphorylation and NF accumulation has been reported in SH-SH5Y cells
following treatment
n

CHAPTER V- EFFECTS OF PD MIMETICS ON NF TURNOVER IN SH-SY5Y CELLS
163
TIME TREATMENT NF-H pNF-H + pNF-M [pNF-H:pNF-M] Conclusion
100μM MPP+ = = ↑ (30%) 48h
100μM MPP+ + BSO = = ↑ (40%)
100μM MPP+ = = ↑ (42%) 72 h
100μM MPP+ + BSO = = ↑ (20%)
100μM MPP+ increases
ratio of pNF-H: pNF-M;
no additional effect with
BSO
500μM MPP+ = = = 24 h
500μM MPP+ + BSO = = =
500μM MPP+ = = ↑ (20%) h
[pNF-H:p NF-M] by 48 h;
no additional effect wi
48 500μM MPP+ + BSO = = ↑ (15%)
500μM MPP+ = ↑ (60%) ↑ (80%) 72
500μM MPP+ increases
th
BSO.
It also leads to an increase
in phosphorylation of NF-
H + NF-M after 72 h. h
500μM MPP+ + BSO = = ↑ (35%)
2 mM MPP+ ↑ (18%) ↑ (127%) ↑ (246%)
LACT + 2mM MPP+ ↑ (21%) ↑ (123%) ↑ (400%)
LACT ↑ (19%) = =
MDL 28,170 ↑ (22%) = =
MDL 28,170 + 2 mM MPP+ ↑ (30%) ↑ (138%) ↑ (325%)
DA 500 μM ↓ (40%) ↓ (75%) N.D
DA 500 μM + LACT ↓ (35%) ↓ (63%) N.D
72
total NF-H levels, pNF-H
H:
l
of
ed
er
ot
n,
in
h
DA 500 μM + MDL 28,170 ↓ (15%)
↑ca DA ↓ (65%) N.D
2mM MPP+ increased
+ pNF-M and [pNF-
pNF-M]; no additiona
effect by the addition
inhibitors; proteasome
activity might be involv
in NF degradation aft
MPP+ treatment but n
calpains.
With DA, increased NF-H
with calpain inhibitio
thus calpain is involved
degrading NF-H
Table 5.3. Summary of effects of toxins and/or protease inhibitors on NF profiles. Accumulation or decrease in NF are symbolised as ↑ or ↓ respchange indicated in brackets. No change in NFs is symbolised as =. N.D refers to not
ectively with the %
etermined. d
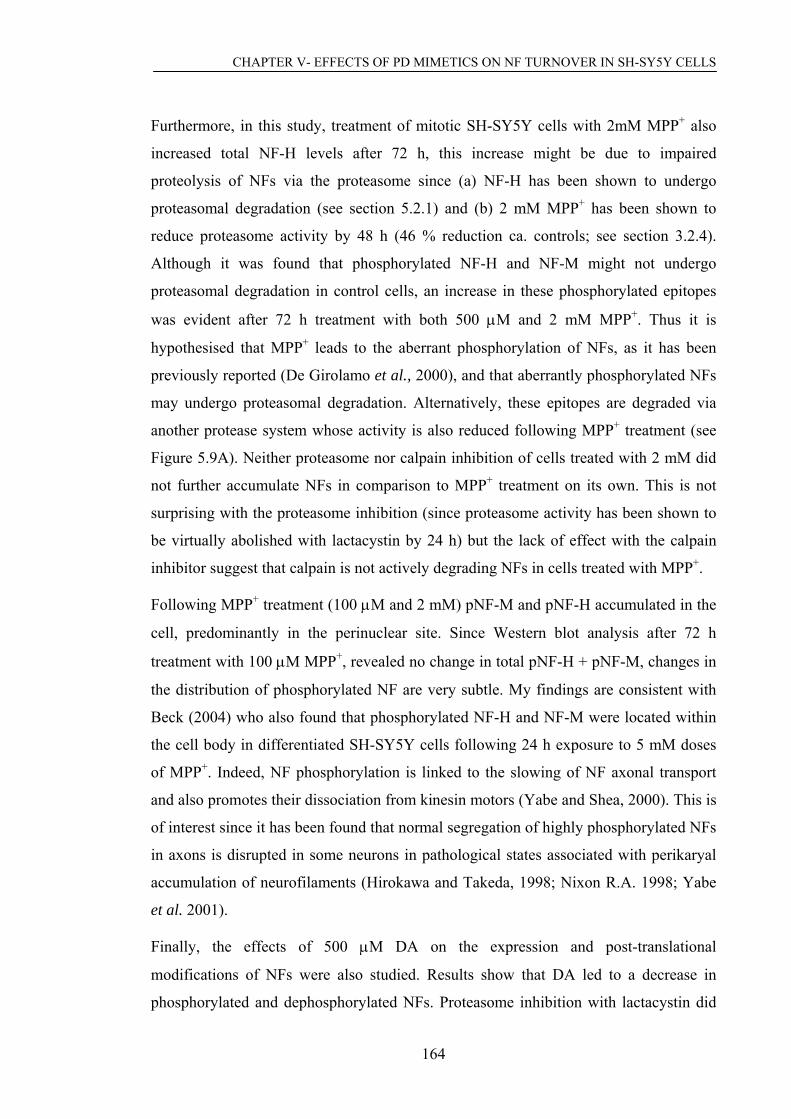
CHAPTER V- EFFECTS OF PD MIMETICS ON NF TURNOVER IN SH-SY5Y CELLS
164
Furtherm dy, tre t o Y 2mM +
increased total NF-H levels after 72 h, this increase might be due to impaired
proteolysis of NFs via the proteasome since (a) NF-H has been shown to undergo
proteas (see s + has
reduce proteasome activity by 48 h (46 % reduction ca. controls; see section 3.2.4).
Although it was found that phosphorylated NF-H and NF-M might not undergo
proteas in con l cells, an
was evident after 72 h treatment with both 500 μM and 2 mM MPP+. Thus it is + leads to the aberrant phosphorylation of NFs, as it has been
previou irolam et al., 200 and that aber tly phos
may undergo proteasomal degradation. Alternatively, these epitopes a
r tem whose activity is also reduced following MPP treatm ee
Figure teasom nor calpai nhibition of cells treated
not further accumulate NFs in comparison to MPP+ treatment on its o
roteasome inhibition (s has
be virt th lacta stin by 24 ) but the la fect with the calpain
inhibitor suggest that calpain is not actively degrading NFs in cells treated with MPP+.
Following MPP+ treatment (100 μM and 2 mM) pNF-M and pNF-H accu
cell, p the p ar s e Wes anal
treatment with 100 μM MPP+ d no ch ge in total pN H + pNF
the distribution of phosphorylated NF are very subtle. My findings are
Beck (200 found sphoryl d NF-H and N -M were
e c ed 5Y owing sure
of MPP+. Indeed, NF phosphorylation is linked to the slowing of NF a
and also promotes their dissociation from otors (Yabe and Shea, 2000). This is
of interest since it has been found that nor egation of ly pho
in axons is disrupted in some neurons in pathological states associated
accu en kaw keda, 199 ixon R.A.
et al. 2001).
ed and dephosphorylated NFs. Proteasome inhibition with lactacystin did
ore, in this stu atmen f mitotic SH-S 5Y cells with MPP also
omal degradation ection 5.2.1) and (b) 2 mM MPP been shown to
omal degradation tro increase in these phosphorylated epitopes
hypothesised that MPP
sly reported (De G o 0), ran phorylated NFs
re degraded via + ent (sanother p otease sys
5.9A). Neither pro e n i with 2 mM did
wn. This is not
been shown to surprising with the p ince proteasome activity
ually abolished wi cy h ck of ef
mulated in the
ysis after 72 h
-M, changes in
consistent with
located within
to 5 mM doses
xonal transport
redominantly in erinucle ite. Sinc tern blot
, reveale an F-
4) who also that pho ate F
th ell body in differentiat SH-SY cells foll 24 h expo
kinesin m
mal segr high sphorylated NFs
with perikaryal
1998; Yabe mulation of neurofilam ts (Hiro a and Ta 8; N
Finally, the effects of 500 μM DA on the expression and post-translational
modifications of NFs were also studied. Results show that DA led to a decrease in
phosphorylat

CHAPTER V- EFFECTS OF PD MIMETICS ON NF TURNOVER IN SH-SY5Y CELLS
165
not change levels of total NF-H and [pNF-H + pNF-M] in DA treated cells. However,
when calpain was inhibited an increase in total NF-H levels was observed in cells
treated with DA in comparison to DA control. This suggests that calpains may be
activated by DA and thus make NF-H a preferable substrate for calpain. This hypothesis
is supported by the finding that that oxidative stress and certain toxins can increase
intracellular calcium levels thereby increasing calpain activity in cultured cells (Lee
M.S. et al., 2000). In section 3.2.5.2, it was shown that 100 μM DA increased ROS
levels in SH-SY5Y cells to a great extent, thus it is likely that DA would activate
calpains via ROS production. Since 2 mM MPP+ raised ROS levels to a much lesser
extent than DA, it is hypothesised that MPP+ might not activate calpains as much as DA
and therefore NFs in MPP+-treated cells might preferably undergo proteasomal
degradation.
A) MPP+ treated cells MPP+ 2 mM 72h
PROTEASOME ↓
system.
Figure 5.9. Overview the effects of high levels of MPP+ (A) and DA (B) on the NF
New protein Synthesis Other routes ↓ ?
(Not calpains) pNF-H + pNF-M ↑ NF-H ↑
JNK/ CDK5 ↑
B) DA-treated cells DA 500 μM 72 h New protein Synthesis
PROTEASOME ↓
Other routes ?pNF-H + pNF-M ↓ NF-H ↓
Calpain ↑ NF-H ↑

CHAPTER V- EFFECTS OF PD MIMETICS ON NF TURNOVER IN SH-SY5Y CELLS
166
5.3.3 Effect of chronic exposure to low levels of MPP+ and DA on NFs
levels and distribution
Finally, since PD is a chronic disorder, the effect of chronic exposure to 10 μM MPP+
and DA was also estudied. Table 5.4 shows a summary of the effects of chronic
treatment with the toxins on NF levels and phosphorylation linked to the effects of these
treatments on proteasome activity (data from section 3.3.4).
Total levels of NF-H were transiently decreased after 3 weeks treatment with DA; at
this time CLA and PLA were markedly reduced, therefore it is hypothesised that NF-Hs
were degraded by calpains. This hypothesis is supported by (a) some evidence that DA
may activate calpains (see section 5.3.2) and (b) the fact that apparent TLA is greatly
activated after 3 weeks treatment and, as discussed in chapter III, could be due to the
fact that the substrate for TLA is able to measure calpain activity. However, NF-H
vels were not affected after 7 weeks treatment with DA.
o significant changes in total NF-H were observed with MPP+. However, both
neurotoxins reduced the levels of pNF-M + pNF-H; this could be explained in a number
f ways. Firstly, as for control cells, phosphorylated NFs might not undergo
roteasomal degradation (see section 5.2.1) and other routes capable of degrading these
hosphoepitopes are more active. Secondly, toxins could induce aberrant
phosphorylation and oxidation of NFs, thus making them more suitable proteasomal
This is also a possible explanation since proteasome activity is only reduced
by 10- 30 % by the toxins over a period of 7 weeks, thus NF-H can still be normally
egraded by the proteasome.
inally, no change in the ratio of pNF-H:pNF-M was found after 3 or 7 weeks treatment
ith these low levels of toxins. However, it is important to note that the ratios in control
samples were 1.4 and 2.3 for cells cultured for 3 and 7 weeks, respectively. This is the
pposite of the situation with short term control cells where the mean control ratio was
.7. Thus, it appears that the ratio of pNF-H: pNF-M increases with time of culture. It
mains to be checked whether the activity of stress kinase enzymes were altered
following chronic exposure.
le
N
o
p
p
substrates.
d
F
w
o
0
re
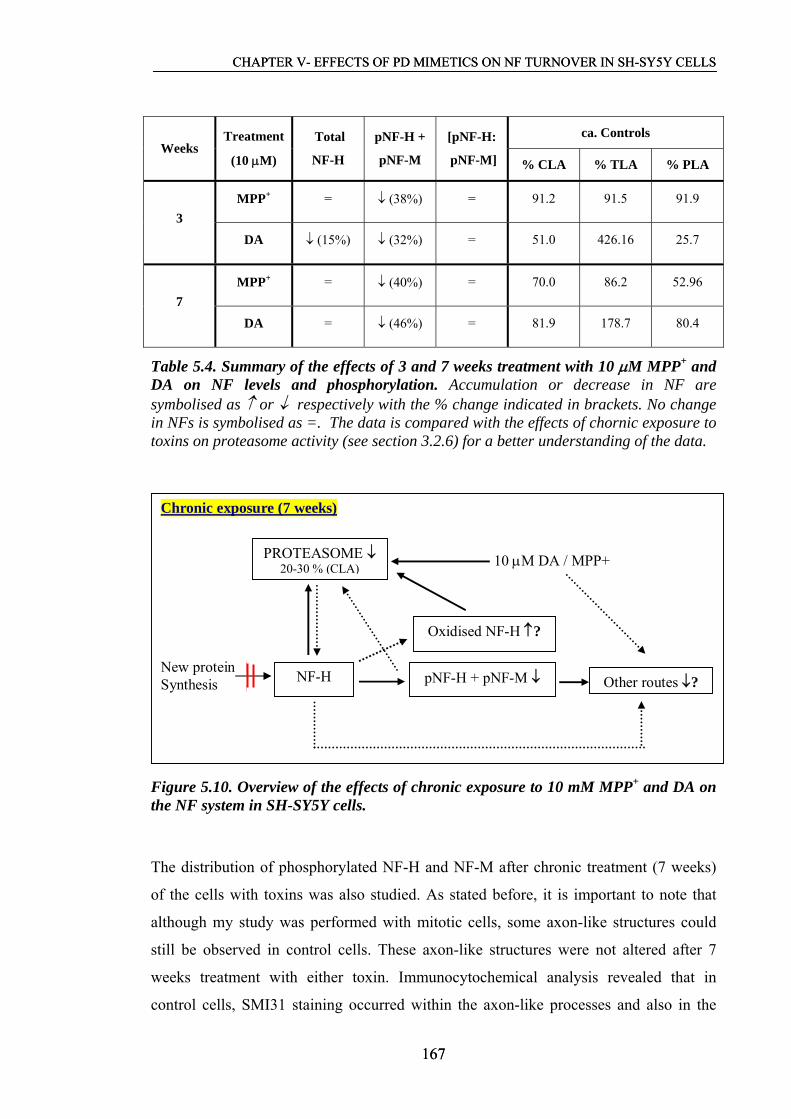
CHAPTER V- EFFECTS OF PD MIMETICS ON NF TURNOVER IN SH-SY5Y CELLS
167
CHAPTER V- EFFECTS OF PD MIMETICS ON NF TURNOVER IN SH-SY5Y CELLS
167
ca. Controls Weeks
Treatment
(10 μM)
Total
NF-H
pNF-H +
pNF
[pNF-H:
-M pNF-M] % CLA % TLA % PLA
MPP+ = ↓ (38%) = 91.2 91.5 91.9 3
DA ↓ (15%) ↓ (32%) = 51.0 426.16 25.7
MPP+ = ↓ (40%) = 70.0 86.2 52.96 7
DA = ↓ (46%) = 81.9 178.7 80.4
Table 5.4. Summary of the effects of 3 and 7 weeks treatment with 10 μM MPP+ and DA on NF levels and phosphorylation. Accumulation or decrease in NF are symbolised as ↑ or ↓ respectively with the % change indicated in brackets. No change in NFs is symbolised as =. The data is compared with the effects of chornic exposure to toxins on proteasome activity (see section 3.2.6) for a better understanding of the data.
Chronic exposure (7 weeks) 10 μM DA / MPP+ New protein Synthesis
PROTEASOME ↓20-30 % (CLA)
Other routes ↓?pNF-H + pNF-M ↓ NF-H
Oxidised NF-H ↑?
Figure 5.10. Overview of the effects of chronic exposure to 10 mM MPP+ and DA on the NF system in SH-SY5Y cells.
The distribution of phosphorylated NF-H and NF-M after chronic treatment (7 weeks)
of the cells with toxins was also studied. As stated before, it is important to note that
although my study was performed with mitotic cells, some axon-like structures could
still be observed in control cells. These axon-like structures were not altered after 7
eeks treatment with either toxin. Immunocytochemical analysis revealed that in
control cells, SMI31 staining occurred within the axon-like processes and also in the
w
CHAPTER V- EFFECTS OF PD MIMETICS ON NF TURNOVER IN SH-SY5Y CELLS
168
perikarya. However, after tre tment with the toxins SMI31 staining was intense and
r to ll b nd do perinuclear. These results are
consistent with De Girolamo et al. (2000) and De Girolamo and Billett (2006) who
foun accum of pho horyla H wi n the cell perikary ter tre t
of mouse neuroblastom ith toxic ncentra of M he c s
in the distribution of pNFs might be due to impaired transport of NF proteins within the
cell, and ma involv in t ation of inclusion bodies seen in several
neurodegenerative disorders (Petzod, 2005).
a
estricted the ce ody a was pre minantly
d ulation sp ted NF- thi on af atmen
a cells w sub-cyto co tions PTP. T hange
y be ed he form

CHAPTER VI
GENERAL DISCUSSION

CHAPTER VI- GENERAL DISCUSSION
170
6. GENERAL DISCUSSION
This thesis has focused in two areas of research regarding the pathogenetic mechanisms
underlying PD, altered proteasomal activity and changes in NFs after mimicking some
of the biochemical features of PD by using MPP+ and DA in an in vitro model.
6.1 EFFECTS OF MPP+ AND DA ON PROTEASOME ACTIVITY
6.1.1 Role of ATP and ROS in toxin-mediated proteasome impairment
The causes underlying PD have not yet been fully elucidated, thus a wide amount of
research is being undertaken in order to determine the specific mechanisms of nigral
cell death. Recently, UPS impairment is gaining importance in the field as a key event
contributing to the pathogenesis of both sporadic and familial PD. Moreover,
impairment of this proteolytic pathway might also be involved in the formation of
protein aggregates typical of the disease (reviewed by McNaught and Olanow, 2006).
In this thesis, the effects of MPP+ and DA on proteasomal activity from human
dopaminergic SH-SY5Y cells were investigated since both toxins are relevant in PD;
Indeed, MPP+ can reproduce some of the biochemical deficits of PD (reviewed by
Przedborsky and Vila, 2001) and DA containing neurons are specifically lost in PD.
Moreover, DA metabolism creates a highly oxidative environment thus increasing the
vulnerability of these neurons (reviewed by Blum et al., 2001). The contributions of
ROS and ATP on proteasome impairment were studied since both parameters are
thought to be important in PD and most previous in vitro work was performed in rat
cells. This is important since different proteasome subtypes exist in different species,
tissues and cells (Rivett et al., 2001).
This study revealed that complex I inhibition by MPP+ and the presence of DA led to a
reduction in CLA and PLA in the cells. However, TLA activity was not reduced by the
toxins; in fact, activation of this activity was observed following treatment with low
doses of MPP+ and high doses of DA, suggesting a compensatory effect of the cells in
response to oxidative stress. This is the first time that differential proteasome sensitivity
to the toxins has been reported despite the assessment of the three activities in a limited
number of human post-mortem PD samples (McNaught and Jenner, 2001; McNaught et
al., 2003), in rats or SK-N-MC cells chronically treated with rotenone (Betardet et al.,

CHAPTER VI- GENERAL DISCUSSION
171
2006) and in rodent cells treated with rotenone, MPP+ (Hoglinger et al., 2003) and 6-
OHDA (Elkon et al., 2004).
The mechanisms triggering MPP+- and DA-mediated proteasome impairment were
found to be different in SH-SY5Y cells. MPP+ decreased proteasome activity primarily
via complex I inhibition (ie. ATP depletion) whilst, DA-mediated proteasome
impairment was a major consequence of oxidative stress (ie. ROS generation) as
confirmed by the fact that NAC, a precursor for glutathione synthesis and a mild
antioxidant itself, could counteract the effects of DA on the proteasome linked to the
recovery of cell morphology. These findings are in agreement with Elkon et al. (2004)
who found that NAC alleviated proteasome impairment caused by 6-OHDA in an in
vitro mouse cell model. Moreover, glutathione levels were transiently increased after
DA treatment, as previously reported by Haque et al. (2003), possibly as a response of
the cells to oxidative stress. In contrast, NAC did not protect the proteasome against
MPP+ toxicity. ATP has previously been claimed as the main factor driving proteasome
impairment after MPP+ and rotenone treatment in rat mesencephalic cell cultures
(Hoglinger et al., 2003).
Results in this thesis show that DA is a stronger oxidant than MPP+, since low doses of
DA generated greater amounts of ROS than high doses of MPP+. However, NAC was
able to withdraw the ROS generated by both toxins, thus it is tempting to hypothesise
that ROS might also influence or exacerbate ATP depletion caused by MPP+ thereby,
further compromising proteasomal function. Indeed in dopaminergic cells, DA plus
complex I inhibition would exacerbate each others effects.
It is important to note that short term glutathione depletion on its own might not be
sufficient to impair CLA, thus other adverse events, notably ATP depletion, might act
together with ROS in decreasing protesomal function.
Finally, since PD is a chronic disorder chronic treatment of the cells may give a better
understanding of the situation in vivo. Interestingly, CLA was also impaired after 3 and
7 weeks treatment with 10 μM MPP+ and DA. However, PLA and TLA were only
significantly reduced after 7 weeks treatment suggesting that CLA is more sensitive
than the other activities; this is consistent with our short exposure data. As before, TLA
was the least sensitive proteasomal activity to the toxins. The relevance of this finding
CHAPTER VI- GENERAL DISCUSSION
172
remains uncertain, since the most important proteolytic activity for protesomal function
has been reported to be CLA (Jäger et al., 1999).
Since in this study proteasomal activity was monitored using fluorogenic peptides
which measure ATP independent 20S activity (from both free 20S and 20S bound to
regulatory particles), it remains to be determined whether the toxins differently affect
the 26S proteasome. Furthermore, the effects of the toxins on other proteases, including
calpains, also needs to be assessed.
6.1.2 Direct effects of toxins on proteasome activity
By studying the direct effects of the toxins on purified 20S proteasome and proteasomal
activities of crude cell extracts, the primary and secondary effects of the toxins on
proteasome activity were able to be discriminated. MPP+ and DA were shown to
directly decrease CLA when added to cell extracts, with MPP+ having a greater effect
than DA. This was the opposite situation to purified 20S samples where DA was more
damaging than MPP+. This suggests that MPP+ direct effect is more specific towards the
proteasome whilst DA might be randomly interacting with all the proteins present in the
cell lysate. It is worth noting, that some the direct effects of the toxins detected via
measurement via 20S activity in the cell lysates might possibly occurring via damage to
the regulatory subunits, given that our extraction system contained ATP and would
conserve at least some 26S particles (Coux et al.,1996).
Overall, 20S-CLA was more sensitive to MPP+ and DA than 20S-PLA followed by
20S-TLA. Indeed, MPTP although unable to be metabolised to MPP+ in vitro also
reduced 20S-CLA and 20S-PLA (this time PLA being more sensitive than CLA) whilst
TLA was unaffected. It appears than TLA is directly and indirectly less sensitive to the
toxins than the other two activities. Since addition of an antioxidant could protect
against toxic insult, the direct effect of the toxins to the proteasome is at least partly due
to oxidative damage to the multiprotease itself. This is consistent with Shamoto-Nagai
et al. (2003) who report decreased proteasomal activity in rotenone-treated cells
associated with oxidative modification of the proteasome. Therefore, since TLA is the
least affected activity by the toxins, either TLA catalytic subunits (β2 and β6) or TLA
regulation (α-subunits) might be less sensitive to oxidative damage or the oxidative
changes in this subunits might have less impact in the functionality of this activity.

CHAPTER VI- GENERAL DISCUSSION
173
The fact that the direct effect of the toxins on the proteasome might be partly due to
oxidative damage could have consequential effects on the 26S proteasome since is four
times more vulnerable to oxidative stress than the 20S (Reinheckel et al.,1998). This
could be related to possible effects on the various regulatory subunits of the 26S
proteasome. Indeed, McNaught et al. (2003) reported a loss in the α-subunits in SNpc
of PD patients together with a reduction in the 19S activator and virtually undetectable
levels of 11S. However, oxidative damage is not solely confined to the regulatory
subunits since the β-subunits of the 20S are also reported to be targets in SH-SY5Y
cells (Shamoto-Nagai et al., 2003).
Indeed, this thesis shows that CLA (β4), TLA (β2 and β6) and some α-subunits (α1,
α2, α3 and α6) of the 20S proteasome were modified after treatment with DA.
However, although MPP+ decreased proteasomal activity this was not detected by
Western blotting, suggesting that changes in the subunits following MPP+ treatment are
either more subtle than the ones caused by DA or the epitopes modified by MPP+ are
different to the epitopes recognised by the antibodies.
Interestingly, whilst the direct effects of MPP+ on 20S-TLA were very similar to their
effects on trypsin enzyme, DA was more damaging to the proteasome suggesting that
some of the oxidative damage could be affecting the non-catalytic subunits which can
moderate the 20S-TLA. Indeed, as previously discussed, western blotting analysis
showed that some of the α- subunits were affected by DA.
The fact that the three PD mimetics used in this study could directly affect 20S activity
would suggest that chemicals with this type of structure may have direct deleterious
effects on the UPS in vivo if their concentrations are sufficiently high. Indeed, it has
been suggested that exposure to environmental toxins/pesticides may be contributing to
the most common, sporadic form of PD (Liu and Yang 2005;Zhou et al. 2004) This is
supported by a report that maneb leads to a reduction in proteasome activity (Zhou et al.
2004). Very recently a paper by Wang et al. (2006) looked at the direct effects of other
pesticides (including rotenone) on 26S using human neuroblastoma cells with a 26S
proteasome reporter system and found six pesticides which resulted in reductions in 26S
activity, some at very low concentrations (10 nM for rotenone). Of the six pesticides,
rotenone caused oxidative stress, but the others did not (e.g. benomyl, dieldrin, ziram),
suggesting the involvement of other mechanisms. On the other hand none of the
CHAPTER VI- GENERAL DISCUSSION
174
pesticides had a direct effect on 20S proteasomal activity in cell lysates at the
concentrations tested (maximum 10µM), as also concluded for rotenone in another
recent study (Betarbet et al. 2006).
Thus this work adds further support to the suggestion that complex I inhibition/defects,
whether due to the effects of toxins or due to genetic predisposition, leads to selective
problems in dopaminergic neurons since the DA is released following ATP depletion,
causing damage to the proteasome in these cells. It is likely that complex I inhibition in
non-dopaminergic cells would be less damaging, and in this case ATP depletion rather
than ROS would be the important determinant of 20S activity.
Further investigation is required to further confirm that the toxins oxidatively modify
the 20S proteasomal subunits and to determine whether other possible modifications are
also occurring. Moreover, it would be of interest to study the direct effects of the toxins
on purified 26S proteasome.
6.2 EFFECTS OF MPP+ AND DA ON THE NF SYSTEM
This thesis demonstrates that NFs can undergo proteasomal degradation in SH-SY5Y
cells. Moreover, MPP+ altered the expression and distribution of NF proteins. Short
term exposure to high levels of the toxin led to the accumulation of total NF-H and
increased NF-H and NF-M phosphorylation in my cell system. This could be a result of
a decrease in proteasome activity caused by the toxin; moreover, MPP+ might be
causing aberrant phosphorylation of NF proteins. Indeed, an increase of the ratio in the
ratio of pNF-H: pNF-M was also observed and might be important in the response of
the cells to MPP+ toxicity. Although this thesis did not study the kinases responsible for
elevated NF phosphorylation following MPP+ treatment, it is possible CDK-5 could be
involved since it has been reported that oxidative stress can increase CDK-5 activity
thereby increasing perikaryal NF phosphorylation (Shea et al., 2004). Alternatively, NF
phosphorylation could be increased by JNK since it has been reported that proteasomal
inhibition increased NF-H phosphorylation and JNK activity in PC12h cells (Masaki et
al., 2000).
The effects of high doses of DA on NF proteins were also determined, contrary to
MPP+, DA decreased total NF-H levels and NF-H and NF-M phosphorylation after 72
h. It is hypothesised that DA is possibly activating calpains. Indeed, calpains are

CHAPTER VI- GENERAL DISCUSSION
175
reported to be the major pathway involved in NF degradation (reviewed by Petzold,
2005) along with further evidence presented in this thesis.
It is important to note that with high doses of the toxins (i.e 500 μM DA and 2 mM
MPP+) other factors different to the ones highlighted in this thesis might be also
activated which might influence both the proteasomal and NF systems in my cell model,
thus increasing the complexity of the analysis and extrapolation of these data to the in
vivo situation.
Similarly to the short time exposure data, chronic exposure of the cells to DA resulted
in a transient decrease of both total NF-H (again possibly, due to calpain activation),
whilst no change was observed with MPP+. However, both toxins decreased the levels
of phosphorylated NFs by 3 weeks probably due to proteasomal degradation since
proteasome activity was not greatly impaired by chronic exposure to the toxins.
Furthermore, immunocytochemical analyses revealed that both short and long term
exposures to MPP+ altered the distribution of NF which localised to the cell body. This
was also the case in cells chronically treated with DA suggesting that both toxins might
alter the axonal transport of these cytoskeletal proteins. This is of interest since
abnormal NF aggregates are pathological hallmarks of many neurodegenerative
disorders including PD (Julien, 1999). Moreover, NF proteins are found in LB together
with ubiquitinated proteins, suggesting that disruption of the UPS might contribute to
the formation of such aggregates and vice-versa, protein aggregates might also perturb
proteasomal function by sequestering the UPS components or by overloading the
proteasome capacity (reviewed by Betardet et al., 2005). A link between LB and NFs
accumulation or redistribution reported in this thesis is still uncertain and requires
further investigation, for example immunocytochemical co-localisation studies of NFs,
synuclein, proteasome subunits and ubiquitin need to be undertaken. To assess the
significance of changes in NF distribution it will be useful to also study the status of
other cytoskeletal elements (MTs and MFs) and proteins found associated with
aggresomes (γ-tubulin and heat-shock proteins).

CHAPTER VI- GENERAL DISCUSSION
176
6.3 CONCLUSIONS
Figure 6.1 integrates the data presented in this thesis and suggests possible links to PD
pathogenecity.
In conclusion, this thesis provides further evidence that the UPS in conjunction with
complex I inhibition and ROS formation might play an important role in PD
pathogenesis and possibly in protein aggregation which is a common feature not only of
neurodegenerative disorders but also of ageing. The findings reported in this study can
be summarised as follows:
• MPP+ and DA decreased proteasomal activity, ATP and glutathione levels in
SH-SY5Y cells. MPP+ toxicity towards the proteasome is primarily caused by
ATP depletion whilst ROS (glutathione depletion) appeared to be the
determinant in the case of DA.
• MPP+, MPTP and DA could directly impair the 20S proteasome partly due to
oxidative damage to the multicatalytic complex.
• The relative sensitivity of the different proteasomal activities to the toxins in
both the cells and the 20S was overall: CLA > PLA > TLA.
• The proteasome seemed more sensitive to DA than trypsin enzyme suggesting
that the regulatory subunits of the 20S proteasome might also be critical in
maintaining protesome activity.
• Several catalytic and non-catalytic subunits of the proteasomal core were
modified by the toxins. Again TLA was the least sensitive activity to the direct
effect of toxins.
• Proteasomal inhibition resulted in accumulation of NF-H levels suggesting
that these proteins might undergo proteasomal degradation.
• MPP+ and DA induced changes in the post-translational modification and
distribution of the NF network.

CHAPTER VI- GENERAL DISCUSSION
177
Figure 6.1. Overview of MPP+ and DA effects on UPS and NF system as detailed in this thesis and current literature. MPP+ impairs proteasomal activity primarily via complex I inhibition whilst DA-mediated proteasome impairment is mainly due to ROS. In addition these toxins can directly reduce 20S proteasome activity. Reduced proteasomal function leads to accumulation of NFs (phosphorylated and dephosphorylated) in the cell body and are known to be found in LB with other aberrant proteins (Gai et al., 2000). Based on published work (reviewed by McNaught and Ollanow, 2006) it is likely that proteasome dysfunction leads to protein aggregation of other proteins also.
20S proteasome impairment
REDISTRIBUTION OF NF PROTEINS
↑ NF levels and phosphorylation
↓ ATP
COMPLEX I INHIBITION
MPP+
DA
↓ GLUT
ROS direct
ROS
ROS direct CDK5/JNK
activation?

CHAPTER VII
REFERENCE LIST

CHAPTER VII- REFERENCE LIST 7. REFERENCE LIST Abou-Sleiman,P.M., Muqit,M.M.K., and Wood,N.W. (2006) Expanding insights of mitochondrial dysfunction in Parkinson's disease. Nature Reviews Neuroscience 7: 207-219.
Alberts, B.,Bray, D., Lewis, J., Raff, M., Roberts, K. and Watson, J.D. (1994). Molecular biology of the cell (3rd edition). New York: Garland Publishing. Alves-Rodrigues,A., Gregori,L., and Figueiredo-Pereira,M.E. (1998) Ubiquitin, cellular inclusions and their role in neurodegeneration. Trends in Neurosciences 21: 516-520.
Ancolio,K., ves da Costa,C., Ueda,K., and Checler,F. (2000) [alpha]-Synuclein and the Parkinson's disease-related mutant Ala53Thr-[alpha]-synuclein do not undergo proteasomal degradation in HEK293 and neuronal cells. Neuroscience Letters 285: 79-82.
Anderson,M.E. (1985) Determination of Glutathione and Glutathione Disulfide in Biological Samples. Methods in Enzymology 113: 548-555.
Ardley,H.C., Hung,C.C., and Robinson,P.A. (2005) The aggravating role of the ubiquitin-proteasome system in neurodegeneration. FEBS Letters 579: 571-576.
Arendt,C.S., and Hochstrasser,M. (1997) Identification of the yeast 20S proteasome catalytic centers and subunit interactions required for active-site formation. Proceedings of the National Academy of Sciences of the United States of America 94: 7156-7161.
Artal-Sanz,M., and Tavernarakis,N. (2005) Proteolytic mechanisms in necrotic cell death and neurodegeneration. FEBS Letters 579: 3287-3296.
Ascherio,A., Zhang,S.M.M., Hernan,M.A., Kawachi,I., Colditz,G.A., Speizer,F.E., and Willett,W.C. (2001) Prospective study of caffeine consumption and risk of Parkinson's disease in men and women. Annals of Neurology 50: 56-63.
Barzilai,A., and Melamed,E. (2003) Molecular mechanisms of selective dopaminergic neuronal death in Parkinson's disease. Trends Molecular Medicine 9: 126-132.
Beal,M.F. (2001) Experimental models of Parkinson's disease. Nature Reviews Neuroscience 2: 325-332.
Beck, K. (2004). Changes in the cytoskeleton and signalling pathways in differentiated human neuroblstoma cells following MPP+ exposure. Doctoral thesis: Nottingham Trent University. Ben-Shachar,D., Zuk,R., Gazawi,H., and Ljubuncic,P. (2004) Dopamine toxicity involves mitochondrial complex I inhibition: implications to dopamine-related neuropsychiatric disorders. Biochemical Pharmacology 67: 1965-1974.
Bence,N.F., Sampat,R.M., and Kopito,R.R. (2001) Impairment of the ubiquitin-proteasome system by protein aggregation. Science 292: 1552-1555.
Bennett,M.C., Bishop,J.F., Leng,Y., Chock,P.B., Chase,T.N., and Mouradian,M.M. (1999) Degradation of alpha-synuclein by proteasome. Journal of Biological Chemistry 274: 33855-33858.
Berg,D., Gerlach,M., Youdim,M.B.H., Double,K.L., Zecca,L., Riederer,P., and Becker,G. (2001) Brain iron pathways and their relevance to Parkinson's disease. Journal of Neurochemistry 79: 225-236.
Bernardi,P., Scorrano,L., Colonna,R., Petronilli,V., and Di,L. (1999) Mitochondria and cell death. Mechanistic aspects and methodological issues. European Journal Biochemistry 264: 687-701.
179
CHAPTER VII- REFERENCE LIST Betarbet,R., Sherer,T.B., MacKenzie,G., Garcia,O., Panov,A.V., and Greenamyre,J.T. (2000) Chronic systemic pesticide exposure reproduces features of Parkinson's disease. National Neuroscience 3: 1301-1306.
Betarbet,R., Sherer,T.B., and Greenamyre,J.T. (2002) Animal models of Parkinson's disease. Bioessays 24 : 308-318.
Betarbet,R., Sherer,T.B., and Greenamyre,J.T. (2005) Ubiquitin-proteasome system and Parkinson's diseases. Experimental Neurology 191: S17-S27.
Betarbet,R., Canet-Aviles,R.A., Sherer,T.B., Mastroberardino,P.G., McLendon,C., Kim,J.H. et al. (2006) Intersecting pathways to neurodegeneration in Parkinson's disease: Effects of the pesticide rotenone on DJ-1, alpha-synuclein, and the ubiquitin-proteasome system. Neurobiology of Disease 22: 404-420.
Biedler,J.L., Helson,L., and Spengler,B.A. (1973) Morphology and growth, tumorigenicity, and cytogenetics of human neuroblastoma cells in continuous culture. Cancer Research 33: 2643-2652.
Bizat,N., Hermel,J.M., Boyer,F., Jacquard,C., Creminon,C., Ouary,S. et al. (2003) Calpain is a major cell death effector in selective striatal degeneration induced in vivo by 3-nitropropionate: Implications for Huntington's disease. Journal of Neuroscience 23: 5020-5030.
Bizat,N., Hermel,J.M., Humbert,S., Jacquard,C., Creminon,C., Escartin,C. et al. (2003) In vivo calpain/caspase cross-talk during 3-nitropropionic acid-induced striatal degeneration - Implication of a calpain-mediated cleavage of active caspase-3. Journal of Biological Chemistry 278: 43245-43253.
Bloom,J., Amador,V., Bartolini,F., DeMartino,G., and Pagano,M. (2003) Proteasome-mediated degradation of p21 via N-terminal ubiquitinylation. Cell 115: 71-82.
Blum,D., Torch,S., Lambeng,N., Nissou,M., Benabid,A.L., Sadoul,R., and Verna,J.M. (2001) Molecular pathways involved in the neurotoxicity of 6-OHDA, dopamine and MPTP: contribution to the apoptotic theory in Parkinson's disease. Progress in Neurobiology 65: 135-172.
Bonifati,V., Rizzu,P., van Baren,M.J., Schaap,O., Breedveld,G.J., Krieger,E. et al. (2003) Mutations in the DJ-1 gene associated with autosomal recessive early-onset parkinsonism. Science 299: 256-259.
Brooks,P., Fuertes,G., Murray,R.Z., Bose,S., Knecht,E., Rechsteiner,M.C. et al. (2000) Subcellular localization of proteasomes and their regulatory complexes in mammalian cells. Biochemical Journal 346: 155-161.
Brown,T.P., Rumsby,P.C., Capleton,A.C., Rushton,L., and Levy,L.S. (2006) Pesticides and Parkinson's disease - Is there a link? Environmental Health Perspectives 114: 156-164.
Brownell,A.L., Livni,E., Galpern,W., and Isacson,O. (1998) In vivo PET imaging in rat of dopamine terminals reveals functional neural transplants. Annals of Neurology 43: 387-390.
Brownell,A.L., Canales,K., Chen,Y.I., Jenkins,B.G., Owen,C., Livni,E. et al. (2003) Mapping of brain function after MPTP-induced neurotoxicity in a primate Parkinson's disease model. Neuroimage 20: 1064-1075.
Brownlees,J., Yates,A., Bajaj,N.P., Davis,D., Anderton,B.H., Leigh,P.N. et al. (2000) Phosphorylation of neurofilament heavy chain side-arms by stress activated protein kinase-1b/Jun N-terminal kinase-3. Journal of Cell Science 113: 401-407.
180

CHAPTER VII- REFERENCE LIST Buhmann,C., Arlt,S., Kontush,A., Moller-Bertram,T., Sperber,S., Oechsner,M. et al. (2004) Plasma and CSF markers of oxidative stress are increased in Parkinson's disease and influenced by antiparkinsonian medication. Neurobiology of Disease 15: 160-170.
Bulteau,A.L., Lundberg,K.C., Humphries,K.M., Sadek,H.A., Szweda,P.A., Friguet,B., and Szweda,L.I. (2001) Oxidative modification and inactivation of the proteasome during coronary occlusion/reperfusion. Journal of Biological Chemistry 276: 30057-30063.
Canu,N., Barbato,C., Ciotti,M.T., Serafino,A., Dus,L., and Calissano,P. (2000) Proteasome involvement and accumulation of ubiquitinated proteins in cerebellar granule neurons undergoing apoptosis. Journal of Neuroscience 20: 589-599.
Carlier,M.F. (1991) Actin - Protein-Structure and Filament Dynamics. Journal of Biological Chemistry 266: 1-4.
Carrard,G., Bulteau,A.L., Petropoulos,I., and Friguet,B. (2002) Impairment of proteasome structure and function in aging. International Journal of Biochemistry & Cell Biology 34: 1461-1474.
Carvalho,P., Tirnauer,J.S., and Pellman,D. (2003) Surfing on microtubule ends. Trends in Cell Biology 13: 229-237.
Cassarino,D.S., Fall,C.P., Swerdlow,R.H., Smith,T.S., Halvorsen,E.M., Miller,S.W. et al. (1997) Elevated reactive oxygen species and antioxidant enzyme activities in animal and cellular models of Parkinson's disease. Biochimica et Biophysica Acta 1362: 77-86.
Cassarino,D.S., and Bennett,J.P. (1999) An evaluation of the role of mitochondria in neurodegenerative diseases: mitochondrial mutations and oxidative pathology, protective nuclear responses, and cell death in neurodegeneration. Brain Research Reviews 29: 1-25.
Cassarino,D.S., Parks,J.K., Parker,W.D., and Bennett,J.P. (1999) The parkinsonian neurotoxin MPP+ opens the mitochondrial permeability transition pore and releases cytochrome c in isolated mitochondria via an oxidative mechanism. Biochimica and Biophysica Acta 1453: 49-62.
Chan,P., Delanney,L.E., Irwin,I., Langston,J.W., and Dimonte,D. (1991) Rapid Atp Loss Caused by 1-Methyl-4-Phenyl-1,2,3,6-Tetrahydropyridine in Mouse-Brain. Journal of Neurochemistry 57: 348-351.
Chard,P.S., Bleakman,D., Savidge,J.R., and Miller,R.J. (1995) Capsaicin-Induced Neurotoxicity in Cultured Dorsal-Root Ganglion Neurons - Involvement of Calcium-Activated Proteases. Neuroscience 65: 1099-1108.
Chau,V., Tobias,J.W., Bachmair,A., Marriott,D., Ecker,D.J., Gonda,D.K., and Varshavsky,A. (1989) A Multiubiquitin Chain Is Confined to Specific Lysine in A Targeted Short-Lived Protein. Science 243: 1576-1583.
Chen,T.S., Koutsilieri,E., and Rausch,W.D. (1995) Mpp(+) Selectively Affects Calcium Homeostasis in Mesencephalic Cell-Cultures from Embryonal C57/B16 Mice. Journal of Neural Transmission-General Section 100: 153-163.
Chin,T.K., Eagles,P.A.M., and Maggs,A. (1983) The Proteolytic Digestion of Ox Neurofilaments with Trypsin and Alpha-Chymotrypsin. Biochemical Journal 215: 239-252.
Chinta,S.J., Rajagopalan,S., Butterfield,D.A., and Andersen,J.K. (2006) In vitro and in vivo neuroprotection by [gamma]-glutamylcysteine ethyl ester against MPTP: Relevance to the role of glutathione in Parkinson's disease. Neuroscience Letters 402: 137-141.
181

CHAPTER VII- REFERENCE LIST Chiueh,C.C., Huang,S.J., and Murphy,D.L. (1992) Enhanced Hydroxyl Radical Generation by 2'-Methyl Analog of Mptp - Suppression by Clorgyline and Deprenyl. Synapse 11: 346-348.
Chu-Ping,M., Slaughter,C.A., and DeMartino,G.N. (1992) Identification, Purification, and Characterization of A Protein Activator (Pa28) of the 20-S Proteasome (Macropain). Journal of Biological Chemistry 267: 10515-10523.
Chu-Ping,M., Vu,J.H., Proske,R.J., Slaughter,C.A., and DeMartino,G.N. (1994) Identification, Purification, and Characterization of A High-Molecular-Weight, Atp-Dependent Activator (Pa700) of the 20-S Proteasome. Journal of Biological Chemistry 269: 3539-3547.
Chung,K.K.K., Dawson,V.L., and Dawson,T.M. (2001a) The role of the ubiquitin-proteasomal pathway in Parkinson's disease and other neurodegenerative disorders. Trends in Neurosciences 24: S7-S14.
Chung,K.K.K., Zhang,Y., Lim,K.L., Tanaka,Y., Huang,H., Gao,J. et al. (2001b) Parkin ubiquitinates the alpha-synuclein-interacting protein, synphilin-1: implications for Lewy-body formation in Parkinson disease. Nature Medicine 7: 1144-1150.
Ciechanover,A. (1998) The ubiquitin-proteasome pathway: on protein death and cell life. EMBO Journal 17: 7151-7160.
Ciechanover,A. (2005) Proteolysis: from the lysosome to ubiquitin and the proteasome. Nature Reviews Molecular Cell Biology 6: 79-86.
Claverol,S., Burlet-Schiltz,O., Girbal-Neuhauser,E., Gairin,J.E., and Monsarrat,B. (2002) Mapping and structural dissection of human 20 S proteasome using proteomic approaches. Molecular & Cellular Proteomics 1: 567-578.
Conn,K.J., Ullman,M.D., Eisenhauer,P.B., Fine,R.E., and Wells,J.M. (2001) Decreased expression of the NADH:ubiquinone oxidoreductase (complex I) subunit 4 in 1-methyl-4-phenylpyridinium -treated human neuroblastoma SH-SY5Y cells. Neuroscience Letters 306: 145-148.
Cookson,M.R., Mead,C., Austwick,S.M., and Pentreath,V.W. (1995) Use of the Mtt Assay for Estimating Toxicity in Primary Astrocyte and C6 Glioma Cell-Cultures. Toxicology in Vitro 9: 39-&.
Costelli,P., Reffo,P., Penna,F., Autelli,R., Bonelli,G., and Baccino,F.A. (2005) Ca2+-dependent proteolysis in muscle wasting. International Journal of Biochemistry & Cell Biology 37: 2134-2146.
Craiu,A., Gaczynska,M., Akopian,T., Gramm,C.F., Fenteany,G., Goldberg,A.L., and Rock,K.L. (1997) Lactacystin and clasto-lactacystin beta-lactone modify multiple proteasome beta-subunits and inhibit intracellular protein degradation and major histocompatibility complex class I antigen presentation. Journal of Biological Chemistry 272: 13437-13445.
Crocker,S.J., Smith,P.D., Jackson-Lewis,V., Lamba,W.R., Hayley,S.P., Grimm,E. et al. (2003) Inhibition of calpains prevents neuronal and behavioral deficits in an MPTP mouse model of Parkinson's disease. Journal of Neuroscience 23: 4081-4091.
D’Amato,R.J., Lipman,Z.P., and Snyder,S.H. (1986) Selectivity of the parkinsonian neurotoxin MPTP: toxic metabolite MPP+ binds to neuromelanin. Science 231: 987-989.
D'Andrea,M.R., Ilyin,S., and Plata-Salaman,C.R. (2001) Abnormal patterns of microtubule-associated protein-2 (MAP-2) immunolabeling in neuronal nuclei and Lewy bodies in Parkinson's disease substantia nigra brain tissues. Neuroscience Letters 306: 137-140.
Dammermann,A., Desai,A., and Oegema,K. (2003) The minus end in sight. Current Biology 13: R614-R624.
182
CHAPTER VII- REFERENCE LIST Dauer,W., and Przedborski,S. (2003) Parkinson's disease: Mechanisms and models. Neuron 39: 889-909.
David,D.C., Layfield,R., Serpell,L., Narain,Y., Goedert,M., and Spillantini,M.G. (2002) Proteasomal degradation of tau protein. Journal of Neurochemistry 83: 176-185.
Davies,K.J.A. (2001) Degradation of oxidized proteins by the 20S proteasome. Biochimie 83: 301-310.
Davis,G.C., Williams,A.C., Markey,S.P., Ebert,M.H., Caine,E.D., Reichert,C.M., and Kopin,I.J. (1979) Chronic Parkinsonism Secondary to Intravenous-Injection of Meperidine Analogs. Psychiatry Research 1: 249-254.
De Girolamo,L.A., Billett,E.E., and Hargreaves,A.J. (2000) Effects of 1-methyl-4-phenyl-1,2,3,6-tetrahydropyridine on differentiating mouse N2a neuroblastoma cells. Journal of Neurochemistry 75: 133-140.
De Girolamo,L.A., and Billett,E.E. (2006) Role of extracellular-regulated kinase and c-Jun NH2-terminal kinase in 1-methyl-4-phenyl-1,2,3,6-tetrahydropyridine-induced neurofilament phosphorylation. Journal of Neuroscience Research 83: 680-693.
de Vrij,F.M.S., Fischer,D.F., van Leeuwen,F.W., and Hol,E.M. (2004) Protein quality control in Alzheimer's disease by the ubiquitin proteasome system. Progress in Neurobiology 74: 249-270.
Delzompo,M., Piccardi,M.P., Ruiu,S., Quartu,M., Gessa,G.L., and Vaccari,A. (1993) Selective Mpp+ Uptake Into Synaptic Dopamine Vesicles - Possible Involvement in MPTP Neurotoxicity. British Journal of Pharmacology 109: 411-414.
DeMartino,G.N., and Slaughter,C.A. (1999) The proteasome, a novel protease regulated by multiple mechanisms. Journal of Biological Chemistry 274: 22123-22126.
Dexter,D.T., Wells,F.R., Lees,A.J., Agid,F., Agid,Y., Jenner,P., and Marsden,C.D. (1989) Increased Nigral Iron Content and Alterations in Other Metal-Ions Occurring in Brain in Parkinsons-Disease. Journal of Neurochemistry 52: 1830-1836.
Di Monte,D.A. (2001) The role of environmental agents in Parkinson's disease. Clinical Neuroscience Research 1: 419-426.
Di Monte,D.A. (2003) The environment and Parkinson's disease: is the nigrostriatal system preferentially targeted by neurotoxins? Lancet Neurology 2: 531-538.
Dick,L.R., Moomaw,C.R., Pramanik,B.C., DeMartino,G.N., and Slaughter,C.A. (1992) Identification and Localization of A Cysteinyl Residue Critical for the Trypsin-Like Catalytic Activity of the Proteasome. Biochemistry 31: 7347-7355.
Ding,Q., and Keller,J.N. (2001a) Proteasome inhibition in oxidative stress neurotoxicity: implications for heat shock proteins. Journal of Neurochemistry 77: 1010-1017.
Ding,Q.X., and Keller,J.N. (2001b) Proteasomes and proteasome inhibition in the central nervous system. Free Radical Biology and Medicine 31: 574-584.
Ding,Q., Reinacker,K., Dimayuga,E., Nukala,V., Drake,J., Butterfield,D.A. et al. (2003) Role of the proteasome in protein oxidation and neural viability following low-level oxidative stress. FEBS Letters 546: 228-232.
Downing,K.H., and Nogales,E. (1998) Tubulin and microtubule structure. Current Opinion in Cell Biology 10: 16-22.
183
CHAPTER VII- REFERENCE LIST Dringen,R. (2000) Metabolism and functions of glutathione in brain. Progress in Neurobiology 62: 649-671.
Duke,D.C., Moran,L.B., Kalaitzakis,M.E., Deprez,M., Dexter,D.T., Pearce,R.K.B., and Graeber,M.B. (2006) Transcriptome analysis reveals link between proteasomal and mitochondrial pathways in Parkinson's disease. Neurogenetics 7: 139-148.
Ehlers,M.D. (2003) Activity level controls postsynaptic composition and signaling via the ubiquitin-proteasome system. Nature Neuroscience 6: 231-242.
Elder,G.A., Friedrich,V.L., Bosco,P., Kang,C.H., Gourov,A., Tu,P.H. et al. (1998) Absence of the mid-sized neurofilament subunit decreases axonal calibers, levels of light neurofilament (NF-L), and neurofilament content. Journal of Cell Biology 141: 727-739.
Elkon,H., Melamed,E., and Offen,D. (2004) Oxidative stress, induced by 6-hydroxydopamine, reduces proteasome activities in PC12 cells - Implications for the pathogenesis of Parkinson's disease. Journal of Molecular Neuroscience 24: 387-400.
Eyer,J., and Peterson,A. (1994) Neurofilament-Deficient Axons and Perikaryal Aggregates in Viable Transgenic Mice Expressing A Neurofilament-Beta-Galactosidase Fusion Protein. Neuron 12: 389-405.
Facheris,M., Strain,K.J., Lesnick,T.G., de Andrade,M., Bower,J.H., Ahlskog,J.E. et al. (2005) UCHL1 is associated with Parkinson's disease: A case-unaffected sibling and case-unrelated control study. Neuroscience Letters 381: 131-134.
Farout,L., Mary,J., Vinh,J., Szweda,L.I., and Friguet,B. (2006) Inactivation of the proteasome by 4-hydroxy-2-nonenal is site specific and dependant on 20S proteasome subtypes. Archives of Biochemistry and Biophysics 453: 135-142.
Fasani,F., Bocquet,A., Robert,P., Peterson,A., and Eyer,J. (2004) The amount of neurofilaments aggregated in the cell body is controlled by their increased sensitivity to trypsin-like proteases. Journal of Cell Science 117: 861-869.
Fenteany,G., Standaert,R.F., Lane,W.S., Choi,S., Corey,E.J., and Schreiber,S.L. (1995) Inhibition of Proteasome Activities and Subunit-Specific Amino-Terminal Threonine Modification by Lactacystin. Science 268: 726-731.
Ferrell,K., Wilkinson,C.R.M., Dubiel,W., and Gordon,C. (2000) Regulatory subunit interactions of the 26S proteasome, a complex problem. Trends in Biochemical Sciences 25: 83-88.
Filloux,F., and Townsend,J.J. (1993) Presynaptic and Postsynaptic Neurotoxic Effects of Dopamine Demonstrated by Intrastriatal Injection. Experimental Neurology 119: 79-88.
Floor,E., and Wetzel,M.G. (1998) Increased protein oxidation in human substantia nigra pars compacta in comparison with basal ganglia and prefrontal cortex measured with an improved dinitrophenylhydrazine assay. Journal of Neurochemistry 70: 268-275.
Fonck,C., and Baudry,M. (2001) Toxic effects of MPP(+) and MPTP in PC12 cells independent of reactive oxygen species formation. Brain Research 905: 199-206.
Fornai,F., Lenzi,P., Gesi,M., Ferrucci,M., Lazzeri,G., Busceti,C.L. et al. (2003) Fine structure and biochemical mechanisms underlying nigrostriatal inclusions and cell death after proteasome inhibition. Journal of Neuroscience 23: 8955-8966.
Fornai,F., Schluter,O.M., Lenzi,P., Gesi,M., Ruffoli,R., Ferrucci,M. et al. (2005) Parkinson-like syndrome induced by continuous MPTP infusion: Convergent roles of the ubiquitin-proteasome
184

CHAPTER VII- REFERENCE LIST system and alpha-synuclein. Proceedings of the National Academy of Sciences of the United States of America 102: 3413-3418.
Forno,L.S., Sternberger,L.A., Sternberger,N.H., Strefling,A.M., Swanson,K., and Eng,L.F. (1986) Reaction of Lewy Bodies with Antibodies to Phosphorylated and Nonphosphorylated Neurofilaments. Neuroscience Letters 64: 253-258.
Forno,L.S., Langston,J.W., Delanney,L.E., and Irwin,I. (1988) An Electron-Microscopic Study of Mptp-Induced Inclusion-Bodies in An Old Monkey. Brain Research 448: 150-157.
Forno,L.S. (1996) Neuropathology of Parkinson's disease. Journal of Neuropathology and Experimental Neurology 55: 259-272.
Fowler,J.S., Volkow,N.D., Wang,G.J., Pappas,N., Logan,J., MacGregor,R. et al. (1996) Inhibition of monoamine oxidase B in the brains of smokers. Nature 379: 733-736.
Gaczynska,M., Rodriguez,K., Madabhushi,S., and Osmulski,P.A. (2006) Highbrow proteasome in high-throughput technology. Expert Review of Proteomics 3: 115-127.
Gai,W.P., Yuan,H.X., Li,X.Q., Power,J.T.H., Blumbergs,P.C., and Jensen,P.H. (2000) In situ and in vitro study of colocalization and segregation of alpha-synuclein, ubiquitin, and lipids in Lewy bodies. Experimental Neurology 166: 324-333.
Galloway,P.G., Grundkeiqbal,I., Iqbal,K., and Perry,G. (1988) Lewy Bodies Contain Epitopes Both Shared and Distinct from Alzheimer Neurofibrillary Tangles. Journal of Neuropathology and Experimental Neurology 47: 654-663.
Galvin,J.E., Lee,V.M.Y., Baba,M., Mann,D.M.A., Dickson,D.W., Yamaguchi,H. et al. (1997) Monoclonal antibodies to purified cortical lewy bodies recognize the mid-size neurofilament subunit. Annals of Neurology 42: 595-603.
Gandhi,S., Muqit,M.M.K., Stanyer,L., Healy,D.G., bou-Sleiman,P.M., Hargreaves,I. et al. (2006) PINK1 protein in normal human brain and Parkinson's disease. Brain 129: 1720-1731.
Gard,D.L., and Lazarides,E. (1982) Cyclic Amp-Modulated Phosphorylation of Intermediate Filament Proteins in Cultured Avian Myogenic Cells. Molecular and Cellular Biology 2: 1104-1114.
Giasson,B.I., Duda,J.E., Murray,I.V.J., Chen,Q.P., Souza,J.M., Hurtig,H.I. et al. (2000) Oxidative damage linked to neurodegeneration by selective alpha-synuclein nitration in synucleinopathy lesions. Science 290: 985-989.
Gimenez-Xavier,P., Gomez-Santos,C., Castano,E., Francisco,R., Boada,J., Unzeta,M. et al. (2006) The decrease of NAD(P)H has a prominent role in dopamine toxicity. Biochimica et Biophysica Acta-Molecular Basis of Disease 1762: 564-574.
Glickman,M.H., and Raveh,D. (2005) Proteasome plasticity. FEBS Letters 579: 3214-3223.
Gluck,M.R., and Zeevalk,G.D. (2004) Inhibition of brain mitochondrial respiration by dopamine and its metabolites: implications for Parkinson's disease and catecholamine-associated diseases. Journal of Neurochemistry 91: 788-795.
Goedert,M. (2001) The significance of tau and alpha-synuclein inclusions in neurodegenerative diseases. Curr Opin Genet Dev 11: 343-351.
Goldberg,A.L. (1995) Functions of the Proteasome - the Lysis at the End of the Tunnel. Science 268: 522-523.
185
CHAPTER VII- REFERENCE LIST Goldman,R.D., Chou,Y.H., Prahlad,V., and Yoon,M. (1999) Intermediate filaments: dynamic processes regulating their assembly, motility, and interactions with other cytoskeletal systems. FASEB Journal 13: S261-S265.
Goll,D.E., Thompson,V.F., Li,H.Q., Wei,W., and Cong,J.Y. (2003) The calpain system. Physiological Reviews 83: 731-801.
Gomez-Santos,C., Ferrer,I., Reiriz,J., Vinals,F., Barrachina,M., and Ambrosio,S. (2002) MPP+ increases alpha-synuclein expression and ERK/MAP-kinase phosphorylation in human neuroblastoma SH-SY5Y cells. Brain Research 935: 32-39.
Gomez-Santos,C., Ferrer,I., Santidrian,A.F., Barrachina,M., Gil,J., and Ambrosio,S. (2003) Dopamine induces autophagic cell death and alpha-synuclein increase in human neuroblastoma SH-SY5Y cells. Journal of Neuroscience Research 73: 341-350.
Gomez-Santos,C., Barrachina,M., Gimenez-Xavier,P., Dalfo,E., Ferrer,I., and Ambrosio,S. (2005) Induction of C/EBPP and GADD153 expression by dopamine in human neuroblastoma cells relationship with alpha-synuclein increase and cell damage. Brain Research Bulletin 65: 87-95.
Gonzalez-Polo,R.A., Soler,G., Rodriguezmartin,A., Moran,J.M., and Fuentes,J.M. (2004) Protection against MPP+ neurotoxicity in cerebellar granule cells by antioxidants. Cell Biology International 28: 373-380.
Good,P.F., Hsu,A., Werner,P., Perl,D.P., and Olanow,C.W. (1998) Protein nitration in Parkinson's disease. Journal of Neuropathology and Experimental Neurology 57: 338-342.
Gou,J.P., and Leterrier,J.F. (1995) Possible involvement of ubiquitination in neurofilament degradation. Biochemical and Biophysical Research Communications 217: 529-538.
Graham,D.G., Tiffany,S.M., Bell,W.R., and Gutknecht,W.F. (1978) Autoxidation Versus Covalent Binding of Quinones As Mechanism of Toxicity of Dopamine, 6-Hydroxydopamine, and Related Compounds Toward C1300-Neuroblastoma Cells Invitro. Molecular Pharmacology 14: 644-653.
Grant,P., and Pant,H.C. (2000) Neurofilament protein synthesis and phosphorylation. Journal of Neurocytology 29: 843-872.
Grant,P., Sharma,P., and Pant,H.C. (2001) Cyclin-dependent protein kinase 5 (Cdk5) and the regulation of neurofilament metabolism. Europen Journal of Biochemistry 268: 1534-1546.
Groll,M., Ditzel,L., Lowe,J., Stock,D., Bochtler,M., Bartunik,H.D., and Huber,R. (1997) Structure of 20S proteasome from yeast at 2.4 angstrom resolution. Nature 386: 463-471.
Groll,M., Bajorek,M., Kohler,A., Moroder,L., Rubin,D.M., Huber,R. et al. (2000) A gated channel into the proteasome core particle. Nature Structural Biology 7: 1062-1067.
Groll,M., and Huber,R. (2003) Substrate access and processing by the 20S proteasome core particle. International Journal of Biochemistry & Cell Biology 35: 606-616.
Groll,M., and Huber,R. (2004) Inhibitors of the eukaryotic 20S proteasome core particle: a structural approach. Biochimica et Biophysica Acta-Molecular Cell Research 1695: 33-44.
Grune,T., Merker,K., Sandig,G., and Davies,K.J.A. (2003) Selective degradation of oxidatively modified protein substrates by the proteasome. Biochemical and Biophysical Research Communications 305: 709-718.
186

CHAPTER VII- REFERENCE LIST Grune,T., Jung,T., Merker,K., and Davies,K.J.A. (2004) Decreased proteolysis caused by protein aggregates, inclusion bodies, plaques, lipofuscin, ceroid and aggresomes; during oxidative stress, aging, and disease. The International Journal of Biochemistry & Cell Biology 36: 2519-2530.
Grynspan,F., Griffin,W.R., Cataldo,A., Katayama,S., and Nixon,R.A. (1997) Active site-directed antibodies identify calpain II as an early-appearing and pervasive component of neurofibrillary pathology in Alzheimer's disease. Brain Research 763: 145-158.
Gu,M., Owen,A.D., Toffa,S.E.K., Cooper,J.M., Dexter,D.T., Jenner,P. et al. (1998) Mitochondrial function, GSH and iron in neurodegeneration and Lewy body diseases. Journal of the Neurological Sciences 158: 24-29.
Hamre,K., Tharp,R., Poon,K., Xiong,X.P., and Smeyne,R.J. (1999) Differential strain susceptibility following 1-methyl-4-phenyl-1,2,3,6-tetrahydropyridine (MPTP) administration acts in an autosomal dominant fashion: quantitative analysis in seven strains of Mus musculus. Brain Research 828: 91-103.
Harrower,T.P., Michell,A.W., and Barker,R.A. (2005) Lewy bodies in Parkinson's disease: Protectors or perpetrators? Experimental Neurology 195: 1-6.
Hartley,C.L., Anderson,V.E., Anderton,B.H., Robertson,J., and Anderson,B.H. (1997) Acrylamide and 2,5-hexanedione induce collapse of neurofilaments in SH-SY5Y human neuroblastoma cells to form perikaryal inclusion bodies. Neuropathological Applications in Neurobiology 23: 364-372.
Hartmann-Petersen,R., Seeger,M., and Gordon,C. (2003) Transferring substrates to the 26S proteasome. Trends in Biochemical Sciences 28: 26-31.
Haywood,A.F.M., and Staveley,B.E. (2004) Parkin counteracts symptoms in a Drosophila model of Parkinson's disease. BMC Neuroscience 5.
Heinemeyer,W., Fischer,M., Krimmer,T., Stachon,U., and Wolf,D.H. (1997) The active sites of the eukaryotic 20 S proteasome and their involvement in subunit precursor processing. Journal of Biological Chemistry 272: 25200-25209.
Hernan,M.A., Takkouche,B., Caamano-Isorna,F., and Gestal-Otero,J.J. (2002) A meta-analysis of coffee drinking, cigarette smoking, and the risk of Parkinson's disease. Annals of Neurology 52: 276-284.
Hernandez,D., Ruiz,C.P., Crawley,A., Malkani,R., Werner,J., Gwinn-Hardy,K. et al. (2005) The dardarin G2019S mutation is a common cause of Parkinson's disease but not other neurodegenerative diseases. Neuroscience Letters 389: 137-139.
Hershko,A., and Ciechanover,A. (1998) The ubiquitin system. Annual Review of Biochemistry 67: 425-479.
Hicke,L. (2001) Protein regulation by monoubiquitin. Nature Reviews Molecular Cell Biology 2: 195-201.
Hilt,W., Heinemeyer,W., and Wolf,D.H. (1993) Studies on the Yeast Proteasome Uncover Its Basic Structural Features and Multiple In-Vivo Functions. Enzyme & Protein 47: 189-201.
Hirokawa,N., and Takeda,S. (1998) Gene targeting studies begin to reveal the function of neurofilament proteins (vol 143, pg 1, 1998). Journal of Cell Biology 143: 1143.
Hoglinger,G.U., Carrard,G., Michel,P.P., Medja,F., Lombes,A., Ruberg,M. et al. (2003) Dysfunction of mitochondrial complex I and the proteasome: interactions between two biochemical deficits in a cellular model of Parkinson's disease. Journal of Neurochemistry 86: 1297-1307.
187
CHAPTER VII- REFERENCE LIST Huang,Y., Cheung,L., Rowe,D., and Halliday,G. (2004) Genetic contributions to Parkinson's disease. Brain Research Reviews 46: 44-70.
Hughes,G., Murphy,M.P., and Ledgerwood,E.C. (2005) Mitochondrial reactive oxygen species regulate the temporal activation of nuclear factor kappa B to modulate tumour necrosis factor-induced apoptosis: evidence from mitochondria-targeted antioxidants. Biochemical Journal 389: 83-89.
Hyun,D.H., Lee,M.H., Halliwell,B., and Jenner,P. (2002) Proteasomal dysfunction induced by 4-hydroxy-2,3-trans-nonenal, an end-product of lipid peroxidation: a mechanism contributing to neurodegeneration? Journal of Neurochemistry 83: 360-370.
Imai,J., Maruya,M., Yashiroda,H., Yahara,I., and Tanaka,K. (2003) The molecular chaperone Hsp90 plays a role in the assembly and maintenance of the 26S proteasome. EMBO Journal 22: 3557-3567.
Imai,Y., Soda,M., Inoue,H., Hattori,N., Mizuno,Y., and Takahashi,R. (2001) An unfolded putative transmembrane polypeptide, which can lead to endoplasmic reticulum stress, is a substrate of parkin. Cell 105: 891-902.
Jager,S., Groll,M., Huber,R., Wolf,D.H., and Heinemeyer,W. (1999) Proteasome beta-type subunits: Unequal roles of propeptides in core particle maturation and a hierarchy of active site function. Journal of Molecular Biology 291: 997-1013.
Janmey,P.A. (1998) The cytoskeleton and cell signaling: component localization and mechanical coupling. Physioly Reviews 78: 763-781.
Jellinger,K., Linert,L., Kienzl,E., Herlinger,E., and Youdim,M.B.H. (1995) Chemical evidence for 6-hydroxydopamine to be an endogenous toxic factor in the pathogenesis of Parkinson's disease. Journal of Neural Transmission-Supplement: 297-314.
Jenner,P., and Olanow,C.W. (1996) Oxidative stress and the pathogenesis of Parkinson's disease. Neurology 47: S161-S170.
Jha,N., Jurma,O., Lalli,G., Liu,Y., Pettus,E.H., Greenamyre,J.T. et al. (2000) Glutathione depletion in PC12 results in selective inhibition of mitochondrial complex I activity - Implications for Parkinson's disease. Journal of Biological Chemistry 275: 26096-26101.
Jha,N., Kumar,M.J., Boonplueang,R., and Andersen,J.K. (2002) Glutathione decreases in dopaminergic PC12 cells interfere with the ubiquitin protein degradation pathway: relevance for Parkinson's disease? Journal of Neurochemistry 80: 555-561.
Johannessen,J.N., Kelner,L., Hanselman,D., Shih,M.C., and Markey,S.P. (1985) Invitro Oxidation of Mptp by Primate Neural Tissue - A Potential Model of Mptp Neurotoxicity. Neurochemistry International 7: 169-176.
Johnson,E.S., Ma,P.C.M., Ota,I.M., and Varshavsky,A. (1995) A Proteolytic Pathway That Recognizes Ubiquitin As A Degradation Signal. Journal of Biological Chemistry 270: 17442-17456.
Julien,J.P. (1999) Neurofilament functions in health and disease. Current Opinion in Neurobiology 9: 554-560.
Jung,C.W., Lee,S., Ortiz,D., Zhu,Q.Z., Julien,J.P., and Shea,T.B. (2005) The high and middle molecular weight neurofilament subunits regulate the association of neurofilaments with kinesin: Inhibition by phosphorylation of the high molecular weight subunit. Molecular Brain Research 141: 151-155.
188
CHAPTER VII- REFERENCE LIST Junn,E., and Mouradian,M.M. (2001) Apoptotic signaling in dopamine-induced cell death: the role of oxidative stress, p38 mitogen-activated protein kinase, cytochrome c and caspases. Journal of Neurochemistry 78: 374-383.
Kass,G.E., Wright,J.M., Nicotera,P., and Orrenius,S. (1988) The mechanism of 1-methyl-4-phenyl-1,2,3,6-tetrahydropyridine toxicity: role of intracellular calcium. Archives in Biochemistry and Biophysics 260: 789-797.
Keeney,P.M., Xie,J., Capaldi,R.A., and Bennett,J.P. (2006) Parkinson's disease brain mitochondrial complex I has oxidatively damaged subunits and is functionally impaired and misassembled. Journal of Neuroscience 26: 5256-5264.
Keller,J.N., Huang,F.F., Dimayuga,E.R., and Maragos,W.F. (2000) Dopamine induces proteasome inhibition in neural PC12 cell line. Free Radical Biology and Medicine 29: 1037-1042.
Kisselev,A.F., Akopian,T.N., Castillo,V., and Goldberg,A.L. (1999) Proteasome active sites allosterically regulate each other, suggesting a cyclical bite-chew mechanism for protein breakdown. Molecular Cell 4: 395-402.
Kisselev,A.F., and Goldberg,A.L. (2001) Proteasome inhibitors: from research tools to drug candidates. Chemistry & Biology 8: 739-758.
Kisselev,A.F., and Goldberg,A. (2005) Monitoring activity and inhibition of 26S proteasomes with fluorogenic peptide substrates, Methods in Enzymology 398: 364-378.
Kitada,T., Asakawa,S., Hattori,N., Matsumine,H., Yamamura,Y., Minoshima,S. et al. (1998) Mutations in the parkin gene cause autosomal recessive juvenile parkinsonism. Nature 392: 605-608.
Klaidman,L.K., Adams,J.D., Leung,A.C., Kim,S.S., and Cadenas,E. (1993) Redox Cycling of Mpp+ - Evidence for A New Mechanism Involving Hydride Transfer with Xanthine-Oxidase, Aldehyde Dehydrogenase, and Lipoamide Dehydrogenase. Free Radical Biology and Medicine 15: 169-179.
Kopin,I.J., and Markey,S.P. (1988) Mptp Toxicity - Implications for Research in Parkinsons-Disease. Annual Review of Neuroscience 11: 81-96.
Kopito,R.R. (2000) Aggresomes, inclusion bodies and protein aggregation. Trends in Cell Biology 10: 524-530.
Kopp,F., Hendil,K.B., Dahlmann,B., Kristensen,P., Sobek,A., and Uerkvitz,W. (1997) Subunit arrangement in the human 20S proteasome. Proceedings of the National Academy of Sciences of the United States of America 94: 2939-2944.
Kowall,N.W., Hantraye,P., Brouillet,E., Beal,M.F., Mckee,A.C., and Ferrante,R.J. (2000) MPTP induces alpha-synuclein aggregation in the substantia nigra of baboons. Neuroreport 11: 211-213.
Kramer,B.C., Yabut,J.A., Cheong,J., Jnobaptiste,R., Robakis,T., Olanow,C.W., and Mytilineou,C. (2004) Toxicity of glutathione depletion in mesencephalic cultures: a role for arachidonic acid and its lipoxygenase metabolites. European Journal of Neuroscience 19: 280-286.
Kruger,R., Kuhn,W., Muller,T., Woitalla,D., Graeber,M., Kosel,S. et al. (1998) Ala30Pro mutation in the gene encoding alpha-synuclein in Parkinson's disease. Nature Genetics 18: 106-108.
Kruger,R., Fischer,C., Schulte,T., Strauss,K.M., Muller,T., Woitalla,D. et al. (2003) Mutation analysis of the neurofilament M gene in Parkinson's disease. Neuroscience Letters 351: 125-129.
189
CHAPTER VII- REFERENCE LIST Kunz,S., Niederberger,E., Ehnert,C., Coste,O., Pfenninger,A., Kruip,J. et al. (2004) The calpain inhibitor MDL 28170 prevents inflammation-induced neurofilament light chain breakdown in the spinal cord and reduces thermal hyperalgesia. Pain 110: 409-418.
Kupina,N.C., Detloff,M.R., Bobrowski,W.F., Snyder,B.J., and Hall,E.D. (2003) Cytoskeletal protein degradation and neurodegeneration evolves differently in males and females following experimental head injury. Experimental Neurology 180: 55-72.
Lai,M., Griffiths,H., Pall,H., Williams,A., and Lunec,J. (1993) An Investigation Into the Role of Reactive Oxygen Species in the Mechanism of 1-Methyl-4-Phenyl-1,2,3,6-Tetrahydropyridine Toxicity Using Neuronal Cell-Lines. Biochemical Pharmacology 45: 927-933.
Langston,J.W., Ballard,P., Tetrud,J.W., and Irwin,I. (1983) Chronic Parkinsonism in humans due to a product of meperidine-analog synthesis. Science 219: 979-980.
Langston,J.W., and Irwin,I. (1986) Mptp - Current Concepts and Controversies. Clinical Neuropharmacology 9: 485-507.
Langston,J.W. (2002) Parkinson's disease: Current and future challenges. NeuroToxicology 23: 443-450.
Lasek,R.J., Paggi,P., and Katz,M.J. (1993) The Maximum Rate of Neurofilament Transport in Axons - A View of Molecular-Transport Mechanisms Continuously Engaged. Brain Research 616: 58-64.
Lavedan,C., Buchholtz,S., Nussbaum,R.L., Albin,R.L., and Polymeropoulos,M.H. (2002) A mutation in the human neurofilament M gene in Parkinson's disease that suggests a role for the cytoskeleton in neuronal degeneration. Neuroscience Letters 322: 57-61.
Le,W., and Appel,S.H. (2004) Mutant genes responsible for Parkinson’s disease. Current Opinion in Pharmacology 4: 79-84.
Lee,D.H., and Goldberg,A.L. (1998) Proteasome inhibitors: valuable new tools for cell biologists. Trends in Cell Biology 8: 397-403.
Lee,F.J., Liu,F., Pristupa,Z.B., and Niznik,H.B. (2001) Direct binding and functional coupling of alpha-synuclein to the dopamine transporters accelerate dopamine-induced apoptosis. FASEB Journal 15: 916-926.
Lee,G., Junn,E., Tanaka,M., Kim,Y.M., Lee,S.S., and Mouradian,M.M. (2002) Synphilin-1 degradation by the ubiquitin-proteasome pathway and effects on cell survival. Journal of Neurochemistry 83: 346-352.
Lee,H.S., Park,C.W., and Kim,Y.S. (2000a) MPP+ Increases the Vulnerability to Oxidative Stress Rather Than Directly Mediating Oxidative Damage in Human Neuroblastoma Cells. Experimental Neurology 165: 164-171.
Lee,M.K., and Cleveland,D.W. (1996) Neuronal intermediate filaments. Annual Review of Neuroscience 19: 187-217.
Lee,M.S., Kwon,Y.T., Li,M., Peng,J., Friedlander,R.M., and Tsai,L.H. (2000b) Neurotoxicity induces cleavage of p35 to p25 by calpain. Nature 405: 360-364.
Leroy,E., Boyer,R., Auburger,G., Leube,B., Ulm,G., Mezey,E. et al. (1998) The ubiquitin pathway in Parkinson's disease. Nature 395: 451-452.
190
CHAPTER VII- REFERENCE LIST Leterrier,J.F., Kas,J., Hartwig,J., Vegners,R., and Janmey,P.A. (1996) Mechanical effects of neurofilament cross-bridges - Modulation by phosphorylation, lipids, and interactions with F-actin. Journal of Biological Chemistry 271: 15687-15694.
Liao,G.J., and Gundersen,G.G. (1998) Kinesin is a candidate for cross-bridging microtubules and intermediate filaments - Selective binding of kinesin to detyrosinated tobulin and vimentin. Journal of Biological Chemistry 273: 9797-9803.
Liou,H.H., Tsai,M.C., Chen,C.J., Jeng,J.S., Chang,Y.C., Chen,S.Y., and Chen,R.C. (1997) Environmental risk factors and Parkinson's disease: A case-control study in Taiwan. Neurology 48: 1583-1588.
Liu,Y.C., Fallon,L., Lashuel,H.A., Liu,Z.H., and Lansbury,P.T. (2002) The UCH-L1 gene encodes two opposing enzymatic activities that affect alpha-synuclein degradation and Parkinson's disease susceptibility. Cell 111: 209-218.
Lopiano,L., Fasano,M., Giraudo,S., Digilio,G., Koenig,S.H., Torre,E. et al. (2000) Nuclear magnetic relaxation dispersion profiles of substantia nigra pars compacta in Parkinson's disease patients are consistent with protein aggregation. Neurochemistry International 37: 331-336.
Lotharius,J., and Malley,K.L. (2000) The parkinsonism-inducing drug 1-methyl-4-phenylpyridinium triggers intracellular dopamine oxidation. A novel mechanism of toxicity. Journal of Biological Chemistry 275: 38581-38588.
Lowe,J., Lennox,G., Jefferson,D., Morrell,K., Mcquire,D., Gray,T. et al. (1988) A Filamentous Inclusion Body Within Anterior Horn Neurons in Motor Neuron Disease Defined by Immunocytochemical Localization of Ubiquitin. Neuroscience Letters 94: 203-210.
Lowry, O.H., Rosebrough, N.J., Farr A.L. and Radall, R.J. (1951). Protein measurement with the Folin phenol reagent. Journal of Biological Chemistry 193: 265-275. Mandelkow,E.M., Mandelkow,E., and Milligan,R.A. (1991) Microtubule dynamics and microtubule caps: a time-resolved cryo-electron microscopy study. Trends in Cell Biology 1: 153.
Maraganore,D.M., Farrer,M.J., Hardy,J.A., Lincoln,S.J., McDonnell,S.K., and Rocca,W.A. (1999) Case-control study of the ubiquitin carboxy-terminal hydrolase L1 gene in Parkinson's disease. Neurology 53: 1858-1860.
Maries,E., Dass,B., Collier,T.J., Kordower,J.H., and Steece-Collier,K. (2003) The role of alpha-synuclein in Parkinson's disease: Insights from animal models. Nature Reviews Neuroscience 4: 727-738.
Martensson,J., Jain,A., Stole,E., Frayer,W., Auld,P.A.M., and Meister,A. (1991) Inhibition of Glutathione Synthesis in the Newborn Rat - A Model for Endogenously Produced Oxidative Stress. Proceedings of the National Academy of Sciences of the United States of America 88: 9360-9364.
Masaki,R., Saito,T., Yamada,K., and Ohtani,K. (2000) Accumulation of phosphorylated neurofilaments and increase in apoptosis-specific protein and phosphorylated c-Jun induced by proteasome inhibitors. Journal of Neuroscience Research 62: 75-83.
Matsuzaki,M., Hasegawa,T., Takeda,A., Kikuchi,A., Furukawa,K., Kato,Y., and Itoyama,Y. (2004) Histochemical features of stress-induced aggregates in alpha-synuclein overexpressing cells. Brain Research 1004: 83-90.
Mazzio,E.A., Reams,R.R., and Soliman,K.F.A. (2004) The role of oxidative stress, impaired glycolysis and mitochondrial respiratory redox failure in the cytotoxic effects of 6-hydroxydopamine in vitro. Brain Research 1004: 29-44.
191
CHAPTER VII- REFERENCE LIST McCormack,A.L., Thiruchelvam,M., Manning-Bog,A.B., Thiffault,C., Langston,J.W., Cory-Slechta,D.A., and Di Monte,D.A. (2002) Environmental risk factors and Parkinson's disease: Selective degeneration of nigral dopaminergic neurons caused by the herbicide paraquat. Neurobiology of Disease 10: 119-127.
McNaught,K.S., Mytilineou,C., Jnobaptiste,R., Yabut,J., Shashidharan,P., Jennert,P., and Olanow,C.W. (2002) Impairment of the ubiquitin-proteasome system causes dopaminergic cell death and inclusion body formation in ventral mesencephalic cultures. Journal of Neurochemistry 81 : 301-306.
McNaught,K.S., and Olanow,C.W. (2003) Proteolytic stress: A unifying concept for the etiopathogenesis of Parkinson's disease. Annals of Neurology 53: S73-S84.
McNaught,K.S.P., Olanow,C.W., Halliwell,B., Isacson,O., and Jenner,P. (2001) Failure of the ubiquitin-proteasome system in Parkinson's disease. Nature Reviews Neuroscience 2: 589-594.
McNaught,K.S.P., and Jenner,P. (2001) Proteasomal function is impaired in substantia nigra in Parkinson's disease. Neuroscience Letters 297: 191-194.
McNaught,K.S., and Olanow,C.W. (2006) Protein aggregation in the pathogenesis of familial and sporadic Parkinson's disease. Neurobiology of Aging 27: 530-545.
Mehdi,S. (1991) Cell-Penetrating Inhibitors of Calpain. Trends in Biochemical Sciences 16: 150-153.
Meredith,G.E., Totterdell,S., Petroske,E., Cruz,K.S., Callison,R.C., and Lau,Y.S. (2002) Lysosomal malfunction accompanies alpha-synuclein aggregation in a progressive mouse model of Parkinson's disease. Brain Research 956: 156-165.
Meredith,G.E., Halliday,G.M., and Totterdell,S. (2004) A critical review of the development and importance of proteinaceous aggregates in animal models of Parkinson's disease: new insights into Lewy body formation. Parkinsonism & Related Disorders 10: 191-202.
Michel,P.P., and Hefti,F. (1990) Toxicity of 6-Hydroxydopamine and Dopamine for Dopaminergic-Neurons in Culture. Journal of Neuroscience Research 26: 428-435.
Mishizen-Eberz,A.J., Norris,E.H., Giasson,B.I., Hodara,R., Ischiropoulos,H., Lee,V.M.Y. et al. (2005) Cleavage of alpha-synuclein by calpain: Potential role in degradation of fibrillized and nitrated species of alpha-synuclein. Biochemistry 44: 7818-7829.
Mitchison,T., and Kirschner,M. (1984) Microtubule Assembly Nucleated by Isolated Centrosomes. Nature 312: 232-237.
Miwa,H., Kubo,T., Suzuki,A., Nishi,K., and Kondo,T. (2005) Retrograde dopaminergic neuron degeneration following intrastriatal proteasome inhibition. Neuroscience Letters 380: 93-98.
Moldoveanu,T., Hosfield,C.M., Lim,D., Elce,J.S., Jia,Z.C., and Davies,P.L. (2002) A Ca2+ switch aligns the active site of calpain. Cell 108: 649-660.
Morikawa,N., NakagawaHattori,Y., and Mizuno,Y. (1996) Effect of dopamine, dimethoxyphenylethylamine, papaverine, and related compounds on mitochondrial respiration and complex I activity. Journal of Neurochemistry 66: 1174-1181.
MouattPrigent,A., Karlsson,J.O., Agid,Y., and Hirsch,E.C. (1996) Increased M-calpain expression in the mesencephalon of patients with Parkinson's disease but not in other neurodegenerative disorders involving the mesencephalon: A role in nerve cell death? Neuroscience 73: 979-987.
192

CHAPTER VII- REFERENCE LIST Moyal-Segal,L., and Soreq,H. (2006) Gene-environment interactions in sporadic Parkinson's disease. Journal of Neurochemistry 97: 1740-1755.
Muchowski,P.J., and Wacker,J.L. (2005) Modulation of neurodegeneration by molecular chaperones. Nature Reviews Neuroscience 6: 11-22.
Murakami,Y., Matsufuji,S., Kameji,T., Hayashi,S., Igarashi,K., Tamura,T. et al. (1992) Ornithine Decarboxylase Is Degraded by the 26S-Proteasome Without Ubiquitination. Nature 360: 597-599.
Mytilineou,C., Kramer,B.C., and Yabut,J.A. (2002) Glutathione depletion and oxidative stress. Parkinsonism & Related Disorders 8: 385-387.
Myung,J., Kim,K.B., Lindsten,K., Dantuma,N.P., and Crews,C.M. (2001) Lack of proteasome active site allostery as revealed by subunit-specific inhibitors. Molecular Cell 7: 411-420.
Nakagawa,T., Chen,J.G., Zhang,Z.Z., Kanai,Y., and Hirokawa,N. (1995) 2 Distinct Functions of the Carboxyl-Terminal Tail Domain of Nf-M Upon Neurofilament Assembly - Cross-Bridge Formation and Longitudinal Elongation of Filaments. Journal of Cell Biology 129: 411-429.
Nakanishi,H. (2003) Neuronal and microglial cathepsins in aging and age-related diseases. Ageing Research Reviews 2: 367-381.
Nixon,R.A., and Lewis,S.E. (1986) Differential turnover of phosphate groups on neurofilament subunits in mammalian neurons in vivo. Journal of Biological Chemistry 261: 16298-16301.
Nixon,R.A., and Logvinenko,K.B. (1986) Multiple Fates of Newly Synthesized Neurofilament Proteins - Evidence for A Stationary Neurofilament Network Distributed Nonuniformly Along Axons of Retinal Ganglion-Cell Neurons. Journal of Cell Biology 102: 647-659.
Nixon,R.A. (1986) Fodrin Degradation by Calcium-Activated Neutral Proteinase (Canp) in Retinal Ganglion-Cell Neurons and Optic Glia - Preferential Localization of Canp Activities in Neurons. Journal of Neuroscience 6: 1264-1271.
Nixon,R.A., and Sihag,R.K. (1991) Neurofilament phosphorylation: a new look at regulation and function. Trends Neurosci 14: 501-506.
Nixon,R.A., Paskevich,P.A., Sihag,R.K., and Thayer,C.Y. (1994) Phosphorylation on Carboxyl-Terminus Domains of Neurofilament Proteins in Retinal Ganglion-Cell Neurons In-Vivo - Influences on Regional Neurofilament Accumulation, Interneurofilament Spacing, and Axon Caliber. Journal of Cell Biology 126: 1031-1046.
Nixon,R.A. (1998) The slow axonal transport of cytoskeletal proteins. Current Opinion in Cell Biology 10: 87-92.
Nixon,R.A. (2003) The calpains in aging and aging-related diseases. Ageing Research Reviews 2: 407-418.
Ohara,O., Gahara,Y., Miyake,T., Teraoka,H., and Kitamura,T. (1993) Neurofilament Deficiency in Quail Caused by Nonsense Mutation in Neurofilament-l Gene. Journal of Cell Biology 121: 387-395.
Olanow,C.W., Perl,D.P., DeMartino,G.N., and McNaught,K.S.P. (2004) Lewy-body formation is an aggresome-related process: a hypothesis. Lancet Neurology 3: 496-503.
Pant,H.C. (1988) Dephosphorylation of Neurofilament Proteins Enhances Their Susceptibility to Degradation by Calpain. Biochemical Journal 256: 665-668.
193

CHAPTER VII- REFERENCE LIST Parker,W.D., Boyson,S.J., and Parks,J.K. (1989) Abnormalities of the Electron-Transport Chain in Idiopathic Parkinsons-Disease. Annals of Neurology 26: 719-723.
Perier,C., Bove,J., Vila,M., and Przedborski,S. (2003) The rotenone model of Parkinson's disease. Trends in Neurosciences 26: 345-346.
Perry,T.L., Godin,D.V., and Hansen,S. (1982) Parkinsons-Disease - A Disorder Due to Nigral Glutathione Deficiency. Neuroscience Letters 33: 305-310.
Petzold,A. (2005) Neurofilament phosphoforms: Surrogate markers for axonal injury, degeneration and loss. Journal of the Neurological Sciences 233: 183-198.
Pickart,C.M. (2001) Mechanisms underlying ubiquitination. Annual Review of Biochemistry 70: 503-533.
Pines,J., and Lindon,C. (2005) Proteolysis: anytime, any place, anywhere? Nature Cell Biology 7: 731-735.
Pollanen,M.S., Bergeron,C., and Weyer,L. (1993) Deposition of Detergent-Resistant Neurofilaments Into Lewy Body Fibrils. Brain Research 603: 121-124.
Polymeropoulos,M.H., Lavedan,C., Leroy,E., Ide,S.E., Dehejia,A., Dutra,A. et al. (1997) Mutation in the alpha-synuclein gene identified in families with Parkinson's disease. Science 276: 2045-2047.
Prahlad,V., Helfand,B.T., Langford,G.M., Vale,R.D., and Goldman,R.D. (2000) Fast transport of neurofilament protein along microtubules in squid axoplasm. Journal of Cell Science 113: 3939-3946.
Pramstaller,P.P., Schlossmacher,M.G., Jacques,T.S., Scaravilli,F., Eskelson,C., Pepivani,I. et al. (2005) Lewy body Parkinson's disease in a large pedigree with 77 Parkin mutation carriers. Annals of Neurology 58: 411-422.
Prasad,K.N., Cole,W.C., and Kumar,B. (1999) Multiple antioxidants in the prevention and treatment of Parkinson's disease. Journal of American College of Nutrition 18: 413-423.
Przedborski,S., and Vila,M. (2001) MPTP: a review of its mechanisms of neurotoxicity. Clinical Neuroscience Research 1: 407-418.
Przedborski,S. (2005) Pathogenesis of nigral cell death in Parkinson's disease. Parkinsonism & Related Disorders 11: S3-S7.
Ramsay,R.R., and Singer,T.P. (1986) Energy-Dependent Uptake of N-Methyl-4-Phenylpyridinium, the Neurotoxic Metabolite of 1-Methyl-4-Phenyl-1,2,3,6-Tetrahydropyridine, by Mitochondria. Journal of Biological Chemistry 261: 7585-7587.
Rao,M.V., Houseweart,M.K., Williamson,T.L., Crawford,T.O., Folmer,J., and Cleveland,D.W. (1998) Neurofilament-dependent radial growth of motor axons and axonal organization of neurofilaments does not require the neurofilament heavy subunit (NF-H) or its phosphorylation. Journal of Cell Biology 143: 171-181.
Ray,S.K., Wilford,G.G., Ali,S.F., and Banik,N.L. (2000) Calpain upregulation in spinal cords of mice with 1-methyl-4-phenyl-1,2,3,6-tetrahydropyridine (MPTP)-induced Parkinson's disease, Annals of the New York Academy of Sciences 914: 275-283 2000
Reinheckel,T., Sitte,N., Ullrich,O., Kuckelkorn,U., Davies,K.J., and Grune,T. (1998) Comparative resistance of the 20S and 26S proteasome to oxidative stress. Biochemical Journal 335 ( Pt 3): 637-642.
194
CHAPTER VII- REFERENCE LIST Riederer,P., Sofic,E., Rausch,W.D., Schmidt,B., Reynolds,G.P., Jellinger,K., and Youdim,M.B.H. (1989) Transition-Metals, Ferritin, Glutathione, and Ascorbic-Acid in Parkinsonian Brains. Journal of Neurochemistry 52: 515-520.
Rivett,A.J. (1998) Intracellular distribution of proteasomes. Current Opinion in Immunology 10: 110-114.
Rivett,A.J., Bose,S., Brooks,P., and Broadfoot,K.I. (2001) Regulation of proteasome complexes by gamma-interferon and phosphorylation. Biochimie 83: 363-366.
Rivett,A.J., Bose,S., Pemberton,A.J., Brooks,P., Onion,D., Shirley,D. et al. (2002) Assays of proteasome activity in relation to aging. Experimental Gerontology 37: 1217-1222.
Rodgers,K.J., and Dean,R.T. (2003) Assessment of proteasome activity in cell lysates and tissue homogenates using peptide substrates. International Journal of Biochemistry & Cell Biology 35: 716-727.
Roy,S., Coffee,P., Smith,G., Liem,R.K.H., Brady,S.T., and Black,M.M. (2000) Neurofilaments are transported rapidly but intermittently in axons: Implications for slow axonal transport. Journal of Neuroscience 20: 6849-6861.
Saido,T.C., Sorimachi,H., and Suzuki,K. (1994) Calpain - New Perspectives in Molecular Diversity and Physiological-Pathological Involvement. FASEB Journal 8: 814-822.
Sanchez-Pernaute,R., Brownell,A.L., and Isacson,O. (2004) Insights into Parkinson's disease models and neurotoxicity using non-invasive imaging. Toxicology and Applied Pharmacology 197: 151.
Saric,T., Graef,C.I., and Goldberg,A.L. (2004) Pathway for degradation of peptides generated by proteasomes - A key role for thimet oligopeptidase and other metallopeptidases. Journal of Biological Chemistry 279: 46723-46732.
Sasaki,T., Kikuchi,T., Yumoto,N., Yoshimura,N., and Murachi,T. (1984) Comparative Specificity and Kinetic-Studies on Porcine Calpain-I and Calpain-Ii with Naturally-Occurring Peptides and Synthetic Fluorogenic Substrates. Journal of Biological Chemistry 259: 2489-2494.
Sayas,C.L., Avila,J., and Wandosell,F. (2002) Regulation of neuronal cytoskeleton by lysophosphatidic acid: role of GSK-3. Biochimica et Biophysica Acta-Molecular and Cell Biology of Lipids 1582: 144-153.
Schapira,A.H. (1994) Advances in the understanding of the cause of Parkinson's disease. Journal of the Royal Society of Medicine 87: 373-375.
Schapira,A.H.V., Cooper,J.M., Dexter,D., Jenner,P., Clark,J.B., and Marsden,C.D. (1989) Mitochondrial Complex I Deficiency in Parkinsons-Disease. Lancet 1: 1269.
Schapira,A.H.V. (2006) Mitochondrial disease. Lancet 368: 70-82.
Schlaepfer,W.W., Lee,C., Lee,V.M.Y., and Zimmerman,U.J.P. (1985) An Immunoblot Study of Neurofilament Degradation Insitu and During Calcium-Activated Proteolysis. Journal of Neurochemistry 44: 502-509.
Schlossmacher,M.G., Frosch,M.P., Gai,W.P., Medina,M., Sharma,N., Forno,L. et al. (2002) Parkin localizes to the Lewy bodies of Parkinson disease and dementia with Lewy bodies. American Journal of Pathology 160: 1655-1667.
195

CHAPTER VII- REFERENCE LIST Schmidt,M.L., Murray,J., Lee,V.M.Y., Hill,W.D., Wertkin,A., and Trojanowski,J.Q. (1991) Epitope Map of Neurofilament Protein Domains in Cortical and Peripheral Nervous-System Lewy Bodies. American Journal of Pathology 139: 53-65.
Schulz,J.B., Lindenau,J., Seyfried,J., and Dichgans,J. (2000) Glutathione, oxidative stress and neurodegeneration. European Journal of Biochemistry 267: 4904-4911.
Shamoto-Nagai,M., Maruyama,W., Kato,Y., Isobe,K., Tanaka,M., Naoi,M., and Osawa,T. (2003) An inhibitor of mitochondrial complex I, rotenone, inactivates proteasome by oxidative modification and induces aggregation of oxidized proteins in SH-SY5Y cells. Journal of Neuroscience Research 74: 589-597.
Shea,T.B., Sihag,R.K., and Nixon,R.A. (1990) Dynamics of Phosphorylation and Assembly of the High-Molecular-Weight Neurofilament Subunit in Nb2A/D1 Neuroblastoma. Journal of Neurochemistry 55: 1784-1792.
Shea,T.B., and Beermann,M.L. (1994) Respective Roles of Neurofilaments, Microtubules, Map1B, and Tau in Neurite Outgrowth and Stabilization. Molecular Biology of the Cell 5: 863-875.
Shea,T.B., Wheeler,E., and Jung,C.W. (1997) Aluminum inhibits neurofilament assembly, cytoskeletal incorporation, and axonal transport - Dynamic nature of aluminum-induced perikaryal neurofilament accumulations as revealed by subunit turnover. Molecular and Chemical Neuropathology 32: 17-39.
Shea,T.B., Yabe,J., Dahl,D., Ekinci,F.J., and Jung,C. (1998) Regional decline in neurofilament axonal transport is mediated by neurofilament phosphorylation and resultant dissociation from a kinesin-based transport system: Potential relationship with amyotrophic lateral sclerosis. Annals of Neurology 44: 461.
Shea,T.B., and Flanagan,L.A. (2001) Kinesin, dynein and neurofilament transport. Trends in Neurosciences 24: 644-648.
Shea,T.B., Jung,C., and Pant,H.C. (2003) Does neurofilament phosphorylation regulate axonal transport? Trends Neurosci 26: 397-400.
Sherer,T.B., Trimmer,P.A., Borland,K., Parks,J.K., Bennett,J.P., and Tuttle,J.B. (2001) Chronic reduction in complex I function alters calcium signaling in SH-SY5Y neuroblastoma cells. Brain Research 891: 94-105.
Shimohama,S., Sawada,H., Kitamura,Y., and Taniguchi,T. (2003) Disease model: Parkinson's disease. Trends in Molecular Medicine 9: 360-365.
Shimoji,M., Zhang,L., Mandir,A.S., Dawson,V.L., and Dawson,T.M. (2005) Absence of inclusion body formation in the MPTP mouse model of Parkinson's disease. Molecular Brain Research 134 : 103-108.
Shimura,H., Schlossmacher,M.C., Hattori,N., Frosch,M.P., Trockenbacher,A., Schneider,R. et al. (2001) Ubiquitination of a new form of alpha-synuclein by parkin from human brain: Implications for Parkinson's disease. Science 293: 263-269.
Shoesmith-Berke,S.J., and Paulson,H.L. (2003) Protein aggregation and the ubiquitin proteasome pathway: gaining the UPPer hand on neurodegeneration. Current Opinion in Genetics & Development 13: 253-261.
Sian,J., Dexter,D.T., Lees,A.J., Daniel,S., Jenner,P., and Marsden,C.D. (1994) Glutathione-Related Enzymes in Brain in Parkinsons-Disease. Annals of Neurology 36: 356-361.
196
CHAPTER VII- REFERENCE LIST Sidhu,A., Wersinger,C., and Vernier,P. (2004) alpha-Synuclein regulation of the dopaminergic transporter: a possible role in the pathogenesis of Parkinson's disease. FEBS Letters 565: 1-5.
Siegel, G.J. (1999). Basic Neurochemistry, molecular and cellular aspects (6th edition). Philadelphia:Lipincott-Raven publishers. Snyder,H., Mensah,K., Theisler,C., Lee,J., Matouschek,A., and Wolozin,B. (2003) Aggregated and monomeric alpha-synuclein bind to the S6 ' proteasomal protein and inhibit proteasomal function. Journal of Biological Chemistry 278: 11753-11759.
Sofic,E., Lange,K.W., Jellinger,K., and Riederer,P. (1992) Reduced and Oxidized Glutathione in the Substantia-Nigra of Patients with Parkinsons-Disease. Neuroscience Letters 142: 128-130.
Song,D.D., Shults,C.W., Sisk,A., Rockenstein,E., and Masliah,E. (2004) Enhanced substantia nigra mitochondrial pathology in human [alpha]-synuclein transgenic mice after treatment with MPTP. Experimental Neurology 186: 158-172.
Song,X., Perkins,S., Jortner,B.S., and Ehrich,M. (1997) Cytotoxic effects of MPTP on SH-SY5Y human neuroblastoma cells. NeuroToxicology 18: 341-353.
Song,X.O., and Ehrich,M. (1998) Uptake and metabolism of MPTP and MPP+ in SH-SY5Y human neuroblastoma cells. In Vitro & Molecular Toxicology-A Journal of Basic and Applied Research 11 : 3-14.
Speciale,S.G. (2002) MPTP - Insights into parkinsonian neurodegeneration. Neurotoxicology and Teratology 24: 607-620.
Speese,S.D., Trotta,N., Rodesch,C.K., Aravamudan,B., and Broadie,K. (2003) The ubiquitin proteasome system acutely regulates presynaptic protein turnover and synaptic efficacy. Current Biology 13: 899-910.
Spillantini,M.G., Crowther,R.A., Jakes,R., Cairns,N.J., Lantos,P.L., and Goedert,M. (1998) Filamentous alpha-synuclein inclusions link multiple system atrophy with Parkinson's disease and dementia with Lewy bodies. Neuroscience Letters 251: 205-208.
Spina,M.B., and Cohen,G. (1989) Dopamine Turnover and Glutathione Oxidation - Implications for Parkinson Disease. Proceedings of the National Academy of Sciences of the United States of America 86: 1398-1400.
Stefanis,L., Larsen,K.E., Rideout,H.J., Sulzer,D., and Greene,L.A. (2001) Expression of A53T mutant but not wild-type alpha-synuclein in PC12 cells induces alterations of the ubiquitin-dependent degradation system, loss of dopamine release, and autophagic cell death. Journal of Neuroscience 21: 9549-9560.
Sternberger,L.A., and Sternberger,N.H. (1983) Monoclonal-Antibodies Distinguish Phosphorylated and Nonphosphorylated Forms of Neurofilaments Insitu. Proceedings of the National Academy of Sciences of the United States of America-Biological Sciences 80: 6126-6130.
Stokes,A.H., Lewis,D.Y., Lash,L.H., Jerome III,W.G., Grant,K.W., Aschner,M., and Vrana,K.E. (2000) Dopamine toxicity in neuroblastoma cells: role of glutathione depletion by -BSO and apoptosis. Brain Research 858: 1-8.
Storch,A., Kaftan,A., Burkhardt,K., and Schwarz,J. (2000) 1-Methyl-6,7-dihydroxy-1,2,3,4-tetrahydroisoquinoline (salsolinol) is toxic to dopaminergic neuroblastoma SH-SY5Y cells via impairment of cellular energy metabolism. Brain Research 855: 67-75.
197
CHAPTER VII- REFERENCE LIST Strauss,K.M., Martins,L.M., Plun-Favreau,H., Marx,F.P., Kautzmann,S., Berg,D. et al. (2005) Loss of function mutations in the gene encoding Omi/HtrA2 in Parkinson's disease. Human Molecular Genetics 14: 2099-2111.
Stys,P.K., and Jiang,Q.B. (2002) Calpain-dependent neurofilament breakdown in anoxic and ischemic rat central axons. Neuroscience Letters 328: 150-154.
Szweda,P.A., Friguet,B., and Szweda,L.I. (2002) Proteolysis, free radicals, and aging. Free Radical Biology and Medicine 33: 29-36.
Takahashi,N., Miner,L.L., Sora,I., Ujike,H., Revay,R.S., Kostic,V. et al. (1997) VMAT2 knockout mice: Heterozygotes display reduced amphetamine-conditioned reward, enhanced amphetamine locomotion, and enhanced MPTP toxicity. Proceedings of the National Academy of Sciences of the United States of America 94: 9938-9943.
Tanaka,Y., Engelender,S., Igarashi,S., Rao,R.K., Wanner,T., Tanzi,R.E. et al. (2001) Inducible expression of mutant alpha-synuclein decreases proteasome activity and increases sensitivity to mitochondria-dependent apoptosis. Human Molecular Genetics 10: 919-926.
Tanner,C.M., Goldman,S.M., Aston,D.A., Ottman,R., Ellenberg,J., Mayeux,R., and Langston,J.W. (2002) Smoking and Parkinson's disease in twins. Neurology 58: 581-588.
Terada,S. (2003) Where does slow axonal transport go? Neuroscience Research 47: 367-372.
Terman,A., and Brunk,U.T. (2004) Aging as a catabolic malfunction. International Journal of Biochemistry & Cell Biology 36: 2365-2375.
Tofaris,G.K., Razzaq,A., Ghetti,B., Lilley,K.S., and Spillantini,M.G. (2003) Ubiquitination of alpha-synuclein in Lewy bodies is a pathological event not associated with impairment of proteasome function. Journal of Biological Chemistry 278: 44405-44411.
Ungerstent,U. (1971) Postsynaptic Supersensitivity After 6-Hydroxydopamine Induced Degeneration of Nigro-Striatal Dopamine System. Acta Physiologica Scandinavica: 69-&.
Uversky,V.N. (2004) Neurotoxicant-induced animal models of Parkinson's disease: understanding the role of rotenone, maneb and paraquat in neurodegeneration. Cell and Tissue Research 318: 225-241.
Valente,E.M., bou-Sleiman,P.M., Caputo,V., Muqit,M.M.K., Harvey,K., Gispert,S. et al. (2004) Hereditary early-onset Parkinson's disease caused by mutations in PINK1. Science 304: 1158-1160.
Vercammen,L., Van der Perren,A., Vaudano,E., Gijsbers,R., Debyser,Z., Van den Haute,C., and Baekelandt,V. (2006) Parkin Protects against Neurotoxicity in the 6-Hydroxydopamine Rat Model for Parkinson's Disease. Molecular Therapy 14: 716-723.
Verma,R., and Deshaies,R.J. (2000) A proteasome howdunit: The case of the missing signal. Cell 101: 341-344.
Vidaluc,J.L. (1996) MPTP as a molecular paradigm for neurodegeneration. A review of its connections with relevant molecules. Current Medicinal Chemistry 3: 117-138.
Vila,M., Wu,D.C., and Przedborski,S. (2001) Engineered modeling and them secrets of Parkinson's' disease. Trends in Neurosciences 24: S49-S55.
198
CHAPTER VII- REFERENCE LIST Wakabayashi,K., Takahashi,H., Obata,K., and Ikuta,F. (1992) Immunocytochemical Localization of Synaptic Vesicle-Specific Protein in Lewy Body-Containing Neurons in Parkinsons-Disease. Neuroscience Letters 138: 237-240.
Wakabayashi,K., Mori,F., and Takahashi,H. (2006) Progression patterns of neuronal loss and Lewy body pathology in the substantia nigra in Parkinson's disease. Parkinsonism & Related Disorders 12: S92-S98.
Wang,X.F., Li,S., Chou,A.P., and Bronstein,J.M. (2006) Inhibitory effects of pesticides on proteasome activity: Implication in Parkinson's disease. Neurobiology of Disease 23: 198-205.
Welchman,R.L., Gordon,C., and Mayer,R.J. (2005) Ubiquitin and ubiquitin-like proteins as multifunctional signals. Nature Reviews Molecular Cell Biology 6: 599-609.
Wojcik,C., and DeMartino,G.N. (2003) Intracellular localization of proteasomes. International Journal of Biochemistry & Cell Biology 35: 579-589.
Wolf,D.H., and Hilt,W. (2004) The proteasome: a proteolytic nanomachine of cell regulation and waste disposal. Biochimica et Biophysica Acta-Molecular Cell Research 1695: 19-31.
Wood-Kaczmar,A., Gandhi,S., and Wood,N.W. (2006) Understanding the molecular causes of Parkinson's disease. Trends in Molecular Medicine 12: 521-528.
Xiao,S., McLean,J., and Robertson,J. (2006) Neuronal intermediate filaments and ALS: A new look at an old question. Biochimica et Biophysica Acta (BBA) - Molecular Basis of Disease 1762 (11-12): 1001-1012
Xu,Z.S., Marszalek,J.R., Lee,M.K., Wong,P.C., Folmer,J., Crawford,T.O. et al. (1996) Subunit composition of neurofilaments specifies axonal diameter. Journal of Cell Biology 133: 1061-1069.
Yabe,J.T., Chylinski,T., Wang,F.S., Pimenta,A., Kattar,S.D., Linsley,M.D. et al. (2001) Neurofilaments consist of distinct populations that can be distinguished by C-terminal phosphorylation, bundling, and axonal transport rate in growing axonal neurites. Journal of Neuroscience 21: 2195-2205.
Yamada,M., Mizuno,Y., and Mochizuki,H. (2005) Parkin gene therapy for alpha-synucleinopathy: A rat model of Parkinson's disease. Human Gene Therapy 16: 262-270.
Yang,Y.M., Bauer,C., Strasser,G., Wollman,R., Julien,J.P., and Fuchs,E. (1999) Integrators of the cytoskeleton that stabilize microtubules. Cell 98: 229-238.
Yoo,M.S., Chun,H.S., Son,J.J., DeGiorgio,L.A., Kim,D.J., Peng,C., and Son,J.H. (2003) Oxidative stress regulated genes in nigral dopaminergic neuronal cells: correlation with the known pathology in Parkinson's disease. Molecular Brain Research 110: 76-84.
Yuan,A.D., Nixon,R.A., and Rao,M.V. (2006) Deleting the phosphorylated tail domain of the neurofilament heavy subunit does not alter neurofilament transport rate in vivo. Neuroscience Letters 393: 264-268.
Zang,L.Y., and Misra,H.P. (1992) Superoxide Radical Production During the Autoxidation of 1-Methyl-4-Phenyl-2,3-Dihydropyridinium Perchlorate. Journal of Biological Chemistry 267: 17547-17552.
Zarranz,J.J., Alegre,J., Gomez-Esteban,J.C., Lezcano,E., Ros,R., Ampuero,I. et al. (2004) The new mutation, E46K, of alpha-synuclein causes Parkinson and Lewy body dementia. Annals of Neurology 55: 164-173.
199
CHAPTER VII- REFERENCE LIST Zeng,B.Y., Iravani,M.M., Lin,S.T., Irifune,M., Kuoppamaki,M., Al-Barghouthy,G. et al. (2006) MPTP treatment of common marmosets impairs proteasomal enzyme activity and decreases expression of structural and regulatory elements of the 26S proteasome. European Journal of Neuroscience 23: 1766-1774.
Zhang,Y., Gao,J., Chung,K.K., Huang,H., Dawson,V.L., and Dawson,T.M. (2000) Parkin functions as an E2-dependent ubiquitin- protein ligase and promotes the degradation of the synaptic vesicle-associated protein, CDCrel-1. Proceedings of the National Academy of Sciences U.S.A 97: 13354-13359.
ZilkhaFalb,R., Ziv,I., Nardi,N., Offen,D., Melamed,E., and Barzilai,A. (1997) Monoamine-induced apoptotic neuronal cell death. Cellular and Molecular Neurobiology 17: 101-118.
200