the effects of ownership concentration and identity …
TRANSCRIPT
Item #2 RESEARCH SEMINAR IN LAW, ECONOMICS, AND ORGANIZATION Professors Bebchuk, Hart, and Kaplow Monday, October 3, 2005 Pound 108, 12:30 p.m.
THE EFFECTS OF OWNERSHIP CONCENTRATION AND IDENTITY ON INVESTMENT PERFORMANCE: AN INTERNATIONAL COMPARISON
By Klaus Gugler, Dennis C. Mueller* and B. Burcin Yurtoglu
*Presenting

The Effects of Ownership Concentration and Identity on Investment Performance: An
International Comparison*
Klaus Gugler, Dennis C. Mueller and B. Burcin Yurtoglu
University of Vienna, Department of Economics
BWZ, Bruennerstr. 72, A-1210
Vienna, Austria
Phone: +43 1 4277 37482
Fax: +43 1 4277 37498
E-mail: [email protected]
Abstract:
This article makes two important contributions to the literature on the incentive effects of
insider ownership. First, it presents a clean method for separating the positive wealth effect of
insider ownership from the negative entrenchment effect, which can be applied to samples of
companies from the US and any other country. Second, it measures the effects of insider
ownership using a measure of firm performance, namely a marginal q, which ensures that the
causal relationship estimated runs from ownership to performance. The article applies this
method to a large sample of publicly listed firms from the Anglo-Saxon and Civil law
traditions and confirms that managerial entrenchment has an unambiguous negative effect on
firm performance as measured by both Tobin's (average) q and our marginal q, and that the
wealth effect of insider ownership is unambiguously positive for both measures. We also test
for the effects of ownership concentration for other categories of owners and find that while
institutional ownership improves the performance in the USA, financial institutions have a
negative impact in other Anglo-Saxon countries and in Europe.
JEL Codes: G32, L21 Keywords: Insider ownership, ownership structure, investment performance, international comparison
* We would like to thank the Jubiläumsfonds of the Austrian National Bank for the financial support through Project #8090. We would also like to thank the participants in the workshop on corporate governance held in Vienna in December, 2003 for the helpful comments. Special thanks in this regard go to Paul Guest.
1
I. Introduction
The possibility of a conflict of interests between a firm’s managers and owners can be
traced at least as far back as the classic study of Berle and Means (1932) documenting the
existence of a “separation of ownership from control.” Since their book appeared numerous
studies have hypothesized about the nature of the conflict between managers and owners,
and/or attempted to measure the economic consequences of this conflict.1 This literature,
implicitly or explicitly, has assumed an “Anglo-Saxon” corporate governance structure. A
firm’s owners are its shareholders; shares are widely dispersed, so that no outside shareholder
has a strong incentive to monitor managers carefully; managers do not hold large fractions of
their companies’ shares, and thus do not have the same financial interest in the firm as the
shareholders. When managers held a large fraction of the shares, as say ten percent, it was
assumed that they identified with the shareholders and maximized their wealth.2
In a seminal article, Mørck, Shleifer and Vishny (1988, hereafter MSV) highlighted a
second feature of insider ownership – the larger the fraction of a company’s shares held by its
managers, the more entrenched they are. Thus, insider ownership has two conflicting effects:
(1) an alignment effect -- as the number of shares held by the insiders increases, the effect on
their wealth of a rise in the firm’s market value increases; (2) an entrenchment effect – the
likelihood of replacement through a proxy fight or takeover declines as the managers’
increase giving them more discretion to pursue their own goals.
MSV presented evidence of a relationship between the shareholdings of a company’s
board of directors and Tobin’s q. Tobin’s q rose from around 0.75 when the board held no
shares to roughly 1.0, when it held 5 percent, and then fell reaching a value of only 0.7, at a
holding of 25 percent of outstanding shares. From this point on q again rose. MSV attributed

2
this nonlinear pattern to the alignment effect dominating over the first and third ranges of
ownership concentration and the entrenchment effect dominating over the middle range.
Several subsequent studies reported similar up/down/up relationships between
performance and ownership concentration (Cho, 1988; Short and Keasey, 1999; Cosh, Guest
and Hughes, 2000; and Gugler, Mueller and Yurtoglu, 2004). McConnell and Servaes (1990,
1995) observed only the first part of the curve – an inverted parabola – in their US data, as
did Thomsen and Pedersen (2000) in data from Europe.3 Again the interpretation for these
nonlinearities has been that a single variable – ownership concentration – has two conflicting
effects on company performance.
It would clearly be preferable to capture the two effects of insider ownership with two
separate variables. An important contribution of this article is to employ one variable to
capture the positive wealth effect on firm performance that comes with insider ownership,
and a second variable to capture its negative entrenchment effect. We find a strong and
unambiguous positive effect on company performance from managers’ wealth holdings in
their firms, and an equally unambiguous negative entrenchment effect, once these two effects
are separated.
As noted above, the institutional environment implicitly assumed in this literature has
been that of an Anglo-Saxon country, and most of the empirical work has used data from the
United States. A second important contribution of this article is to extend the methodology to
countries with other corporate governance structures. We do this in two ways. First, we
estimated the wealth and entrenchment effects from insider ownership in for two other
samples of countries – five Anglo-Saxon countries other than the US, and for a sample of
Continental European countries. Second, we test for the existence of analogous effects when
outside institutions are the largest shareholder. We do this for two categories of institutions –
other, non-financial firms and finance institutions (banks and insurance companies).

3
Most contributions to this literature have followed MSV and used Tobin’s q to
measure company performance. Starting with Harold Demsetz (1983), however, several
authors have questioned whether ownership concentration can properly be treated as an
exogenous variable in studies of firm performance.4 In industries in which agency problems
could significantly lower a firm’s market value, ownership might remain concentrated to
mitigate agency problems, while in industries in which the performance of managers could be
easily judged, the advantages of diversifying shareholdings dominate and ownership becomes
dispersed. The third major contribution of this article is to employ a measure of firm
performance, which does not suffer from this endogeneity problem – namely a marginal q.
We proceed as follows: The main methodological issues and models to be tested are
discussed in the following section. The US data are discussed in Section III, with results for
the US presented in Section IV. In Section V the insider ownership model is estimated for
samples of countries with Anglo-Saxon or civil law legal systems. Estimates of the model for
other ownership categories are presented in Section VI. Conclusions are drawn in the final
section.
II. Methodological Issues
A. Separating the Wealth and Entrenchment Effects of Insider Ownership
The fraction of shares held by insiders (IS) is clearly the appropriate variable for
measuring the entrenchment effect. As IS rises it becomes increasingly difficult to displace
the managers through a proxy contest or hostile takeover. Thus, when one considers only the
entrenchment effect, one predicts a negative relationship between IS and firm performance.
As a measure of the positive wealth effects of insider ownership, IS is problematic.
Consider, for example, the consequences of a decision by empire-building managers to
acquire another firm, even though the merger will produce no net gain in wealth.5 The
acquirer must offer the shareholders of the other firm a premium of typically 20-30 percent
4
over their pre-bid price to get them to give up their shares. If the target is 30 percent of the
size of the acquirer and the premium is 30 percent of its market value, the premium equals 9
percent of the acquirer’s market value, and the acquirer’s shareholders suffer a 9 percent loss
in wealth from a merger that generates no net wealth.6 The wealth loss to the managers is
proportional to the value of their holdings, not to their size as a percent of outstanding shares.
A manager owning $10 million of her company’s shares has the same financial incentive to
raise their price, regardless of whether her holdings constitute one percent of outstanding
shares or 15 percent. A ten percent increase in her company’s share price makes her a
million dollars richer regardless of the fractional size of her holdings. Thus, for all
managerial decisions having a proportional effect on the value of the firm, the proper variable
for measuring the wealth effects of these decisions is the value of insiders’ shareholdings
(VS).7
For some decisions, it is better to assume an absolute effect on the firm’s market
value. For example, if the managers award themselves a $20 million bonus, this reduces the
value of the firm by the amount of the bonus. The cost of this award to the managers is
directly related to the fraction of shares held by them. Thus, IS will also capture the effects
on insiders’ wealth from decisions having an absolute effect on the value of the firm.
For investment decisions like mergers, the most reasonable assumption to make is that
they have proportional effects on market values and insiders’ wealth. Both measures of
performance that we use, Tobin’s (average) q and marginal q, will be more sensitive to
decisions with proportional effects than to decisions with absolute effects. VS is thus the
appropriate variable for capturing the wealth effects for these types of decisions. We shall
interpret IS as capturing the entrenchment effect of insider ownership, but recognize that it
can also capture the effects of decisions having an absolute effect on managers wealth.8

5
Claessens, Djankov, Fan and Lang (2002, hereafter CDFL) have also attempted to
separate the wealth and entrenchment effects of insider ownership. They take advantage of
the highly concentrated shareholdings in East Asian countries, and the fact that cash flow and
control rights sometimes differ for large shareholders. CDFL claim to measure the wealth
effect of ownership with a measure of cash flow rights, and the entrenchment effect using
control rights of large shareholders.
Although we find this method for separating the two effects of ownership to be quite
innovative, it nevertheless has several shortcomings compared to our approach. Most
significantly, it cannot be applied to the US, since the kinds of corporate pyramids and
multiple-vote shares that lead to divergences between cash flow and control rights in East
Asia are largely absent in the US, and many firms have no large shareholders. Furthermore,
even where large shareholders are important, as in Germany, control and cash flow rights are
the same for most shareholders. Nevertheless, the entrenched position of large shareholders
can lead to rent extraction by them. Gugler and Yurtoglu (2003b) find for German
companies, for example, that unconstrained large shareholders have detrimental effects for
minority shareholders, even though cash flow and control rights may be equal, provided that
they are less than 100%.
Although corporate pyramids and multiple-vote shares can produce a divergence
between cash flow and control rights, in countries where these institutions are common cash
flow and control rights remain identical for most firms. Claessens et al. (2000, p. 100) and
Faccio and Lang (2002, p.392) report identical cash flow and control rights for the median
firm in East Asia and Western Europe, respectively. The same is true for samples of
companies from Germany and Turkey, where pyramids and multiple-vote shares are also
important.9 This large overlap between cash flow and control rights naturally leads to high
positive correlations between the two variables. In the German sample the Pearson
6
correlation between cash flow and control rights was 0.71, for Turkey it was 0.47.10 For the
United States, of course, it would be near one. In contrast, the two variables that we use to
measure the wealth and entrenchment effects are nearly uncorrelated (r = -0.15). Thus, our
methodology can be applied to samples where large shareholders are relatively rare, to
samples with large shareholders and no separation of cash flow and control rights, as well as
to samples with large shareholders and a separation of cash flow and control rights, while the
CDFL methodology is applicable only in the last of these three cases.
B. Endogeneity Issues
As noted in section I, a main criticism against using managerial shareholdings to
explain company performance has been that ownership structure is not exogenous, when a
measure of average performance like Tobin’s q is the dependent variable. So that our results
can be compared with the rest of the literature, we shall use Tobin’s q as one measure of firm
performance. Our second measure of performance is an estimate of marginal q – the ratio of
a firm’s return on investment to its cost of capital.11 This measure of performance does not
suffer from any endogeneity problem.
The fractional holdings of managers may, of course, be endogenous to the nature of
the investment opportunities of a firm. Managers of firms with high risk investment
opportunities may choose to hold smaller fractions of their companies’ shares. Companies
with risky investment opportunities face higher costs of capital, and must earn higher returns
from their investments to maximize their shareholders’ wealth. However, the predicted ratio
of returns on investment to cost of capital is the same for all firms, which maximize
shareholder wealth. On the last dollar invested it should equal 1.0. If all managers
maximized shareholder wealth, all firms would have qms equal to or slightly greater than 1.0
regardless of the nature of their investment opportunities.12 Marginal q would be
independent of managerial shareholdings and all other variables. If, on the other hand,
7
managers who are secure in their positions invest more than the amount, which maximizes
shareholder wealth, qms will differ across firms, and these differences will be related to the
degrees to which managers’ investment decisions deviate from those that would maximize
their shareholders’ wealth. The incentive to deviate will in turn depend upon the degree of
managerial entrenchment and the wealth effects of managers’ shareholdings – the variables in
our model. Causality must run from the variables that determine managers’ incentives to
invest (i.e. IS and VS) to the investments themselves, which in turn determine the returns on
these investments (i.e. qm). Managers choose investment levels, investment levels do not
determine managers, or the characteristics of their shareholdings. If the relationships
between average q and the other variables in the model are also observed for marginal q, we
can be reasonably sure that the relationship is not driven by simultaneity problems. If, on the
other hand, the results for the two choices of dependent variables differ, it is the results for
qm that will not suffer from simultaneous equation bias.
C. Model Specification
If managers are risk averse, their utility will increase nonlinearly with their wealth,
and a nonlinear relationship between the value of their shareholdings and company
performance can be expected. We capture this nonlinearity by including both linear and
quadratic terms in VS in the equation with a positive coefficient predicted for VS and a
negative coefficient for VS2. The negative entrenchment effect of insider ownership (IS) is
assumed to be linear.13
While entrenchment can be expected to increase with the size of managerial
shareholdings, keeping this fraction constant, managerial entrenchment may also increase
with the size of the firm (S). With a perfect capital market an outsider could always raise the
necessary money to takeover a poorly performing company, and size would be no protection
for managers engaging in substantial on-the-job consumption. But if capital markets are less

8
than perfect, size may offer managers some protection against takeovers. A second reason
for expecting a negative relationship between size and firm performance, measured as either
average or marginal q, is that small companies may find it difficult to raise sufficient funds to
finance all of their wealth-creating investments due to asymmetric information problems, and
thus their qs lie above one.14 There are, of course, still other reasons why firm size and
performance might be related. To the extent that firm size is related to market shares a
positive relationship between size and performance might be expected, due to market power
or efficiency effects. To the extent that size is related to diversification, a positive relationship
would be expected, if diversification improves performance, a negative relationship, if it
worsens performance. Although we treat size as a second measure of managerial
entrenchment, the reader is of course free to interpret its effect in other ways, when average q
is the performance measure. When marginal q is the dependent variable, however, a negative
relationship between firm size and q can only arise if managers of large firms over invest as a
result of managerial entrenchment, or under invest due to asymmetric information problems.
Although it is reasonable to assume that managerial shareholdings produce conflicting
incentive effects, the same cannot be said for the shareholdings of outsiders. In recent years,
mutual and pension funds have become an important class of shareholders in the US. We
expect these institutional shareholders to be interested only in share performance and predict,
therefore, that managers’ discretion to pursue their own goals declines with the fraction of a
company’s shares held by institutional shareholders, IT.
The R&D to sales ratio, RD, is included as an additional control variable. Firms with
attractive opportunities to innovate are likely to spend more on R&D than other companies,
and earn monopoly rents from their innovations. These firms will have relatively high infra-
marginal returns on capital that will be reflected in higher average qs than other firms.15
There is less reason to expect a positive relationship between marginal q and RD, however. If

9
firms maximized shareholder wealth, all would have the same marginal q, namely 1.0, and
there would be no relationship between marginal q and R&D. On the other hand, firms that
spend a lot on R&D may have more attractive investment opportunities. These may allow
managers to satisfy their desires for growth without overinvesting, or at least without
overinvesting as much as do managers of firms with limited investment opportunities. This
reasoning implies a positive relationship between RD and marginal q.
Leverage might be yet another candidate for inclusion in the model. A difficulty
arises in including leverage in our q-equations, however, in that it is itself likely to be a
function of some variables in our model. Indeed, several different hypotheses for why
leverage should be a function of insider concentration have been advanced.16 Thus, both
leverage and firm performance can be expected to be functions of the variables that measure
managerial incentives and constraints. Since our goal is not to contribute to the literature on
the determinants of leverage, we do not construct a model to explain it nor include it in our
model. We justify this decision on the grounds that leverage does not belong in a q-equation
as a causal variable, but if at all only as a proxy for other variables related to managerial
incentives and constraints. Since we already include measures of these, an additional proxy
for them is unneeded.
We are thus left with the following specification for testing the different hypotheses
about firm performance, defined as either average or marginal q:
q = β1IS + β2VS + β3VS2 + β4S + β5IT + β6RD + µ (1)
The predicted coefficients are β1 < 0, β2 > 0, β3 < 0, β4 < 0, β5 >0 and β6 > 0 .
We turn now to a discussion of the data used to test the hypotheses.
III. Data
The financial data are taken from the 1996-2000 versions of the Global Vantage and
10
1997 version of the Compustat databases of Standard & Poor's.17 The percentage of insider
ownership (IS) is drawn from the Compact Disclosure (CD) database. The sole source of
ownership data used by CD is the Securities and Exchange Commission’s corporate proxy
statements. IS is defined as the total number of shares held in aggregate by all officers and
directors divided by the number of shares outstanding. VS is the value of the shares held by
insiders and calculated by multiplying IS with the market value of equity.
We exclude banks and financial companies and some service industries (SICs 6000
through 6999 and above 8100), because the nature of capital and investment in these
industries is not comparable to those of non-financial firms. We also exclude corporations
reporting data that are not credible (negative sales and negative debt). To minimize the
weight of outliers, we cap our basic variables at both the 1st and 99th percentile of the sample.
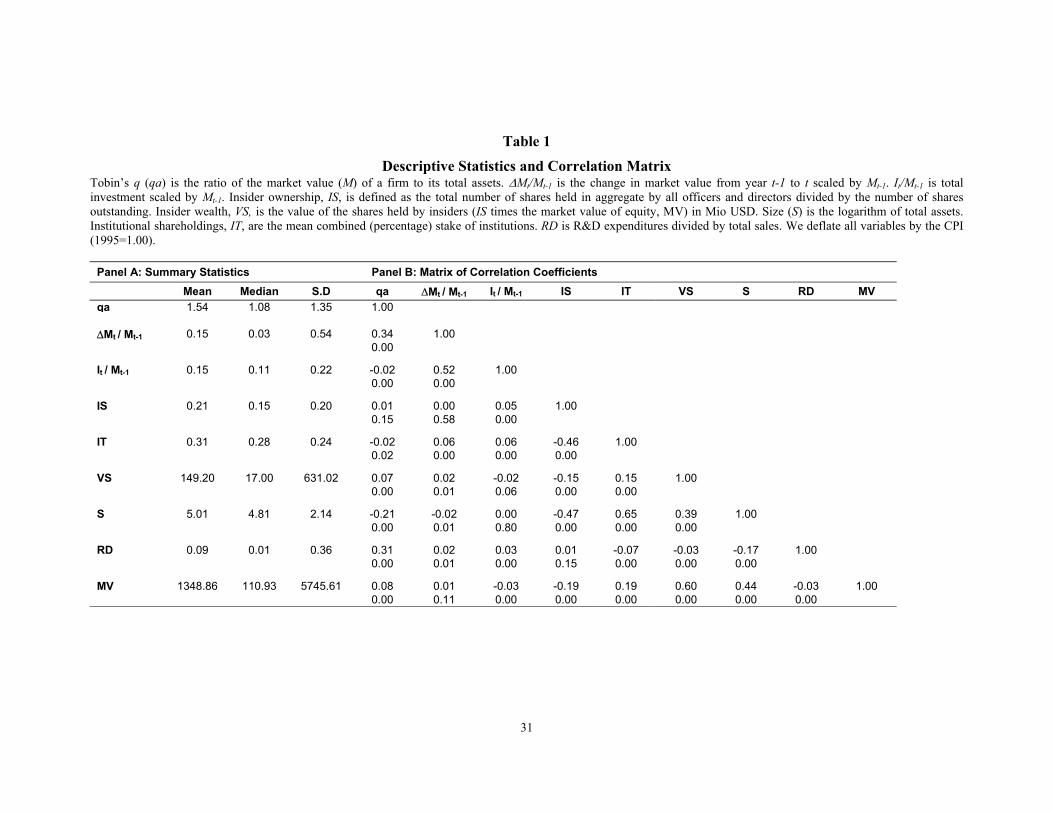
Panel A of Table 1 reports descriptive statistics of our main variables. The average IS of 21%
is considerably higher than the 10.6 % figure reported by MSV.18 The median value of
shares held by insiders (VS) is $17,000,000. The mean combined stake of institutions (IT) is
31%. Size (S) is measured by the logarithm of total assets and its mean indicates that the
average firm has about $150 million in total assets.
Noteworthy in Panel B of Table 1 is the high negative correlation between size and
insider ownership and the high positive correlation between size and institutional
shareholdings. As discussed above, the failure to allow for these relationships may help to
explain the nonlinear pattern between insider ownership and q. The results in the next section
indicate that it does.
IV. Results for the United States
A. Results for Average (Tobin’s) q
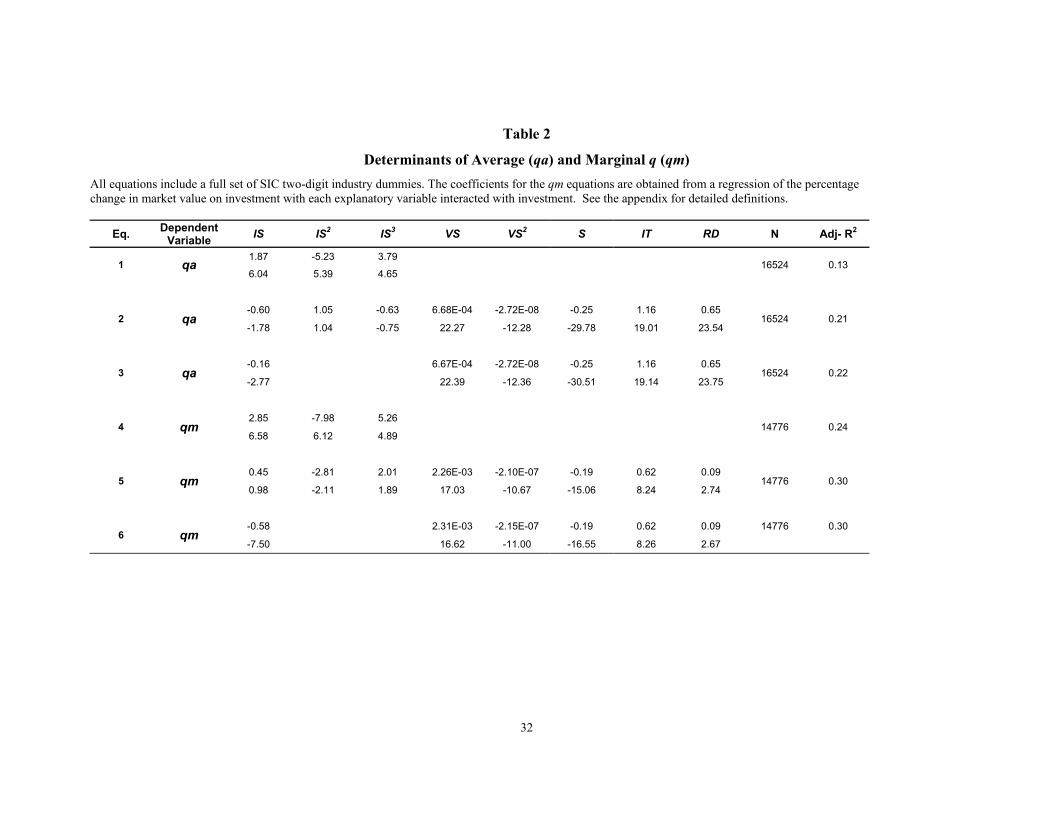
Equation 1 in Table 2 presents our results when average q, qa, is regressed on insider

11
ownership. A set of two-digit industry dummies was included in all equations, but their
coefficients are not reported to save space. The same pattern of marginal effects of insider
ownership is observed in eq. 1, as in MSV and several other studies. The relationship is
nonlinear with all three terms in the cubic equation being highly significant.19
The relationship between qa and IS remains cubic once the other variables in the
model are added (eq. 2), but the signs on the three IS terms reverse. Instead of qa rising as
insider shareholdings increase it falls, although again in a nonlinear fashion. A negative
relationship is of course exactly what one expects, if the fraction of shares held by insiders
captures only the entrenchment effect of ownership. When IS is constrained to have a linear
relationship with qa, its coefficient is negative and significant, and the adjusted R2 remains
unchanged (eq. 3).
The relationship between insiders’ shareholdings (VS) and qa is quadratic with the
coefficients on the two terms being positive and negative as predicted. The marginal wealth
effect of managers’ shareholdings on company performance, as captured by the value of their
holdings, is positive and tapers off as VS gets large, but remains positive over the range of VS.
A diminishing marginal effect of VS is consistent with the assumption of diminishing
marginal utility of wealth.
The second entrenchment variable in the equation, log size (S), has a negative
coefficient as predicted, and is highly significant. Both institutional shareholdings (IT) and
R&D have positive and significant impacts on qa as predicted.
The results in equations 1-3 of Table 2 illustrate the value of disentangling the
entrenchment and wealth effects of insider shareholdings. The coefficients of both IS and S
imply a strong negative effect on qa from managerial entrenchment as measured by either the
size of managers’ fractional shareholdings or the size of the firm itself. The wealth effect,
12
captured by the value of the shares held by managers, is on the other hand positive and
significant. Institutional shareholders appear to improve the performance of the companies in
their portfolios.
B. Results for Marginal q
We first test for the same cubic relationship between marginal q and insider
ownership as observed with average q as the dependent variable.20 Eq. 4 in Table 2 reports
these results. The three IS terms have the same signs as in eq. 1, and all coefficients are
highly significant. Unlike in the equation for qa, when the other variables are added to the
equation, the coefficients on the three IS terms do not reverse signs (see eq. 5), but their
statistical significance drops dramatically with only the quadratic term’s negative coefficient
remaining significant at the 5 percent level. The coefficients on the other variables have the
same signs as when qa is the dependent variable, and all are again statistically significant.
In eq. 6 we again drop the squared and cubic IS terms. As for qa, in the linear
specification insider ownership has a significant, negative relationship with marginal q, as
predicted under the entrenchment hypothesis. As discussed above, there is less reason to
expect a positive relationship between R&D and marginal q, than for average q. RD does
pick up a positive and significant coefficient in the qm equation, but both its coefficient and t-
statistic are much smaller in the qm than in the qa equation, which matches our expectations.
When equations 3 and 6 are compared, we observe the exact same pattern of
coefficients in both the qm and qa equations. The negative entrenchment effects of insider
ownership and firm size appear with either qa or qm as the dependent variable. The positive
wealth effects of insider ownership and the positive effects of both institutional ownership
and R&D are also present regardless of whether we use a measure of average performance, or
the more appropriate measure of marginal performance – qm. Using qm, however, we are
13
much more confident that reverse causality is not a problem.
Before closing this section, we shall contrast the relationships implied by our results
between the two qs and insider ownership with those found in other studies. To do so we
must take into account the fact that IS and firm size are inversely related. Managers tend to
own larger stakes in small firms than in large ones. Thus, as we increase IS both S and the
market value of the firm tend to fall. To predict the marginal effect of an increase in IS, we
thus divide the range of IS into subintervals. For each subinterval we compute the mean
value of S and the market value of the firm. We then multiply the mean figure for S by its
respective coefficient in Table 2 and add this number to the coefficient on IS. We multiply
the mean value of the firms’ market value by IS to create a mean VS for each IS interval, and
then multiply this number and its square by the appropriate coefficients in Table 2 and add
them to the figures just calculated using mean values for S. An analogous calculation is made
for IT. Since RD is uncorrelated with IS, we simply multiply its mean over the entire sample
times its appropriate coefficient in Table 2 and add it to the figures just calculated.
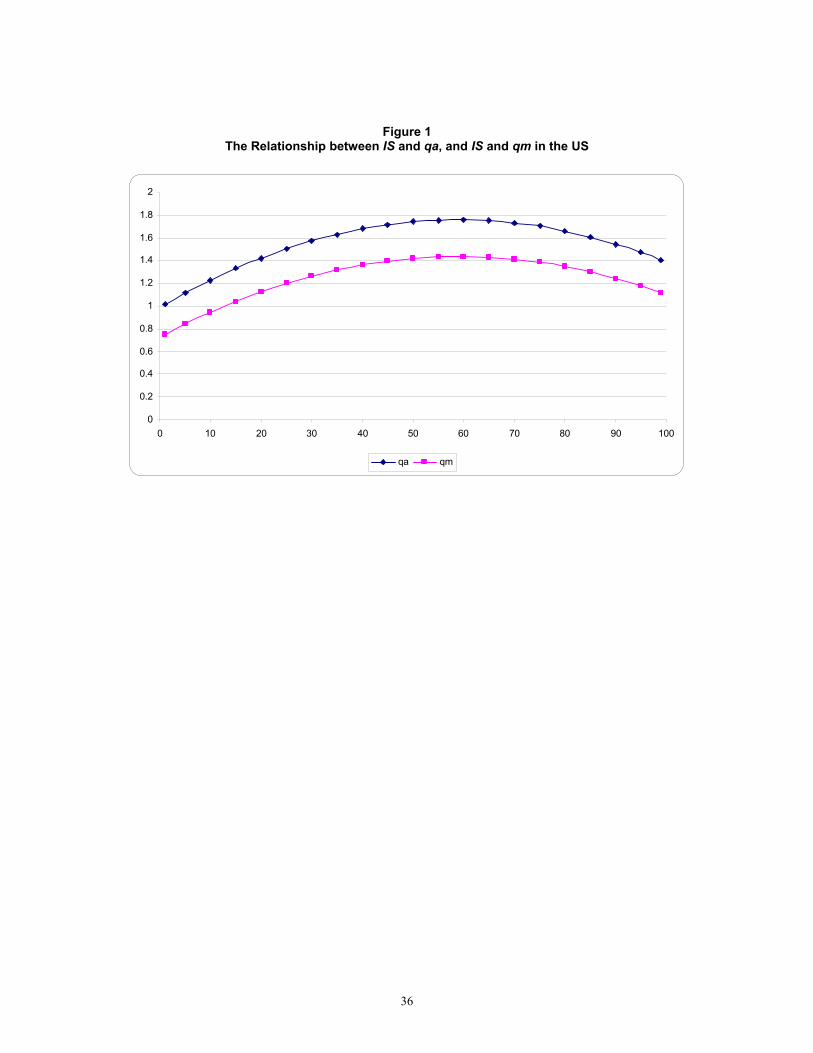
This exercise gave us a set of points in q-IS space. Inspection of the pattern of the
points suggested a quadratic relationship between both measures of q and IS. Therefore, we
fitted a quadratic function to the points and plotted the relationship (see Figure 1). At low
values of insider ownership, the wealth effect dominates the entrenchment effects and both qa
and qm increase with IS. At a level of insider ownership of 60 percent, the entrenchment
effect begins to dominate. These relationships between average and marginal q and IS are
similar to those observed by McConnell and Servaes (1990, 1995) and Thomsen and
Pedersen (2000) for average q. Note also that the marginal q/IS curve lies entirely below the
average q curve. This can be expected, if some firms earn infra-marginal rents, and thus have
higher average than marginal returns on capital.
Given that MSV used qa as their measure of performance, one might wonder why our

14
results do not imply the same pattern as in MSV when qa is the dependent variable. Here it is
worth recalling that we do reproduce the MSV pattern with qa when IS is the only variable in
the equation (Table 2, eq. 1). The reason why it does this is that IS by itself has to capture
three effects – the entrenchment effect from insider ownership, the wealth effect from insider
ownership, and the entrenchment effect from size. This one variable appears to capture these
three effects less well than the three variables we use to capture these effects.
V. The Effects of Insider Ownership Concentration in Other Countries
A. Characteristics of the Sample
Our data sources do not contain enough observations on firms in each country to
undertake the same kind of analysis for other countries as we have done for the United States.
In examining the effects of ownership structure on investment performance, therefore, we
have grouped countries according to the La Porta, Lopez-De-Silanes, Shleifer and Vishny
(1997, 1998, hereafter LLSV) categorization based on the origins of the countries’ legal
systems. We have found in previous research that their categorization is useful for examining
various aspects of corporate governance,21 and by using it we eliminate at least one possible
dimension of heterogeneity in our cross-national data. LLSV identify two broad categories of
legal systems – Anglo-Saxon or common law systems, and civil law systems. We employ
this same division in our subsequent tests, with the Anglo-Saxon category including five
countries from the LLSV category, but excluding the United States.
In previous research,22 we observed that the three Asian countries assigned to the
Germanic/civil law category – Japan, Korea, and Taiwan – performed quite differently from
the three European countries in this category. This difference in performance might be due to
differences in corporate governance structures between the two continents that go beyond the
origins of their legal systems. A notable feature of corporate governance in Japan and Korea

15
that differs from Europe lies in the important role played by group firms. The existence of
these group firms makes it difficult to apply the methodology used in this study to measure
the effects of ownership structures. In Japan, for example, the largest shareholder of a
company typically holds less than 10 percent, often less than five percent of its outstanding
shares. If the firm is a member of a keiretsu, however, the managers may be well entrenched
against challenges from outside of the keiretsu, because the cumulative holdings of all
members of the group are sufficient to protect the firm against outsiders.23 Measuring the
extent of managerial entrenchment as we do for the United States and the other countries in
our sample would be meaningless. We thus limit our civil law countries to Europe.24
Column 2 of Table 3 reports the numbers of firms in each country’s sample. The next
four columns report the fractions of firms in each sample, for which a family, a non-financial
corporation, a financial institution, or the state is the largest shareholder. The numbers in
columns 3-6 sum to one. Column 7 reports the percentage of companies in each sample for
which no family or institution holds at least 10 percent of a firm’s shares. These firms are
defined as having dispersed ownership. Several things are noteworthy in the first seven
columns of the table. First, the fraction of companies for which a non-financial corporation is
the largest shareholder is much lower in the United States than in either of the other country
groups. This is due to Section 8 of the Clayton Act, which prohibits large cross-holdings of
shares. Second, dispersed ownership is much lower in the United States than one anticipates
from the Berle and Means view of ownership. This difference can be explained by the fact
that our sample for the United States is very large, and thus includes many small firms for
which an individual or family is the largest shareholder. If we limited our US sample to the
500 largest firms, as many studies do, the figure for dispersed ownership in the United States
would be over 40 percent. Note also, however, that the Anglo-Saxon stereotype of widely
dispersed ownership does not accurately characterize all of the other Anglo-Saxon countries
16
either, although the average for this group is three times larger than for the Continental
countries. Note also from column 6 that in most countries the state is the largest shareholder
for very small percentages of companies.
Column 8 presents the mean shareholding of the largest shareholder in each country
group, regardless of his identity. Here the numbers correspond more closely to the Anglo-
Saxon stereotype. The average fraction of shares held by the largest shareholder in the civil
law countries is twice as large as in the United States or the other Anglo-Saxon countries.
Column 9 reports the mean shareholdings of the largest shareholder, when a family is
the largest shareholder, with the last three columns constructed analogously for the other
ownership categories. Thus, we see that for 20 percent of the companies in the civil law
countries a family is the largest shareholder (column 3), and the mean holding for these firms
is 26 percent of outstanding shares (column 9). Particularly noteworthy is the importance of
other firms as shareholders in the civil law countries. For 49 percent of the companies in the
civil law countries a non-financial firm is the largest shareholder (column 4), a fraction which
is seven times larger than for the US and double the size for the other Anglo-Saxon countries.
The mean holding for these firms in the civil law countries is 51 percent of outstanding shares
(column 10), a fraction which is again considerably larger than for the US and the other
Anglo-Saxon countries. These figures illustrate the importance of corporate pyramids and
cross-shareholdings in Continental Europe.
B. Adjustments to the Model
In the United States we identified insider holdings as the holdings of the board of
directors following the precedent of MSV. In many of the other countries it was not always
possible to identify whether an individual was part of management or not. Thus, in the case
where an individual or a family is the largest shareholder, we have chosen to define her or it
17
as an insider, because in the great majority of cases these persons, or at least some members
of the family, are part of management. This procedure may introduce a bias into our
estimates of the effects of entrenchment to the extent that some families with large
shareholdings are not part of management. They may be able to exert more control over
managers because of their large shareholdings, and produce a better performance for the firm.
The other variables in the model should not be affected by this problem.
It was also not always possible in other countries to identify all of the holdings of
institutional shareholders. We could identify the holdings of banks and other financial
institutions like insurance companies, however. Banks have often been thought to play a
positive monitoring role for the companies in which they hold shares, particularly in civil law
countries like Germany (Cable, 1985). Thus, one might expect the same positive coefficient
on Fin, the fraction of shares held by financial institutions, as we observed for IT in the US
results. Banks are also run by professional managers, however. If bank managers are empire
builders, they may encourage the companies that they can influence to pursue growth, and
Fin will pick up a negative coefficient in the q equations.
Many countries do not require firms to report their R&D. Thus, the final change to
the basic model estimated for the US is to drop the R&D because of a lack of data.
C. The Results
In Table 4, the sample is restricted to companies in each country group for which the
largest shareholder is an individual or family. We assume that this largest shareholder is part
of management, and thus that the entrenchment and wealth effects from his shareholdings
should be captured by the same variables used for the USA. We do not concern ourselves any
longer with the issue of whether performance is a cubic function of IS. The first thing one
notes from the table is that the pattern of signs for the two key variables is identical to that for

18
the United States. The entrenchment effect of insider (family) ownership is negative and
highly significant for both country groups and measures of performance. The wealth effect is
positive on the margin, and diminishing in VS. Both coefficients on the two VS terms are
highly significant.
A comparison of the sizes of the coefficients reveals an important difference between
the United States and the other countries, however. The coefficient on IS in eq. 3 of Table 2,
predicts a fall in Tobin’s q of 0.045 for a rise in an insider’s shareholdings of 10 percent of
outstanding shares. The comparable estimates in Table 4 for the Anglo-Saxon and civil law
countries are nearly twice as large as for the United States, implying drops in qa of roughly
0.08 for both country groups. These differences imply stronger negative effects from
entrenchment for both the Anglo-Saxon and civil law samples than for the United States.
The coefficients on the two VS terms in the qa equations in Table 4 imply similar
wealth effects from insider shareholdings for the United States and the other two groups of
countries.
Our second entrenchment variable – size – has a negative and highly significant
coefficient in both qa-equations, with both coefficients being close to that for the US. The
variable Fin is insignificant for the Anglo-Saxon countries, but negative and significant for
the civil law countries. Thus, there is no evidence in the qa equations that banks and other
financial institutions play a positive monitoring role as minority shareholders. In the civil
law countries they even appear to worsen company performance.
In the bottom half of Table 4, the results are presented with qm as the dependent
variable. As was true for the United States, all coefficients on the IS and VS variables have
the same signs as in the qa-equations, and all are significant. Insider entrenchment worsens
investment performance, while the wealth effects of insider shareholdings positively affect
19
investment performance. The coefficient on IS for the other Anglo-Saxon countries is almost
identical to that for the US, while IS’s coefficient in eq. 4 of Table 4 implies a weaker
entrenchment effect in the civil law countries than for the United States.25 The coefficients
on VS in the qm equations are much smaller than observed in Table 2 for the US, and thus
imply flatter qm-VS curves and weaker wealth effects of insider ownership than for the US.
Size again has a negative coefficient in both qm-equations, but is significant for only
the Anglo-Saxon countries. Both coefficients are substantially smaller than for the US. Fin
is insignificant in both equations.
The similarities in the results in Tables 2 and 4 outweigh the differences. The
entrenchment effect of insider ownership is negative and significant for both measures of
performance in every sample. The wealth effect is positive and significant. Size generally
has a negative effect on performance.
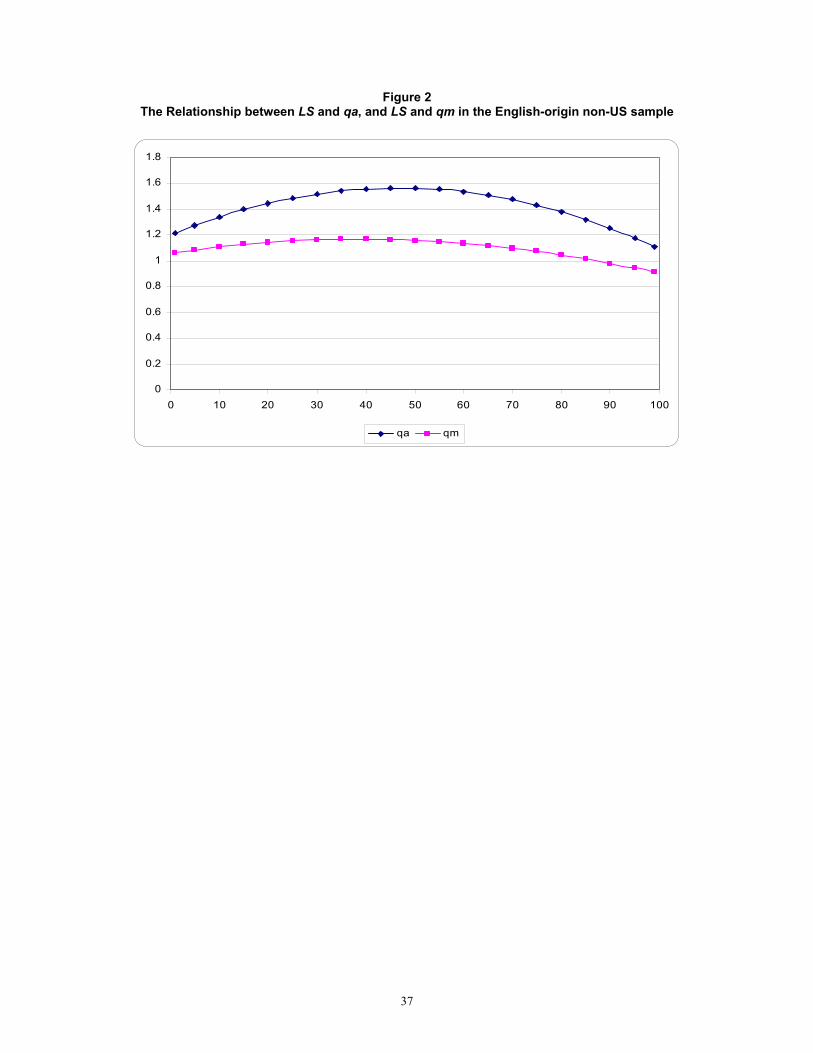
As for the US, in Figures 2 and 3 we plot the predicted values for qa and qm against
IS taking into account changes in the market values and sizes of firms associated with
changes in IS. We also add an adjustment for Fin in eq. 2, where it was significant. For the
Anglo-Saxon countries, the two curves start at points slightly above 1.0. Both curves rise
with IS, the qa curve more steeply than qm. Both curves peak earlier than for the US – at
around an IS of 40%. The qm curve drops below 1.0 at an IS of around 80%.
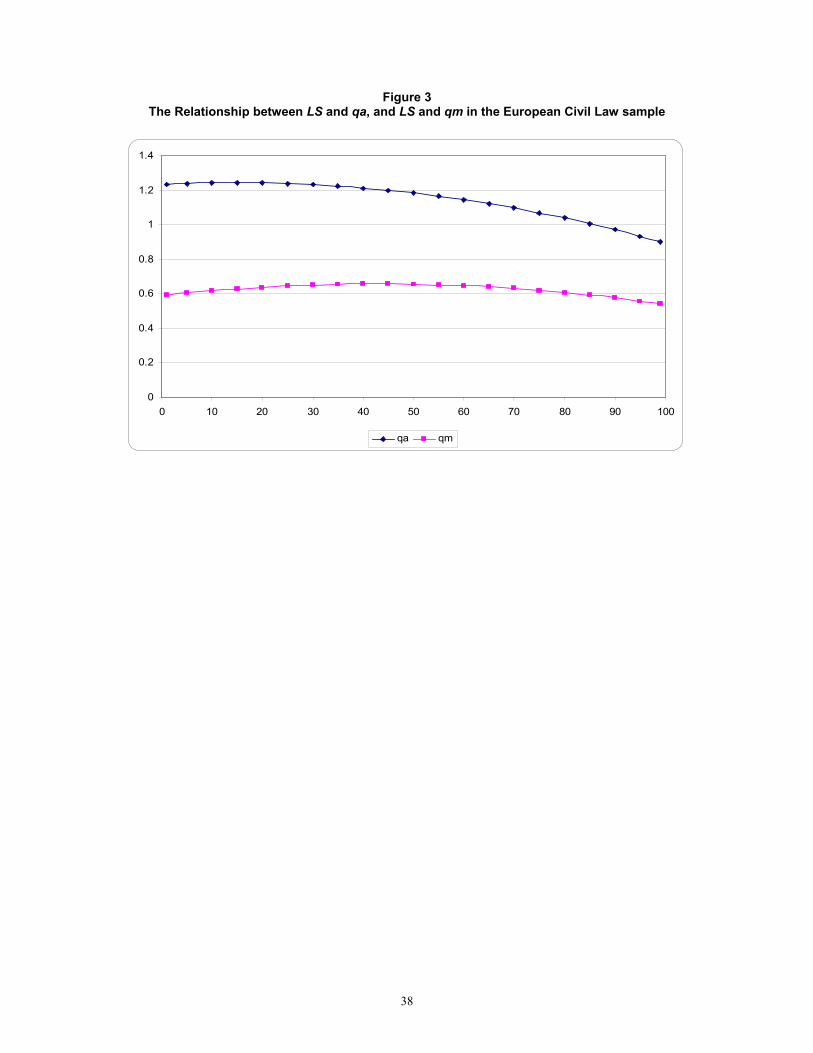
The qa-curve for the civil law countries is essentially flat up to an IS of around 25%,
and then begins to slope continuously downward dropping below 1.0 at an IS of slightly
above 80 percent. The qm curve begins at around 0.6, rises ever so slightly until an IS of
around 45%, and then gradually declines as insider ownership increases. Marginal q stays
below 0.7 over the whole range of IS. Thus, the results in Figures 1, 2 and 3 reveal rather
clearly that Anglo-Saxon countries have a superior investment performance to civil law

20
countries. Moreover, they imply that the importance of the wealth effect of insider ownership
relative to the entrenchment effects is strongest in the United States and weakest in the
Continental European countries.
VI. The Effects of Ownership Concentration for Other Categories of Owners
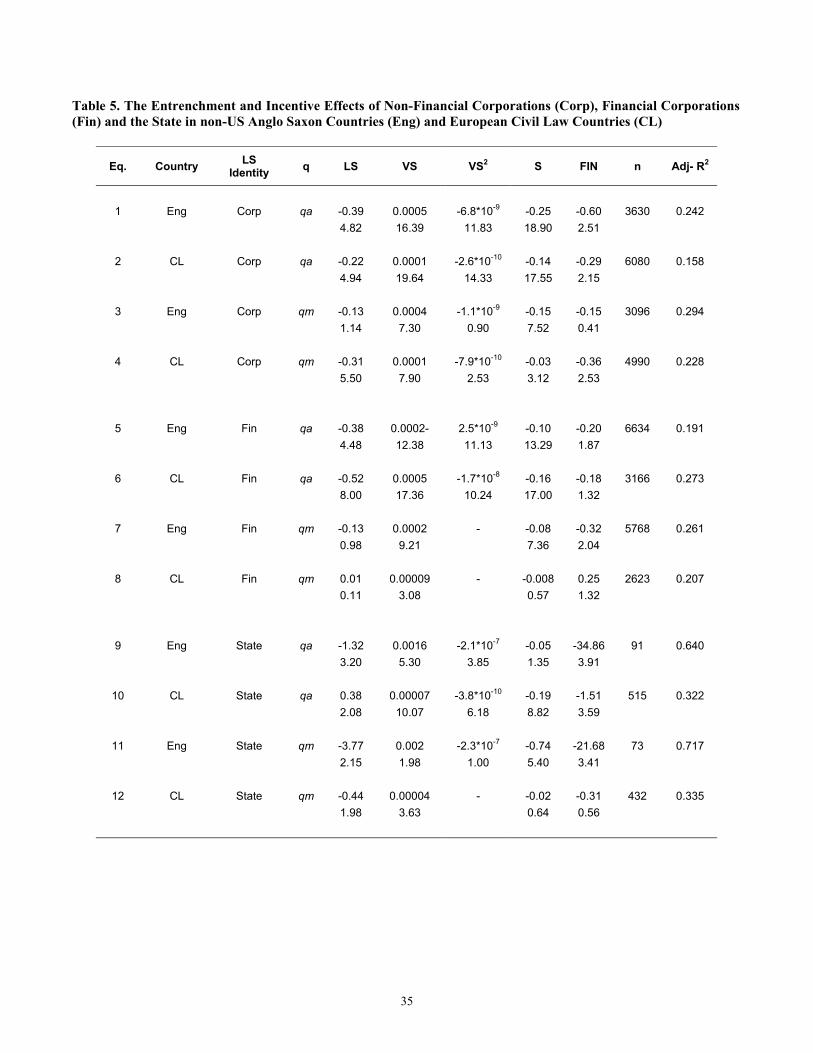
Table 5 has been constructed analogously to Table 4. In the first four equations, the
sample is restricted to firms with a non-financial company as the largest shareholder, in the
next four a financial institution is the largest shareholder. The samples for state-controlled
firms were so small that we have not estimated the models for them. Since the largest
shareholder is no longer an insider or family, we have changed the designation of the largest
shareholder’s fraction of outstanding shares to LS.
A consistent pattern appears across all equations. VS and VS2 typically have positive
and negative coefficients, respectively. In three equations, the coefficient on VS was
insignificant, but became significant when the VS2 term was dropped, and so we report only
the results without VS2. We expect a positive coefficient on VS and a negative coefficient on
VS2, because of diminishing marginal utility of wealth. This pattern was consistently
observed when individuals are the largest shareholders (Tables 2 and 4). The estimates for
the qm equations imply that financial institution as largest shareholder behave as if they were
risk neutral.
LS has a negative coefficient in 7 of the 8 equations with 6 of the 7 being statistically
significant. The other entrenchment variable, S, has a negative coefficient in all 8 equations
with 7 being significant. Of particular interest is the qm equation for Continental Europe
when a financial institution is the largest shareholder. Marginal q is independent of both firm
size and the controlling financial institution’s stake in the firm, LS, while increasing with the
value of this stake, VS.

21
When another firm is the largest shareholder, the coefficient on Fin is negative in all
four equations, three being statistically significant. When a non-financial company is the
largest shareholder, a firm is generally part of a corporate pyramid, or involved in cross-
shareholdings with other companies. The negative coefficients on LS in these equations
imply that a company’s performance declines as the firm controlling it becomes more
entrenched. The negative coefficients on Fin indicate that banks and other financial
institutions only reinforce the adverse effects of these interlocking corporate relationships.
VS’s coefficient in the average q equation for family-controlled firms in both the other
Anglo-Saxon and civil-law countries is around 0.001. VS’s coefficients in the qa equations
for firms controlled by other firms are 0.0005 for the Anglo-Saxon countries, and 0.0001 for
the civil-law countries, a difference by a factor of two in the first case, ten in the second.
Similar differences in the VS coefficients can be observed when financial institutions are the
largest shareholders. Thus, the magnitude of the wealth effect on performance as measured
by qa is generally much larger for insiders than for the other largest-shareholder categories in
both the Anglo-Saxon and civil law countries.
Figure 4 presents the plots of qa and qm against LS based on the estimates from Table
5. The qa and qm curves for firm-controlled companies in Anglo-Saxon countries exhibit the
same inverted-U shape observed for insider ownership. The qa curve for firm-controlled
companies in the Continental European countries takes on a modest U-shape, and lies entirely
above 1.0. As always a better indication of the importance of agency problems comes from
observing the qm curve. It starts out just below 0.8, remains roughly constant until an
ownership concentration of 0.20, and then declines steadily approaching 0.5 at a
concentration level of 100 percent.
Both the qa and qm curves for finance-controlled companies in Anglo-Saxon
countries have inverted-U shapes. The qm curve has a positive slope throughout most of the

22
range of LS values implying an improvement in investment performance of finance-
controlled companies in Anglo-Saxon countries as their ownership stakes rise. Nevertheless,
the qm curve for these companies never even reaches a value of 0.90. Finance-controlled is
the only ownership category in the Anglo-Saxon countries for which marginal qs are not
greater than 1.0. Financial institutions in these countries do not appear to do a particularly
good job of monitoring the firms that they control.
The same is true but even more so for finance-controlled companies in Continental
Europe. The qm curve rises slightly with the controlling financial institution’s ownership
stake, but the curve lies entirely between 0.6 and 0.7 for the entire range of LS values. Thus,
the curves in Figure 4 tell a similar story to the earlier figures. Although they reveal the
existence of agency problems for finance-controlled companies in Anglo-Saxon countries,
these problems are much more severe in Continental Europe than in Anglo-Saxon countries.
VII. Conclusions
This article cleanly separates the positive wealth effect of share ownership from the
negative entrenchment effect. Almost without exception, we have found the wealth effect to
be positive and significant and the entrenchment effect to be negative and significant across
all control categories and countries. Our preferred measure of investment performance is
marginal q, because it more accurately reflects the extent of agency problems in a firm and is
not subject to simultaneous equation bias. Comparing the coefficients on IS and LS in the qm
equations of Tables 2, 4 and 5, we see that the wealth effect of insider ownership was much
stronger in the United States than in other countries, and generally stronger for insider owners
than for other ownership categories in the other countries. Thus, when an individual or a
family is in control of a firm, its performance is more sensitive to the value of the controller’s
stake than when another firm or financial institution is in control.26 Individuals seem to
respond more strongly to financial incentives than do institutions.
23
Again focussing on the marginal q equations, we observed that the negative effects of
entrenchment by insiders were of similar strength in the United States and the other Anglo-
Saxon countries, but weaker although still significant in the civil law countries. On the other
hand, the decline in marginal q for companies controlled by other firms as these controlling
firms’ stakes grow was three times larger in the civil law countries than in the Anglo-Saxon
countries, with LS’s coefficient not even being significant in the latter sample.
When we combined the wealth and entrenchment effects of insider ownership, we
found for the United States that both average and marginal q initially rose with increasing
insider ownership, and than fell when IS reached values of roughly 60 percent. The same was
true for average q in the other Anglo-Saxon countries except that the curve peaked at an IS of
some 45 percent. Both qm curves in the English-origin and civil law countries were
essentially flat suggesting that the wealth and entrenchment effects tend to balance one
another out over the full range of IS.
Another interesting finding of our study is that institutional shareholders appear to be
able to constrain managerial propensities toward overinvestment in the United States. Both
qa and qm are positively related to institutional shareholdings in the US. For the other two
sets of countries there was no evidence that financial institutions improve the performance of
companies either as minority shareholders or when they are the largest shareholders. Both
measures of performance were negatively related to the size of a financial institution’s
shareholding, when it was a minority shareholder, and the qm-LS curves lie entirely below
1.0 when a financial institution is the largest shareholder in both the Anglo-Saxon and civil
law countries.
An important theme in several recent contributions to the literature has been the
simultaneity of insider ownership and firm performance. In trying to address this issue,
authors have written down one set of variables that they claim explains insider ownership,
24
and another set that supposedly explains performance, as measured by qa. Industry dummies
to capture industry specific characteristics, size, leverage and measures of risk, like the
variance in share returns, have all been used to predict ownership structure. But these
choices strike us as somewhat arbitrary, since all of these variables are also plausible
candidates for explaining Tobin’s q.27
Our substitution of qm for qa is an alternative way to mitigate the issue of
simultaneity with respect to the right-hand-side variables in the model. As stressed above,
the returns on an investment are determined by the size and quality of the investment, and
these, in turn, are determined by a firm’s managers. Causality must run from the incentives
faced by managers to their investment decisions. These investments then determine the
returns on investment, which then determine our marginal q. Our confidence in our
interpretation of the variables used to measure the entrenchment and wealth effects of insider
ownership is strengthened, therefore, by the fact, that we obtain substantially the same results
when marginal q is the dependent variable as when average q is.
Although our results reveal a number of similarities across the three samples of
countries, they also reveal some important differences. In addition to the differences in the
shapes of the curves relating the two measures of firm performance, qa and qm, to IS and LS
as discussed above, there are also important differences in their heights. The superior
investment performance of the United States and the other Anglo-Saxon countries over the
civil law countries is clearly apparent when comparing the relative heights of the three qm
curves for insider-controlled firms in Figures 1-3. This superior investment performance of
the Anglo-Saxon countries continues to be observed for other categories of ownership.
Although evidence of agency problems was apparent in the qm-LS curve of finance-
controlled companies in Anglo-Saxon countries (Figure 4c), this curve lies entirely above the
analogous curve for the civil law countries (Figure 4d). These firms performed about as

25
badly as family-controlled companies in the civil law countries. Based on our estimates for
the marginal q equations, the best performing companies in the civil law countries where
controlled by other, non-financial companies. Above and ownership stake of 20 percent,
however, the qms for these companies steadily declined, so that at large values of LS they
were performing just as badly as other firms in the civil law countries (qm ≈ 0.6). These
findings support the hypothesis that the legal institutions in the Anglo-Saxon countries offer
shareholders better protection against agency problems than do those of the civil law
countries.
26
References
Agrawal, Anup, and Charles R. Knoeber, 1996, Firm Performance and Mechanism to Control
Agency Problems between Managers and Shareholders, Journal of Financial and
Quantitative Analysis 31: 377-397.
Agrawal, Anup, and Gershon N. Mandelker, 1987, Managerial Incentives and Corporate
Investment and Financing Decisions, Journal of Finance 42, 823-837.
Amihud, Y, B. Lev, and N. G. Travlos, 1990, Corporate Control and the Choice of
Investment Financing: The Case of Corporate Acquisitions, Journal of Finance 45: 603-
616.
Baker, George P. and Brian J. Hall, 2004, CEO Incentives and Firm Size, Journal of Labor
Economics, 22 (4): 767-798.
Bathala, Chenchuramaiah T., Kenneth P. Moon, and Ramesh P. Rao, 1994, Managerial
Ownership, Debt Policy, and the Impact of Institutional Holdings: An Agency
Perspective, Financial Management 23: 38-50.
Berger, Philip G., Eli Ofek and David L. Yermack, 1997, Managerial Entrenchment and
Capital Structure Decisions, Journal of Finance 52: 1411-1438.
Berglöf, E., and Perotti, E. (1994), The Governance Structure of the Japanese Financial
Keiretsu, Journal of Financial Economics 36: 259-84.
Berle, A. A. and G.C. Means, 1932, The Modern Corporation and Private Property. New
York: Harcourt, Brace and World.
Bøhren O. and Ødegaard A., 2001, Corporate Governance and Economic Performance: A
Closer Look, WP Norwegian School of Management.
Cable, John R, 1985, Capital Market Information and Industrial Performance: The Role of
West German Banks, The Economic Journal 95: 118-32.
Cho, M. H., 1998, Ownership Structure, Investment, and the Corporate Value: An Empirical
Analysis, Journal of Financial Economics 47, 103-121.
Claessens, S., S. Djankov, and L. H. P. Lang, 2000, The Separation of Ownership and
Control in East Asian Corporations, Journal of Financial Economics 58, 81-112.
27
Claessens, S., S. Djankov, J. P. H. Fan and L. H. P. Lang, 2002, Disentangling the Incentive
and Entrenchment Effects of Large Shareholders, Journal of Finance 57, 2741-2771.
Cosh, A. D., Guest, P. and Hughes, A. 2001, Managerial Discretion and Takeover
Performance, WP ESRC Centre for Business Research, Cambridge University.
Demsetz, H. and K. Lehn, 1985, The Structure of Corporate Ownership: Causes and
Consequences, Journal of Political Economy 93, 1155-1177.
Demsetz, H., 1983, The Structure of Ownership and the Theory of the Firm, The Journal of
Law and Economics 26, 375-393.
Faccio, M. and L.H.P. Lang, 2002, The Ultimate Ownership of Western European
Corporations, Journal of Financial Economics 65, 365-395.
Firth, Michael, 1991, Corporate Takeovers, Stockholder Returns and Executive Rewards,
Managerial and Decision Economics, 12(6): 421-28.
Firth, Michael, 1995, The Impact of Institutional Stockholders and Managerial Interests on
the Capital Structure of Firms, Managerial and Decision Economics 16, 167-175.
Friend, I., and L. H. P. Lang, 1988, An Empirical Test of the Impact of Managerial Self-
Interest on Corporate Capital Structure, Journal of Finance 42: 271-281.
Gedajlovic E. R. and Shapiro, D.M. 1998, Management and Ownership Effects: Evidence
from Five Countries, Strategic Management Journal, 19(6), 533-53.
Grossman, S and O. Hart, Corporate Financial Structure and Managerial Incentives, in J.
McCall ed.: The Economics of Information and Uncertainty, University of Chicago Press,
Chicago, Ill, 1982.
Gugler, K. and B. B. Yurtoglu, 2003a, Corporate Governance and Dividend Pay-out Policy in
Germany, European Economic Review 47 (4), 731-58.
Gugler, K. and B. B. Yurtoglu, 2003b, Average Q, Marginal Q, and the Relation Between
Ownership and Performance, Economics Letters, 78(3), 379 - 384.
Gugler, K., Mueller, D. C. and B.B. Yurtoglu, 2003a, Marginal Q, Tobin's Q, Cash Flow and
Investment, Southern Economic Journal, 70(3), 512-531.
Gugler, K., Mueller, D. C. and B. B. Yurtoglu, 2003b, The Impact of Corporate Governance
on Investment Returns in Developed and Developing Countries, The Economic Journal
113, 511-539.
28
Gugler, K., Mueller, D. C. and B. B. Yurtoglu, 2004, Corporate Governance and the Returns
on Investment, Journal of Law and Economics, October, 589-633.
Hall, B., 1993, The Stock Market's Valuation of Research and Development Investment
During the 1980s, American Economic Review 83, 259-264.
Himmelberg, C.P., R.G. Hubbard and D. Palia, 1999, Understanding the Determinants of
Managerial Ownership and the Link between Ownership and Performance, Journal of
Financial Economics 53, 353-384.
Holmstrom, Bengt and Steven N. Kaplan, 2001, Corporate Governance and Merger Activity
in the United Sates: Making Sense of the 1980s and 1990s, Journal of Economic
Perspectives, 15(2), 121-144.
Jensen, G. R., D. P. Solberg, and T. S. Zorn, 1992, Simultaneous Determination of Insider
Ownership, Debt, and Dividend Policies, Journal of Financial and Quantitative Analysis
27, 247-263.
Kamerschen, David R., 1968, The Influence of Ownership and Control on Profit Rates,
American Economic Review 58, 432-447.
Kim, W. S., and E. H. Sorenson, 1986, Evidence on the Impact of the Agency Cost of Debt
on Corporate Debt Policy, Journal of Financial and Quantitative Analysis 21: 131-144.
Kole, S. R., 1995, Measuring Managerial Equity Ownership: A Comparison of Sources of
Ownership Data, Journal of Corporate Finance, 1(3-4), pp. 413-35.
Kole, Stacey R., 1996, Managerial Ownership and Firm Performance: Incentives or
Rewards? in Advances in Financial Economics, 119-149.
La Porta, Rafael; Lopez-de-Silanes, Florencio; Shleifer, Andrei; and Vishny, Robert, 1997,
Legal Determinants of External Finance, Journal of Finance 52, 1131-1150.
La Porta, Rafael; Lopez-de-Silanes, Florencio; Shleifer, Andrei; and Vishny, Robert, 1998,
Law and Finance, Journal of Political Economy 106, 1113-1155.
Lewellen, Wilbur, Loderer, Claudio and Rosenfeld, Ahron, 1985, Merger Decisions and
Executive Stock Ownership in Acquiring Firms, Journal of Accounting and Economics,
7(1-3), 209-31.
Loderer, C. and K. Martin, 1997, Executive Stock Ownership and Performance: Tracking
Faint Traces, Journal of Financial Economics 45, 223-255.

29
Marris, Robin and Dennis C. Mueller, 1980, The Corporation, Competition, and the Invisible
Hand, Journal of Economic Literature 18, 32-63.
McConnell, J. J. and H. Servaes, 1990, Additional Evidence on Equity Ownership and
Corporate Value, Journal of Financial Economics 27, 595-612.
McGuire, Patrick, 2003, Bank Ties and Bond Market Access: Evidence on Investment-Cash
Flow Sensitivity in Japan, NBER WP 9644.
Modigliani, F. and Miller, M. 1958, “The Cost of Capital, Corporation Finance and The
Theory of Investment.” American Economic Review 48: 261-97.
Monsen, Joseph R., John S. Chiu, and David E. Cooley, 1968, The Effect of Separation of
ownership and Control on the Performance of the Large Firm, Quarterly Journal of
Economics, June, 435-451.
Mørck, R., A. Shleifer and R. Vishny, 1988, Management Ownership and Market Valuation:
An Empirical Analysis, Journal of Financial Economics 20, 293-315.
Mueller, D. C. and E. Reardon, 1993, Rates of Return on Corporate Investment, Southern
Economic Journal 60, 430-453.
Mueller, D.C. and B.B. Yurtoglu, 2000, Country Legal Environments and Corporate
Investment Performance, German Economic Review 2: 187-220.
Mueller, Dennis C. and Mark L. Sirower, 2003, The Causes of Mergers: Tests Based on the
Gains to Acquiring Firms' Shareholders and the Size of Premia, Managerial and Decision
Economics, 24(5): 373-91.
Oliner, Stephen D. and Glenn D. Rudebusch, 1992, Sources of the Financing Hierarchy for
Business Investment, Review of Economics and Statistics, 74, 643-54.
Osano, H., 1996, Intercorporate Shareholdings and Corporate Control in the Japanese Firm,
Journal of Banking and Finance 20: 1047-68.
Palmer, John, 1973, The Profit-Performance Effects of the Separation of Ownership from
Control in Large U.S. Industrial Corporations, Bell Journal of Economics 4: 293-303.
Radice, H. K. ,1971, Control Type, Profitability and Growth in Large Firms: An Empirical
Study, The Economic Journal, Sept: 547-562.
Rajan, Raghuram, 1992, Insiders and Outsiders: The Choice between Informed and Arm’s-
Length Debt, Journal of Finance 47, 1367-1400.
30
Ross, S. 1977, The Determination of Financial Structure: The Incentive-Signaling Approach,
Bell Journal of Economics, 8(1), 23-40.
Sharpe, Steven A., 1990, Asymmetric Information, Bank Lending and Implicit Contracts: A
Stylized Model of Customer Relationships, Journal of Finance 45, 1069-1087.
Shinn, Earl W., 1999, Returns to Acquiring Firms: The Role of Managerial Ownership,
Managerial Wealth, and Outside Owners, Journal of Economics and Finance, 23(1), 78-
89.
Shleifer, Andrei, and Robert W. Vishny, 1997, A Survey of Corporate Governance, Journal
of Finance 52, 737-783.
Short, H. and Keasey, K. 1999, Managerial Ownership and the Performance of Firms:
Evidence from the UK, Journal of Corporate Finance 5(1), 79-101.
Short, H., K. Keasey, and D. Duxburry, 2002, Capital Structure, Management Ownership and
Large External Shareholders: A UK Analysis, International Journal of the Economics of
Business 9: 375-399.
Thomsen, S. and Pedersen, T., 2000, Ownership Structure and Economic Performance in the
Largest European Companies, Strategic Management Journal 21 (6), 689-705.
Walkling, Ralph A. and Long, Michael S., 1984, Agency Theory, Managerial Welfare, and
Takeover Bid Resistance, Rand Journal of Economics, 15(1): 54-68
Weinstein, D. and Y. Yafeh, 1998, On the Costs of a Bank-Centered Financial System:
Evidence from the Changing Main Bank Relations in Japan, Journal of Finance, 53, 635-
72.
Weston, F. and S. K. Mansinghka, 1971, Tests of the Efficiency Performance of
Conglomerate Firms, Journal of Finance 26, 919-936.
Yurtoglu, B. B., 2003, Corporate Governance and Implications for Minority Shareholders in
Turkey, Journal of Corporate Ownership & Control 1: 72-86.
Zhou, X., 2001, Understanding the Determination of Managerial Ownership and its Relation
to Firm Performance: Comment, Journal of Financial Economics 62, 559-571.
31
Table 1
Descriptive Statistics and Correlation Matrix Tobin’s q (qa) is the ratio of the market value (M) of a firm to its total assets. ∆Mt/Mt-1 is the change in market value from year t-1 to t scaled by Mt-1. It/Mt-1 is total investment scaled by Mt-1. Insider ownership, IS, is defined as the total number of shares held in aggregate by all officers and directors divided by the number of shares outstanding. Insider wealth, VS, is the value of the shares held by insiders (IS times the market value of equity, MV) in Mio USD. Size (S) is the logarithm of total assets. Institutional shareholdings, IT, are the mean combined (percentage) stake of institutions. RD is R&D expenditures divided by total sales. We deflate all variables by the CPI (1995=1.00).
Panel A: Summary Statistics Panel B: Matrix of Correlation Coefficients
Mean Median S.D qa ∆Mt / Mt-1 It / Mt-1 IS IT VS S RD MV qa 1.54 1.08 1.35 1.00 ∆Mt / Mt-1 0.15 0.03 0.54 0.34 1.00 0.00
It / Mt-1 0.15 0.11 0.22 -0.02 0.52 1.00 0.00 0.00
IS 0.21 0.15 0.20 0.01 0.00 0.05 1.00 0.15 0.58 0.00
IT 0.31 0.28 0.24 -0.02 0.06 0.06 -0.46 1.00 0.02 0.00 0.00 0.00
VS 149.20 17.00 631.02 0.07 0.02 -0.02 -0.15 0.15 1.00 0.00 0.01 0.06 0.00 0.00
S 5.01 4.81 2.14 -0.21 -0.02 0.00 -0.47 0.65 0.39 1.00 0.00 0.01 0.80 0.00 0.00 0.00
RD 0.09 0.01 0.36 0.31 0.02 0.03 0.01 -0.07 -0.03 -0.17 1.00 0.00 0.01 0.00 0.15 0.00 0.00 0.00
MV 1348.86 110.93 5745.61 0.08 0.01 -0.03 -0.19 0.19 0.60 0.44 -0.03 1.00 0.00 0.11 0.00 0.00 0.00 0.00 0.00 0.00
32
Table 2
Determinants of Average (qa) and Marginal q (qm) All equations include a full set of SIC two-digit industry dummies. The coefficients for the qm equations are obtained from a regression of the percentage change in market value on investment with each explanatory variable interacted with investment. See the appendix for detailed definitions.
Eq. Dependent Variable IS IS2 IS3 VS VS2 S IT RD N Adj- R2
1.87 -5.23 3.79 1 qa
6.04 5.39 4.65 16524 0.13
-0.60 1.05 -0.63 6.68E-04 -2.72E-08 -0.25 1.16 0.65 2 qa
-1.78 1.04 -0.75 22.27 -12.28 -29.78 19.01 23.54 16524 0.21
-0.16 6.67E-04 -2.72E-08 -0.25 1.16 0.65 3 qa
-2.77 22.39 -12.36 -30.51 19.14 23.75 16524 0.22
2.85 -7.98 5.26 4 qm
6.58 6.12 4.89 14776 0.24
0.45 -2.81 2.01 2.26E-03 -2.10E-07 -0.19 0.62 0.09 5 qm
0.98 -2.11 1.89 17.03 -10.67 -15.06 8.24 2.74 14776 0.30
-0.58 2.31E-03 -2.15E-07 -0.19 0.62 0.09 14776 0.30 6 qm
-7.50 16.62 -11.00 -16.55 8.26 2.67

33
Table 3 Ownership Structure in Common Law and Civil law Countries
The table reports the fractions of firms in each sample for which a family, a non-financial corporation, a financial institution, or the state is the largest shareholder (Columns 2-6). LS in column 8 presents the mean shareholding of the largest shareholder regardless of his identity. Columns 9-12 report the mean shareholdings of the largest shareholder if the largest shareholder is a family, or non-financial corporation, a financial institution, or the state.
(1) (2) (3) (4) (5) (6) (7) (8) (9) (10) (11) (12)
Country Firms Family
Non-financial Financial State Dispersed LS Family
Non-financial Financial State
USA 3614 0.48 0.07 0.41 0.04 0.11 0.21 0.26 0.34 0.15 0.11
Australia 131 0.48 0.31 0.21 0.01 0.21 0.25 0.14 0.36 0.32 0.10 Canada 376 0.31 0.44 0.21 0.01 0.03 0.40 0.39 0.49 0.25 0.20 Great Britain 985 0.25 0.14 0.59 0.00 0.34 0.17 0.17 0.29 0.14 0.35 Ireland 33 0.36 0.25 0.38 0.00 0.31 0.20 0.26 0.25 0.15 - New Zealand 35 0.06 0.40 0.53 0.00 0.01 0.44 0.39 0.44 0.45 -
English-Origin (non-US) 1560 0.29 0.24 0.45 0.01 0.23 0.24 0.25 0.39 0.17 0.22
Austria 55 0.06 0.59 0.20 0.14 0.00 0.62 0.59 0.67 0.54 0.57 Belgium 63 0.09 0.48 0.43 0.00 0.03 0.46 0.30 0.53 0.42 - Denmark 65 0.39 0.36 0.22 0.03 0.33 0.25 0.21 0.38 0.10 0.41 Finland 61 0.15 0.36 0.32 0.13 0.20 0.26 0.24 0.34 0.15 0.42 France 403 0.24 0.55 0.18 0.02 0.05 0.49 0.43 0.56 0.39 0.40 Germany 353 0.27 0.46 0.19 0.04 0.04 0.53 0.54 0.61 0.36 0.45 Greece 9 0.16 0.74 0.08 0.00 0.09 0.45 0.46 0.50 0.45 - Italy 132 0.07 0.42 0.45 0.05 0.06 0.44 0.36 0.49 0.40 0.49 Luxembourg 7 0.04 0.54 0.09 0.33 0.00 0.45 0.35 0.54 0.43 0.31 Netherlands 132 0.05 0.58 0.31 0.04 0.30 0.27 0.28 0.32 0.18 0.26 Norway 67 0.18 0.52 0.25 0.04 0.08 0.32 0.34 0.35 0.21 0.51 Portugal 20 0.07 0.46 0.26 0.21 0.02 0.44 0.24 0.49 0.44 0.46 Spain 91 0.04 0.59 0.30 0.04 0.10 0.41 0.20 0.51 0.27 0.22 Sweden 126 0.21 0.32 0.45 0.02 0.09 0.31 0.31 0.32 0.29 0.37 Switzerland 119 0.33 0.46 0.16 0.03 0.09 0.45 0.39 0.54 0.26 0.58 Turkey 27 0.14 0.49 0.33 0.04 0.00 0.43 0.41 0.41 0.40 0.95
Europe 1730 0.20 0.49 0.26 0.04 0.08 0.44 0.26 0.51 0.32 0.44

34
Table 4
The Entrenchment and Incentive Effects of Insider Ownership in non-US Anglo Saxon Countries (Eng) and European Civil Law Countries (CL)
Dependent Variable Country Group IS VS VS2 S FIN n Adj- R2
qa Eng -0.78 1.07E-03 -1.05E-07 -0.23 0.11 4315 0.21 -8.00 15.13 -11.43 -18.19 0.45 qa CL -0.82 1.35E-03 -1.17E-07 -0.28 -0.71 2411 0.23 -9.07 18.44 -12.05 -16.10 -2.43 qm Eng -0.56 7.29E-04 -7.32E-08 -0.08 -0.37 3700 0.26 -4.21 4.90 -2.89 -4.36 -1.06 qm CL -0.20 4.91E-04 -3.90E-08 -0.02 0.56 1924 0.20 -2.18 6.26 -2.99 -0.99 1.53
35
Table 5. The Entrenchment and Incentive Effects of Non-Financial Corporations (Corp), Financial Corporations (Fin) and the State in non-US Anglo Saxon Countries (Eng) and European Civil Law Countries (CL)
Eq. Country LS Identity q LS VS VS2 S FIN n Adj- R2
1 Eng Corp qa -0.39 0.0005 -6.8*10-9 -0.25 -0.60 3630 0.242 4.82 16.39 11.83 18.90 2.51 2 CL Corp qa -0.22 0.0001 -2.6*10-10 -0.14 -0.29 6080 0.158 4.94 19.64 14.33 17.55 2.15 3 Eng Corp qm -0.13 0.0004 -1.1*10-9 -0.15 -0.15 3096 0.294 1.14 7.30 0.90 7.52 0.41 4 CL Corp qm -0.31 0.0001 -7.9*10-10 -0.03 -0.36 4990 0.228 5.50 7.90 2.53 3.12 2.53 5 Eng Fin qa -0.38 0.0002- 2.5*10-9 -0.10 -0.20 6634 0.191 4.48 12.38 11.13 13.29 1.87 6 CL Fin qa -0.52 0.0005 -1.7*10-8 -0.16 -0.18 3166 0.273 8.00 17.36 10.24 17.00 1.32 7 Eng Fin qm -0.13 0.0002 - -0.08 -0.32 5768 0.261 0.98 9.21 7.36 2.04 8 CL Fin qm 0.01 0.00009 - -0.008 0.25 2623 0.207 0.11 3.08 0.57 1.32 9 Eng State qa -1.32 0.0016 -2.1*10-7 -0.05 -34.86 91 0.640 3.20 5.30 3.85 1.35 3.91
10 CL State qa 0.38 0.00007 -3.8*10-10 -0.19 -1.51 515 0.322 2.08 10.07 6.18 8.82 3.59
11 Eng State qm -3.77 0.002 -2.3*10-7 -0.74 -21.68 73 0.717 2.15 1.98 1.00 5.40 3.41
12 CL State qm -0.44 0.00004 - -0.02 -0.31 432 0.335 1.98 3.63 0.64 0.56
36
Figure 1 The Relationship between IS and qa, and IS and qm in the US
0
0.2
0.4
0.6
0.8
1
1.2
1.4
1.6
1.8
2
0 10 20 30 40 50 60 70 80 90 100
qa qm
37
Figure 2 The Relationship between LS and qa, and LS and qm in the English-origin non-US sample
0
0.2
0.4
0.6
0.8
1
1.2
1.4
1.6
1.8
0 10 20 30 40 50 60 70 80 90 100
qa qm
38
Figure 3 The Relationship between LS and qa, and LS and qm in the European Civil Law sample
0
0.2
0.4
0.6
0.8
1
1.2
1.4
0 10 20 30 40 50 60 70 80 90 100
qa qm
39
Appendix: Definition of Variables
Tobin’s q (qa) is defined as the ratio of the market value of a firm to its total assets
(COMPUSTAT item 6) where the market value of the firm equals the market value of
common equity (item 199 (share price at the end of the fiscal year) times item 25 (common
shares outstanding)) plus the book value of preferred stock (items 56, 10, 130) plus the book
value of short-term (9) and long-term debt (34).
Total investment is defined as the sum of income before extraordinary items (18),
depreciation (14) and dividends (21), new debt ( D∆ ), new equity issues ( E∆ ), &R D
expenditures (46) and advertising expenditures (45). New debt ( D∆ ) is the change in total
debt since the previous period. Net new equity ( E∆ ) is sales (108) less purchases (214) of
common and preferred stock. Missing values of &R D expenditures are approximated using
&R D -sales ratios at the 3-digit SIC code level from the FTC's Annual Line of Business
Reports. Missing values of advertising expenses are approximated using 2-digit advertising to
sales ratios from the 1990 IRS Reports on Corporation Returns.
Insider ownership, IS, is defined as the total number of shares held in aggregate by all
officers and directors divided by the number of shares outstanding. Insider wealth, VS, is the
value of the shares held by insiders and calculated by multiplying IS with the market value of
equity. Size (S) is measured by the logarithm of total assets in Mn. USD. Institutional
shareholdings, IT, are the mean combined (percentage) stake of institutions. RD is R&D
expenditures divided by total sales. We deflate all variables by the CPI (1995=1.00).

40
Notes
1 This literature includes both the “managerial discretion” literature of the 1950s and 1960s
and the more recent studies, which build on the principal/agent model. For surveys of these
literatures see Marris and Mueller (1980), Shleifer and Vishny (1997).
2 See, for example, Kamerschen (1968), Monsen, Chui and Cooley (1968), Radice (1971) and
Palmer (1973).
3 Gedajlovic and Shapiro (1998) also test for a relationship between performance and
ownership concentration, but their results are difficult to compare with the other studies,
since they do not distinguish among the identities of owners, and also interact ownership with
diversification.
4 See in addition, Demsetz and Lehn (1985), Kole (1995, 1996), Loderer and Martin (1997),
Cho (1998), Himmelberg, Hubbard, and Palia (1999), and Bøhren and Ødegaard (2001).
5 Marris (1964, 1998) was the first to posit growth maximization as a goal for managers, and
many studies include empire-building in their lists of possible manifestations of agency
problems.
6 For evidence that the losses to acquirers’ shareholders are proportional to the gains to the
targets, see Mueller and Sirower (2003).
7 Although our study is the first to test for a relationship between the value of insiders'
shareholdings and q-type measures of firm performance, several studies have tested for a
relationship between this variable and other measures of performance - like the returns to
shareholders from takeovers, see Walkling and Long (1984), Lewellen et al. (1985), Firth
(1991) and Shinn (1999).
8 Baker and Hall (2004) discuss the distinction between proportional and absolute effects of
managerial decisions, and argue that the relative importance of decisions with proportional
effects increases with firm size.
9 Data are for 382 German firms (Gugler and Yurtoglu, 2003a) and 300 Turkish firms
(Yurtoglu, 2003).
10 Claessens et al. (2000) do not report the correlation statistic for their sample and we lack
the data to compute it.

41
11 The methodology for estimating marginal qs was first presented by Mueller and Reardon
(1993). Recent applications include Mueller and Yurtoglu (2000), Gugler and Yurtoglu
(2003b), Gugler, Mueller and Yurtoglu (2003a, 2003b, 2004).
12 The assumption of diminishing marginal returns on investment implies that our measure of
marginal q, namely the returns on total investment divided by the cost of capital, should
exceed 1.0.
13We also experimented with including a quadratic term in IS in the equation, but its
coefficient was generally insignificant and its inclusion sometimes made the coefficient on
the linear term insignificant, suggesting multicollinearity. As will be seen, a linear term in IS
is almost always significant, and so we report only it.
14 For a discussion of the asymmetric information problem and investment, see Myers and
Majluf (1984). Oliner and Rudebusch (1992) use size to identify firms subject to asymmetric
information problems.
15 Bronwyn Hall (1993) has found a positive relationship between R&D and the market value
of firms in some time periods.
16 A negative relationship between insider ownership and leverage has been reported by
Friend and Lang (1988), Jensen, Solberg and Zorn (1992), Bathala, Moon and Rao (1994),
and Firth (1995). A positive relationship has been reported by Kim and Sorenson (1986),
Agrawal and Mandelker (1987), Amihud, Lev and Travlos (1990), Agrawal and Knoeber
(1996), Berger, Ofek, and Yermack (1997), and Short, Keasey and Duxbury (2002).
17 The definitions of these variables are detailed in the appendix.
18 MSV figures are based on 371 Fortune 500 firms. If we restrict our sample to the largest
500 firms in terms of average size over the sample period, the mean and median values of IS
are 11.39% and 4.40%, respectively.
19 MSV estimated a piece-wise linear regression rather than a cubic equation, but the pattern
of signs on the three linear terms in their model corresponds to those in ours.
20 Eq. 1 expresses a firm’s performance as a function of insider ownership and the other
variables that are assumed to affect performance. Our measure of investment performance,
qm, is estimated using the following equation:
(Mt - Mt-1)/Mt-1 = - δ + qm It/Mt-1 + µt /Mt-1
42
Substituting from eq. (1) into this equation yields a series of interaction terms between a
firm’s investment in period t and the relevant explanatory variable from eq. (1). The reported
coefficients in Table 2 are for these interaction terms.
21 See Gugler, Mueller and Yurtoglu (2003b, 2004).
22 See, Mueller and Yurtoglu (2000), and Gugler, Mueller and Yurtoglu (2004).
23 For variants on this argument see, Berglöf and Perotti (1994) and Osano (1996).
24 Some data, although not a lot, are available for Latin American countries that LLSV
categorize as having civil law legal systems. The differences between Europe and Latin
America in level of development, corruption and the like seem sufficiently great, however,
that we have decided to confine our civil law sample to the European countries. For some
evidence on the importance of stage of development for performance, see Gugler, Mueller
and Yurtoglu (2003b).
25 Since we predict a negative coefficient on IS, the t value of 1.74 implies significance at the
5 percent level using a one-tail test.
26 The exception to this statement is in eq. 3 of Table 7, where we have a very small sample.
27 When all else fails, researchers often resort to lagged values of a variable as its instruments.
This strategy does not seem appropriate in this case, however. The fraction of shares held by
insiders varies quite slowly over time. Once the effect of last year’s insider-ownership
holdings on this year’s holdings has been removed, there is not much left to do any
explaining. For a somewhat related argument, see Zhou (2001).