the effects of open educational resource adoption on ... · pdf filethe effects of open...
TRANSCRIPT

The Effects of Open Educational Resource Adoption on
Measures of Post-Secondary Student Success
Thomas Jared Robinson
A dissertation submitted to the faculty of Brigham Young University
in partial fulfillment of the requirements for the degree of
Doctor of Philosophy
Lane Fischer, Chair David A. Wiley
Richard R Sudweeks John Hilton III Joseph Olsen
Educational Inquiry, Measurement, and Evaluation
Brigham Young University
May 2015
This work by Thomas Jared Robinson is licensed under a Creative Commons Attribution 4.0 International License
All rights reserved
INFORMATION TO ALL USERSThe quality of this reproduction is dependent upon the quality of the copy submitted.
In the unlikely event that the author did not send a complete manuscriptand there are missing pages, these will be noted. Also, if material had to be removed,
a note will indicate the deletion.
Microform Edition © ProQuest LLC.All rights reserved. This work is protected against
unauthorized copying under Title 17, United States Code
ProQuest LLC.789 East Eisenhower Parkway
P.O. Box 1346Ann Arbor, MI 48106 - 1346
UMI 3714922
Published by ProQuest LLC (2015). Copyright in the Dissertation held by the Author.
UMI Number: 3714922

ABSTRACT
The Effects of Open Educational Resource Adoption on
Measures of Post-Secondary Student Success
Thomas Jared Robinson Department of Educational Inquiry, Measurement, and Evaluation, BYU
Doctor of Philosophy
The purpose of this study was to ascertain whether the adoption of Open Educational Resources had a significant effect on student learning outcomes in seven courses taught at seven post-secondary institutions. The use of open educational resources (OER) is increasing in the United States. Initiatives focusing on expanding the use of OER as a replacement for traditional textbooks at the post-secondary level include OpenStax, Project Kaleidoscope, Open Course Library, and others. While researchers have begun to explore OER, few have sought to evaluate the quality of OER as a function of student academic success. In this dissertation, I examined measures of student success in seven courses at seven different early-adopters of Project Kaleidoscope where faculty members chose to adopt OER to replace traditional textbooks. The sample for this study consisted of students using open textbooks in courses at seven Project Kaleidoscope post-secondary institutions, as well as a control group of students at those same institutions who used traditional textbooks in sections of the same courses. I used an ex-post-facto quasi-experimental design, in which I compared students using OER to students using traditional textbooks in comparable courses. In order to control for the threat of selection bias, I used propensity score matching (PSM) to match treatment and control groups on a set of demographic variables. After creating matched treatment and control groups, I used multiple regression and logistic regression to examine whether textbook selection predicts a measurable difference in student achievement after accounting for relevant covariates. I found that students using open textbooks earned, on average, lower grades than students who used traditional textbooks, after controlling for student-level and course-level covariates. Further analysis revealed that this negative differential was isolated to students in business and psychology classes. I also found that students who used open textbooks enrolled in more credits than students using traditional textbooks, controlling for relevant covariates. Because of the finding of a variation in textbook effect from course to course, future studies may seek to understand the effects of particular OER adoption instances rather than the global effect of OER adoption. Keywords: open educational resources, open textbooks, post-secondary education

ACKNOWLEDGMENTS
I would like to thank the members of my dissertation committee who mentored me
throughout my doctoral program and dissertation process. Dr. Sudweeks and Dr. Olsen are
mentors and examples of thoughtful research design and rigorous statistical analysis. Dr. Wiley,
Dr. Hilton, and Dr. Fischer provided life-changing opportunities for me by recruiting me to open
educational resources research and allowing me to participate in the Open Education Group as a
true peer. They encouraged and empowered me in triumph and discouragement.
Thanks to my family for supporting my academic aspirations. My wife, Kristy, in
particular, has been my best friend, my confidante, and most steadfast supporter. My children
Thomas, Kimball, Amelia, and Calvin have reminded me time and time again to enjoy and
celebrate life in all its many stages.
The entire process of writing this dissertation was steeped in the memory of a student I
had the privilege to teach at Arapahoe High School in the winter of 2011. Claire Davis was taken
from us too soon, and we miss her terribly.

iv
TABLE OF CONTENTS
ABSTRACT.…………………………………………………………………………………..….ii
ACKNOWLEDGEMENTS………………………………………………………………………iii
TABLE OF CONTENTS………………………………………………………………………....iv
LIST OF TABLES……………………………………………………………………………….vii
LIST OF FIGURES………………………………………………………………………………ix
Chapter 1: Introduction ................................................................................................................... 1
OER Defined ............................................................................................................................... 1
OER Adoption ............................................................................................................................ 2
Theoretical/practical reasons to adopt. ................................................................................... 3
Empirical justification. ............................................................................................................ 4
Research Purposes and Questions ............................................................................................... 4
Chapter 2: Review of Literature ..................................................................................................... 7
Results ......................................................................................................................................... 7
Frameworks for OER evaluation. ........................................................................................... 7
Empirical studies of OER quality and effectiveness............................................................. 10
The State of Textbook Research ............................................................................................... 13
Non-experimental case studies. ............................................................................................ 14
Quasi-experimental designs. ................................................................................................. 17
Experimental designs. ........................................................................................................... 23
v
Discussion ................................................................................................................................. 25
Conclusion ................................................................................................................................ 27
Chapter 3: Method ........................................................................................................................ 29
Design ....................................................................................................................................... 29
Participants ................................................................................................................................ 30
Measures ................................................................................................................................... 31
Procedures ............................................................................................................................... 333
Data imputation. .................................................................................................................... 33
Propensity score matching. ................................................................................................... 34
Ordinary least squares regression. ........................................................................................ 37
Logistic regression. ............................................................................................................... 38
Chapter 4: Results ......................................................................................................................... 39
Data Description ....................................................................................................................... 39
Research Questions ................................................................................................................... 41
Question 1. ............................................................................................................................ 41
Question 2. ............................................................................................................................ 46
Question 3. ............................................................................................................................ 55
Chapter 5: Conclusions ................................................................................................................. 58
Reflections on Findings ............................................................................................................ 58
Limitations ................................................................................................................................ 62

vi
Conclusions and Implications for Future Research .................................................................. 65
References ..................................................................................................................................... 69

vii
LIST OF TABLES
Table 1: Courses Included in Final Subsample with Counts ........................................................ 30
Table 2: Participant Characteristic and Demographic Data .......................................................... 31
Table 3: Variables in the PK Dataset ............................................................................................ 32
Table 4: Simultaneous Regression of Omnibus Course Grades ................................................... 43
Table 5: Simultaneous Regression Results of Grades Disaggregated by Course for Business and
Psychology ........................................................................................................................ 45
Table 6: Simultaneous Regression of Grades Disaggregated by Course for Algebra, Biology,
Geography, Reading, and Writing .................................................................................... 46
Table 7: Logistic Regression Results of C-minus and Completion .............................................. 48
Table 8: Logistic Regression Results of C-minus and Completion Disaggregated by Course for
Business ............................................................................................................................ 49
Table 9: Logistic Regression Results of C-minus and Completion Disaggregated by Course for
Psychology ........................................................................................................................ 50
Table 10: Logistic Regression Results of C-minus and Completion Disaggregated by Course for
Algebra .............................................................................................................................. 51
Table 11: Logistic Regression Results of C-minus and Completion Disaggregated by Course for
Geography ......................................................................................................................... 52
Table 12: Logistic Regression Results of C-minus and Completion Disaggregated by Course for
Reading ............................................................................................................................. 53
Table 13: Logistic Regression Results of C-minus and Completion Disaggregated by Course for
Writing .............................................................................................................................. 54

viii
Table 14: Logistic Regression Results of C-minus and Completion Disaggregated by Course for
Biology .............................................................................................................................. 55
Table 15: Simultaneous Regression of Omnibus Enrollment Intensity ........................................ 56
ix
LIST OF FIGURES
Figure 1: Propensity score distributions for the matched and unmatched grades subsamples. .... 36

1
Chapter 1: Introduction
According to the Federal Communications Commission, the U.S. spends more than seven
billion dollars every year on textbooks for K-12 public schools (Usdan & Gottheimer, 2012). For
college students, textbook costs rose at double the rate of inflation from 1986 – 2004 (U.S.
Government Accountability Office, 2005). For most people educated in the U.S. or other places
around the world, it is difficult to imagine the school experience without textbooks or the cost
that comes with them.
One recent and growing trend in K-12 and higher education is the adoption of open
educational resources (OER) by teachers and by institutions in an effort to replace traditional
publisher-produced textbooks. Open Educational Resources are perhaps best known by high-
profile examples such as the Massachusetts Institute of Technology OpenCourseWare project,
which makes materials from over 2,000 courses freely available to the public. Other for-profit
companies like Coursera and Udacity have popularized massive open online courses (MOOCs),
which freely offer full courses, complete with accreditations to users. But, OER adoption has
also blossomed at the institution level, both in secondary and higher education in the U.S., as an
alternative to relatively expensive publisher-produced textbooks.
OER Defined
Open educational resources have been broadly defined as “resources that reside in the
public domain or have been released under an intellectual property license that permits their free
use or re-purposing by others” (D’Antoni, 2009, p. 4). Creative Commons intellectual property
licenses allow users to specify the degree to which resources are open to other users. Wiley
(2009) discussed OER in terms of four R’s of open education, including the right to reuse,
redistribute, revise, and remix materials for educational purposes. Hilton, Wiley, Stein, and

2
Johnson (2010) further clarified that “a baseline definition of ‘open’ requires that the owner or
copyright holder allow others to freely reuse and redistribute the work. Allowing others to remix
and revise the work further enhances openness, and provides opportunities for new, derivative
OER to be created” (p. 40).
OER Adoption
The number of institutions and teachers adopting OER to replace traditional textbook
materials for students appears to be increasing. For example, in 2009, the Open High School of
Utah (now Mountain Heights Academy) became the first high school in the U.S. to adopt
exclusively OER curricular materials for students. From 2010-2012, science teachers in a Utah
school district piloted the adoption of open science textbooks in biology, chemistry, and earth
systems courses, with thousands of students using open replacements for traditional science
textbooks. The state of Utah is currently in the process of taking the pilot statewide with the Utah
Open Textbook Project.
This K-12 momentum now extends to the two states with the largest populations of
students, California and Texas. These two states notably represent the largest coalitions of 20
textbook adoption states, which for some or all levels of K-12 education, mandate state level
approval for the adoption of any textbook. But, both California and Texas have recently adopted
legislative or policy initiatives facilitating and encouraging the adoption of OER in secondary
education.
OER adoption extends beyond the K-12 sphere, however. In Washington, the State Board
of Community and Technical Colleges (SBCTC), in conjunction with the Bill and Melinda Gates
Foundation, introduced the Open Course Library (OCL) to produce open materials for 81 of the
highest enrollment courses. Forty-two of these courses are currently completed, and faculty

3
members from the SBCTC have been encouraged to use the materials from OCL to replace
traditional textbooks. One Virginia community college recently committed to providing a
textbook-cost-free business associates degree to students in an initiative known as Textbook
Zero.
Twenty state and community colleges across the nation have worked together in a
consortium called Project Kaleidoscope to adopt OER materials in eight high-enrollment
courses. Instructors who have volunteered to be a part of Project Kaleidoscope committed to
providing cost-free OER to replace traditional publisher textbooks in the courses.
Theoretical/practical reasons to adopt. A number of reasons exist for the increased
adoption of OER both in secondary and higher education. Perhaps foremost, OER promises vast
educational cost reductions for states, institutions, and students. In most school districts, millions
of dollars are spent every year on curricular materials. OER offers the opportunity to slash and
eliminate this expenditure, freeing districts and states to invest in other potentially more effective
educational interventions. For colleges, the cost of curricular materials is traditionally passed on
to students. Some estimate that textbooks cost one fourth as much as tuition at public four-year
institutions (Wiley, Green, & Soares, 2012).
OER also promises more democratic, open access to education for all people. By
removing barriers such as copyright access and prohibitive costs, OER makes knowledge more
freely available. This is particularly important to learners who come from socioeconomically
disadvantaged backgrounds or to school districts with limited curricular funds stemming from
lower property tax revenue.
OER may also provide opportunities for more authentic participation in communities of
practice (Lave & Wenger, 1991). The rights to revise and remix materials provide multiple

4
stakeholders with the ability to participate in the creation and dissemination of learning
materials. Students may act in an apprentice role in the creation and modification of texts
pertinent to a particular community of practice. Teachers can also model authentic participation
in a broad community of practice through their manipulation, creation, and navigation of
disciplinary texts.
Empirical justification. While theoretical or pragmatic reasons to adopt might be
persuasive to educational stakeholders, today’s accountability-focused educational climate
demands attention to the utility of OER, specifically as it relates to student learning outcomes.
Do OER work to help students learn? How good are the OER we have? And what types of
research have been done to examine the empirical effects of OER in the classroom?
Understanding the effects of textbooks on learning is important in a political climate that
highly values measurable student learning outcomes as a standard for what counts as quality.
Understanding the state of the research on outcomes associated with open textbooks will also
provide a much needed base of knowledge for a field where philanthropy, state policy, and
federal law are currently being driven primarily by theoretical and financial justifications.
Research Purposes and Questions
The purpose of this research study was to examine whether the adoption of OER has a
significant impact on student success and progress for post-secondary students in community and
state colleges who were participants in the pilot year of Project Kaleidoscope.
There are many reasons to hypothesize that teacher adoption of OER will impact student
performance. On the positive side, because OER are freely available, teacher adoption of OER
results in a situation where all students have immediate and ongoing access to all course
materials from the first day of class. Contrast this with the typical situation in which teachers

5
adopt expensive traditional college textbooks; many students forego this purchase for economic
reasons and consequently do not have the access to course content necessary to succeed
(Buczynski, 2007). Thus, adoption of OER might lead to improved student outcomes,
particularly for low-income students who would be more likely to skip required textbook
purchases.
Second, the permissive licensing of OER allows faculty members to customize and adapt
their materials, providing an experience more closely tailored to the needs of their students. Such
adaptations might also lead to improved student outcomes. However, we might also hypothesize
that permissive licensing has nothing to do with student learning, and that free or very
inexpensive content, even though fully copyrighted, might produce the same levels of learning as
full-fledged OER.
Finally, on the negative side are industry arguments that “you get what you pay for,”
suggesting that the use of open educational resources will lead to a decline in learning, and that
students would be best served by more expensive, publisher-produced textbooks.
This study will focus on students taking seven courses from seven early adopting post-
secondary institutions associated with Project Kaleidoscope (PK). Some of these students used
OER replacements for textbooks, while others did not. For these students, I propose to examine
the following questions:
What is the relationship between OER-adoption by teachers of post-secondary courses
and their students’:
1. final course grade?
2. rates of course success (i.e., completing a course with a C- or better grade)?

6
3. enrollment intensity (i.e., the number of credit hours they take during the
semester they are taking the OER course)?
Understanding the answers to these questions will provide much needed empirical
evidence to a field where philanthropy, state policy, and federal law are currently being driven
primarily by unsubstantiated claims and hype. It is critical that we answer these questions so as
to support effective long-term investments, policies, and laws and avoid making long-term
commitments in areas demonstrated to be ineffective in supporting student success.
7
Chapter 2: Review of Literature
This systematic review of literature aims to answer three guiding questions:
1. What evidence exists that the adoption of Open Educational Resources (OER)
textbooks in secondary and higher education leads to comparable student
educational outcomes as traditional curricular materials?
2. How does literature pertaining to evaluating OER compare to the literature
evaluating textbook quality and adoption in general? and
3. What does a systematic review of these two literature domains suggest about
future directions for OER research?
Results
The research into OER is still in a very early stage. As such, there are relatively few
studies of the actual effectiveness of OER as textbook replacement in educational settings. The
work that has been done can be categorized into frameworks for OER evaluation and empirical
studies of OER quality and effectiveness.
Frameworks for OER evaluation. Two separate frameworks were developed through
research during the Open, Transferable, Technology-enabled Educational Resources (OTTER)
project at University of Leicester, UK. Nikoi, Rowlett, Armellini, and Witthaus (2011) proposed
the CORRE (content, openness, reuse, repurpose, and evidence) framework for the purpose of
evaluating OER materials or materials that could potentially be adopted into OER. The article
suggests that switching from traditional materials to OER can be daunting and provides a
workflow framework aiming to help teachers evaluate OER and create new, high-quality OER.
While the content and openness portions of CORRE specifically refer to the process of
transforming materials into legally-licensed OER, the reuse/repurpose and evidence elements of

8
the framework present the authors’ thinking on ways institutions can be involved in evaluating
the quality and effectiveness of OER materials.
Specifically, Nikoi et al. (2011) referred to an internal reality check as the suggested
evaluation mechanism for adopted OER. This reality check involved brief questionnaires geared
at various stakeholders, including the team that developed the OER, academic staff at the
institution, students using the OER, and external stakeholders. The questions are structured as a
series of yes/no questions, with four to six questions addressed to each stakeholder. Questions
like “Is the learning goal clear?” and “Is the structure and layout clear for navigation?” (Nikoi et
al., 2011, p. 207) are indicative of the overall types of questions. In the evidence category of the
framework, the authors recommended using web analytics, optional questionnaires for users, and
descriptive data to examine how the OER is being used and reused.
From the same OTTER Project, Nikoi and Armellini (2012) also developed and proposed
the “OER mix framework” which examines adopters’ purpose, process, product, and policy (the
4 Ps). The framework deals with the creation of OER, and what variables influence the OER
product that is then shared with others. The authors suggested that different permutations of
stances in regards to the four Ps can reflect fundamentally different stakeholder values and
produce products with different strengths and weaknesses, and should, therefore, influence how
OER is evaluated.
Clements and Pawlowski (2012) focused on teachers’ perspective of the quality of OER.
The study is significant in at least two ways pertaining to the objectives of this review. First,
Clements and Pawlowski identified a perception of lack of quality as one of the key concerns in
regards to OER and one of the major barriers for broader adoption. The authors draw from

9
quality literature in other fields to contend that quality directly relates to perceptions and that
there are different approaches to ascertaining the quality of OER.
The second pertinent contribution by Clements and Pawlowski was the creation and
administration of a teacher survey aimed at measuring what teachers perceive as key to OER
quality. Results from their survey indicated that most teachers desire for OER to employ quality
multimedia, be accurate in terms of content, meet pre-established curricular guidelines, work
well with their learning management system (LMS), and come from a reputable source. While
this study did not ask teachers to evaluate materials, the authors indicated that many teachers
surveyed would be willing to serve on review boards for materials.
Abeywardena, Raviraja, and Tham (2012) problematized peer review of OER, however.
They suggested that peer review is infeasible when resources are proliferated as quickly as OER
and can be legally revised or remixed by any user. Accordingly, in their study the authors
explored automated measures of OER quality, giving Google Scholar citation statistics as a
possible model. They suggest a desirability index, or D-index, which multiplies measures of
openness, access, and relevance, and divides the resulting product by 256. Openness was
measured on a four-point scale based on the freedom to adopt the 4 Rs of openness. Access was
measured on a sixteen-point scale (see Hilton et al., 2010). Relevance was measured by search
result ranks. The study then applied the D-index to OER from three OER repositories. They
concluded that using the D-index would improve OER selection for the academic community.
In addition to providing a new framework for evaluating OER, the Abeywardena,
Raviraja, and Tham (2012) study highlighted the need to compare specific OER to other
curricular resources in order to make some attempt to verify that students are getting the better of
available materials. This line of thinking differentiates the paper from the other discussed
10
frameworks. Clements and Pawlowski (2012) examined quality from the perspective of teachers,
highlighting what issues teachers found key for quality OER, but not providing a way to compare
resources or even measure the quality of resources. Similarly, neither the Nikoi and Armellini
(2012) OER mix framework nor the Nikoi et al. (2011) CORRE framework offers means or even
justification for comparing curricular resources. In these frameworks, openness is itself the
measure of a resource’s desirability—that resources should be preferred as a function of their
openness, with little regard to their broader quality compared to non-OER resources, such as
textbooks.
This approach in isolation has a number of possible limitations. Some of these include
that research following these frameworks may be likely to rely on theory over empirical, results-
based evaluation. This leads to multiple difficulties, including a lack of defensible generalization
from one study to other cases, and the likelihood of generating literature appealing only to those
already converted to OER as an a priori desirable alternative to publisher-produced materials.
Additionally, in the absence of complimentary empirical research, it is reasonable to question
whether OER materials can produce learning as effectively as traditionally produced materials.
Empirical studies of OER quality and effectiveness. There has been some limited work
done comparing OER replacements for textbooks to the non-OER materials they replaced. For
example, Bliss, Hilton, Wiley, and Thanos (2013) examined teacher and student perceptions of
the quality of open textbooks used in the classroom compared to perceptions of the quality of
traditional textbooks. They surveyed 125 students and 11 faculty members who were involved in
a pilot of OER as textbook replacement in eight separate courses at seven U.S. colleges. Students
in the survey were asked to rate the quality of textbooks in the class compared to traditional
textbooks. Three percent felt that the open textbooks were of significantly lower quality than

11
traditional textbooks, with 67% responded that the quality was about the same, and 41%
reporting that the open textbooks were significantly better than traditional textbooks. In open
responses, students reported ease of understanding, organizational features, the online nature of
the books, and visual appeal of the books were all reasons to prefer the open textbooks. Among
faculty adopters, 5 out of the 11 faculty members were actively involved in creating the texts.
The six faculty members who did not create the texts were asked to compare the quality of the
open textbook to traditional textbook. All six responded that the quality was about the same.
While this result seems to suggest that quality may not suffer with the adoption of OER to
replace textbooks, the results are specific to adoptions of seven specific open textbooks in seven
courses, and are therefore delimited.
Petrides and Jimes (2008) conducted survey research and case study analysis on the use
of the South African Free High School Science Texts. While the study did not form broad
conclusions about the quality of OER compared to the textbooks they replaced, they did suggest
that comparing the resources being developed to prior curriculum was an important factor in
increasing textbook quality.
Hilton and Laman (2012) compared student performance of 690 students using an open
textbook in an introductory psychology class, and compared their performance to 370 students
who previously had used a traditional textbook. The researchers concluded that students who
used the open textbook achieved better grades in the course, had a lower withdrawal rate, and
scored better on the final examination. The researchers acknowledged the ex-post facto design
elements of the study; the research was presented as a case study, and suggestions were made for
more rigorous causal research in the future.

12
Another limitation of this study was the lack of design elements or statistical analysis.
The analysis of the results did not make use of hypothesis testing logic or statistical tests, and
authors did not analyze the probability that the observed variation between groups was merely an
artifact of sampling error. Furthermore, only a subset of the data from the 690 students in the
treatment group was analyzed without a clear rationale being presented for some students’
exclusion. Finally, the final exams for the two semesters were substantively different, though
drawn from the same test bank. The selection committee subjectively evaluated the questions to
try to create tests with equal difficulty, but no psychometric comparison was done to validate the
assumption of equal difficulty of tests. Consequentially, the results of the Hilton and Laman
(2012) study should not be used to conclude that open textbooks can be equally effective at
promoting student outcomes.
This research does, however, suggest a fundamentally distinct way to think about
evaluating textbook quality. By treating student learning outcomes as a dependent variable,
researchers can design experiments and quasi-experiments to attempt to quantify differences in
textbooks, not in terms of perceptions of quality, but in terms of student learning outcomes.
Robinson, Fischer, Wiley, and Hilton (2014) conducted perhaps the most systematic
study into the effect of open textbooks on student learning outcomes. They employed a quasi-
experimental design with 4,183 secondary science students in a Utah school district. The
researchers compared the state science criterion-referenced test scores for students who used
open textbooks and those who used traditional textbooks. In order to facilitate causal inference in
the absence of randomly assigned groups, the researchers used propensity score matching to
approximate random assignment. They then used an ordinary least squares regression approach

13
to control for possible confounding variables such as prior student achievement, student socio-
economic status, and teacher quality.
Robinson et al. found that students who used open textbooks showed significant gains on
the state exams compared to students using traditional textbooks. Further analyses revealed that
these gains were localized in high school chemistry classes, while other courses showed no
significant difference for students with open textbooks versus their peers using traditional
textbooks. While the study’s quasi-experimental design, propensity score matching, and
covariate selection all helped to facilitate more valid causal inference, the study did not provide a
mechanism to further examine exactly what aspects of open textbook adoption affected student
learning.
The State of Textbook Research
While there are a greater number of studies that examine the empirical effects of
textbooks on student learning than OER per se, the overall number of studies is somewhat
smaller than one might expect, given the long history of the use of textbooks in school contexts.
Furthermore, the quality of the research is less refined than might be assumed. One literature
review looking at research connected to textbooks in the developing world highlighted that
textbooks significantly improve learning when compared with no textbooks, especially in
developing nations (Heyneman, Farrell, & Sepulveda-Stuardo, 1981). Zucker, Moody, and
McKenna (2009) conducted a systematic review of the use of e-books for early literacy
instruction. This review of literature suggested that e-books have a small positive effect on
literacy instruction for young learners. Slavin and Lake (2008) reviewed studies on different
approaches to the teaching of mathematics to elementary students. They found that elementary
mathematics curriculum or textbooks could have a small to moderate effect on student learning

14
outcomes. The reviewed studies had an effect size range of -0.25 to 0.26 with a median of 0.10.
None of these reviews, however, can be easily applied to OER research, as nearly all of OER
implementation and research happens at the secondary and higher education level, where
students have already developed the ability to read.
The remainder of this review organizes studies connected to textbook effects based on
methodology, to facilitate discussion about the strengths and weaknesses of the individual
studies. These studies are divided into non-experimental case studies, quasi-experiments, and
true experiments.
Non-experimental case studies. Berry, Cook, Hill, and Stevens (2010) conducted a
study that differs from others in that it does not examine the effects of textbook adoption or
individual textbook features. Instead, the study examines the extent that students use college
finance textbooks, not differentiating results based on what type of textbook was presented.
Because this study asked a different type of question, not aimed at inferring causality, no
treatment and control group were used. Instead, the research used a survey of 267 students
enrolled in finance classes in three universities. Results showed that roughly 18% of students do
not read the textbook, 43% read less than one hour per week, 31% read between one and three
hours per week, and only 8% read more than three hours per week. This was compared to
responses that indicated 70% of students believed their professors expected them to read more
than one hour per week.
This study is somewhat limited in its scope, only looking at responses for one course type
in one discipline. However, it highlights a key issue in textbook evaluation. Even significant
differences in textbook quality are likely to be mitigated by student use rates. Given low rates of

15
student use of textbooks, there may be theoretical reasons to minimize the projected overall role
that textbooks play in college learning outcomes.
Another non-experimental case study also raises important issues related to textbook
evaluation. Gurung (2003) conducted a study in which he examined student use of textbook
pedagogical aids and attempted to correlate the use of pedagogical aids with student learning
outcomes. Significantly, this approach uses the same logic seen in Hilton and Laman (2012),
namely that quality and usefulness of textbooks or textbook features should be examined in light
of student outcomes. In the study, students in an introductory psychology course were surveyed
to determine which textual study aids associated with their textbook they found to be helpful to
their learning. Those responses were then compared to student exam performance. Results
showed that student reports of use and helpfulness of different pedagogical aids did not correlate
with student test scores. While these results should be considered cautiously, as the author did
not control for student ability or effort, they are still noteworthy. If, as the results suggest, student
perception of textbooks’ pedagogical value does not correlate with actual student learning,
research into student perceptions of textbook quality may not provide results that translate into
actual improvements in student achievement. This conclusion is somewhat supported by research
by Porter, Rumann, and Pontius (2011), which finds that students consistently misreport answers
even to seemingly simple questions, such as how many books were required for a course.
In another study, Luik and Mikk (2008) examined the correlation of different online
textbook features with student learning outcomes in four separate Estonian schools. Fifty-four
students each read 35 distinct online textbook units, which had been classified as having one or
more of 131 different textbook characteristics. Students were grouped into high- and low-ability
learners according to their previous performance. Students took a pretest prior to every unit, and

16
a subsequent posttest, and gain scores were used to measure student learning. Results were then
correlated for the high-ability and low-ability groups with the different text classifications for
each unit. Researchers used the resulting positive and negative correlations to determine text
features that were more or less effective. This correlational case-study design presents an
interesting model for examining the pedagogical effectiveness of textual characteristics. As in
the case of Gurung (2003) and Hilton and Laman (2012), the study assumed that textbooks and
pedagogical features of texts derive their value from their utility in promoting student learning
outcomes. The study did not fully account for the confounding or interactive effect of multiple
text structures in each unit, nor did it address questions of long-term retention, but, it
systematically and rigorously examined the correlation of text features with learning. Luik and
Mikk also showed that different textbook features functioned differently for students of varying
ability levels. “The low-achieving students profited from clear instructions, familiar icons,
examples, and answering from the keyboard. The high-achieving students benefited from key-
combinations, menus with different levels, the Internet, analogies and lower density of terms in
the content of the material” (p. 1483).
These case studies reveal interesting, if divergent approaches to the evaluation of
textbook quality and the potential impact of textbooks on student learning. Both the Gurung
(2003) and Luik and Mikk (2008) studies acknowledge the importance of considering student
achievement as the primary indicator of textbook quality. Also, two of the studies highlighted
potential problems in textbook research. Berry et al. (2010) suggested that students do not
actually use their textbooks as often as researchers might expect, or as often as teachers ask them
to. This research suggests caution for researchers in assuming that textbooks have a significant
effect on student learning. Gurung (2003) also provided research with cautionary implications

17
for researchers by suggesting that student perceptions of their use of textbook features and the
helpfulness of these textbook features do not correlate with student performance. Consequently,
researchers should be cautious about using student perception data as the primary reference point
in the evaluation of textbooks.
While Gurung (2003), and Luik and Mikk (2008) provided correlational data on the
effectiveness of certain textbook features, the lack of a control group in either study limited the
strength of any causal claims; differences in student achievement could possibly be explained by
other factors, including student effort, or different cognitive load demands varying across
subjects. These threats to the internal validity of causal claims could be addressed by the
introduction of control groups in experimental or quasi-experimental designs.
Quasi-experimental designs. Other research dealing with textbook evaluation uses
quasi-experimental designs, characterized by the existence of treatment and control groups, but
lacking randomization present in experimental designs. These quasi-experimental designs may
intimate causal inquiry into the efficacy of textbooks in promoting student learning, provided
they use rigorous design and statistical analysis.
Dickson, Miller, and Devoley (2005) examined the effect of study guide completion on
student academic performance in an introductory psychology course. Two hundred thirty-six
students, distributed across two sections, participated in the study. In the treatment section, 113
students were required to complete the study guide that accompanied the textbook. In the control
section, the 123 participants were not required or encouraged to use the textbook. The same
instructor taught both sections, and student performance was measured using four multiple-
choice examinations.
18
Researchers used ANCOVA to examine differences in group means controlling for
student high school GPA as a covariate. The study found that students who were required to use
the textbook study guide scored significantly higher on the four examinations than students who
were not required to use the textbook study guide, F(1,232) = 4.19, 𝑝𝑝 = .04, 𝜂𝜂2 = .02. The
researchers thus concluded that the textbook’s study guide was an effective way to improve
student performance. However, the results were confounded. Students could read or not read the
textbook in either group. It is unclear whether differences were due to the study guide or not
even reading the textbook.
This study showed some strength in its evaluation of a textbook feature. The design
notably included a treatment and control group taught by the same instructor, which accounted
for potentially important variation in student performance that could result from different
teachers teaching the different sections. Additionally, researchers surveyed students to examine
how student perceptions of the study guides aligned and explained the results of the study.
Finally, the study’s use of high school GPA as a covariate indicates the researchers’
acknowledgement that students likely varied in personal traits across group; researchers used
GPA to attempt to control for this variation.
Several flaws hamper the internal validity of these conclusions, however. Even though
the researchers label their study as an experiment, the study lacks random assignment, which is
the defining characteristic of experiments. In reality, this is a quasi-experiment with non-
equivalent groups and posttest measures. This design is generally considered weak for causal
inference, in part due to likely systematic differences across groups (Shadish, Cook, &
Campbell, 2002). The researchers tried to control for this by including high school GPA as a
covariate, but GPA is notoriously unstable across teachers, schools, subjects, and geographical
19
locations (Bacon & Bean, 2006). Also, researchers relied on student self-reports of high school
GPA, which may introduce distortion. Additionally, the researchers failed to include reliability
information on the test scores recorded, which allows speculation that measurement error could
be a cause of variation in scores, leading to deflated Standard Errors of Measurement and
distorted p values. When combined with the extremely low effect size of .02 and the
confounding of treatment condition, these flaws combine to undermine the findings of the study.
Guthrie (2011) examined whether Christian-published science textbooks served students
as well as traditionally published textbooks. The study focused on a subset of textbooks that
could hypothetically be poorer in quality than traditional textbooks, but are adopted because of
ideological reasons. This seems to mirror the adoption of open textbooks, which in many
instances are seen as less polished and refined than their traditional counterparts, but possess
ideological traits that lead certain faculty to adopt them in place of publisher-produced materials.
Guthrie used scores from the ACT college entrance exam as the outcome variable for the
study. Specifically, the study examined whether “Christian-published textbooks are effective at
preparing students for the ACT science reasoning subtest” (p. 57). The research drew a sample of
students from Christian high schools across the Midwest that met certain inclusion criteria. ACT
science subtest scores were then compared to national science subtest averages. Guthrie used a t-
test and found no significant difference between performance in national averages and students
using Christian-published textbooks.
The strengths of this study include the large sample size and the standardized outcome
variable of the ACT test, which is rigorously psychometrically evaluated and scaled. The study
also conscientiously chose only students who were exposed to Christian published textbooks.
20
However, this study also has major weaknesses that threaten the internal and external
validity of its causal claims. First, the students in the treatment group have scores which are also
included in the national average, partially confounding results. Additionally, the study assumes
that all students in the national average use traditional publisher-produced textbooks. This
assumption is problematic because, as noted above, some students in the national average used
non-traditional Christian books. Others likely used more constructivist approaches to curriculum,
or perhaps no textbook. Open Educational Resources also provide alternatives to publisher-
produced textbooks. Importantly, this study suffers from non-equivalent groups. Students
attending Christian private schools are likely to be systematically different than the average
American student in terms of family culture, family income, and other key covariates likely to
influence academic outcomes. These other variables confound the findings of the study and
seriously threaten its validity.
Phillips and Mehrens (1988) conducted another study geared at examining the differences
in student performance on standardized exams across different curricular offerings. They
examined differences in standardized scores for students using two separate sets of reading and
math curricula in elementary schools. The study design was strong in two ways. First, the
researchers created matched groups across textbook condition, matching at the school level
based on overall school performance on standardized tests. Second, they incorporated both
pretest and posttest scores to control for differences in prior knowledge.
The researchers used MANCOVA and factor analysis to test for differences in both
overall student performance as well as patterns of factor loadings of student performance. The
results show that adherence to one curriculum or the other was not a significant predictor of

21
standardized test achievement. Researchers suggested that teachers may not need to worry about
which curriculum they choose, as curriculum is not likely to influence student achievement.
While this study shows sophistication in both design and analysis that helped intimate
causal conclusions, it still is vulnerable to threats to the validity of the conclusions. For example,
the study did not control for factors that may have contributed to student achievement, such as
potential systematic differences in teacher efficacy that might mask textbook effects.
Additionally, using schools as the unit of analysis greatly reduced the statistical power of the
study, limiting the degree of precision of the results. Finally, the results may not be
generalizable, as the quality of different textbooks and curricula may diverge to a much greater
degree than did the two curricula in the study. In this case, one might expect results to vary
depending on the degree of quality divergence. Notwithstanding, this study represents a careful,
rigorous examination of textbook performance in the classroom.
In 2007, Chamberlin and Powers conducted a study with a similar aim; the study asked
whether there was a difference in preservice elementary teacher achievement based on the
adoption of three different preservice geometry curricula. The subjects were all in training to
become elementary teachers. The study consisted of a mixed methods design in that it also
collected qualitative data from students, comparing their perceptions of the helpfulness of the
curriculum to which each student was exposed. The quantitative portion of the study used
pretests and posttests to control for differences in student prior knowledge. The authors used
ANCOVA to look at group differences.
Chamberlin and Powers found that students performed significantly better on posttests
with one of the three curricula, controlling for student prior knowledge. The results from the
student surveys also indicated higher levels of student perceptions of quality for the highest-

22
performing text from the lowest-performing text, although that pattern of perception of high
quality was also present for the third textbook, with which student scores were not significantly
higher.
While this study is commendable in its use of multiple groups and pretest and posttest in
its design, there are still threats to validity that lead the authors to present their results as
tentative. Most notably, the selection of textbook across groups was perfectly confounded with
teacher. Four separate teachers taught one or two of six total sections of the course. Each teacher
used one and only one curriculum in his/her course. Thus, the study provided no way of
distinguishing between effects due to textbook and effects due to teacher. The study is notable,
however, in its combination of quantitative and qualitative data to form conclusions about
textbook quality and effectiveness. This approach seemed to provide a more well-rounded
depiction of textbook quality than studies relying solely quantitative or qualitative data.
Pyne (2007) studied the long-term effect of the selection of a textbook for
microeconomics students. His research differs from the studies previously discussed because it
examines student performance in future courses as a measure of textbook quality. The study
tracked 533 students who had taken microeconomics and examined, as dependent variables,
student performance in advanced economics courses, and money/banking courses. The study
found that choice of textbook had a significant effect on student performance in future courses.
One of the strengths of the study is the number of potentially confounding variables for which
the author attempted to control. For example, Pyne considered and controlled for the occurrences
of multiple attempts at individual courses by students and time elapsed between the introductory
and advanced course. He also reported using 16 dummy-coded variables to control for teacher
characteristics, but does not explain further how this was accomplished.

23
This study suggested that textbooks are an important factor in determining students’
retention of curricular materials and seems to offer an alternative perspective to that presented by
Phillips and Mehrens (1988). The study also highlighted the importance of careful consideration
of competing explanations and controlling for these explanations in design and analysis.
Experimental designs. Farragher and Yore (1997) examined the effect of two different
textbook features—embedded questions and regulating adjuncts—on science achievement, time-
on-task, and learning efficiency. The study used an experimental design with 125 ninth grade
science students randomly assigned to one of five groups. The groups included one control group
who simply read a passage, and four treatment groups who used different combinations of
reading, embedded questions, and other textbook features. The design also incorporated a pretest
and posttest, as well as a delayed posttest to look at retention. The tests used were reliable with a
Cronbach Alpha coefficient of .85.
The study found that the studied textbook features did not have the anticipated effect on
student science comprehension or achievement. The only statistically significant finding in the
study was that students with the more involved treatment textbook structures spent more time on
task than students who simply read, but that this time on task did not translate to higher scores on
either the posttest or the delayed posttest.
This study was an example of a rigorous approach to evaluating the efficacy of a small
set of textbook features. The researchers asked a focused question with a design that allowed for
the answering of the question. Here, the experimental design allowed researchers to derive
unbiased estimates of effects. Even though the results did not correspond to the hypothesis, the
researchers were able to shed light on the actual effects (or non-effects) of textbook features on
student learning.
24
This study indicates that textbook features that theoretically indicate better material may
not empirically affect student learning as hypothesized. The study highlights the need of rigorous
empirical research to examine claims of efficacy. This may have implications for those who wish
to study textbook selection and implementation, extending to the adoption of open textbooks.
In a similarly aimed study, McCrudden, Schraw, Hartley, and Kenneth (2004) used an
experimental design to examine the role of cognitive load associated with textbook content on
student learning. The researchers randomly assigned participants to one of eight conditions that
manipulated text presentation, text organization, and text context—all of which have been shown
to affect student cognitive load. They then used MANOVA to look at the effects of the
presentation of text on student factual learning, concept learning, and ease of comprehension.
The results showed that student recall was significantly better with lower-cognitive load
presentations of the text. Additionally, the research showed that students were able to accurately
perceive and report on the ease of comprehension.
Stratton (2011) conducted another interesting experimental study examining the effect of
mp3 textbooks on student learning. Stratton randomly assigned two of her four sections of
introductory psychology to receive access to mp3 recordings of the textbook in addition to their
hard copies of the textbook. She used a t-test to examine mastery of test bank questions across
treatment and control groups. Additionally, she conducted surveys of students to determine to
what extent students took advantage of the mp3 option and to learn about students general
feelings towards textbooks and learning.
Stratton found no significant difference in student mastery of test bank questions across
treatment and control books. She also found that students who had access to the mp3 version of
the textbook accessed it very infrequently, with the majority of students not accessing it at all.
25
This could account for the lack of significant differences across groups. But the study does
suggest that access to mp3 versions of textbooks does not improve student learning.
Discussion
My purpose for this review of literature was to determine the effectiveness of OER in
promoting positive student learning outcomes, and to identify concrete ways that future research
could improve upon existing research. I sought to specifically answer three guiding questions.
The first question was whether evidence exists that adoption of OER textbooks in higher
education leads to comparable student outcomes in comparison to traditional curricular materials.
There does not appear to be adequate evidence in the research literature to answer this question.
The Robinson et al. (2014) study suggests that open textbooks can make a difference in student
learning outcomes at the high school level, but did not examine textbook adoption at the post-
secondary level. The studies by Bliss, Hilton, Wiley, and Thanos (2013), Hilton and Laman
(2012), and Petrides and Jimes (2008) begin to lay groundwork for a more comprehensive look
at textbook quality, but there is a lack of systematic research that might illuminate any consistent
trends in student learning associated with OER as an alternative to traditional textbooks. More
specifically, the work of Bliss, Hilton, Wiley, and Thanos (2013) suggests that teachers and
students directly involved in OER-centered classrooms can provide valuable feedback as to their
perceptions of the quality of those materials. Hilton and Laman (2012) utilized an approach that
examined learning outcomes as a function of adoption of OER resources. While the methodology
and analysis techniques should be refined and developed in future studies, this line of outcomes-
based research provides hope of a systematic and scientific inquiry into the effects of OER
adoption on student learning. Examples of this kind of research were much more common in the
general textbook literature as addressed in the second guiding question.

26
The second question addressed how the OER literature compares to the academic
literature concerning learning as a function of all textbooks. As in the case of OER research,
there is limited research in the general textbook literature concerning student use and perception
of textbooks. Notably, findings in both areas provide important cautions for researchers looking
at empirical effects of textbooks on student learning. The Berry et al. (2010) finding that students
used college finance textbooks at lower-than-expected rates highlights a key problem with
textbook research; namely, observed differences in student learning may be a result of
implementation fidelity rather than textbook quality. The extent to which students fail to use a
textbook or curricular resource as prescribed by teachers could confound potential research
results. Also, the Gurung (2003) finding that student perceptions of textbook helpfulness actually
were negatively correlated with student learning should provide important caution to researchers
relying primarily on student perception data as a measure of textbook quality.
A main difference between the OER textbook research and the broader literature on
textbooks is the gap in number and sophistication of studies involving student outcomes tied to
textbook selection, or to specific textbook features. While emerging research in OER begins to
examine textbook quality in terms of student learning, research into general textbook quality
presents a much more nuanced picture of this line of research.
The final question asked what conclusions can be drawn concerning future directions for
OER research based on the review of literature. The various experimental and quasi-
experimental studies reviewed highlight some of the key difficulties in drawing causal
conclusions about the effect of textbook selection on student learning. As noted in the preceding
sections, the validity of causal claims can be threatened by systematic differences between
treatment and control groups (selection bias) and the lack of design or analysis controls for
27
competing explanations of student learning. OER researchers should diligently seek to
understand competing explanations for student achievement, such as teacher effect, and create
design or statistical controls for these confounding variables. Researchers interested in isolating a
learning effect due to the adoption of OER materials should also find ways to create matched
groups, perhaps using techniques like propensity score matching, or randomized assignment.
Carefully designed experimental studies may alleviate some threats to internal validity by
randomizing textbook assignment across students, teachers, and even institutions. The Farragher
and Yore (1997) and McCrudden et al. (2004) studies highlight that random assignment may be
more feasible in short term studies conducted across days or weeks, rather than over the course
of an entire semester or year.
Even though there appear to be more studies examining the impact of textbook selection
or textbook features on student learning, this literature is far from being richly developed. The
studies found here each dealt with isolated texts, and make no broad conclusions about the extent
to which textbooks might be expected to play a role in student learning. Perhaps not surprisingly,
some studies suggested that textbook selection is not a significant predictor of student learning
(see Farragher & Yore, 1997; Guthrie, 2011), others suggested that textbook selection did affect
student learning (see Chamberlin & Powers, 2007, McCrudden et al., 2004, Pyne, 2007). These
divergent results seem to indicate that textbook quality varies across discipline and textbook
selection, and highlight the difficulties involved in providing generalizable conclusions about
textbooks in general.
Conclusion
This review highlights gaps in open educational resource research that should be filled as
the OER community attempts to make inroads in replacing traditional textbooks with open

28
materials. While much of the current OER research focuses on frameworks for evaluating how
well curricular materials fit the OER model, or how stakeholders perceive the quality of open
curricular materials, very little work has been done to evaluate the effect of open versions of
textbooks on student learning. Researchers should prioritize inquiry into the effects of OER on
student learning; such research could help pave the way for broader OER adoption and could
provide an invaluable feedback mechanism for improving existing OER.
The open educational resources community should use systematic and rigorous studies of
empirical impacts of open textbook adoption to add rigor and respectability to the community’s
body of research. Future research should use experimental and quasi-experimental designs to
address the question of the effect of OER adoption on student learning. Studies should strive to
maximize the following four criteria in research design and analysis: (a) creation of comparable
groups, (b) study of student use patterns, (c) use of reliable measures of student learning or
achievement, and (d) control for possible confounding variables.

29
Chapter 3: Method
The general purpose of this study was to determine what effect, if any, open textbook
adoption has on measures of student success in seven community colleges who were early
adopters of Project Kaleidoscope (PK). These early adopters received grant monies to provide
training and curated OER to course instructors. As a condition of PK participation, instructors
agreed to only use OER curricular materials, which meant that no students would be asked to
purchase textbooks. Instructors at these institutions were free to participate or not in PK. Because
of this, each institution had students who used OER and students who used traditional textbooks.
The specific research question addressed by this study is:
What is the relationship between OER-adoption by teachers of post-secondary
courses and their students’:
1. final course grade?
2. rates of course success (i.e., completing a course with a C- or better
grade)?
3. enrollment intensity (i.e., the number of credit hours they take during the
semester they are taking the OER course)?
Design
In order to address this research question, I used an ex post facto two groups quasi-
experimental design (Shadish et al., 2002). This design was augmented by propensity score
matching between the two groups (Rosenbaum & Rubin, 1985). This research design facilitated
more valid and robust causal inference regarding the effects of OER on post-secondary students.
30
Participants
Participants in this study came from seven different schools who were early participants
in PK. Students in the sample took at least one of seven introductory college courses. For each of
these courses, some instructors opted to participate in PK and adopt OER, while other instructors
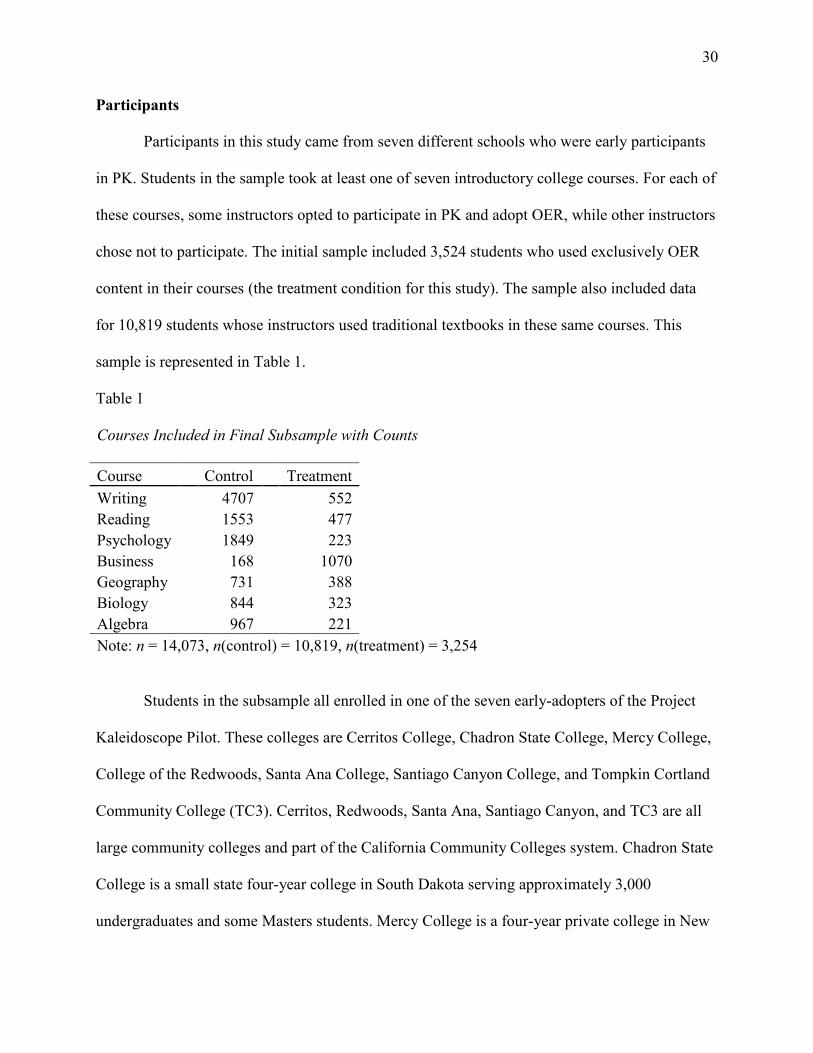
chose not to participate. The initial sample included 3,524 students who used exclusively OER
content in their courses (the treatment condition for this study). The sample also included data
for 10,819 students whose instructors used traditional textbooks in these same courses. This
sample is represented in Table 1.
Table 1 Courses Included in Final Subsample with Counts Course Control Treatment
Writing
4707
552 Reading
1553
477
Psychology
1849
223 Business
168
1070
Geography
731
388 Biology
844
323
Algebra 967 221 Note: n = 14,073, n(control) = 10,819, n(treatment) = 3,254
Students in the subsample all enrolled in one of the seven early-adopters of the Project
Kaleidoscope Pilot. These colleges are Cerritos College, Chadron State College, Mercy College,
College of the Redwoods, Santa Ana College, Santiago Canyon College, and Tompkin Cortland
Community College (TC3). Cerritos, Redwoods, Santa Ana, Santiago Canyon, and TC3 are all
large community colleges and part of the California Community Colleges system. Chadron State
College is a small state four-year college in South Dakota serving approximately 3,000
undergraduates and some Masters students. Mercy College is a four-year private college in New

31
York State with an enrollment of approximately 5,000 undergraduates. Demographic and
student characteristic data for these participants is listed in Table 2.
Table 2 Participant Characteristic and Demographic Data
Control Treatment Total
Total Number of Students 10,819 3,254 14,073 Number from Cerritos College 4,715 1,727 6,442 Number from Chadron State College 299 220 519 Number from Mercy College 953 418 1,371 Number from College of the Redwoods 1,231 242 1,473 Number from Santa Ana College 696 194 890 Number from Santiago Canyon College 434 242 676 Number from Tompkins Cortland C.C. 2,491 211 2,702 Mean Age 21.78 22.54 21.96 Percentage of Female Students 55.07 54.21 54.87 Percentage of Male Students 43.62 44.31 43.80 Percentage of African American Students 10.42 12.91 10.99 Percentage of American Indian Students 1.75 1.10 1.60 Percentage of Asian Students 6.44 6.91 6.76 Percentage of Hispanic Students 41.84 43.98 42.34 Percentage of White Students 31.80 25.35 30.31 Percentage of "Other-race" Students 7.75 8.82 8.00 Mean Number of Credits Currently Attempted 10.86 10.54 10.79 Percentage of Students Eligible for Pell Grants 50.49 48.92 50.62
Measures
Three different outcome variables were considered for this study. The first was the grade
earned in the course. These grades ranged from 0.0 – 4.0 and were reported on a traditional four-
point scale. The second outcome variable was a dichotomized version of the final grade at the cut
point 1.7; this was used to determine student success rates where success is defined as passing
with a C- or better. The third outcome variable was the number of credits each student enrolled
in during the semester.

32
Other student and school background variables from the dataset were used as covariates
in Ordinary Least Squares (OLS) regression models and as matching variables in propensity
score matching. The complete list of variables is found in Table 3.
Table 3 Variables in the PK Dataset Variable
Label
Outcome Variables
Letter grade earned in course
Lettergrade
Numeric grade earned in course (0.0-4.0)
Grade
Pass with a C- or better
C-minus
Completed the course Completion
Credits currently attempting
Credits
Student Demographic Variables
Student gender
Gender
Student age as of January 1, 2013
Age
Student race
Race
Pell eligibility marker
Pell
Student permanent zip code
Zip
GED marker
GED
High school diploma marker
HSD
Course Variables
Subject label
Course
Term
Semester
Course delivery mechanism (online or face-to-face)
Online
Project Kaleidoscope school
Institution
Assignment Variable
Exclusive adoption of OER marker Kaleidoscope

33
Procedures
Data analysis involved the use of data imputation of missing values, propensity score
matching (PSM) to create matched treatment and control groups and OLS regression to estimate
the effect of treatment controlling for relevant covariates.
Data imputation. The dataset had limited missing values. Missing values occurred in
only six relevant variables. I encountered missing values in the following variables: grade (2,023
cases), c minus (1,873 cases), completion (280 cases), credits (1 case), and gender (187 cases). In
addition, 1,126 students in the dataset had a race of “other,” “multi-racial,” “not specified,”
“declined to state” or a combination of these labels. Because different schools coded race
differently, it was often impossible to distinguish between students who had reported “other” or
had simply not opted to report. As a result, I made the decision to treat all of these cases as
simply “other” rather than missing. Accordingly, I did not impute students’ race.
For the grade variable, all missing data came from students who received incompletes,
official withdraws, pass, and no pass grades. These grade designations were informative, but
they did not convert to the four-point grade scale that I used to answer Question 1. Rather than
attempting to impute grades on the four-point scale for these students, I created a subset of the
overall dataset including students with interpretable grades and used this subset to answer
Question 1. This grades subset consisted of all 12,050 students with valid grades.
The C-minus variable is a dichotomized transformation of the grade variable where
students who passed with a C-minus grade or better were differentiated from students who did
not pass with a C-minus or better. This variable was used in part to answer my Question 2. The
discrepancy in the number of missing values between the C-minus and grade variables stems
from pass/no pass grades, which were omitted in the grade variable and included in the c minus

34
variable. For the purpose of answering Question 2, I created a second subset of the data only
including cases with valid values for the variable C-minus. This subset consisted of 12,200
students with valid values for the C-minus variable.
The completion variable was a dichotomized transformation of the grade variable where
students who finished the course and received a traditional grade (A-F, pass/no pass) were
differentiated from students who withdrew from the course at any point. This variable was also
used in part to answer research question two. For this variable, the 280 missing cases result from
students who were marked “incomplete.” Typically, and incomplete grade indicates that a
student has not yet been awarded a grade, but will be at some point in the future.
For the completion variable and the remaining variables, because the missing values were
determined to be missing not at random (MNAR), imputation was necessary to avoid bias.
Imputation is also necessary in order to estimate propensity scores and match the data.
I used the package Amelia in R in order to conduct the imputation. Amelia is designed
for multiple imputation and uses the expectation maximization (EM) algorithm (Dempster,
Laird, & Rubin, 1977). I created my imputed dataset as an aggregate of 11 multiple-imputed
datasets using Amelia. This process was repeated three times: once for the completion subset,
once for the grades subset, and once for the C-minus subset.
Propensity score matching. The group of students in OER-using courses and the group
of students in other courses are non-equivalent groups, raising the possibility of selection bias.
Consequently, if these groups were compared directly, differences in measured outcomes would
be difficult to attribute to the use or non-use OER. To overcome this problem I used propensity
score matching in order to improve the strength of our quasi-experimental design, reduce the risk
of selection bias, and provide valid estimates of the effects of OER implementation.
35
Propensity score matching significantly strengthens the research design by minimizing
pre-existing differences between treatment and control groups. This matching procedure
balances the probabilities of being in either group, thus approximating randomized control trials
(see Austin, 2011; d’Agostino, 1998; and Luellen, Shadish, & Clark, 2005). The matching
procedure improves the validity of the study by eliminating threats to internal validity posed by
selection bias. It also helps to ensure the data meets the assumptions necessary for valid use of
statistical hypothesis tests.
Propensity score matching (Rosenbaum & Rubin, 1985) entails using logistic regression
to match groups on a variety of covariates that may also be affecting student outcomes. In this
study, these covariates included (a) the school, (b) the course, (c) gender, (d) age, (e) race, (f)
Pell Grant eligibility, (g) high school diploma, (h) General Educational Development (GED)
tests, (i) course delivery mechanism, and the (j) semester the course was attempted. I used the
glm function in the software package R to conduct logistic regression of treatment condition on
the covariates listed above to estimate a single propensity score for each student in both the
treatment and control groups.
Students from the control group were then matched with students in the treatment group
based on propensity scores using caliper matching (Guo & Fraser, 2010). In accordance with the
recommendations of Rosenbaum and Rubin (1985), calipers were determined using formula 𝜀𝜀 ≤
.25𝜎𝜎𝜌𝜌 where ε is the caliper and σρ indicates the standard deviation of the propensity scores of the
sample.
I then used the fitted scores from the logistic regression model as propensity scores,
representing the conditional probability that a given student was in the treatment condition, given
the set of covariates. Using the package MatchIt in R, I then created a matched sub-sample of the

36
imputed dataset. In order to accomplish this, I used one-to-one caliper matching where the
caliper was determined by multiplying the standard deviation of the distribution of the fitted
values of the logistic regression by .25, resulting in a caliper of .059.
The resulting matched dataset contained 4,314 entries, with 2,157 students in each of the
two treatment conditions. This matching resulted in a 99.53% improvement in the balance of the
propensity scores across treatment and control groups. This improvement is graphically
displayed in figure 1.
This propensity score matching procedure was repeated two times on the subsamples of
the complete dataset for grades and C-minus. These models used the same covariates. The
calipers 𝜀𝜀𝑔𝑔𝑔𝑔𝑔𝑔𝑔𝑔𝑔𝑔𝑔𝑔 and 𝜀𝜀𝑐𝑐𝑐𝑐𝑐𝑐𝑐𝑐𝑐𝑐𝑔𝑔 were calculated using the same formula and were .059 and .058
respectively. The balance improvement for “grades” was 99.37% and for “C-minus” was
99.54%. The grades matched data set included 3,816 students with 1,908 in each the treatment
and control groups. The C-minus matched dataset included 3,760 students with 1,880 in each
group. One significant byproduct of the PSM procedure with caliper matching was a non-
negligible reduction in sample size, not only in the control group, but in the treatment group as
Figure 1. Propensity score distributions for the matched and unmatched grades subsamples.

37
well. When I wrote the PSM code for the MatchIt package in R, I sought to minimize the loss of
student data from the treatment condition. However, there were a significant number of students
in the treatment conditions with higher propensity scores and limited students from the control
group to serve as matches. While this disparity highlighted reflected observable selection bias
and highlighted the need for a matching procedure, it also led to a reduction of approximately
40% of treatment group cases.
For analyses of patterns at the course level, I chose not to conduct separate matching
procedures for each course-dependent variable combination. This decision was informed by the
fact that course was a covariate in the original PSM models, and therefore I would expect that in
many instances students in the treatment group would be matched with students taking the same
course in the control group. This assumption seems to be supported by the general balance of
treatment and control students in each of the course areas. However, because PSM relies on
composite probabilities, it is possible that students in the treatment and control group are
fundamentally different at the course level.
To the extent that the covariates included in the logistical regression model capture
relevant information that would affect student performance, this propensity score matching is an
approximation of random assignment and facilitates the kind of causal analysis intended in the
study.
Ordinary least squares regression. After generating matched groups using PSM, I used
ordinary least squares (OLS) regression to examine research questions one and three. OLS
regression was deemed to be the most appropriate analysis tool for this data because the
dependent variables of grade and credit enrollment were both ordinal variables. Ideally, the
dataset would have included variables that would have allowed for a modeling of the hierarchical
38
structure of the actual learning, but unfortunately, this data was not uniformly available for the
2011-2012 PK participating institutions. OLS provided a mechanism to estimate the effect of the
dichotomous treatment condition while controlling for the categorical and continuous variables
which might provide competing explanations of any observed difference across treatment
condition. For all OLS analyses, the null hypotheses were rejected when the probability of Type
I error was less than or equal to .05.
Logistic regression. In order to examine Question 2, I used logistic regression. I chose
logistic regression for two main reasons. The first was that logistic regression is able to
incorporate both categorical and non-categorical independent variables in the model, which is
not the case for discriminant analysis (Keith, 2006). A second reason was the interpretability of
the results. While OLS regression comes from the general linear model and logistic regression
comes from the generalized linear model, both involve estimating beta weights and standard
errors, which provided some rough comparability in results reporting. Additionally, logistic
regression affords the opportunity to transform beta estimates into odds ratios, which adds
interpretability to results. For all logistic regression analyses, the null hypotheses were rejected
when the probability of Type I error was less than or equal to .05.

39
Chapter 4: Results
I conducted modeling and analysis of the data as described in the methods section. I used
SAS 9.3 for all analyses in this section. I also used the software package R (v 2.13.1) and R
Studio (v 0.98.1091) to initially estimate OLS and logistic models. The results were consistent
across software packages with one minor exception. Both R and SAS use different decision rules
for assigning reference groups for categorical variables. R assigns the first value in numeric or
alphabetic order as the reference group, while SAS assigns the last value to be reference group.
This difference affected dichotomous variables like gender and semester by changing the sign of
the beta weight. It also changed the beta weights and parameter estimates for polytomous
variables like institution, course, and race. This change in reference groups also resulted in
changes to the intercept estimates in the models. But all of these parameters were incidental to
my research question about the differences across treatment condition; the estimates, standard
errors, and odds ratios for the treatment variable were stable across software platforms for all
models, as were model statistics like R squared or pseudo R squared.
Data Description
The dataset included students from seven different PK schools taking seven different
courses. Although these courses were taught in multiple sections by various teachers, this
hierarchical structure was not reliably available for the data. Assuredly, students within these
groupings shared common variance that would not be accounted for in non-hierarchical OLS
regression and logistic regression. Because class and institution had only seven groups each,
fixed effects for these variables were modeled as covariates in OLS and logistic regression rather
than as clustering variables with random effects in a multilevel model. The inability to model the
multilevel structure of the data represents one of the serious limitations of this study.
40
I examined the distribution of the continuous variables in the dataset to check for
normality of data. I used histogram graphs to visually examine the continuous variables. Perhaps
predictably, age showed positive skew. Grades appeared to have a relatively flat distribution.
Only credits currently attempted showed a roughly normal distribution. Even though some of
these variables are non-normally distributed, in multiple regression analyses, it is the residuals
that are assumed to be normal (Allison, 1999).
Another characteristic of this dataset was that not all seven courses were taught at each of
the seven PK schools.
• Algebra data came from Mercy, Santiago Canyon, and Tompkins Cortland.
• Biology data came from Redwoods, Santiago Canyon, and Tompkins Cortland.
• Business data came from Cerritos and Santa Ana.
• Geography data came from Cerritos and Chadron.
• Psychology data came from Chadron, Redwoods, and Tompkins Cortland.
• Reading data came from Cerritos, Chadron, Mercy, and Redwoods.
• Writing data came from Cerritos, Chadron, Santa Ana, and Tompkins Cortland.
Presumably, all or most of these seven courses was taught at each of the institutions, given that
they are some of the most commonly-taught courses at two-year and four-year colleges.
However, different institutions in the PK pilot had the freedom to pick and choose what PK OER
courses they would offer. No data were collected for courses where there was not at least one PK
OER offering in that course at the participating institutions. While none of the PK courses was
taught at all seven schools, each of the courses was taught in at least two participating schools.
41
Research Questions
This study aimed to answer three specific research questions: What is the relationship
between OER-adoption by teachers of post-secondary courses and their students’:
1. final course grade?
2. rates of course success (i.e., completing a course with a C- or better grade)?
3. enrollment intensity (i.e., the number of credit hours they take during the
semester they are taking the OER course)?
I examined each of these research questions in turn, using both OLS and logistic
regression analyses using the software package R and in SAS 9.3. Conducting the analyses in
both packages provided the opportunity to engage in quality control for results and access the
relative strengths of each program in data visualization and results reporting to better understand
and interpret results.
Question 1. I used the matched “grades” dataset to answer my first research question.
This matched subset of the data included 1,908 students who participated in the treatment group
and 1,908 students who participated in the control group. Each of these students received a valid
grade in the course that could be converted to a 4.0 scale.
In order to examine the relationship between open textbook adoption and student grades,
I analyzed an OLS multiple regression model with “grade” as the dependent variable, treatment
condition as an independent variable, and other independent variables which might theoretically
affect student grades. These covariates were class, semester, institution, course delivery mode
(online, face-to-face, or blended), gender, age, race, Pell Grant eligibility, high school
graduation, and GED attainment. This model is depicted in the formula
𝑦𝑦𝑐𝑐 = 𝛽𝛽0 + β1𝑥𝑥𝑐𝑐 + 𝛽𝛽2𝑥𝑥𝑐𝑐 . . . +𝛽𝛽11𝑥𝑥𝑐𝑐 + ϵ𝑐𝑐 .
42
I then analyzed the data first for all courses combined and then separately for each of the seven
individual subject areas to see if any observed pattern in the omnibus analysis was also manifest
in each individual course.
Omnibus analysis. The results of the omnibus analysis are depicted below in Table 4. In
the model, most of the covariates were statistically significant predictors of student grade, adding
justification for a model with so many covariates. It is worth noting, however, that even given
this large number of covariates, the overall model 𝑅𝑅2value of .091 indicates that the model
accounts for only 9.1% of the overall variance in student grades.
My research question dealt with whether adoption of open textbooks affected student
grades. Notably, these results reveal that students who used open textbooks achieved statistically
significantly lower grades than students using traditional textbooks (𝑏𝑏 = −0.15, 𝑡𝑡 = −3.65,𝑝𝑝 <
.001. In other words, students who used open textbooks scored on average .15 grades lower than
students who took the same courses with traditional textbooks, controlling for student and course
covariates. A grade point of 1 represents the difference from one letter grade to the next. A
difference of −.15 represents, for example, approximately half of the difference between a B
(3.0) and a B- (2.7).

43
Table 4 Simultaneous Regression of Omnibus Course Grades b S.E. β Intercept 2.10 *** 0.17 0.00 Kaleidoscope -0.15 *** 0.04 -0.06 Age 0.02 *** 0.00 0.10 CourseAlgebra -0.75 *** 0.13 -0.14 CourseBiology -0.02 0.15 -0.01 CourseBusiness 0.28 0.16 0.04 CourseGeography -0.40 *** 0.07 -0.11 CoursePsychology 0.05 0.13 0.01 CourseReading -0.02 0.11 -0.01 GED -0.28 ** 0.10 -0.05 GenderFemale 0.13 ** 0.04 0.05 HSD -0.12 0.06 -0.03 InstitutionCerritos 0.66 *** 0.13 0.24 InstitutionChadron 0.19 0.14 0.04 InstitutionMercy 0.68 *** 0.13 0.21 InstitutionRedwoods 0.14 0.11 0.03 InstitutionSantaAna 0.57 ** 0.20 0.08 InstitutionSantiago 0.19 0.12 0.04 Online -0.24 *** 0.07 -0.07 Pell -0.06 0.05 -0.02 RaceAsian -0.05 0.10 -0.01 RaceBlack -0.76 *** 0.08 -0.19 RaceHispanic -0.51 *** 0.06 -0.18 RaceNatAmer -0.25 0.18 -0.02 RaceOther -0.32 *** 0.08 -0.07 SemesterFall 0.01 0.05 0.00
Note. 𝑛𝑛 = 3,816, 𝑅𝑅2 = .09. The reference group for course was writing, for institution was TC3, and for race was white. *𝑝𝑝 < .05, **𝑝𝑝 < .01,***𝑝𝑝 < .001.
Another way to examine the relative size of this difference is to look at the effect size as
estimated by the standardized beta weight for the kaleidoscope variable; in this case, 𝛽𝛽 = −.06.
Either approach to understanding the relative magnitude of the negative difference in predicted
grades for students using open textbooks reveals that the observed difference is relatively small.

44
Nevertheless, the data suggests that students using open textbooks received statistically
significantly lower grades than those who used traditional textbooks, after accounting for a set of
relevant covariates.
Course-level analysis. Given the statistically significant difference between student
grades for OER adopters vs. non-adopters, I then used OLS regression to examine the
relationship between grades and OER textbooks in each individual course. For each course, I
used the model 𝑦𝑦𝑐𝑐𝑖𝑖 = 𝛽𝛽0 + β1𝑥𝑥𝑐𝑐 + 𝛽𝛽2𝑥𝑥𝑐𝑐 . . . +𝛽𝛽10𝑥𝑥𝑐𝑐 + ϵ𝑐𝑐, where 𝑦𝑦𝑐𝑐 represented the grade for
student 𝑖𝑖 in the course and β1𝑥𝑥𝑐𝑐 + 𝛽𝛽2𝑥𝑥𝑐𝑐 . . . +𝛽𝛽10𝑥𝑥𝑐𝑐 represented the covariates kaleidoscope,
semester, institution, online, gender, age, race, Pell, HSD, and GED respectively. This model is
comparable to the omnibus model, with the exception of the class variable that is omitted in the
course-level models.
Interestingly, only two of the seven course-level analyses indicated that student grade
significantly differed across treatment conditions. These courses were business and psychology,
and the results for these two models are shown in Table 5. In the business classes, the model
estimates that students using OER received significantly lower grades than students using
traditional textbooks, 𝑏𝑏 = −.94, 𝑡𝑡 = −3.87,𝑝𝑝 < .001. This unstandardized beta weight of −.94
represents nearly one full grade difference between the scores of the two groups. The
standardized beta, 𝛽𝛽 = −.32 indicates a moderate effect size. This suggests that for business
students in the sample, grades were significantly lower for OER users, even controlling for
relevant student- and school-level covariates.
In the psychology-only model, the beta weight for treatment was also statistically
significant, 𝑏𝑏 = −.43, 𝑡𝑡 = −2.74,𝑝𝑝 < .001. This indicates that students using OER scored
approximately half of a grade lower. The effect size as estimated by the standardized beta,

45
𝛽𝛽 = −.14, falls between the effect size in the omnibus model and the effect size in the business
model.
Table 5 Simultaneous Regression Results of Grades Disaggregated by Course for Business and Psychology
Business (n=177)
Psychology (n=393)
b S.E. β b S.E. β Intercept 3.18 *** .83 .00
1.82 *** .46 .00
Kaleidoscope -.94 *** .24 -.32
-.43 ** .16 -.14 Age .02
.01 .12
.04 *** .01 .19
GED .34
.68 .06
-.80 * .39 -.14 GenderFemale .15
.24 .05
.38 * .16 .12
HSD -.05
.58 -.01
-.34
.31 -.08 InstitutionCerritos -.61
.36 -.19
InstitutionChadron
.25
.33 .04 InstitutionRedwoods
.04
.24 .01
Online .54
.31 .18
.02
.22 .01 Pell -.08
.24 -.03
.12
.19 .04
RaceAsian -.02
.50 .00
.40
.55 .03 RaceBlack -1.08 * .54 -.26
-1.16 *** .26 -.22
RaceHispanic -.60
.44 -.20
-.62 ** .22 -.14 RaceNatAmer
-.50
.37 -.07
RaceOther -.45
.52 -.10
-.07
.33 -.01 SemesterFall .00 .24 .00 .04 .16 .01
Note. 𝑅𝑅𝑏𝑏𝑐𝑐𝑔𝑔𝑐𝑐𝑐𝑐𝑔𝑔𝑔𝑔𝑔𝑔2 = .24,𝑅𝑅𝑝𝑝𝑔𝑔𝑝𝑝𝑐𝑐ℎ𝑜𝑜𝑜𝑜𝑔𝑔𝑝𝑝2 = .16. The reference group for race was white for both models. The reference group for institution was Santa Ana for business and TC3 for Psychology. *𝑝𝑝 < .05, **𝑝𝑝 < .01,***𝑝𝑝 < .001.
None of the other course-level analyses returned a statistically significant estimate for the
treatment variable in the models. The results for these models are presented in Table 6. While
some of the covariates estimates were significant at the 𝛼𝛼 = .05 level, the proportion of
significant estimates was noticeably smaller than in the omnibus analysis. This is to be expected,
given the smaller n counts among the course-level subsets of the data. This smaller sample size,
and consequentially lower statistical power, partially explains the non-significant treatment

46
effect estimates, given the standardized beta estimates which were, at times, of comparable
magnitude to the −.06 observed in the omnibus analysis.
Table 6 Simultaneous Regression of Grades Disaggregated by Course with Non-Significant Treatment Estimates
Algebra (n=279)
Biology (n=583)
Geography (n=679)
Reading (n=852)
Writing (n=853)
b(S.E.) b(S.E.) b(S.E.) b(S.E.) b(S.E.) Intercept 1.70(.46)*** 2.88(.34)*** 2.00(.79)* 2.7(.33)*** 1.69(.29)*** Kaleidoscope .09(.22) -.18(.10) .10(.10) -.16(.09) -.14(.09) Age .01(.01) .02(.01)* .02(.01)** .01(.01) .02(.01)** GED -.06(.35) .10(.30) -.97(.28)*** -.32(.17) -.09(.24) GenderFemale .38(.17)* -.11(.10) .06(.09) .19(.10)* .11(.08) HSD -.22(.29) .06(.22) -.11(.12) .11(.12) -.10(.14) InstitutionCerritos . . .32(.74) .21(.19) 1.08(.19)*** InstitutionChadron . . . .28(.26) .67(.22)** InstitutionMercy .22(.28) . . . . InstitutionRedwoods . -.52(.20)* . . . InstitutionSantaAna .49(.43) . . . -.17(.64) InstitutionSantiago .69(.33)* -.66(.18)*** . . . Online -.77(.27)** . .10(.20) .98(.17)*** -.08(.14) Pell .10(.18) -.10(.15) -.14(.10) .10(.11) -.18(.09)* RaceAsian -.12(.42) .19(.20) -.18(.23) -.09(.28) -.12(.18) RaceBlack -.93(.27)*** -.81(.30)** 1.01(.24)*** .56(.15)*** -.75(.16)*** RaceHispanic -.36(.24) -.52(.13)*** -.46(.18)* .71(.14)*** -.41(.13)** RaceNatAmer . .04(.27) -.60(.53) .21(1.36) -.68(.44) RaceOther -.44(.41) -.31(.17) -.40(.20) -.46(.23) -.17(.17) SemesterFall -.02(.23) -.22(.14) -.04(.09) .23(.13) -.16(.10) Note. 𝑅𝑅𝑔𝑔𝑜𝑜𝑔𝑔𝑔𝑔𝑏𝑏𝑔𝑔𝑔𝑔2 = .10,𝑅𝑅𝑏𝑏𝑐𝑐𝑜𝑜𝑜𝑜𝑜𝑜𝑔𝑔𝑝𝑝2 = .10,𝑅𝑅𝑔𝑔𝑔𝑔𝑜𝑜𝑔𝑔𝑔𝑔𝑔𝑔𝑝𝑝ℎ𝑝𝑝2 = .06,𝑅𝑅𝑔𝑔𝑔𝑔𝑔𝑔𝑔𝑔𝑐𝑐𝑐𝑐𝑔𝑔2 = .09,𝑅𝑅𝑤𝑤𝑔𝑔𝑐𝑐𝑤𝑤𝑐𝑐𝑐𝑐𝑔𝑔2 = .10. The reference group for race was white, and for institution was TC3, except for in the case of geography, where it was Chadron. *𝑝𝑝 < .05, **𝑝𝑝 < .01,***𝑝𝑝 < .001.
Question 2. I used the matched C-minus and the matched completion datasets to answer
my second research question, what is the relationship between OER-adoption by teachers of
post-secondary courses and their students’ rates of course success? I examined two separate
47
variables as dependent variables: “C-minus” and “completion.” Because each of these variables
was dichotomous, I chose to use logistic regression models to analyze the data.
The C-minus variable represented whether or not a student passed the course with a C-
grade or better. This dichotomous flag is used by institutions like the Gates foundation as an
indicator of student success, as it represents a cutoff grade at which a student not only passed a
course, but did so with an acceptable level of mastery. This variable was highly correlated with
grade, but the justification of including it as a separate analysis lied in the argument that for
students, especially at the introductory level, passing with a C- or better provides tangible
benefits to students, particularly community college students, as they move through the post-
secondary system.
The second dependent variable, completion, represented whether or not a student
persisted to the end of the semester, regardless of what the final grade received ended up being.
Students who persist to the end of the semester are more likely to succeed in other success
metrics like grades. Also, course completion can be seen as a proxy for student engagement.
Omnibus analysis. I used two separate logistic regression models, changing only the
dependent variable in the models (C-minus for the first, and completion for the second). Like I
did with the omnibus analysis of the grade data, I used ten independent variables in my omnibus
models: (a) Kaleidoscope (treatment), (b) semester, (d) institution, (e) online, (f) gender, (g) age,
(h) race, (i) Pell, (j) HSD, and (k) GED. The results of these analyses are depicted in Table 7. In
each case, adoption of OER textbooks had no significant predictive power in the model when
controlling for all of the covariates.

48
Table 7 Logistic Regression results of C-minus and Completion
C-minus (n = 3,760)
Completion (n = 4,314)
b S.E. Odds b S.E. Odds Intercept .25
.30
2.26 *** .36
Kaleidoscope -.13
.08 .88
.03
.10 1.03 Age .03 *** .01 1.03
.00
.01 1.00
CourseAlgebra -.94 *** .22 .71
-.30
.27 .74 CourseBiology .67 * .27 .94
.14
.37 1.15
CourseBusiness .10
.30 .96
-.58 ** .22 .56 CourseGeography -.51 *** .14 .60
.29
.16 1.33
CoursePsychology .12
.21 3.53
.29
.30 1.34 CourseReading .10
.20 1.38
-.09
.22 .92
GED -.52 ** .17 2.57
-.05
.24 .95 GenderFemale .12
.08 1.03
.23 * .10 1.26
HSD -.04
.12 2.48
.07
.16 1.08 InstitutionCerritos 1.26 *** .21 .92
-.37
.26 .69
InstitutionChadron .32
.22 1.05
.94 ** .36 2.55 InstitutionMercy .94 *** .21 .39
1.04 *** .31 2.83
InstitutionRedwoods .03
.20 1.96
.12
.29 1.13 InstitutionSantaAna .91 ** .34 1.10
-.31
.31 .74
InstitutionSantiago -.08
.28 .60
-1.64 *** .34 .19 Online -.35 ** .13 1.13
-.65 *** .14 .52
Pell -.07
.09 1.10
.04
.11 1.04 RaceAsian .15
.21 1.12
-.20
.21 .82
RaceBlack -1.08 *** .14 1.17
-.63 *** .18 .53 RaceHispanic -.56 *** .12 .34
-.30 * .15 .74
RaceNatAmer .00
.34 .57
-.96 ** .35 .38 RaceOther -.25
.17 1.00
-.11
.20 .90
SemesterFall .05 .09 .78 .12 .11 1.13 Note. The pseudo R Square for C-minus was .09 and for Completion was .12. The reference group for course was writing, for institution was TC3, and for race was white. *𝑝𝑝 < .05, **𝑝𝑝 < .01,***𝑝𝑝 < .001.
Course-level models. Even though there was no significant difference detected in the
probability of completing a course or passing a course with at least a C- across treatment
conditions, I evaluated course level models for all 14 combinations of courses by dependent
variable. By and large, the same lack of significant differences in probabilities across treatment

49
conditions appeared in the models. There were, however, three notable variations from this
result. Two of these cases were instances in which the beta estimates for students in the treatment
condition indicated that OER textbook adoption predicted significantly lower probabilities of
finishing a course with a C- or better (See Tables 8 and 9).
Table 8 Logistic Regression Results of C-minus and Completion Disaggregated by Course for Business
C-minus (n = 173)
Completion (n = 307)
b S.E. Odds b S.E. Odds Intercept 2.66
138.70
-.29
1.07
Kaleidoscope -1.19 * .54 .31
.04
.35 1.04 Age .03
.03 1.03
.07 ** .02 1.07
GED 2.97
1.76 19.46
.84
.81 2.32 GenderFemale .33
.50 1.39
.38
.31 1.46
HSD 1.12
1.35 3.07
.02
.61 1.02 InstitutionCerritos -.56
.91 .57
-1.41 ** .51 .24
Online .55
.77 1.73
-.33
.43 .72 Pell .17
.51 1.19
.52
.35 1.68
RaceAsian -1.88
138.70 <0.001
.36
.74 1.43 RaceBlack -4.12
138.70 <0.001
-1.04
.72 .35
RaceHispanic -2.58
138.70 <0.001
-.28
.60 .76 RaceNatAmer
-1.48
1.44 .23
RaceOther -2.91
138.70 <0.001
-.19
.75 .82 SemesterFall -.01 .49 .99 .13 .32 1.14 Note. The pseudo R Square for C-minus was .24 and for Completion was .18. The reference group for institution was Santa Ana, and for race was white. *𝑝𝑝 < .05, **𝑝𝑝 < .01,***𝑝𝑝 < .001.
For business students, the beta estimate for Kaleidoscope was −1.19, 𝑧𝑧 = −2.183, 𝑝𝑝 =
.0290. The odds of course success for OER users was .31 compared to 1 for students in the
control group. This represents a substantial change in the odds of course success for business
students. This result seems to match the pattern observed in the business grade data. Namely,

50
students using the business OER curricular materials had statistically significantly lower grades,
and had a lower probability of finishing the course with a C- or better
Table 9 Logistic Regression Results of C-minus and Completion Disaggregated by Course for Psychology
C-minus (n = 451)
Completion (n = 477)
b S.E. Odds b S.E. Odds Intercept -.29
.81
3.26 ** 1.09
Kaleidoscope -.55 * .25 .58
.51
.37 1.67 Age .06 * .02 1.07
-.02
.03 .98
GED -2.04 ** .72 .13
-.94
.92 .39 GenderFemale .44
.24 1.55
.35
.37 1.42
HSD .01
.58 1.01
-.01
.81 .99 InstitutionChadron .35
.46 1.42
1.42
1.09 4.13
InstitutionRedwoods .47
.41 1.60
-.01
.58 .99 Online -.14
.37 .87
-.53
.49 .59
Pell .13
.30 1.14
-.72
.50 .49 RaceAsian -.37
.72 .69
-1.44 * .71 .24
RaceBlack -2.07
.41 .13
-.79
.55 .45 RaceHispanic -.64
.33 .53
-.94
.48 .39
RaceNatAmer -.36
.64 .70
-.34
.82 .72 RaceOther -.03
.60 .97
-.04
1.07 .96
SemesterFall -.03 .25 .97 .07 .36 1.07 Note. The pseudo R Square for C-minus was .23 and for Completion was .18. The reference group for institution was Santa Ana, and for race was white. *𝑝𝑝 < .05, **𝑝𝑝 < .01,***𝑝𝑝 < .001.
But psychology students also showed a significant decrease in probability of passing with
a C- or better for students using OER, 𝑏𝑏 = −.55, 𝑧𝑧 = −2.22,𝑝𝑝 = .0266. The odds of .58 is
somewhat less marked than for business students, but students in OER sections of psychology
still had lower odds of course success as measured by passing with a C-minus or better. Even
though both business and psychology courses showed a negative effect on student probability of
passing with a C- or better, these results were not so marked that they were reflected in the

51
omnibus analysis. It is also interesting to note that this significant difference in the probability of
course completion across treatment condition for these two courses did not correspond with a
statistically significant omnibus difference in the likelihood of course completion.
In fact, for most courses, students who used open textbooks were not statistically
significantly more or less likely to pass the course with a C-minus or better, nor were they more
or less likely to complete the course (See Tables 10-13).
Table 10 Logistic Regression Results of C-minus and Completion Disaggregated by Course for Algebra
C-minus (n = 230)
Completion (n = 250)
b S.E. Odds b S.E. Odds Intercept -.25
.87
.48
1.67
Kaleidoscope -.20
.33 .82
-.30
.92 .74 Age .03
.02 1.03
.08 * .04 1.08
GED .33
.56 1.39
-.30
1.19 .74 GenderFemale .08
.30 1.08
.61
.43 1.84
HSD .51
.47 1.67
-.16
1.18 .85 InstitutionMercy -.13
.51 .88
1.51
.88 4.51
InstitutionSantaAna .52
.68 1.68
.16
.70 1.18 Online -1.31 ** .43 .27
-1.64
1.02 .19
Pell .10
.31 1.10
-.85
.47 .43 RaceAsian .37
.79 1.45
1.31
1.27 3.70
RaceBlack -1.27 ** .44 .28
1.70
1.10 5.46 RaceHispanic -.44
.39 .65
-.04
.57 .96
RaceNatAmer 13.32
1216.30 >999
13.14
1158.60 >999.999 RaceOther -.14
.68 .87
12.47
288.90 >999.999
SemesterFall -.33 .51 .72 .85 .62 2.33 Note. The pseudo R Square for C-minus was .15 and for Completion was .30. The reference group for institution was TC3, and for race was white. *𝑝𝑝 < .05, **𝑝𝑝 < .01,***𝑝𝑝 < .001.

52
Table 11 Logistic Regression Results of C-minus and Completion Disaggregated by Course for Geography
C-minus (n = 658)
Completion (n = 746)
b S.E. Odds b S.E. Odds Intercept 12.21
609.40
1.87
1.04
Kaleidoscope .29
.20 1.34
.18
.26 1.20 Age .05 * .02 1.06
-.02
.02 .98
GED -1.77 *** .48 .17
.00
.62 1.00 GenderFemale -.02
.20 .98
.23
.24 1.26
HSD .02
.26 1.02
.16
.31 1.17 InstitutionCerritos -11.56
609.40 <0.001
.80
.78 2.22
Online .70
.45 2.01
-.39
.44 .68 Pell -.26
.20 .77
-.20
.25 .82
RaceAsian -.27
.51 .76
-.43
.61 .65 RaceBlack -1.39 ** .51 .25
-1.50 ** .55 .22
RaceHispanic -.59
.42 .55
-.38
.50 .68 RaceNatAmer -1.09
1.24 .34
-.97
1.25 .38
RaceOther -.51
.47 .60
-.13
.58 .88 SemesterFall .01 .20 1.01 .13 .25 1.14 Note. The pseudo R Square for C-minus was .09 and for Completion was .06. The reference group for institution was TC3, and for race was white. *𝑝𝑝 < .05, **𝑝𝑝 < .01,***𝑝𝑝 < .001.

53
Table 12 Logistic Regression Results of C-minus and Completion Disaggregated by Course for Reading
C-minus (n = 869)
Completion (n = 912)
b
S.E. Odds
b
S.E. Odds
Intercept -.72
.76
3.32 ** 1.07 Kaleidoscope -.06
.18 .94
-.20
.29 .82
Age .02
.02 1.02
-.02
.03 .99 GED -.22
.28 .80
-.53
.48 .59
GenderFemale .29
.18 1.34
.35
.29 1.42 HSD -.18
.23 .84
-.11
.35 .89
InstitutionCerritos 3.25
.61 25.90
-.65
.76 .52 InstitutionChadron 1.94 ** .66 6.97
1.41
1.31 4.11
InstitutionMercy 2.13
.50 8.43
.79
.68 2.19 Online -1.40
.30 .25
-.23
.53 .80
Pell .36
.20 1.43
.54
.31 1.72 RaceAsian -.47
.57 .63
-.34
.90 .71
RaceBlack -1.27
.30 .28
-1.20 * .56 .30 RaceHispanic -1.30
.30 .27
-1.16 * .54 .31
RaceNatAmer .10
1.45 1.10
-1.65
1.29 .19 RaceOther -1.22 ** .45 .29
-1.19
.69 .30
SemesterFall .46 * .21 1.59 -.19 .43 .83 Note. The pseudo R Square for C-minus was .14 and for Completion was .10. The reference group for institution was Redwoods, and for race was white. *𝑝𝑝 < .05, **𝑝𝑝 < .01,***𝑝𝑝 < .001.

54
Table 13 Logistic Regression Results of C-minus and Completion Disaggregated by Course for Writing
C-minus (n = 850)
Completion (n = 981)
b
S.E. Odds
b
S.E. Odds
Intercept .06
.68
2.33 *** .66 Kaleidoscope .14
.19 1.15
-.23
.23 .80
Age .06 ** .02 1.06
-.02
.02 .98 GED -.59
.51 .55
.93
.65 2.53
GenderFemale .11
.18 1.12
.48 * .20 1.62 HSD -.60
.35 .55
.34
.28 1.41
InstitutionCerritos 1.19 *** .33 3.28
-.48
.46 .62 InstitutionChadron .39
.37 1.48
.57
.61 1.76
InstitutionSantaAna -1.42
1.15 .24
-2.47 ** .77 .09 Online -.13
.28 .88
.33
.42 1.39
Pell -.37
.19 .69
.20
.20 1.22 RaceAsian .87
.54 2.40
-.31
.45 .73
RaceBlack -.64 * .30 .53
-.25
.42 .78 RaceHispanic -.25
.28 .78
-.26
.36 .77
RaceNatAmer -.98
.70 .38
-1.64
.88 .20 RaceOther .35
.42 1.43
-.52
.44 .60
SemesterFall -.04 .22 .97 .22 .28 1.24 Note. The pseudo R Square for C-minus was .12 and for Completion was .11. The reference group for institution was TC3, and for race was white. *𝑝𝑝 < .05, **𝑝𝑝 < .01,***𝑝𝑝 < .001.
In the completion analysis, students who used open textbooks had a significantly higher
probability of completing the biology course than did their counterparts using traditional
textbooks, 𝑏𝑏 = .82, 𝑧𝑧 = 2.98,𝑝𝑝 < .001 (see Table 14). Students in PK OER courses had higher
odds than students in the control by a ratio of 2.26:1, which represents a significant increase in
the likelihood of course completion. Even though this was a significant positive effect, it appears
to be isolated only to the case of biology; there were no other statistically significant differences
across treatment groups for any of the other courses, nor were there in the omnibus analysis. This
difference in the likelihood of completing the course was not reflected in a corresponding
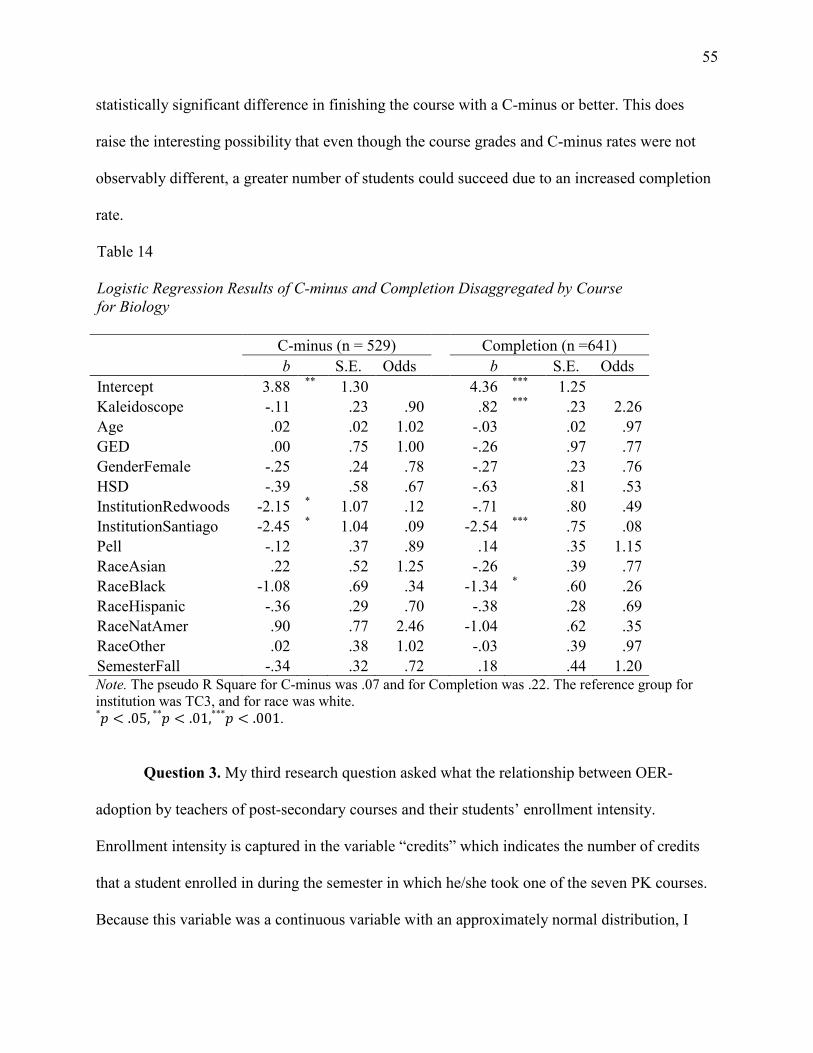
55
statistically significant difference in finishing the course with a C-minus or better. This does
raise the interesting possibility that even though the course grades and C-minus rates were not
observably different, a greater number of students could succeed due to an increased completion
rate.
Table 14 Logistic Regression Results of C-minus and Completion Disaggregated by Course for Biology
C-minus (n = 529)
Completion (n =641)
b S.E. Odds b S.E. Odds Intercept 3.88 ** 1.30
4.36 *** 1.25
Kaleidoscope -.11
.23 .90
.82 *** .23 2.26 Age .02
.02 1.02
-.03
.02 .97
GED .00
.75 1.00
-.26
.97 .77 GenderFemale -.25
.24 .78
-.27
.23 .76
HSD -.39
.58 .67
-.63
.81 .53 InstitutionRedwoods -2.15 * 1.07 .12
-.71
.80 .49
InstitutionSantiago -2.45 * 1.04 .09
-2.54 *** .75 .08 Pell -.12
.37 .89
.14
.35 1.15
RaceAsian .22
.52 1.25
-.26
.39 .77 RaceBlack -1.08
.69 .34
-1.34 * .60 .26
RaceHispanic -.36
.29 .70
-.38
.28 .69 RaceNatAmer .90
.77 2.46
-1.04
.62 .35
RaceOther .02
.38 1.02
-.03
.39 .97 SemesterFall -.34 .32 .72 .18 .44 1.20 Note. The pseudo R Square for C-minus was .07 and for Completion was .22. The reference group for institution was TC3, and for race was white. *𝑝𝑝 < .05, **𝑝𝑝 < .01,***𝑝𝑝 < .001.
Question 3. My third research question asked what the relationship between OER-
adoption by teachers of post-secondary courses and their students’ enrollment intensity.
Enrollment intensity is captured in the variable “credits” which indicates the number of credits
that a student enrolled in during the semester in which he/she took one of the seven PK courses.
Because this variable was a continuous variable with an approximately normal distribution, I

56
once again used an OLS where I regressed the dependent variable credits on treatment condition
and nine other covariates which might compete with treatment condition as explanations for
observed variance. These covariates were (a) course, (b) semester, (c) institution, (d) online, (e)
gender, (f) age, (g) race, (h) Pell, (i) HSD, and (j) GED. The results are presented in Table 15.
Table 15 Simultaneous Regression of Omnibus Enrollment Intensity
b S.E. β Intercept 14.61 *** .43 .00 Kaleidoscope .27 * .12 .03 Age -.09 *** .01 -.12 CourseAlgebra -.40 .33 -.02 CourseBiology -.16 .40 -.01 CourseBusiness .30 .35 .02 CourseGeography -.44 * .20 -.04 CoursePsychology -.09 .32 -.01 CourseReading .68 * .28 .06 GED .04 .27 .00 GenderFemale .03 .12 .00 HSD .56 ** .18 .05 InstitutionCerritos -2.40 *** .31 -.26 InstitutionChadron 1.15 *** .34 .06 InstitutionMercy .58 .33 .05 InstitutionRedwoods -1.04 *** .31 -.07 InstitutionSantaAna -6.85 *** .43 -.38 InstitutionSantiago -5.00 *** .40 -.28 Online -.84 *** .18 -.07 Pell 1.07 *** .13 .12 RaceAsian .17 .26 .01 RaceBlack -.40 .21 -.03 RaceHispanic -.78 *** .17 -.08 RaceNatAmer -1.06 * .47 -.03 RaceOther -.44 .24 -.03 SemesterFall -1.07 *** .13 -.12 Note. 𝑛𝑛 = 4,314, 𝑅𝑅2 = .32. The reference group for Course was writing, for institution was TC3, and for race was white. *𝑝𝑝 < .05, **𝑝𝑝 < .01,***𝑝𝑝 < .001.
57
In the case of enrollment intensity, students who enrolled in OER courses showed a
statistically significant increase in the overall enrollment intensity over students who enrolled in
the same courses, but used traditional textbooks, 𝑏𝑏 = .27, 𝑡𝑡 = 2.35,𝑝𝑝 = .0190. In other words,
students using open textbooks on average took approximately one quarter more of a credit in that
semester than did students using traditional courses, holding student, course- , and institution-
level covariates constant. The standardized beta (𝛽𝛽 = .03) is small, indicating that the effect size
of this result is relatively small. This model shows a stronger overall 𝑅𝑅2value of .3187, indicating
that approximately 32% of variance in student enrollment is explained by the variables included
in the model.
58
Chapter 5: Conclusions
The goal of this study was to determine the effects of OER adoption on post-secondary
students’ academic performance. The OER community and researchers focusing on OER
adoption have documented that OER textbook replacements can be a powerful way to help
college students save money (Hilton, Robinson, Wiley, & Ackerman, 2014). Theory suggest that
OER textbooks and curricular materials could affect student success by (a) positive or negative
change in textbook quality (Bliss, Robinson, Hilton, & Wiley, 2013), (b) increasing access to
core course materials for students who would otherwise forgo or delay purchase (Berry et al.,
2010), (c) changing faculty engagement patterns with course curriculum by inviting them to
develop customized OER (Robinson et al., 2014), or by (d) allowing students to more efficiently
use limited financial resources to maximize collegiate success (Hilton et al., 2014). Robinson et
al. (2014) found that high school students scored higher on standardized tests when their teachers
switched to open textbooks, and Hilton, Gaudet, Clark, and Robinson (2013) and Hilton and
Laman (2012) presented correlational case study evidence of higher student outcomes across
non-equivalent groups. This study should add to the field by exploring whether this result holds
true with early PK adopters.
Reflections on Findings
This study represents a mixed finding OER adoption in the pilot year of PK. Both the
grade data and the completion data reveal that aggregated across classes or in isolated courses,
OER adoption may have actually hurt student achievement as measured by student grades and
passing with at least a C-. However, for biology, it appears that OER adoption significantly
increased the probability that student complete a course, even though student grades did not
change significantly for that course, raising the possibility that OER could have changed student
59
success by increasing the throughput through the course. More notably, however, it appears that
students in the OER group enrolled in a significantly higher number of credits in that semester.
While each of these findings was statistically significant at the 𝑎𝑎 = .05 level, the effect size and
practical significance of these findings vary.
The first key finding was that students who used OER received significantly lower grades
in their courses than students who used traditional textbooks. The limitations to this and other
findings are important to consider, and will be discussed at length later in the chapter. However,
it should be noted that this result serves as the first finding of a negative effect associated with
OER adoption and a counterpoint to other studies that have shown positive learning outcome
differences between OER adopters and non-adopters as measured by grades or student test scores
(Robinson et al., 2014; Hilton et al., 2014; Hilton & Laman, 2012).
The results from the separate course-level “grade” and “C-minus” analyses shed
additional light on the overall pattern detected. The treatment variable was non-significant in six
of the seven courses taught. Only business showed a significant result; OER students earned
significantly lower grades than their counterparts who used traditional
Even though the decrease in student grades associated with OER adoption is statistically
significant, there may be limited educational significance in the finding. The effect size as
estimated by the standardized beta weight, 𝛽𝛽 = −.05, was relatively small compared to other
predictors in the model. Perhaps not surprisingly, group-level variables like the course subject,
course delivery, and institution accounted for a higher proportion of the variance in course grade.
In fact, treatment condition had the smallest effect size of all statistically significant covariant
differences in the model. The non-standardized beta b = −.15 means that the difference in
grades for students represents approximately half of one grade designation change (for example
60
B to C+ or D+ to D). This may or may not be a practically significant difference merely from a
grade perspective, depending on whether or not there are high-stakes consequences to falling on
one side of a particular grade cut point (like passing or failing).
By and large, the difference seems to be relatively small. But if student learning
outcomes are to be used as a measure of textbook quality (Gurung, 2003; Luik & Mik, 2008),
these results may indicate that the OER materials used in the business and psychology courses in
the PK pilot suffered in comparison to traditional textbooks. This conclusion is somewhat
bolstered by the results from the C-minus analysis. Even though there was not a significant result
in the omnibus analysis, students in business and psychology showed a significant difference in
grades between treatment groups, controlling for other variables.
This finding has several implications. A significant effect in the negative direction for
OER learners provides a counterpoint to the argument that OER adoption leads to higher
learning outcomes, simply because of the nature of its openness. While other studies have found
improved learning outcomes associated with OER, these competing results suggest that OER are
not a magic bullet for improving student learning. To the extent that some adoption instances of
OER lead to positive learning outcomes and others lead to negative, this finding could be seen as
a piece of evidence that OER adoption may not necessarily consistently affect student
achievement positively or negatively. This conclusion was tentatively supported by the existence
of a statistically significant negative effect in the omnibus analysis that manifest itself as two
courses with significant negative effects in the course-level analysis; the other five courses had
no significant effect.
This pattern, while reversed in the direction of the effect, mirrored the pattern found by
Robinson et al. (2014) which found a significant positive effect of OER in an omnibus analysis
61
of secondary school science textbooks, but found that this result was isolated to chemistry
students, while biology and earth systems students showed no significant difference.
The second key finding was that students who used OER enrolled in a significantly
higher number of courses in the semester than students who used traditional textbooks. This
finding aligns with theory, which suggests that cost is a barrier to students’ enrollment intensity
and that students who save money on textbooks can use that money to enroll in more courses.
While OER researchers have hypothesized that this is a possibility (see Hilton et al., 2014), this
is the first study that actually observed a significant difference in student enrollment for students
whose instructors adopted OER. The difference between the two groups is relatively small (only
.27 credits with a standardized beta of .03), but this result would indicate that for some students,
being relieved of the burden of textbook cost has a significant positive effect in the ability to
pursue the desired number of courses. PSM matched groups helps to mitigate the chances that
this difference is an artifact of systematic differences in the treatment and control groups.
Coupled with the inclusion of relevant covariates, this result is doubly-robust, in that student
demographics, institution, and course, which are still imperfectly balanced across groups, are
included as covariates in the OLS model. The overall model 𝑅𝑅2 of .32 suggests that the observed
covariates account for a reasonable amount of the variation in student enrollment.
An increase in student enrollment is a highly desirable outcome for many students,
schools, and policy makers. Increased enrollment is an income generator for colleges. Students
who enroll in more courses can accelerate their academic progress, and increase the likelihood of
persistence and graduation (Calcagno, Crosta, Bailey, & Jenkins, 2007).
Consequentially, instructors and administrators considering the adoption of OER might
interpret and weigh these results differently depending on what outcomes they most value for

62
their students. For example, some decision makers might find the tradeoff between grades and
enrollment intensity a strong incentive to avoid OER adoption, while others might weight find
the utilitarian calculus a compelling reason to pursue expanded OER adoption.
Limitations
This research study has serious limitations and threats to the internal and external validity
of its findings. These limitations should be considered when evaluating the findings and
interpreting the results.
The first category of limitations involves limitations inherent in the dataset that threaten
the statistical-conclusion validity of the findings. The seven reporting institutions did not
consistently report important information that would have made more appropriate modeling of
the data possible. For example, the data is multiple-membership (MM), which means that some
students appear more than once in the dataset. However, because we asked for the data to be de-
identified, some of the institutions did not report unique student identifiers for their students. As
a result, I chose to analyze models that did not consider the MM structure of the data. However,
the cost of including all available cases in the data was the likely violation of one of the main
assumptions of OLS and logistic regression, statistical independence of errors (Allison, 1999).
Violation of this assumption may have produced biased estimates of standard errors and
significance tests. This provides a strong reason to interpret these results with caution.
Another important feature of the data is that it naturally has a hierarchical structure,
which was not considered in the models for this study. Students were nested in sections of
courses which were taught at different institutions by different teachers. Because the total
number of courses and institutions were so small (seven of each) it was not appropriate to
include these as higher-order variables in a hierarchical linear model. These variables were

63
included in the OLS and logistic regressions as categorical covariates, which used a single-level
logic while still accounting for variation due to student aggregation in these groups. However, it
would have been appropriate to model course sections and teachers had that data been available.
However, this data was not available in this dataset. As a result, some of the variance in the
outcome variables was due to student enrollments in particular sections or being taught by
particular teachers. Due to this lack of data, the models used did not make explicit the true nature
of the data. This failure to properly model hierarchical data can lead to incorrect standard errors,
and, by extension, hypothesis tests (Heck & Thomas, 2000). This threatens the statistical
conclusion validity of these results. This may be particularly true in the case of the outcome
variable “grades” due to the fact that grades are assigned by individual teachers, and I would
expect to see intra-teacher variation be less than inter-teacher variation.
Another threat to the validity of these findings stems from the covariate selection.
Although I was able to control for several course- and student-level variables in this study, the
list of covariates was not exhaustive. In fact, I have theoretical and statistical reasons to believe
that important unobserved covariates were omitted from both the propensity score models and
the analysis models. The most important example is that the models did not include a clear
measure of student prior achievement or academic achievement, even though theory suggests
that student achievement and ability covariates may be the single largest contributor to variance
in academic achievement. The absence of this and other theoretical variables of interest was
likely a primary factor in the low multiple 𝑅𝑅2 values, which for the grades models ranged from
.06 to .16. Lacking these measures of student ability and prior achievement present a major threat
to the internal validity of these findings. Different student ability across groups could explain any
observed differences.
64
The use of PSM was intended to reduce threats to internal validity by making groups
equal in expectation. PSM can approximate the unbiased assignment to treatment condition that
makes random assignment such a powerful research design; however, this is only true to the
extent that relevant covariates are included in the models used to compute propensity scores.
While the model did include student variables that may be weakly correlated with empirical
educational attainment outcomes (Pell Grant eligibility, GED attainment, high school diploma,
and gender, for example), it did not include variables which were more highly correlated with
student achievement like prior GPA or entrance exam scores. Even though I improved the
balance of the treatment and control groups on relevant available covariates, the exclusion of
other covariates in PSM modeling and the analysis models provides ample reason to express
caution in accepting the results as proof of causality in observed differences across treatment
condition.
Finally, it should be noted that this study has external validity limitations for multiple
reasons. First, the colleges sampled for the study were not randomly chosen. Colleges self-
selected and tend to represent a small subsection of all post-secondary institutions. Six of the
seven colleges are community colleges, for example. While the locations range from New York
(Mercy College) to California (Tompkins Cortland Community College, Santa Ana Community
College, Santiago Community College), the geographical distribution is far from representative.
The seven courses in the study are all commonly taught general education courses, but they
represent a small sample of all potential courses that could use OER for textbook replacement.
The OER selected for each course represents one variation or permutation of all available OER
which could hypothetically be used for that course. The open nature of these resources means
that the available pool of resources is in a constant state of flux. Consequentially, observed

65
differences learning outcomes for any one course should not be seen as a static interaction
between that course material and all OER, even if differences across treatment groups could be
solely attributed to the chosen curriculum. For example, even though OER students performed
significantly worse on average than the control group for business, use of different business OER
might have produced a different result.
Even more specifically, the OER curriculum used in the seven PK courses across the
seven early-adopting institutions was specifically curated by external cooperating staff as part of
the grant funding for the PK pilot. This funding paid for the work that included curating and
vetting OER that could be used across institutions and training instructors on how to use the
curated OER. While this external funding and support mechanism was instrumental in
facilitating the widespread adoption of OER that made this study possible, it is far from the
normal adoption scenario for many, if not most, OER adopting instructors and institutions do so
in a much less coordinated environment with much less external support. So in this sense, Project
Kaleidoscope’s external involvement serves to confound explanations of observed differences in
student outcomes. It is impossible to differentiate between differences caused by OER and
differences caused by PK’s influence over the instantiation of OER. This provides one more
reason to avoid assuming that the observed results are generalizable to instances of OER
adoption that take place in other specific learning contexts.
Conclusions and Implications for Future Research
In many ways, the threats to external validity discussed above are inextricably tied to all
studies of the effect of OER on student educational outcomes: because OER by their very nature
provide that they can be freely reused, revised, remixed, and redistributed, it is highly unlikely
that any two classes will use the same OER, even if the core subject is the same. The very

66
flexibility of OER means that educators can reimagine the ways that curricular materials are used
in the classroom in ways that are made less likely by the rigidity of the traditional textbook.
While some OER creators (like OpenStax) merely replicate the textbook format, others abandon
the structure of textbooks for more flexible, modular approaches to curriculum delivery. Because
many OER are distributed electronically, they can easily include non-print open components. As
OER continue to evolve, research comparing OER to textbooks users will likely become more
and more complicated, calling for more nuanced research design.
The extreme variability in OER may partially explain why this study indicates lower
student grades associated with free curriculum, while other studies have shown improved
outcomes. OER will vary in delivery mechanism, sequencing, source material, visual aesthetic,
and other key ways. In this study, I attempted to answer questions about the effects of OER
adoption on student academic outcomes. My results suggest that in the particular case of PK
early adopters, OER on average marginally lowered student grades while marginally increasing
student enrollment intensity. Other studies show increased student learning outcomes as
measured by pass-rates (Hilton et al., 2013) or standardized tests (Robinson et al., 2014). These
seemingly conflicting results might suggest that the influence of OER on student learning may be
a product of more complexity than the simple dichotomous decision to use or not use OER in a
classroom setting.
This is not to say that student learning outcomes should not be used to evaluate the
quality of OER. To the contrary, these findings highlight just how important it is to consider
student learning as a key indicator of OER quality. Bliss, Robinson, Hilton, and Wiley (2013)
surveyed a sample of students and instructors from the PK pilot and found that most respondents
perceived their OER to be at least as high in quality as traditional textbooks, a finding arguably

67
challenged by a quantitative analysis of the data. A careful analysis of outcome data may provide
insight that subjective reports of perceptions of quality cannot accurately access. For this reason,
I continue to endorse complementing qualitative quality research with outcomes-based
quantitative approaches to understanding OER and its place in educational spaces.
But if research studies continue to paint a mixed picture of the effect of OER on student
learning, we might not be surprised. In the case that this indeed happens, educators may continue
to find this general quasi-experimental approach to understanding OER quality helpful, but less
so as an examination on the global effects of OER and more so as a tool in program evaluation.
If it is indeed the case that student performance might improve or decline depending less on the
choice of OER versus publisher-produced textbooks and more on the particular instantiations of
open or closed curriculum, then this approach would naturally evolve to an evaluation rather than
research approach.
It is my hope that future research will improve upon this study by collecting data that
controls for differences in aptitude or prior achievement, as this is a key predictor of student
learning outcomes. Future studies should also collect data in ways that will facilitate modeling of
multi-level data structures and multiple-membership in the model.
The increased enrollment intensity observed for OER users is one result that might not be
as volatile contingent on the quality of OER. If the cost savings associated with OER is
substantial enough that it provides access to more courses for students who would otherwise not
be able to afford it, this result might reasonably be expected to hold true across multiple subjects
and differing quality of OER. Triangulating this finding in future studies could be a key piece of
evidence that OER adoption can significantly benefit the educational experience of students as a
direct byproduct of its openness. Future research should also explore whether observed effects on
68
enrollment intensity are additive, or in other words, increase as students enroll in multiple OER
courses in the same or consecutive semesters. Additionally, future research should explore in
longitudinal studies whether changes in enrollment intensity due to OER adoption can
significantly affect future enrollment, or possible success markers like graduation.
69
References
Abeywardena, I. S., Raviraja, S., & Tham, C. Y. (2012). Conceptual framework for
parametrically measuring the desirability of open educational resources using D-
index. The International Review of Research in Open and Distance Learning, 13(2), 59-
76.
Allison, P. D. (1999). Multiple regression: A primer. Thousand Oaks, CA: Pine Forge Press.
Austin, P. (2011). An introduction to propensity score methods for reducing the effects of
confounding in observational studies. Multivariate Behavioral Research, 46, 399-424.
Bacon, D. R., & Bean, B. (2006). GPA in research studies: An invaluable but neglected
opportunity. Journal of Marketing Education, 28(1), 35-42.
Berry, T., Cook, L., Hill, N., & Stevens, K. (2010). An exploratory analysis of textbook usage
and study habits: Misperceptions and barriers to success. College Teaching, 59(1), 31-39.
Bliss, T., Hilton III, J., Wiley, D., & Thanos, K. (2013). The cost and quality of online open
textbooks: Perceptions of community college faculty and students. First Monday, 18(1).
Retrieved from http://firstmonday.org/ojs/index.php/fm/article/view/3972/3383
Bliss, T., Robinson, T. J., Hilton, J., & Wiley, D. A. (2013). An OER COUP: College teacher
and student perceptions of open educational resources. Journal of Interactive Media in
Education, 2013(1). Retrieved from http://jime.open.ac.uk/article/view/2013-04/470
Buczynski, J. A. (2007). Faculty begin to replace textbooks with “freely” accessible online
resources. Internet Reference Services Quarterly, 11, 169-179.
Calcagno, J. C., Crosta, P., Bailey, T., & Jenkins, D. (2007). Stepping stones to a degree: The
impact of enrollment pathways and milestones on community college student
outcomes. Research in Higher Education, 48, 775-801.
70
Chamberlin, M. T., & Powers, R. A. (2007). Selecting from three curricula for a preservice
elementary teacher geometry course. Issues in the Undergraduate Mathematics
Preparation of School Teachers, 4. Retrieved from http://www.k-
12prep.math.ttu.edu/journal/4.curriculum/chamberlin/article.pdf
Clements, K. I., & Pawlowski, J. M. (2012). User‐oriented quality for OER: Understanding
teachers' views on re‐use, quality, and trust. Journal of Computer Assisted
Learning, 28(1), 4-14.
d’Agostino, R. B. (1998). Tutorial in biostatistics: Propensity score methods for bias reduction in
the comparison of a treatment to a non-randomized control group. Stat Med, 17, 2265-
2281.
D’Antoni, S. (2009). Open educational resources: Reviewing initiatives and issues. Open
Learning: The Journal of Open and Distance Learning, 24, 3–10.
Dempster, A. P., Laird, N. M., & Rubin, D. B. (1977). Maximum likelihood from incomplete
data via the EM algorithm. Journal of the Royal Statistical Society. Series B, 1-38.
Dickson, K. L., Miller, M. D., & Devoley, M. S. (2005). Effect of textbook study guides on
student performance in introductory psychology. Teaching of Psychology, 32(1), 34-39.
Farragher, P., & Yore, L. D. (1997). The effects of embedded monitoring and regulating devices
on the achievement of high school students learning science from text. School Science
and Mathematics, 97, 87-95.
Guo, S., & Fraser, M.W. (2010). Propensity score analysis: Statistical methods and
applications. Thousand Oaks, CA: SAGE.
Gurung, R. A. (2003). Pedagogical aids and student performance. Teaching of Psychology, 30,
92-95.

71
Guthrie, J. (2011). Christian-published textbooks and the preparation of teens for the rigors of
college science courses. Journal of Research on Christian Education, 20(1), 46-72.
Heck, R. H., & Thomas, S. L. (2000). An introduction to multilevel modeling techniques.
Mahwah, NJ: Erlbaum.
Heyneman, S. P., Farrell, J. P., & Sepulveda‐Stuardo, M. A. (1981). Textbooks and achievement
in developing countries: What we know. Journal of Curriculum Studies, 13, 227-246.
Hilton III, J. L., Gaudet, D., Clark, P., Robinson, J., & Wiley, D. (2013). The adoption of open
educational resources by one community college math department. The International
Review of Research in Open and Distributed Learning, 14(4). Retrieved from
http://www.irrodl.org/index.php/irrodl/article/view/1523/2652
Hilton III, J., & Laman, C. (2012). One college’s use of an open psychology textbook. Open
Learning: The Journal of Open, Distance and e-Learning, 27, 265-272.
Hilton III, J. L., Robinson, T. J., Wiley, D., & Ackerman, J. D. (2014). Cost-savings achieved in
two semesters through the adoption of open educational resources. The International
Review of Research in Open and Distributed Learning, 15(2). Retrieved from
http://www.irrodl.org/index.php/irrodl/article/view/1700
Hilton III, J., Wiley, D., Stein, J., & Johnson, A. (2010). The four ‘R’s of openness and ALMS
analysis: Frameworks for open educational resources. Open Learning, 25(1), 37-44.
Keith, T. Z. (2006). Multiple Regression and Beyond. Boston, MA: Pearson.
Lave, J., & Wenger, E. (1991). Situated learning: Legitimate peripheral participation. Boston,
MA: Cambridge university press.
Luellen, J. K., Shadish, W. R., & Clark, M. H. (2005). Propensity scores: An introduction and
experimental test. Evaluation Review, 29, 530-558.

72
Luik, P., & Mikk, J. (2008). What is important in electronic textbooks for students of different
achievement levels? Computers & Education, 50, 1483-1494.
McCrudden, M., Schraw, G., Hartley, K., & Kenneth, A. K. (2004). The influence of
presentation, organization, and example context on text learning. The Journal of
Experimental Education, 72, 289-306.
Nikoi, S., & Armellini, A. (2012). The OER mix in higher education: Purpose, process, product,
and policy. Distance Education, 33, 165-184.
Nikoi, S. K., Rowlett, T., Armellini, A., & Witthaus, G. (2011). CORRE: A framework for
evaluating and transforming teaching materials into open educational resources. Open
Learning: The Journal of Open, Distance and e-Learning, 26, 191-207.
Petrides, L., & Jimes, C. (2008). Building open educational resources from the ground up: South
Africa's free high school science texts. Journal of Interactive Media in
Education, 2008(1), 1-7.
Phillips, S. E., & Mehrens, W. A. (1988). Effects of curricular differences on achievement test
data at item and objective levels. Applied Measurement in Education, 1(1), 33-51.
Porter, S. R., Rumann, C., & Pontius, J. (2011). The validity of student engagement survey
questions: Can we accurately measure academic challenge? New Directions for
Institutional Research, 2011(150), 87-98.
Pyne, D. (2007). Does the choice of introductory microeconomics textbook matter? The Journal
of Economic Education, 38, 279-296.
Robinson, T. J., Fischer, L., Wiley, D., & Hilton, J. (2014). The impact of open textbooks on
secondary science learning outcomes. Educational Researcher, 43, 341-351.

73
Rosenbaum, P. R., & Rubin, D. B. (1985). Constructing a control group using multivariate
matched sampling methods that incorporate the propensity score. The American
Statistician, 39(1), 33-38.
Shadish, W. R., Cook, T. D., & Campbell, D. T. (2002). Experimental and quasi-experimental
designs for generalized causal inference. Boston, MA: Houghton Mifflin.
Slavin, R. E., & Lake, C. (2008). Effective programs in elementary mathematics: A best-
evidence synthesis. Review of Educational Research, 78, 427-515.
Stratton, G. (2011). Does increasing textbook portability increase reading rates or academic
performance? Inquiry, 16(1), 5-16.
Usdan, J., & Gottheimer, J. (2012, February 3). FCC chairman: Digital textbooks to all students
in five years [Blog post]. Retrieved from http://www.fcc.gov/blog/fcc-chairman-digital-
textbooks-all-students-five-years
U.S. Government Accountability Office. (2005). College textbooks: Enhanced offerings appear
to drive recent price increases (Report to Congressional Requesters No. GAO 05-
806).Washington, DC: U.S. Government Accountability Office.
Wiley, D. (2009). Openness, disaggregation, and the future of schools. TechTrends, 53(4), 37.
Wiley, D., Green, C., & Soares, L. (2012). Dramatically bringing down the cost of education
with OER: How open education resources unlock the door to free learning. Center for
American Progress. Retrieved from
http://www.americanprogress.org/issues/labor/news/2012/02/07/11167/dramatically-
bringing-down-the-cost-of-education-with-oer/

74
Zucker, T. A., Moody, A. K., & McKenna, M. C. (2009). The effects of electronic books on pre-
kindergarten-to-grade 5 students' literacy and language outcomes: A research
synthesis. Journal of Educational Computing Research, 40(1), 47-87.