the effects of native american gaming on other … · introduction of nag has had on non-nag...
TRANSCRIPT

The Effects of Native American Gaming
on Other Tourist Businesses
Carl A. Boger, Jr., Ph.D. Department of Hospitality & Tourism
University of Wisconsin - Stout
Abstract
Native American gaming (NAG) has increased significantly over the Last several years since its Legalization in I988. Currently there are I70 Native American tribes that have some form of gaming. It has been estimated that NAG has become a 2 billion dollar industry for many states. In the next several years it could become one of the Largest industry throughout the United States. The overall impact of NAG has not been thoroughly studied due to its recent Legalization. This study examined the impact that the introduction of NAG has had on non-NAG businesses at a Wisconsin tourist destination area. Key Words: Native American gaming, economic impact, tourism, and growth.
Introduction
Acceptance of Gaming All fifty states, except for Utah and Hawaii, have some form of legalized gaming
(Fleur & Hevener, 1992). In 1993 there were 47 states that offered bingo, 43 offered parimutuel betting, 35 offered a lottery, 25 offered NAG, and 6 have legalized riverboat casinos (Vallen, 1993). State lotteries are examples of how state legislators have legalized gaming
States' budgetary shortfalls were the primary catalyst for legislators legalizing gaming activities in the 1980s and 90s.
across the country. Thirty years ago state lotteries did not exist and today there are 35 with a national lottery purse exceeding $20 billion annually.
Vallen (1993) reported that states' budgetary shortfalls were the primary catalyst for legislators legalizing gaming activities in the 1980s and 90s. In fact 38 states had to reduce their budgetary expenditures in 1983. Eleven years later this situation has not changed for many states. The demand for state revenues,
without increasing or introducing new taxes, have provided the foundation for the expansion of gaming throughout the United States (National Indian Gaming Law Helps Spread Gambling, 1991 ).
Gaming Research & Review Journal- Volume 1, Issue 2- 1994 25
Gambling is now considered a "slightly sinful indulgence" and is perceived as an "extension of the middle-class weekend outing." The commerce of gaming is considered a part of the "recreation business" and is no longer considered a corrupt enterprise (Painton, 1993). Vallen (1993) also found that the acceptance of gaming is due to the exposure of NAG. More than 170 tribes in the United States are involved in operating NAG enterprises.
Feldman (1992) found that 68 percent of Americans supported NAG and 28 percent did not support it. The study also found that 51 percent of Americans supported other forms of gaming which were regulated by the states. The economic base provided to the Native Americans through gaming was the primary reason cited by Americans who supported NAG.
Native American Gaming Indian Gaming Regulatory Act (IGRA), which became effective in October 1988,
gave Native American tribes the right to establish NAG enterprises on their own reservations in those states that do not expressly prohibit gaming or allow class-3 gaming activities. Class-3 gaming includes state lotteries, pari-mutuel wagering, horse and greyhound racing, banking-card games, slot machines, casino games, and jai alai.
The location of NAG facilities is not restricted to the reservations' current land holdings. The United State's Secretary of the Interior has broad discretionary authority to accept land in trust for Native American individuals and tribes within or outside the existing reservation boundaries (Staff, 1991). This is due to many reservations being located on lands that are not economically suited to build any meaningful economic enterprises.
NAG within the State of Wisconsin has dramatically increased in the last several years. There were only two NAG facilities between 1985 and 1989 which have since increased to 17 in 1994. While the growth in the number of facilities is evident, specific information on other growth indicators, such as a facility's revenue and income are not publicly disclosed. Within the NAG compact between the Native American tribes in Wisconsin and the State of Wisconsin, the state promises that the Native American records related to NAG "will not be disclosed to any member of the public except as needed in a judicial proceeding to interpret or enforce the terms of this compact."
Therefore, figures found in the Nation's Restaurant News had to be used to estimate the size of NAG in the State of Wisconsin. The average Wisconsin NAG facility is grossing approximately 125 million dollars a year which represents a 2.1 billion dollar industry (Walkup, 1993). Murray (1992) found that the average NAG visitor will spend approximately $50 dollars per visit; and the total number of visitors at each location will exceed 2.5 million people per year.
Murray (1993) also found that the impact of Wisconsin's NAG industry benefited both the Native and non-Native American residents. By the end of 1992, there were more than 4,500 people directly employed by the NAG facilities in Wisconsin. Over half (2,500) were Native Americans and the rest (2,000) were non-Native Americans. More than half of these 4,500 workers were formerly unemployed with 20 percent receiving some form of welfare benefits. The typical NAG employee received approximately $15,000 per year in 1992 with two-thirds of the employees being the sole financial supporter for their household.
Murray (1993) found that eleven Native American communities in Wisconsin received about $135 million in net profits from the NAG operations in 1992. Out of these dollars, 70 percent were spent on housing, health services, elderly care, community and economic development, education, and land purchases. Thirty percent were being held in reserve as these Native American communities developed long-range plans to diversify their economies.
The Wisconsin economy also has benefited through the expansion of NAG. Nearly $462 million dollars were spent on a variety of goods and services with 90 percent of these dollars being spent through Wisconsin suppliers. More than 10,000 jobs were supported directly by the NAG industry. These jobs included workers being employed at the NAG
26 Gaming Research & Review Journal- Volume 1, Issue 2 - /994

The Effects of Native American Gaming on Other Tourist Businesses
facilities, construction firms, and firms making non-NAG sales to NAG visitors in 1992. An additional 22,000 jobs were supported throughout Wisconsin by the income being recirculated by these companies. The dollars generated to pay for these expenditures came from both Wisconsin (80%) and out-of-state residents (20%) that patronized these NAG facilities.
The social problems, gambling addictions, stress on the local and state's infrastructures and other problems created by the introduction of NAG was not examined within this study. Instead the study focused on the problems created for non-NAG businesses surrounding a NAG facility. A concern expressed by the hospitality industry was that these NAG facilities were subsidizing their restaurant and lodging operations which allowed them to lower their food and lodging prices (Walkup, 1993). An example of this is how two NAG facilities in Minnesota, The Grand Casino Hinckley and Grand Casino Mille Lacs, discounted or subsidized menu items for their visitors. Another Minnesota NAG facility, Mytic Lake, grossed approximately 1.9 million dollars of revenues from their buffets in their first six months of operation. Walkup found that the NAG food service
Indian Gaming Regulatory Act (IGRA), which became effective in October 1988, gave Native American tribes the right to establish NAG enterprises on their own reservations.
establishments were harming the nonNAG food service businesses within the area.
Walkup also reported that NAG facilities do not pay any taxes on their income which places an unfair burden on the non-NAG businesses. By not having to pay any property taxes, sales taxes, corporate income taxes and state income taxes (by Native Americans living on the reservation),
the Minnesota hospitality industry believes that these advantages have caused an unfair playing field which may force many non-NAG operators out of business. Meyer (1993) reported that nearly 38 percent of Minnesota Restaurants, Hotels and Resorts Association Members have lost business since the opening of NAG facilities. Seventy percent of the members felt that NAG was the primary reason for a decrease in their sales revenues. The negative impact on other types of businesses in Minnesota or Wisconsin has not been thoroughly examined since the introduction of NAG.
Marketing Tourism Destinations The marketing of tourist destinations have been thoroughly discussed throughout
the literature; however, the effects of NAG at a tourist destination has not been thoroughly discussed. A conceptual framework developed by Vandermey (1984) identified eight sectors in a tourist destination area: 1) transportation, 2) events and attractions, 3) outdoor recreation and parks, 4) business and conference, 5) travel services, 6) retail trade, 7) hospitality and, 8) accommodation; however, these eight sectors did not include gaming as an independent sector. It could be argued that events and attractions could include gaming, but the economic impact and specificity of gaming suggest that it should be identified as a separate sector.
Another area concerning the introduction of NAG in a tourist destination was whether or not it will enhance, compete with or destroy the current sectors within the area. Mill & Morrison (1985) identified that the introduction of a new sector (NAG) may enhance the appeal of the area by increasing the market segmentation. However, if visitors patronize a new sector as a substitute for others, it may negatively affect the other sectors.
Gaming Research & Review Journal- Volume 1, Issue 2- 1994 27

The location of a NAG facility may also play a vital role in its success and impact on other sectors' businesses. The spatial placement of a NAG facility can either compliment or compete with the other sectors' businesses (Lue, Crompton, & Fesenmaier, 1993). However, Gunn (1994) found that if the layout is not strategically placed, the flow of tourists could be severely limited which may reduce the economic impact from tourism.
In summary NAG has been found to have both positive and negative effects on nonNAG businesses. A closer examination is needed to determine exactly when NAG will have both positive and negative effects on non-NAG businesses. This should allow businesses to be prepared for the consequences of NAG being introduced into their area.
Methodology
A goal of the research study was to obtain information concerning the impact that a NAG facility had on non-NAG sectors' businesses in a tourist destination area. The area selected for the study is located in Wisconsin with nearly 3 million visitors annually. This location was selected because NAG was introduced one year prior to the study being conducted. The non-NAG sectors examined included: a) events and attractions, b) outdoor recreation and parks, c) retail trade, d) hospitality, and e) accommodation. A further clarification is also needed of how these different sectors were defined within this research study: a) "events and attractions" were defined as "amusement places," b) "outdoor recreation and parks" as "RV parks and campgrounds," c) "retail trade" as "gift shops," d) "hospitality" as "restaurants," and e) "accommodation" as "hotels and motels." Rational for utilizing these new terms was that the businesses selected for the study were found in the local phone book directory under these new terms. Twenty businesses were randomly selected in each of these sectors for a total population sample size of 100 businesses.
A questionnaire was developed to gather information through phone interviews with the different businesses' repre-
A goal of the research study was to obtain information concerning the impact that a NAG facility had on non-NAG sectors' businesses in a tourist destination area.
sentatives. The owner, manager or lead employee were interviewed for this research study. The definition of a lead employee was an employee who had worked for at least two years at a location. Follow-up calls were made until a business representative either agreed or asked not to be a part of the research study.
Results
Spatial Relationship The spatial relationship between the NAG facility and the other businesses within
the area resembled a model developed by Lue, Crompton, and Fesenmaier ( 1993). Figure I compares the spatial relationship of the NAG and the other businesses within the area. NAG facility is located approximately 3 miles and on the opposite side of the interstate from the majority of the other tourist businesses. This allowed the NAG tourists not to interfere with those who were visiting the other non-NAG businesses.
28 Gaming Research & Review Journal- Volume 1, Issue 2 - 1994

The Effects of Native American Gaming on Other Tourist Businesses
Figure 1 Spatial Relationship Between the NAG and Non-NAG Zones
c:::;, Non-NAG Zone j,,,,,,,,,,, NAG Zone - Interstate
Highway
Scale: 3 miles = 1 inch
The location of the NAG business may also protect the other tourist businesses by not being a closer competitor. Currently there are very limited number of businesses located near the NAG facility. This may cause NAG visitors to utilize non-NAG facilities, such as restaurants, hotels and other supportive services.
Demographics Overall, eighty-two percent (n = 82) of the businesses agreed to be interviewed for
this study. By business sector 75 percent (n = 15) of the amusement places agreed to be interviewed, 85 percent (n = 17) of the restaurants, 85 percent (n = 17) of the gift shops, 85 percent (n = 17) of the RV parks and campgrounds, and 80 percent (n = 16) of the hotels and motels. A high response rate for this research study should enhance its overall validity. Babbie (1986) stated that an overall response rate of 80 percent should be considered very good for survey research. This high response rate is due to repeated contacts with those businesses who initially did not respond to the survey.
The respondents' titles included owner (36.6%, n = 30), manager (45.1%, n = 37) and lead employee (18.3%, n = 15). The owner or manager were not always available to be interviewed; therefore, the lead employee was interviewed in those cases. Several lead employees indicated that "the owner or manager was responsible for many different businesses within the area and is only there on a limited basis" or "the owner has a different full-time job."
Gaming Research & Review Journal- Volume 1, Issue 2 -1994 29
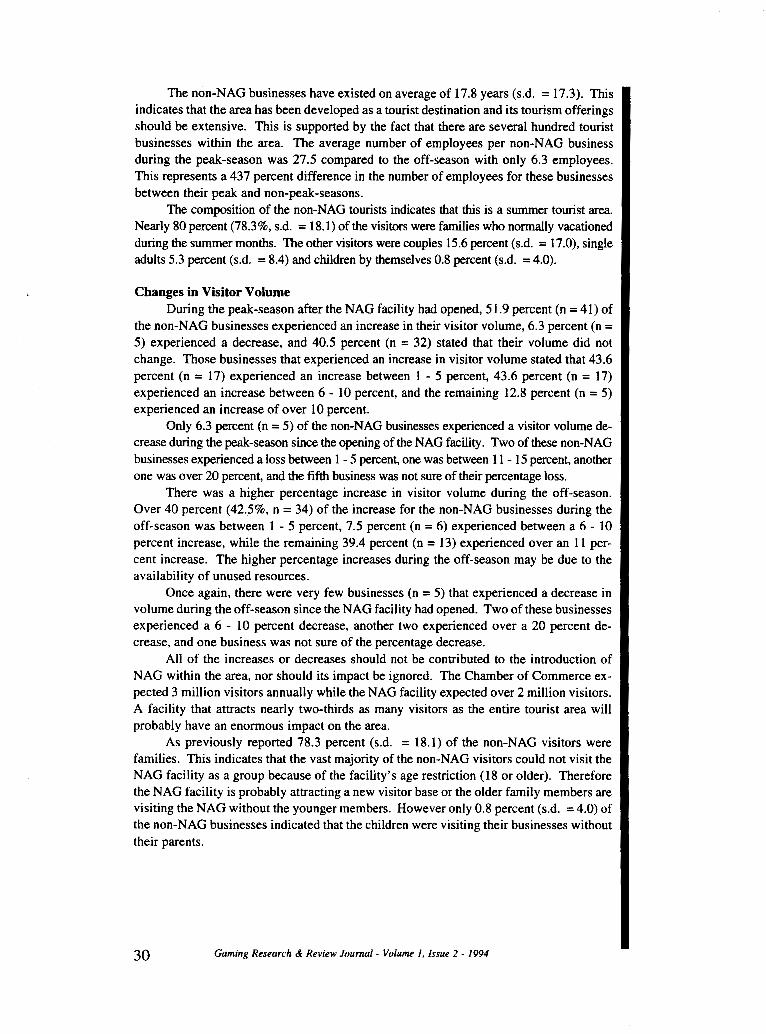
The non-NAG businesses have existed on average of 17.8 years (s.d. = 17.3). This indicates that the area has been developed as a tourist destination and its tourism offerings should be extensive. This is supported by the fact that there are several hundred tourist businesses within the area. The average number of employees per non-NAG business during the peak-season was 27.5 compared to the off-season with only 6.3 employees. This represents a 437 percent difference in the number of employees for these businesses between their peak and non-peak-seasons.
The composition of the non-NAG tourists indicates that this is a summer tourist area. Nearly 80 percent (78.3%, s.d. = 18.1) of the visitors were families who normally vacationed during the summer months. The other visitors were couples 15.6 percent (s.d. = 17.0), single adults 5.3 percent (s.d. = 8.4) and children by themselves 0.8 percent (s.d. = 4.0).
Changes in Visitor Volume During the peak-season after the NAG facility had opened, 51.9 percent (n = 41) of
the non-NAG businesses experienced an increase in their visitor volume, 6.3 percent (n = 5) experienced a decrease, and 40.5 percent (n = 32) stated that their volume did not change. Those businesses that experienced an increase in visitor volume stated that 43.6 percent (n = 17) experienced an increase between 1 - 5 percent, 43.6 percent (n = 17) experienced an increase between 6- 10 percent, and the remaining 12.8 percent (n = 5) experienced an increase of over 10 percent.
Only 6.3 percent (n = 5) of the non-NAG businesses experienced a visitor volume decrease during the peak-season since the opening of the NAG facility. Two of these non-NAG businesses experienced a loss between 1 - 5 percent, one was between 11 - 15 percent, another one was over 20 percent, and the fifth business was not sure of their percentage loss.
There was a higher percentage increase in visitor volume during the off-season. Over 40 percent (42.5%, n = 34) of the increase for the non-NAG businesses during the off-season was between 1 - 5 percent, 7.5 percent (n = 6) experienced between a 6- 10 percent increase, while the remaining 39.4 percent (n = 13) experienced over an 11 percent increase. The higher percentage increases during the off-season may be due to the availability of unused resources.
Once again, there were very few businesses (n = 5) that experienced a decrease in volume during the off-season since the NAG facility had opened. Two of these businesses experienced a 6 - 10 percent decrease, another two experienced over a 20 percent decrease, and one business was not sure of the percentage decrease.
All of the increases or decreases should not be contributed to the introduction of NAG within the area, nor should its impact be ignored. The Chamber of Commerce expected 3 million visitors annually while the NAG facility expected over 2 million visitors. A facility that attracts nearly two-thirds as many visitors as the entire tourist area will probably have an enormous impact on the area.
As previously reported 78.3 percent (s.d. = 18.1) of the non-NAG visitors were families. This indicates that the vast majority of the non-NAG visitors could not visit the NAG facility as a group because ofthe facility's age restriction (18 or older). Therefore the NAG facility is probably attracting a new visitor base or the older family members are visiting the NAG without the younger members. However only 0.8 percent (s.d. = 4.0) of the non-NAG businesses indicated that the children were visiting their businesses without their parents.
30 Gaming Research & Review Journal- Volume 1, Issue 2- 1994

The Effects of Native American Gaming on Other Tourist Businesses
Labor Market Fifty-four point nine percent (n = 45) of the respondents reported that the labor
market has become tighter since the introduction of NAG. Another 45.1 percent (n = 37) stated that they had to increase their pay-scale to attract new employees on an average of $0.40 per hour (s.d. = .40). This finding is supported by the fact that the NAG facility has over 800 people employed compared to the 27.5 for the average non-NAG business.
A year-to-year comparison shows some dramatic differences before and after the opening of the NAG facility. In May of 1993 (prior to the opening of the NAG facility), the two primary counties that comprised the majority of the tourist destination area had 51,272 people employed and 3251 unemployed with an unemployment rate of 6.2 percent. One year later after the NAG had opened, 1249 more people became employed and the unemployment rate decreased to 4.9 percent. This indicates that the NAG facility may have contributed to the decrease of unemployment within the area. This was also supported by the fact that there were no large employers moving into the area since the opening of the NAG facility.
Figure 2 shows how the unemployment rate changed in 1992, 1993 and part of 1994 for the county that contained the tourist area. For the past three years, the unemployment rate increased between 5 and 9 percent during the off-season, and then decreased to less than 5 percent during the peak-season. The respondents were also very concerned about the quality of the available labor force. As one respondent stated, "At what point will the unemployed only contain the unemployable."
Unemployment Rate
9
8
7
6
5
4
3
2
Figure 2 Unemployment Rate
-+-1994
-----1993
0~======~-----------------Jan Feb Mar Apr May Jun Jul Aug Sept Oct Nov Dec
Source: State of Wisconsin's Labor Market Information Bureau
Support for Gaming Table 1 shows that 47.6 percent (n = 39) of the respondents supported NAG within
the area, 17.1 percent (n = 14) were opposed, and 35.4 percent (n = 29) stated that they did not care one way or the other. This indicates that the opposition to NAG within this tourist area is minimal because 82.9 percent (n = 68) of the respondents were not opposed to NAG while 17.1 (n = 14) percent opposed it. However these numbers changed very rapidly when the respondents were asked if they would support the expansion of gaming within the area. Only 20.7 percent ( n = 17) of the respondents supported the expansion of
Gaming Research & Review Journal- Volume 1, Issue 2- 1994 31

w N
Table 1
c;"l Support for Gaming
"" l! s· "" ~ "' Support for Gaming ... "' "" <=! ;:to
R-~ Native American Gaming Expansion of Gaming "' .., ;;;· ~
(:;'
"' ~ Yes No Doesn't Total Yes No Doesn't Total
~ i:
Matter Matter
~ !-- Area n % n % n % nt_% n % n % D % nt_% ;:;;-... "' "' N
..... Type of businesses '0
~ Entertairunent 4 26.7 3 20.0 8 53.3 15/100.0 2 13.3 10 66.7 3 20.0 15/100.0
Gift Shops 14 82.4 3 17.7 0 0.0 al7/IOO.I 5 29.4 12 70.6 0 0.0 171100.0
Hotels/Motels 5 29.4 4 23.5 8 47.1 171100.0 2 11.8 10 58.8 5 29.4 171100.0
Restaurants 6 35.3 2 11.8 9 52.9 171100.0 5 29.4 4 23.5 8 47.1 171100.0
RV Parks/ 10 62.5 2 12.5 4 25.0 161100.0 3 18.8 8 50.0 5 31.3 al61100.1
Campgrounds
Total 39 47.5 14 17.1 29 35.4 17 20.7 44 53.7 21 25.6
Overall visitor volume
More 21 51.2 4 9.8 16 39.0 411100.0 6 14.6 22 53.7 13 31.7 411100.0
Less 2 40.0 2 40.0 I 20.0 51100.0 0 0.0 4 80.0 I 20.0 51100.0
About the same 13 40.6 7 21.9 12 37.5 521100.0 8 25.0 17 53.1 7 21.9 321100.0
Did not respond 0 0.0 I 100.0 0 0.0 11100.0 0 0.0 I 100.0 0 0.0 11100.0
• Error is due to rounding.

The Effects of Native American Gaming on Other Tourist Businesses
gaming, 53.7 percent (n = 44) opposed it and 25.6 percent (n = 21) did not care one way or the other. This indicates that the respondents accept the current NAG but would oppose the expansion of gaming.
When the businesses experienced an increase in volume after the opening of the NAG, 90.2 percent (n = 37) of the respondents were not opposed to NAG while 9.8 percent (n = 4) opposed it. However, these percentages changed drastically when these respondents were asked whether they would support the expansion of gaming within the area. Forty-six point three percent (n = 19) of these respondents were not opposed to the expansion of gaming while 53.7 percent (n = 22) opposed it.
The businesses that experienced a visitor volume decrease during the peak-season were not as supportive for NAG. Sixty percent (n = 3) of these respondents were not opposed to NAG while 40 percent (n = 2) opposed it. However, only 20 percent (n = 1) of the respondents stated that it did not matter if gaming was expanded within the area while 80 percent (n = 4) opposed any expansion. This indicates that the support for NAG is somewhat dependent on how it affects the other businesses within the area; however, the majority of the respondents did not oppose the current NAG no matter how their visitor volumes were affected. Finally, the majority of the respondents were not supportive of any expansion of gaming regardless of their visitor volumes.
Conclusion
The number of employees, gross sales, and the effects of tourists visiting the area demonstrate that gaming has become a legitimate sector within a tourist destination area. Therefore the Vandermey (1984) model should be modified to include gaming as a separate sector (Figure 3).
Figure 3 Conceptual Framework of Regional Tourism Resources
Gaming Research & Review Journal- Volume 1, issue 2- 1994 33

The placement of the NAG facility at this tourist destination area minimized the negative impact on the other non-NAG businesses. This is supported by the fact that the NAG facility is located in the opposite direction from the non-NAG businesses. Lue, Crompton, and Fesenmaier (1993) argued that the location of the different business sectors is essential to the overall success of a tourist destination area. The location of the NAG facility provided a spatial separation between the tourist visiting the NAG facility and those who where visiting the non-NAG businesses.
The research shows that over three-quarters (78.3%, s.d. = 18.1) of the non-NAG visitors were families. On the other hand, the NAG facility prohibits anyone under the age of eighteen to enter their facility. This supports the conclusion that the introduction of NAG has expanded the demographic market to include more non-family segments.
The introduction of NAG has probably enhanced the visitor volume during the peakseason. This is supported by the fact that 51.9 percent (n = 41) of the businesses experienced an increase while only 6.3 percent (n = 5) experienced a decrease. However, all of the increases during the peak-season should not be solely contributed to the introduction of NAG. Many of the non-NAG businesses, such as "duck rides" (a vehicle that travels on both land and water), "putt-putt", "water" attractions were very dependent on the weather. Also, the Local Chamber of Commerce has enhanced their marketing efforts to attract new tourists.
The off-season should give a better indication of the effects that NAG will have on a tourist area. This is due to the fact that there are unused tourist resources during the offseason which may not be available during the peak-season. Forty-two point five percent ( n = 34) of the businesses experienced an increase during the off-season in visitor volume. The fact that the NAG facility has joined the Chamber and designated their membership fee (approximately $150,000) for off-season marketing supports this conclusion.
Since the opening of the NAG facility, the labor market has become tighter which caused the non-NAG businesses to offer a higher pay scale. The 800 people employed at the NAG facility has probably affected the labor market; however, the labor shortage was only experienced during the months of July, August, September and October with an average unemployment rate of approximately 4 to 5 percent in 1993. The remaining 8 months had unemployment rates between 5 and 9 percent.
The vast majority (82.9%, n = 68) of the respondents were not opposed to the NAG facility within the area and only 17.1 percent (n = 14) opposed it. However, these figures changed drastically when the respondents were asked if they supported the expansion of gaming within the area. Less than half (46.3%, n = 38) did not opposed the expansion of gaming while the majority (53.7%, n = 44) were opposed to the idea. This indicates that currently there is a balance between the NAG and non-NAG businesses; however, the opposition to the expansion of gaming indicates that the respondents were concerned it might effect their businesses.
A final conclusion is that the introduction of NAG within the area has created a need for the development of supportive services and non-NAG businesses that would appeal to NAG visitors. The separation between the "non-NAG" and "NAG" zones provide the area with future economic growth potential. However, any expansion should be strategically planned otherwise there may be extreme opposition from the current non-NAG businesses.
34 Gaming Research & Review Journal- Volume 1, Issue 2- 1994

The Effects of Native American Gaming on Other Tourist Businesses
References
Babbie, E. (1986). FDuCATION RFsEAR.rn AND EvALUATION MEmoos. Boston: Uttle, Brown and Company.
Feldman, G.M. (1992). PuBLIC OPINJON STRONGLY SUPPORTS INDIAN GAMING. Washington, DC: Washington University National Indian Policy Center.
Fleur, T.L. & Hevener, P. (1992, September 15). Gaming at a glance. GAMING AND WAGERING BUSINESS, pp. 34-35.
Gunn, C.A. (1994). TOURISM PlANNING: BASICS CDNCEPrS CASES (3rd ed.). Washington, DC: Taylor & Francis.
Lue, C. C., Crompton, J.L., & Fesenmaier, D.R. (1993). Conceptualization of multi-destination pleasure trips. ANNALS OF TOURISM REsEARCH, 20,(2), 289-301.
Meyer, H. (1993). Indian Gaming: Is it out of control in Minnesota? HoSPITALITY MANAGEMENT, 12(1), pp. 34-38.
Mill, R.C. & Morrison, A.M. (1985). THE TOURIST SYSTEM: AN INTRODUCTORY TEXT. Englewood Cliffs: New Jersey. Prentice Hall.
Murray, J.M. (1993, March). THE EcONOMIC BENEFITS OF AMERICAN INDIAN GAMING FACILmES IN WISCONSIN. Madison, WI: The Wisconsin Indian Gaming Association and the University of Wisconsin Cooperative Extension.
Murray, J.M. (1992, March). AN ANALYSIS OF WISCONSIN AND U.S. GAMBLING MARKET AS IT RELATES TO THE IRENE MooRE ACTIVITY CENTER. Green-Bay, WI: University of Wisconsin Bureau of Business and Economic Research.
National Indian gaming law helps spread gambling. (1991, June 2). ARIZONA DAILY SuN, p. 19.
Painton, P. (I 993, May 3). The Great Casino Salesman, TIME, p. 52.
Staff. (1991, July 15). Proposed Department of the Interior rules for the consideration of offreservation land acquisitions for Indian tribes. FEDERAL REGISTER, 56 (135).
Vallen, G.K. (1993, December). Gaming in the U.S.: A ten-year comparison. THE CoRNELL H.R.A. QUARTERLY, 51-58.
Vandermey, A. (1984). Assessing the importance of urban tourism. ToURisM MANAGEMENT, 5(2), pp. 123-125.
Walkup, C. (1993, February). Indian casinos challenge local operators. NATIONS REsTAURANT NEWS, p. 7.
Gaming Research & Review Journal- Volume 1, Issue 2- 1994 35

9£