the effects of maize planting density and weeding regimes ...centaur.reading.ac.uk/45197/1/kivuvu...
TRANSCRIPT

The effects of maize planting density and weeding regimes on light and water use Article
Published Version
Creative Commons: Attribution 3.0 (CCBY)
Open Access
Kivuvu, B. M., Mburu, M. W. K., Maina, J. M. and Murdoch, A. J. (2014) The effects of maize planting density and weeding regimes on light and water use. Journal of Agricultural Science, 6 (12). pp. 215229. ISSN 19169760 doi: https://doi.org/10.5539/jas.v6n12p215 Available at http://centaur.reading.ac.uk/45197/
It is advisable to refer to the publisher’s version if you intend to cite from the work. See Guidance on citing .
To link to this article DOI: http://dx.doi.org/10.5539/jas.v6n12p215
Publisher: Canadian Center of Science and Education
All outputs in CentAUR are protected by Intellectual Property Rights law, including copyright law. Copyright and IPR is retained by the creators or other copyright holders. Terms and conditions for use of this material are defined in the End User Agreement .
www.reading.ac.uk/centaur
CentAUR

Central Archive at the University of Reading
Reading’s research outputs online

Journal of Agricultural Science; Vol. 6, No. 12; 2014 ISSN 1916-9752 E-ISSN 1916-9760
Published by Canadian Center of Science and Education
215
The Effects of Maize Planting Density and Weeding Regimes on Light and Water Use
Benjamin M. Kivuva1, Mary W. K. Mburu2, Jedidah M. Maina3 & Alistair J. Murdoch4
1 Kenya Agricultural and Livestock Research Organisation, Crops Research Institute, Muguga South, Nairobi, Kenya 2 Department of Dryland Agriculture South Eastern Kenya University, Kitui, Kenya 3 Kenya Agricultural and Livestock Research Organisation, Crops Research Institute, Kabete, Nairobi, Kenya 4 School of Agriculture, Policy and Development, The University of Reading, Earley Gate, Reading, UK
Correspondence: Benjamin M. Kivuva, Kenya Agricultural and Livestock Research Organiation, Crops Research Institute, Muguga South, P O Box 30148-00100, Nairobi, Kenya. Tel: 254-720-824-484. E-mail: [email protected]
Received: August 11, 2014 Accepted: August 31, 2014 Online Published: November 15, 2014
doi:10.5539/jas.v6n12p215 URL: http://dx.doi.org/10.5539/jas.v6n12p215
Abstract Light and water are among essential resources required for production of photosynthates in plants. A study on the effects of weeding regimes and maize planting density on light and water use was conducted during the 2001/2 short and 2002 long rain seasons at Muguga in - the central highlands of Kenya. Weeding regimes were: weed free (W1), weedy (W2), herbicide (W3) and hand weeding twice (W4). Maize planting densities were 9 (D1) and 18 plants m-2 (D2) intercropped with Phaseolus vulgaris (beans). The experiment was laid as randomized complete block design replicated four times and repeated twice. All plots were thinned to 4 plants m-2 at tasseling stage (96 DAE) and thinnings quantified as forage. Soil moisture content (SMC), photosynthetically active radiation (PAR) interception, evapo-transpiration (ET crop), water use efficiency (WUE), and harvest index (HI), were determined. Percent PAR was higher in D2 than in D1 before thinning but higher in D1 than in D2 after thinning in both seasons. PAR interception was highest in W2 but similar in W1, W3 and W4 in both seasons. SMC was significantly lower in W2 but similar in W1, W3 and W4. D2 had lower SMC than D1 in season two. Weeding regime significantly influenced ET crop, while planting density and weeding regime significantly influenced WUE and HI. D2 maximizes water and light use for forage production but results to increased intra-specific plant competition for water and light severely before thinning (96 DAE) that reduce grain yield in dual purpose maize, relative to D1.
Keywords: light, water, weeding regimes, planting density, yield
1. Introduction Plant growth and development is affected by soil moisture stress at any time during the crop life cycle. However, the extent and the nature of the stress injury, the capacity to recover, and the impact on the crop yield depend on the stage of development the stress occurs (Tarun et al., 2013; Ibrahim, Adzemi, & Wan-Zaliha, 2013). Soil moisture stress sensitivity of the crop is acute during the reproduction processes of the crop, which are extremely vulnerable to water stress (Zhao, Shen, Lang, Liu, & Li, 2013; Tarun et al., 2013). These reproductive processes include; floral initiation, differentiation of the inflorescence, male and female meiosis, development of pollen and embryo sac, pollination, fertilisation and seed development. Soil moisture stress during any of these reproductive processes reduces the grain yield drastically (Sheng, Na, Shuang-En, Ming-Hui, & Dong-Li, 2014). Plants attain potential transpiration and photosynthesis with adequate soil moisture content a pre-requisite for high crop yields (De Vries, Bennett, Boote, Albretch, & Maliro, 1989). However, under drought stress, plants respond through stomatal closure which further causes light and heat stress on the leaves resulting to reduced PAR utilization and photosynthesis (Tozzi, Easlon, & Richards, 2013). Thus, soil moisture stress is reported to be the main limitation to the photosynthetic process (Zhang et al., 2014). Consequently, supplementary irrigation under drought conditions at reproductive growth stages such as flowering and seed development, lead to optimum transpiration and photosynthesis hence high yields, depending on the cropping density (Tarun et al.,

www.ccsenet.org/jas Journal of Agricultural Science Vol. 6, No. 12; 2014
216
2013).
Cropping density influence yield of the crops (Matusso, Mugwe, & Mucheru-Muna, 2014). Crops sown at lower or higher than optimal cropping density leads to poor yields (Seran & Brintha, 2010). Cropping density influences the crop canopy which influences the level of light penetration and interception of the crop. Crops sown at high density prevent light penetration hence smother growth of underneath. (Muoneke, Ogwuche, & Kalu, 2007). Mashingaidze (2004) reported that maize grown at density 222,000 plants ha-1 (22.2 plants m-2) and beans grown at 37000 plants ha-1 (3.7 plants m-2) in a maize-bean intercrop reduced weed biomass by 50% – 66%. Also, high cropping density minimises soil erosion through reduced splash and run off erosion (Seran & Brintha, 2010). In constrast, high cropping density may lead to crop failure especially under inadequate soil moisture. Improved crop yield is as a result of the crops attaining optimal transpiration, light absorption and temperature as well as adequate soil nutrients (Tozzi et al., 2013). High planting densities increase intra plant competition for soil nutrients and water which result to poor yields under inadequate resources (Matusso et al., 2014). Moreover, due to diminishing grazing land, small scale farmers feed their livestock with maize thinnings and stover forage and use the grain for food (Methu et al., 2001). However, the cropping density determine the grain yield relative to forage biomass depending on soil moisture status.
Soil moisture stress interferes with sink source relationship of the crop. The roots of the crop become the major photosynthates sinks under moisture stress. Depending on the prevailing temperatures, soil moisture stress causes yield loss ranging from 20%–100% (Yi, Christopher, & Shu, 2014). Optimum maize growth occurs at temperatures of 24 to 30 °C, however, temperatures of ≥ 38 °C, increases evapo-transpiration resulting to senescence and drastic yield reduction (Pingali, 2001). Quantity and quality of radiation intercepted influences photosynthesis efficiency of higher plants (Ghassemi-Golezani, Bakhshy, Zehtab-Salmasi, & Moghaddam, 2013). Intercepted radiation is the difference between light received at the canopy surface and that transmitted through the canopy (Squire, 1990). However, leaf canopy of a crop depends on the planting density. Moreover, canopy light interception greatly reduces in crops under drought conditions due to leaf rolling and senescence (Ghassemi-Golezani et al., 2013).The production of photosynthates in maize, is positively correlated to the canopy PAR interception since maize does not exhibit light saturation, even at full sunlight (Squire, 1990; Juan, Luis, Alejandra, Patricia, & Agustín, 2013; Muchow, Sinclair, & Bennet, 1990).
Weeds compete with crops for nutrients, moisture, light and space, which adversely affect the crop growth and yield (Sebuliba-Mutumba & Adiphala, 1997). Yield reduction of between15%–90% due to weed interference has been reported on mixed cropping systems (Maina, 1997; Sebuliba-Mutumba & Adiphala, 1997). Improved weed control and optimising planting density enhances efficient use of plant resources (nutrients, light and water) in maize bean intercrops, increasing the forage and grain yields. Use of optimal planting density increases crop yield, however, moisture stress hinder improved biomass yields (Lemma, Worku, & Woldemichael, 2009). Research has shown that supplementary irrigation under drought conditions improved crop water use efficiency and optimized growth and yield in sorghum (Ibrahim et al., 2013).Total above ground biomass of lucerne (Medicago sativa L.) increased to optimum 2292 g m−2 under narrow spacing (15 cm between plants) but reduced to 1670 g m−2 under wide spacing (30 cm between plants) (Juan et al., 2013). Under soil moisture stress conditions, Mulberry cultivar V1 (Morusindica L.) showed a decrease in electron transport and enhanced thermal dissipation from photosystem II, hence reduced photosynthesis (Anirban & Attipalli, 2014). Bermuda grass (Cynodon spp.) genotypes had greater soil water extraction, and large rhizome root network under continuous soil moisture stress (Yi et al., 2014). In cotton, stomatal closure during water stress caused light and heat stress on the plant leaves, resulting to reduced photosynthesis (Tozzi et al., 2013). Soil moisture stress reduced photosynthesis rate and dry matter accumulation in rice (Sarvestani, Pirdashti, Sanavy, & Balouchi, 2008). However, the effect of planting density, thinning and weeding regimes on light and water use in maize has not been documented. Thus, in this study, the effect of planting density, thinning after three months, and weeding regimes on maize light and water use was examined and reported.
2. Materials and Methods 2.1 Study Site
The study was carried out at the National Agricultural Research Center, Muguga (NARCM) of the Kenya Agricultural Research Institute (KARI), about 27 km NW of Nairobi, latitude 1°13′S, longitude 36°38′E, altitude 2096 meters above sea level. The area receives on average 900 – 1000 mm rainfall annually in two distinct seasons: - long rains (mid March to June) with an average precipitation of 550 mm and the short rains (mid October to December) with an average of 400 mm. Temperature ranges are, minimum 7 °C maximum 24 °C, mean 15 °C. The agro-climatic zone is subhumid. The soil is a well drained, very deep, dark reddish brown to
www.ccsenet.org/jas Journal of Agricultural Science Vol. 6, No. 12; 2014
217
dark red, friable clay classified as humic nitisols (United States Department of Agriculture (USDA), 1975).
2.2 Weather Data
Data on daily rainfall and temperature on both seasons was obtained from Muguga meteorological station, situated about 300 m from the trial site. The experimentt was done in the same plots in the two seasons.
2.3 Trial Treatments Layout
The first experiment was planted on 8th of November 2001 during short rains while the second experiment was planted on 20th of May 2002 in the long rains. Each experimental plot was 4 m × 4 m. The plots were tractor ploughed and harrowed to produce a good tilth for maize. The experiment was laid out as a randomised complete block design replicated four times. The treatments consisted of four weeding regimes namely weed free (W1) achieved through occasional hand weeding, weedy (W2), pre-emergence herbicide (W3) and hand weeding twice (W4) (i.e. two and six weeks after emergence), and two maize planting densities i.e. 9 plants m-2 (2 plants hill-1) (D1) and 18 plants m-2 (4 plants hill-1) (D2). Certified seeds of maize (cultivar H511) was planted in 15 cm deep furrows open with hand hoes, spaced at 75 cm × 30 cm, to a depth of 3–5 cm. Certified seeds of beans variety GLP2 were planted in 15 cm deep farrows made using hand hoes, at the centre between maize rows (37.5 cm from adjacent maize rows), in all plots at 2 plants hill-1 at spacing of 75 cm × 30 cm, to a depth of 3–5 cm. Maize hills were thinned to 2 plants hill-1 in D1 and 4 plants hill-1 in D2 and also beans were thinned to two plants hill-1 three weeks after planting. Each experimental plot consisted of five rows of maize and four rows of beans each of three meters long. Soil samples were taken before sowing in each plot and analysed for pH, organic C, N, and available P and K (Okalebo, Gathua, & Woomer, 1993). Diammonium phosphate (DAP 18:46:0 N: P: K) fertiliser was applied before sowing at rate of 25 kg ha-1 since based on the soil analysis done, the soil was deficient of phosphorous. During the first day after sowing maize and bean, pre-emergence herbicides (alachlor 48 EC at 1.2 kg a.i. ha-1 and linuron at 0.6 kg a.i. ha-1) were applied using a knapsack sprayer with a piston type pump, and tank capacity of 20 L, at working pressure of 100 Kpa (15 psi) with nozzle flow of 500 mls per minute from 1630 to 1830 hours in W3. Plots were irrigated in the first season to ensure establishment but not in the second season. Weed control was done as per the described weeding regimes and no pest and disease control chemical sprays were done in both experiments. Beans were harvested at maturity (112 days after emergence (DAE)), sun dried and threshed manually and yield data recorded.
2.4 Photosynthetically Active Radiation (PAR) Measurements
Maize PAR interception was measured using a sunfleck ceptometer (SF-80 Decagon, Pulman, Washington) every two weeks between 11.30 hours and 13.30 hours from 42 DAE up to harvest. The ceptometer was held perpendicular to the rows and nine measurements made in each plot, 5 cm above and below the maize canopy. The PAR intercepted by maize was calculated by substracting the ceptometer reading below the maize canopy from the reading 5 cm above the canopy. Then the % PAR interception was calculated using the formula:
% PAR intercepted = PARa – PARb PARa 100 (1)
Where; PARa is the PAR above the canopy, PARb is the PAR below the canopy.
2.5 Thinning, Stover and Grain Yield
Maize was thinned to 1 plant hill-1 at 96 DAE. Thinning data was collected only on the seven inner hills of the three inner rows of maize whereby, total fresh weight of the thinnings from each plot was taken. Dry matter was determined from samples of 500 g of fresh mass of the thinnings taken from each plot and dried at 60 °C to constant mass. At maturity (132 DAE), stover and grain yield was collected only on the seven inner hills of the three inner rows of maize whereby, maize stover was harvested and its fresh weight per plot measured. Samples of 500 g of fresh mass of the harvested stover were dried at 60 °C to constant mass. The shelled maize grain from sampled plants in each each was dried to 13% moisture content and their dry mass determined.
2.6 Soil Moisture Measurement
Soil moisture content was measured at 84 days after emergence using neutron probe (Didcot Wallingford) at intervals of 20 cm. Before planting, aluminium access tubes of 6.35 cm diameter and 155 cm deep, sealed at the bottom end, were inserted into 150 cm deep augur holes that were slightly smaller that the access tube. The access tubes were pushed through the hole using a mallet. To calibrate the neutron probe, probe counts readings were taken using an access tube that was is a dustbin containing water. The soil probe counts were taken at intervals of 20 cm starting from 10 cm up to 130 cm.
2.7 Neutron Probe Calibration
The neutron counts were converted to volumetric moisture content through calibration. Ten tubes were

www.ccsenet.org/jas Journal of Agricultural Science Vol. 6, No. 12; 2014
218
randomly clustered into five groups. The soil around the tubes was watered with 100, 200, 300, 400 and 500 litres of water respectively and covered with grass mulch overnight. Both neutron counts and soil core samples at intervals of 20 cm were taken the following day taken down the soil profile up to 150 cm at intervals of 20 cm starting from 10 cm. Soil moisture content of the core samples was gravimetrically determined by oven (model number TV80 UL 508032, Memmert, Germany) drying the samples at 105 °C to constant mass. The soil bulk density was also determined. The dry mass of the dried sample was measured and moisture content determined using the formula;
WSM - DM = MC (2)
Where; WSM = wet soil mass mass, DSM = Dry soil mass, MC = moisture content, all in grams.
A graph of relative counts versus volumetric moisture content was drawn and the equation of the curve taken as the calibration equation.
2.8 Evapotranspiration, Water Use Efficiency and Harvest Index
Evapotranspiration and water use efficiency were determined following Bolton (1981) formula: WUE = Y ET (3)
Where; WUE = water use efficiency kg ha-1 mm-1, Y = total dry matter yield in kg ha-1, ET = evapotranspiration (mm), ET = the amount of water lost through both evaporation from the soil beneath the crop canopy and transpiration over the season.
ET = T + Es (4) Where; Es = the evaporation from the soil beneath the crop canopy (mm), T = transpiration (mm). Thus from the soil water balance equation (Hillel, 1980);
S = P - Es– T - Dr- Roff (5) ET = P - (S + Dr+ Roff) (6)
Where; S = change in storage water (mm), P = precipitation (rainfall and irrigation; mm), Es = soil evaporation in mm, T = transpiration in mm, Dr = drainage (mm), Roff=run off in (mm). Harvest index (HI) was determined as follows;
HI = Total grain yield / Total biomass (8)
2.9 Data Analysis
Analysis of variance was done using GENSTAT (1995) (Genstat 5 Release 3.2 Lawes Agricultural Trust, Rothamsted Experimental Station, 2003). Significantly different means (P = 0.05) were separated using LSD values.
3. Results 3.1 Weather Data
Rainfall was low in both seasons and supplementary irrigation was applied in the first eseason. In experiment one, the total monthly rainfall in December 2001, January 2002 and February 2002 was 22.1 mm, 0 mm and 22.4 mm respectively while irrigation water was 71 mm, 141 mm and 71 mm respectively. The total rainfall and irrigation in the first season was 298 mm and 283 mm, respectively, totaling to 581 mm. The rainfall in the second season rainfall was 201 mm (Figure 1) and the experiment was not irrigated. The mean minimum daily temperature was 6 °C and 4 °C in season 1 season 2, respectively while mean maximum daily temperature was 23 °C and 20 °C in both seasons respectively. The mean temperatures for season one and two was 14 °C and 12 °C, respectively (Figure 1).

www.ccsenet.org/jas Journal of Agricultural Science Vol. 6, No. 12; 2014
219
Figure 1. The rainfall (mm) in season one (a) and two (b) and temperature season one (c) and two (d)
respectively
3.2 Soil Analysis
Results of soil chemical analysis indicated that phosphorous was deficient. The rest of the macro elements analyzed were adequate (Table 1).
Table 1. Soil chemical analysis
Trait Amount in soil Adequate ranges
% organic C 3.2 0.5-3
% N 0.3 0.05-0.25
Available P (mg P kg-1) 8.6 150-500
K (mg K kg-1) 1128.5 50-175
pH water 5.9 5.5-7.0
Note. C = Carbon, N = Nitrogen, P = Phosphorous and K = Potassium.
0
15
30
45
60
75
1 11 21 31 41 51 61 71 81 91 101 111 121 131
Rai
nfal
l (m
m) (a) Rainfall Season 1
0
15
30
45
60
75
1 11 21 31 41 51 61 71 81 91 101 111 121 131
Rai
nfa
ll (m
m)
Days after sowing
(b) Rainfall season 2
0
5
10
15
20
25
30
1 11 21 31 41 51 61 71 81 91 101 111 121 131
Te
mpe
ratu
re (
oC)
Days after sowing
Tmin Tmax Tmean
(c) Temperature season 1
0
5
10
15
20
25
30
1 11 21 31 41 51 61 71 81 91 101 111 121 131
Tem
pera
ture
(o
C)
Days after sowing
Tmin Tmax Tmean
(d) Temperature season 2

www.ccsenet.org/jas Journal of Agricultural Science Vol. 6, No. 12; 2014
220
3.3 Photosynthetically Active Radiation (PAR) Interception
The proportion of PAR intercepted by the canopy varied significantly in the two seasons among the maize planting densities and weeding regimes from 56 DAE to 112 DAE (Figure 2).The PAR intercepted, at 84 DAE (prior to thinning) was higher at the high planting density (D2) compared to the low planting density (D1) (Figure 2a). The maximum PAR intercepted at high density (D2) in season 1 and 2 was 95% and 82% of incident PAR, respectively. Weedy plots (W2) intercepted more PAR compared to the weed controlled plots in the two seasons most of the times except at 42 DAE and W1 at 56 DAE and 70 DAE. The three types of weed control resulted to similar PAR interception of the crop in both seasons (Figure 2).
Figure 2. Effect of maize planting density and weeding regime on % PAR interception over time in season one (a and b) and two (c and d); where, D1 = low density, D2 = high density, W1 = weedfree, W2 = weedy regime, W3
= herbicide use, W4 = two times hand weeding. LSD bars indicated
3.4 Neutron Probe calibration
The neutron count and soil water content were positively correlated at all depths measured and they ranged from 0.84 to 0.98 (Figure 3).
0
10
20
30
40
50
60
70
80
90
100
25 45 65 85 105 125
% P
AR
inte
rcep
tion
Days after emergence
D1 D2
0
10
20
30
40
50
60
70
80
90
100
25 45 65 85 105 125
% P
AR
inte
rcep
tion
Days after emergence
D1
D2
0
10
20
30
40
50
60
70
80
90
100
25 45 65 85 105 125
% P
AR
inte
rcep
tion
Days after emergence
W1 W2
W3 W4
0
10
20
30
40
50
60
70
80
90
100
25 45 65 85 105 125
% P
AR
inte
rce
ptio
n
Days after emergence
W1 W2
W3 W4

www.ccsenet.org/jas Journal of Agricultural Science Vol. 6, No. 12; 2014
221
Figure 3. The neutron probe counts (counts s-1) calibration at the experimental site Muguga central highlands of
Kenya, where; Cs = probe count in soil, Cw = probe count in water and R2 = regression coefficient.
3.5 Soil Moisture Content
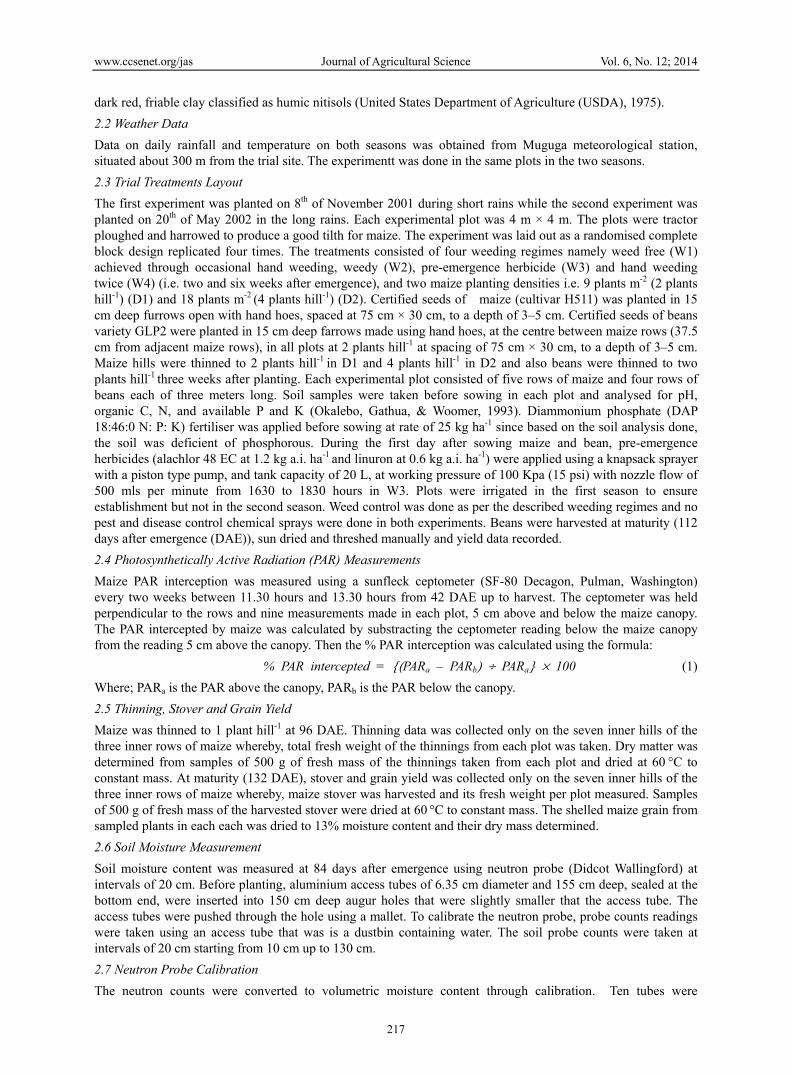
There soil moisture content varied significantly among weeding regimes while density significantly influenced moisture content early in the season during season one (10-50 DAE) and in the second season. During the second season soil moisture was higher in D1 (low density) than in D2 (high density). The moisture content was lower in the weedy plots compared to those where weeds were controlled (Figure 4). There was progressive depletion of soil water down the soil profile throughout the growing season (up to 130 cm depth) in both seasons (Figure 4) and in all treatments. The most significant moisture changes occured between10 and 90cm in all the treatments and in both seasons (Figure 4).
y = 0.5162x - 0.0237R² = 0.9777
0
0.05
0.1
0.15
0.2
0.25
0.3
0.20 0.30 0.40 0.50 0.60
Soi
l wat
er (
cm3
cm-3
)Relative count (Cs Cw-1)
(a) 10-20 cm depth
y = 0.5473x + 0.0029R² = 0.9024
0
0.05
0.1
0.15
0.2
0.25
0.3
0.35
0.20 0.30 0.40 0.50 0.60
Soi
l wat
er (
cm3 cm
-3)
Relative count (Cs Cw-1)
(b) 30-40 cm depth
y = 0.8247x - 0.0977R² = 0.8907
0
0.05
0.1
0.15
0.2
0.25
0.3
0.35
0.4
0.20 0.30 0.40 0.50 0.60
Soi
l wat
er (
cm3
cm-3
)
Relative count (Cs Cw-1)
(d) 70-80 cm depth
y = 0.8299x - 0.0135R² = 0.9426
00.050.1
0.150.2
0.250.3
0.350.4
0.450.5
0.20 0.30 0.40 0.50 0.60
Soi
l wat
er (
cm3
cm-3
)
Relative count (Cs Cw-1)
(c) 50-60 cm depth
y = 1.0422x - 0.0629R² = 0.8427
0
0.1
0.2
0.3
0.4
0.5
0.6
0.7
0.00 0.20 0.40 0.60 0.80
Soi
l wat
er (
cm3 c
m-3
)
Relative counts ( Cs C w-1)
(e) 90-100 cm depth
y = 0.9767x + 0.0262R² = 0.9511
0
0.1
0.2
0.3
0.4
0.5
0.6
0.7
0.00 0.20 0.40 0.60 0.80
Soi
l wat
er (
cm3 c
m-3
)
Relative count (Cs Cw-1)
(f) 110-120 cm depth
y = 1.1539x + 0.0065R² = 0.9391
00.10.20.30.40.50.60.70.80.9
0.00 0.20 0.40 0.60 0.80
Soi
l wat
er (
cm3 c
m-3)
Relative count (Cs Cw-1)
(g) 130-150cm depth
www.ccsenet.org/jas Journal of Agricultural Science Vol. 6, No. 12; 2014
222
Figure 4. The effect of planting density and weeding regimes on moisture content at 84 DAE (cm3cm-3) during
season one (a and b) and season two (c and d); where, D1 = low density, D2 = high density, W1 = weedfree, W2 = weedy regime, W3 = herbicide use, W4 = two times hand weeding. LSD bars indicated
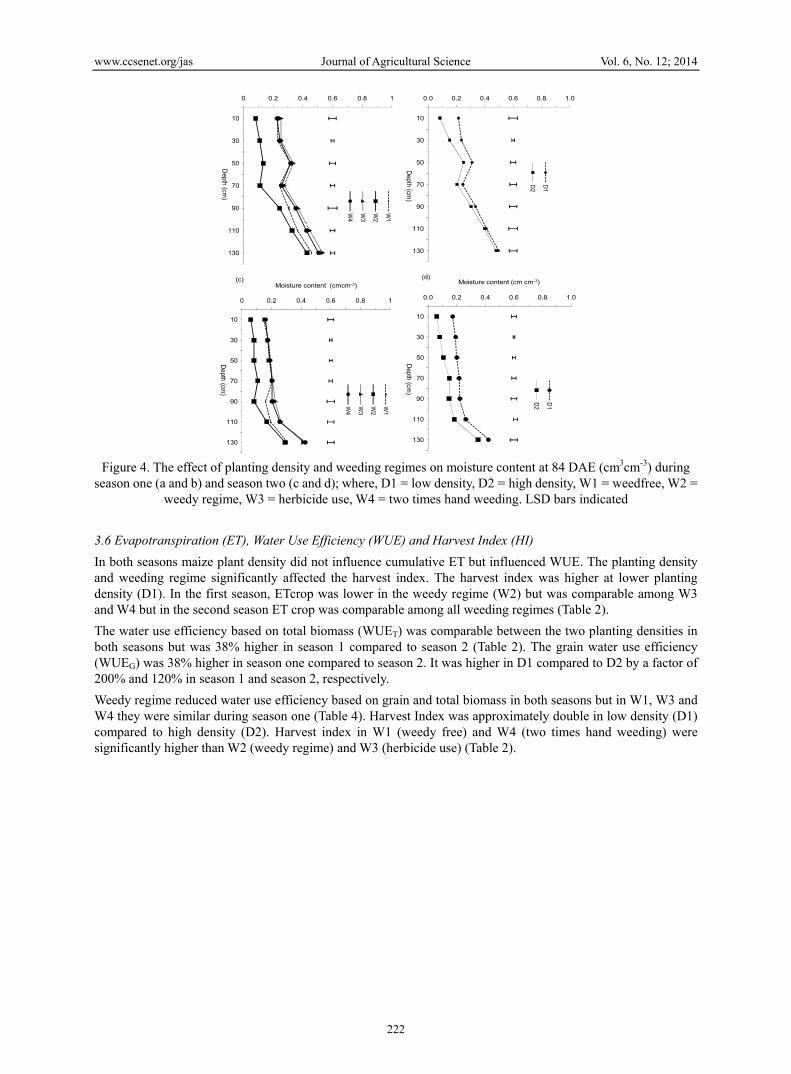
3.6 Evapotranspiration (ET), Water Use Efficiency (WUE) and Harvest Index (HI) In both seasons maize plant density did not influence cumulative ET but influenced WUE. The planting density and weeding regime significantly affected the harvest index. The harvest index was higher at lower planting density (D1). In the first season, ETcrop was lower in the weedy regime (W2) but was comparable among W3 and W4 but in the second season ET crop was comparable among all weeding regimes (Table 2).
The water use efficiency based on total biomass (WUET) was comparable between the two planting densities in both seasons but was 38% higher in season 1 compared to season 2 (Table 2). The grain water use efficiency (WUEG) was 38% higher in season one compared to season 2. It was higher in D1 compared to D2 by a factor of 200% and 120% in season 1 and season 2, respectively.
Weedy regime reduced water use efficiency based on grain and total biomass in both seasons but in W1, W3 and W4 they were similar during season one (Table 4). Harvest Index was approximately double in low density (D1) compared to high density (D2). Harvest index in W1 (weedy free) and W4 (two times hand weeding) were significantly higher than W2 (weedy regime) and W3 (herbicide use) (Table 2).
0.0 0.2 0.4 0.6 0.8 1.0
10
30
50
70
90
110
130
Depth (cm
)
D1
D2
0 0.2 0.4 0.6 0.8 1
10
30
50
70
90
110
130
Depth (cm
)
W1
W2
W3
W4
0.0 0.2 0.4 0.6 0.8 1.0
10
30
50
70
90
110
130
Moisture content (cm cm-3)
Depth (cm
)
D1
D2
(d)
0 0.2 0.4 0.6 0.8 1
10
30
50
70
90
110
130
Moisture content (cmcm-3)
Depth (cm
)
W1
W2
W3
W4
(c)

www.ccsenet.org/jas Journal of Agricultural Science Vol. 6, No. 12; 2014
223
Table 2. The effect of planting density and weeding regime on cumulative evapo-transpiration (Cum. ET), water use efficiency on maize grain (WUEG), and total biomass (WUET) in kg ha-1and harvest index (HI)
Planting density Cum. ET (mm) WUET (kg ha-1 mm-1 ) WUEG (kg ha-1 mm-1 ) HI
Season 1
D1 623 a 47.1 a 6.0 a 0.14 a
D2 610 a 41.6 a 2.9 b 0.08 b
LSDD 29.93 7.55 1.04 0.02
Season 2
D1 362 a 27 a 1.8 a 0.16 a
D2 349 a 37.1 a 1.5 b 0.09 b
LSDD 18.04 5.88 0.29 0.03
Weeding regime
Season 1
W1 611 a 48.5 a 5.0 a 0.12 a
W2 578 a 31.1 b 2.5 b 0.08 b
W3 638 a b 45.9 a 4.1 a 0.10 a
W4 640 a b 51.8 a 6.2 a c 0.13 a
LSDW 42.33 10.68 1.47 0.03
Season 2
W1 366a 40.6 a 2.4 a 0.14 a
W2 347 a 9.6 b 0.1 b 0.09 b
W3 356 a 37.6 a 1.7 c 0.12 a
W4 353 a 40.4 a 2.4 a 0.15 a
LSDW 25.51 8.32 0.41 0.04
Note. D1 = low density, D2 = high density, W = weedfree, W2 = weedy regime, W3 = herbicide use, W4 = two times hand weeding. LSDW = least significant differences of weeding regimes, LSDD = least significant differences of planting densities. Suffix letters a, b, c indicates significant similarities or differences of the observations in each trait.
3.7 Grain and Forage Loss Due to Weeds
The yield reduction due to weeds was highest on grain in both seasons, however in season two, which experienced drought conditions, the grains yield reduction was very high (97%). The dry matter yield loss of forage (stover and thinnings) was lower than grain yield loss in both seasons (Table 3).

www.ccsenet.org/jas Journal of Agricultural Science Vol. 6, No. 12; 2014
224
Table 3. The percent loss of maize grain and forage yields due to weeds (weed free regime yields less weedy regime yields)
Component Weed free (W1) (t ha-1)
Weedy (W2) (t ha-1)
loss due to weeds in t ha-1 and in%
Season 1
Grain 3.4 1.6 1.8 (53%)
Thinnings 12.9 8.1 4.8 (37%)
Stover 16.4 10.2 6.2 (38%)
Forage (Thinnings+ Stover) 29.3 18.3 11 (38%)
Total biomass (Thinnings + Stover +grain) 32.7 19.9 12.8 (39%)
Season 2
Grain 1 0.03 0.97 (97%)
Thinnings 8 2.1 5.9 (74%)
Stover 7.5 1.6 5.9 (79%)
Forage (Thinnings + Stover) 15.5 3.6 11.9 (77%)
Total biomass (Thinnings + Stover +grain) 16.5 3.7 12.8 (78%)
3.8 Beans Dry Matter Biomass and Grain Yield In this experiment, bean yields ranged 61 to 144 kg ha-1 (Table 4). At 0 to 50 DAE about 40 - 60% of the PAR was transmitted through the maize canopy to the beans canopy. However, during the reproductive phase of the beans (50 - 90 DAE) about 20% or less of light penetrated through the maize canopy to the beans (Figure 2). In the first season beans planted under low density maize plots had higher grain and total dry matter yield than in high density but in second season maize density did not influence bean dry matter and grain (Table 4). Control of weeds (W3 and W4) increased the bean grain yield and total dry matter biomass in the first season while only twice hand weeding (W4) significantly increased the bean grain yield and total dry matter biomass in the second season (Table 4). In the first season, bean grain yield in both W3 and W4 methods of weed control was comparable while use of herbicide reduced the bean grain yield and total dry matter biomass i, in the second season, relative to twice hand weeding (W4).
Table 4. The effect of planting density and weeding regime on bean biomass and grain yield (kg ha-1) Season one Season two
Planting density Total dry matter Grain Total dry matter Grain
D1 130a 74a 103a 77a
D2 100b 48b 114a 82a
LSD D 29 20 20 17
Weeding regime
W1 124a 71a 121a 83a
W2 15b 1b 85b 61b
W3 174c 92a 84b 61b
W4 146ac 81a 144ac 112c
LSD W 41 42 28 24
Note. D1 = low density, D2 = high density, W = weedfree, W2 = weedy regime, W3 = herbicide use, W4 = two times hand weeding. LSDW = least significant differences of weeding regimes, LSDD = least significant differences of planting densities. Suffix letters a, b, c indicates significant similarities or differences of the observations in each trait.

www.ccsenet.org/jas Journal of Agricultural Science Vol. 6, No. 12; 2014
225
4. Discussion 4.1 Weather Data
In season one the amount of water supplied to the crop was 581 mm; 298 mm and 283 mm from rainfall and supplementary irrigation, respectively. However no supplementary irrigation was done in the second season which had rainfall of 201 mm. The average rainfall for first season (long rains) in KARI Muguga, Kenya is 550 mm while for second season (short rains) is 400 mm respectively which indicates rainfall + irrigation in season one was sufficient, but season two rainfall was less than average by about 50% of the season’s mean. The maximum daily temperature for both seasons ranged from slightly below 20 oC to slightly above 25 oC, an indication that the temperature was adequate for the growth of the crop.
4.2 Soil Analysis
The results of soil analysis indicated nitrogen, and potassium were sufficient but phosphorous was inadequate. Nitrogen is a constituent of the protein molecules purines, pyrimidines that are found in nucleic acids and DNA for protein synthesis (Devlin & Witham, 2002). Also, nitrogen constitutes porphyrins that are found in chlorophyll pigments and cytochromes vital for photosynthesis and respiration, while potassium is essential for respiration, photosynthesis, chlorophyll development, and opening and closing of stomata (Devlin & Witham, 2002). Phosphorous constitutes nucleic acids, phospholipids, coenzymes NAD and NADP and energy molecule ATP, which play important role in photosynthesis and respiration in plants.Therefore, deficiency of phosphorous in this study would have hindered photosynthesis and other metabolic processes that would have reduced the crop yield if not corrected. However, this deficiency was corrected through application double ammonium phosphate fertilizer at rates indicated in section 2.3.
4.3 PAR Interception
The proportion of incident solar radiation intercepted by a canopy is influenced by the leaf area index and the canopy geometry. High plant density increased leaf canopy size that intercepted more PAR prior to thinning. Thinning reduced the leaf area and subsequently PAR interception. PAR interception in un-weeded plots (W2) remained higher because the maize plants were thinned and were small and the weeds intercepted most of the PAR. However, PAR interception in D1 was higher than in D2 after thinning because, plants in the higher density were smaller probably because of high intraplant competition for plant resources. Moreover, PAR interception decreased late in the season (after 85 DAE) due to leaf fall and senescence (Masri & Boote, 1988). The positive increase in radiation with increasing plant density has been documented in crops (Simmonds et al., 1999; Juan et al., 2013).
4.4 Neutron Probe Counts Calibration
The R2 values of the curves generated ranged from 0.84 to 0.98 down the soil profile which indicated that the calibration curves fitted well and therefore the probe counts conversion into volumetric moisture content was sufficient for this study.
4.5 Soil Moisture Content
High plant density (D2) and not controling weeds (W2) probably increased both the root density and leaf canopy resulting in increased transpiration which significantly reduced soil moisture content in high density treatment (D2) in the early growth stages of the crop. Soil moisture increased down the soil profile implying water uptake through evapo-transpiration because most of the roots are usually found in the top soil layers (Sharp & Davies, 1985). Gowan and Williams (1989) reported that increasing rate of drying of the soil down the profile indicated water uptake by roots. In season one change in the soil water content below 70 cm was minimal indicating the bulk of the roots were in the top 70 cm. In season 2 the soil moisture content was much lower compared to season 1 as indicated by the low soil water content. The changes in water content may have been as result of loss of water through drainage as well as uptake by roots. Both maize and weeds may have grown to 110 cm deep. Yi, et al. (2014) reported that Bermuda grass genotypes (Cynodon spp.) under continuous drought developed large rhizome network and greater soil water extraction.
Tarun et al. (2013) reported that adequate soil moisture enabled plants to maintain better water relations and photosynthesis, leaf area and biomass partitioning, leading to increased yields. Anirban and Attipalli (2014) found that drought-stressed mulberry cultivar showed a decrease in electron transport and enhanced thermal dissipation from PS II, which reduced plant biomass production.

www.ccsenet.org/jas Journal of Agricultural Science Vol. 6, No. 12; 2014
226
Application of supplementary irrigation water in season one made the crop to channel its assimilates to yield biomass sinks other than the roots which led to increased grain and forage yield, while in the second season moisture stress not only caused the roots to be the major sinks but also adversely affected photosynthesis reducing the crop yields. Also, Lemma et al. (2009) conducted a study on planting density and contrasting moisture regimes on cowpeas and found that both grain and total biomass yield ha-1 increased with increasing planting density under wet regime while an increase in planting density decreased grain yield and total biomass ha-1 under the water limited regime. In this study season two grain yield and maize biomass decreased probably due to drought conditions. This supported by Stewart (1983) reported that yields of maize and beans increased linearly with application of irrigation water and reported yields in maize/bean intercrop of 4.98 and 0.7 t ha-1 respectively at 438 mm water.
4.6 Evapotranspiration (ET), Water Use Efficiency (WUE) and Harvest Index (HI)
Drought conditions led to low ET values and reduction of total biomass by 50% in season two relative to season one. Pilbeam, Daamen and Simmonds (1995) reported that transpiration of 15% (15 mm) in a season which had 150 mm rainfall and 40% (200 mm) in a season that had 500 mm rainfall in maize bean intercrop in Kenya. During the first season not controlling weeds reduced ET of the crop probably because weeds competed for water, light and nutrients reducing the crop canopy, which reduced transpiration that led to reduced WUE of the crop at the expense of the weeds. This led to low forage and grain yields and reduced WUE of the crop in the weedy treatment. Crop water use efficiency was low at high density due to competition between individual plants and the weeds for water, light and probably plant nutrients leading to low dry matter conversion per unit plant and reduced WUE in D2 than in D1. WUEG in the weeded plots were comparable to those obtained at Kabete (7.22 to 9.5 kg ha-1mm-1) (Lenga, 1979). The harvest index in D1 (density 9 m-2) varied from 0.14 to 0.16 in both seasons while in D2 (density 18 m-2) varied from 0.08 to 0.09 in both seasons. Squire (1990) reported HI of maize at densities of 2.3 m-2, 3.5 m-2, 4.8 m-2, 6.1 m-2 and 7.4 m-2 as 0.5, 0.4, 0.35, 0.35 and 0.3 respectively in Zimbabwe, which indicated reduction of HI with increase in maize density and, by inference, supports the HI reported in this study. This reduction in HI may be explained by the findings of Squire (1990) that the additional higher population relative to the recommended plant density intercepts little more solar radiation of lower quality reducing the photo assimilates per unit plant (Squire, 1990). In this study, high density resulted to reduced grain yield compared to low density probably because of thinning to single plant in all plots at tasselling stage, and inter and intra plant competition for plant resources, higher in high density (D2) compared to low density (D1) prior to thinning. This is supported by Berzsenyi (1988) who reported that increasing plant density consistently caused water stress especially during flowering, reducing grain yield and thus harvest index. Thus both high density and weeds increased the moisture and light competition.
4.7 Grain and Forage Loss Due to Weeds
The highest loss due to weed occurred in maize grain (53-97%) which was aggravated by drought conditions. This agrees with findings of Maina (1997), and Sebuliba-Mutumba and Adipala (1997) who found out that weeds reduced yields by 15 to 90%. Moreover, the drought condition in season two of this study, elevated the competition for water and other plant resources that led to drastic forage and grain loss due to weed competition.
4.8 Beans Dry Matter Biomass and Grain Yield The recommended beans spacing is 45 to 60 cm × 15 cm (depending on the variety) resulting to a population of 110,000 to 145,000 plants ha-1 which yields 220 to 1,100 kg ha-1 (Acland, 1971). In this experiment beans were sown at a spacing of 75cm × 30 cm two seeds per hill resulting to a population of 88,000 plants ha-1 and their yields ranged 61 to 144 kg ha-1, a very poor performance relative to national bean yield average of 600 to 800 kg ha-1 (Muigai & Ndegwa, 1991). Thus, less population contributed to the low yields of beans in this experiment. At 0 to 42 DAE approximately over 40% of the PAR was transmitted through the maize canopy, however low light (20% of the total PAR) may have had severely limited photosynthesis during the reproductive phase (45 to 90 DAE). This is supported by Ghassemi-Golezani, et al. (2013) who reported that increasing shade stress in soybean (Glycine max L.) decreased grain yield per unit area under minimal moisture stress. Probably also, weeds competition for plant nutrients and poor rainfall might have contributed to low beans yield.
5. Conclusions High planting density increased light interception while types of weed control did not significantly influence PAR interception especially before and up to tasseling stage in maize. High planting density may not influence the ETcrop, but influences WUE, since enhanced intraspecific competition under high crop density regimes

www.ccsenet.org/jas Journal of Agricultural Science Vol. 6, No. 12; 2014
227
depletes soil water content through transpiration faster compared to lower crop densities. High density and failure to control weeds, led to high plant resource competition, reduced WUET, WUEG and HI in both seasons in this study. Supplementary irrigation approximately doubled the total biomass and increased the maize grain yield more than three times irrespective of the planting density or the weeding regime, which confirms that moisture stress has multiplier effect to all other anti-productive plant processes. Intercropping beans with maize under high planting density drastically reduces their yield mainly because of shading effect.
Acknowledgements “This publication is an output from a research project funded by the United Kingdom Department for International Development (DFID) for the benefit of developing countries. The views expressed are not necessarily those of DFID. Project R7955, IPM of maize forage dairying: Renewable Natural Resources Knowledge Strategy (RNRKS) Livestock and Crop Protection Research Programmes.”
Our sincere thanks to the Centre Director and the staff of KARI, NARC Muguga and NARL for their great support. The help of the Field and Chemical Laboratory Department Officers from NARC Muguga and NARL is especially appreciated. We also thank the Department of Crop Science, University of Nairobi for use of their facilities. Special gratitude is due to Professor Emyr Owen of Reading University and to Mr. John Terry of Long Ashton Research Station (UK) for their technical advice and inspiration.
References Acland, J. D. (1971). East African Crops (pp. 124-134). An introduction to the production of field and plantation
crops in Kenya, Tanzania and Uganda. Longman Group UK Limited.
Anirban, G., & Attipalli, R. R. (2014). Leaf gas exchange, water relations and photosystem-II functionality depict anisohydric behavior of drought-stressed mulberry (Morusindica, cv. V1) in the hot semi-arid steppe agroclimate of Southern India. Flora − Morphology, Distribution, Functional Ecology of Plants. http://dx.doi.org/10.1016/j.flora.2013.12.007
Berzsenyi, Z. (1988). Changes in the Harvest Index of maize (Zea mays L.) in relation to N fertiliser application, plant density and growing season. Novenytermeles, 37(3), 229-238.
Bolton, F. E. (1981). Optimising the use of water and Nitrogen through soil and crop management. In J. Monteith & C. Webb (Eds.), Soil water and Nitrogen in Mediterranean type environments (pp. 231-247). The Hague: M. Nijholt and W. Junk publishers. Retrieved from http://link.springer.com/article/10.1007/BF02180055
De Vries, T. D., Bennett, J. M., Boote, K. J., Albretch, S. L., & Maliro, C. E. (1989). Nitrogen accumulation and partitioning by three grain legumes in response to soil water deficits. Field Crops Research, 22, 33-44. http://dx.doi.org/10.1111/pce.12070
Devlin, R. M., & Witham, F. H. (2002). Plant physiology (4th ed., pp. 140-144). CBS publishers and distributors, Darya Ganj, New Delhi, India.
GENSTAT. (1995). Genstat 5 Release 3.2 Lawes Agricultural Trust. Rothamsted Experimental Station. Ghassemi-Golezani, K., Bakhshy, J., Zehtab-Salmasi, S., & Moghaddam, M. (2013). Changes in leaf
characteristics and grain yield of soybean (Glycine max L.) in response to shading and water stress. International Journal of Biosciences, 3, 71-79. http://dx.doi.org/10.12692/ijb/12693.12692.12671-12679
Ibrahim, W., Adzemi M. A., & Wan-Zaliha, W. S. (2013). Effects of Regulated Deficit Irrigation on Growth of Sorghum Cultivar. Journal of Biology, Agriculture and Healthcare, 3, 33-39.
Juan, M., Luis, A. R., Alejandra, L. C., Patricia, S. C., & Agustín, A. G. (2013). Yield components, light interception and radiation use efficiency of lucerne (Medicago sativa L.) in response to row spacing. European Journal of Agronomy, 45, 87-95. http://dx.doi.org/10.1016/j.eja.2012.1010.1008
Lemma, G., Worku, W., & Woldemichael, A. (2009). Moisture and planting density interractions affect productivity in cowpea (Vigna Uinguiculata). Journal of Agronomy, 8, 117-123. http://dx.doi.org/10.3923/ja.2009.117.123
Lenga, F. K. (1979). Water use by eight annual crops at Kabete (M.Sc. thesis, Soil Science, U.O.N., Kenya).
Maina, J. M. (1997). The effect of intercropping on weeds and weeds management in maize growing in Kenya (Ph.D. thesis, University of Reading, United Kingdom).
Mashingaidze, A. B. (2004). Improving Weed Management and Crop Productivity in Maize Systems in Zimbabwe

www.ccsenet.org/jas Journal of Agricultural Science Vol. 6, No. 12; 2014
228
(p. 207). (PhD thesis, Wageningen University).
Masri, B. M., & Boote, K. J. (1988). Effects of water stress on leaf area index, crop growth rate and dry matter accumulation of field grown corn and soybean. MARDI Research Journal, 16(1), 57-61.
Matusso, J. M. M., Mugwe, J. N., & Mucheru-Muna, M. (2014). Review on potential role of cereal-legume intercropping systems in integrated soil fertility management in smallholder farming systems of Sub-Saharan Africa. Research Journal of Agriculture and Environmental Management, 3(3), 162-174.
McGown, M., & Williams, J. B. (1989). The water balance of agricultural water catchment. I. Estimation of evaporation from soil water records. Journal of Soil Science, 31, 217-230.
Methu, J. N., Owen, E., Tanner, J. C., & Abate, A. (2001). The effect of increasing planting density and thinning on forage and grain yield of maize in Kenya holdings. Tropical Science, 41, 68-73.
Muchow, R. C., Sinclair, T. R., & Bennet, J. M. (1990). Temperature and solar radiation effects on potential maize yields across locations. Agronomy Journal, 82, 338-343. http://dx.doi.org/10.2134/agronj1990.00021962008200020033x
Muigai, S. G. S., & Ndegwa, A. N. M. (1991). Bean research programme review. In M. Wabule, P. O. Fungo, & I. Njoroge (Eds.), Proceedings of the review workshop (5th to 10th May, 1991, Thika, Kenya) (pp. 1-25). KARI publications.
Muoneke, C. O., Ogwuche, M. A. O., & Kalu, B. A. (2007). Effect of maize planting density on the performance of maize/soybean intercropping system in a guinea savannah agro-ecosystem. African Journal of Agricultural Research, 2(12), 667-677.
Okalebo, J. R., Gathua, K. W., & Woomer, P. L. (1993). Laboratory methods for soil analysis. A working manual T.S.B.F., UNESCO. ROSTA, Nairobi.
Pilbeam, C. J., Daaman, C. C., & Simmonds, L. P. (1995). Analysis of water budget in semi arid land from soil water records. Experimental Agriculture, 31, 131-149. http://dx.doi.org/10.1017/S0014479700025229
Pingali, P. L. (2001). Population and technological change in Agriculture. In N. J. Smelser & P. B. Baltes (Eds.), International Encyclopaedia of the Social and Behavioural Sciences (pp. 1-56). London: Pergamon. http://dx.doi.org/10.1016/B0-08-043076-7/04158-9
Sarvestani, Z. T., Pirdashti, H., Sanavy, S. A. M. M., & Balouchi, H. (2008). Study of Water Stress Effects in Different Growth Stages on Yield and Yield Components of Different Rice (Oryza sativa L.) Cultivars. Pakistan Journal of Biological Sciences, 11, 1303-1309. http://dx.doi.org/10.3923/pjbs.2008.1303.1309
Sebuliba-Mutumba, R., & Adipala, E. (1997). Effect of weed management practices on growth and yield of cowpea. African Journal of Plant Protection, 7, 35-43.
Seran, T. H., & Brintha, I. (2010). Review on Maize Based Intercropping. Journal of Agronomy, 9(3), 135-145. http://dx.doi.org/10.3923/ja.2010.135.145
Sharp, R. E., & Davies, W. J. (1985). Root growth and water uptake by maize plants in drying soil. Journal of Experimental Botany, 36(9), 1441-1456. http://dx.doi.org/10.1093/jxb/36.9.1441
Sheng, D., Na, L., Shuang-En, Y., Ming-Hui, W., & Dong-Li, S. (2014). Effects of controlled irrigation and drainage on growth, grain yield and water use in paddy rice. European Journal of Agronomy, 53, 1-9. http://dx.doi.org/10.1016/j.eja.2013.1010.1005
Simmonds, L. P., Mburu, M. W. K., & Pilbeam, C. J. (1999). Bean growth and yield response to irrigation, nitrogen fertilizer and planting density under temperate and tropical conditions. East Africa Agriculture and Forestry Journal, 65, 21-36.
Squire, G. R. (1990). The physiology of tropical crop production. CAB international Walling ford. Oxon, UK. Retrieved from http://www.cabdirect.org/abstracts/19900739022.html;jsessionid=8FB7CC5F1B5BF6C05C 6742C888CD5744
Stewart, J. I. (1983). Crop yields and returns under different soil moisture regimes. In J. C. Holmes & W. M. Tahir (Eds.), More food from better technology (Vol. 1, pp. 427-438). FAO. Rome, Italy.
Tarun, A., Gopal, K., Chakravarty, N. V. K., Katiyar, R. K., Deshmukh, P. S., & Joshi, H. C. (2013). Biomass and biomass water use efficiency in oilseed crop (Brassica juncea L.) under semi-arid microenvironments. Biomass and Bioenergy, 51, 154-162. http://dx.doi.org/110.1016/j.biombioe.2013.1001.1021
Tozzi, E. S, Easlon, H. M., & Richards, J. H. (2013). Interactive effects of water, light and heat stress on

www.ccsenet.org/jas Journal of Agricultural Science Vol. 6, No. 12; 2014
229
photosynthesis in Fremont cottonwood. Plant, Cell & Environment, 36(8), 123-143. http://dx.doi.org/10.1111/pce.12070
USDA. (1975). Soil Taxonomy. Soil survey staff, Washington, DC.
Yi, Z., Christopher, J. L., & Shu, F. (2014). Drought resistance and soil water extraction of a perennial C4 grass: Contributions of root and rhizome traits. Functional Plant Biology. http://dx.doi.org/10.1071/FP13249
Zhang, Y. J., Xie, Z. K., Wang, Y. J., Su, P. X., An, L. P., & Gao, H. (2014). Effect of water stress on leaf photosynthesis, chlorophyll content, and growth of oriental lily. Russian Journal of Plant Physiology, 58(5), 844-850. http://dx.doi.org/10.1134/S1021443711050268
Zhao, D., Shen, J., Lang, K., Liu, Q., & Li, Q. (2013). Effects of irrigation and wide-precision planting on water use, radiation interception, and grain yield of winter wheat in the North China Plain. Agricultural Water Management, 118, 87-92. http://dx.doi.org/10.1016/j.agwat.2012.1011.1019
Copyrights Copyright for this article is retained by the author(s), with first publication rights granted to the journal.
This is an open-access article distributed under the terms and conditions of the Creative Commons Attribution license (http://creativecommons.org/licenses/by/3.0/).