the effects of inheritance on constituents of plasma: a twin study … · the effects of...
TRANSCRIPT
1\1111 Gill iJiocl!clII 1l)1{4; 21: 176-IK~
The effects of inheritance on constituents of plasma: a twin study on some biochemical variables
J B W HIT FIE L D * and N G MAR TI N t From the * Department of Clinical Biochemistry, Royal Prince Alfred Hospital, Camperdown NSW 2050, Australia and the fDepartment of Population Biology, Research School of Biological Sciences, Australian National University, Canberra ACT 2600, Australia
SUMMARY. Heritability and within-person repeatability of thirteen constituents of plasma were assessed in a study of 206 pairs of male and female twins. Repeat measurements were available on 44 pairs. For bilirubin, calcium, creatinine. phosphate and potassium, the individuality of these characteristics was genetic in origin. Total protein, albumin and globulin showed significant heritability but considerable variation between occasions. while bicarbonate, chloride. iron. sodium and urea showed mainly environmental effects.
The inheritance of quantitative biochemical characteristics is relevant to clinical biochemistry for two reasons. Firstly, it has a bearing on the definition of reference ranges for individuals rather than populations. Secondly, many of the variables studied are of physiological as well as diagnostic importance and the differences between people and the inheritance of these differences are of interest.
Several studies have been carried out on the maintenance of differences in the composition of plasma between individuals. 1- 3 There could be at least three different sources of this variation; these may be either genetic or environmental. Genetic variance probably involves the additive effects of several genes since variation is continuous and there is no evidence of the modality we should expect if only one or two factors are segregating. Environmental causes in turn can be divided into the persisting effects of prenatal, neonatal, or childhood experiences shared by members of a family, and the environmental influences unique to each person and not shared within families. These last can contribute to biochemical individuality if they are constant for a person over time.
These three sources of variation can be distinguished by studies on monozygotic (MZ) and dizygotic (DZ) twin pairs, if certain assumptions are made. Unfortunately many twin studies suffer from inadequate numbers of subjects and consequently cannot estimate parameters such as heritability with any reason-
able degree of accuracy. 4 The largest twin study of biochemical variables5 arose from a study of coronary heart disease risk factors and was confined to middle-aged men. Because age and sex could influence the relative contributions of genetic and environmental factors we have carried out a study on young adult male and female twins.
This paper reports on thirteen plasma biochemical measurements, of which three in particular (bilirubin, calcium, and potassium) show some interesting genetic features, while others (bicarbonate, chloride, globulin, iron, and sodium) appear to be affected by shared environmental factors.
Subjects and methods
Two hundred and six pairs of MZ and DZ twins aged between 18 and 34 years (mean 23·1) were recruited from the Australian NH & MRC Twin Registry for a study of alcohol metabolism and susceptibility to intoxication.6 Both members of a pair attended on the same day. Of these twins 87 individuals (48 men, 39 women) attended on a second occasion from 1 to 17 months later (mean 4·5 months) and the results from these 1tfe used to assess medium-term repeatability of the measurements within an individual.
Blood was taken at about 10 a.m. into a heparin tube. centrifuged within 2 hours, and stored at 4°C for up to 48 hours. The following
176

Twin sllIdy: inheritance of plaslI/a cOllstilll('I/(S 177
tests were performed on a Technicon SMAC analyser: albumin, bicarbonate, bilirubin (total), calcium, chloride, creatinine. iron. phosphate. potassium, protein (total). sodium and urea. Plasma globulin was calculated as the difference between the total protein and albumin. The analytical methods remained the same for the 2 years of the study.
All twins were typed with 15 blood group antisera and for aI-antitrypsin. Twins were diagnosed as DZ on the basis of a difference in sex, at least one marker locus or, in a few cases large differences in height, colouring and other morphological features. In remaining cases of doubtful zygosity several more genetic markers were typed. It is possible, however, that there were a few pairs assigned to the MZ group who on still further typing would prove to be DZ.
Of the 206 twin pairs for whom measurements were avaHable. there were 43 MZ female, 44 DZ female, 42 MZ male, 38 DZ male and 39 DZ pairs of opposite sex (DZOS). There were no substantial differences in age distribution between the five zygosity groups, and no significant differences in means or variances between MZ and DZ pairs of the same sex.
The frequency distribution of each measure" ment was examined to see if deviations from Gaussian distributions occurred; only bilirubin showed a highly skewed distribution and a loglo transformation was performed. Since this study is concerned with normal subjects, it was
thought justifiable to exclude a few results which appeared to be outliers. as shown in Table I.
The presence of significant differences between individuals was tested by calculating the within-person (s';) and between-person (r.) components of variance on the 87 people who attended on two occasions. The ratio of between-person to total variance, s;,J(s'; + S;) is the intraclass correlation and is a measure of the degree of repeatable difference between people. or individuality.
The within-pair and between-pair mean squares for each of the five twin groups were calculated and a series of models of genetic and environmental contributions to total population variance was fitted to these using an iterative weighted least-square procedure. 7 Possible sources of variance included in the models are; V A, additive genetic variance; E2, variance due to environmental effects such as dietary habits which are shared by both twins of a pair but differing between pairs, and E" variance due to environmental effects unique to each individual. The simplest model, that only E1 effects contribute, is tested first and if it is rejected more complex models, EIE2 and ElVA, are fitted to the mean squares to test whether the between-pairs variance can be adequately explained by either family environment effects or additive genetic variance. The fit of alternative models is assessed by the chi-square criterion.
If one of these two parameter models is
TABLE 1. Truncation limits or transformation used, together with means and variances by sex and tests for significant differences in means between male and female subjects. There are no significant differences in total variances of males and females
Variable Units Range Male Female accepted or
s~ r transformation n i n i
Albumin gil 40-55 197 47·6 7·2 201 45·9'" 7·7 Bicarbonate mmolll 199 27-1 8·7 212 25·4'" 7·8 Bilirubin "molll log 199 1·09 0·048 212 0·91'" 0·039 Calcium mmolll 198 2·44 0·0085 212 2·39'·· 0·0075 Chloride mmolll 98-112 195 103-3 5·72 204 105·0'" 5·25 Creatinine "molll 199 84·9 129·9 212 72·2'" 104·9 Globulin gil 199 28·8 14·9 212 30·1" 15·1 Iron Ilffiolll 199 22·4 52·5 212 21·0 68·6 Phosphate mmolll 0-1-5 196 0·88 0·021 211 0·94'" 0·022 Potassium mmolll 199 4·13 0·12 212 4·12 0·11 Protein gil 199 76·3 14·4 212 75·9 15·1 Sodium mmolll 135-155 198 141·6 6·[ 211 140·8'" 4·9 Urea mmolll 0-8·5 195 5·24 1·0.\ 212 4·70'" 1·35
··P<O·Ol. ... P<O·OOI.
, 178 Whitfield and Martin
rejected and the other is not, the latter is accepted; otherwise a three-parameter model with contributions from EIE2 and VA is required. This procedure leads to a preferred model, estimates of the variance attributable to each source, and a test of the significance of each.
Results
Inspection of the frequency distributions led to the exclusion of a small number of results which appeared to be outliers. The greatest number of subjects excluded was for albumin (3·2%), with 2-9% excluded for chloride, 1-5% for phosphate and urea, and 0·5% for sodium. One result was missing for calcium. The means and variance for men and women after exclusion of outliers are shown in Table 1 and it will be seen that significant sex differences in meflns were found for ten of the variables but there were no significant differences between the sexes in the variances.
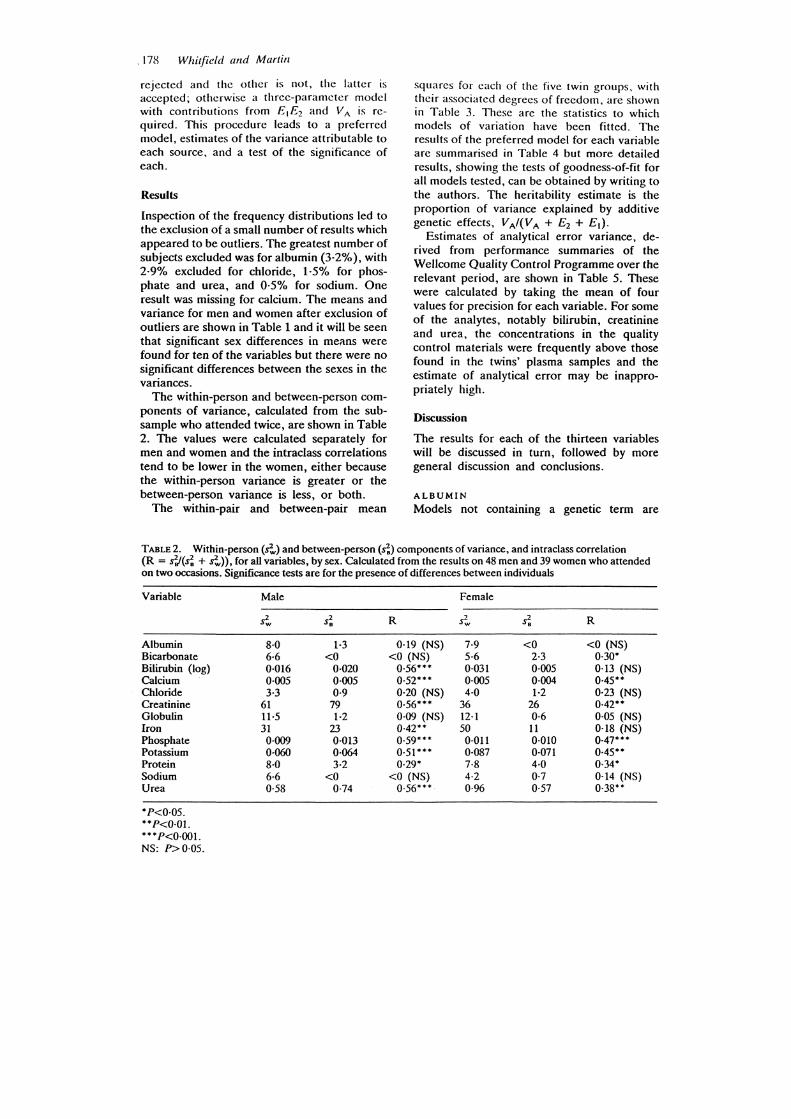
The within-person and between-person components of variance, calculated from the subsample who attended twice, are shown in Table 2. The values were calculated separately for men and women and the intraclass correlations tend to be lower in the women, either because the within-person variance is greater or the between-person variance is less, or both.
The within-pair and between-pair mean
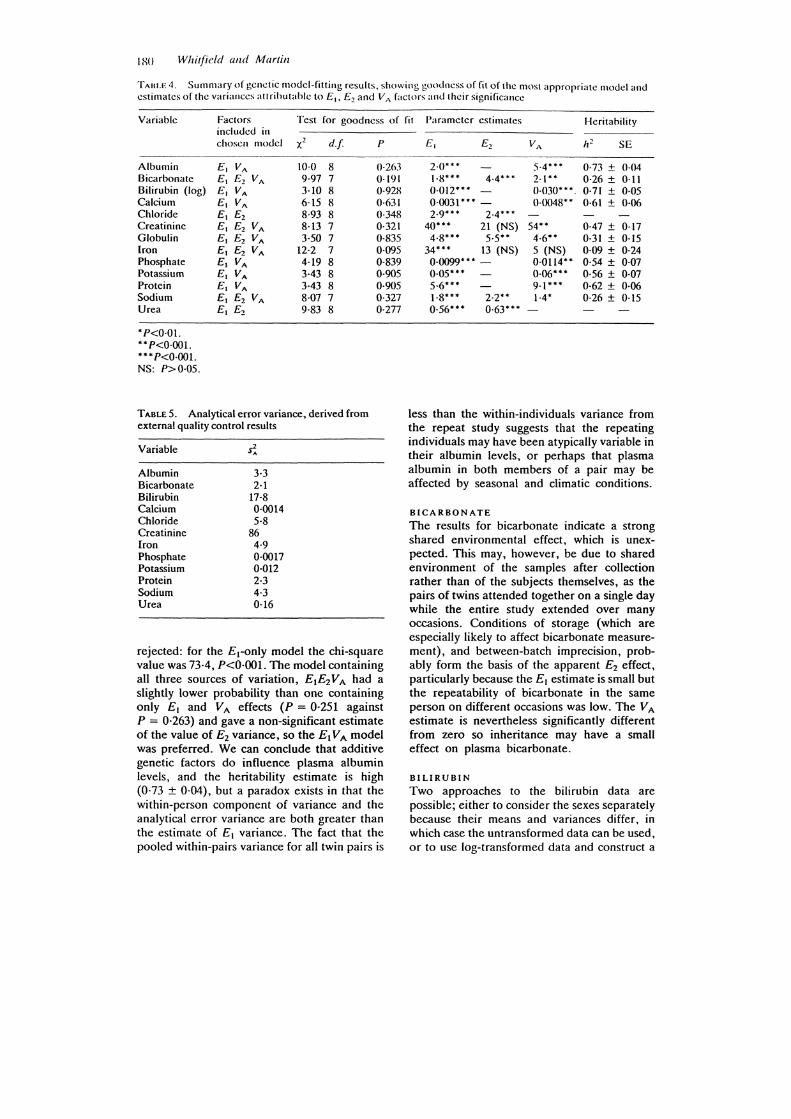
squares for each of the five twin groups, with their associated degrees of freedom, are shown in Table 3. These are the statistics to which models of variation have been fitted. The results of the preferred model for each variable are summarised in Table 4 but more detailed results, showing the tests of goodness-of-fit for all models tested, can be obtained by writing to the authors. The heritability estimate is the proportion of variance explained by additive genetic effects, V A/(V A + E2 + Ed.
Estimates of analytical error variance, derived from performance summaries of the Wellcome Quality Control Programme over the relevant period, are shown in Table 5. These were calculated by taking the mean of four values for precision for each variable. For some of the analytes, notably bilirubin, creatinine and urea, the concentrations in the quality control materials were frequently above those found in the twins' plasma samples and the estimate of analytical error may be inappropriately high.
Discussion
The results for each of the thirteen variables will be discussed in turn, followed by more general discussion and conclusions.
ALBUMIN
Models not containing a genetic term are
TABLE 2. Within-person (s;,) and between-person (s;) components of variance, and intraclass correlation (R = r"l(s; + s;,», for all variables, by sex. Calculated from the results on 48 men and 39 women who attended on two occasions. Significance tests are for the presence of differences between individuals
Variable Male Female
s;, S2 • R s~ S2 • R
Albumin 8·0 1·3 {)·19 (NS) 7-9 <0 <0 (NS) Bicarbonate 6·6 <0 <0 (NS) S·6 2·3 0·30-Bilirubin (log) 0·016 0·020 0·S6--- 0·031 O·OOS 0·13 (NS) Calcium O·OOS O·OOS 0·S2°·- O·OOS 0·004 0·4S·· Chloride 3·3 0·9 0·20 (NS) 4·0 1·2 0·23 (NS) Creatinine 61 79 0·S6··· 36 26 0·42*· Globulin 11'S 1·2 0·09 (NS) 12·1 0-6 O·OS (NS) Iron 31 23 0·42·' SO 11 0·18 (NS) Phosphate 0·009 0·013 0·S9"- 0·011 0·010 0·47-'-Potassium 0-060 0·064 O·SI··- 0·087 0·071 0·4S·· Protein 8·0 3-2 0·29- 7·8 4·0 0·34· Sodium 6·6 <0 <0 (NS) 4·2 0·7 0·14 (NS) Urea 0·S8 0-74 0·S6··· 0·96 0·S7 0·38··
·P<O·OS. ··P<O·Ol. ···P<O·OOI. NS: P>O·OS.

TABLE 3 .. Within-pair and between-pair mean squares, with associated degrees of freedom, by sex and zygosity. MZM, male MZ pairs; MZF, female MZ pairs; DZM, male DZ pairs, DZF, female DZ pairs; DZOS, DZ pairs of opposite sex. (The DZOS within-pairs mean squares are corrected for mean sex difference.)
Variable MZM MZF DZM DZF DZOS
Albumin Between 13-698 (40) 9·347 (39) to·605 (36) 15·157 (38) 7·761 (36) Within 1·805 (41) 2·225 (40) 3·149 (37) 5·115 (39) 4·718 (36)
Bicarbonate Between to·851 (41) 14·030 (42) 19·041 (37) 11·398 (43) 15·551 (38) Within 2·226 (42) 1·256 (43) 3·421 (38) 2·352 (44) 2·986 (38)
Bilirubin Between 0·08196 (41) 0·05757 (42) 0·06821 (37) 0·04988 (43) 0·06508 (38) (log) Within 0·01218 (42) 0·01244 (43) 0·02568 (38) 0·02378 (44) 0·02871 (38)
Calcium Between 0·01379 (41) 0·01313 (42) 0·00816 (36) 0·00878 (43) 0·01260 (38) Within 0·00296 (42) 0·00324 (43) 0·00742 (37) 0·00407 (44) 0·00590 (38) ~ Chloride Between 7·046 (39) to·306 (40) 9·881 (34) 5·641 (41) 6·050 (36) S· Within 3·125 (40) 2·024 (41) 2-629 (35) 3·262 (42) 3·333 (36)
:::. Creatinine Between 223·4 (41) 127-4 (42) 135·0 (37) 156·7 (43) 223·1 (38) } Within 42·2 (42) 36·9 (43) 56·6 (38) 64·3 (44) 85·2 (38) Globulin Between 21·307 (39) 25·211 (41) 20·292 (37) 16·247 (40) 18·802 (38)
Within 2·038 (40) 4·738 (42) 6·t05 (38) 4·024 (41 ) 7·863 (38) S· ::-
Iron Between 94·295 ( 41) 65·512 (42) 78·923 (37) 93·840 (43) 76·087 (38) '" " Within 36·005 (42) 30·640 (43) 17·871 (38) 46·091 (44) 56·775 (38) ~.
Phosphate . Between 0·03960 (40) 0·02925 (41) 0·02585 (37) 0·02647 (43) 0·02902 (36) , ;::;
Within 0·01111 (41) 0·00957 (42) 0·01314 (38) 0·01853 (44) 0·01132 (36) '" Potassium Between 0·1601 ( 41) 0·1394 (42) 0·1501 (37) 0·1419 (43) 0·1718 (38) ~
Within 0·0392 (42) 0-0552 (43) 0·0909 (38) 0·0815 (44) ()·O886 (38) " Protein Between 21·508 (41) 23·085 (42) 230429 (37) 19·055 (43) 19·497 (38) W Within 4·393 (42) 6·860 (43) 9·724 (38) 9·295 (44) to·873 (38)
Sodium Between 8·243 (41) 7·508 (42) 12-668 (36) 6·335 (43) 8·774 (37) Ei Within 1·500 (42) 1·988 (43) 2-811 (37) 2-352 (44) 2·533 (37) g
Urea Between 1·919 (39) 2·081 (42) 0·940 (37) 2·423 (43) 1·569 (36) ~. Within 0·670 (40) 0·500 (43) 0·486 (38) 0·509 (44) 0·677 (36)
~ :;;
-..J \C
IXO Whitfield alld Martin
TAIILE 4_ Summary of genctie model-fitting results. showing goodness of fit of the most appropriate model and estimates of the vari'lIlces attrihutahle to E,. E2 and V A factors and their significance
Variable Factors Test for goodness of fit Parameter estimates Heritahility included in choscn model X2 dI
Albumin E, VA 10·0 8 Bicarbonate E, E2 VA 9·97 7 Bilirubin (log) E, VA 3·10 8 Calcium E, VA 6-15 8 Chloride E, E2 8·93 8 Creatinine E, E2 VA 8·13 7 Globulin E, E-z VA 3·50 7 (ron E, E2 VA 12·2 7 Phosphate E\ VA 4-19 8 Potassium £, VA 3·43 8 Protein £, VA 3·43 8 Sodium £, £2 VA 8·07 7 Urea £, £2 9·83 8
·P<O·Ol. ··P<O·OOI. ···P<O·OOI. NS: P>0·05.
TABLE 5. Analytical error variance, derived from external quality control results
Variable
Albumin Bicarbonate Bilirubin Calcium Chloride Creatinine Iron Phosphate Potassium Protein Sodium Urea
3·3 2-1
17·8 0·0014 5·8
86 4·9 0·0017 0·012 2·3 4·3 0·16
P
0·263 0-191 0·928 0·631 0·348 0·321 0·835 0·095 0·839 0·905 0-905 0·327 0·277
rejected: for the EI-only model the chi-square value was 73·4, P<O·OOI. The model containing all three sources of variation, E1EzVA had a slightly lower probability than one containing only EI and V A effects (P = 0·251 against P = 0·263) and gave a non-significant estimate of the value of Ez variance, so the EI V A model was preferred. We can conclude that additive genetic factors do influence plasma albumin levels, and the heritability estimate is high (0·73 ± 0·04), but a paradox exists in that the within-person component of variance and the analytical error variance are both greater than the estimate of EI variance. The fact that the pooled within-pairs variance for all twin pairs is
E, E2 VA h2 SE
2·0*" 5·4··· 0·73 ± 0-04 1·8'" 4·4'" 2·1" 0·26 ± 0·11 0·012*" 0·030'" _ 0·71 ± 0·05 0·0031'" - 0·(1048" 0·61 ± 0·06 2·9'" 2·4'"
40*"'· 21 (NS) 54" 0·47 ± 0·\7 4·8'" 5·5" 4·6** 0·31 ± 0·15
34'" 13 (NS) 5 (NS) 0·09 ± 0-24 0·0099'" - 0·0114" 0·54 ± 0-07 0·05'" 0·06'" 0·56 ± 0·07 5·6'" 9·1'" 0·62 ± 0·06 1·8'" 2·2" 1·4' 0·26 ± 0·15 0·56'" 0·63'"
less than the within-individuals variance from the repeat study suggests that the repeating individuals may have been atypically variable in their albumin levels, or perhaps that plasma albumin in both members of a pair may be affected by seasonal and climatic conditions.
BICARBONATE
The results for bicarbonate indicate a strong shared environmental effect, which is unexpected. This may, however, be due to shared environment of the samples after collection rather than of the subjects themselves, as the pairs of twins attended together on a single day while the entire study extended over many occasions. Conditions of storage (which are especially likely to affect bicarbonate measurement), and between-batch imprecision, probably form the basis of the apparent E2 effect, particularly because the EI estimate is small but the repeatability of bicarbonate in the same person on different occasions was low. The VA estimate is nevertheless significantly different from zero so inheritance may have a small effect on plasma bicarbonate.
BILIRUBIN
Two approaches to the bilirubin data are possible; either to consider the sexes separately because their means and variances differ, in which case the untransformed data can be used, or to use log-transformed data and construct a
Twin study: inheritancc of plas/1/a constitucnts 181'
common model for both sexes. The latter makes fuller use of the data and is theoretically preferable but in some ways the two approaches lead to the same conclusions.
If untransformed data are used, both men and women show a heritability around 80% (0·81 ± 0·05 for men, 0·78 ± 0·05 for women) but both the E\ and V A components of variance are three times greater in men, as would be expected from the original frequency distributions. The log transformation allows combination of male and female data by reducing the differences between their total variances and including DZ opposite-sex pairs, and leads to a heritability estimate of 0·71 ± 0·05.
The repeatability is much lower in women than would be expected from the heritability estimate, and it is lower than in men both because of lower between-person and greater within-person variation.
Although none of the subjects had bilirubin levels high enough to cause visible jaundice, a high proportion had slight increases. Thirty-five men (18%) had a bilirubin above 20 tLmoVl, while this occurred in only five women (2%). These people are intermediate between the usual 'normal range' and visible jaundice, and might be classified as having Gilbert's syndrome. The inheritance of this condition has been difficult to reconcile with Mendelian dominant or recessive inheritance in family studies.8 but regarding these individuals as lying at one extreme of a continuous distribution generated in part by polygenic variation is an explanation which is more consistent with our data.
The sex difference in bilirubin levels has been a consistent finding in many studies, but the explanation is not known; presumably there are sex-dependent differences in bilirubin uptake or conjugation by the liver,
CALCIUM
The plasma total calcium shows significant heritability and no shared environmental effect. The repeatability within individuals is compatible with the heritability at around 50%.
Plasma total calcium levels are to some extent dependent on protein or albumin levels, both of which show genetic variation in this study. However we cannot be sure if this link is the cause of the apparent heritability of calcium, or if ionised calcium must also be considered. In the latter case, the sensitivity of the parathyroid to plasma ionised calcium would have to show genetic variation.
There appears to be a link between plasma total calcium and blood pressure,'l which is itself in part an inherited characteristic, but which is cause and which effect is at present unknown.
CHLORIDE
It proved necessary to consider only those subjects with chloride of 98-112 mmoVl to obtain an acceptable fit for any model; there is no evidence for any genetic variation and it seems likely that the shared environmental component reflects either climatic differences between occasions (remembering that both members of a twin pair attended on the same day) or between-batch imprecision.
CREATININE
All three sources of variation appear to affect plasma creatinine, but the E2 component is small and does not reach statistical significance. The heritability is 0·47, which is slightly less than the repeatability. Because creatinine is derived from muscle creatine, body build is probably the major source of the genetic effect on creatinine, but genetic effects on glomerular filtration rate might also exist.
GLOBULIN
The measurement of plasma globulin is subject to greater uncertainty because it is measured indirectly, as the difference between total protein and albumin. The variation between occasions in the same person is considerable (Table 2) but there appear to be significant genetic and shared environmental effects (Table 4). If true, this would mean that a pair of twins are more similar to each other on a single day than a person is to himself on two different occasions, which is possible but seems rather unlikely. Unfortunately there appear to be no other studies on the within-individual repeatability of plasma globulin with which to compare our repeatability results, which might be unreliable because of the comparatively small number of subjects.
The plasma immunoglobulin concentrations, which make up a major part of the globulins, have been shown to be under some degree of genetic control. 10
IRON
There is significant individuality for plasma iron in men but not women. The blood samples were all taken at the same time of day, so this source of variation is eliminated; but recent food
1 R2 Whitfield and Martin
intake was not standardised, and in women variation related to the menstrual cycle I I would also tend to reduce the repeatability.
Therefore the failure to demonstrate significant genetic or shared environmental effects is not surprising, and a combination of analytical and (more importantly) temporal variation, reflected in the EI estimate, accounts for about two-thirds of the variance.
PHOSPHATE
Repeatability and heritability are each slightly greater than 50% for phosphate. Others have favoured an environmental explanation for differences in plasma phosphate,S but this is not supported by our results.
POTASSIUM
Results for plasma potassium indicate that there are significant genetically determined differences between individuals. The El VA model gave a good fit to the data and the addition of the shared environment parameter (£2) to the model gave no improvement in fit and produced a negative estimate for the E2 variance component. The repeatability estimate is also consistent with the heritability, and with a previous estimatt? of the individual nature of plasma potassium.
One previous study on renal sodium and potassium handling in twins found a genetic effect on plasma potassium but only after sodium loading, not in the normal state. However their number of subjects was less (55 pairs), so an effect might have existed before the sodium load without reaching significance.
Plasma potassium is probably a poor indicator of whole body potassium, at least in disease13 and so the genetic difference between individuals is more likely to be in the balance between cellular and extracellular potassium and/or renal tubular reabsorption. Several groups have claimed to show differences between people in cell membrane sodium! potassium transport 14 although the results, using various different assay systems, are rather inconsistent.
PROTEIN
The plasma total protein concentration appears to be heritable but, as with albumin, the repeatability between occasions is less than would be expected. Genetic effects are probably present but our estimate of h2 (0·62) must be regarded as tentative.
SOLJIUM
The model containing all three sources of variation provides the best fit to the data for sodium, with genetic factors of only marginal significance. Analytical variation, both within and between occasions, together with possible climatic effects between occasions, probably accounts for most of the variation. Other workers have also found very little individuality for plasma sodium. 2
UREA No genetic variation could be demonstrated for urea concentration, but a significant shared environmental effect was present. Its magnitude was similar to the repeatability.
This result may be contrasted with the other measure of renal function, creatinine. Urea is strongly affected by the protein content of the diet, so this may be the source of the shared environment effect.
GENERAL
We are not aware of any previous study on these biochemical variables which measured both heritability and repeatability. In several cases, these two conflict, since the repeatability should always be equal to or greater than the heritability. 15 Previous measurements of repeatability have not distinguished between men and women, and it is important to do so when the mean values of the two sexes differ because sex confers its own individuality (or, more formally, inflates the between-individuals component of variance).
Recalculation of the results of Pickup et af., 1
who studied only men, showed results very similar to ours. Of the variables reported in both their study and this paper, phosphate showed the greatest 'individuality' and sodium the least. The only notable difference is in that study the within-person repeatability of both total protein and albumin is greater than our results would indicate; this may well be due to the greater ambient temperature range in Sydney than in London.
Just as heritability should logically be no greater than the repeatability, the analytical error variances should be less than the withinperson component of variance found from the repeat subjects. Comparison of Tables 2 and 5 shows that this is indeed so, except for chloride and creatinine; in the latter case inclusion of quality control samples with high creatinines will have increased the analytical error estimate.

TlI'in .WlIlIy: inherital/ce of plasl/la constifllell1S 183
Analytical errors arc also relevant to the shared environmental effects (£2) found for bicarbonate, chloride, creatinine, globulin. iron, sodium and urea. Since samples from the two members of a twin pair were analysed in the same batch, and within-run imprecision is normally less than between-run imprecision, these £2 effects are probably in part artefacts caused by the shared analytical, rather than the shared human environment. A true £2 effect probably exists for urea, however, because the between-run imprecision (which assuming zero within-run imprecision sets a limit on betweenrun effects) is considerably less than £2 variance estimate.
The interpretation of twin studies in terms of genetic and environmental causes of differences is based on a number of assumptions, notably that twins are representative of the total population and that the environmental similarity of MZ and DZ pairs is the same. For these variables these assumptions seem reasonable, and the first is supported in that the means and ranges of all the results are close to those expected for the general population.
The only previous similar study concluded that genetic variability played a role in controlling glucose, urea, uric acid and bilirubin.s We are unable to present results for glucose because some subjects were fasting and others were not; we disagree on the source of variation in urea, but agree that there is genetic variation for bilirubin. Uric acid shows genetic effects, complicated by the effects of alcohol consumption, and these results will be published separately.
Many of the other results of Havlik et al. 5
could not be interpreted because of differences in either means or variances between the MZ and DZ pairs, but we did not encounter this problem in our sample, even before the exclusion of extreme results as described above. Some of the differences between their results and ours would be due to the greater age of their subjects (42-56 years).
To summarise, we agree with others that many .. biochemical variables show a smaller range of variation within each person than between people, and we have found that for many variables the repeatable variation between the individuals is partly under genetic control.
Acknowledgements
We are grateful to the twins of the Australian
NH & MRC Twin Registry who participated in this study, to Janet Craig who organised collection of the samples and to the staff of the Department of Clinical Biochemistry, Royal Prince Alfred Hospital, for analysing them. The larger project of which this is a part was funded by the Australian Associated Brewers.
References
I Pickup JF. Harris EK, Keams M, et al. Intraindividual variation of some serum constituents and its relevance to population based reference ranges. Clin Chern 19TI; 23: 8-\2-50.
2 Van Steirteghem AC. Robertson EA. Young OS. Variance of components of serum constituents in healthy individuals. Qin Chern 1978; 24: 212-22.
3 Williams GZ. Widdowson GM. Penton 1. Individual characters of variation in time-series studies of healthy people. Qin Chem 1978; 24: 313-20.
4 Martin NG. Eaves U, Kearsev MJ, et al. The power of the classical twin study. Heredity 1978; 40: 97-116.
5 Havlik R. Garrison R. Fabsitz R. Feinleib M. Genetic variability of clinical chemical variables. Clin Chem 19TI; 23: 659-62.
6 Martin NG; Oakeshott lG, Gibson lB, et al. Prodromus to a twin study of sensitivity to intoxication and alcohol metabolism. Aust NZ J Med 1981; 11: 140-3.
7 Clark p. Jardine R, Martin NG. et al. Sex differences in the inheritance of some anthropometric characters in twins. ACla Genet Med Gemellol 1980; 29: 171-92.
8 Schmid R, McDonagh AF. Hyperbilirubinaemia. In: Stanbury lB. Wyngaarden JB, Fredrickson OS, eds. The Metabolic Basis of Inherited Disease, 4th edn. New York: McGraw-Hili, 1978: 1243-5.
9 Robinson O. Bailey AR, Williams PT. Calcium and blood pressure. Lancet 1982; Ii: 1215-6.
10 Clark P, Jardine R. Jones p, et al. Directional dominance for low IgM and IgA levels. Arner J Hum Genet 1981; 33: 709-21.
11 Mardell M, Zilva JF. Effects of oral contraceptives on the variations in serum iron during the menstrual cycle. Lancet 1967; ii: 1323-5.
12 Grim CE, Miller JZ, Luft FC. et al. Genetic influences on renin. aldosterone. and the renal excretion of sodium and potassium following volume expansion and contraction in normal man. Hypertension 1979; I: 583-90.
13 F1ear CfG, Cooke WT. Quinton A. Serum potassium levels as an index of body content. Lallcet 1957; i: 458-9.
14 Editorial. Cells, ions and blood pressure. Lancet 1982; ii: 965-7.
15 Falconer OS. Ifllroductioll to Quafllitative Genetics. 2nd edn. London: Longman. 1982.
Accepted for publicatioll 16 S('l,/ember 1983