the effects of high fiber diets and feeding partitions …
TRANSCRIPT

THE EFFECTS OF HIGH FIBER DIETS AND FEEDING PARTITIONS ON THE WELL-
BEING OF GROUP-KEPT SOWS
BY
MAYRA LOPEZ
THESIS
Submitted in partial fulfillment of the requirements
for the degree of Master of Science in Animal Sciences
in the Graduate College of the
University of Illinois at Urbana-Champaign, 2015
Urbana, Illinois
Master’s Committee:
Associate Professor Janeen Salak-Johnson, Chair
Professor Hans-Henrik Stein
Professor Matthew Wheeler

ii
ABSTRACT
The European Union, Canada, and numerous states in the United States have banned the
use of gestation stalls. As a result pork producers have to either retrofit their existing gestation
barns or build new ones in order to comply with the group-housing mandates. One of the main
concerns with housing sows in groups is the increased aggression at mixing and around limited
resources, especially feed and water. Grouped-housed sows establish a social hierarchy upon
mixing which often reduces aggressive encounters later-on (Greenwood et al., 2014; Velarde,
2007; Li, 2012). During gestation, sows are often limit-fed to prevent obesity, thus feed becomes
a limiting resource and as a result aggression occurs during feeding time despite an established
hierarchy. Physiological demands of pregnancy increases the energy demands of the dry sow
(Prunier et al., 2010; Marchant et al., 1995); and in group pens demand is further increased due
to variability in feed intake and increased aggression. Hence, these drawbacks of group housing
need to be minimized in order to improve the productivity and well-being of sows. The objective
of this thesis was to assess the effects of housing sows in group-pens equipped with feeding
partitions of different lengths and feeding high fiber diets that differ in energy levels on sow
well-being using a multidisciplinary approach. The multiple measures included performance,
productivity, physiology, and behavior. The results of this study show that regardless of dietary
treatment (30% wheat middlings and 15% soybean hulls or 30% DDGS and 30% corn germ
meal) there were minimal effects on the overall well-being of sows, except for average piglet
weaning weight. Similarly housing sows in pens with either 0.6 m or 1.8 m long feeding
partitions did not affect sow performance or productivity, but aggression and body lesion scores
were reduced by housing sows in pens equipped with 0.6 m long feeding partitions.

iii
ACKNOWLEDGEMENTS
First and foremost I would like to thank Dr. Janeen Salak-Johnson for believing in me,
encouraging me to do better, and listening to me in my troubling moments. I have learned so
much under her guidance and I appreciate all her help in writing this thesis. I would like to thank
Drs. Hans Stein and Matthew Wheeler for being part of my committee and helping me through
this process. All the people at the Swine Research Center, especially Glenn and Matt, deserve a
special thank you for all their time and help over the past 2 years. I would also like to express
my gratitude to Eridia Pacheco for working with me throughout this study and for sharing her
knowledge. Also, thank you to Ashley DeDecker for her willingness to answer my questions,
and the rest of the graduate students who helped one way or another. I also want to thank all the
undergraduate students who volunteered and assisted in the lab, your help was much appreciated.
I want to thank my family for all their unconditional support and love. Last but not least, I want
to thank Bernardo Salazar for being there since the beginning of this journey, his patience, and
his support.

iv
Table of Contents
Chapter 1: Review of Literature…………………………………………………………………..1
Chapter 2: High fiber diets and feeding partitions impact the performance
and body lesion scores of group-kept gestating sows………………………………..20
Chapter 3: Effects of high fiber diets and feeding partitions on immune status
and behavior of group-kept multiparous sows……………………………………….44
Appendix A………………………………………………………………………………………62
Appendix B………………………………………………………………………………………83

1
CHAPTER 1:
REVIEW OF LITERATURE
Introduction
The United States is the second largest pork producer in the world with over 2.8 million
sows farrowing each quarter (Animal Production, 2015; Pork Production, 2013). Numerous
states, such as Florida, Arizona, California, and Colorado, have either passed or proposed
legislation banning or limiting the use of the individual gestation stall (National Agricultural
Law Center, 2014). As a result many pork producers are transitioning toward group housing
systems, however there are concerns with group-housing of gestating sows, in terms of increased
aggression at mixing and lesions, and variability in body condition scores (BCS) which may
have negative effects on sow well-being. Physiological demands of pregnancy increase the
energy demands of the dry sow (Prunier et al., 2010; Marchant et al., 1995) while increased
aggression and variability in feed intake among sows housed in group pens further increases this
demand. Hence, these drawbacks of group housing of gestating sows needs to be mitigated or
minimized in order to improve sow performance, productivity, and well-being.
Stress and the Well-being of Sows
Stress can be defined as “a real or interpreted threat to the physiological or psychological
integrity of an individual that results in physiological and/or behavioral responses,” (McEwen,
2010). Cannon (1932) coined the term “homeostasis,” which refers to the concept that organisms
have internal set points and deviations from these internal set points leads to the organism
making the appropriate physiological adjustments to re-establish the set point in order to survive.

2
For example, an animal needs to maintain a set blood pH and once it deviates from the set point
the animal will make physiological adjustments in order to return to baseline level. However,
homeostasis essentially applies to those physiological systems that are essential for life, while the
term “allostasis” applies to systems that can change based on an individual’s environment thus
allowing the animal to adapt (Sterling and Eyer, 1988; McEwen, 2010).
When faced with a stressor an animal elicits a biological response in its attempt to cope
with stress and if the appropriate response is initiated animal well-being may not be
compromised. Conversely, if an animal is unable to successfully cope or adapt its life
expectancy and productivity may be compromised (Broom, 1991). Many factors can influence
the type of biological response evoked by an animal, such as the type (physical or perceived) and
duration (chronic or acute) of the stressor (Salak-Johnson and McGlone, 2007). More
specifically, Salak-Johnson et al. (2012; 2007) showed that sows group-housed at different floor-
space allowances and/or housed in stalls elicit different biological responses, specifically
immunological or behavioral, in attempt to cope with the different constraints of each
environment but if the appropriate response is initiated there will be minimal effects on
performance and productivity. In addition, Couret et al. (2008) found that gilts subjected
repeatedly to social stress had higher cortisol concentrations compared to gilts not exposed to
social stress, but there was no effect on litter performance.
Contrary, when an animal has difficulty coping with stress this can be detrimental to its
overall well-being. Animals exposed to prolonged or multiple stressors may lead to an allostatic
overload because of an inadequate response to the impingement(s) (McEwen, 1998). McEwen
(2010) describes four responses that can potentially lead to an allostatic overload: a) frequent
stress, b) failure to habituate, c) failure to shut-down the response, and d) inadequate response. In

3
the face of a stressor, the hypothalamic-pituitary-adrenal (HPA) axis is activated which leads to
the secretion of cortisol (Bellavance and Rivest, 2014; Mellor et al., 2000). In addition, HPA axis
hormone corticotropin releasing factor (CRF) can activate the sympathetic system leading to the
release of catecholamines. Repeated stress or prolong stress can lead to high cortisol levels and
once the animal fails to cope with the stress it may experience distress. Distress can compromise
well-being since the animal must divert nutrients from other biological resources to cope with the
stressor (Moberg and Mench, 2000).
Stress can affect performance, physiology, and overall health of the dry sow. Aggressive
interactions can elicit a physiological response such as increased heart rate, especially during the
physical encounter or when the animal loses the fight (Marchant et al., 1995). Often, when sows
are housed in group pens, aggression occurs around feeding time, specifically higher ranked
sows will use aggressive behaviors to displace lower ranked sows which leads to insufficient
feed intake by lower ranked sows (Csermely and Wood-Gush 1990; Kranendonk et al., 2007).
Food deprivation increases cortisol levels and if prolonged, animals will lose body weight and
can lead to reproductive failure (Anderson, 1975; Tsuma et al., 1996; Mburu et al., 1998).
Furthermore, chronic stress (e.g., long-term tethering) can cause increased cortisol and decreased
pituitary gland weight (van der Staay, 2010). Increased cortisol levels by exogenous ACTH
injections can negatively affect embryonic development (i.e. decrease embryonic cleavage rate;
Razdan et al., 2002).
Stress can also elicit a behavioral response with the most common behaviors associated
with compromised welfare being stereotypic behaviors, specifically oral-nasal-facial and sham
chewing. When sows have difficulty coping with their environment often times they will perform
stereotypic behaviors in attempt to cope, thus sows that are tethered during gestation showed
4
more stereotypic behavior (Wiepkema and Schouten, 1992). Furthermore, gilts and sows can
elicit both behavioral and physiological responses simultaneously in an attempt to cope with a
stressful environment. Tethered gilts performing increased stereotypic behaviors, such as chain
manipulation, have lower heart rate and tethered sows have higher metabolic rate and produce
more heat (Schouten and Wiepkema, 1991; Cronin et al., 1986).
Stress and the Immune System
The immune system can be divided into two branches: innate and adaptive immunity.
The former is the first line of defense and acts quickly when a pathogen is present. Adaptive
immunity is slower, acquired through experience, and is antigen specific. The majority of cells,
including neutrophils, eosinophils, and monocytes, are all part of innate immunity, while
lymphocytes are considered to be part of adaptive immunity (Dranoff, 2004). Stress can affect
the number and activity of white blood cells. Acute stress leads to a decrease in the number of
lymphocytes but an increase in neutrophils, which results in an increase in neutrophil-to-
lymphocyte ratio—classic sign of acute stress (Davis, 2008). Furthermore, stress can suppress
neutrophil chemotaxis and Natural Killer (NK) cell activity (Rhodes et al., 2005).
Within the lymphocyte population the primary cells of interest are the T- and B-cells, and
within these populations there are subpopulations of T-cells including helper, killers, and
suppressors (Mosmann and Coffman, 1989). T-helper cells play an important role in immune
activation, these cells are derived from naive T-cells and further differentiate into T-helper 1
(Th1) or T-helper 2 (Th2) cells depending on the cytokines present. For instance, in the presence
of Interleuken-12 (IL-12) a naïve T cell will differentiate into a Th1 cell. These Th1 cells are
associated with cellular immunity and a pro-inflammatory response; while Th2 cells activate
humoral immunity and are anti-inflammatory (Mosmann and Sad, 1996). It is believed that Th1

5
and Th2 cells need to be balanced in order to maintain homeostasis, however, stress can create an
unbalanced Th1/Th2 because cortisol primarily enhances Th2 cytokines and suppresses Th1
cytokines. Moreover, catecholamines suppress IL-12 and enhance the Th2 cytokine Interleukin
10 (IL-10; Elenkov et al., 1996). An enhanced Th2 response leads to an increase in Th2 cells
(e.g. B cells, eosinophils, mast cells) and decrease in Th1 cells (e.g. T cells, NK cells,
macrophages). An animal with an enhanced Th2 response may be more capable of eliminating
parasitic antigens, but less effective at eliminating viruses and intracellular pathogens due to the
suppression of Th1 cytokines.
Pen design, space allowance, and group size have all been shown to affect various
immune measures (Barnett et al., 1992; Salak-Johnon et al., 2012; Hemsworth et al., 2013).
Housing gilts in pens with partial feeding partitions can lower cortisol levels and enhance cell-
mediated immunity compared to gilts housed in pens without feeding partitions (Barnett et al.,
1992). Gilts housed at a reduced space allowance of 0.98 m² had elevated cortisol levels and
reduced cell-mediated immunity, however Salak-Johnson et al. (2012) reported that sows housed
in pens with a space allowance of 3.3 m² had higher neutrophil-to-lymphocyte ratio and LPS-
induced lymphocyte proliferation, but lower NK cytotoxicity compared to sows allotted a
reduced space allowance of 1.4 m². Hemsworth et al. (2013) found that sows housed in groups
of 10 had lower neutrophil-to-lymphocyte ratio at d 2 post-mixing compared to sows in groups
of 30 or 80 but at d 51 sows in groups of 80 had the highest neutrophil-to-lymphocyte ratio.
Stress can enhance, suppress or have no effect on the immune system, thus when using immune
measures to assess welfare, both innate and adaptive immunity needs to be considered because
these two arms work together not independently of each other.
6
Concerns with Housing Sows in Groups
A major drawback of group housing is an increase in aggression at mixing and around
limited resources, such as feed and water. Grouped-housed sows establish a social hierarchy
upon mixing which often reduces aggressive encounters later-on (Greenwood et al., 2014;
Velarde, 2007; Li, 2012). Most aggression among group-housed sows occurs within the 1st 24-
hours post mixing and after a few days the hierarchy remains relatively stable (Pedersen et al.,
1993). During gestation, sows are often limit-fed to prevent obesity, thus feed becomes a limited
resource, which leads to increased aggression during feeding time despite an established
hierarchy.
Sow social rank and parity can also affect aggressive behavior. Higher ranked gilts tend
to show more aggression, while lower rank gilts receive more aggression (Medl et al., 1992).
When sows are individually fed, social rank influences the order in which they consume their
feed. Dominant sows will receive their feed allotment first when housed in pens that use an
electronic sow feeding system, often they will enter the first stall of a stall feeding system
(Hunter et al., 1988; Gonyou, 2001). In addition, when sows are floor-fed higher ranked sows
will “guard” feed by staying in the center of the pile allowing lower ranked sows access to feed
on the outer-edges of the pile (Csermely and Wood-Gush 1990). Furthermore, dominant sows
will displace submissive sows from the feeder, resulting in higher ranked sows consuming more
feed than lower ranked sows (Andersen et al., 1999; Kranendonk et al., 2007). Thus, higher
ranked sows gain more body weight during gestation than lower ranked sows resulting in greater
variability in BCS among the group. Sows that consume more than their daily feed allotment
tend to be heavier and obese, while those sows that consume less than their daily feed allotment
tend to be lighter. Both, obese and too thin sows may have reproductive problems thus

7
compromising sow well-being (Gonyou, 2001). Social rank tends to be related to parity, meaning
higher parity sows are often the more dominant sow within the group (Hunter et al., 1988).
Strawford et al. (2008) found that parity ≥4 sows are involved in more and longer aggressive
encounters than lower parity sows. Gilts tend to avoid aggressive encounters, Salak-Johnson et
al. (2007) reported that gilts had lower lesion scores than higher parity sows when housed in
group pens and floor-fed.
Many factors, such as group size and floor space allowance can affect aggression. When
comparing group sizes of 5, 10, 20, and 40 sows per pen more aggressive behavior is often
observed among larger groups of sows (Taylor et al., 1997). Hemsworth et al. (2013) found that
housing 10 sows per pen resulted in less injuries compared to housing 30 or 80 sows per pen. In
addition, they showed that as space allowance increased from 1.4 m² to 3.0 m² per sow there was
a reduction in cortisol concentrations and aggression during feeding. Similarly Salak-Johnson et
al. (2007) demonstrated that sows allotted at 1.4 m² of floor-space per sow resulted in greater
lesion scores and lower BCS compared to sows that were allotted at 2.3 m² or 3.3 m² per sow.
Also, total lesion severity score was higher for sows kept at 1.7 m² as opposed to 2.3 m² of floor-
space per sow (DeDecker et al., 2014).
The way sows are managed (statically or dynamically) and feeding system used in group
housing systems can affect the amount of aggression that occurs within the group of sows. Static
groups are typically only mixed once and remain static throughout gestation. Conversely,
dynamic groups are mixed more than once by removing and adding new sows to an already
established group. Anil et al. (2006) found that sows fed using an electronic sow feeding system
and managed as a dynamic group had higher injury scores than did sows maintained in static
groups or sows that were mixed twice. Similarly sows managed in a static group of 35-40 sows
8
have less lesions than if managed in a dynamic group with more than 100 sows (Li and Gonyou,
2013). In addition, the type of feeding system used can affect the aggressive behavior and sow
BCS. There is more aggression and injuries when sequential feeding systems (e.g. electronic sow
feeder) are used compared to simultaneous feedings systems (e.g. DDD) are used (Krause et al.,
1997; Chapinal et al., 2010). Yet, there is more sow displacement in the latter system leading to
greater variability in BCS because some sows will eat more feed than other sows.
The time of mixing post-breeding can affect aggressive encounters and reproductive
performance. Mixing sows at 35 days post-breeding resulted in less aggressive encounters, lesion
scores, and cortisol concentrations than if sows were mixed prior to day 35 (Strawford et al.,
2008; Stevens et al., 2015). Conversely, Knox et al. (2014) found that mixing sows 13 to 17 days
post-breeding resulted in less fighting bouts compared to sows that were mixed at 3 to 7 days or
35 days post-breeding. Often times mixing sows before implantation can negatively impact
reproductive performance, such that farrowing and conception rates were reduced among sows
that were mixed prior to day 9 post-breeding (Li and Gonyou, 2013; Knox et al., 2014).
Sow Group Housing and Well-being: Behavior
Stereotypic behaviors are defined as “repetitive, unvarying and apparently functionless
behavioral patterns,” (Mason et al., 2007). The stereotypic behaviors commonly performed by
sows are oral-nasal-facial (ONF) behaviors, such as rooting and bar biting, in group housing the
most prevalent stereotypic behavior displayed by sows is sham chewing (Rushen, 1985; Vieuille-
Thomas et al., 1995). Some research has shown that gestating sows tend to perform more
stereotypic behaviors when housed in individual stalls as opposed to sows in group pens
(Arellano et al., 1992). While others have found no differences in occurrence of ONF behaviors
between sows housed in individual stalls vs. group pens (reviewed by McGlone et al., 2004).

9
Sow age and parity are also associated with the development of stereotypic behaviors, with
higher parity sows more likely to develop these types of behaviors.
In general, some believe that stereotypic behavior compromises well-being of sows, but
others believe that these behaviors also serve as coping mechanisms or are part of pre- and post-
feeding behavioral sequences (reviewed by Lawrence and Terlouw, 1993). Sekiguchi and
Koketsu (2004) found sows that perform more sham-chew behavior had less piglets born
compared to sows that did not perform this behavior; yet, other reproductive performance
measures were not different. However, stereotypic behaviors may be used as a coping
mechanism in an attempt to cope with a stressful environment (Wiepkema and Schouten, 1992;
Mason et al., 2007). Furthermore, stereotypic behaviors can develop due to lack of satiety when
sows are fed a limited amount of feed (Danielsen and Vestergaard, 2001). Terlouw et al. (1991)
showed that gilts that were fed 2.2 kg per day had an increase in activity, chain manipulation,
and pre-feeding sham chewing compared to gilts that were fed 4.0 kg per day. Also, when sows
were fed 2.5 kg per day they performed more ONF behaviors compared to those that were fed
4.0 kg/day (Terlouw et al., 1993).
Feeding strategies, such as modified gestational diets, can be used to reduce stereotypic
behaviors by improving sow satiety. Adding fiber to gestational diets allows sows to feel “fuller”
because high fiber diets are bulkier and sows take longer to consume them (Rebert and Farmer,
1997; Guillemet et al., 2006). Furthermore, feeding high fiber diets to sows can reduce sham
chewing, bar biting, and foraging behaviors (Brouns et al., 1994; Rebert and Farmer, 1997;
Whittaker et al., 1998; Danielsen and Vestergaard, 2001; DeDecker et al., 2014). The fiber
source and amount used in the diet are important factors that need to be taken into account
because not all sources provide the same amount of fiber or have the same physiological effects.

10
Robert et al. (1993) found that feeding sows a wheat bran and corn cobs fiber diet was more
effective at reducing stereotypic behaviors while increasing time spent lying compared to feeding
sows an oat hulls and oat fiber diet. Furthermore, certain fiber sources do not reduce stereotypic
behaviors, for instance feeding a supplemented fortified sorghum-soybean meal with 25% beet
pulp did not reduce ONF behavior in gilts (McGlone and Fullwood, 2001). Similarly feeding
sows a high fiber diet composed of corn-soybean meal with 40% soybean hulls did not decrease
stereotypic behaviors, but the diet did increase the time sows spent eating (Holt et al., 2006).
Feeding high energy diets can also reduce stereotypic behaviors such as sham chewing and chain
manipulation (Gonyo, 1997; Robert, 1997).
Furthermore, feeding high fiber diets can increase time spent lying and decrease
aggressive behavior among group housed sows. de Leeuw et al. (2004) found that sows fed a
high fiber diet spent less time active and made less frequent postural changes for several hours
post-feeding. Similarly, others reported a decrease in activity and an increase in time spent lying
among sows fed a high fiber diet (Robert et al., 1993; Brouns et al., 1994). Furthermore, sows
fed a high fiber diet had less severe vulva lesion scores and engaged in less aggression compared
with sows fed a low fiber diet (DeDecker et al., 2014; Danielsen and Vestergaard, 2001).
Similarly to feeding high fiber diets, feeding sows high energy diets also results in increased
lying and reduced overall activity (Bergeron and Gonyo, 1997).
The use of feeding partitions may also help reduce aggressive encounters among group
housed sows. When sows are restricted fed they fight to access feed, thus feeding partitions
provide partial protection for sows during feeding. Feeding sows in pens equipped with partial
feeding partitions have been shown to reduce the occurrence of aggressive interactions among
sows during feeding as opposed to feeding sows on the floor without partitions (Barnett et al.,

11
1992). The length of the feeding partitions is also important, the use of full body partitions result
in reduced aggression and displacement and allows submissive sows to spend more time at the
trough than does shoulder length feeding partitions (Andersen et al., 1999).
Sow Group Housing and Well-being: Performance and Productivity
The performance and productivity metrics include sow body weight, back-fat depth, and
litter-related traits (e.g. total piglets born, litter weight, weaning weight, etc.). Anil et al. (2003)
found that sows in individual stalls had higher farrowing rates than sows housed in groups with
electronic sow feeders, but litter size, piglets born alive, and number of stillborns were not
different. Yet, Bates et al. (2003) showed that sows in group pens and fed using an electronic
sow feeder had heavier piglets both at birth and weaning compared to sows in stalls. Similarly,
Seguin et al. (2005) found that group housed sows had larger litters compared to sows housed in
stalls, while Zhou et al. (2014) showed no difference in the number of piglets weaned, piglet
birth weight, or weaning weight between sows housed in pens or stalls. Furthermore, no
difference in sow back fat depth was found between sows in group pens and stalls. When
comparing a large group (26 sows), small group (6 sows), and individual gestation stalls, sows
housed in large groups gained less body weight during gestation and had lowest farrowing rate
than sows housed in small groups or stalls (Johnston and Li, 2013).

12
Literature Cited
Anderson, L. L. 1975. Embryonic and placental development during prolonged inanition in the
pig. Am. J. Physiol. 229:1687-1694.
Andersen, I. L., Bøe, K. E., and Kristiansen, A. L. 1999. The influence of different feeding
arrangements and food type on competition at feeding in pregnant sows. Appl. Anim.
Behav. Sci. 65:91-104.
Anil et al., 2003. Performance, Welfare in Stalls Comparable to Group Sow Housing.
National Hog Farmer. 48:16-18.
Anil, L., Anil, S. S., Deen, J., Baidoo, S. K., and Walker, R. D. 2006. Effect of group size and
structure on the welfare and performance of pregnant sows in pens with electronic sow
feeders. Can. J. Vet. Res., 70:128.
Animal production. United States Department of Agriculture. 2015. Retrieved from
http://www.usda.gov/wps/portal/usda/usdahome?navid=ANIMAL_PRODUCTION
Arey, D. S., and Edwards, S. A. 1998. Factors influencing aggression between sows after mixing
and the consequences for welfare and production. Livest. Prod. Sci., 56:61-70.
Arellano, P. E., Pijoan, C., Jacobson, L. D., and Algers, B. 1992. Stereotyped behaviour, social
interactions and suckling pattern of pigs housed in groups or in single crates. Appl. Anim.
Behav. Sci., 35:157-166.
Appleby, M. C., and Lawrence, A. B. 1987. Food restriction as a cause of stereotypic behaviour
in tethered gilts. Anim. Prod. 45:103-110.
Backus, B.L. and McGlone, J.J. 2014. Animal welfare: Stress, global issues, and perspective.
Encyclopedia of agriculture and food systems.1:387-402.
Barnett, J. L., Hemsworth, P. H., Cronin, G. M., Newman, E. A., McCallum, T. H., and Chilton,
D. 1992. Effects of pen size, partial stalls and method of feeding on welfare-related
behavioural and physiological responses of group-housed pigs. Appl .Anim. Behav.
Sci. 34:207-220.
Bates, R. O., Edwards, D. B., and Korthals, R. L. 2003. Sow performance when housed either in
groups with electronic sow feeders or stalls. Livest. Prod. Sci., 79:29-35.
Bellavance, M.A. and Rivest, S. 2014. The HPA-immune axis and the immunomodulatory
actions of glucocorticoids in the brain. Front. Immunol. 5.

13
Bergeron, R., and Gonyou, H. W. 1997. Effects of increasing energy intake and foraging
behaviours on the development of stereotypies in pregnant sows. Appl. Anim. Behav. Sci.
53:259-270.
Broom, D. M. 1991. Assessing welfare and suffering. Behav. Process. 25:117-123.
Brouns, F., and Edwards, S. A. 1994. Social rank and feeding behaviour of group-housed sows
fed competitively or ad libitum. Appl.Anim. Behav. Sci. 39:225-235.
Brouns, F., Edwards, S. A., and English, P. R. 1994. Effect of dietary fibre and feeding system
on activity and oral behaviour of group housed gilts. Appl.Anim. Behav. Sci. 39:215-223.
Bryan, M. 2014. Associations between sow body lesions with body condition and reproductive
performance. In ADSA-ASAS Midwest Meeting. ASAS.
Cannon, W. B. 1932. The wisdom of the body. New York.
Chapinal, N., Ruiz-De-La-Torre, J. L., Cerisuelo, A., Gasa, J., Baucells, M. D., and Manteca, X.
2010. Aggressive behavior in two different group-housing systems for pregnant sows. J.
Appl. Anim. Wel. Sci. 13:137-153.
Coffey, R. D., Parker, G. R., and Laurent, K. M. 1999. Assessing sow body condition. ASC-158
Publication on-line at http://www. thepigsite. com/FeaturedArticle/Default. asp.
Couret, D., Otten, W., Puppe, B., Prunier, A., and Merlot, E. 2009. Behavioural, endocrine and
immune responses to repeated social stress in pregnant gilts. Anim. 3:118-127.
Cronin, G. M., Van Tartwijk, J. M. F. M., Van der Hel, W., and Verstegen, M. W. A. 1986. The
influence of degree of adaptation to tether-housing by sows in relation to behaviour and
energy metabolism. Anim. Prod. 42: 257-268.
Csermely, D., and Wood‐Gush, D. G. 1990. Agonistic behaviour in grouped sows. II. How social
rank affects feeding and drinking behaviour. Ital. J. Zool. 57: 55-58.
Danielsen, V. and Vestergaard, E. M. 2001. Dietary fibre for pregnant sows: effect on
performance and behaviour. Anim. Feed Sci. Technol. 90:71-80.
Davis, A. K., Maney, D. L., and Maerz, J. C. 2008. The use of leukocyte profiles to measure
stress in vertebrates: a review for ecologists. Functional Ecology, 22:760-772.
DeDecker, A. E., Hanson, A. R., Walker, P. M., and Salak-Johnson, J. L. 2014. Space allowance
and high fiber diet impact performance and behavior of group-kept gestating sows. J.
Anim. Sci. 92:1666-1674.

14
Dranoff, G. 2004. Cytokines in cancer pathogenesis and cancer therapy. Nat. Rev. Cancer,
4:11-22.
de Leeuw, J. A., Jongbloed, A. W., and Verstegen, M. W. 2004. Dietary fiber stabilizes blood
glucose and insulin levels and reduces physical activity in sows (Sus scrofa). J.
Nutr. 134:1481-1486.
Elenkov, I. J., Papanicolaou, D. A., Wilder, R. L., and Chrousos, G. P. 1996. Modulatory effects
of glucocorticoids and catecholamines on human interleukin-12 and interleukin-10
production: clinical implications. Proceedings of the Association of American Physicians.
108:374-381.
Fink, G. 2010. Stress: definition and history. Stress Science: Neuroendocrinology. 3-9.
Gonyou, H. W. 2001. The Social Behaviour of Pigs 6. Social Behavior in Farm Animals, 147.
Greenwood, E. C., Plush, K. J., van Wettere, W. H., and Hughes, P. E. 2014. Hierarchy
formation in newly mixed, group housed sows and management strategies aimed at
reducing its impact. Appl. Anim. Behav. Sci 160:1-11.
Grün, V., Schmucker, S., and Stefanski, V. 2013. Influence of housing on endocrine function and
immune system in pregnant sows. Brain, Behav. Immun., 29:S15.
Guillemet, R., Dourmad, J. Y., & Meunier-Salaün, M. C. 2006. Feeding behavior in primiparous
lactating sows: Impact of a high-fiber diet during pregnancy. J. Anim. Sci. 84:2474-2481.
Hemsworth, P. H., Rice, M., Nash, J., Giri, K., Butler, K. L., Tilbrook, A. J., and Morrison, R.
S. 2013. Effects of group size and floor space allowance on grouped sows: aggression,
stress, skin injuries, and reproductive performance. J. Anim. Sci. 91:4953-4964.
Holt, J. P., Johnston, L. J., Baidoo, S. K., and Shurson, G. C. 2006. Effects of a high-fiber diet
and frequent feeding on behavior, reproductive performance, and nutrient digestibility in
gestating sows. J. Anim. Sci. 84:946-955.
Hunter, E. J., Broom, D. M., Edwards, S. A., and Sibly, R. M. 1988. Social hierarchy and feeder
access in a group of 20 sows using a computer-controlled feeder. Anim Prod. 47:139-148.
Johnston, L. J., and Li, Y. Z. 2013. Performance and well-being of sows housed in pens
retrofitted from gestation stalls. J. Anim. Sci. 91:5937-5945.
Knox, R., Salak-Johnson, J., Hopgood, M., Greiner, L., and Connor, J. 2014. Effect of day of
mixing gestating sows on measures of reproductive performance and animal welfare. J.
Anim. Sci. 92:1698-1707.

15
Kranendonk, G., Van der Mheen, H., Fillerup, M., and Hopster, H. 2007. Social rank of pregnant
sows affects their body weight gain and behavior and performance of the offspring. J.
Anim. Sci. 85:420-429.
Krause, M., Klooster, C. V. T., Buré, R. G., Metz, J. H. M., and Sambraus, H. H. 1997. The
influence of sequential and simultaneous feeding and the availability of straw on the
behaviour of gilts in group housing. NJAS. 45: 33-48.
Lawrence, A. B., and Terlouw, E. 1993. A review of behavioral factors involved in the
development and continued performance of stereotypic behaviors in pigs. J. Anim. Sci.
71:2815-2825.
Levine, S. 2005. 1-Stress: an historical perspective. Techniques in the Behavioral and Neural
Sciences, 15: 3-23.
Li, Y.Z. 2012. Minimizing aggression among group-housed gestating sows at mixing. Fact Sheet
of Pork Information Gateway.
Li, Y. Z., and Gonyou, H. W. 2013. Comparison of management options for sows kept in pens
with electronic feeding stations. Can. J. Anim. Sci., 93:445-452.
Marchant, J. N., Mendl, M. T., Rudd, A. R., and Broom, D. M. 1995. The effect of agonistic
interactions on the heart rate of group-housed sows. Appl. Anim. Behav. Sci. 46:49-56.
Mason, G., Clubb, R., Latham, N., and Vickery, S. 2006. Why and how should we use
environmental enrichment to tackle stereotypic behaviour?. Appl. Anim. Behav. Sci.,
102:163-188.
Mburu, J. N., Einarsson, S., Kindahl, H., Madej, A., and Rodriguez-Martinez, H. 1998. Effects of
post-ovulatory food deprivation on oviductal sperm concentration, embryo development
and hormonal profiles in the pig. Anim. Reprod. Sci. 52:221-234.
McEwen, B.S. 1998. Stress, adaptation, and disease: Allostasis and allostatic load. Annals of the
New York Academy of Sciences. 840: 33-44.
McEwen, B.S. 2010. Stress: Homeostasis, rheostasis, allostasis and allostatic load. Stress
Science: Neuroendrocrinology. 10-14.
McGlone, J. J., and Fullwood, S. D. 2001. Behavior, reproduction, and immunity of crated
pregnant gilts: effects of high dietary fiber and rearing environment. J. Anim. Sci.
79:1466-1474.

16
McGlone, J. J., Von Borell, E. H., Deen, J., Johnson, A. K., Levis, D. G., Meunier-Salaün, M., ...
and Sundberg, P. L. 2004. Review: Compilation of the scientific literature comparing
housing systems for gestating sows and gilts using measures of physiology, behavior,
performance, and health. Prof. Anim. Scientist, 20:105-117.
Mellor, D. J., Cook, C. J., and Stafford, K. J. 2000. Quantifying some responses to pain as a
stressor. The Biology of Animal Stress: Basic Principles and Implications for Welfare,
171-198.
Mendl, M., Zanella, A. J., and Broom, D. M. 1992. Physiological and reproductive correlates of
behavioural strategies in female domestic pigs. Anim. Behav. 44:1107-1121.
Moberg, G. P., and Mench, J. A. 2000. The biology of animal stress: basic principles and
implications for animal welfare. CABI.
Mosmann, T. R., and Coffman, R. L. 1989. TH1 and TH2 cells: different patterns of lymphokine
secretion lead to different functional properties. Ann. Rev. Immunol., 7:145-173.
Mosmann, T. R., and Sad, S.1996. The expanding universe of T-cell subsets: Th1, Th2 and
more. Immunology today. 17:138-146.
National Agricultural Law Center. 2014. States’ Farm Animal Confinement Statutes. University
of Arkansas.
Pedersen, L. J., Rojkittikhun, T., Einarsson, S., and Edqvist, L. E. 1993. Postweaning grouped
sows: effects of aggression on hormonal patterns and oestrous behaviour. Appl.Anim.
Behav. Sci. 38:25-39.
Pork Production. 2013. Retrieved from
http://www.epa.gov/agriculture/ag101/pork.html
Prunier, A., Heinonen, M., and Quesnel, H. 2010. High physiological demands in intensively
raised pigs: impact on health and welfare. Anim. 4:886-898.
Rushen, J. P. 1985. Stereotypies, aggression and the feeding schedules of tethered sows.
Appl. Anim. Behav. Sci. 14:137-147.
Razdan, P., Mwanza, A. M., Kindahl, H., Rodriguez-Martinez, H., Hultén, F., and Einarsson, S.
2002. Effect of repeated ACTH-stimulation on early embryonic development and
hormonal profiles in sows. Anim. Reprod. Sci 70:127-137.
Rhodes, R. T., Appleby, M. C., Chinn, K., Douglas, L., Firkins, L. D., Houpt, K. A., ... and
Wills, R. W. 2005. A comprehensive review of housing for pregnant sows. JAVMA,
227:1580-1590.

17
Robert, S., Rushen, J. and Farmer, C. 1997. Both energy content and bulk of food affect
stereotypic behaviour, heart rate and feeding motivation of female pigs. Appl. Anim.
Behav. Sci. 54:161-171.
Robert, S., Matte, J. J., Farmer, C., Girard, C. L., and Martineau, G. P. 1993. High-fibre diets for
sows: effects on stereotypies and adjunctive drinking. Appl. Anim. Behav. Sci. 37:297-
309.
Salak-Johnson, J. L., DeDecker, A. E., Horsman, M. J., and Rodriguez-Zas, S. L. 2012. Space
allowance for gestating sows in pens: Behavior and immunity. J. Anim. Sci. 90: 3232-
3242.
Salak-Johnson, J. L., and McGlone, J. J. 2007. Making sense of apparently conflicting data:
Stress and immunity in swine and cattle. J. Anim. Sci. 85:E81-E88.
Salak-Johnson, J. L., Niekamp, S. R., Rodriguez-Zas, S. L., Ellis, M., and Curtis, S. E. 2007.
Space allowance for dry, pregnant sows in pens: Body condition, skin lesions, and
performance. J. Anim. Sci. 85:1758-1769.
Schouten, W. G. P., and Wiepkema, P. R. 1991. Coping styles of tethered sows. Behav. Process.,
25:125-132.
Séguin, M. J., Barney, D., and Widowski, T. M. 2006. Assessment of a group-housing system for
gestating sows: Effects of space allowance and pen size on the incidence of superficial
skin lesions, changes in body condition, and farrowing performance. J. Swine Health
Prod., 14:89.
Sekiguchi, T., and Koketsu, Y. 2004. Behavior and reproductive performance by stalled breeding
females on a commercial swine farm. J. Anim. Sci. 82:1482-1487.
Sterling, P. and Eyer, J. 1988. Allostasis: a new paradigm to explain arousal pathology.
Stevens, B., Karlen, G. M., Morrison, R., Gonyou, H. W., Butler, K. L., Kerswell, K. J., and
Hemsworth, P. H. 2015. Effects of stage of gestation at mixing on aggression, injuries
and stress in sows. Appl. Anim. Behav. Sci 165:40-46.
Strawford, M. L., Li, Y. Z., and Gonyou, H. W. 2008. The effect of management strategies and
parity on the behaviour and physiology of gestating sows housed in an electronic sow
feeding system. Can. J. Anim. Sci., 88: 559-567.
Taylor, I. A., Barnett, J. L., and Cronin, G. M. 1997. Optimum group size for pigs. In Proceeding
of the 5th International Symposium on Livestock Environment, American Society of
Agricultural Engineers. 2:965-971.

18
Terlouw, E. C., and Lawrence, A. B. 1993. Long-term effects of food allowance and housing on
development of stereotypies in pigs. Appl. Anim. Behav. Sci. 38:103-126.
Terlouw, E. M. C., Lawrence, A. B., and Illius, A. W. 1991. Influences of feeding level and
physical restriction on development of stereotypies in sows. Anim. Behav. 42:981-991.
Tsuma, V. T., Einarsson, S., Madej, A., Kindahl, H., and Lundeheim, N. 1996. Effect of food
deprivation during early pregnancy on endocrine changes in primiparous sows. Anim
Reprod Sci 41:267-278.
van der Staay, F. J., Schuurman, T., Hulst, M., Smits, M., Prickaerts, J., Kenis, G., and Korte, S.
M. 2010. Effects of chronic stress: A comparison between tethered and loose sows.
Physiol. Behav., 100:154-164.
Velarde, A. “Agonistic behaviour.” On farm monitoring of pig welfare. Wageningen Academic
Press, Wageningen, the Netherlands, 53-56.
Verdon, M., Hansen, C. F., Rault, J. L., Jongman, E., Hansen, L. U., Plush, K., and Hemsworth,
P. H. 2015. Effects of group housing on sow welfare: A review. J. Anim. Sci. 93:1999-
2017.
Vieuille-Thomas, C., Le Pape, G., and Signoret, J. P. 1995. Stereotypies in pregnant sows:
indications of influence of the housing system on the patterns expressed by the animals.
Appl. Anim. Behav. Sci. 44:19-27.
Von Borell, E. H. 2001. The biology of stress and its application to livestock housing and
transportation assessment. J. Anim. Sci. 79:E260-E267.
Whittaker, X., Spoolder, H. A. M., Edwards, S. A., Lawrence, A. B., and Corning, S. 1998. The
influence of dietary fibre and the provision of straw on the development of stereotypic
behaviour in food restricted pregnant sows. Appl. Anim. Behav. Sci 61:89-102.
Wiepkema, P. R., and Schouten, W. G. P. 1992. Stereotypies in sows during chronic stress.
Psychother. Psychosom., 57:194-199.
Zhao, Y., Flowers, W. L., Saraiva, A., Yeum, K. J., and Kim, S. W. 2013. Effect of social ranks
and gestation housing systems on oxidative stress status, reproductive performance, and
immune status of sows. J. Anim. Sci. 91:5848-5858.
Zhou, Q., Sun, Q., Wang, G., Zhou, B., Lu, M., Marchant-Forde, J.N., Yang, X., and Zhao, R.
2014. Group housing during gestation affects the behaviour of sows and the physiological
indices of offspring at weaning. Anim. 8: 1162-1169.

19
Zonderland, J. J., De Leeuw, J. A., Nolten, C., and Spoolder, H. A. M. 2004. Assessing long-
term behavioural effects of feeding motivation in group-housed pregnant sows; what,
when and how to observe. Appl. Anim. Behav. Sci. 87:15-30.

20
CHAPTER 2:
HIGH FIBER DIETS AND FEEDING PARTITIONS IMPACT THE PERFORMANCE
AND BODY LESION SCORES OF GROUP-KEPT GESTATING SOWS
Abstract
Five groups (n=36 sows per group) of primiparous and multiparous sows were randomly
assigned to one of two diets and to a pen (9 sows/pen; 1.7 m²/ sow) equipped with either short or
long feeding partitions. Once confirmed pregnant, sows were assigned to a dietary treatment of
either (a) high fiber, low energy gestational diet (30% wheat middlings and 15% soybean hulls;
Midds-Hulls) or (b) high fiber, high energy gestational diet (30% DDGS and 30% corn germ
meal; DDGS-Germ Meal) and to a feeding partition length of either (c) 0.6 m (SHORT) or (d)
1.8 m (LONG). Sows were fed dietary treatments from gestational d 35 to 104 and then moved
to treatment pens at gestational d 37. Sow BW and BF depth were recorded at gestational d 30,
70, 90, 104, and then again at end of lactation. Sow BCS was recorded on gestational d 37, 90,
104, and then again at end of lactation. Body lesion scores were recorded prior to, 24-h after, and
then every 3d for first 2-wk after mixing (Phase 1), and then bi-weekly thereafter (Phase 2).
Litter-related traits included litter birth weight, total piglets born and born alive, males, females,
stillborn, mummified, laid-on, pre-weaning mortality, litter weaning weight, and average piglet
weaning weight. No effects of diet × feeding partition length occurred for sow- or litter-related
traits. Sows fed DDGS-Germ Meal loss less BW (P < 0.01) from gestational d 90 through end of
lactation and had greater BF depth (P =0.05) at end of lactation compared with sows fed Midds-
Hulls diet. Those same sows also weaned heavier piglets than did sows fed Midds-Hulls diet (P
= 0.02). Gilts were lighter and parity ≥ 3 sows were heavier prior to treatment and throughout
gestation compared to parity 1 or 2 sows (P < 0.01). Parity ≥ 3 sows had more piglets born (P <

21
0.01), but they also had more stillborns (P = 0.02) and higher pre-weaning mortality (P < 0.01)
than did parity ≤ 2 sows. There was no diet × feeding partition length effect on total lesion
severity during phase 1 (P > 0.05), but there was an effect on lesion severity scores during phase
2. Sows housed in pens with SHORT feeding partitions and fed either Midds-Hulls or DDGS-
Germ Meal diet had least severe total lesion scores (P = 0.04). Sows fed Midds-Hulls diet had
lower (P = 0.03) total lesion severity score during phase 2. Regardless of diet, sows housed in
pens with SHORT feeding partitions had less severe lesion scores during both phases (P < 0.01).
Based on these results, it seems plausible to increase average piglet weaning weight by feeding
sows a DDGS-corn germ meal fiber diet from gestational d 35 to 104. However, the feeding
partition lengths did not affect performance and productivity of sows housed in small groups,
with exception of lesion severity scores which may be reflective of either inadequate length
and/or floor-space allowance.
22
Introduction
Many pork producers in the United States are moving towards housing gestating sows in
group pens due to state-by-state referendums (e.g., Florida, Arizona, California, and Colorado)
banning the gestation stall. One of the main concerns with housing sows in groups is the
aggressive encounters that occur at mixing and around feeding time, which may compromise
sow well-being. Another welfare concern is variation in body condition score, especially among
submissive sows. Research shows that during feeding, higher ranked sows will quickly consume
their feed allotment, and then displace the lower ranked sows from the feeder, and then consume
other sows feed allotment (Gonyou, 2001; Andersen et al., 1999). Therefore, higher ranked sows
tend to gain more body weight and tend to be heavier than lower ranked sows (Brouns and
Edwards, 1994; Kranendonk et al., 2007; Zhao et al., 2013). Both, too fat and too thin body
condition may cause reproductive problems thus compromising efficiency and overall well-being
of the gestating and lactating sow (Gonyou, 2001). A feeding method that can be used to reduce
aggression and displacement during feeding time is feeding partitions (Barnett et al., 1992;
Andersen et al., 1999). When sows are feed-restricted, they fight for access to feed, therefore
feeding partitions can provide some protection for sows and allow them to consume their allotted
feed. In addition, feeding high fiber gestational diets have been shown to improve sow satiety
(Rebert and Farmer, 1997; Guillemet et al., 2006). Since, high fiber diets tend to be bulkier, sows
take longer to consume feed which may allow all sows (especially lower ranked) more time to
consumer their feed allotment before being displaced. The objective of this study was to
determine the effects of housing sows in groups-pens equipped with feeding partitions of
different lengths and feeding high fiber diets that differ in energy levels on lesion severity scores
and performance and productivity of gestating sows.
23
Materials and Methods
Animals, Housing, and Experimental Design
Crossbred primiparous (parity 0, n=46) and multiparous (parities 1 and 2, n=57; parities
≥3, n=76) sows were used in this experiment. All sows were derived from Genetiporc sow line
kept at the University of Illinois Swine Research Center. Sows were randomly assigned to a 2 x 2
factorial design and housed in a pen (n =9 sows/pen/treatment) with a space allowance of 1.7 m²
per sow. There were 36 sows per block (n=5), but 5 sows were removed from the study due to
either injury or lack of eating, and 2 sows were euthanized for health reasons, not related to
experimental treatments. The University of Illinois Institutional Animal Care and Use Committee
approved the animal protocol of this experiment.
All sows were artificially inseminated and pregnancy was detected ultrasonically on d 30
post breeding. Sows were randomly allotted to either a high fiber, low energy gestational diet
(30% wheat middlings and 15% soybean hulls; Midds-Hulls) or a high fiber, high energy
gestational diet (30% DDGS and 30% corn germ meal; DDGS-Germ Meal) and to a pen
equipped with either 0.6 m (SHORT) or 1.8 m (LONG) feeding stall partitions. The SHORT
feeding partition length started at the head and ended at her shoulders, while the LONG feeding
partition protected the entire body of the sow. Each treatment group was balanced for sow body
weight (BW), back-fat depth (BF), and parity. Sows remained in individual gestation stalls until
gestational d 37 when sows were moved to their assigned treatment pen (some blocks were
subjected to a 35-minute feeding test for a different study). Sows were moved to farrowing crates
at gestational d 104. All diets were formulated to meet or exceed nutrient requirements (NRC,
2012; Table 2.1). Feed was placed in individual feeding space once a day at 0630 h. Each
feeding space was equipped with a water nippler. Sows were fed 2.23 kg (Midds-Hulls) and

24
2.10 kg (DDGS-Germ Meal) per sow from gestational d 35 to 90 and then 3.57 kg (Midds-Hulls)
and 3.37 kg (DDGS-Germ Meal) from gestational d 91 until moved to farrowing (d 104). Once
sows were moved to farrowing crates, sows were fed a standard lactation diet.
Performance and Productivity Traits
Sow BW and BF depth were recorded on gestational d 30, 70 (excluding BF), 90, and
104, and then again at the end of lactation. Sow BF depth was measured at the last rib using a
longitudinal ultrasound scan (Aloka model 500V B-mode with a 5011 probe, Corometrics
Medical Systems, Wallingford, CT). Sow body condition score (BCS) was recorded on
gestational d 37, 90, and 104, and then again at the end of lactation. BCS ranged from 1 to 5 with
1 being emaciated and 5 being overly fat. Litter-related traits included number of piglets born,
born alive, males, females, stillborn, mummified, laid-on, total pre-weaning mortality, birth
weight, weaning weight, and average piglet weaning weight per litter. If piglets were cross-
fostered, they were only cross-fostered within the same treatment. All piglets were weaned at
19+2 days.
Body Lesion Scores
Body lesions scores were recorded prior to sows moving into their respective treatment
pens, one day after moving into pens, then every 3 days for the first two weeks post-mixing
(phase 1), and then bi-weekly thereafter (phase 2). Lesion scores were recorded as previously
described by Salak-Johnson et al. (2007) with minor modifications. Briefly, the body regions
were: head, ears, neck, breast, shoulders, side, back, udder, rear, vulva, front legs, hind legs,
front hooves, and hind hooves. Scores ranged from 0 to 7 for all regions except hooves which
had a possible high score of 5. Score 0 = no lesions, 1 = dehairing/callus/balding, 2 =
redness/swelling, 3 = swelling and callus/abscess, 4 = scabbed over scratch, 5 = marked
wound/fresh scratch, 6 = severe wound/open wound, and 7 = severe swelling. For the hooves, 0

25
= normal, 2 = swelling/callus, 3 = claw asymmetry, 3 = severe swelling, 4= crown/declaw
wound, and 5 = sand crack. Each body region was given a score and all region scores were added
to calculate total severity for each day.
Statistical Analysis
Data were analyzed using the mixed models procedure of SAS (SAS Inst. Inc., Cary,
NC). Day of measure was used as a repeated measure and groups were used as a random effect
to minimize potential differences among groups. Data was analyzed for normality and a natural
logarithm transformation was applied to non-normal data. A linear mixed effects model was used
with the following fixed effects: diet, feeding partition length, and parity; all possible
interactions were included as well. Due to significant differences in BF at gestational d 30, that
day was used as a covariate to analyze BF. The GLIMMIX procedure of SAS was used to
analyze the number of stillborn, mummified, laid-on, mortality, and cross foster as well as BCS
and body lesion scores. Significance level was set at P ≤ 0.05 while trends were recognized at P
≤ 0.10.
Results
Sow BW, BF, and BCS
There were no effects of diet × feeding partition length on any sow performance traits (P
> 0.05). However, there was a tendency for sows fed Midds-Hulls diet and housed in pens with
LONG feeding partitions to have higher BCS than sows in other treatment groups (P =0.06).
There were no effects of feeding partition length on sow BW, BF, or BCS (P > 0.05).
Sow BW was not different between dietary treatments, however sows fed DDGS-Germ
Meal diet tended to be heavier at the end of lactation (P =0.09). Sow BW change was affected by
dietary treatment, specifically sows fed DDGS-Germ Meal diet gained more BW between
26
gestational d 30 and end of lactation (P < 0.01) than did sows fed Midds-Hulls. But, sows fed
Midds-Hulls diet gained more BW from gestational d 70 to 104 and loss more BW from
gestational d 90 to end of lactation (P <0.01; Table 2.2). Sow BW change from gestational d 30
to 70, 30 to 90, 30 to 104, 70 to 90, and 70 to end of lactation were not different among sows fed
different diets (P > 0.05).
At end of lactation, sows fed DDGS-Germ Meal diet had deeper mean BF (P =0.05) and
tended to have deeper BF at gestational d 90 (P =0.09) than did sows fed Midds-Hulls diet. Sow
BCS was not different between dietary treatments (P > 0.05).
A diet × feeding partition length × parity effect occurred for mean BW (P ≤ 0.01). Parity
≥3 sows fed Midds-Hulls diet and housed in pens equipped with SHORT feeding partitions were
lighter (P < 0.01) compared with same parity sows in other treatment groups. Regardless of diet,
parity 1 and 2 sows housed in pens with SHORT feeding partitions had greater BW than same
parity sows housed in pens equipped with LONG feeding partitions (P < 0.01). Although a 3-
way interaction occurred for mean BCS (P = 0.01), all scores were within the range of 2.90 and
3.09.
Sow parity had an effect on BW, BF depth, and BCS. Gilts were lighter, parity 1 and 2
were intermediate, and parity ≥ 3 sows were heavier prior to treatment, throughout gestation, and
end of lactation (P < 0.01). There was also a main effect of parity on BW gain from gestational d
90 to 104 (P < 0.01); gilts gained the least amount of BW (16.70 ± 0.9 kg) compared to higher
parity sows (parity 1 and 2, 19.46 ± 0.7 kg; parity ≥3, 19.94 ± 0.7 kg). Sow BW change between
gestational d 30 and 70, d 70 and 90, d 104 to end of lactation, and d 30 to end of lactation were
not different among all sows across all parities. Although gilts had deeper BF at gestational d 30
and 90 (P <0.01), at d 104 and end of lactation BF depth was not different (P >0.05; Figure 2.2).
27
In addition, gilts had higher BCS at gestational d 37 and 90 (P <0.01 and P =0.05, respectively),
but at end of lactation parity ≥3 sows had higher BCS than did gilts (P < 0.01).
Litter Traits
There were no effects of dietary treatment × feeding partition length or main effects of
feeding partition length on any litter-related traits (P > 0.05). Only average piglet weaning
weight was affected by diet; sows fed DDGS-Germ Meal diet weaned heavier piglets (7.09 ± 0.2
kg) compared to sows fed Midds-Hulls diet (6.75 ± 0.2 kg; P = 0.02). Sows fed DDGS-Germ
Meal diet tended to have less stillborn piglets per litter compared to sows fed Midds-Hulls diet,
1.29 ± 0.2 versus 1.86 ± 0.2, respectively (P = 0.08). There were no effects on all other litter-
related traits.
Parity also affected some litter-related traits. Parity ≥3 sows had more piglets born than
did lower parity sows (P < 0.01), but parity ≥3 sows had more stillborn piglets (P =0.02) and
higher pre-weaning mortality than did parity ≤ 2 sows (P < 0.01). There were no effects of
dietary treatment ×feeding partition length × parity, diet ×parity, or feeding partition length ×
parity on any litter-related traits.
Sow Body Lesion Scores
During phase 1, total lesion severity scores were not different among treatment groups (P
= 0.97). Body lesion scores at the ears, udder, and vulva were affected by diet × feeding partition
length interaction (Table 2.3). Sows fed DDGS-Germ Meal diet and housed in pens with SHORT
feeding partitions had the greatest lesion score at the ears (P < 0.01). Sows fed the same diet but
housed in pens with LONG feeding partitions had more severe lesions at the udder and vulva (P
≤ 0.01). During phase 2, sows housed in pens with SHORT feeding partitions and fed either diet
had the lowest total lesion severity, while sows fed DDGS-Germ Meal and housed in pens with
28
LONG feeding partitions had the highest lesion scores (P = 0.04). There were no differences in
lesion scores at all body regions except the ears. Sows fed DDGS-Germ Meal diet and housed in
pens with LONG feeding partitions had more severe lesions at the ears than did sows in other
treatments (P < 0.01).
Dietary treatment had no effect on total lesion severity scores during phase 1 (P = 0.56).
Also, lesion scores at all body regions were not different between sows fed Midds-Hulls diet and
sows fed DDGS-Germ Meal diet, except for lesions at the udder and front hooves. Sows fed
Midds-Hulls diet had lowest udder lesion score (P = 0.02) and those fed DDGS-Germ Meal diet
had less severe lesions at the front hooves (P < 0.001). Furthermore, there was a tendency for
sows fed DDGS-Germ Meal diet to have least severe neck lesion score compared to sows fed
Midds-Hulls diet (P = 0.06). There was also a dietary treatment effect on lesion scores during
phase 2. Sows fed Midds-Hulls diet had lowest total lesion severity (P = 0.03) and least severe
lesions at the ears (P =0.03) and back (P < 0.01). Sows fed DDGS-Germ Meal diet had least
severe vulva lesion score (P = 0.04). Although not significantly different, rear and hind leg lesion
scores were lowest for sows fed Midds-Hulls diet (P = 0.07 and P =0.08).
There was a feeding partition length effect on total lesion severity score. Sows housed in
pens with SHORT feeding partitions had lower total severity scores during both phases (P <
0.01). Moreover, lesions at the neck, back, rear, vulva, and hind legs among these sows were less
severe during both phases (all P < 0.01). Head lesion scores (phase 1) were lower among sows
housed in pens with SHORT feeding partitions (P < 0.01). During phase 1, sow ear lesion scores
were less severe for sows housed in pens with LONG feeding partitions, but during the phase 2
sows housed in pens with SHORT feeding partitions had lowest ear lesion scores (both P =
0.01).

29
Parity also had an effect on body lesion scores. During phase 1, gilts had least severe total
lesion score than did higher parity sows (P < 0.01). Gilts also had less severe lesions at the head,
neck, side, rear, and hind legs than parity ≥1 sows (all P < 0.01). Lesion scores at the back were
more severe among parity 1 and 2 sows and less severe among gilts, while udder lesion scores
were more severe among parity ≥3 sows and less severe for gilts (both P < 0.01). Ear lesion
scores were more severe among parities 1 and 2 sows and less severe among parity ≥3 sows;
gilts and parity ≥1 sows did not have different scores (P =0.05). At the front legs, gilts had less
lesions than did parity ≥ 3 sows, but parity 1 and 2 sows did not have different scores compared
to other parity sows (P =0.02).
During phase 2 gilts had lower total severity scores than did sows of parity 1 and 2, but
total severity scores were not different between parity ≥ 3 and lower parity sows (P = 0.05).
Higher parity (>0) sows had less lesions at the ears than did gilts (P = 0.01). Parity ≥3 sows had
less severe lesions at the neck than did parity 1 and 2 sows, but gilts did not have different scores
compared to all sows (P =0.03). Gilts and parity ≥ 3 sows had less severe lesions at the shoulders
compared to sows of parity 1 and 2 (P < 0.01). Gilts had lower lesion scores at the udder and rear
compared to parity ≥ 3 sows, but lesion scores for parity 1 and 2 sows were not different
compared to all other sows (udder, P = 0.02; rear, P < 0.01).
No effects of diet × feeding partition length × parity, diet × parity, or feeding partition
length × parity occurred for sow body lesion scores.

30
Discussion
Diet Effects
Previous studies have shown contradicting findings of BF depth and BW loss in sows fed
high fiber diets, however they all agree that high fiber diets have minimal to no effect on litter-
related traits (McGlone and Fullwood, 2001; Danielsen and Vestergaard, 2001; Guillemet et al.,
2006; Holt et al., 2006). In the present study the data imply that sows fed DDGS-Germ Meal diet
during gestation had greater BF depth at the end of lactation, loss less BW during lactation, and
weaned heavier piglets than sows fed Midds-Hulls diet. McGlone and Fullwood (2001) found
gilts were heavier at farrowing when fed a beet pulp fiber diet compared to gilts that were fed a
control diet, but BW change during lactation was not different regardless of diet. In the present
study, sows were not weighed at farrowing, but the latest BW recorded prior to farrowing was at
gestational d 104 (one-wk prior to farrowing), and on that day sow BW was not different among
sows fed either diet. Since there was no difference in litter birth weight, we speculate that the
difference in BW change from d 104 to end of lactation is most likely reflective of the BW loss
during lactation. This means that sows fed Midds-Hulls diet used more energy resources
(indicated by the greater BW and BF depth loss) to produce milk compare to sows fed the
DDGS-Germ Meal.
We speculate that sows fed Midds-Hulls diet may have diverted some nutrients in order
to cope with stress, hence more loss in BF depth and BW. Sows fed the Midds-Hulls diet had a
higher neutrophil-to-lymphocyte ratio (chapter 3) indicating that these sows were more stressed
than sows fed the DDGS-Germ Meal diet. The most common stressor in group-housing is
aggression, however sows fed the Midds-Hulls had less severe lesions than sows fed the DDGS-
Germ Meal diet suggesting that there was less aggression among sows fed the former diet.
31
Another common stressor in group housing is not enough feed intake, it has been shown that
food deprivation can cause stress (Anderson, 1975; Tsuma et al., 1996; Mburu et al., 1998). In
the present study sows were simultaneously fed which could have led to some sows eating more
and others eating less feed. Perhaps sows fed the Midds-Hulls diet did not provide enough satiety
compared to sows fed DDGS-Germ Meal diet. Sows fed the Midds-Hulls diet had more severe
lesions at the vulva which may indicate that they tried to displace each other more than sows fed
the DDGS-Germ Meal diet. Both competing for feed and eating less than their allotted feed may
have led to the stress experienced by sows fed the Midds-Hulls diet. As a result, they gained less
BW and loss more BF depth. Furthermore, the effects of stress during gestation could have
impacted sows during lactation, for instance sows fed the Midds-Hulls diet could have had less
energy reserved leading to less milk production thus weaning lighter piglets.
Effects of Feeding Partition Length
Feeding partitions were used in an attempt to reduce sow aggression, it was hypothesized
that the LONG feeding partitions would provide more protection and thus result in less body
lesions since the stalls were long enough to protect the entire body. Surprisingly, sows housed in
pens with LONG feeding partitions had more severe lesions during both phases, especially at the
neck, back, rear, and hind legs. During phase 1, sows housed in pens with LONG feeding
partitions had more lesions at the back and rear, 1.37 and 1.76 difference, respectively. Similarly
during phase 2, sows housed in pens with LONG feeding partitions had higher lesion scores at
the neck, back, rear, and hind legs (differences were 0.98, 0.92, 1.79, and 1.41 respectively). We
speculate that the pen design may partially explain higher scores among these sows. The LONG
feeding partitions were essentially standard gestation stalls with backs removed and the feeding
partition floor-space was included in the total floor-space allowance per sow. We speculate that
32
sows ability to easily leave the long feeding partition space was hindered by restricted-space and
the hinges that were left on once the gestation stall backgates were removed. Furthermore,
lesion on the rear and hind legs were a lot more severe on sows housed in pens with LONG
feeding partitions which may have been due to sows trying to displace one another but not
having adequate space to leave or enter the feeding stall space. Since most of the sow’s body was
protected with the LONG feeding partitions it would have been more difficult for sows to
displace one another thus sow displacement would have taken longer and thus the greater
duration of aggressive encounters. In addition, the space between the end of the LONG feeding
partitions and the end of the pen was a lot smaller than the space between the SHORT feeding
partitions and the end of the pen so the minimal space in the former pen could have forced sows
to hit the fences with their rears and hind legs. In an early study by Barnett et al. (1992) there
was no difference in the number and length of lesions between gilts housed in pens with feeding
partitions and gilts housed in pens without any feeding partitions. Barnett et al. (1992) compared
the number and length of lesions as oppose to the present study, were scores were given based on
the presence or absence of lesions and severity. Furthermore, Barnett et al. (1992) only used gilts
while the present study used gilts and multiparous sows which can contribute to the different
findings. In a similar study, Andersen et al. (1999) compared the use of body and shoulder
feeding partitions along with feeding wet or dry feed to sows. Sows housed in pens with body
feeding partitions and fed a dry diet received less bites at the head, shoulder, and body. In
addition, total aggressive behaviors and displacements at the trough were reduced in sows
housed in pens with body feeding partitions compared to sows housed in pens with shoulder
feeding partitions or with no partitions at all. These results are contrary to what was found in the
present study, where sows housed in pens with LONG feeding partitions had higher total severity
33
scores and more lesions at the head (phase 1). Unlike in Andersen et al. (1999) in this study there
were no differences in shoulder lesions and the sow body was categorized into different regions.
Lesions on the side were not different but sows housed in pens with LONG feeding partitions
had more severe lesions on the back. Andersen et al. (1999) found more vulva bites in sows
housed in pens with body partitions and the same was found in the present study, sows housed in
pens with LONG feeding partitions had more severe lesions at the vulva. Krause et al. (1997)
found that most of the aggression between gilts housed in groups was towards the head instead of
the side or rear, but in the present study more lesions were seen on the shoulder, side, and hind
legs than in the head. This may partly be explained by the observation that during feeding, when
most aggression occurred, the head of the sow was in the feeding trough and protected by the
feeding partitions while the side and hind legs were exposed. Sows could have squeezed between
the sow and the feeding partition and attacked the side.
Despite the differences in body lesions due to the different feeding partition treatments
sow performance and productivity was not compromised. Sows housed in LONG feeding
partitions had more severe lesions, yet they did not have different BW, BF, BCS, and litter traits
as sows housed in SHORT feeding partitions. This suggests that sows housed in LONG feeding
partitions were able to cope with their environment without compromising their well-being in
terms of performance and productivity.
Parity Effects
Sow parity can impact various performance traits such as sow BW, BF depth and BCS.
Parity ≥ 3 sows were heaviest at the start of the study and at the end of lactation, while parity 0
(gilts) had the lowest BW throughout gestation and lactation. These findings are not surprising.
Johnston and Li (2013) found that parity 1 sows were lightest and parity ≥ 3 were the heaviest.
34
Furthermore, in the present study gilts had greater BF depth and BCS during most of gestation
compared to parity ≥ 1 sows. This may be partly explained by the developmental and
physiological status of the pregnant gilt. During each gestation there is maternal weight gain,
which does not include the weight of the placenta, uterus, or fetuses, and this weight gain allows
sows to keep growing thus higher parity sows are bigger (Close and Cole, 1986). In addition,
gilts tend to have more body fat than protein since they are not fully developed compared to
higher parity sows therefore are often less productive (Omtvedt et al., 1965; Johnston and Li,
2013).
Feeding partition length primarily affected the BW of parity 1 and 2 sows. These sows
(parities 1 and 2) were heavier when housed in pens with SHORT feeding partitions instead of
pens with LONG feeding partitions. The floor space allowance per sow was 1.7 m², however the
feeding partition floor space was included with the total floor space. As a result pens with
SHORT feeding partitions had a pen space closer to 1.7 m² per sow compared to pens with
LONG feeding partitions. Parity 1 and 2 sows had higher lesion scores when housed in pens
equipped with LONG feeding partitions, which suggests that less space allowance, such as in
pens with LONG feeding partitions, may lead to more aggression. It is likely that the aggression
that occurred was during feeding time, thus sows may not have been able to consume their
allotted feed resulting in lower BW.
Although not surprising, litter-related traits were also affected by sow parity. Parity ≥ 3
sows had more piglets born, stillborn, and the highest pre-weaning mortality compared to gilts
and parity 1 and 2 sows. Similar results were seen in Johnston and Li (2013), parity ≥ 3 sows had
larger litters and more stillborn piglets. Contrary, Salak-Johnson et al. (2007) found no effect of
parity on litter size or piglet BW gain from birth to weaning among sows that were kept in

35
groups of 5 at various floor-space allowances. However, floor space allowance, group size, and
diets in that study were different from the present study. In Salak-Johnson et al. sows were
allotted 1.4, 2.3, or 3.3 m² floor space while in the present study the space allowance per sow
was 1.7 m² thus space allowance may interact with parity. Furthermore, group sizes were smaller
and high fiber diets were not used in that study. Any or all of these differences could interact
with parity and affect litter traits.
Lesion scores were affected by parity but this effect might be due to the size and
experience of gilts. Gilts had less lesions compared to parity ≥ 1 sows (during phase 1) and parity
≥ 3 sows (during phase 2). Similarly, Salak-Johnson et al. (2007) showed that gilts had less
severe lesions at the head, neck, shoulders, rear, and hind legs. In general, prior to moving into
gestation stalls gilts are housed in group pens until they reach puberty so they are used to living
in groups as opposed to higher parity sows that have not been in groups for a long time. Housing
sows in groups when they have been in individual stalls may cause more aggression because they
have not been in that type of environment for a long time. Furthermore, parity and social status
are directly related, gilts tend to be of a lower rank while higher parity sows are higher in the
hierarchy (Hunter et al., 1988). Previous research has shown that lower rank sows receive less
aggression and spent less time fighting (Andersen et al., 1999 and Strawford et al., 2008).
Perhaps gilts in the present study avoided aggressive encounters by voluntarily leaving the
partition stalls leading to less aggressive encounters and less severe lesions.
Based on these results, average piglet weaning weight can be increased by feeding sows a
high fiber, high energy diet from gestational d 35 to 104, however the feeding partition lengths
used in this study at the floor space of 1.7 m² had no effect on performance and productivity of
sows housed but 0.6 m feeding partitions resulted in less severe body lesion scores. More

36
research needs to be done on the effects of high energy diets by comparing it with a control diet.
Feeding partitions could be further studied but differences in structure should be minimized.
Despite sows being able to cope with different environmental challenges different well-being
measures should be used to determine which environment is best.
37
Literature Cited
Andersen, I. L., Bøe, K. E., and Kristiansen, A. L. 1999. The influence of different feeding
arrangements and food type on competition at feeding in pregnant sows. Appl. Anim.
Behav. Sci. 65:91-104.
Barnett, J. L., Hemsworth, P. H., Cronin, G. M., Newman, E. A., McCallum, T. H., and Chilton,
D. 1992. Effects of pen size, partial stalls and method of feeding on welfare-related
behavioural and physiological responses of group-housed pigs. Appl .Anim. Behav.
Sci. 34:207-220.
Brouns, F., and Edwards, S. A. 1994. Social rank and feeding behaviour of group-housed sows
fed competitively or ad libitum. Appl. Anim. Behav. 39:225-235.
Close, W. H., and Cole, D. J. A. 1986. Some aspects of the nutritional requirements of sows:
Their relevance in the development of a feeding strategy. Livest. Prod. Sci., 15: 39-52.
Danielsen, V. and Vestergaard, E. M. 2001. Dietary fibre for pregnant sows: effect on
performance and behaviour. Anim. Feed Sci. Technol. 90:71-80.
DeDecker, A. E., Hanson, A. R., Walker, P. M., and Salak-Johnson, J. L. 2014. Space allowance
and high fiber diet impact performance and behavior of group-kept gestating sows. J.
Anim. Sci. 92:1666-1674.
Gonyou, H. W. 2001. The Social Behaviour of Pigs 6. Social Behavior in Farm Animals, 147.
Guillemet, R., Dourmad, J. Y., & Meunier-Salaün, M. C. 2006. Feeding behavior in primiparous
lactating sows: Impact of a high-fiber diet during pregnancy. J. Anim. Sci. 84:2474-2481
Holt, J. P., Johnston, L. J., Baidoo, S. K., and Shurson, G. C. 2006. Effects of a high-fiber diet
and frequent feeding on behavior, reproductive performance, and nutrient digestibility in
gestating sows. J. Anim. Sci. 84:946-955.
Hunter, E. J., Broom, D. M., Edwards, S. A., and Sibly, R. M. 1988. Social hierarchy and feeder
access in a group of 20 sows using a computer-controlled feeder. Anim Prod. 47:139-148.
Johnston, L. J., and Li, Y. Z. 2013. Performance and well-being of sows housed in pens
retrofitted from gestation stalls. J. Anim. Sci. 91:5937-5945.
Kranendonk, G., Van der Mheen, H., Fillerup, M., and Hopster, H. 2007. Social rank of pregnant
sows affects their body weight gain and behavior and performance of the offspring. J.
Anim. Sci. 85:420-429.

38
Krause, M., Klooster, C. V. T., Buré, R. G., Metz, J. H. M., and Sambraus, H. H. 1997. The
influence of sequential and simultaneous feeding and the availability of straw on the
behaviour of gilts in group housing. NJAS. 45: 33-48.
McGlone, J. J., and Fullwood, S. D. 2001. Behavior, reproduction, and immunity of crated
pregnant gilts: effects of high dietary fiber and rearing environment. J. Anim. Sci.
79:1466-1474.
NRC. 2012. Nutritional requirements of swine. Natl. Acad. Press, Washington, DC.
Omtvedt, I. T., Stanislaw, C. M., and Whatley, J. A. 1965. Relationship of gestation length, age
and weight at breeding, and gestation gain to sow productivity at farrowing. J. Anim. Sci.
24: 531-535.
Robert, S., Rushen, J. and Farmer, C. 1997. Both energy content and bulk of food affect
stereotypic behaviour, heart rate and feeding motivation of female pigs. Appl. Anim.
Behav. Sci. 54:161-171.
Salak-Johnson, J. L., Niekamp, S. R., Rodriguez-Zas, S. L., Ellis, M., and Curtis, S. E. 2007.
Space allowance for dry, pregnant sows in pens: Body condition, skin lesions, and
performance. J. Anim. Sci. 85:1758-1769.
Strawford, M. L., Li, Y. Z., and Gonyou, H. W. 2008. The effect of management strategies and
parity on the behaviour and physiology of gestating sows housed in an electronic sow
feeding system. Can. J. Anim. Sci., 88: 559-567.
Zhao, Y., Flowers, W. L., Saraiva, A., Yeum, K. J., and Kim, S. W. 2013. Effect of social ranks
and gestation housing systems on oxidative stress status, reproductive performance, and
immune status of sows. J. Anim. Sci. 91:5848-5858.

39
Tables and Figures
Table 2.1: Composition of modified gestational diets used in the experiment.
Item
Wheat middlings-soybean
hulls (Midds-Hulls)
DDGS-corn germ meal
(DDGS-Germ Meal)
Ingredients, %
Corn 38.90 33.65
Soybean meal, 48% 12.50 2.50
Soybean hulls 15.00 -
Wheat middlings 30.00 -
DDGS - 30.00
Corn germ meal - 30.00
Soybean oil 1.00 1.00
Limestone 1.30 1.60
Dicalcium phosphate 0.60 0.55
Salt 0.40 0.40
Vitamin mineral premix 0.30 0.30
Total 100.00 100.00
Energy and nutrients
Energy, Kcal ME/kg 2,999 3,177
Crude protein, % 13.78 18.96
Calcium, % 0.78 0.78
Phosphorus, % 0.61 0.66
Phosphorus, digestible, % 0.34 0.34
Acid detergent fiber, % 9.81 7.93
Neutral detergent fiber, % 23.97 25.75
Amino Acids
Arginine, % 0.90 0.83
Histidine, % 0.35 0.52
Isoleucine, % 0.59 0.49
Leucine, % 1.05 1.34
Lysine, % 0.61 0.61
Methionine, % 0.21 0.45
Methionine + cysteine, % 0.46 0.66
Phenylalanine, % 0.60 0.58
Threonine, % 0.43 0.51
Tryptophan, % 0.15 0.23
Valine, % 0.59 0.59

40
Table 2.2: Effects of treatments on sow performance (least-squares means ± SE).
Performance trait
Midds-Hulls
DDGS-Germ Meal
P-value
SHORT Partitions
LONG Partitions P-value
Diet × Partition¹
Mean BW, kg 233.4 ± 5.6 234.4 ± 5.6 0.67 235.0 ± 5.6 232.8 ± 5.6 0.33 0.59 BW, kg (d30) 219.7 ± 5.7 221.6 ± 5.7 0.65 221.8 ± 5.7 219.5 ± 5.7 0.58 0.74 BW, kg (d70) 227.2 ± 3.5 223.0 ± 3.5 0.40 224. 6 ± 3.5 225.6 ± 3.6 0.85 0.79 BW, kg (d90) 235.4 ± 6.4 236.4 ± 6.4 0.88 238.4 ± 6.4 233.7 ± 6.4 0.29 0.79 BW, kg (d104) 256.5 ± 6.5 255.0 ± 6.5 0.75 257.6 ± 6.5 253.9 ± 6.5 0.43 0.97 BW, kg (end of lactation) 223.8 ± 8.1 233.5 ± 8.0 0.09 230.4 ± 8.0 226.9 ± 8.1 0.55 0.78 BW, kg (d 30 to 70) 10.0 ± 1.4 8.19 ± 1.4 0.29 9.25 ± 1.4 8.95 ± 1.4 0.86 0.76 BW, kg (d 30 to 90) 14.8 ± 1.8 14.0 ± 1.8 0.68 15.0 ± 1.8 13.8 ± 1.8 0.54 0.80 BW, kg (d30 to 104) 34.0 ± 1.8 31.7 ± 1.8 0.28 33.0 ± 1.8 32.8 ± 1.8 0.93 0.62 BW, kg (d30 to end of lactation) 1.11 ± 2.2ᵃ 9.22 ± 2.1ᵇ < 0.01 3.74 ± 2.1 6.59 ± 2.1 0.22 0.54 BW, kg (d70 to 90) 5.23 ± 1.0 3.74 ± 1.0 0.08 4.89 ± 1.0 4.08 ± 1.0 0.35 0.95 BW, kg (d70 to 104) 25.6 ± 1.2ᵃ 20.6 ± 1.2ᵇ < 0.01 23.2 ± 1.2 23.0 ± 1.2 0.86 0.36 BW, kg (d70 to end of lactation) -6.41 ± 4.7 -2.94 ± 4.7 0.11 -5.93 ± 4.7 -3.42 ± 4.7 0.25 0.68 BW, kg (d90 to 104) 20.9 ± 0.7ᵃ 17.3 ± 0.7ᵇ < 0.01 18.7 ± 0.7 19.4 ± 0.7 0.35 0.77 BW, kg (d90 to end of lactation) -13.2 ± 3.7ᵃ -5.99 ± 3.7ᵇ < 0.01 -11.1 ± 3.7 -8.12 ± 3.7 0.16 0.25 BW, kg (d104 to end of lactation) -32.8 ± 3.7ᵃ -23.0 ± 3.6ᵇ < 0.01 -28.7 ± 3.6 -27.0 ± 3.6 0.44 0.19 Mean BF, cm 1.86 ± 0.03 1.92 ± 0.03 < 0.01 1.89 ± 0.03 1.89 ± 0.03 0.75 0.62 BF, cm (d30) 1.97 ± 0.06 1.83 ± 0.06 0.04 1.91 ± 0.06 1.89 ± 0.06 0.68 0.25 BF, cm (d90) 1.87 ± 0.05 1.96 ± 0.05 0.09 1.89 ± 0.05 1.94 ± 0.05 0.65 0.96 BF, cm (d104) 1.91 ± 0.05 1.99 ± 0.05 0.18 1.96 ± 0.05 1.93 ± 0.05 0.56 0.94 BF, cm (end of lactation) 1.69 ± 0.04 1.83 ± 0.04 0.05 1.75 ± 0.04 1.76 ± 0.04 0.91 0.93 Mean BCS 2.99 ± 0.02 2.98 ± 0.02 0.75 2.98 ± 0.02 2.98 ± 0.02 0.90 0.06 BCS, d37 2.99 ± 0.03 3.01 ± 0.03 0.57 3.01 ± 0.03 2.99 ± 0.03 0.57 0.34 BCS, d90 2.99 ± 0.04 2.96 ± 0.04 0.53 2.98 ± 0.04 2.96 ± 0.04 0.78 0.36 BCS, d104 3.07 ± 0.04 3.01 ± 0.04 0.23 3.03 ± 0.04 3.05 ± 0.04 0.59 0.63 BCS, end of lactation 2.90 ± 0.07 2.93 ± 0.07 0.50 2.90 ± 0.07 2.92 ± 0.07 0.64 0.15
ᵃ˒ᵇWithin a row, means without a common superscript letter differ (P ≤ 0.05). ¹ Probability value for the diet x feeding partition length interaction.

41
Table 2.3: Effects of dietary treatment × feeding partition length on sow body lesion scores
(least-squares means ± SE).
Midds-Hulls DDGS-Germ Meal
Item SHORT
Partitions LONG
Partitions
SHORT Partitions
LONG Partitions P-value¹
Phase 1
Total Severity 25.5 ± 1.5 30.4 ± 1.5 25.9 ± 1.5 30.8 ± 1.5 0.97
Head 1.72 ± 0.2 2.11 ± 0.2 1.53 ± 0.2 2.14 ± 0.2 0.45 Ears 1.45 ± 0.3ᵃ 1.45 ± 0.3ᵃ 1.94 ± 0.3ᵇ 1.28 ± 0.3ᵃ < 0.01 Neck 4.19 ± 0.2 4.54± 0.2 3.75 ± 0.2 4.35 ± 0.2 0.47
Chest 0.05 ± 0.02 0.03 ± 0.02 0.01 ± 0.02 0.04 ± 0.02 0.20
Breast < 0.0001 ± 0.02 0.04 ± 0.02 0.03 ± 0.02 < 0.0001 ± 0.02 0.09 Shoulders 4.62 ± 0.3 4.37 ± 0.3 4.86 ± 0.3 4.58 ± 0.3 0.93
Side 4.51 ± 0.4 4.66 ± 0.4 4.93 ± 0.4 4.75 ± 0.4 0.35
Back 1.34 ± 0.3 2.86 ± 0.3 1.57 ± 0.3 2.78 ± 0.3 0.30
Udder 0.48 ± 0.1ᵃ 0.37 ± 0.1ᵃ 0.46 ± 0.1ᵃ 0.76 ± 0.1ᵇ < 0.01 Rear 1.31 ± 0.2 3.24 ± 0.2 1.55 ± 0.2 3.13 ± 0.2 0.26 Vulva 0.29 ± 0.01ᵃ 0.47 ± 0.01ᵇ 0.10 ± 0.1ᵃ 0.64 ± 0.1ᶜ 0.01
Front Legs 0.94 ± 0.2 1.35 ± 0.2 0.76 ± 0.2 1.21 ± 0.2 0.85
Hind Legs 4.49 ± 0.4 5.06 ± 0.4 4.37 ± 0.4 5.14 ± 0.4 0.59
Front Hooves 0.01 ± 0.01 0.04 ± 0.01 < 0.0001 ± 0.01 < 0.0001 ± 0.01 0.36
Hind Hooves 0.08 ± 0.1 0.18 ± 0.1 < 0.0001 ± 0.1 0.03 ± 0.1 0.65
Phase 2 Total Severity 20.0 ± 1.1ᵃ 24.4 ± 1.1ᵇ 20.2 ± 1.1ᵃ 27.8 ± 1.1ᶜ 0.04
Head 1.86 ± 0.2 1.69 ± 0.2 1.62 ± 0.2 1.70 ± 0.2 0.50 Ears 1.05 ± 0.2ᵃ 1.01 ± 0.2ᵃ 0.97 ± 0.2ᵃ 1.73 ± 0.2ᵇ < 0.01 Neck 2.45 ± 0.3 3.31 ± 0.3 2.47 ± 0.3 3.57 ± 0.3 0.54 Chest 0.02 ± 0.02 0.02 ± 0.02 0.02 ± 0.02 0.02 ± 0.02 0.86 Breast -- -- -- -- --
Shoulders 3.68 ± 0.2 3.60 ± 0.2 3.63 ± 0.2 4.01 ± 0.2 0.22 Side 3.77 ± 0.3 3.62 ± 0.3 3.75 ± 0.3 4.12 ± 0.3 0.20 Back 0.89 ± 0.4 1.60 ± 0.4 1.14 ± 0.4 2.29 ± 0.4 0.17 Udder 1.15 ± 0.3 1.18 ± 0.3 1.18 ± 0.3 1.55 ± 0.3 0.27
Rear 1.02 ± 0.2 2.78 ± 0.2 1.31 ± 0.2 3.13 ± 0.2 0.87
Vulva 0.49 ± 0.1 0.69 ± 0.1 0.17 ± 0.1 0.53 ± 0.1 0.49 Front Legs 0.81 ± 2.8 0.75 ± 2.7 0.66 ± 2.8 6.16 ± 2.7 0.31 Hind Legs 2.79 ± 0.3 4.16 ± 0.3 3.13 ± 0.3 4.58 ± 0.3 0.84
Front Hooves < 0.0001 ± 0.03 0.03 ± 0.03 0.05 ± 0.03 0.01 ± 0.03 0.13 Hind Hooves 0.05 ± 0.4 < 0.0001 ± 0.4 0.06 ± 0.4 0.83 ± 0.4 0.31
ᵃ⁻ᶜ Within a row, means without a common superscript letter differ (P ≤ 0.05). ¹Probability value for the diet x feeding partition length interaction.
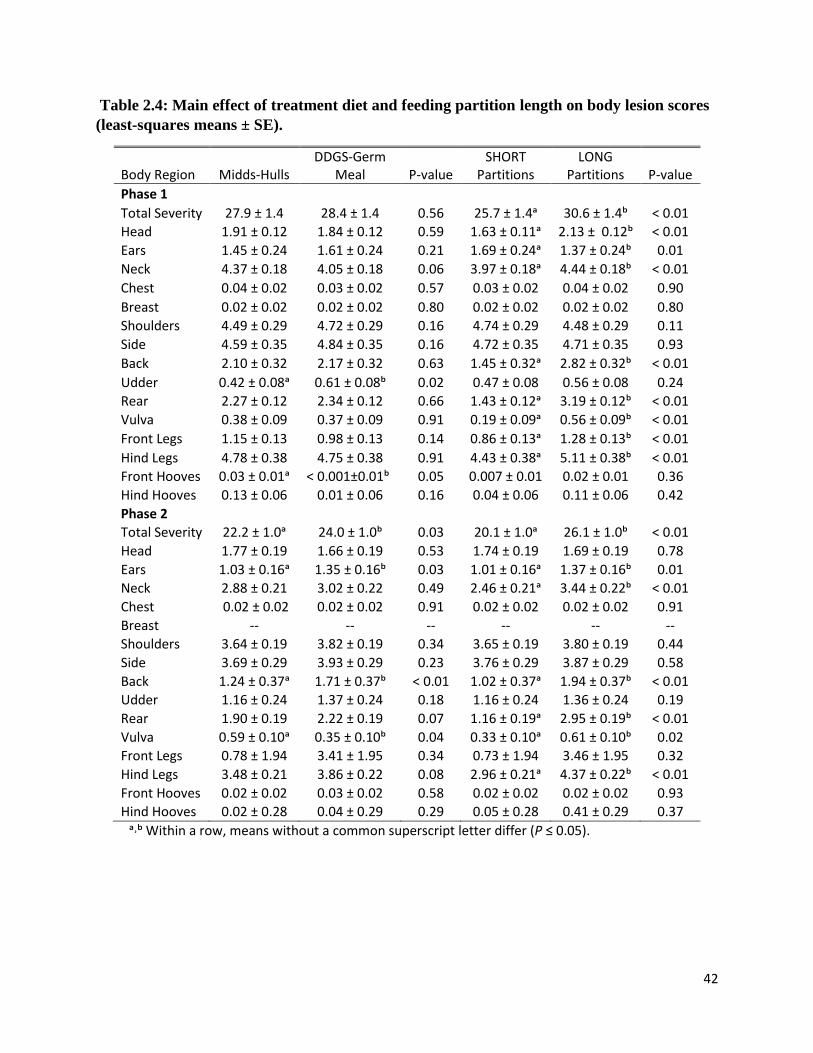
42
Table 2.4: Main effect of treatment diet and feeding partition length on body lesion scores
(least-squares means ± SE).
Body Region Midds-Hulls DDGS-Germ
Meal P-value SHORT
Partitions LONG
Partitions P-value
Phase 1
Total Severity 27.9 ± 1.4 28.4 ± 1.4 0.56 25.7 ± 1.4ᵃ 30.6 ± 1.4ᵇ < 0.01
Head 1.91 ± 0.12 1.84 ± 0.12 0.59 1.63 ± 0.11ᵃ 2.13 ± 0.12ᵇ < 0.01
Ears 1.45 ± 0.24 1.61 ± 0.24 0.21 1.69 ± 0.24ᵃ 1.37 ± 0.24ᵇ 0.01
Neck 4.37 ± 0.18 4.05 ± 0.18 0.06 3.97 ± 0.18ᵃ 4.44 ± 0.18ᵇ < 0.01
Chest 0.04 ± 0.02 0.03 ± 0.02 0.57 0.03 ± 0.02 0.04 ± 0.02 0.90
Breast 0.02 ± 0.02 0.02 ± 0.02 0.80 0.02 ± 0.02 0.02 ± 0.02 0.80
Shoulders 4.49 ± 0.29 4.72 ± 0.29 0.16 4.74 ± 0.29 4.48 ± 0.29 0.11
Side 4.59 ± 0.35 4.84 ± 0.35 0.16 4.72 ± 0.35 4.71 ± 0.35 0.93
Back 2.10 ± 0.32 2.17 ± 0.32 0.63 1.45 ± 0.32ᵃ 2.82 ± 0.32ᵇ < 0.01
Udder 0.42 ± 0.08ᵃ 0.61 ± 0.08ᵇ 0.02 0.47 ± 0.08 0.56 ± 0.08 0.24
Rear 2.27 ± 0.12 2.34 ± 0.12 0.66 1.43 ± 0.12ᵃ 3.19 ± 0.12ᵇ < 0.01
Vulva 0.38 ± 0.09 0.37 ± 0.09 0.91 0.19 ± 0.09ᵃ 0.56 ± 0.09ᵇ < 0.01
Front Legs 1.15 ± 0.13 0.98 ± 0.13 0.14 0.86 ± 0.13ᵃ 1.28 ± 0.13ᵇ < 0.01
Hind Legs 4.78 ± 0.38 4.75 ± 0.38 0.91 4.43 ± 0.38ᵃ 5.11 ± 0.38ᵇ < 0.01
Front Hooves 0.03 ± 0.01ᵃ < 0.001±0.01ᵇ 0.05 0.007 ± 0.01 0.02 ± 0.01 0.36
Hind Hooves 0.13 ± 0.06 0.01 ± 0.06 0.16 0.04 ± 0.06 0.11 ± 0.06 0.42
Phase 2
Total Severity 22.2 ± 1.0ᵃ 24.0 ± 1.0ᵇ 0.03 20.1 ± 1.0ᵃ 26.1 ± 1.0ᵇ < 0.01
Head 1.77 ± 0.19 1.66 ± 0.19 0.53 1.74 ± 0.19 1.69 ± 0.19 0.78
Ears 1.03 ± 0.16ᵃ 1.35 ± 0.16ᵇ 0.03 1.01 ± 0.16ᵃ 1.37 ± 0.16ᵇ 0.01
Neck 2.88 ± 0.21 3.02 ± 0.22 0.49 2.46 ± 0.21ᵃ 3.44 ± 0.22ᵇ < 0.01
Chest 0.02 ± 0.02 0.02 ± 0.02 0.91 0.02 ± 0.02 0.02 ± 0.02 0.91
Breast -- -- -- -- -- --
Shoulders 3.64 ± 0.19 3.82 ± 0.19 0.34 3.65 ± 0.19 3.80 ± 0.19 0.44
Side 3.69 ± 0.29 3.93 ± 0.29 0.23 3.76 ± 0.29 3.87 ± 0.29 0.58
Back 1.24 ± 0.37ᵃ 1.71 ± 0.37ᵇ < 0.01 1.02 ± 0.37ᵃ 1.94 ± 0.37ᵇ < 0.01
Udder 1.16 ± 0.24 1.37 ± 0.24 0.18 1.16 ± 0.24 1.36 ± 0.24 0.19
Rear 1.90 ± 0.19 2.22 ± 0.19 0.07 1.16 ± 0.19ᵃ 2.95 ± 0.19ᵇ < 0.01
Vulva 0.59 ± 0.10ᵃ 0.35 ± 0.10ᵇ 0.04 0.33 ± 0.10ᵃ 0.61 ± 0.10ᵇ 0.02
Front Legs 0.78 ± 1.94 3.41 ± 1.95 0.34 0.73 ± 1.94 3.46 ± 1.95 0.32
Hind Legs 3.48 ± 0.21 3.86 ± 0.22 0.08 2.96 ± 0.21ᵃ 4.37 ± 0.22ᵇ < 0.01
Front Hooves 0.02 ± 0.02 0.03 ± 0.02 0.58 0.02 ± 0.02 0.02 ± 0.02 0.93
Hind Hooves 0.02 ± 0.28 0.04 ± 0.29 0.29 0.05 ± 0.28 0.41 ± 0.29 0.37
ᵃ˒ᵇ Within a row, means without a common superscript letter differ (P ≤ 0.05).

43
Table 2.5: Effects of treatment on litter traits (least-squares means ± SE).
Litter trait Midds-Hulls DDGS-Germ
Meal P-value SHORT
Partitions LONG
Partitions P-value Diet ×
Partition¹
Litter birth weight (kg) 19.7 ± 1.1 20.0 ± 1.1 0.68 19.7 ± 1.1 20.0 ± 1.1 0.75 0.34 Total born (No./litter) 14.3 ± 0.6 13.7 ± 0.6 0.23 14.2 ± 0.6 13.8 ± 0.6 0.41 0.48 Total born alive (No./litter) 12.3 ± 0.6 12.3 ± 0.6 0.93 12.5 ± 0.6 12.0 ± 0.6 0.32 0.80 Males (No./litter) 5.73 ± 0.3 6.07 ± 0.3 0.33 6.13 ± 0.3 5.67 ± 0.3 0.18 0.42 Females (No./litter) 5.82 ± 0.3 5.55 ± 0.3 0.48 5.52 ± 0.3 5.85 ± 0.3 0.38 0.24 Stillborn (No./litter) 1.86 ± 0.2 1.29 ± 0.2 0.08 1.56 ± 0.2 1.59 ± 0.2 0.93 0.45 Mummified (No./litter) 0.14 ± 0.07 0.16 ± 0.07 0.69 0.15 ± 0.07 0.16 ± 0.07 0.90 0.66 Laid-on (No./litter) 0.88 ± 0.1 0.88 ± 0.1 0.97 0.84 ± 0.1 0.92 ± 0.1 0.67 0.47 Other dead (No./litter) 0.80 ± 0.3 1.08 ± 0.3 0.17 0.91 ± 0.3 0.96 ± 0.3 0.81 0.83 Pre-weaning mortality (No./litter) 3.51 ± 0.4 3.26 ± 0.3 0.59 3.29 ± 0.4 3.48 ± 0.4 0.69 0.48 Total piglets weaned (No./litter) 10.9 ± 0.3 10.5 ± 0.3 0.11 10.8 ± 0.3 10.6 ± 0.3 0.42 0.90 Litter weaning weight (kg) 72.9 ± 2.4 73.0 ± 2.3 0.97 73.4 ± 2.3 72.4 ± 2.4 0.64 0.68 Avg. piglet weaning weight (kg) 6.75 ± 0.2ᵃ 7.09 ± 0.2ᵇ 0.02 7.00 ± 0.2 6.84 ± 0.2 0.28 0.94 Cross-foster (No./litter) -0.20 ± 0.2 -0.10 ± 0.1 0.79 -0.08 ± 0.3 -0.22 ± 0.3 0.72 0.14
ᵃ˒ᵇ Within a row, means without a common superscript letter differ (P ≤ 0.05). ¹ Probability value for the diet x feeding partition length interaction.

44
CHAPTER 3:
EFFECTS OF HIGH FIBER DIETS AND FEEDING PARTITIONS ON IMMUNE
STATUS AND BEHAVIOR OF GROUP-KEPT MULTIPAROUS SOWS
Abstract
Four groups (n=36 sows per group) of primiparous and multiparous sows were randomly
assigned to one of two diets and to a pen (9 sows/pen; 1.7 m²/ sow) equipped with either short or
long feeding partitions. Once confirmed pregnant, sows were assigned to a dietary treatment of
either (a) low energy, high fiber (30% wheat middlings and 15% soybean hulls; Midds-Hulls) or
(b) high energy, high fiber (30% DDGS and 30% corn germ meal; DDGS-Germ Meal) and to a
feeding partition length of either (c) 0.6 m (SHORT) or (d) 1.8 m (LONG). Sows were fed
dietary treatments from gestational d 35 to 104, and then moved to treatment pens at gestational
d 37. Blood samples were collected via jugular venipuncture on gestational d 30, 70, 90, and
104, and then again at end of lactation. Immune measures included total white blood cell count,
total neutrophil and lymphocyte counts, leukocyte percentages, and mitogen induced lymphocyte
proliferation. Plasma cortisol and Interleukin-12 were measured on gestational d 30 and 90.
Aggressive behavior was recorded for 48-h post-mixing. There were no dietary treatment ×
feeding stall length effects on any measures. There were few main effects of diet or partition
length on immune and behavior. Sows fed DDGS-Germ Meal diet had higher total WBC counts
(P = 0.03), lymphocytes (P < 0.01), and monocytes (P = 0.02) than did sows fed Midds-Hulls
diet. Conversely, sows fed Midds-Hulls diet had a higher neutrophil count (P = 0.02) and
percentage (P < 0.01) and higher neutrophil-to-lymphocyte ratio (P < 0.01). Sows housed in pens
with SHORT feeding partitions had shorter aggressive encounters and lower neutrophil counts (P
< 0.01 and P = 0.02, respectively) than did sows in pens with LONG feeding partitions. Despite
dietary effects on descriptive immune parameters and feeding partition length on behavior, sows

45
were able to adapt to the various constraints within their environments which was apparent by
the differential biological responses evoked without compromising overall well-being.
Introduction
Many pork producers in the United States will either retrofit their existing gestation barns
or build new ones in order to comply with the group-housing mandates being imposed by either
state-by-state referendums or retailers. Group-housing is perceived by consumers as a better
housing option, but in reality there are welfare concerns associated with group housing systems
(reviewed by Kroneman et al, 1993; Spoolder et al., 2009; Verdon et al., 2015). A major
drawback of group housing is the increased aggression which occurs at mixing and around
limited resources, especially feed and water. Grouped-housed sows establish a social hierarchy
upon mixing which often reduces aggressive encounters later-on (Greenwood et al., 2014;
Velarde, 2007; Li, 2012). Most aggression among group-housed sows occurs within the 1st 24-h
post-mixing and thereafter a stable hierarchy within the group is achieved (Pedersen et al., 1993).
Yet, despite an established hierarchy aggression still occurs during feeding with higher ranked
sows often displacing lower ranked sows which leads to insufficient feed intake by lower ranked
sows (Csermely and Wood-Gush 1990; Kranendonk et al., 2007) and over-consumption by
higher ranked sows. Aggressive encounters are stressful and can affect the physiology and health
of the dry sow (Marchant et al., 1995). In addition, food deprivation increases cortisol levels and
if prolonged can cause body weight loss and reproductive failure (Anderson, 1975; Tsuma et al.,
1996; Mburu et al., 1998).
The objective of this study was to determine the effects of housing sows in groups-pens
equipped with two different feeding partitions lengths and two different high fiber supplemented
diets that differ in available energy on immune status and aggressive behavior of dry sows.

46
Materials and Methods
Animals, Housing, and Experimental Design
Crossbred primiparous (parity 0, n=39) and multiparous (parities 1 and 2, n=42; parities
≥3, n=62) sows were used in this experiment. All sows were derived from Genetiporc sow line
kept at the University of Illinois Swine Research Center. Sows were randomly assigned to a 2 x 2
factorial design (2 diet levels and 2 feeding partition lengths) and housed in a pen (n =9
sows/pen/treatment) with a floor-space allowance of 1.7m² per sow. There were 36 sows per
block (n=4), but 5 sows were removed from the study due to either injury or lack of eating and 2
sows were euthanized for health reasons, not related to treatments. The University of Illinois
Institutional Animal Care and Use Committee approved the animal protocol of this experiment.
All sows were artificially inseminated and pregnancy was detected ultrasonically on day
30 post breeding. Sows were randomly allocated to either a high fiber, low energy gestational
diet (30% wheat middlings and 15% soybean hulls; Midds-Hulls) or a high fiber, high energy
gestational diet (30% DDGS and 30% corn germ meal; DDGS-Germ Meal) and to a pen
equipped with either 0.6 m (SHORT) or 1.8 m (LONG) individual feeding partitions. The
length of the SHORT feeding partition started at the head and ended at the shoulders of the sow,
while the length of the LONG feeding partition protected the entire body of the sow. Group pens
were balanced for sow body weight (BW), back-fat depth (BF), and parity. Sows remained in
individual gestation stalls until gestational d 37 when sows were moved to their assigned
treatment pen (all blocks were subjected to a 35-minute feeding test for a different study prior to
moving into the pens). Sows were moved to farrowing crates at gestational d 104. All diets were
formulated to meet or exceed nutrient requirements (NRC, 2012; see Table 2.1 in chapter 2).
Feed was placed in individual feeding space once a day at 0630 h. Each feeding space was

47
equipped with a water nippler. Sows were fed 2.23 kg (Midds-Hulls) and 2.10 kg (DDGS-Germ
Meal) per sow from gestational d 35 to 90 and then 3.57 kg (Midds-Hulls) and 3.37 kg (DDGS-
Germ Meal) from gestational d 91 until moved to farrowing (d 104). Once sows were moved to
farrowing crates, sows were fed a standard lactation diet.
Blood Sample Collection and Analysis
Sows were nose-snared and 15 mL of blood was collected via jugular venipuncture from
each sow using heparinized 30 mL syringes on gestational d 30, 70, 90, and 104, and then again
at end of lactation. All blood samples were obtained within ≤ 2 min time period.
Total white blood cell (WBC) counts were calculated using a Coulter Z1 particle counter
(Beckman Coulter, Indianapolis, IN). For each sample, 10 µL of whole blood was added to 10
mL of Isoflow (Beckman Coulter), then Zap-oglobin (Beckman Coulter) was added to lyse the
red blood cells. For differential leukocyte counts, 10 µl of whole blood was used to make blood
smears. Slides were fixed in methanol, stained with Hema 3 staining solutions (Fisher Scientific,
Houston, TX) and then using a light microscope 100 cells per slide were counted.
Six mL of whole blood was layered over 3 mL of Histopaque 1077 (density= 1.077
g/mL; Saint Lout, MO) and 3 mL of Histopaque 1119 (density = 1.119 g/mL; Sigma Aldrich).
Samples were then centrifuged at 1840 rpm for 30 min at 25 °C. Plasma was aspirated and
transferred to eppendorf tubes and stored at -80 °C. Lymphocytes were removed from the 1077
layer and added to 5 mL of RPMI (Gibco; Carlsbad, CA). Neutrophils were removed from the
1119 layer and placed in a 50 mL conical tube. The neutrophils were washed three times with
RPMI and centrifuged at 200 x g for 10 minutes at 4°C and then resuspended in PBS (Fisher
Scientific). Neutrophils were counted using a particle counter and cell concentration was
adjusted to 3 x 10⁶ cells/mL.
48
The mixed-lymphocyte population was centrifuged at 1500 rpm for 15 min at 4°C,
supernatant was aspirated, and then cell pellet was resuspended in 2 mL of RPMI. Mixed cell
suspension was transferred to a petri dish containing 10 mL of 5% Fetal Bovine Serum (FBS;
Sigma Aldrich) and incubated for 2 h at 37 °C and 5% CO₂. After 2-h incubation period, non-
adherent cell mixture was collected, Petri dishes were washed with 5 mL of RMPI, and then non-
adherent cell mixture was centrifuged at 1500 rpm for 15 min at 4°C. Cell pellet was
resuspended in 1 mL of RPMI and counted using cell particle counter and cell concentration was
adjusted to 5 x 10 ⁶ cells/ mL with 10% FBS/ RPMI.
Lymphocyte Proliferation Assay
The mitogen induced lymphocyte proliferation assay was performed following a previous
protocol by Sutherland et al., 2006 with minor modifications. Mitogens used were
Concanavalin (ConA; Sigma Aldrich) at 0, 2, and 20 µg/mL for stimulating T-cells and
Lipopolysaccharide (LPS; Sigma Aldrich) at 0, 5, 50 µg/mL for stimulating B-cells, respectively.
To each well, 100 µL of each mitogen was added in triplicates to a sterile 96-well flat bottom
plate and then 100 µL of cells were added on top of the mitogen. The plates were then incubated
for 48 h at 37 °C, 5% CO₂. Following incubation period, 100 µL of supernatant was removed and
100 µL of 10% FBS/RPMI was added to each well. The plates were incubated for an additional
18 hrs and then 20 µL of 5 mg/mL thiazolyl blue tetrazolium bromide (MTT; Sigma Aldrich)
were added to each well. Plates were incubated for 4 h and 100 µL of HCl/isoproponal was
added to each well. Within an hour plates were read using a microplate reader at a wavelength of
600 nm. The proliferation index (PI) was calculated using the following equation:
49
𝑃𝐼 = 𝑎𝑣𝑒𝑟𝑎𝑔𝑒 𝑜𝑝𝑡𝑖𝑐𝑎𝑙 𝑑𝑒𝑛𝑠𝑖𝑡𝑦 𝑜𝑓 𝑠𝑡𝑖𝑚𝑢𝑙𝑎𝑡𝑒𝑑 𝑐𝑒𝑙𝑙𝑠
𝑎𝑣𝑒𝑟𝑎𝑔𝑒 𝑜𝑝𝑡𝑖𝑐𝑎𝑙 𝑑𝑒𝑛𝑠𝑖𝑡𝑦 𝑜𝑓 𝑛𝑜𝑛 − 𝑠𝑡𝑖𝑚𝑢𝑙𝑎𝑡𝑒𝑑 𝑐𝑒𝑙𝑙𝑠
Plasma Analysis
Plasma cortisol was measured using a validated RIA kit (MP Biomedicals, Santa Ana,
CA) by following the manufacture’s protocol with a slight modification, standards were made in
stripped porcine plasma. The concentrations used for the standard curve were 0, 8, 16, 32, 62.5,
125, and 250 ng/µL. Twenty-five µL of plasma or standard was added in duplicates to antibody-
coated tubes and then 1 mL of I125 cortisol was added. Tubes were placed in a water bath at 37°C
for 45 min. After the incubation period, the liquid was aspirated and samples were counted using
a gamma-counter. Interassay and intraassay CV were 8.3% and 9.1%, respectively, and
sensitivity was 3 pg. Total plasma IL-12 was measured using a validated commercial ELISA kit
(R&D Systems; Minneapolis, MN) following manufacture protocol. Briefly, 100 µL of 4-fold
diluted sample or standard was added in duplicate to 50 µL of assay diluent on an antibody
coated 96 well plate. The plate was placed on a shaker for 2-h at room temperature. Each well
was aspirated and plates were washed 5x with a wash buffer provided in the kit, and then 200 µL
of porcine conjugate was added and incubated for 2 h. After incubation, plates were washed and
120 µL of the substrate solution was added to each well. The plate was incubated in the dark for
30 min and then 120 µL hydrochloric acid was added to each well and plates were read at 450
nm using a microplate reader.
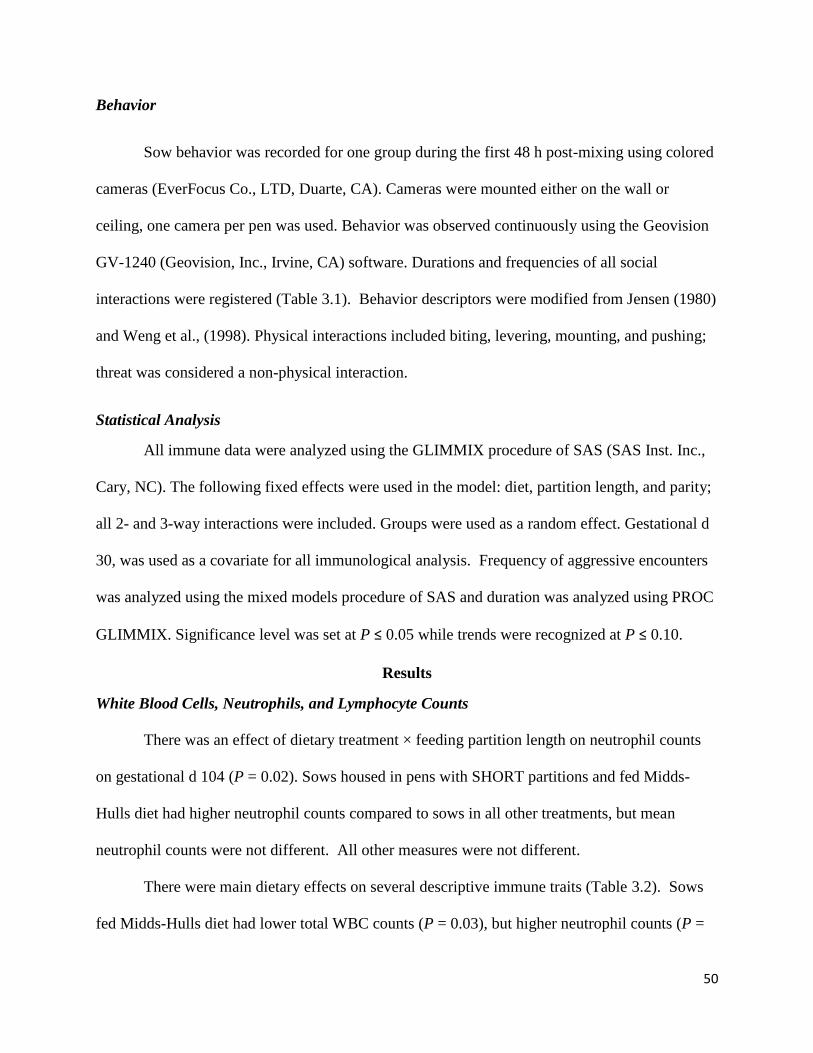
50
Behavior
Sow behavior was recorded for one group during the first 48 h post-mixing using colored
cameras (EverFocus Co., LTD, Duarte, CA). Cameras were mounted either on the wall or
ceiling, one camera per pen was used. Behavior was observed continuously using the Geovision
GV-1240 (Geovision, Inc., Irvine, CA) software. Durations and frequencies of all social
interactions were registered (Table 3.1). Behavior descriptors were modified from Jensen (1980)
and Weng et al., (1998). Physical interactions included biting, levering, mounting, and pushing;
threat was considered a non-physical interaction.
Statistical Analysis
All immune data were analyzed using the GLIMMIX procedure of SAS (SAS Inst. Inc.,
Cary, NC). The following fixed effects were used in the model: diet, partition length, and parity;
all 2- and 3-way interactions were included. Groups were used as a random effect. Gestational d
30, was used as a covariate for all immunological analysis. Frequency of aggressive encounters
was analyzed using the mixed models procedure of SAS and duration was analyzed using PROC
GLIMMIX. Significance level was set at P ≤ 0.05 while trends were recognized at P ≤ 0.10.
Results
White Blood Cells, Neutrophils, and Lymphocyte Counts
There was an effect of dietary treatment × feeding partition length on neutrophil counts
on gestational d 104 (P = 0.02). Sows housed in pens with SHORT partitions and fed Midds-
Hulls diet had higher neutrophil counts compared to sows in all other treatments, but mean
neutrophil counts were not different. All other measures were not different.
There were main dietary effects on several descriptive immune traits (Table 3.2). Sows
fed Midds-Hulls diet had lower total WBC counts (P = 0.03), but higher neutrophil counts (P =

51
0.02) compared to sows fed DDGS-Germ Meal diet. All other descriptive immune traits were not
different, exception was a tendency for sows fed Midds-Hulls diet to have higher lymphocyte
counts on gestational d 90 (P = 0.06).
Total neutrophils were higher for sows housed in pens with LONG partitions compared
with sows in pens with SHORT feeding partitions (P = 0.02). Total WBC and lymphocyte counts
were not affected by the length of the partitions, except for at gestational d 90; sows housed in
pens with LONG feeding partitions had higher counts (P = 0.02).
There were no effects of parity × diet × feeding partition length, parity × diet, or parity ×
feeding partition length or main effects of parity on total WBC, neutrophil, or lymphocyte counts
(P > 0.05).
Differentials
No diet × feeding partition length effects occurred for percentages of lymphocytes,
neutrophils, eosinophils, or monocytes. There was a tendency for sows housed in pens with
LONG partitions and fed Midds-Hulls diet to have lower percentage of eosinophils than sows in
other treatments (P = 0.07). Sows housed in pens with LONG feeding partitions and fed Midds-
Hulls had higher neutrophil-to-lymphocyte ratio at gestational d 90 compared to sows in other
treatments (P = 0.04). There were dietary effects on percentages of lymphocytes, monocytes,
and neutrophils. Sows fed DDGS-Germ Meal diet had greater percentages of lymphocytes and
monocytes than did sows fed other diet (P < 0.01 and P = 0.02, respectively). Sows fed Midds-
Hulls had higher neutrophil percentage and neutrophil-to-lymphocyte ratio (both P < 0.01) than
did sows fed other diet. Sows fed Midds-Hulls diet also had higher percentage of eosinophils at d
90 (P = 0.05), only.
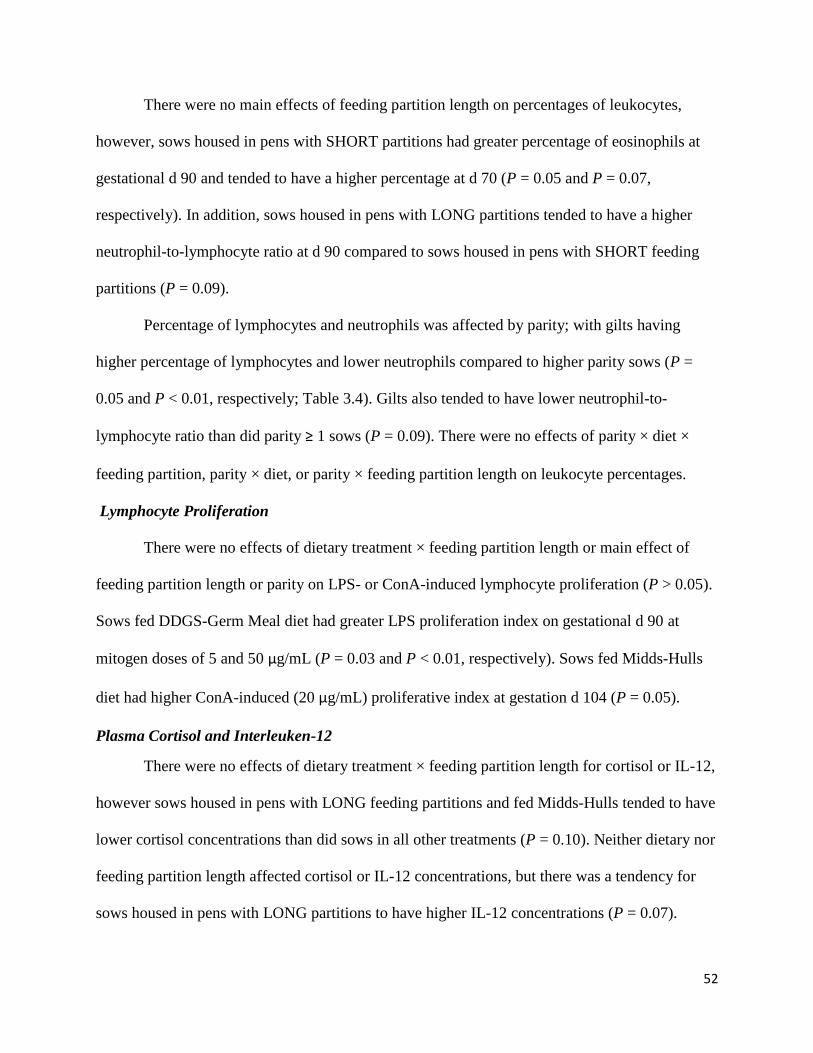
52
There were no main effects of feeding partition length on percentages of leukocytes,
however, sows housed in pens with SHORT partitions had greater percentage of eosinophils at
gestational d 90 and tended to have a higher percentage at d 70 (P = 0.05 and P = 0.07,
respectively). In addition, sows housed in pens with LONG partitions tended to have a higher
neutrophil-to-lymphocyte ratio at d 90 compared to sows housed in pens with SHORT feeding
partitions (P = 0.09).
Percentage of lymphocytes and neutrophils was affected by parity; with gilts having
higher percentage of lymphocytes and lower neutrophils compared to higher parity sows (P =
0.05 and P < 0.01, respectively; Table 3.4). Gilts also tended to have lower neutrophil-to-
lymphocyte ratio than did parity ≥ 1 sows (P = 0.09). There were no effects of parity × diet ×
feeding partition, parity × diet, or parity × feeding partition length on leukocyte percentages.
Lymphocyte Proliferation
There were no effects of dietary treatment × feeding partition length or main effect of
feeding partition length or parity on LPS- or ConA-induced lymphocyte proliferation (P > 0.05).
Sows fed DDGS-Germ Meal diet had greater LPS proliferation index on gestational d 90 at
mitogen doses of 5 and 50 µg/mL (P = 0.03 and P < 0.01, respectively). Sows fed Midds-Hulls
diet had higher ConA-induced (20 µg/mL) proliferative index at gestation d 104 (P = 0.05).
Plasma Cortisol and Interleuken-12
There were no effects of dietary treatment × feeding partition length for cortisol or IL-12,
however sows housed in pens with LONG feeding partitions and fed Midds-Hulls tended to have
lower cortisol concentrations than did sows in all other treatments (P = 0.10). Neither dietary nor
feeding partition length affected cortisol or IL-12 concentrations, but there was a tendency for
sows housed in pens with LONG partitions to have higher IL-12 concentrations (P = 0.07).

53
Mean plasma cortisol and IL-12 concentrations were not affected by sow parity, but
gestational day affected IL-12. Gilts had lower IL-12 at gestational d 30 (P < 0.01) and d 90 (P
= 0.03) compared to higher parity sows. There were no 2- or 3-way interactions with parity, diet,
and feeding partition length on these measures.
Behavior
There were no effects of dietary treatment × feeding partition length or main effects of
diet on aggressive behavior (P > 0.05). Sows housed in pens with SHORT feeding partitions (P
< 0.01) had shorter bouts of aggression than did sows in pens with LONG (Table 3.5). Sows
housed in pens with SHORT feeding partitions had more non-physical encounters (P = 0.02) and
more social interactions in the pen area (P = 0.02) than did sows in pens with LONG feeding
partitions. The frequencies of aggressive encounters and other interactions were not different
between sows in pens with either SHORT or LONG feeding partitions.
Discussion
Group housing can be stressful for gestating sows due to aggressive encounters. In this
study there was an attempt to minimize aggression at mixing by adding individual feeding
partitions to the pens. Barnett et al. (1992) found that number of aggressive interactions among
sows during the initial 90 minutes post-mixing was reduced in group-pens with feeding stalls. In
the present study, we found no difference in the frequency of aggressive encounters during the
initial 48 hours post-mixing; however, sows housed in pens with SHORT feeding partitions had
shorter aggressive interactions and more non-physical encounters. This was surprising because
we hypothesized that LONG feeding partitions which protected the sow’s entire body would
serve as a place for sows to retreat during fights and that it would be more difficulty to displace
them from these feeding stall spaces. The SHORT feeding partitions only protected the sow’s
head and shoulders so even if they attempted to hide in between the feeding partitions the attacks

54
could have continued on their side or rear. Salak-Johnson et al. (2012) showed that sows fight
less when they are allotted less floor allowance in small group-pens with floor-feeding. In pens
with LONG feeding partitions there was less available open-pen space for sows to easily escape
or retreat while the greater open-pen space available in pens with SHORT partitions may have
allowed sows to retreat quicker and farther away from attacking sows. Conversely, an earlier
study by Weng et al. (1998) found that aggression increased as space allowance per sow
decreased. In the present study the space reduction in pens with LONG feeding partitions could
have contributed to the longer aggressive encounters. We speculate that sows in these pens were
not able to retreat as easily because of the limited space. Sows could have blocked escape routes
or the entrance to feeding partition spaces leading to receiving sows not having somewhere to
easily retreat.
Overall, sows housed in pens with SHORT feeding partitions may have been less stressed
as evident by physiological measures including lower neutrophil-to-lymphocyte ratio (a classical
marker of stress). Barnett et al. (1992) found lower cortisol concentrations among sows housed
in pens with feeding partitions when compared to sows that were either floor-fed or without
protection. Conversely, in the present study cortisol was not measured until gestational d 90,
thus it is plausible that cortisol may have been different post-mixing but based on our findings
sows had acclimated to the stressful constraints of each housing environment by gestation d 90.
Often increases in cortisol are indicative of an acute stress response, thus one would expect
cortisol to increase earlier rather than later. Despite the treatment effects on aggressive behavior
and increased neutrophil counts—indicative of acute stress, overall well-being was not different
between sows housed in pens with LONG or SHORT feeding partitions. These findings imply
that sows in either treatment group managed to cope with their environment by eliciting different
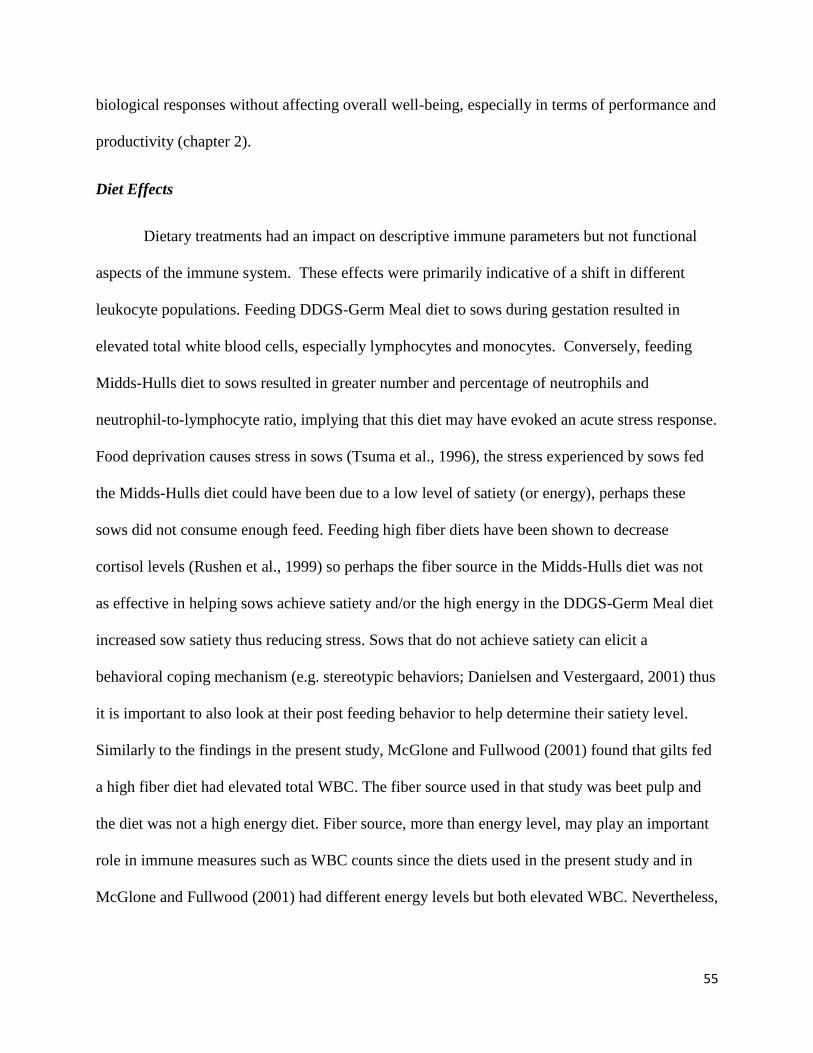
55
biological responses without affecting overall well-being, especially in terms of performance and
productivity (chapter 2).
Diet Effects
Dietary treatments had an impact on descriptive immune parameters but not functional
aspects of the immune system. These effects were primarily indicative of a shift in different
leukocyte populations. Feeding DDGS-Germ Meal diet to sows during gestation resulted in
elevated total white blood cells, especially lymphocytes and monocytes. Conversely, feeding
Midds-Hulls diet to sows resulted in greater number and percentage of neutrophils and
neutrophil-to-lymphocyte ratio, implying that this diet may have evoked an acute stress response.
Food deprivation causes stress in sows (Tsuma et al., 1996), the stress experienced by sows fed
the Midds-Hulls diet could have been due to a low level of satiety (or energy), perhaps these
sows did not consume enough feed. Feeding high fiber diets have been shown to decrease
cortisol levels (Rushen et al., 1999) so perhaps the fiber source in the Midds-Hulls diet was not
as effective in helping sows achieve satiety and/or the high energy in the DDGS-Germ Meal diet
increased sow satiety thus reducing stress. Sows that do not achieve satiety can elicit a
behavioral coping mechanism (e.g. stereotypic behaviors; Danielsen and Vestergaard, 2001) thus
it is important to also look at their post feeding behavior to help determine their satiety level.
Similarly to the findings in the present study, McGlone and Fullwood (2001) found that gilts fed
a high fiber diet had elevated total WBC. The fiber source used in that study was beet pulp and
the diet was not a high energy diet. Fiber source, more than energy level, may play an important
role in immune measures such as WBC counts since the diets used in the present study and in
McGlone and Fullwood (2001) had different energy levels but both elevated WBC. Nevertheless,

56
the few difference in immune measures did not affect sow performance or litter traits (except for
average piglet weaning weight; see chapter 2).
Parity Effects
Gilts had a higher percentage of lymphocytes and less neutrophils, resulting in a lower
neutrophil to lymphocyte ratio compare to parity ≥ 1 sows. A lower ratio indicates that gilts were
less stressed than higher parity sows. Often older sows are involved in more aggressive
encounters and have higher body lesion scores than younger sows (Salak-Johnson et al., 2007;
Strawford et al., 2008), it is likely that the gilts in this study were involved in fewer aggressive
encounters thus experienced less social stress. Furthermore, social rank is directly related to
parity, gilts are often the submissive sows in the group so they are less likely to be involved in
social status fights (Hunter et al., 1988). By not having to constantly fight to maintain their social
rank, sows are less stressed. Overall, gilts tended to evoke less of a stress response than did
higher parity sows but did not have different productivity as parity 1 and 2 sows (chapter 2).
In conclusion, SHORT feeding partitions decrease the duration of aggressive interactions
consequently reducing social stress in group-kept sows. Thus housing sows in pens with shoulder
length feeding partitions may be plausible for pork producers. Feeding a DDGS-Germ Meal diet
may improve sow satiety as indicated by the low neutrophil-to-lymphocyte ratio. Further
research needs to examine aggressive encounters beyond the initial 48 hours post mixing in pens
with 0.6 m feeding partitions to conclude whether the effects seen in this study are the same once
a social hierarchy has been established. In addition, different dietary energy sources and their
effect on stereotypic behaviors need to be examined while using multiple measures of sow well-
being.

57
Literature Cited
Anderson, L. L. 1975. Embryonic and placental development during prolonged inanition in the
pig. Am. J. Physiol. 229:1687-1694
Barnett, J. L., Hemsworth, P. H., Cronin, G. M., Newman, E. A., McCallum, T. H., and Chilton,
D. 1992. Effects of pen size, partial stalls and method of feeding on welfare-related
behavioural and physiological responses of group-housed pigs. Appl. Anim. Behav.
Sci. 34:207-220.
Csermely, D., and Wood‐Gush, D. G. 1990. Agonistic behaviour in grouped sows. II. How social
rank affects feeding and drinking behaviour. Ital. J. Zool. 57: 55-58.
Danielsen, V. and Vestergaard, E. M. 2001. Dietary fibre for pregnant sows: effect on
performance and behaviour. Anim. Feed Sci. Technol. 90:71-80.
DeDecker, A. E., Hanson, A. R., Walker, P. M., and Salak-Johnson, J. L. 2014. Space allowance
and high fiber diet impact performance and behavior of group-kept gestating sows. J.
Anim. Sci. 92:1666-1674.
Greenwood, E. C., Plush, K. J., van Wettere, W. H., and Hughes, P. E. 2014. Hierarchy
formation in newly mixed, group housed sows and management strategies aimed at
reducing its impact. Appl .Anim. Behav. Sci 160:1-11.
Jensen, P.1980. An ethogram of social interaction patterns in group-housed dry sows. Appl.
Anim. Ethol., 6: 341-350.
Kranendonk, G., Van der Mheen, H., Fillerup, M., and Hopster, H. 2007. Social rank of pregnant
sows affects their body weight gain and behavior and performance of the offspring. J.
Anim. Sci. 85:420-429.
Kroneman, A., Vellenga, L., Van der Wilt, F. J., and Vermeer, H. M. 1993. Review of health
problems in group‐housed sows, with special emphasis on lameness. Vet. Quart., 15:26-
29.
Li, Y.Z. 2012. Minimizing aggression among group-housed gestating sows at mixing. Fact Sheet
of Pork Information Gateway.
Marchant, J. N., Mendl, M. T., Rudd, A. R., and Broom, D. M. 1995. The effect of agonistic
interactions on the heart rate of group-housed sows. Appl. Anim. Behav. Sci. 46:49-56.
Mburu, J. N., Einarsson, S., Kindahl, H., Madej, A., and Rodriguez-Martinez, H. 1998. Effects of
post-ovulatory food deprivation on oviductal sperm concentration, embryo development
and hormonal profiles in the pig. Anim. Reprod. Sci. 52:221-234.

58
McGlone, J. J., and Fullwood, S. D. 2001. Behavior, reproduction, and immunity of crated
pregnant gilts: effects of high dietary fiber and rearing environment. J. Anim. Sci.
79:1466-1474.
NRC. 2012. Nutritional requirements of swine. Natl. Acad. Press, Washington, DC.
Pedersen, L. J., Rojkittikhun, T., Einarsson, S., and Edqvist, L. E. 1993. Postweaning grouped
sows: effects of aggression on hormonal patterns and oestrous behaviour. Appl. Anim.
Behav. Sci. 38:25-39.
Rushen, J., Robert, S., and Farmer, C. 1999. Effects of an oat-based high-fibre diet on insulin,
glucose, cortisol and free fatty acid concentrations in gilts. Animal science: an
international journal of fundamental and applied research.
Salak-Johnson, J. L., DeDecker, A. E., Horsman, M. J., and Rodriguez-Zas, S. L. 2012. Space
allowance for gestating sows in pens: Behavior and immunity. J. Anim. Sci. 90: 3232-
3242.
Spoolder, H. A. M., Geudeke, M. J., Van der Peet-Schwering, C. M. C., and Soede, N. M. 2009.
Group housing of sows in early pregnancy: A review of success and risk factors. Livest.
Sci., 125:1-14.
Strawford, M. L., Li, Y. Z., and Gonyou, H. W. 2008. The effect of management strategies and
parity on the behaviour and physiology of gestating sows housed in an electronic sow
feeding system. Can. J. Anim. Sci., 88: 559-567.
Sutherland, M. A., Niekamp, S. R., Rodriguez-Zas, S. L., and Salak-Johnson, J. L. 2006. Impacts
of chronic stress and social status on various physiological and performance measures in
pigs of different breeds. J. Anim. Sci. 84: 588-596.
Tsuma, V. T., Einarsson, S., Madej, A., Kindahl, H., and Lundeheim, N. 1996. Effect of food
deprivation during early pregnancy on endocrine changes in primiparous sows. Anim.
Reprod. Sci. 41:267-278.
Velarde, A. “Agonistic behaviour.” On farm monitoring of pig welfare. Wageningen Academic
Press, Wageningen, the Netherlands, 53-56.
Verdon, M., Hansen, C. F., Rault, J. L., Jongman, E., Hansen, L. U., Plush, K., and Hemsworth,
P. H. 2015. Effects of group housing on sow welfare: A review. J Anim. Sci. 93:1999-
2017.
Weng, R. C., Edwards, S. A., and English, P. R. 1998. Behaviour, social interactions and lesion
scores of group-housed sows in relation to floor space allowance. Appl. Anim. Behav. Sci.
59: 307-316.

59
Tables
Table 3.1: Definitions of the social interactions recorded (least-squares means ± SE).
Behavior Description
Biting Sow has mouth open and makes contact with conspecific Levering Sow lifts conspecific up in the air with snout Mounting Sow has front legs on conspecific’s back or rear Pushing Sow pushes conspecific with any part of her body Threat Sow moves suddenly towards another sow with no physical contact and
receiving sow retreats

60
Table 3.2: Effects of treatment on total white blood cells and lymphocytes and neutrophils counts (least-
squares means ± SE).
Immune trait Midds-Hulls DDGS-Germ
Meal P-value SHORT
Partitions LONG
Partitions P-value Diet ×
Partition¹
Mean total WBC (10⁷/mL) 6.77 ± 0.3ᵃ 7.22 ± 0.3ᵇ 0.03 7.07 ± 0.3 6.93 ± 0.3 0.49 0.40 Mean lymphocytes (10⁷/mL) 4.37 ± 0.4 4.17 ± 0.4 0.40 4.13 ± 0.4 4.37 ± 0.4 0.26 0.74 Mean neutrophils (10⁶/mL) 21.0 ± 1.8ᵃ 19.2 ± 1.8ᵇ 0.02 19.2 ± 1.8ᵃ 21.0 ± 1.8ᵇ 0.02 0.89
ᵃ˒ᵇ Within a row, means without a common superscript letter differ (P < 0.05). ¹ Probability value for the diet x feeding partition length interaction.
Table 3.3: Effects of treatment on leukocyte differentials (least-squares means ± SE).
Immune trait Midds-Hulls DDGS-Germ
Meal P-value SHORT
Partitions LONG
Partitions P-value Diet ×
Partition¹
Mean lymphocytes (%) 42.1 ± 2.2ᵃ 44.9 ± 2.2ᵇ < 0.01 43.05 ± 2.2 44.02 ±2.2 0.29 0.28 Mean neutrophils (%) 48.2 ± 1.8ᵃ 45.3 ± 1.8ᵇ < 0.01 47.10 ± 1.8 46.41 ± 1.8 0.50 0.35 Mean eosinophils (%) 5.24 ± 0.2 5.24 ± 0.2 1.00 5.37 ± 0.2 5.11 ± 0.2 0.28 0.07 Mean monocytes (%) 3.09 ± 0.9ᵃ 3.73 ± 0.9ᵇ 0.02 3.45 ± 0.9 3.37 ± 0.9 0.76 0.82 Mean other (%) 0.73 ± 0.4 1.00 ± 0.4 0.09 0.96 ± 0.4 0.78 ± 0.4 0.26 0.48
Mean neutrophil: lymphocyte 1.60 ± 0.2ᵃ 1.30 ± 0.2ᵇ < 0.01 1.46 ± 0.2 1.44 ± 0.2 0.85 0.97
ᵃ˒ᵇ Within a row, means without a common superscript letter differ (P < 0.05). ¹ Probability value for the diet x feeding partition length interaction.
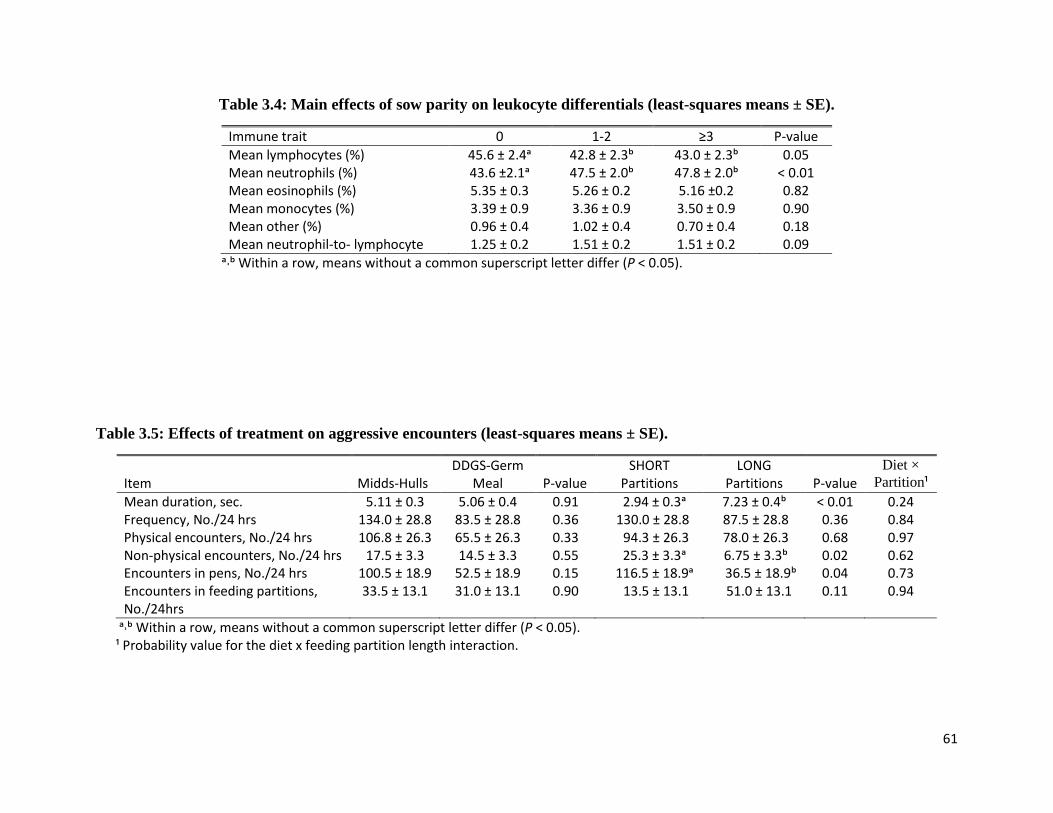
61
Table 3.4: Main effects of sow parity on leukocyte differentials (least-squares means ± SE).
Immune trait 0 1-2 ≥3 P-value
Mean lymphocytes (%) 45.6 ± 2.4ᵃ 42.8 ± 2.3ᵇ 43.0 ± 2.3ᵇ 0.05 Mean neutrophils (%) 43.6 ±2.1ᵃ 47.5 ± 2.0ᵇ 47.8 ± 2.0ᵇ < 0.01 Mean eosinophils (%) 5.35 ± 0.3 5.26 ± 0.2 5.16 ±0.2 0.82 Mean monocytes (%) 3.39 ± 0.9 3.36 ± 0.9 3.50 ± 0.9 0.90 Mean other (%) 0.96 ± 0.4 1.02 ± 0.4 0.70 ± 0.4 0.18 Mean neutrophil-to- lymphocyte 1.25 ± 0.2 1.51 ± 0.2 1.51 ± 0.2 0.09
ᵃ˒ᵇ Within a row, means without a common superscript letter differ (P < 0.05).
Table 3.5: Effects of treatment on aggressive encounters (least-squares means ± SE).
Item Midds-Hulls DDGS-Germ
Meal P-value SHORT
Partitions LONG
Partitions P-value
Diet ×
Partition¹
Mean duration, sec. 5.11 ± 0.3 5.06 ± 0.4 0.91 2.94 ± 0.3ᵃ 7.23 ± 0.4ᵇ < 0.01 0.24 Frequency, No./24 hrs 134.0 ± 28.8 83.5 ± 28.8 0.36 130.0 ± 28.8 87.5 ± 28.8 0.36 0.84 Physical encounters, No./24 hrs 106.8 ± 26.3 65.5 ± 26.3 0.33 94.3 ± 26.3 78.0 ± 26.3 0.68 0.97 Non-physical encounters, No./24 hrs 17.5 ± 3.3 14.5 ± 3.3 0.55 25.3 ± 3.3ᵃ 6.75 ± 3.3ᵇ 0.02 0.62 Encounters in pens, No./24 hrs 100.5 ± 18.9 52.5 ± 18.9 0.15 116.5 ± 18.9ᵃ 36.5 ± 18.9ᵇ 0.04 0.73 Encounters in feeding partitions, No./24hrs
33.5 ± 13.1 31.0 ± 13.1 0.90 13.5 ± 13.1 51.0 ± 13.1 0.11 0.94
ᵃ˒ᵇ Within a row, means without a common superscript letter differ (P < 0.05). ¹ Probability value for the diet x feeding partition length interaction.

62
APPENDIX A
Table A.1: Main effects of parity on sow performance (least-squares means ± SE).
Parity
Performance trait 0 1-2 ≥3 P-value
Mean BW (kg) 205.0 ± 5.6ᵃ 232.2 ± 5.6ᵇ 252.6 ± 5.5ᶜ < 0.01 BW, d 30 (kg) 193.9 ± 5.2ᵃ 217.9 ± 5.0ᵇ 238.3 ± 4.8ᶜ < 0.01 BW, d 70 (kg) 194.8 ± 3.5ᵃ 222.0 ± 3.3ᵇ 245.5 ± 2.7ᶜ < 0.01 BW, d 90 (kg) 208.5 ± 6.5ᵃ 234.2 ± 6.3ᵇ 253.3 ± 6.1ᶜ < 0.01 BW, d 104 (kg) 225.5 ± 6.8ᵃ 253.7 ± 6.5ᵇ 273.3 ± 6.3ᶜ < 0.01 BW, end of lactation (kg) 195.9 ± 7.0ᵃ 224.5 ± 6.62ᵇ 246.5 ± 6.4ᶜ < 0.01 BW change, d 30 to 70 (kg) 7.81 ± 1.9 9.46 ± 1.8 9.79 ± 1.5 0.63 BW change, d 70 to 90 (kg) 4.47 ± 1.2 5.58 ± 1.1 3.75 ± 1.1 0.20 BW change, d 90 to 104 (kg) 16.7 ± 0.9ᵃ 19.5 ± 0.7ᵇ 19.9 ± 0.7ᵇ < 0.01 BW change, d 104 to end of lactation (kg) -29.7 ± 4.0 -27.0 ± 3.8 -28.0 ± 3.7 0.67 BW change, d 30 to end of lactation (kg) -0.02 ± 2.8 5.48 ± 2.5 6.64 ± 2.3 0.08 Mean BF (cm) 2.05 ± 0.1ᵃ 1.84 ± 0.1ᵇ 1.83 ± 0.1ᵇ < 0.01 BF, d 30 (cm) 2.20 ± 0.08ᵃ 1.83 ± 0.07ᵇ 1.78 ± 0.07ᵇ < 0.01 BF, d 90 (cm) 2.09 ± 0.1ᵃ 1.86 ± 0.1ᵇ 1.87 ± 0.1ᵇ 0.01 BF, d 104 (cm) 2.03 ± 0.1 1.94 ± 0.1 1.9 ± 0.1 0.25 BF, end of lactation (cm) 1.77 ± 0.1 1.77 ± 0.1 1.76 ± 0.1 0.99 Mean BCS 3.05 ± 0.03ᵃ 2.95 ± 0.03ᵇ 2.98 ± 0.02ᵇ < 0.01 BCS, d 37 3.14 ± 0.04ᵃ 2.96 ± 0.04ᵇ 2.95 ± 0.03ᵇ <0.01 BCS, d 90 3.07 ± 0.05ᵃ 2.93 ± 0.04ᵇ 2.95 ± 0.03ᵇ 0.05 BCS, d 104 3.13 ± 0.06 3.00 ± 0.05 3.03 ± 0.05 0.12 BCS, end of lactation 2.76 ± 0.1ᵃ 2.89 ± 0.1ᵃ˒ᵇ 2.99 ± 0.1ᵇ < 0.01
ᵃ⁻ᶜ Within a row, means without a common superscript letter differ (P ≤ 0.05).

63
Figure A.1: Main effects of parity on sow body weight.
Figure A.2: Main effects of parity on sow back-fat depth.
a aa
a
aa
b bb
b
b bc c cc
c c
0
50
100
150
200
250
300
day 30 day 70 day 90 day 104 end oflactation
mean
Bo
dy
we
igh
t (k
g)
0
1-2
≥3
aa a
a
a
b ba
a bbb a
a b
0
0.5
1
1.5
2
2.5
day 30 day 90 day 104 end oflactation
mean
Bac
k-fa
t (c
m)
0
1-2
≥3

64
Figure A.3: Main effects of parity on body condition score.
Table A.2: Main effects of parity on litter traits (least-squares means ± SE).
ᵃ˒ᵇ Within a row, means without a common superscript letter differ (P ≤ 0.05).
a
a
a
a
a
bb
a
a,b
bb b
ab b
2.5
2.6
2.7
2.8
2.9
3
3.1
3.2
day 37 day 90 day 104 end oflactation
mean
Bo
dy
con
dit
ion
sco
re
0
1-2
≥3
Parity
Litter trait 0 1-2 ≥3 P-value
Litter birth weight (kg) 19.0 ± 1.3 20.1 ± 1.2 20.1 ± 1.2 0.47 Total born (No./litter) 12.7 ± 0.7ᵃ 13.6 ± 0.7ᵃ 14.9 ± 0.6ᵇ < 0.01 Total born Alive (No./litter) 11.7 ± 0.7 12.2 ± 0.7 12.7 ± 0.6 0.31 Males (No./litter) 6.00 ± 0.4 5.45 ± 0.3 6.19 ± 0.3 0.17 Females (No./litter) 5.16 ± 0.4 5.93 ± 0.4 5.85 ± 0.3 0.28 Stillborn (No./litter) 0.94 ± 0.3ᵃ 1.31 ± 0.3ᵃ 2.04 ± 0.2ᵇ 0.02 Mummified (No./litter) 0.12 ± 0.1 0.18 ± 0.1 0.16 ± 0.1 0.80 Laid-on (No./litter) 0.55 ± 0.2 0.85 ± 0.2 1.05 ± 0.2 0.16 Other dead (No./litter) 0.76 ± 0.3 0.96 ± 0.3 1.00 ± 0.3 0.67 Pre-weaning mortality (No./litter) 2.22 ± 0.5ᵃ 3.17 ± 0.4ᵃ 4.12 ± 0.4ᵇ < 0.01 Total piglets weaned (No./litter) 11.0 ± 0.4 10.6 ± 0.4 10.7 ± 0.3 0.54 Litter weaning weight (kg) 73.8 ± 2.7 74.1 ± 2.5 72.9 ± 2.3 0.86 Avg. piglet weaning weight (kg) 6.79 ± 0.2 7.05 ± 0.2 6.90 ± 0.2 0.43 Cross-foster (No./litter) 0.01 ± 0.4 0.02 ± 0.4 -0.36 ± 0.4 0.64
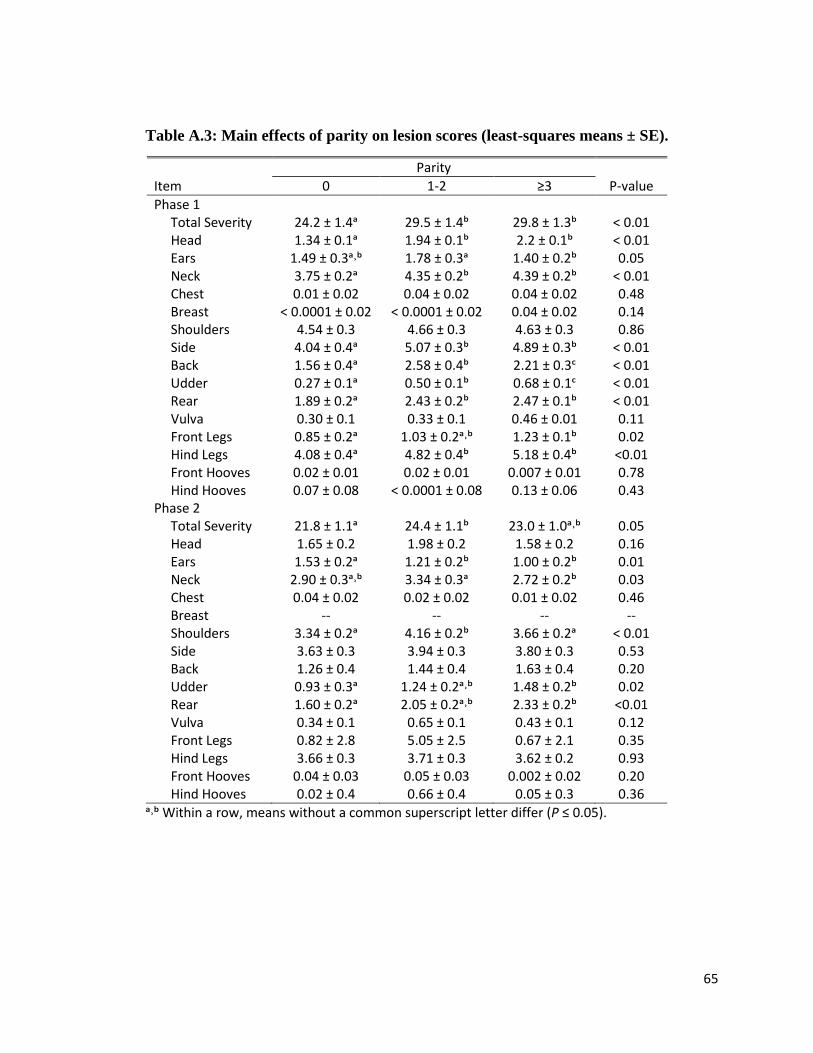
65
Table A.3: Main effects of parity on lesion scores (least-squares means ± SE).
Parity
Item 0 1-2 ≥3 P-value
Phase 1 Total Severity 24.2 ± 1.4ᵃ 29.5 ± 1.4ᵇ 29.8 ± 1.3ᵇ < 0.01 Head 1.34 ± 0.1ᵃ 1.94 ± 0.1ᵇ 2.2 ± 0.1ᵇ < 0.01 Ears 1.49 ± 0.3ᵃ˒ᵇ 1.78 ± 0.3ᵃ 1.40 ± 0.2ᵇ 0.05 Neck 3.75 ± 0.2ᵃ 4.35 ± 0.2ᵇ 4.39 ± 0.2ᵇ < 0.01 Chest 0.01 ± 0.02 0.04 ± 0.02 0.04 ± 0.02 0.48 Breast < 0.0001 ± 0.02 < 0.0001 ± 0.02 0.04 ± 0.02 0.14 Shoulders 4.54 ± 0.3 4.66 ± 0.3 4.63 ± 0.3 0.86 Side 4.04 ± 0.4ᵃ 5.07 ± 0.3ᵇ 4.89 ± 0.3ᵇ < 0.01 Back 1.56 ± 0.4ᵃ 2.58 ± 0.4ᵇ 2.21 ± 0.3ᶜ < 0.01 Udder 0.27 ± 0.1ᵃ 0.50 ± 0.1ᵇ 0.68 ± 0.1ᶜ < 0.01 Rear 1.89 ± 0.2ᵃ 2.43 ± 0.2ᵇ 2.47 ± 0.1ᵇ < 0.01 Vulva 0.30 ± 0.1 0.33 ± 0.1 0.46 ± 0.01 0.11 Front Legs 0.85 ± 0.2ᵃ 1.03 ± 0.2ᵃ˒ᵇ 1.23 ± 0.1ᵇ 0.02 Hind Legs 4.08 ± 0.4ᵃ 4.82 ± 0.4ᵇ 5.18 ± 0.4ᵇ <0.01 Front Hooves 0.02 ± 0.01 0.02 ± 0.01 0.007 ± 0.01 0.78 Hind Hooves 0.07 ± 0.08 < 0.0001 ± 0.08 0.13 ± 0.06 0.43 Phase 2 Total Severity 21.8 ± 1.1ᵃ 24.4 ± 1.1ᵇ 23.0 ± 1.0ᵃ˒ᵇ 0.05 Head 1.65 ± 0.2 1.98 ± 0.2 1.58 ± 0.2 0.16 Ears 1.53 ± 0.2ᵃ 1.21 ± 0.2ᵇ 1.00 ± 0.2ᵇ 0.01 Neck 2.90 ± 0.3ᵃ˒ᵇ 3.34 ± 0.3ᵃ 2.72 ± 0.2ᵇ 0.03 Chest 0.04 ± 0.02 0.02 ± 0.02 0.01 ± 0.02 0.46 Breast -- -- -- -- Shoulders 3.34 ± 0.2ᵃ 4.16 ± 0.2ᵇ 3.66 ± 0.2ᵃ < 0.01 Side 3.63 ± 0.3 3.94 ± 0.3 3.80 ± 0.3 0.53 Back 1.26 ± 0.4 1.44 ± 0.4 1.63 ± 0.4 0.20 Udder 0.93 ± 0.3ᵃ 1.24 ± 0.2ᵃ˒ᵇ 1.48 ± 0.2ᵇ 0.02 Rear 1.60 ± 0.2ᵃ 2.05 ± 0.2ᵃ˒ᵇ 2.33 ± 0.2ᵇ <0.01 Vulva 0.34 ± 0.1 0.65 ± 0.1 0.43 ± 0.1 0.12 Front Legs 0.82 ± 2.8 5.05 ± 2.5 0.67 ± 2.1 0.35 Hind Legs 3.66 ± 0.3 3.71 ± 0.3 3.62 ± 0.2 0.93 Front Hooves 0.04 ± 0.03 0.05 ± 0.03 0.002 ± 0.02 0.20 Hind Hooves 0.02 ± 0.4 0.66 ± 0.4 0.05 ± 0.3 0.36
ᵃ˒ᵇ Within a row, means without a common superscript letter differ (P ≤ 0.05).

66
Table A.4: Effects of diet × feeding partition length × parity on sow performance (least-squares means ± SE).
Midds-Hulls DDGS-Germ Meal
SHORT Partitions LONG Partitions SHORT Partitions LONG Partitions
Item 0 1-2 ≥3 0 1-2 ≥3 0 1-2 ≥3 0 1-2 ≥3 P-value¹
Mean BW
(kg)
210.4 ±
6.4ᵃ
238.8
± 6.4ᵇ 244.8 ±
6.0ᵇ
200.8
± 6.6ᵃ 228.9
± 6.1ᶜ 255.7
± 6.1ᵈ
200.6
± 6.5ᵃ 236.8 ±
6.3ᵇ
256.3
± 6.0ᵈ
208.4
± 6.4ᵃ 224.2
± 6.2ᶜ 253.6
± 6.0ᵈ <0.01
Mean BF
(cm)
2.04 ±
0.09
1.92 ±
0.09
1.78 ±
0.08
2.22 ±
0.1
1.82 ±
0.08
1.88 ±
0.08
2.04 ±
0.09
1.85 ±
0.09
1.82 ±
0.08
1.89 ±
0.09
1.78 ±
0.09
1.85 ±
0.08 0.30
Mean BCS 3.07 ±
0.05
2.98 ±
0.05
2.91 ±
0.03
3.02 ±
0.05
2.99 ±
0.05
3.02 ±
0.04
3.02 ±
0.05
2.93 ±
0.04
3.04 ±
0.04
3.09 ±
0.05
2.90 ±
0.04
2.93 ±
0.04 0.01
ᵃ⁻ᵈWithin a row, means without a common superscript letter differ (P ≤ 0.05). ¹Probability value for the diet x feeding partition length x parity interaction.
Table A.5: Effect of diet × feeding partition length × parity on body lesion scores (least-squares means ± SE).
Midds-Hulls DDGS-Germ Meal
SHORT Partitions LONG Partitions SHORT Partitions LONG Partitions
Item 0 1-2 ≥3 0 1-2 ≥3 0 1-2 ≥3 0 1-2 ≥3 P-value¹
Total Severity
20.1 ± 1.5
26.1 ± 1.5
23.9 ± 1.3
25.1 ± 1.6
28.1 ± 1.4
30.3 ± 1.4
22.1 ± 1.5
25.3 ± 1.5
23.9 ± 1.4
26.1 ± 1.5
30.6 ± 1.5
31.0 ± 1.4
0.33
Phase 1 21.3 ±
1.8 28.2 ±
1.9 26.5 ±
1.6 26.6 ±
1.9 30.0 ±
1.7 33.0 ±
1.6 22.8 ±
1.8 27.5 ±
1.8 27.0 ±
1.6 26.0 ±
1.9 32.5 ±
1.8 32.6 ±
1.6 0.34
Phase 2 18.2 ±
1.7 22.8 ±
1.7 19.6 ±
1.4 21.8 ±
1.9 25.2 ±
1.5 25.1 ±
1.5 20.8 ±
1.7 21.6 ±
1.6 18.7 ±
1.5 26.3 ±
1.7 27.8 ±
1.6 28.6 ±
1.4 0.81
ᵃ⁻ᵈ Within a row, means without a common superscript letter differ (P ≤ 0.05). ¹Probability value for the diet x feeding partition length x parity interaction.

67
Table A.6: Effects of diet × parity on sow performance and body lesion scores (least-squares means ± SE).
Midds-Hulls DDGS-Germ Meal
Item 0 1-2 ≥3 0 1-2 ≥3 P-value¹
Mean BW (kg) 205.6 ± 6.0 233.8 ± 5.8 250.3 ± 5.7 204.5 ± 5.9 230.5 ± 5.8 255.0 ± 5.7 0.15 Mean BF (cm) 2.13 ± 0.08 1.87 ± 0.07 1.83 ± 0.07 1.97 ± 0.08 1.81 ± 0.08 1.84 ± 0.07 0.30 Mean BCS 3.05 ± 0.04 2.98 ± 0.03 2.97 ± 0.03 3.05 ± 0.03 2.92 ± 0.03 2.99 ± 0.03 0.24 Total Lesion Severity 22.6 ± 1.3 27.1 ± 1.3 27.1 ± 1.2 24.1 ± 1.3 28.0 ± 1.3 27.5 ± 1.2 0.72 Total, Phase 1 23.9 ± 1.6 29.1 ± 1.5 29.8 ± 1.4 24.0 ± 1.6 30.0 ± 1.5 29.8 ± 1.5 0.86 Total, Phase 2 20.0 ± 1.4 24.0 ± 1.3 22.3 ± 1.2 23.6 ± 1.4 24.7 ± 1.3 23.6 ± 1.2 0.38
¹Probability value for the diet x parity interaction.
Table A.7: Effects of feeding partition length × parity on sow performance and body lesion scores (least-squares means ± SE).
SHORT Partitions LONG Partitions
Item 0 1-2 ≥3 0 1-2 ≥3 P-value¹
Mean BW (kg) 205.5 ± 5.9ᵃ 237.8 ± 5.8ᵇ 250.6 ± 5.7ᶜ 204.6 ± 6.0ᵃ 226.6 ± 5.8ᵈ 254.7 ± 5.7ᶜ <0.01 Mean BF (cm) 2.04 ± 0.08 1.89 ± 0.08 1.80 ± 0.07 2.06 ± 0.08 1.80 ± 0.07 1.87 ± 0.07 0.15 Mean BCS 3.0 ± 0.03 2.96 ± 0.03 2.98 ± 0.03 3.05 ± 0.04 2.94 ± 0.03 2.98 ± 0.03 0.93 Total Lesion Severity 21.1 ± 1.3ᵃ 25.7 ± 1.3ᵇ 23.9 ± 1.2ᵇ 25.6 ± 1.3ᵇ 29.4 ± 1.3ᶜ 30.7 ± 1.2ᶜ 0.04 Total, Phase 1 22.0 ± 1.5 27.9 ± 1.6 26.8 ± 1.4 26.3 ± 1.6 31.2 ± 1.5 32.8 ± 1.5 0.28 Total, Phase 2 19.5 ± 1.3 22.2 ± 1.3 19.2 ± 1.2 24.1 ± 1.4 26.5 ± 1.3 26.8 ± 1.2 0.12
ᵃ⁻ᵈ Within a row, means without a common superscript letter differ (P ≤ 0.05). ¹Probability value for the feeding partition length x parity interaction.

68
Table A.8: Main effects of day of treatment on
total severity of lesion scores among sows housed
in groups (least-squares means ± SE). Day Total Severity
Phase 1¹ 0 22.3 ± 1.5 1 33.8 ± 1.5 3 31.8 ± 1.5 6 31.3 ± 1.5 9 33.4 ± 1.5 12 31.2 ± 1.6 15 29.5 ± 1.6 Phase 2¹ 29 26.0 ± 1.2 43 26.7 ± 1.2 51 21.9 ± 1.2 67 22.1 ± 1.2
Table A.9: Main effects of dietary treatment on total
severity of lesion scores across days (least-squares means ± SE). Day Midds-Hulls DDGS-Germ Meal
Phase 1¹ 0 23.1 ± 1.8 21.5 ± 1.8 1 33.4 ± 1.8 34.1 ± 1.8 3 30.7 ± 1.8 33.0 ± 1.8 6 29.4 ± 1.8 33.3 ± 1.8 9 32.9 ± 1.8 33.8 ± 1.8 12 31.1 ± 1.8 31.3 ± 1.8 15 30.0 ± 1.8 29.0 ± 1.8 Phase 2² 29 25.5 ± 1.4 26.0 ± 1.5 43 25.6 ± 1.4 27.9 ± 1.4 51 20.6 ± 1.4 23.2 ± 1.4 67 22.8 ± 1.5 22.8 ± 1.5
¹P =0.18 for the treatment day x diet interaction. ²P =0.79 for the treatment day x diet interaction.

69
Table A.10: Effects of day of treatment × feeding partition
length on total severity of lesion scores (least-squares means ± SE). Day SHORT LONG
Phase 1¹ 0 21.6 ± 1.8ᵃ 23.0 ± 1.8ᵃ 1 33.3 ± 1.8ᵃ 34.4 ± 1.8ᵃ 3 28.4 ± 1.8ᵃ 35.3 ± 1.8ᵇ 6 27.1 ± 1.8ᵃ 35.6 ± 1.8ᵇ 9 30.4 ± 1.8ᵃ 36.4 ± 1.8ᵇ 12 27.6 ± 1.8ᵃ 34.7 ± 1.8ᵇ 15 25. 4 ± 1.8ᵃ 33.6 ± 1.8ᵇ Phase 2¹ 29 21.4 ± 1.4ᵃ 30.5 ± 1.4ᵇ 43 24.0 ± 1.4ᵃ 29.5 ± 1.4ᵇ 51 18.3 ± 1.4ᵃ 25.5 ± 1.4ᵇ 67 18.0 ± 1.4ᵃ 26.3 ± 1.4ᵇ
ᵃ˒ᵇ Within a row, means without a common superscript letter differ (P < 0.05). ¹P < 0.01 for the treatment day x feeding partition length interaction.
Table A.11: Effects of day of treatment × dietary × feeding partition length treatments on
total severity of lesion scores (least-squares means ± SE).
Midds-Hulls DDGS-Germ Meal
Day SHORT Partition LONG Partition SHORT Partition LONG Partition
Phase 1¹ 0 21.6 ± 2.1ᵃ 24.6 ± 2.1ᵃ 21.7 ± 2.1ᵃ 21.4 ± 2.1ᵃ 1 33.9 ± 2.1ᵃ 33.0 ± 2.1ᵃ 32.6 ± 2.1ᵃ 35.8 ± 2.1ᵃ 3 25.1 ± 2.1ᵃ 36.2 ± 2.1ᵇ 31.6 ± 2.1ᶜ 34.4 ± 2.1ᵇ˒ᶜ 6 25.3 ± 2.1ᵃ 33.6 ± 2.1ᵇ 29.0 ± 2.1ᵃ 37.5 ± 2.1ᵇ 9 30.6 ± 2.1ᵃ 35.3 ± 2.1ᵇ 30.2 ± 2.1ᵃ 37.4 ± 2.1ᵇ 12 29.6 ± 2.1ᵃ˒ᶜ 32.5 ± 2.1ᵃ˒ᵇ 25.6 ± 2.1ᶜ 36.9 ± 2.1ᵇ 15 25.3 ± 2.1ᵃ 34.7 ± 2.1ᵇ 25.5 ± 2.1ᵃ 32.5 ± 2.1ᵇ Phase 2² 29 22.3 ± 1.8 29.6 ± 1.9 20.6 ± 1.8 31.4 ± 1.8 43 23.3 ± 1.8 27.9 ± 1.9 24.8 ± 1.9 31.0 ± 1.8 51 18.5 ± 1.8 22.7 ± 1.8 18.1 ± 1.9 28.4 ± 1.8 67 17.8 ± 1.8 25.2 ± 1.9 18.2 ± 1.9 27.4 ± 1.9
ᵃ⁻ᶜWithin a row, means without a common superscript letter differ (P < 0.05). ¹P = 0.03 for the treatment day x diet x feeding partition length interaction. ²P = 0.86 for the treatment day x diet x feeding partition length interaction.

70
Figure A.4: Effects of day × dietary × feeding partition length treatments on total lesion
severity for phase 1 (P = 0.03).
Figure A.5: Mean total lesion severity for both phase 1 and 2 by diet.

71
Figure A.6: Mean total lesion severity scores for both phase 1 and 2 by feeding partition
length treatments.
Figure A.7: Effects of day × dietary × feeding partition length treatments on total lesion
severity, phase 1.
a
a
a a
a a,c
aa
ab
bb
a,bb
a
ac
a a
c a
a
a b,cb b b
b
0
5
10
15
20
25
30
35
40
0 1 3 6 9 12 15
Mea
n L
esio
n S
core
Post-treatment (days)
MIDDS + SHORT Parition MIDDS + LONG Partition DDGS + SHORT Partition DDGS + LONG Partition

72
Figure A.8: Effects of day × dietary × feeding partition length treatments on total lesion
severity, phase 2 (P = 0.86).
Figure A.9: Effects of parity on total piglets born, stillborn, and mortality per litter.
15
18
21
24
27
30
33
29 43 51 67
Mea
n L
esio
n S
core
Post-treatment (days)
MIDDS + SHORT Parition
MIDDS + LONG Partition
DDGS + SHORT Partition
DDGS + LONG Partition
a
a
a
a
a
a
b
b
b
0
2
4
6
8
10
12
14
16
Total Born Mortality Stilborn
Nu
mb
er p
er li
tter
0
1-2
3-6

73
Figure A.10: Effects of parity on total lesion severity.
Figure A.11: Effects of parity on lesion scores at different body regions during phase 1.
a
a
b
b
b
a, b
0
5
10
15
20
25
30
35
Phase 1 Phase 2
Mea
n L
esio
n S
core
0
1-2
≥3
aa,b
aa
a
a
a
a
a
b a
b
b
b
b
b
a,b
b
b
b
b
b
c
c
b
b
b
0
1
2
3
4
5
6
Head Ears Neck Side Back Udder Rear Front Legs Hind Legs
Mea
n L
esio
n S
core
0
1-2
≥3

74
Figure A.12: Effects of parity on lesion scores at different body regions during
phase 2.
Figure A.13: Sow body weight loss from day 104 post breeding to end of lactation.
a
a,b
a
a
a
b
a
b
a,b
a,b
b
b
a
b
b
0
0.5
1
1.5
2
2.5
3
3.5
4
4.5
Ears Neck Shoulders Udder Rear
Mea
n L
esio
n S
core
0
1-2
≥3
a
b
0
5
10
15
20
25
30
35
MIDDS DDGS
Bo
dy
wei
ght
loss
(kg
)
Diet

75
Figure A.14: Sow body weight gain from day 30 post breeding to end of lactation.
Figure A.15: Sow body weight gain from day 30 to 104 post breeding.
a
b
0
1
2
3
4
5
6
7
8
9
10
MIDDS DDGS
Mea
n b
od
y w
eig
ht
(kg)
Diet
a
a
30.5
31
31.5
32
32.5
33
33.5
34
34.5
MIDDS DDGS
Mea
n b
od
y w
eigh
t (k
g)
Diet

76
Figure A.16: Total lesion severity in phases 1 and 2 based on treatment diets.
Figure A.17: Dietary treatment effect on udder and front hooves lesions during phase 1.
ᵃ
ᵃ
ᵃ
ᵇ
0
5
10
15
20
25
30
35
Phase 1 Phase 2
Mea
n L
esio
n S
core
MIDDS
DDGS
a
a
b
b0
0.1
0.2
0.3
0.4
0.5
0.6
0.7
Udder Front Hooves
Mea
n L
esio
n S
core
Body Region
MIDDS
DDGS

77
Figure A.18: Dietary treatment effect on the ears, back, and vulva lesions during phase 2.
Figure A.19: Effect of feeding partition length treatment on total lesion severity during
phase 1 and 2.
a
a
a
b
b
b
0
0.2
0.4
0.6
0.8
1
1.2
1.4
1.6
1.8
Ears Back Vulva
Mea
n L
esio
n S
core
Body Region
MIDDS
DDGS
ᵃ
ᵃᵇ
ᵇ
0
5
10
15
20
25
30
35
Phase 1 Phase 2
Mea
n L
esio
n S
core
LONG partitions
SHORT partitions
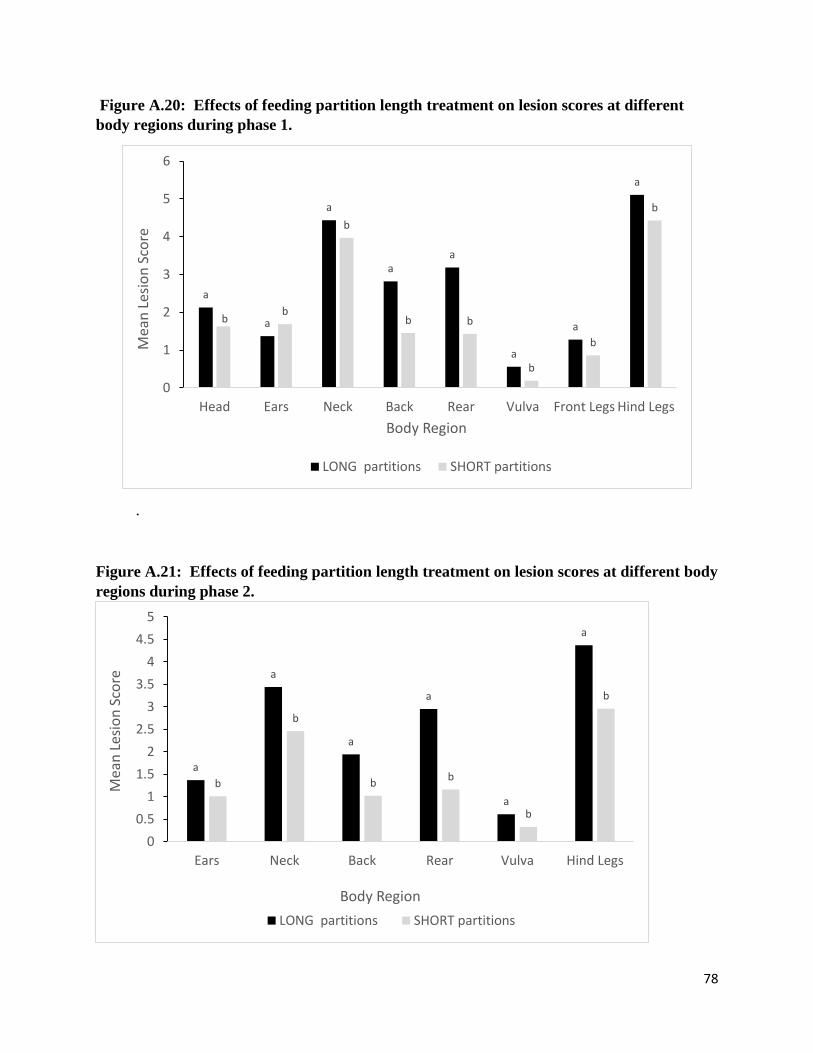
78
Figure A.20: Effects of feeding partition length treatment on lesion scores at different
body regions during phase 1.
.
Figure A.21: Effects of feeding partition length treatment on lesion scores at different body
regions during phase 2.
a
a
a
aa
a
a
a
bb
b
b b
b
b
b
0
1
2
3
4
5
6
Head Ears Neck Back Rear Vulva Front Legs Hind Legs
Mea
n L
esio
n S
core
Body Region
LONG partitions SHORT partitions
a
a
a
a
a
a
b
b
bb
b
b
0
0.5
1
1.5
2
2.5
3
3.5
4
4.5
5
Ears Neck Back Rear Vulva Hind Legs
Mea
n L
esio
n S
core
Body Region
LONG partitions SHORT partitions

79
Figure A.22: Effects of diet × feeding partition length treatment on body weights of gilts.
Figure A.23: Effects of diet × feeding partition length treatment on body weight of parity 1
and 2 sows.
194
196
198
200
202
204
206
208
210
212
Midds-Hulls DDGS-Germ Meal
BW
, kg
Parity 0
Short Partitions Long Partitions
215
220
225
230
235
240
Midds-Hulls DDGS-Germ Meal
BW
, kg
Parity 1 & 2
Short Partitions Long Partitions

80
Figure A.24: Effects of diet × feeding partition length treatment on body weight of parity
≥3 sows.
Figure A.25: Effects of diet × feeding partition length treatment on gilt body condition
score.
238
240
242
244
246
248
250
252
254
256
258
Midds-Hulls DDGS-Germ Meal
BW
, kg
Parity ≥3
Short Partitions Long Partitions
2.98
3
3.02
3.04
3.06
3.08
3.1
Midds-Hulls DDGS-Germ Meal
BC
S
Parity 0
Short Partitions Long Partitions

81
Figure A.26: Effects of diet × feeding partition length treatment on body condition score of
parity 1 and 2 sows.
Figure A.27: Effects of diet × feeding partition length treatment on body condition score of
parity ≥3 sows.
2.84
2.86
2.88
2.9
2.92
2.94
2.96
2.98
3
Midds-Hulls DDGS-Germ Meal
BC
SParity 1 & 2
Short Partitions Long Partitions
2.8
2.85
2.9
2.95
3
3.05
Midds-Hulls DDGS-Germ Meal
BC
S
Parity ≥3
Short Partitions Long Partitions

82
Table A.12: Effects of treatment on total severity of body lesion scores during both phases (least-squares means ± SE).
Midds-Hulls DDGS-Germ
Meal P-value SHORT
Partitions LONG
Partitions P-value
Diet ×
Partition¹
Total Severity 25.9 ± 1.2 26.7 ± 1.2 0.11 29.0 ± 1.2 23.6 ± 1.2 < 0.01 0.38
¹Probability value for the diet x feeding partition length interaction.
Table A.13: Main effects of parity on lesion score severity during both phases (least-squares means ± SE).
0 1-2 ≥3 P-value
Total Severity 23.4 ± 1.2 27.5 ± 1.2 27.3 ± 1.2 < 0.01

83
APPENDIX B
Table B.1: Effects of diet × feeding partition length × parity on immune traits (least-squares means ± SE).
Midds-Hulls DDGGS-Germ Meal
Short Partitions Long Partitions Short Partitions Long Partitions
Immune Trait 0 1-2 ≥3 0 1-2 ≥3 0 1-2 ≥3 0 1-2 ≥3 P-value¹
Mean total WBC (10⁷/mL)
6.65 ± 0.5
6.83 ± 0.5
6.84 ± 0.4
6.77 ± 0.5
6.89 ± 0.4
6.64 ± 0.4
7.19 ± 0.5
7.12 ± 0.5
6.96 ± 0.4
7.50 ± 0.5
7.37 ± 0.5
7.30 ± 0.4
0.91
Mean lymphocyte (10⁷/mL)
4.13 ± 0.6
3.98 ± 0.6
4.51 ± 0.5
4.32 ± 0.6
4.80 ± 0.5
4.25 ± 0.5
4.55 ± 0.6
3.56 ± 0.6
3.96 ± 0.5
5.25 ± 0.6
3.86 ± 0.6
4.19 ± 0.5
0.64
Mean neutrophils (10⁶/mL)
18.9 ± 2.3
20.8 ± 2.3
20.6 ± 2.0
25.2 ± 2.4
20.7 ± 2.1
21.3 ± 2.1
17.0 ± 2.3
18.3 ± 2.2
18.9 ± 2.1
20.2 ± 2.3
18.7 ± 2.2
21.2 ± 2.1
0.50
Mean lymphocytes (%)
44.7 ± 2.8
40.8 ± 2.8
39.4 ± 2.5
43.5 ± 2.9
42.3 ± 2.6
43.8 ± 2.6
48.4 ± 2.9
43.7 ± 2.7
44.1 ± 2.5
45.8 ± 2.9
44.4 ± 2.7
44.8 ± 2.6
0.76
Mean neutrophils (%)
45.7 ± 2.7
48.1 ± 2.6
51.4 ± 2.3
47.5 ± 2.9
47.9 ± 2.4
46.8 ± 2.4
39.5 ± 2.8
47.2 ± 2.6
46.5 ± 2.3
41.6 ± 2.7
46.8 ± 2.5
46.5 ± 2.4
0.54
Mean eosinophils (%)
5.33 ± 0.5
5.66 ± 0.5
5.68 ± 0.4
4.50 ± 0.5
4.97 ± 0.4
5.02 ± 0.4
5.31 ± 0.5
5.14 ± 0.4
5.09 ± 0.4
6.27 ± 0.5
5.25 ± 0.4
4.87 ± 0.4
0.82
Mean monocytes (%)
3.11 ± 1.00
3.66 ± 0.99
2.89 ± 0.94
2.92 ± 1.04
2.65 ± 1.0
3.42 ± 1.0
4.10
±1.0
3.82 ± 1.0
3.51 ± 0.9
3.43 ± 1.0
3.31 ± 1.0
4.19 ± 0.9
0.90
Mean other (%) 0.72 ±
0.5
0.85 ± 0.5
0.75 ± 0.4
0.60 ± 0.5
0.79 ± 0.5
0.67 ± 0.4
1.57 ± 0.5
1.16 ± 0.5
0.93 ± 0.4
0.96 ± 0.5
1.28 ± 0.5
0.47 ± 0.4
0.66
Mean neutrophil: lymphocyte
1.32 ± 0.3
1.65 ± 0.3
1.73 ± 0.2
1.64 ± 0.3
1.57 ± 0.3
1.58 ± 0.3
0.99 ± 0.3
1.52 ± 0.3
1.34 ± 0.2
1.07 ± 0.3
1.32 ± 0.3
1.40 ± 0.3
0.62
¹Probability value for the diet x feeding partition length x parity interaction.

84
Table B.2: Effects of diet × feeding partition length × parity on mitogen induced lymphocyte proliferation, cortisol, and
Interleukin-12 (least-squares means ± SE).
Midds-Hulls DDGS-Germ Meal
Short Partitions Long Partitions Short Partitions Long Partitions
Immune Trait 0 1-2 ≥3 0 1-2 ≥3 0 1-2 ≥3 0 1-2 ≥3 P-value¹
Mean LPS (5)- induced PI
1.08 ± 0.03
1.07 ± 0.03
1.07 ± 0.02
1.06 ± 0.03
1.07 ± 0.02
1.06 ± 0.02
1.09 ± 0.03
1.08 ± 0.03
1.08 ± 0.02
1.08 ± 0.03
1.07 ± 0.02
1.08 ± 0.02
0.92
Mean LPS (50)- induced PI
1.12 ± 0.05
1.11 ± 0.05
1.12 ± 0.03
1.12 ± 0.05
1.10 ± 0.04
1.11 ± 0.04
1.15 ± 0.05
1.13 ± 0.04
1.13 ± 0.04
1.13 ± 0.05
1.12 ± 0.05
1.14 ± 0.03
0.96
Mean ConA (2)- induced PI
1.02 ± 0.01
1.01 ± 0.01
1.02 ± 0.01
1.01 ± 0.01
1.02 ± 0.01
1.01 ± 0.01
1.02 ± 0.01
1.01 ± 0.01
0.99 ± 0.01
1.02 ± 0.01
1.01 ± 0.01
1.01 ± 0.01
0.40
Mean ConA (20)-induced PI
1.05 ± 0.02
1.03 ± 0.02
1.05 ± 0.02
1.04 ± 0.02
1.06 ± 0.02
1.03 ± 0.02
1.03 ± 0.02
1.03 ± 0.02
1.02 ± 0.02
1.03 ± 0.02
1.03 ± 0.02
1.03 ± 0.02
0.60
Mean plasma cortisol (ng/mL)
14.5 ± 1.4
16.1 ± 1.4
15.5 ± 1.0
16.2 ± 1.5
15.5 ± 1.2
16.6 ± 1.1
17.4 ± 1.4
16.6 ± 1.4
15.8 ± 1.1
15.1 ± 1.4
15.1 ± 1.3
14.4 ± 1.1
0.71
Mean Interleukin- 12 (pg/mL)
66.9 ± 6.3
56.7 ± 6.4
52.9 ± 5.2
61.1 ± 7.0
65.6 ± 5.8
52.7 ± 5.5
59.6 ± 6.4
53.8 ± 6.1
56.4 ± 5.5
62.1 ± 6.4
64.1 ± 6.0
59.1 ± 5.3
0.89
¹Probability value for the diet x feeding partition length x parity interaction.

85
Table B.3: Effects of diet × parity on immune traits (least-squares means ± SE).
Midds-Hulls DDGS-Germ Meal
Immune trait 0 1-2 ≥3 0 1-2 ≥3 P-value¹
Mean total WBC (10⁷/mL) 6.71 ± 0.4 6.86 ± 0.4 6.74 ± 0.4 7.34 ± 0.4 7.25 ± 0.4 7.13 ± 0.4 0.88 Mean lymphocyte (10⁷/mL) 4.22± 0.5 4.39 ± 0.5 4.38 ± 0.4 4.90 ± 0.5 3.71 ± 0.5 4.08 ± 0.5 0.11 Mean neutrophils (10⁶/mL) 22.0 ± 2.1 20.7 ± 2.0 21.0 ± 1.9 18.6 ± 2.0 18.5 ± 2.0 20.1 ± 1.9 0.42 Mean lymphocytes (%) 44.1 ± 2.5 41.5 ± 2.4 41.6 ± 2.4 47.0 ± 2.6 44.0 ± 2.4 44.5 ±2.4 0.98 Mean neutrophils (%) 46.59 ± 2.4 48.04 ± 2.2 49.07 ± 2.1 40.56 ± 2.3 47.00 ± 2.2 46.49 ± 2.1 0.20 Mean eosinophils (%) 4.91 ± 0.4 5.32 ± 0.3 5.35 ± 0.3 5.79 ± 0.4 5.20 ± 0.3 4.98 ± 0.3 0.13 Mean monocytes (%) 3.01 ± 0.9 3.15 ± 0.9 3.15 ± 0.9 3.77 ± 0.9 3.56 ± 0.9 3.85 ± 0.9 0.88 Mean other (%) 0.66 ± 0.4 0.82 ± 0.4 0.71 ± 0.4 1.26 ± 0.4 1.22 ± 0.4 0.70 ± 0.4 0.26 Mean neutrophil: lymphocyte
1.48 ± 0.2 1.61 ± 0.2 1.66 ± 0.2
1.03 ± 0.2 1.42 ± 0.2 1.37 ± 0.2 0.63
Mean LPS (5)-induced PI 1.07 ± 0.02 1.07 ± 0.02 1.06 ± 0.01 1.09 ± 0.02 1.07 ± 0.02 1.08 ± 0.02 0.89 Mean LPS (50)-induced PI 1.12 ± 0.03 1.11 ± 0.03 1.12 ± 0.03 1.14 ± 0.03 1.13 ± 0.03 1.13 ± 0.03 1.00 Mean ConA (2)-induced PI 1.02 ± 0.01 1.02 ± 0.01 1.01 ± 0.01 1.02 ± 0.01 1.01 ± 0.01 1.00 ± 0.01 0.62 Mean ConA (20)-induced PI 1.05 ± 0.02 1.05 ± 0.01 1.04 ± 0.01 1.03 ± 0.02 1.03 ± 0.02 1.02 ± 0.01 1.00 Mean plasma cortisol (ng/mL) 15.4 ± 1.0 15.8 ± 0.9 16.0 ± 0.8 16.3 ± 1.0 15..8 ± 0.9 15.1 ± 0.8 0.58 Mean Interleukin-12 (pg/mL) 64.0 ± 5.2 61.1 ± 4.8 52.8 ± 4.4 60.8 ± 5.1 58.9 ± 4.8 57.7 ± 4.4 0.42
¹Probability value for the diet x parity interaction.

86
Table B.4: Effects feeding partition length × parity on immune traits (least-squares means ± SE).
Short Partitions Long Partitions
Immune trait 0 1-2 ≥3 0 1-2 ≥3 P-value¹
Mean total WBC (10⁷/mL) 6.92 ± 0.4 6.98 ± 0.4 6.90 ± 0.4 7.13 ± 0.4 7.13 ± 0.4 6.97 ± 0.4 0.96 Mean lymphocyte (10⁷/mL) 4.34 ± 0.5 3.77 ± 0.5 4.24 ± 0.4 4.78 ± 0.5 4.33 ± 0.5 4.22 ± 0.5 0.56 Mean neutrophils (10⁶/mL) 18.0 ± 2.0 19.5 ± 2.0 19.8 ± 1.9 22.7 ± 2.1 19.7 ± 2.0 21.2 ± 1.9 0.08 Mean lymphocytes (%) 46.5 ± 2.5 42.3 ± 2.5 41.8 ± 2.4 44.7 ± 2.6 43.3 ± 2.4 44.3 ± 2.4 0.17 Mean neutrophils (%) 42.6 ± 2.3 47.7 ± 2.2 49.0 ± 2.1 44.5 ± 2.3 47.4 ± 2.2 46.6 ± 2.1 0.26 Mean eosinophils (%) 5.32 ± 0.3 5.40 ± 0.3 5.38 ± 0.3 5.39 ± 0.4 5.11 ± 0.3 4.94 ± 0.3 0.72 Mean monocytes (%) 3.60 ± 0.9 3.73 ± 0.9 3.20 ± 0.9 3.18 ± 0.9 2.98 ± 0.9 3.80 ± 0.9 0.08 Mean other (%) 1.14 ± 0.4 1.00 ± 0.4 0.84 ± 0.4 0.78 ± 0.4 1.04 ± 0.4 0.57 ± 0.4 0.59 Mean neutrophil: lymphocyte 1.15 ± 0.2 1.58 ± 0.2 1.54 ± 0.2 1.35 ± 0.2 1.45 ± 0.2 1.49 ± 0.2 0.44 Mean LPS (5)-induced PI 1.08 ± 0.02 1.08 ± 0.02 1.07 ± 0.01 1.07 ± 0.02 1.07 ± 0.02 1.07 ± 0.02 0.97 Mean LPS (50)-induced PI 1.14 ± 0.03 1.12 ± 0.03 1.12 ± 0.02 1.13 ± 0.03 1.12 ± 0.03 1.12 ± 0.03 0.98 Mean ConA (2)-induced PI 1.02 ± 0.01 1.01 ± 0.01 1.01 ± 0.01 1.02 ± 0.01 1.02 ± 0.01 1.01 ± 0.01 0.63 Mean ConA (20)-induced PI 1.04 ± 0.02 1.03 ± 0.02 1.04 ± 0.01 1.04 ± 0.02 1.04 ± 0.01 1.03 ± 0.01 0.76 Mean plasma cortisol (ng/mL) 16.0 ± 1.0 16.3 ± 1.0 15.6 ± 0.8 15.6 ± 1.0 15.3 ± 0.9 15.5 ± 0.8 0.86 Mean Interleukin-12 (pg/mL) 63.2 ± 5.1 55.2 ± 5.0 54.7 ± 4.4 61.6 ± 5.2 64.8 ± 4.7 55.9 ± 4.4 0.29
¹Probability value for the feeding partition length x parity interaction

87
Table B.5: Main effects of dietary treatment on total white blood cells, and lymphocytes and neutrophils counts at all
gestational days (least-squares means ± SE).
Immune trait Midds-Hulls DDGS-Germ
Meal P-value SHORT
Partitions LONG
Partitions P-value
Diet ×
Partition¹
Total WBC, d 30 (10⁷/mL) 6.96 ± 0.6 7.17 ± 0.6 0.43 6.94 ± 0.6 7.19 ± 0.6 0.36 0.80 Total WBC, d 70 (10⁷/mL) 6.42 ± 0.5 7.01 ± 0.5 0.11 6.73 ± 0.5 6.70 ± 0.5 0.94 0.38 Total WBC, d 90 (10⁷/mL) 7.64 ± 0.8ᵃ 6.64 ± 0.8ᵇ 0.04 7.00 ± 0.8 7.29 ± 0.8 0.54 0.87 Total WBC, d 104 (10⁷/mL) 6.12 ± 1.2ᵃ 8.06 ± 1.2ᵇ < 0.01 6.98 ± 1.2 7.20 ± 1.2 0.68 0.77 Total WBC, end of lactation (10⁷/mL) 6.57 ± 0.6 7.28 ± 0.6 0.08 6.85 ± 0.6 7.00 ± 0.6 0.69 0.11 Lymphocytes, d 30 (10⁷/mL) 5.56 ± 1.2 5.50 ± 1.2 0.93 5.78 ± 1.2 5.48 ± 1.2 0.89 0.57 Lymphocytes, d 70 (10⁷/mL) 4.85 ± 0.9 4.61 ± 0.9 0.62 4.67 ± 0.9 4.78 ± 0.9 0.83 0.50 Lymphocytes, d 90 (10⁷/mL) 4.71 ± 0.7 3.67 ± 0.7 0.06 3.55 ± 0.7ᵃ 4.83 ± 0.7ᵇ 0.02 0.72
Lymphocytes, d 104 (10⁷/mL) 2.94 ± 0.5 3.16 ± 0.5 0.51 3.26 ± 0.4 2.94 ± 0.5 0.22 0.20 Lymphocytes, end of lactation (10⁷/mL) 3.73 ± 0.7 3.55 ± 0.7 0.72 3.42 ± 0.7 3.85 ± 0.7 0.39 0.69 Neutrophils, d 30 (10⁶/mL) 15.6 ± 1.8ᵃ 19.8 ± 1.9ᵇ < 0.01 16.0 ± 1.9ᵃ 19.3 ± 1.9ᵇ 0.02 0.49
Neutrophils, d 70 (10⁶/mL) 19.7 ± 3.0ᵃ 16..9 ± 3.0ᵇ 0.05 13.8 ± 3.0ᵃ 22.8 ± 3.0ᵇ < 0.01 0.19 Neutrophils, d 90 (10⁶/mL) 20.6 ± 1.4 20.0 ± 1.4 0.72 18.4 ± 1.4ᵃ 22.2 ± 1.4ᵇ 0.03 0.35
Neutrophils, d 104 (10⁶/mL) 21.7 ± 2.5ᵃ 17.8 ± 2.5ᵇ 0.01 20.8 ± 2.5 18.7 ± 2.5 0.17 0.02 Neutrophils, end of lactation (10⁶/mL) 26.5 ± 4.2 23.6 ± 4.3 0.14 25.7 ± 4.2 24.4 ± 4.3 0.50 0.97
ᵃ˒ᵇ Within a row, means without a common superscript letter differ (P < 0.05). ¹ Probability value for the diet x feeding partition length interaction.

88
Table B.6: Main effects of sow parity on total white blood cells, and lymphocytes and neutrophils counts
at all gestational days (least-squares means ± SE).
Immune trait 0 1-2 ≥3 P-value
Mean total WBC (10⁷/mL) 7.03 ± 0.4 7.06 ± 0.3 6.93 ± 0.3 0.86 Total WBC, d 30 (10⁷/mL) 7.83 ± 0.7ᵃ 6.83 ± 0.7ᵇ 6.87 ± 0.6ᵇ < 0.01 Total WBC, d 70 (10⁷/mL) 6.73 ± 0.6 6.44 ± 0.5 6.85 ± 0.5 0.62 Total WBC, d 90 (10⁷/mL) 7.13 ± 0.9 7.68 ± 0.8 6.82 ± 0.8 0.29 Total WBC, d 104 (10⁷/mL) 7.62 ± 1.2 7.10 ± 1.2 6.82 ± 1.2 0.53 Total WBC, end of lactation (10⁷/mL) 6.37 ± 0.7 6.85 ± 0.6 7.20 ± 0.6 0.30 Mean lymphocytes (10⁷/mL) 4.56 ± 0.4 4.05 ± 0.4 4.23 ± 0.4 0.31 Lymphocytes, d 30 (10⁷/mL) 6.48 ± 1.3 5.70 ± 1.2 4.76 ± 1.2 0.11 Lymphocytes, d 70 (10⁷/mL) 4.76 ± 1.0 4.57 ± 0.9 4.80 ± 0.9 0.92 Lymphocytes, d 90 (10⁷/mL) 4.94 ± 0.8 3.59 ± 0.7 4.07 ± 0.7 0.19 Lymphocytes, d 104 (10⁷/mL) 3.25 ± 0.5 3.18 ± 0.5 2.84 ± 0.5 0.56 Lymphocytes, end of lactation (10⁷/mL) 3.95 ± 0.8 3.24 ± 0.8 3.75 ± 0.7 0.54 Mean neutrophils (10⁶/mL) 20.3 ± 1.9 19.6 ± 1.8 20.5 ± 1.8 0.60 Neutrophils, d 30 (10⁶/mL) 17.0 ± 2.1 17.3 ± 2.1 18.3 ± 1.9 0.73 Neutrophils, d 70 (10⁶/mL) 20.4 ± 3.1 17.0 ± 3.0 18.3 ± 2.9 0.17 Neutrophils, d 90 (10⁶/mL) 20.5 ± 1.9 20.6 ± 1.7 20.0 ± 1.5 0.95 Neutrophils, d 104 (10⁶/mL) 21.1 ± 2.8 18.8 ± 2.7 20.0 ± 2.6 0.50 Neutrophils, end of lactation (10⁶/mL) 23.1 ± 4.6 23.7 ± 4.5 26.9 ± 4.4 0.20
ᵃ˒ᵇ Within a row, means without a common superscript letter differ (P < 0.05).
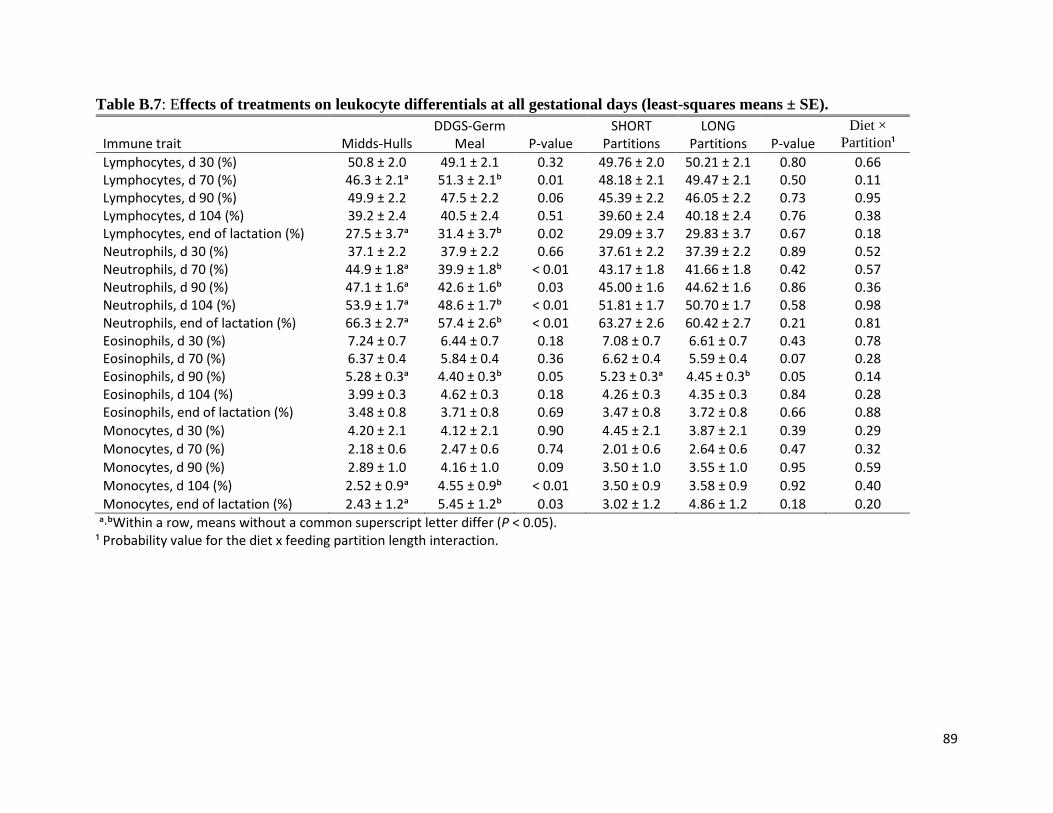
89
Table B.7: Effects of treatments on leukocyte differentials at all gestational days (least-squares means ± SE).
Immune trait Midds-Hulls DDGS-Germ
Meal P-value SHORT
Partitions LONG
Partitions P-value Diet ×
Partition¹
Lymphocytes, d 30 (%) 50.8 ± 2.0 49.1 ± 2.1 0.32 49.76 ± 2.0 50.21 ± 2.1 0.80 0.66 Lymphocytes, d 70 (%) 46.3 ± 2.1ᵃ 51.3 ± 2.1ᵇ 0.01 48.18 ± 2.1 49.47 ± 2.1 0.50 0.11 Lymphocytes, d 90 (%) 49.9 ± 2.2 47.5 ± 2.2 0.06 45.39 ± 2.2 46.05 ± 2.2 0.73 0.95 Lymphocytes, d 104 (%) 39.2 ± 2.4 40.5 ± 2.4 0.51 39.60 ± 2.4 40.18 ± 2.4 0.76 0.38 Lymphocytes, end of lactation (%) 27.5 ± 3.7ᵃ 31.4 ± 3.7ᵇ 0.02 29.09 ± 3.7 29.83 ± 3.7 0.67 0.18 Neutrophils, d 30 (%) 37.1 ± 2.2 37.9 ± 2.2 0.66 37.61 ± 2.2 37.39 ± 2.2 0.89 0.52 Neutrophils, d 70 (%) 44.9 ± 1.8ᵃ 39.9 ± 1.8ᵇ < 0.01 43.17 ± 1.8 41.66 ± 1.8 0.42 0.57 Neutrophils, d 90 (%) 47.1 ± 1.6ᵃ 42.6 ± 1.6ᵇ 0.03 45.00 ± 1.6 44.62 ± 1.6 0.86 0.36 Neutrophils, d 104 (%) 53.9 ± 1.7ᵃ 48.6 ± 1.7ᵇ < 0.01 51.81 ± 1.7 50.70 ± 1.7 0.58 0.98 Neutrophils, end of lactation (%) 66.3 ± 2.7ᵃ 57.4 ± 2.6ᵇ < 0.01 63.27 ± 2.6 60.42 ± 2.7 0.21 0.81 Eosinophils, d 30 (%) 7.24 ± 0.7 6.44 ± 0.7 0.18 7.08 ± 0.7 6.61 ± 0.7 0.43 0.78 Eosinophils, d 70 (%) 6.37 ± 0.4 5.84 ± 0.4 0.36 6.62 ± 0.4 5.59 ± 0.4 0.07 0.28 Eosinophils, d 90 (%) 5.28 ± 0.3ᵃ 4.40 ± 0.3ᵇ 0.05 5.23 ± 0.3ᵃ 4.45 ± 0.3ᵇ 0.05 0.14 Eosinophils, d 104 (%) 3.99 ± 0.3 4.62 ± 0.3 0.18 4.26 ± 0.3 4.35 ± 0.3 0.84 0.28 Eosinophils, end of lactation (%) 3.48 ± 0.8 3.71 ± 0.8 0.69 3.47 ± 0.8 3.72 ± 0.8 0.66 0.88
Monocytes, d 30 (%) 4.20 ± 2.1 4.12 ± 2.1 0.90 4.45 ± 2.1 3.87 ± 2.1 0.39 0.29 Monocytes, d 70 (%) 2.18 ± 0.6 2.47 ± 0.6 0.74 2.01 ± 0.6 2.64 ± 0.6 0.47 0.32
Monocytes, d 90 (%) 2.89 ± 1.0 4.16 ± 1.0 0.09 3.50 ± 1.0 3.55 ± 1.0 0.95 0.59 Monocytes, d 104 (%) 2.52 ± 0.9ᵃ 4.55 ± 0.9ᵇ < 0.01 3.50 ± 0.9 3.58 ± 0.9 0.92 0.40 Monocytes, end of lactation (%) 2.43 ± 1.2ᵃ 5.45 ± 1.2ᵇ 0.03 3.02 ± 1.2 4.86 ± 1.2 0.18 0.20
ᵃ˒ᵇWithin a row, means without a common superscript letter differ (P < 0.05). ¹ Probability value for the diet x feeding partition length interaction.
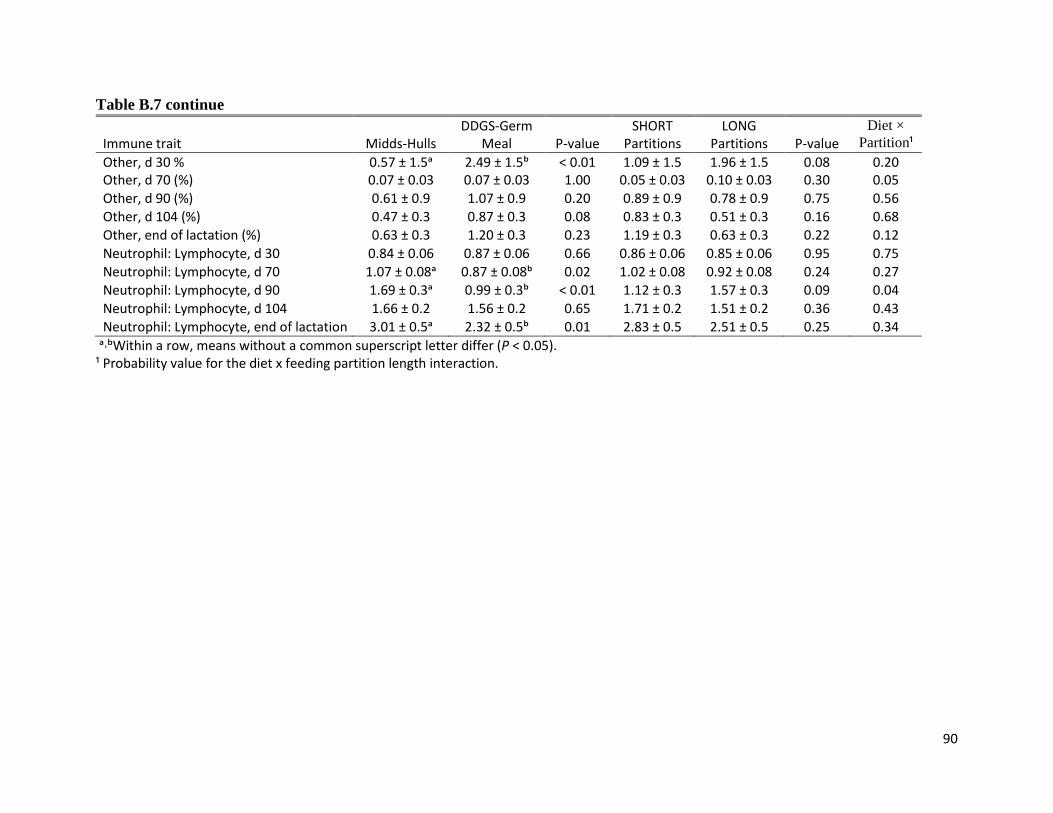
90
Table B.7 continue
Immune trait Midds-Hulls DDGS-Germ
Meal P-value SHORT
Partitions LONG
Partitions P-value Diet ×
Partition¹
Other, d 30 % 0.57 ± 1.5ᵃ 2.49 ± 1.5ᵇ < 0.01 1.09 ± 1.5 1.96 ± 1.5 0.08 0.20 Other, d 70 (%) 0.07 ± 0.03 0.07 ± 0.03 1.00 0.05 ± 0.03 0.10 ± 0.03 0.30 0.05
Other, d 90 (%) 0.61 ± 0.9 1.07 ± 0.9 0.20 0.89 ± 0.9 0.78 ± 0.9 0.75 0.56 Other, d 104 (%) 0.47 ± 0.3 0.87 ± 0.3 0.08 0.83 ± 0.3 0.51 ± 0.3 0.16 0.68 Other, end of lactation (%) 0.63 ± 0.3 1.20 ± 0.3 0.23 1.19 ± 0.3 0.63 ± 0.3 0.22 0.12
Neutrophil: Lymphocyte, d 30 0.84 ± 0.06 0.87 ± 0.06 0.66 0.86 ± 0.06 0.85 ± 0.06 0.95 0.75 Neutrophil: Lymphocyte, d 70 1.07 ± 0.08ᵃ 0.87 ± 0.08ᵇ 0.02 1.02 ± 0.08 0.92 ± 0.08 0.24 0.27
Neutrophil: Lymphocyte, d 90 1.69 ± 0.3ᵃ 0.99 ± 0.3ᵇ < 0.01 1.12 ± 0.3 1.57 ± 0.3 0.09 0.04 Neutrophil: Lymphocyte, d 104 1.66 ± 0.2 1.56 ± 0.2 0.65 1.71 ± 0.2 1.51 ± 0.2 0.36 0.43
Neutrophil: Lymphocyte, end of lactation 3.01 ± 0.5ᵃ 2.32 ± 0.5ᵇ 0.01 2.83 ± 0.5 2.51 ± 0.5 0.25 0.34
ᵃ˒ᵇWithin a row, means without a common superscript letter differ (P < 0.05). ¹ Probability value for the diet x feeding partition length interaction.

91
Table B.8: Main effects of sow parity on leukocyte differentials at all gestational days
(least-squares means ± SE).
Immune trait 0 1-2 ≥3 P-value
Lymphocytes, d 30 (%) 52.3 ± 2.4 50.2 ± 2.2 48.4 ± 2.1 0.19 Lymphocytes, d 70 (%) 50.3 ± 2.6 47.7 ± 2.5 48.6 ± 2.3 0.60 Lymphocytes, d 90 (%) 47.1 ± 2.6 44.3 ± 2.4 46.2 ± 2.2 0.54 Lymphocytes, d 104 (%) 44.9 ± 2.9ᵃ 40.4 ± 2.6ᵃ˒ᵇ 37.1 ± 2.5ᵇ < 0.01 Lymphocytes, end of lactation (%) 31.7 ± 3.9 28.5 ± 3.8 29.0 ± 3.7 0.40 Neutrophils, d 30 (%) 35.5 ± 2.6 37.4 ± 2.5 38.8 ± 2.3 0.26 Neutrophils, d 70 (%) 42.1 ± 2.3 43.7 ± 2.2 41.8 ± 2.0 0.68 Neutrophils, d 90 (%) 43.8 ± 2.3 46.5 ± 1.9 43.9 ± 1.7 0.50 Neutrophils, d 104 (%) 47.0 ± 2.3ᵃ 50.9 ± 1.9ᵃ˒ᵇ 53.3 ± 1.7ᵇ 0.05 Neutrophils, end of lactation (%) 59.7 ± 3.2 63.6 ± 2.9 61.7 ± 2.7 0.47 Eosinophils, d 30 (%) 6.86 ± 0.8 6.62 ± 0.8 6.99 ± 0.8 0.87 Eosinophils, d 70 (%) 5.82 ± 0.6 6.47 ± 0.5 5.99 ± 0.4 0.66 Eosinophils, d 90 (%) 4.90 ± 0.5 4.99 ± 0.4 4.70 ± 0.3 0.85 Eosinophils, d 104 (%) 4.45 ± 0.5 4.49 ± 0.4 4.09 ± 0.4 0.72 Eosinophils, end of lactation (%) 4.14 ± 1.0 3.08 ± 0.9 3.61 ± 0.8 0.42 Monocytes, d 30 (%) 4.04 ± 2.2 4.17 ± 2.2 4.22 ± 2.1 0.98 Monocytes, d 70 (%) 1.67 ± 0.9 2.01 ± 0.8 2.99 ± 0.7 0.42 Monocytes, d 90 (%) 3.23 ± 1.1 3.37 ± 1.1 3.87 ± 1.0 0.77 Monocytes, d 104 (%) 3.58 ± 1.0 3.08 ± 0.9 3.99 ± 0.9 0.58 Monocytes, end of lactation (%) 3.32 ± 1.6 3.45 ± 1.3 4.75 ± 1.1 0.62 Other, d 30 % 1.46 ± 1.5 1.42 ± 1.5 1.68 ± 1.5 0.89 Other, d 70 (%) 0.04 ± 0.05 0.08 ± 0.04 0.08 ± 0.04 0.71 Other, d 90 (%) 1.08 ± 1.0 0.85 ± 0.9 0.71 ± 0.9 0.71 Other, d 104 (%) 0.41 ± 0.4 1.03 ± 0.4 0.55 ± 0.4 0.08 Other, end of lactation (%) 1.40 ± 0.5 1.28 ± 0.4 0.38 ± 0.3 0.12 Neutrophil: Lymphocyte, d 30 0.82 ± 0.08 0.82 ± 0.07 0.90 ± 0.07 0.62 Neutrophil: Lymphocyte, d 70 0.92 ± 0.1 1.04 ± 0.1 0.96 ± 0.1 0.58 Neutrophil: Lymphocyte, d 90 1.23 ± 0.4 1.43 ± 0.3 1.34 ± 0.3 0.86 Neutrophil: Lymphocyte, d 104 1.15 ± 0.3ᵃ 1.62 ± 0.2ᵃ˒ᵇ 1.83 ± 0.2ᵇ 0.04 Neutrophil: Lymphocyte, end of lactation
2.48 ± 0.5 2.88 ± 0.5 2.63 ± 0.5 0.56
ᵃ˒ᵇ Within a row, means without a common superscript letter differ (P < 0.05).

92
Table B.9: Effects of treatments on mitogen induced lymphocyte proliferation at all gestational days (least-squares means ±
SE).
Immune trait Midds-Hulls DDGS-Germ
Meal P-value SHORT
Partitions LONG
Partitions P-value
Diet ×
Partition¹
Mean LPS (5)-induced PI 1.07 ± 0.01 1.08 ± 0.01 0.29 1.07 ± 0.01 1.07 ± 0.01 0.53 0.95 LPS (5)-induced PI, d 30 1.37 ± 0.1ᵃ 1.07 ± 0.1ᵇ < 0.01 1.22 ± 0.1 1.22 ± 0.1 0.98 0.78 LPS (5)-induced PI, d 70 1.03 ± 0.01 1.03 ± 0.01 0.91 1.03 ± 0.01 1.02 ± 0.01 0.54 0.72 LPS (5)-induced PI, d 90 1.02 ± 0.03ᵃ 1.06 ± 0.03ᵇ 0.03 1.05 ± 0.03 1.03 ± 0.03 0.34 0.77 LPS (5)-induced PI, d 104 1.04 ± 0.01 1.05 ± 0.01 0.63 1.05 ± 0.01 1.04 ± 0..01 0.61 0.94 LPS (5)-induced PI, end of lactation 1.02 ± 0.009 1.03 ± 0.009 0.37 1.03 ± 0.01 1.02 ± 0.01 0.43 0.45 Mean LPS (50)-induced PI 1.11 ± 0.02 1.13 ± 0.02 0.47 1.13 ± 0.02 1.12 ± 0.02 0.80 0.96 LPS (50)-induced PI, d 30 1.62 ± 0.2ᵃ 1.32 ± 0.2ᵇ < 0.01 1.49 ± 0.2 1.45 ± 0.2 0.76 0.92 LPS (50)-induced PI, d 70 1.02 ± 0.01 1.02 ± 0.01 0.87 1.02 ± 0.01 1.02 ± 0.01 0.93 0.23
LPS (50)-induced PI, d 90 1.01 ± 0.03ᵃ 1.09 ± 0.03ᵇ < 0.01 1.05 ± 0.03 1.04 ± 0.03 0.68 0.52 LPS (50)-induced PI, d 104 1.07 ± 0.02 1.03 ± 0.02 0.07 1.05 ± 0.02 1.05 ± 0.02 0.96 0.40
LPS (50)-induced PI, end of lactation 1.02 ± 0.008 1.02 ± 0.008 0.60 1.02 ± 0.01 1.02 ± 0.01 0.59 0.65
Mean ConA (2)-induced PI 1.02 ± 0.007 1.01 ± 0.007 0.51 1.01 ± 0.01 1.01 ± 0.01 0.58 0.32
ConA (2)-induced PI, d 30 1.04 ± 0.02 1.00 ± 0.02 0.14 1.02 ± 0.02 1.01 ± 0.02 0.69 0.77 ConA (2)-induced PI, d 70 1.00 ± 0.01 1.00 ± 0.01 0.93 1.00 ± 0.01 1.00 ± 0.01 0.98 0.92
ConA (2)-induced PI, d 90 1.02 ± 0.01 1.00 ± 0.01 0.14 1.00 ± 0.01 1.02 ± 0.01 0.31 0.81 ConA (2)-induced PI, d 104 1.00 ± 0.02 1.00 ± 0.02 0.66 1.00 ± 0.02 1.00 ± 0.02 0.73 0.16 ConA (2)-induced PI, end of lactation 1.02 ± 0.007 1.01 ± 0.007 0.46 1.01 ± 0.01 1.02 ± 0.01 0.20 0.27
Mean ConA (20)-induced PI 1.05 ± 0.01 1.03 ± 0.01 0.12 1.04 ± 0.01 1.04 ± 0.01 0.94 0.84 ConA (20)-induced PI, d 30 1.22 ± 0.1ᵃ 1.02 ± 0.1ᵇ < 0.01 1.13 ± 0.1 1.11 ± 0.1 0.71 0.81
ConA (20)-induced PI, d 70 1.01 ± 0.02 1.01 ± 0.02 0.77 1.00 ± 0.02 1.02 ± 0.02 0.34 0.32 ConA (20)-induced PI, d 90 1.01 ± 0.01 1.00 ± 0.01 0.54 1.00 ± 0.01 1.01 ± 0.01 0.63 0.85
ConA (20)-induced PI, d 104 1.03 ± 0.02ᵃ 1.00 ± 0.02ᵇ 0.05 1.01 ± 0.02 1.01 ± 0.02 0.37 0.16 ConA (20)-induced PI, end of lactation 1.03 ± 0.06 1.06 ± 0.06 0.60 1.02 ± 0.06 1.07 ± 0.06 0.29 0.16
ᵃ˒ᵇ Within a row, means without a common superscript letter differ (P < 0.05). ¹ Probability value for the diet x feeding partition length interaction.

93
Table B.10: Main effects of sow parity on cortisol and Interleukin-12 at gestational days
30 and 90 (least-squares means ± SE).
Immune trait 0 1-2 ≥3 P-value
Mean plasma cortisol (ng/mL) 15.8 ± 0.7 15.8 ± 0.7 15.6 ± 0.5 0.94 Plasma cortisol, d 30 (ng/mL) 14.7 ± 1.3 16.6 ± 1.3 16.8 ± 1.1 0.36 Plasma cortisol, d 90 (ng/mL) 14.7 ± 1.2 15.5 ± 1.0 14.9 ± 0.8 0.86 Mean Interleukin-12 (pg/mL) 62.4 ± 4.3 60.0 ± 4.1 55.3 ± 3.9 0.12 Interleukin-12, d 30 (pg/mL) 80.6 ± 10.4ᵃ 55.3 ± 10.2ᵇ 53.0 ± 9.7ᵇ < 0.01 Interleukin-12, d 90 (pg/mL) 63.1 ± 8.1ᵃ 58.8 ± 7.8ᵃ˒ᵇ 49.6 ± 7.5ᵇ 0.03
ᵃ⁻ᵈWithin a row, means without a common superscript letter differ (P ≤ 0.05).
Table B.11: Main effects of treatment diet on cortisol and Interleuken-12 at gestational days 30 and 90 (least-squares means ±
SE).
Immune trait Midds-Hulls DDGS-Germ
Meal P-value SHORT
Partitions LONG
Partitions P-value
Diet ×
Partition¹
Mean plasma cortisol (ng/mL) 15.7 ± 0.5 15.6 ± 0.5 0.88 15.9 ± 0.5 15.5 ± 0.5 0.51 0.10 Plasma cortisol, d 30 (ng/mL) 16.6 ± 1.1 15.6 ± 1.1 0.45 16.5 ± 1.1 15.8 ± 1.1 0.57 0.53 Plasma cortisol, d 90 (ng/mL) 15.5 ± 0.8 14.5 ± 0.8 0.38 15.1 ± 0.8 14.9 ± 0.8 0.84 0.16 Mean Interleukin-12 (pg/mL) 58.5 ± 3.8 58.9 ± 3.8 0.87 57.1 ± 3.8 60.4 ± 3.8 0.25 0.54 Interleukin-12, d 30 (pg/mL) 60.2 ± 8.9 61.9 ± 8.9 0.80 60.4 ± 8.9 61.9 ± 8.9 0.83 0.32 Interleukin-12, d 90 (pg/mL) 56.0 ± 7.7 56.1 ± 7.7 1.00 52.2 ± 7.7 59.9 ± 7.7 0.07 0.40
ᵃ˒ᵇ Within a row, means without a common superscript letter differ (P < 0.05). ¹ Probability value for the diet x feeding partition length interaction.
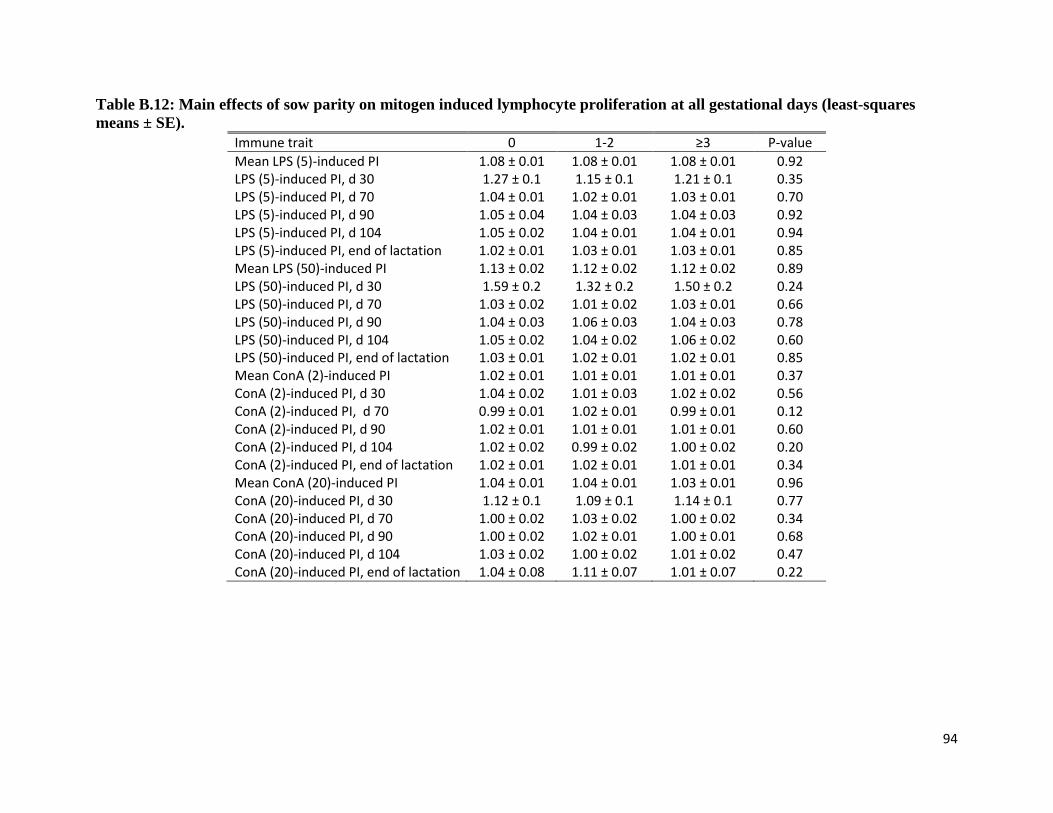
94
Table B.12: Main effects of sow parity on mitogen induced lymphocyte proliferation at all gestational days (least-squares
means ± SE). Immune trait 0 1-2 ≥3 P-value
Mean LPS (5)-induced PI 1.08 ± 0.01 1.08 ± 0.01 1.08 ± 0.01 0.92 LPS (5)-induced PI, d 30 1.27 ± 0.1 1.15 ± 0.1 1.21 ± 0.1 0.35 LPS (5)-induced PI, d 70 1.04 ± 0.01 1.02 ± 0.01 1.03 ± 0.01 0.70 LPS (5)-induced PI, d 90 1.05 ± 0.04 1.04 ± 0.03 1.04 ± 0.03 0.92 LPS (5)-induced PI, d 104 1.05 ± 0.02 1.04 ± 0.01 1.04 ± 0.01 0.94 LPS (5)-induced PI, end of lactation 1.02 ± 0.01 1.03 ± 0.01 1.03 ± 0.01 0.85 Mean LPS (50)-induced PI 1.13 ± 0.02 1.12 ± 0.02 1.12 ± 0.02 0.89 LPS (50)-induced PI, d 30 1.59 ± 0.2 1.32 ± 0.2 1.50 ± 0.2 0.24 LPS (50)-induced PI, d 70 1.03 ± 0.02 1.01 ± 0.02 1.03 ± 0.01 0.66 LPS (50)-induced PI, d 90 1.04 ± 0.03 1.06 ± 0.03 1.04 ± 0.03 0.78 LPS (50)-induced PI, d 104 1.05 ± 0.02 1.04 ± 0.02 1.06 ± 0.02 0.60 LPS (50)-induced PI, end of lactation 1.03 ± 0.01 1.02 ± 0.01 1.02 ± 0.01 0.85 Mean ConA (2)-induced PI 1.02 ± 0.01 1.01 ± 0.01 1.01 ± 0.01 0.37 ConA (2)-induced PI, d 30 1.04 ± 0.02 1.01 ± 0.03 1.02 ± 0.02 0.56 ConA (2)-induced PI, d 70 0.99 ± 0.01 1.02 ± 0.01 0.99 ± 0.01 0.12 ConA (2)-induced PI, d 90 1.02 ± 0.01 1.01 ± 0.01 1.01 ± 0.01 0.60 ConA (2)-induced PI, d 104 1.02 ± 0.02 0.99 ± 0.02 1.00 ± 0.02 0.20 ConA (2)-induced PI, end of lactation 1.02 ± 0.01 1.02 ± 0.01 1.01 ± 0.01 0.34 Mean ConA (20)-induced PI 1.04 ± 0.01 1.04 ± 0.01 1.03 ± 0.01 0.96 ConA (20)-induced PI, d 30 1.12 ± 0.1 1.09 ± 0.1 1.14 ± 0.1 0.77 ConA (20)-induced PI, d 70 1.00 ± 0.02 1.03 ± 0.02 1.00 ± 0.02 0.34 ConA (20)-induced PI, d 90 1.00 ± 0.02 1.02 ± 0.01 1.00 ± 0.01 0.68 ConA (20)-induced PI, d 104 1.03 ± 0.02 1.00 ± 0.02 1.01 ± 0.02 0.47 ConA (20)-induced PI, end of lactation 1.04 ± 0.08 1.11 ± 0.07 1.01 ± 0.07 0.22