the effects of headlight intensity and clothing contrast
TRANSCRIPT

Clemson UniversityTigerPrints
All Theses Theses
8-2010
The Effects of Headlight Intensity and ClothingContrast on Pedestrians' Own EstimatedRecognition Distances at NightRachel RosenbergClemson University, [email protected]
Follow this and additional works at: https://tigerprints.clemson.edu/all_theses
Part of the Psychology Commons
This Thesis is brought to you for free and open access by the Theses at TigerPrints. It has been accepted for inclusion in All Theses by an authorizedadministrator of TigerPrints. For more information, please contact [email protected].
Recommended CitationRosenberg, Rachel, "The Effects of Headlight Intensity and Clothing Contrast on Pedestrians' Own Estimated Recognition Distancesat Night" (2010). All Theses. 876.https://tigerprints.clemson.edu/all_theses/876

THE EFFECTS OF HEADLIGHT INTENSITY AND CLOTHING CONTRAST ON PEDESTRIANS’ OWN ESTIMATED RECOGNITION DISTANCES AT NIGHT
A ThesisPresented to
the Graduate School ofClemson University
In Partial Fulfillmentof the Requirements for the Degree
Master of ScienceApplied Psychology
byRachel Laura Rosenberg
August 2010
Accepted by:Dr. Richard Tyrrell, Committee Chair
Dr. Lee GugertyDr. Chris Pagano

ii
ABSTRACT
Inadequate pedestrian detection is a crucial contributing factor in fatal nighttime
collisions involving pedestrians. Pedestrians typically overestimate how recognizable
they are to oncoming drivers and little is known about what affects pedestrians’ estimates
of how recognizable they think they are. This study explored the extent to which
pedestrians believed their conspicuity was affected by headlight intensity and clothing
reflectance. Participants in four clothing conditions and in four different levels of
headlight intensity walked to and from a parked vehicle until they felt recognizable to the
driver. Estimated recognition distances did not change with variations in headlight
intensity, suggesting that pedestrians do not use headlight illumination when judging their
own conspicuity. Participants estimated shorter recognition distances when in Black
clothing compared to more reflective clothing. These findings indicate a need to educate
pedestrians about night visibility issues.
iii
ACKNOWLEDGEMENTS
I would like to thank my advisor, Dr. Richard Tyrrell, for his guidance and
assistance throughout this project. I would also like to thank my committee members, Dr.
Lee Gugerty and Dr. Chris Pagano, for their comments and cooperation. A special
thanks to all who helped with the data collection process without whom this project could
not have been completed: Stacy Balk, David Ballou, Linnea Smolentzov and Stephanie
Whetsel.
I am also eternally grateful to my parents, Amy and Barry Rosenberg, and to my
boyfriend, Reeve Goodenough, for keeping me sane throughout this entire process. Their
unconditional love, support and encouragement was more than I could have asked for.

iv
TABLE OF CONTENTS
Page
TITLE PAGE ................................................................................................................... i
ABSTRACT .................................................................................................................... ii
ACKNOLWEDGEMENTS .......................................................................................... iii
LIST OF TABLES ...........................................................................................................v
LIST OF FIGURES........................................................................................................ vi
INTRODUCTION............................................................................................................1
METHOD.......................................................................................................................12
Participants ........................................................................................................ 12Experimental Design ..........................................................................................12Variable Design and Assignment .......................................................................13Variable Manipulations ......................................................................................15Materials.............................................................................................................16Procedure............................................................................................................18
RESULTS.......................................................................................................................21
DISCUSSION ................................................................................................................29
APPENDIX ....................................................................................................................43
REFERENCES...............................................................................................................45
v
LIST OF TABLES
Table Page
1 The Four Experimental Groups (A, B, C, D) ....................................................... 13
2 Number of Participant Responses Regarding Typeof Beam Believed to be Used for Each Headlight Condition................ 27
3 Number of Participants Rating Scores Regarding theSimilarity of the Test Vehicle’s Headlightsto Typical Headlights .............................................................................27

vi
LIST OF FIGURES
Figure Page
1 Illumination from the headlights as a function of distance for each level of headlight intensity. .........................................16
2 A view of each headlight condition; (a) Max, (b) High, (c) Medium, (d) Low. ..............................................................................17
3 A picture of the type of retro-reflective vest that was worn..................................18
4 Mean (+/- 1 standard error of the mean) estimated recognitiondistance for each of the four clothing conditions. These values are averaged across the 4 headlight intensity groups. .................22
5 Mean (+/- 1 standard error of the mean) estimated recognitiondistance for each of the headlight intensity groups. These values are averaged across the 4 clothing conditions.............................23
6 Mean (+/- 1 standard error of the mean) estimated recognitiondistance for each of the four headlight intensity groups and four clothing conditions. There was no significantinteraction between clothing and headlight intensity. ............................24
7 Mean (+/- 1 standard error of the mean) estimated recognitiondistance for each of the four clothing types and the two walking directions. There was a significant interaction between clothing and walking direction ..............................25

INTRODUCTION
In the United States in the year 2007, 4,654 pedestrians were killed by traffic
collisions and about 67% of pedestrian fatalities occurred at night (NHTSA, 2007).
Inadequate detection of pedestrians at night is often stated as a crucial contributing factor
in such crashes. It has been shown that when other contributing factors (i.e., fatigue,
alcohol) are held constant, pedestrians are 3-7 times more likely to be involved in fatal
vehicle collisions when illumination is low (Owens and Sivak, 1996; Sullivan and
Flannagan, 2002). In fact, pedestrian visibility at night is so poor that drivers would need
to maintain speeds lower than 40 mph to ensure enough stopping time to avoid hitting a
dark-clad pedestrian (Owens et. al, 2007). Indeed, an earlier study conducted by Allen
(1970) found that 87% of drivers who hit a pedestrian at night reported difficulty in
seeing the pedestrian and 23.4% claimed they heard the impact before they saw the
pedestrian. This research suggests that even alert, sober drivers have difficulty detecting
pedestrians and avoiding collisions in low illumination environments. It has been
proposed that this late detection of pedestrians can be explained by cognitive errors,
meaning inappropriate expectations, or by perceptual errors, meaning a conscious and
slower focus of attention to the situation (Rumar, 1990). Regardless of the cause of such
errors, reducing the number of nighttime pedestrian fatalities could lead to major
improvements in traffic safety (Sivak, Luoma, Flannagan, Bingham, Eby & Shope,
2007).
The fact that the fatality rate is three to four times higher at night than in daylight
(Owens & Tyrrell, 1999) is not due solely to drivers’ reduced visibility levels but also can

2
be explained by drivers’ misjudgment of their own visibility limitations. Driving requires
the use of two distinct (but interacting) neural pathways, known as focal and ambient
vision. Focal vision allows for object recognition and identification, for example
detecting a pedestrian or an animal crossing the road. Ambient vision supports the ability
to navigate and guide oneself, like when maintaining lane position or steering around a
curve in the road. At night, focal vision is severely affected; however, ambient vision
remains relatively unimpaired. The impairment in focal vision often goes unnoticed by
drivers due to enhanced lighting and objects that have been engineered to have a high
degree of contrast (e.g., signs or retroreflective delineators). From this perspective,
drivers assume they can see objects sufficiently well, and will not feel the need to lower
their speed especially when they are able to easily maintain their lane position. They are
not aware that they may be driving too fast to avoid low contrast obstacles and do not
take the necessary precautionary measures for their deteriorated nighttime acuity.
Instead, overconfidence arises from predictable changes in night vision of which drivers
are typically unaware (Leibowitz, Owens & Post., 1982). Leibowitz and colleagues have
asserted that the “selective degradation” of focal vision is responsible for drivers’
overconfidence at night (Leibowitz et. al, 1982; Leibowitz & Owens, 1977). This
hypothesis provides a perspective for examining many nighttime collisions, including
those crashes involving pedestrians.
A study conducted by Owens and Tyrrell in 1999 tested the selective degradation
hypothesis by tracking the effects of blur and luminance on drivers’ steering and acuity.
Participants drove on a simulated roadway while looking through neutral-density filters
3
that manipulated the luminance of the driving simulator’s display. Results showed that
participant’s acuity, or object recognition, diminished rapidly with lower luminance
levels but their ability to steer the vehicle was mostly unaffected. These results were in
accordance with the selective degradation theory.
A more recent study conducted by Brooks, Tyrrell and Frank (2005) also found
similar support for the selective degradation theory. Participants drove on a simulated
curvy roadway with varying levels of reduced luminance, blur and visual field size.
Results showed a decrease in visual acuity with degraded blur and luminance levels, yet
steering performance remained unimpaired. Steering performance was, however,
reduced with narrower visual field size. These findings support the selective degradation
theory and suggest how the two separate neural pathways can be affected by night
driving.
Research has confirmed that when it comes to pedestrian detection at night,
drivers have considerable difficulty in detecting pedestrians from a safe distance.
Pedestrians’ visibility has repeatedly been shown to be influenced by at least two critical
factors: clothing reflectance and headlight illumination.
The use of reflective treatments on clothing has been shown to enhance drivers’
ability to detect pedestrians at night. An early study found that the distance at which a
pedestrian was deemed visible dramatically increased when the pedestrian wore reflective
material (Shinar, 1985). Similar results were found in a more recent study conducted by
Wood, Tyrrell and Carberry (2005). In this study, participants drove around a closed
course and responded when they first recognized a pedestrian. Pedestrians were dressed

4
in black clothing, white clothing or two different configurations of reflective material.
Results showed that drivers detected the presence of a pedestrian in black clothing at an
average distance of just under 13 m whereas the average distance in detecting a
pedestrian in white clothing or either of the two reflective materials was 4 to 12 times
greater. (These distances were combined data for low beam and high beams). These
results showed that drivers were better able to detect pedestrians who wore white clothing
or reflective material compared to those wearing black clothing.
More recent studies have further explored this topic of reflective clothing and
have looked into the effects of reflective material placement and arrangements including
reflective vests and biological motion (biomotion) configurations. A biomotion
configuration places reflective material on major joints, like the elbows and knees, taking
advantage of humans’ visual sensitivity to patterns of motion that specify human
movement. A recent study conducted by Balk et. al (2008) found that drivers were able
to detect pedestrians at a larger distance when reflective material was in the biomotion
pattern compared to dark-colored clothing and other reflective material configurations.
In addition, this biomotion pattern allowed pedestrians to be seen at longer distances
when the pedestrian was in motion. It still had an effect when the pedestrian was
standing still but the magnitude of the effect compared to the other conditions was not
nearly as great. This study showed the influence reflective material, and its various
configurations, can have when trying to detect pedestrians at night.
In addition to clothing, headlight illumination has also been shown to both
positively and negatively affect a driver’s detection of pedestrians at night. Although
5
headlights may provide more illumination and contrast, the glare from headlights of
oncoming cars may interfere with drivers’ abilities to detect pedestrians, particularly
those wearing clothing that does not provide substantial contrast (Theeuwes, 2002). Past
studies have also shown that the presence of glare can lead to both shorter pedestrian
detection distances and slower response times. Ranney et. al (2000) found that when
glare was present, reaction times for detecting pedestrians was about 10% slower than
those reaction times in the no-glare condition. Glare also caused drivers to decrease
speed and deviate from lane position. A different study found that drivers responded to
only 61% of pedestrians when glare was present but to 76% when glare was absent
(Wood et. al, 2005). These results show the unfavorable effects of headlight glare.
Despite these detrimental effects of opposing headlights, drivers’ own high beam
headlights have been shown to improve nighttime visibility (Sivak, Flannagan, Schoettle
& Adachi, 2003) by offering more illumination and more pedestrian contrast. In fact,
research suggests that low beam illumination is inadequate for revealing low-contrast
objects, such as pedestrians, at night. In one report, the visibility distance was found to
be shorter than the estimated stopping distance in 45% of trials with younger drivers and
83% of trials with older drivers when both dark-clad pedestrians and low-beam
illumination were present (Olson & Sivak, 1983). Another study found that drivers
responded to the presence of a pedestrian at an average distance of over 90 m when high
beam illumination was used but at an average distance of just under 60 m with the use of
low beam illumination (Wood et. al, 2005).

6
Despite the evidence that shows the benefits of high beam use, drivers still tend to
overdrive low beams and under-utilize their high beams. These two beam types differ in
terms of light intensity as well as in light pattern. Low beams aim illumination
downward and toward the near shoulder. High beams project the illumination straight
ahead of the vehicle, therefore providing a more lit (but narrower) view of the road
ahead. A study conducted in 2004 found clear evidence that drivers underuse their high
beam headlights, citing reasons such as unawareness of visual impairments or concerns
about forgetting to dim them as to not impair oncoming drivers (Sullivan, Adachi,
Mefford & Flannagan, 2004). In fact, it’s been reported that drivers use their high beams
anywhere from 8% to 25% of the driven distance, depending on the type of road they are
driving on (Mefford, Flannagan & Bogard, 2006).
There is a clear effect between the use of low beam and high beam headlights in
terms of drivers’ detections of pedestrians. One study, conducted by Owens, Wood and
Owens (2007) focused on the effects of experimental reductions in the intensity of high
beam headlights. Such reductions to the high beams were created by mounting neutral-
density filters onto the headlights. The participants were not informed of the
manipulation to the headlights. Results found that both speed and lane-keeping decreased
with reduced illumination. Target recognition (i.e., signs and road hazards) also became
worse in the lower light intensity compared to the higher light intensities (Owens et. al,
2007). In addition, it was found that pedestrian recognition was better when pedestrians
wore reflective material in the biomotion configuration, confirming similar results that
were reported earlier.

7
Despite the aid of reflective material and headlight illumination, drivers still have
difficulty detecting pedestrians at night. They are not the only road users, however, who
fail to appreciate the visual challenges associated with detecting pedestrians; pedestrians,
too, tend to overestimate drivers’ abilities to see them. When first seeing an on-coming
vehicle at night, pedestrians’ eyes (which can be largely dark-adapted) are faced with a
high contrast and high luminance image that is highly conspicuous. Fully dark adapting,
however, is not possible for drivers given the light from their own headlights. Therefore,
it cannot be assumed that both pedestrians and drivers have similar experiences seeing at
night. Unfortunately typical pedestrians seem to make this assumption, overestimating
how conspicuous they are to drivers at night.
Although there is limited information on how pedestrians estimate their own
conspicuity to drivers at night, research on this topic began nearly 70 years ago. The
possibility that pedestrians might overestimate their visibility to approaching drivers at
night was first demonstrated in a preliminary study conducted by Ferguson and Geddes
(1941). Results from this study showed that a considerable proportion of participants did
not understand their visibility levels and greatly exaggerated such distances.
Furthermore, Ferguson et. al concluded that an “immediate investigation is necessary,
both extensively and intensively” on this issue (1941).
Following his own advice, Ferguson conducted a follow up study (1944). Similar
to the study three years prior, participants were asked to walk both toward and away from
the headlights of a stationary vehicle and indicate three points of visibility: 1) the most
distant point at which they were certain they were visible to a driver as a pedestrian, 2)
8
the point at which they felt there was a 50% chance they were visible and 3) the first
point at which they felt certain they were no longer visible as a pedestrian. Results
showed 84% of mean estimations obtained that evening were larger than the actual
visibility distance (Ferguson, 1944). Participants overestimated their visibility to the
“driver,” so much so that Ferguson (1944) deemed these visibility estimates to be at a
“dangerous degree.”
Just like detecting pedestrians from the driver’s point of view, research has
suggested that the tendency for pedestrians to overestimate their own visibility can
likewise be influenced by the amount of light reflecting off of the pedestrian himself as
well as the amount of light projecting into the environment. This is to say that the
reflectance level and type of clothing the pedestrian is wearing, as well as the strength of
headlight illumination, have both been shown to affect how pedestrians perceive their
own visibility at night.
As mentioned previously, reflective clothing can improve pedestrian visibility by
adding contrast between the environment and pedestrian. A study conducted by Tyrrell,
Wood and Carberry (2004) was the first to look at whether pedestrians’ estimated
visibility distances at night were influenced by clothing reflectance level. Participants,
dressed in clothing of various reflectance levels, stood on the side of a road and pressed a
button when they were confident the approaching driver could recognize that a pedestrian
was present. Results from this study have shown that pedestrians tend to feel less visible
at night when wearing black clothing and more visible when wearing either white
clothing or reflective material. Estimates when wearing white or reflective clothing (in

9
either a vest or a biomotion configuration) did not differ. It was also found that on
average, participants estimated they were recognized at a distance of 443 feet whereas, in
a parallel study, drivers responded to the presence of the pedestrian at a distance of only
251 feet (Wood et. al, 2005). By comparing their pedestrians’ conspicuity estimates with
measures of actual conspicuity in matching conditions, Tyrrell et al. (2004) concluded
that pedestrians typically fail to appreciate the extent to which their own conspicuity
varies with their clothing contrast.
Just like reflective clothing, headlight illumination has been found to not only
affect visibility from a driver’s perspective but has also been shown to be a determining
factor when estimating one’s own visibility level at night. Tyrrell et al. (2004) found a
significant main effect of headlight beam from the pedestrian’s point of view. Changing
from low beam to high beam caused pedestrians to increase their estimated recognition
distance by 102%. These findings, however, may not solely be due to a change in
illumination intensity since low beams and high beams also differ in the direction the
light is emitted.
Despite the benefits of both reflective clothing and headlight illumination, the
problem of pedestrian detection and pedestrian overestimation at night still exists. In an
early study conducted by Allen et al. (1970), pedestrians (with no clothing restrictions)
were asked to stand on the side of the road, start a stopwatch when they were certain they
were visible to the oncoming test vehicle and stop the stopwatch once the vehicle passed.
Results from this study found that more than 95% of the participants overestimated their
visibility and that these estimates were up to three times greater than actual visibility

10
distances. Actual visibility distances were measured from other participants who rode in
the approaching car, who were instructed to start a stopwatch when they first saw the
pedestrian and to stop the stopwatch once they passed the pedestrian.
This study, however, only examined one condition of visibility- high beams on
pedestrians wearing dark clothing. A later study conducted by Shinar (1984) was
conducted to build upon the conditions used and the results found in the Allen et. al
(1970) study. The same experimental procedures were employed but this newer study
also looked into the use of high versus low beam, glare versus no glare and the use of
retro-reflective material on pedestrian clothing. Similar to the original study conducted
14 years prior, Shinar found that pedestrians significantly overestimated their visibility
distances. Across all visibility conditions, pedestrians estimated an average visibility
distance of 202 m while the actual mean visibility distance was only 162 m. Both drivers
and pedestrians produced larger visibility distances when retro-reflective material was
used. These results show that the same variable (retro-reflective material) can influence
both the actual visibility of pedestrians as well as the pedestrians’ estimates of their own
visibility, but may cause pedestrians to overestimate. These results show the magnitude
of pedestrian overestimation.
All of this past research has illustrated data regarding some of the factors
influencing driver’s visibility levels and pedestrians’ estimated visibility levels at night.
In general, despite the fact that pedestrians generally overestimate their own visibility,
they believe themselves to be more noticeable with high beam illumination and when
wearing reflective material. There is little information, however, as to whether or not

11
pedestrian estimates change with varying headlight intensities, rather than the standard
low and high beams. Do those estimates vary systematically with illumination intensity
such that pedestrians’ estimates are a simple function of illumination at the eye? And
does the relationship between illumination and pedestrians’ estimates of how
recognizable they are depend on clothing contrast? Is there more of a reliance on clothing
rather than light presence to indicate estimated levels of conspicuity? These are some of
the research questions this present study tried to answer.
The present study further explored some of the possible factors that may influence
how recognizable a pedestrian perceives to be to drivers at night. More specifically, this
study examined the effects of systematic variations in headlight intensities and clothing
on those estimated recognition distances. Participants were randomly assigned to one of
four headlight intensity conditions- a traditional high beam (unfiltered) setting and three
filtered settings. The filtered settings were obtained by placing large neutral-density
filters over the headlights to reduce illumination. Participants were not informed of the
illumination manipulation prior to making their estimates. All participants participated in
each of the four clothing conditions: Street clothing (i.e., the clothing they were wearing
when they arrived), Black clothing, White clothing and a retroreflective Vest condition.
Participants were asked to walk both towards and away from a stationary car (with
varying illumination from the headlights) until they were confident that they were
recognizable as a pedestrian to the driver.
Based on previous research, it was hypothesized that there would be a main effect
for clothing. Recognition estimates from those in the White clothing and retro-reflective

12
Vest condition were predicted to be significantly longer than those in the Black clothing
but not significantly different from each other. It was also predicted that there would be a
main effect for headlight intensity such that the two higher illumination intensities would
show larger estimated distances compared to the two lower intensities. Lastly, it was
predicted that there would be no interaction between clothing and headlight intensity on
the estimated recognition distance, indicating that the relationship between the headlight
intensity and the estimated recognition distance would not depend on the clothing
participants wore.
METHOD
Participants
There were a total of 48 participants (24 females) in this study, ranging from 18 to
33 years of age (M = 19.85, SD = 2.27). All of them were students at Clemson University
and were recruited based on convenience sampling. Participants received extra credit in
their undergraduate Psychology course in exchange for participation. They had normal or
corrected-to-normal vision and achieved a level no less than 20/40 on a standard eye test.
None of the participants reported having any visual pathology other than corrected
refractive errors. Participants averaged 4.30 years of driving experience (SD = 2.57) and
on average 35.11% (SD = 13.96) of their driving time was completed at night.
Experimental Design
This study was a 4x4 mixed design. It included two independent variables-
headlight intensity and clothing. There were four levels to the headlight intensity

13
condition- a traditional high beam setting and three filtered settings. This variable was
manipulated between-subjects such that there were four groups of twelve participants.
The four levels of the clothing condition included Street clothing, Black clothing, White
clothing and a retroreflective Vest. This variable was manipulated within-subjects. The
dependent variable was the mean recognition distance that was estimated by the
participants. Table 1, below, summarizes the experimental conditions.
Table 1
The Four Experimental Groups (A, B, C, D).Clothing Type Headlight Intensities/Illumination Level
Max (unfiltered) High Medium LowStreet Condition A0 Condition B0 Condition C0 Condition D0
Black Condition A1 Condition B1 Condition C1 Condition D1
White Condition A2 Condition B2 Condition C2 Condition D2
Retro-reflective Vest Condition A3 Condition B3 Condition C3 Condition D3
Variable Design and Assignment
Each participant was randomly assigned to one of the four illumination conditions
while also experiencing all four clothing conditions. The headlight conditions followed a
between-subjects design in order to eliminate any demand characteristics that may have
arisen had the participants been told that the headlight intensity was being manipulated.
Participants were only able to give estimates based on one illumination condition they
were exposed to and did not know the intensity level of the other illumination conditions.
If participants had experienced each of the illumination intensities, they could have

14
estimated larger distances when the illumination was higher in order to try to please the
researcher. This bias was prevented by only exposing them to one light condition. On a
given data collection night, all headlight conditions were tested in order to reduce any
lighting effects from the moon that night.
The clothing condition was a within-subjects design in order to control for
individual differences, keep variability levels low across participants and reduce the
amount of unexplained variation. By using this design, any differences in estimates
across clothing type could be attributed to the clothing itself and not to the individual.
The first trial always involved the participants wearing the clothes the participant
happened to be wearing that night (“Street clothing”). This allowed participants to
become familiar with the task before any clothing variations were introduced. To avoid
order and fatigue effects, the other three clothing conditions (Black, White and Vest)
were counterbalanced via a Latin Square.
To vary the walking order, half of the participants within each headlight condition
provided recognition estimates by first walking toward the test vehicle and then walking
away from the test vehicle for each clothing condition, while the other half first walked
away from the test vehicle and then towards the test vehicle for each clothing condition.
This allowed a more efficient use of time with each participant. If the walking order was
altered for each clothing condition (meaning, walk away, walk to, walk to, walk away,
walk away, walk to), time would have been wasted since no data would have been
collected during the walk to the new starting position (e.g., walk away from the vehicle,
return to it, then walk away from the vehicle again without data being collected in order

15
to position the participant so he/she can walk towards the vehicle). These walking orders
were randomly assigned to participants with the constraint that half began by walking
toward the vehicle and half began by walking away from the vehicle.
Variable Manipulations
All forty participants wore each of the three clothing conditions: Black clothing,
White clothing and retro-reflective Vests in addition to walking in their Street clothing.
Participants were randomly assigned (twelve in each group) to one of four headlight
intensity conditions, which included the unfiltered high beam illumination (“Max
illumination”) and three filtered conditions that produced Low illumination, Medium
illumination and High illumination levels. The variation in headlight intensity was
created by placing large neutral-density filters in front of each headlight, thus reducing
the amount of light coming through. The ND 1.5 filter for the Low illumination level
blocked 97% of the light and therefore transmitted only 3% of the light. The ND 0.9
filter for the Medium illumination level blocked 87% of the light and transmitted 13%
and the ND 0.6 filter for the High illumination level blocked 75% of the light and only
25% of the light was transmitted through. Illumination measurements for the current
study were taken to determine the actual illumination levels of each headlight condition
and validating the manipulation. Illumination measurements were recorded at the eye
heights of both a five foot and six foot tall individual and averaged to determine the
illuminance at varying distances from the test vehicle’s headlights. These averages can
be seen in Figure 1 below.

16
Figure 1. Illumination from the headlights as a function of distance for each level of headlight intensity.
As mentioned, the dependent variable was the participants’ estimated recognition
distance. This was calculated by averaging the two distance measurements that were
provided by the participant - one when walking toward the test vehicle and another when
walking away from it.
Materials
Neutral-density filters (GAM Products, Los Angeles, CA) were used to reduce
headlight intensity. These filters reduced the illumination by 0.6, 0.9 or 1.5 log units.

17
The filter material was attached to the outer glass surface of the headlights of the test
vehicle such that no light escaped the filter (see Figure 2 below).
Figure 2. A view of each headlight condition; (a) Max, (b) High, (c) Medium, (d) Low.
The filters were positioned in front of each headlight. The test vehicle was a 2001
Subaru Legacy. The windshield and headlights were cleaned prior to data collection each
night.
Clothing was provided to participants for three of the clothing conditions. In the
Black condition participants were given a black sweatshirt, black sweatpants and black
shoe covers. In the White condition, participants wore a white sweatshirt, white
sweatpants and white shoe covers. The shoe covers covered the participant’s entire shoe.
A retro-reflective Vest was worn in the vest condition over a black sweatshirt, black
sweatpants and black shoe covers. The vest was categorized as an ANSI Class II vest
a b
c d

18
with a total of 1350 cm2 of silver reflective material configured in a U-shape across the
chest. Figure 3 shows a front-view of the vest in nighttime conditions.
Figure 3. A picture of the type of retro-reflective vest that was worn.
A questionnaire was given to participants once the estimation portion of the
experiment was completed (see Appendix A). This questionnaire aimed to obtain
participants’ opinions regarding their own night driving attitudes and behaviors. In
addition, key questions were asked to examine whether participants noticed anything
unusual about the headlight intensity from their experimental session.
A measuring wheel was used to measure the estimated recognition distances. In
addition, a standard Bailey-Lovie acuity chart was employed at the beginning of the
experimental session to measure each participant’s binocular visual acuity. As mentioned
before, a binocular acuity of at least 20/40 was required for participation.
Procedure
Each experimental session was divided into two parts, lasting a total of about one
hour. Data collection occurred no earlier than one hour after sunset and concluded before
19
midnight each night. Data was collected only in cooperative weather conditions,
meaning no active precipitation, no fog/haze or any moisture on the road surface.
The first part of each experimental session was conducted in the laboratory
setting. Here, participants were informed of the purpose and procedure of the study and
were given a consent form to read and sign. Participants’ acuity was then measured.
Any questions were answered by the researcher before proceeding onto the second
portion of the experimental session.
To begin the second part of the experiment, participants were driven in a
researcher’s vehicle to the testing site which was located at Dyke Road in Clemson, SC,
adjacent to the Madren Center and the Walker golf course. This is a dead-end one-lane
utility road with no streetlights and has a straight and level section with a length of
approximately 215 m (700 feet). There were cones and a warning sign blocking the head
of the road.
Once at the testing site, participants were reminded of the procedure, and any
questions were answered, before starting the first trial. The first trial always involved
wearing Street clothing. Participants walked toward and away from the headlights of the
stationary test vehicle, just as they would do in the other three trials. After completing
the task in Street clothing, the participant repeated the task with the other three clothing
conditions.
For each clothing trial, participants were reminded of the procedure and were
given the appropriate attire to wear. The headlights of the experimental vehicle were
turned on (with any filtering already in place) and participants were instructed to walk

20
from a position directly in front of the test vehicle “to the point you are confident the
driver would no longer be able to recognize you as a pedestrian.” When walking with
their back to the test vehicle, participants were encouraged to look back often in order to
judge more accurately. Half of the participants began at the test vehicle and walked away
from the vehicle. The other half of the participants were first led to a traffic cone 215 m
(700 feet) away from the stationary test vehicle and were instructed to walk toward the
vehicle “to the point you are confident that the driver would first be able to recognize you
as a pedestrian.” A researcher followed the participant with the measuring wheel and
recorded the distance once the participant gave a verbal confirmation that the task was
completed. The headlights were then turned off while the researcher and participant
walked the rest of the road to turn around and complete the task in the opposite direction.
Once at the correct position, the headlights were turned back on (with the same
appropriate filtering) and the participant completed the same task but was instructed to
walk in the opposite direction that he/she just completed. Again, a researcher followed
and recorded the distance with a measuring wheel upon hearing a verbal confirmation
from the participant. These two distances (walking away and walking toward the test
vehicle) were later averaged to calculate the estimated recognition distance for that
headlight and clothing condition.
Participants repeated this procedure (of walking both toward and away from the
vehicle) with all of the clothing conditions. As mentioned, the order in which the
clothing conditions were tested as well as the order in which they walked (to and from the
test vehicle) varied by experimental session.

21
Once all trials were completed, participants were probed about the strategies they
used when making their estimates. These responses were recorded on the data sheet by
the researcher. Then, participants were given a survey to complete. This survey aimed to
address the participants’ general night driving behaviors and any suspicions the
participant may have had regarding the illumination levels of the test vehicle’s
headlights. Any further questions the participant had were answered and he or she was
driven back to the laboratory where they were dismissed.
RESULTS
The mean recognition distances were calculated by averaging the distances
recorded when participants walked toward the test vehicle and when they walked away
from the vehicle. These mean distances were converted to z-scores to check for outlying
values. No outliers (defined by z > 3) were present. In addition, alpha was set at .05 for
all inferential tests and Greenhouse-Geisser degrees of freedom corrections were used in
analyses of variance when appropriate.
A mixed model 4 (clothing; varied within-subjects) X 4 (headlight intensity;
varied between-subjects) ANOVA revealed a main effect of clothing, indicating that
when averaged across the 4 headlight intensity groups a significant difference in
estimated recognition distance among the 4 clothing types was present, F(2.57,113.17) =
26.17, p < .000, η2=.373; see Figure 4. Least Significant Difference (LSD) pairwise
comparisons further revealed that estimates from participants in Street clothing (M=81.45
m, SD=33.86 m; M=267.21 ft, SD=111.10 ft) were significantly larger than the estimates
from those in Black clothing (M=69.94 m, SD=33.13 m; M=229.49 ft, SD=108.70 ft) and

22
significantly shorter than the estimates from those in both the White clothing condition
(M=98.10 m, SD=34.77 m; M=321.85 ft, SD=114.08 ft) and the Vest condition (M=96.43
m, SD=38.30 m; M=316.37 ft, SD=125.67 ft). In addition, estimates from participants in
Black clothing were significantly shorter than estimates from those in each of the other
three clothing conditions. Recognition estimates from participants in White and Vest
conditions were not significantly different.
Figure 4: Mean (+/- 1 standard error of the mean) estimated recognition distance for each of the four clothing conditions. These values are averaged across the 4 headlight intensity groups.
There was no main effect of headlight intensity, suggesting that when averaged
across clothing condition there were no significant differences in mean estimated
recognition distances among the four headlight intensity groups, Max (M=90.83 m,
SD=35.31 m; M= 298.01 ft, SD=115.84 ft), High (M=96.44 m, SD=44.88 m; M=316.39
ft, SD=147.24 ft), Medium (M=88.18 m, SD=30.89 m; M=289.29 ft, SD=101.33 ft) and

23
Low (M=70.48 m, SD= 21.50 m; M=231.23 ft, SD=70.55 ft), F(3,44)=1.60, p = .202,
η2=.099. The effects of headlight intensity on estimated recognition distances can be
seen in Figure 5.
Figure 5. Mean (+/- 1 standard error of the mean) estimated recognition distance for each of the four headlight intensity groups. These values are averaged across the 4 clothing conditions.
There was not a significant interaction between headlight intensity and clothing
on the mean recognition distances, F(7.72,113.17)=.1.58, p = .140, η2=.097 . This means
that the relationship between type of clothing and estimated recognition distances did not
significantly vary across the headlight illumination groups. The effects of clothing type
and headlight intensity on estimated recognition distances can be seen in Figure 6.

24
Figure 6. Mean (+/- 1 standard error of the mean) estimated recognition distance for each of the four headlight intensity groups and four clothing conditions. There was no significant interaction between clothing and headlight intensity.
Since the estimated recognition distances were calculated by averaging the
distance walked toward the test vehicle and the distance walked away from the test
vehicle, it was next examined whether the direction of travel influenced the responses.
Another mixed model 2 (direction of travel) X 4 (clothing type) X 4 (headlight group)
ANOVA was conducted with direction of travel (towards or away from the vehicle)
treated as an independent variable that was manipulated within-subjects. The results
revealed a main effect of direction, indicating that when averaged across the four clothing
types and the four headlight intensity groups the estimation distances were larger when
walking towards the vehicle (M=94.76 m, SD=39.90 m; M=310.89 ft, SD=130.91 ft) than
when walking away from it (M=78.23 m, SD=37.74 m; M=256.66 ft, SD=123.80 ft;
F(1,44) = 17.56, p < .000, η2=.285. This ANOVA also revealed a significant interaction

25
between walking direction and clothing, F(2.69,132) = 3.55, p = .020, η2=.075; see
Figure 7. Simple effects showed significant differences among clothing groups when
walking towards the vehicle, F(3,191) = 5.33, p = .002, η2=.078 as well as significant
differences among clothing groups when walking away from the vehicle, F(3,191) =
6.55, p < .000, η2=.095. Further, results from paired t-tests showed that all four clothing
types showed a significant direction effect, where walking toward the test vehicle yielded
larger estimated recognition distances than walking away from the test vehicle.
However, the size of this direction effect was larger when participants wore Street
clothing (η2=.104) than when wearing Black clothing (η2=.030), White clothing (η2=.030)
or a retro-reflective Vest (η2=.030).
Figure 7. Mean (+/- 1 standard error of the mean) estimated recognition distance for each of the four clothing types and the two walking directions. There was a significant interaction between clothing and walking direction.
26
To determine whether the order in which the participants experienced the four
clothing conditions affected the participants’ responses, a 4 (clothing order) X 4
(headlight intensity group) mixed model ANOVA was conducted. Results from this
ANOVA indicated that a significant order effect was not present, F(2.59,114.03)=1.84, p
= .152, η2=.040 and that there was no interaction between order and headlight intensity
group F(7.78,132)=1.27, p = .267, η2=.080.
Examining the 48 participants’ survey responses, only five participants (10%)
indicated that they noticed something unusual about the test vehicle. This question was
designed to measure whether participants noticed the headlights were modified by filters.
None of the participants reported noticing the filters. Of the five participants that reported
noticing something unusual, two participants (4% of total sample) further explained on
the questionnaire that they thought the headlight looked dimmer than normal. Of these,
one (2% of total sample) was in the Medium group and one (2% of total sample) was in
the Low headlight condition). Of the remaining three, two (4% of total sample)
participants explained that they thought the vehicle moved (despite having been told the
test vehicle would remain stationary) and still another participant (2% of total sample)
believed the vehicle’s headlights were changing between their walking sessions.
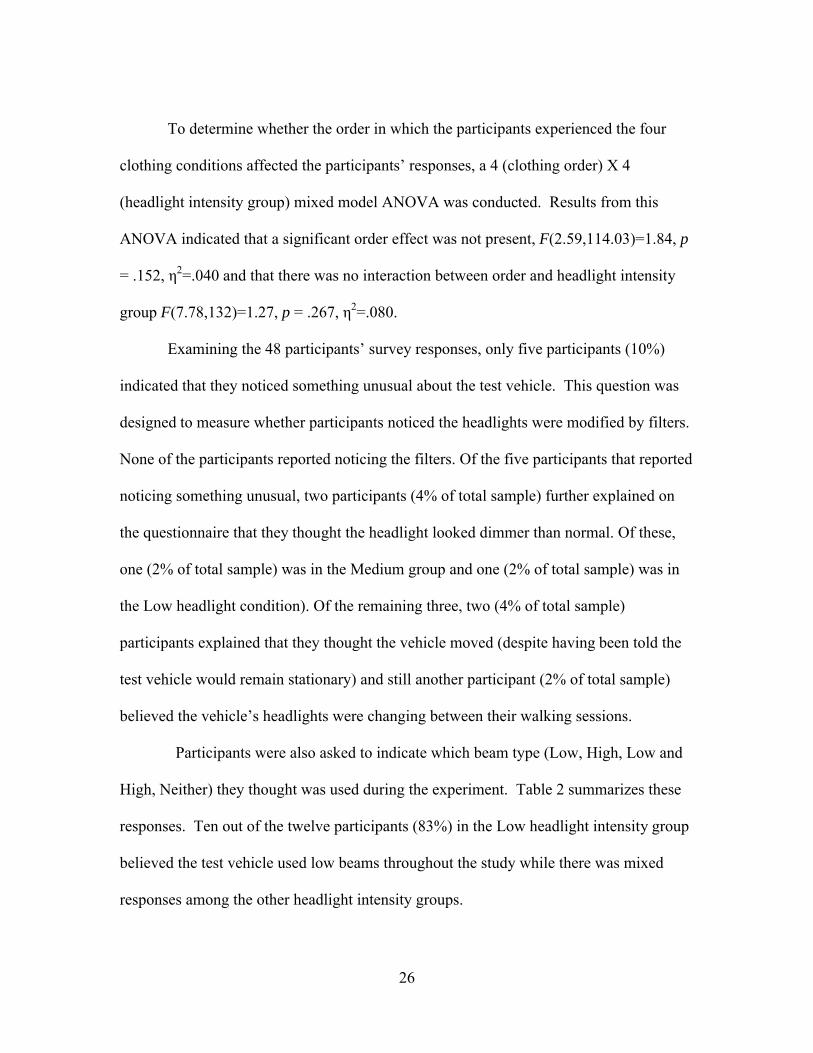
Participants were also asked to indicate which beam type (Low, High, Low and
High, Neither) they thought was used during the experiment. Table 2 summarizes these
responses. Ten out of the twelve participants (83%) in the Low headlight intensity group
believed the test vehicle used low beams throughout the study while there was mixed
responses among the other headlight intensity groups.

27
Table 2
Number of Participant Responses Regarding Type of Beam Believed to be Used for Each
Headlight Condition
Headlight Intensity GroupBeam Type Max High Medium LowLow 5 4 5 10High 3 6 5 0
Low and High 4 2 2 1Neither 0 0 0 1
Participants were asked to rate how similar the stationary vehicle’s headlights
were compared to typical headlights. These ratings were on a one-to-four scale where
one was ‘exactly the same’ and 4 was ‘significantly different.’ Table 3 summarizes the
number of participants who gave the specified rating for their headlight condition
Table 3
Number of Participant Rating Scores Regarding the Similarity of the Test Vehicle’s
Headlights to Typical Headlights
Headlight Intensity GroupRating Max High Medium Low1 8 8 5 62 4 3 4 33 0 1 3 34 0 0 0 0
Note: The rating scores ranged from 1 (exactly the same) to 4 (significantly different).
A one-way ANOVA determined whether the mean rating scores (of how similar
the test vehicle’s headlights were compared to typical headlights) varied across the

28
headlight intensity groups. The results revealed that there was not a significant
relationship, F(3,44) = 1.22, p = .315, η2=.077. A follow-up open-ended question asked
participants to explain their answer. The majority of participants in both the Max and
High headlight conditions noted that the headlights looked normal to them. (Note that
the Max condition received zero responses about being too bright). Only three
participants in the Medium headlight condition explained their rating with the belief that
the light looked dimmer while two others thought the light was brighter than normal.
Five participants (42%) in the Low headlight group noted that the headlights appeared
unusually dim. Correlations examined the relationship between estimated recognition
distances and responses to the survey question that asked how similar the headlights of
the test vehicle were to typical car headlights (on a 1, exactly the same, to 4, significantly
different, scale). Across both clothing type and headlight group, there was no significant
correlation between individual differences in estimated recognition distances and how
typical the participants thought the test vehicle’s headlights were, (p = .09, r = .245).
Similarly, when averaged only across clothing type, no correlations between how typical
participants thought the test vehicle’s headlights were and the estimated recognition
distances within each headlight condition were significant, (all p > .07, r range = -.540 to
.420).
Two correlations, however, were present when examining each clothing type
within each of the headlight groups. In the Max headlight condition, a significant
correlation was found when wearing Black clothing (p = .034, r = .613). This indicates
that in the Max condition, the more atypical a participant thought the test vehicle’s

29
headlights were, the larger their estimated recognition distance. The other significant
correlation was found in the Low headlight intensity condition when wearing Street
clothing (p = .006, r = -.735). This indicates that in the Low headlight condition, the
more atypical participants thought the test vehicle’s headlights were, the shorter distance
they would walk to estimate their recognition.
Additional correlations were examined between the participants’ visual acuity
and their estimated recognition distances. When estimated recognition distances were
averaged across both clothing type and headlight group, there was no significant
correlation between individual differences in acuity level and estimated recognition
distances, (p = .367, r = .133). Further, when averaged across clothing type, none of the
correlations between acuity and estimated recognition distance within each headlight
group were significant,(all p > .16, r range = -.429 to .374). Lastly, there were no
significant correlations between acuity and estimated recognition distances when
examining each clothing type within each of the four headlight groups, (all p > .052, r
range = -.526 to .573).
DISCUSSION
The present study investigated the extent to which clothing contrast and
systematic variations in headlight intensity affected the distance at which pedestrians felt
they were recognizable to a driver. Participants wore four different types of clothing
(Black, White, Vest and Street) and were exposed to one of four levels of headlight
intensities. The participants were not informed that headlight intensity was being
manipulated. These headlight intensities included a standard high beam and three filtered

30
conditions in which neutral density filters had been mounted on top of the high beam
headlights. Participants were asked to walk towards (and away from) a parked vehicle
until they felt they were recognizable to the driver.
As expected, clothing contrast affected pedestrians’ estimated recognition
distances. As predicted, when participants wore Black clothing they estimated shorter
recognition distances than when they wore more reflective clothing (White or Vest).
Estimates from the White and Vest clothing conditions did not differ; this had also been
predicted. These findings are somewhat consistent with the only prior research that
measured recognition distances as a function of clothing, where pedestrians thought
themselves to be less visible in black clothing compared to white or vest condition
(Tyrrell et. al, 2004). In that study, when high beam headlights were used, younger
participants dressed in white clothing estimated themselves to be visible from a distance
that was 73% greater than the distance estimated when in black clothing. Also, younger
participants wearing a retro-reflective vest estimated themselves to be visible from a
distance that was 46% greater than when wearing black clothing. In the present study,
when participants wore White clothing, they estimated themselves to be recognizable
from a distance only 40% greater than when dressed in Black clothing. When wearing a
retro-reflective vest, there was an increase of only 38% in the estimated distances
compared to when wearing Black clothing. Thus the data from the present study are
somewhat inconsistent with Tyrrell et al. (2004) due to the differences seen when
participants wore White clothing. This discrepancy between changes in estimates could
be due to the large difference in mean recognition distances found between studies when

31
participants wore white clothing. The mean distance estimates made in White clothing
differed by 60 m (197 ft) between the two studies; while the mean recognition distances
when participants wore Black clothing differed by only 20 m (66 ft) and the distances
when wearing a Vest differed by 48 m (158 ft). This difference may be due to the length
of the road. The prior study used a road that was 400 m (1312 ft) long while the present
study used a road that was in 215 m (700 ft) in length. The shorter road distance in the
present study may have caused participants to stop in the middle section of the road
instead of walking to an extreme distance. If there was a farther distance to walk, their
estimates may have been longer.
It is also interesting to point out that estimates in Street clothing were
intermediate to the estimates made in Black and White and/or Vest conditions. Only one
participant arrived wearing all black clothing and his estimates in the Black and Street
conditions were fairly similar. The rest of the participants arrived in clothing that had a
mix of reflectance levels (i.e., dark jeans with a light shirt or khakis with a dark jacket),
which would support the finding that the estimates from those in Street clothing were
between the means for Black and White/Vest configurations. Still, it is important to note
that changes to clothing reflectance levels affect participants’ estimates of their own
visibility much less than the same manipulations affect their actual recognition distances.
As mentioned, in the current study, participants dressed in White clothing estimated
themselves to be visible from a distance that was 40% greater than when in Black
clothing and from a similar increase in distance (38%) when wearing a retro-reflective
Vest than when dressed in Black clothing. A previous study that examined how clothing

32
affected drivers’ detections of pedestrians found that drivers detected pedestrians in white
clothing from a distance that was 264% greater than when the pedestrian wore black
clothing and detected pedestrians wearing a retro-reflective vest from a distance that was
106% larger than when the pedestrian wore black clothing (Wood et. al, 2005). Thus the
present data are inconsistent with the existing literature in indicating that pedestrians fail
to appreciate the extent to which reflectance affects their visibility to oncoming drivers.
The prediction of an effect of headlight intensity was not supported by the
findings of this study. The findings indicated that the distance at which pedestrians felt
recognizable to a driver did not systematically change with headlight intensity. No
previous research has examined pedestrians’ perceptions of how recognizable they are
with respect to systematically reduced headlight intensities.
This non-significant effect is surprising considering the magnitude of the
headlight intensity manipulations. The headlight intensities ranged from a standard high
beam (Max) to a high beam headlight that was filtered to transmit only 3% of the light
(Low). The intermediary headlight intensities transmitted only 13% (Medium) and 25%
(High) of the light. In that lowest headlight condition 3% of the light was transmitted;
this means that 97% of the light was blocked. Twelve of the participants were exposed to
this filtered headlight condition and on average these participants thought they would be
no less recognizable to drivers. They also failed to notice anything atypical about the
headlights. This 97% reduction in headlight intensity, which would presumably fall far
below any acceptable standard, is unlikely to have been previously encountered by the
participants. If this strong manipulation does not produce an effect then the more subtle

33
differences in headlight illumination that one sees from vehicles on the road are unlikely
to have an impact on how conspicuous pedestrians believe themselves to be.
One must be cautious, however, about assuming that a non-significant effect of
headlight intensity indicates no effect at all. The non-significant effect of headlight
intensity showed an observed power of .392. This moderate-to-small value may suggest
that perhaps power is too low in order to find an effect. When inspecting the differences
in mean recognition estimates among the four headlight intensity groups, the largest
difference is only 26 m (found between the Low and High conditions). This difference
was similar to the largest mean difference found among the four clothing types (28 m,
found between the White and Black clothing conditions). Yet, a significant effect was
found for clothing. A non-significant effect of headlight intensity does not necessarily
mean the effect does not exist, it may just not have been found in this study. This may be
due to lower power as a result of using a between-subjects design for this variable.
The reason there could have been a non-significant effect of headlight intensity
could be partly attributed to the fact that participants did not differentiate among
headlight intensities. Results showed that participant ratings of how similar the test
vehicle’s headlights were compared to typical headlights did not differ across headlight
intensity groups. Therefore, if illumination differences were not noticed among
participants within each of the headlight groups, then it is less surprising that estimated
recognition distances did not differ among the groups.
Participants had difficulty identifying which beam type (‘Low’, ‘High’, ‘Low and
High’, ‘Neither’) was used during the experiment. Across all headlight groups, 50% of
34
participants thought a low beam was used. This is surprising for the Max headlight
intensity, where almost half of the participants believed a low beam was used when it was
actually a standard unfiltered high beam. This illustrates that pedestrians have difficulty
distinguishing low and high beam headlights. It is also interesting to note that the
majority of participants in the Low headlight intensity group believed either a low beam
or a combination of low and high beam was used. It follows that their recognition
distances did not differ from those in other headlight intensity groups.
It could be that participants did notice something unusual about the headlight
intensity but may have attributed the differences to normal variations of headlights. For
instance, the light from headlights today can vary by car models or be reduced by weaker
batteries, old bulbs or dirty headlights. Some participants even commented on their
questionnaire how headlights can vary between cars, bulbs or other light settings yet they
still believed the test vehicle’s headlights looked normal.
A study conducted almost 30 years ago investigated the effects of light reduction
caused by dirty headlights on one’s ability to recognize objects at night (Rumar, 1974).
In one experiment, researchers measured the percentage of light reduction caused by dirt
on headlights on random vehicles that pulled into a gas station. Rumar found that with
dry weather light reductions due to headlight dirt was normally 10-20%. The participants
in the present study may have attributed any slight variations they may have noticed in
headlight intensity to dirt or other similar ‘normal’ variations.
In Rumar’s second experiment, participants were driven along a straight road at
night and indicated when they detected dark, cloth-covered obstacles. Glass plates

35
covered in a fixed amount of dirt were mounted in front of the test vehicle’s headlights.
Results from this experiment showed that a light reduction of 60% caused a 20%
reduction of high beam visibility. They also found that drivers tend to not notice
reductions in headlight intensity until the light output is reduced by 60% (Rumar, 1974).
It is surprising then, with these past results, that the twelve participants exposed to the
Low headlight intensity, where 97% of the light was filtered (much larger than the
suggested 60% to notice a difference), did not alter the distance at which they thought a
driver would recognize them. The present data suggest that pedestrians are even less
sensitive than drivers to reductions in headlight intensity.
Another possibility is that pedestrians do not understand that fluctuations in
clothing reflectance only matter if they are illuminated. That is, they do not understand
that the percentage of light that is reflected from clothing is a constant percentage of the
illumination that reaches them. As illumination increases, light reflected from clothing
will increase proportionally. If their understanding is just that white clothing is more
visible than black clothing regardless of illumination level then they may not fully
consider the effects of headlight intensity. It is possible that the concept of brightness
constancy –the tendency for a visual object to seem of the same brightness level despite
wide fluctuations in illumination conditions – may be contributing to participants’
misunderstanding of the relationship between illumination and clothing reflectance.
It is interesting to note the strategies participants reported using when trying to
estimate their recognition distances and how these strategies could have influenced the
findings of this study. There were four main strategies that were consistently mentioned

36
by participants during conversations after completing all estimates: (1) basing their
estimates on the clothing they were wearing, (2) assessing how far the light from the
headlights extended onto the road, (3) assessing the shadows off of their own body and
(4) trying to imagine things from the driver’s point of view.
Many participants stated they understood how one’s own visibility is affected by
different reflectance levels of clothing. On the survey questions as well as during
conversation with the researcher, they correctly identified that at night a person wearing
black would be detected at a shorter distance and a person in white would be recognized
at a farther distance due to the ‘brightness’ level of the clothing. Many did not comment
about wearing a retro-reflective vest. Several of those who did acknowledge the benefits
of a retro-reflective vest mentioned that they were nighttime runners or cyclists.
There were two reported strategies by some participants that involved the use of
the headlights. Some reported looking for the point on the road at which the light from
the headlights appeared to end, and others reported strategically inspecting their own
shadows. To an individual who’s repeatedly witnessed all four headlight intensities, the
distance of the extended light and the resulting shadow looked drastically different
between headlight intensities, especially between the Max and Low conditions.
Participants, on the other hand, failed to detect any differences. It is important to recall
that headlight intensity was manipulated between-subjects; perhaps if participants had
been exposed to each of the four headlight conditions they might have noticed the
manipulation. Since they most likely have not previously attended to the typical distance
light falls from a headlight onto the road or how much shadow it should produce, they

37
may have a difficult time distinguishing any deviations from the norm. This would be
especially difficult since high beams were used but are less commonly encountered. As
mentioned before, any slight differences in illumination that may have been noticed could
have been attributed to ‘normal’ variations of headlights (i.e., car model, dirt etc).
Perhaps each manipulation was not different enough from a ‘normal’ headlight
intensity for participants to notice. However, it is difficult to suggest that the headlight
manipulations were not strong enough especially considering the lowest illumination
level reduced the headlight intensity by 97%. This leaves little room to go to a more
extreme manipulation aside from a no light condition. These large illumination
differences between headlight groups were confirmed with a light meter; see Figure 1.
Lastly, still other participants reported trying to imagine the view from the
driver’s point of view and recall their own experiences driving at night in order to make
their estimates. Using this strategy of imagining oneself in the driver’s seat allows this
study to be compared to past studies that used similar clothing and headlight
manipulations but examined drivers’ abilities to detect pedestrians at night- just as the
pedestrians in the present study were trying to imagine. In prior studies it has been
shown that drivers detect pedestrians in black clothing less frequently and at a shorter
distance than those in white clothing or wearing a vest (Wood et. al, 2005). Although the
length of the estimates were larger in past studies, the pattern of results was consistent
with the current research. In terms of headlight intensity, in the present study
participants’ estimated recognition distances did not systematically change with
reductions in headlight intensity. When looking at this from the driver’s point of view (as

38
multiple participants reported), the lack of a main effect of headlight intensity is
somewhat inconsistent with prior research. In a past study where the headlights were
similarly manipulated to systematically reduce the light output, it was found that a
driver’s ability to detect signs, road hazards and pedestrians was better with higher
illumination levels (Owens et. al, 2007). Taken together with the present results, the
results from Owens, et al. (2007) suggests that if participants were attempting to imagine
the view of the roadway from the driver’s perspective they were unsuccessful.
There was also an effect of walking direction and an interaction between direction
and clothing on estimated recognition distances. The effect of walking direction
indicated that when walking towards the vehicle participants provided significantly larger
estimates than when walking away from the vehicle. A larger recognition distance when
walking toward the vehicle makes sense. Walking toward the vehicle is more applicable
to the real-world where pedestrians often walk facing oncoming traffic and can see the
car directly. When walking away from the vehicle, a pedestrian would have to turn back
often to judge the distance and most of the light is projected on the pedestrian’s back
rather than the front. In addition it is not unusual in psychophysical studies for the
estimates of a threshold to systematically differ when testing a stimulus in both ascending
and descending trials, indicating that a direction effect is typically found with this method
(Blake & Sekuler, 2006, 557). When using similar methods, experimenters typically take
the average of the ascending and descending series. Regardless, the results of this study
suggest that the distance at which pedestrians believe they become conspicuous to drivers
39
travelling towards them is greater than the distance at which pedestrians believe they
become inconspicuous to drivers travelling away from them.
The interaction between direction and clothing indicates that the relationship
between the direction walked and the estimated recognition distance depends on the
clothing reflectance level. It is important to note, however, that this interaction is likely
due to the much larger effect size present in the Street clothing condition. This effect size
was three times larger than the effect sizes of the other three clothing conditions.
Although no clear explanation for this effect is offered, it is ironic to note that at that
point in the procedure it was not apparent to the participants that clothing reflectance
would be manipulated.
Participants rated how typical they thought the test vehicle’s headlights were
using a four-point scale. For the most part, these ratings were largely uncorrelated with
participants’ estimated recognition distances. This means there is no relationship
between how typical they thought the test vehicle’s headlights were and the distance at
which they thought they were recognizable to an oncoming driver. This may be a result
of the participants in the three groups in which the headlights were filtered not noticing
the headlight manipulation. Eighty five percent of all participants gave typicality ratings
of “1” (exactly the same) or “2” (slightly different) on a 4-point scale. Therefore these
correlations may not be as accurate as they seem.
There were, however, two instances when estimated recognition distances were
correlated with the typicality ratings. When participants in the Max headlight group
dressed in Black clothing, there was a positive relationship between their typicality rating
40
and their estimated recognition distance. The other correlation was found in the Low
headlight group when participants were dressed in Street clothing. This negative
correlation indicated that the more atypical the participants rated the test vehicle’s
headlights, the shorter their estimated recognition distances.
There were no correlations present between individual differences in visual acuity
and mean estimated recognition distances. This indicates that pedestrians who are able to
discern particularly high spatial frequencies do not believe they are any more or less
conspicuous to drivers than do pedestrians who have a worse visual acuity. It is
important to note, however, that no participant had an acuity level worse than 20/35.
Therefore, the range of acuity levels was somewhat restricted. This range restriction
made it difficult for the present study to detect a relationship between acuity and
estimated recognition distance. A wider range of acuity levels or a direct manipulation of
acuity using blurring lenses may be better able to detect whether such correlations exists.
There were a few limitations to the present study. Having participants walk back
and forth in front of a stationary test vehicle was obviously a contrived scenario that did
not faithfully replicate the more common situation in which a vehicle drives towards a
pedestrian. However, having the test vehicle remain stationary during the experiment
allowed participants to concentrate on their clothing and the headlight illumination, and
to take time to make deliberate decisions. Still, it would be worthwhile to repeat this
study using a method that involved a vehicle moving towards a stationary pedestrian.
The pedestrian would still indicate the point at which he felt confident the driver can
recognize him. This may be more applicable to a situation in which a pedestrian is trying

41
to cross a road and judging the distance of an oncoming vehicle; whereas the present
study focused more on a situation in which a pedestrian is walking alongside a roadway.
Another limitation was the experimental test site not being illuminated. This
location was specifically chosen to minimize ambient lighting in order to isolate how
participants would respond to manipulations of headlight intensity. However, the extent
to which pedestrians estimates of their own conspicuity are affected by changes in
ambient illumination from sources other than the relevant vehicle remains unknown. Just
like in the Selective Degradation Hypothesis where ambient light masks a reduction in
focal vision, surrounding light could also contribute to false estimates, making
pedestrians think they are more visible than they might be due to the extra lighting.
A final limitation is the type of clothing that was used in the experiment. It was
important for experimental control to keep all elements of the clothing sets consistent
with each other (i.e., black sweatshirt, black sweatpants and black shoe covers; or white
sweatshirt, white sweatpants and white shoe covers). However, pedestrians rarely dress
in all of one color from head to toe when walking at night. While it was hoped that the
black and white configurations used in the present study would define the range of
clothing reflectance possibilities, it remains unknown how more typical clothing might
affect pedestrians’ estimates. Although the Street condition capitalized on the
participants’ presenting clothing, there was no systematic attempt to quantify the
reflectance characteristics of the clothing worn by individual participants.
Overall, the findings from this study provided more insight into the factors that
influence pedestrians’ perceptions of how recognizable they think they are to drivers at
42
night. Specifically, the results provided two practical implications. For one, it provided
more confirming evidence that clothing influences a pedestrian’s perception of how
recognizable they think they are. In addition, the findings from this study have shown
that pedestrians’ recognition estimates may not systematically vary with even large
reductions in headlight intensity. Since there is limited research on this topic of
systematically changing headlight intensities, future work should be completed to follow
up on this idea. Future studies could focus on examining the effects of more extreme
headlight variations, including a no headlight condition, or see how drivers’ abilities to
detect pedestrians may be affected by such changes.
Furthermore, these findings indicate a need to educate pedestrians as to how their
conspicuity at night can be affected. Pedestrians might not consider either the amount of
light that falls on them or how that light level might interact with their clothing
reflectance. This naïve way of thinking coupled with the existing problem of pedestrians
overestimating their visibility at night makes clear that there is a need for pedestrian
education. With education on how headlight intensity and clothing reflectance levels can
influence one’s conspicuity at night, pedestrian safety will likely be increased.

43
APPENDIX
Post-test questionnaire Participant #: ____
Please answer each question as accurately as possible. If any question is unclear, please ask for clarification. All answers will remain confidential. Unless noted, assume all questions refer to average driving situations.
1. Age: ____ 2. Gender: Male Female Prefer not to answer
3. Years of driving experience __________
4. Approximately what percent of your driving is done at night? __________
5. What percentage of the time do you use the specified headlight when driving at night in the following situations?
Use low beams when driving on city streets ____%Use low beams when driving on highways ____%Use high beams when driving on city streets ____%Use high beams when driving on highways ____%
6a. Do you consider the visibility level of your clothing before you walk outside at night? Yes No
6b. If so, please explain:
7. Are there other any precautions you take when walking at night?
The following questions are in regards to tonight’s experiment.
1. Did you notice anything unusual about the stationary vehicle that was used in tonight’s experiment?
Yes No
2. If yes, please explain.

44
Appendix (Continued)
3. What type of headlight beams do you think the stationary vehicle used tonight? (please check one)
____ Low beams ____ High beams____ Sometimes low beam, sometimes high beam ____ Neither low beams nor high beams
4. On a scale from (1) exactly the same to (4) significantly different, how similar was the stationary vehicle’s headlights compared to typical headlights?
Exactly slightly somewhat significantlythe same different different different
(1)---------------------(2)---------------------(3)---------------------(4)
5. Please explain your answer.

45
REFERENCES
Allen, M. J. (1970) Vision and Highway Safety. New York, NY: Chilton Book Co.
Allen, M., Hazlett, R., Tacker, H. and Graham. B. (1970). Actual pedestrian visibility and
the pedestrian’s estimate of his own visibility. American Journal of Optometry
and Archives of American Academy of Optometry, 47, 44-49.
Balk, S.A., Tyrrell, R.A., Brooks, J.O., & Carpenter, T.L. (2008). Highlighting human
form and motion information enhances the conspicuity of pedestrians at night.
Perception, 37, 1276-1284.
Blake, R. & Sekuler, R. (2006). Perception (5th ed.). New York, NY: The McGraw Hill
Companies, Inc.
Brooks, J.O., Tyrrell, R.A., & Frank, T.A. (2005). The effects of severe visual challenges
on steering performance in visually healthy young drivers. Optometry and Vision
Science, 82(8), 689-697.
Ferguson, H.H. & Geddes, W.R. (1941). Accidentes de automóvil en lascarreteras. La
confianza peligrosa del peaton. Psicotecnia, 2, 199-206.
Ferguson, H.H. (1944). Road Accidents: Pedestrians’ Beliefs Regarding Visibility at
Night. Journal of Applied Psychology, 28(2), 109-116.
Leibowitz, H.W., Owens D.A. & Post, R.B. (1982). Nighttime driving and visual
degradation. (SAE Technical Paper Series No. 820414). Warrendale PA: Society
of Automotive Engineers.

46
Leibowitz, H. W., Owens, D. A., & Tyrrell, R.A. (1998). The assured clear distance
ahead rule: Implications for nighttime traffic safety and the law. Accident Analysis
and Prevention, 30, 93-99.
Mefford, M.L., Flannagan, M.J. & Bogard, S.E. (2006). Real-world use of high-beam
headlamps. Report No. UMTRI-2006-11. Ann Arbor, MI: The University of
Michigan Transportation Research Institute.
National Highway Traffic Safety Administration. (2007). Traffic Safety Facts. (DOT HS
810994). Washington, DC: U.S. Department of Transportation. Retrieved March
28, 2009, from
http://www.nhtsa.dot.gov/portal/nhtsa_static_file_downloader.jsp?file=/staticfiles
/DOT/NHTSA/NCSA/Content/TSF/2007/810994.pdf
Olson, P.L. & Sivak, M. (1983). Comparison of headlamp visibility distance and
stopping distance. Perceptual and Motor Skills, 57, 1177-1178.
Owens, D.A., & Sivak, M. (1993). The role of reduced visibility in nighttime road
fatalities, Report No. UMTRI-93-33. Ann Arbor, MI: The University of Michigan
Transportation Research Institute.
Owens, D.A. & Sivak, M. (1996). Differentiation of Visibility and Alcohol as
Contributors to Twilight Road Fatalities. Human Factors, 38(4), 680-689.
Owens, D.A., & Tyrrell, R.A. (1999). Effects of luminance, blur, and age on nighttime
visual guidance: A test of the selective degradation hypothesis. Journal of
Experimental Psychology: Applied, 5, 115-128.

47
Owens D. A., Wood J. M. & Owens J. M. (2007). Effects of age and illumination on
night driving: A road test. Human Factors, 49(6), 1115-1131.
Ranney, T. A., Simmons, L. A., & Masalonis, A. J. (2000). The immediate effects of
glare and electrochromic glare-reducing mirrors in simulated track driving.
Human Factors, 42, 337–347.
Rumar, K. (1974). Dirty headlights – Frequency and visibility effects. Ergonomics,
17(4), 529-533.
Rumar, K. (1990). The basic driver error: late detection. Ergonomics, 33(10-11), 1281-
1290.
Shinar, D. (1984). Actual versus estimated night-time pedestrian visibility. Ergonomics,
27, 863-871.
Shinar, D. (1985). The effects of expectancy, clothing reflectance and detection criterion
on nighttime pedestrian visibility. Human Factors, 27(3), 327-333.
Sivak, M., Luoma, J., Flannagan, M.J., Bingham, C.R., Eby, D.W. & Shope, J.T. (2007).
Traffic safety in the U.S.: Re-examining major opportunities. Journal of Safety
Research, (38), 337-355.
Sivak, M., Flannagan, M. J., Schoettle, B., & Adachi, G. (2003). Driving with HID
headlamps: A review of research findings. (SAE Technical Paper Series No.
2003-01-0295). Warrendale, Pennsylvania: Society of Automotive Engineers.
Sullivan, J.M., & Flannagan, M.J. (2002). The role of ambient light level in fatal crashes:
inferences from daylight saving time transitions. Accident Analysis and
Prevention, 34, 487-498.

48
Sullivan, J.M., Adachi, G., Mefford, M.L., & Flannagan, M.J. (2004). High-beam
headlamp usage on unlighted rural roadways. Lighting Research & Technology,
36(1), 59-67.
Theeuwes, J., Alferdinck, J.W.A.M. & Perel, M. (2002). Relation between glare and
driving performance. Human Factors, 44(1), 95-107.
Tyrrell, R. A., Wood, J. M., & Carberry, T.P. (2004). On-road measures of pedestrians’
estimates of their own nighttime conspicuity. Journal of Safety Research, 35,
483–490.
Tyrrell, R. A,, Patton C.W. & Brooks, J.O. (2004). Educational interventions successfully
reduce pedestrians’ overestimates of their own nighttime visibility. Human
Factors, 46(1), 170-182.
Wood, J.M., Tyrrell, R.A., & Carberry, T.P. (2005). Limitations in drivers’ ability to
recognize pedestrians at night. Human Factors, 47, 644-653.