the effects of graphic organizers to identify main idea
TRANSCRIPT

Rowan University Rowan University
Rowan Digital Works Rowan Digital Works
Theses and Dissertations
7-27-2017
The effects of graphic organizers to identify main idea and The effects of graphic organizers to identify main idea and
supporting details in informational text on students with learning supporting details in informational text on students with learning
disabilities disabilities
Heather Coombs Rowan University
Follow this and additional works at: https://rdw.rowan.edu/etd
Part of the Language and Literacy Education Commons, and the Special Education and Teaching
Commons
Recommended Citation Recommended Citation Coombs, Heather, "The effects of graphic organizers to identify main idea and supporting details in informational text on students with learning disabilities" (2017). Theses and Dissertations. 2458. https://rdw.rowan.edu/etd/2458
This Thesis is brought to you for free and open access by Rowan Digital Works. It has been accepted for inclusion in Theses and Dissertations by an authorized administrator of Rowan Digital Works. For more information, please contact [email protected].

THE EFFECTS OF GRAPHIC ORGANIZERS TO IDENTIFY MAIN IDEA AND
SUPPORTING DETAILS IN INFORMATIONAL TEXT ON STUDENTS WITH
LEARNING DISABILITIES
by
Heather Coombs
A Thesis
Submitted to the
Department of Interdisciplinary and Inclusive Education
College of Education
In partial fulfillment of the requirement
For the degree of
Master of Arts in Special Education
at
Rowan University
July 21, 2017
Thesis Chair: Amy Accardo Ed.D.

© 2017 Heather Coombs

Dedications
This thesis is dedicated to my mother, Christine Demcovitz, and my mother in
law, Jean Coombs, for their patience and countless hours of babysitting while I tirelessly
completed my research, writing, and editing to complete this thesis and Master’s degree.
I also dedicate this thesis to my husband, Matthew Coombs, for always believing
in me and my daughter, Amy Coombs, for being my reason to never give up.

iv
Acknowledgments
I would like to express my utmost gratitude to Dr. Amy Accardo for her guidance
and support throughout this process. The completion of this thesis would not have been
possible without her never-ending patience and flexibility during my research and
writing.
I would like to acknowledge my students who were participants in this study.
Your enthusiasm and excitement toward my thesis study meant the world to me.

v
Abstract
Heather Coombs THE EFFECTS OF GRAPHIC ORGANIZERS TO IDENTIFY MAIN IDEA AND
SUPPORTING DETAILS IN INFORMATIONAL TEXT ON STUDENTS WITH
LEARNING DISABILITIES
2016-2017
Amy Accardo, Ed.D.
Masters of Arts in Special Education
The purpose of the study was to examine the effects of graphic organizers to
identify main idea and supporting details in informational text on students with learning
disabilities. The participants were eight 6th
grade students classified with learning
disabilities in reading. This study implemented an ABAB design. Data was collected
during the Baseline (A1), Intervention (B1), Baseline (A2), and Intervention (B2) phases.
The independent variable for this study was the utilization of a graphic organizer to assist
in identifying main idea and supporting details, as well as reading comprehension. The
dependent variables were student identification of main idea and supporting details and
reading comprehension. Overall, the results of the study demonstrate that the utilization
of graphic organizers is an effective intervention to increase identification of main idea
and supporting details from an informational text, and to increase reading comprehension
in students with learning disabilities.

vi
Table of Contents
Abstract ............................................................................................................................v
List of Figures ..................................................................................................................viii
List of Tables ...................................................................................................................ix
Chapter 1: Introduction ....................................................................................................1
Statement of the Problem ...........................................................................................1
Significance of the Study ...........................................................................................3
Purpose of the Study ..................................................................................................4
Research Questions ....................................................................................................5
Chapter 2: Review of the Literature .................................................................................6
Reading Profile of Students with Learning Disabilities ............................................6
Informational Text .....................................................................................................7
Main Idea ...................................................................................................................8
Graphic Organizers ....................................................................................................9
Summary ....................................................................................................................15
Chapter 3: Methodology ..................................................................................................16
Setting and Participants..............................................................................................16
Participant 1 .........................................................................................................17
Participant 2 .........................................................................................................17
Participant 3 .........................................................................................................18
Participant 4 .........................................................................................................18
Participant 5 .........................................................................................................18
Participant 6 .........................................................................................................19

vii
Table of Contents (Continued)
Participant 7 .........................................................................................................19
Participant 8 .........................................................................................................19
Procedure ...................................................................................................................20
Baseline (A1) .......................................................................................................20
Instruction ............................................................................................................21
Intervention (B1) ..................................................................................................22
Baseline (A2) .......................................................................................................23
Intervention (B2) ..................................................................................................23
Social Validity .....................................................................................................23
Variables ....................................................................................................................24
ABAB Design ............................................................................................................25
Chapter 4: Results ............................................................................................................26
Group Results.............................................................................................................26
Individual Results ......................................................................................................29
Survey Results ...........................................................................................................45
Chapter 5: Discussion ......................................................................................................48
Findings......................................................................................................................48
Limitations .................................................................................................................50
Implications................................................................................................................50
Conclusions ................................................................................................................52
References ........................................................................................................................53

viii
List of Figures
Figure Page
Figure 1. Main Idea Question Sheet ................................................................................21
Figure 2. Main Idea and Supporting Details Sheet ..........................................................22
Figure 3. Student Satisfaction Survey ..............................................................................24
Figure 4. Participant 1 Main Idea and Supporting Details Identification ........................30
Figure 5. Participant 1 Comprehension ...........................................................................31
Figure 6. Participant 2 Main Idea and Supporting Details Identification ........................32
Figure 7. Participant 2 Comprehension ...........................................................................33
Figure 8. Participant 3 Main Idea and Supporting Details Identification ........................34
Figure 9. Participant 3 Comprehension ...........................................................................35
Figure 10. Participant 4 Main Idea and Supporting Details Identification ......................36
Figure 11. Participant 4 Comprehension .........................................................................37
Figure 12. Participant 5 Main Idea and Supporting Details Identification ......................38
Figure 13. Participant 5 Comprehension .........................................................................39
Figure 14. Participant 6 Main Idea and Supporting Details Identification ......................40
Figure 15. Participant 6 Comprehension .........................................................................41
Figure 16. Participant 7 Main Idea and Supporting Details Identification ......................42
Figure 17. Participant 7 Comprehension .........................................................................43
Figure 18. Participant 8 Main Idea and Supporting Details Identification ......................44
Figure 19. Participant 8 Comprehension .........................................................................45

ix
List of Tables
Table Page
Table 1. Mean Main Idea and Supporting Details and Comprehension Data Across All
Phases ................................................................................................................27
Table 2. Student Satisfaction Survey ...............................................................................46
1
Chapter 1
Introduction
Seventy percent of secondary students struggle with reading (Biancarosa & Snow,
2006). Although they can phonetically read words, these students have difficulty
comprehending informational text (Sam & Rajan, 2013). This is also true of students
with learning disabilities, as eighty percent of these students have difficulty learning to
read and will later experience difficulty comprehending such texts (Gersten, Russell,
Fuchs, Lynn, Williams, Baker, & Scott, 2001). Despite the staggering numbers of
struggling readers in the secondary grades, content area teachers do not often focus on
reading comprehension as part of their lessons (DiCecco & Gleason, 2002). As a result,
these students may fail to determine the main idea of a text and how it is developed
throughout the text (Sam & Rajan, 2013). Struggling readers may benefit from visual
aids, like graphic organizers, to assist in the organization of new information. Graphic
organizers are one easy and fun way to help students comprehend a text (Sam & Rajan,
2013).
Statement of the Problem
The majority of students with learning disabilities have reading difficulties
(Gersten et. al, 2001). One skill that students with specific learning disabilities in reading
frequently have trouble with is identifying main idea and supporting details, as they have
difficulty separating important details from less significant details in the text (Baxendell,
2003; Gersten et. al, 2001). Students with learning disabilities need a way to organize
their thoughts and separate major and minor details gathered from a text (Gersten et. al,
2001).

2
In particular, students with learning disabilities in reading have significant
difficulty comprehending nonfiction texts (Kim, Vaughn, Wanzek, & Wei, 2004). As
students with learning disabilities move on to secondary grades, they struggle to relate
reading strategies, such as identifying main idea and supporting details, to more complex,
information-driven nonfiction text (Baxendell, 2003; DiCecco & Gleason, 2002; Kim et.
al., 2004; Sam & Rajan, 2013). Graphic organizers can be used to organize new
information and have been proven successful in assisting in the comprehension of
informational texts (Biancarosa & Snow, 2006; Kim et. al., 2004).
The students participating in this study are sixth-grade students in a high-needs,
low-income district. Each student is classified with a specific learning disability in
reading, and with a functioning reading level two or more grades below their current
grade. In general, these students are reluctant and unmotivated readers. Overall, they
prefer fiction texts and find informational text more challenging. As with most classified
students, the students in this study lack organizational and note-taking skills (Kim et. al.,
2004). They may benefit from a visual organizational tool, like a graphic organizer, to
assist in the comprehension of informational texts, specifically the identification of main
ideas and supporting details.
This study will investigate the effect of using a graphic organizer on student
identification of main idea and supporting details in informational texts. The use of
graphic organizers is a research-based strategy frequently recommended when assisting
students with learning disabilities in comprehending informational text (Kim et. al.,
2004). Informational text tends to be challenging for many secondary students, as they
often introduce new concepts and unfamiliar vocabulary (Kim et. al., 2004). When

3
applied to informational text, graphic organizers have increased the success of students
with specific learning disabilities, helping them to organize new content and information
effectively (Baxendell, 2003). In order for a graphic organizer to be successful with
students with specific learning disabilities, it must be used consistently (Baxendell,
2003). Therefore, the same graphic organizer will be applied to all of the informational
texts used throughout this study to provide a framework for the organization of key
concepts from the text.
Significance of the Study
Although much research has been done on the effect of using various types of
graphic organizers and on how to apply them to reading instruction (Kim et. al., 2004;
DiCecco & Gleason, 2002), there is little research on the effects of using graphic
organizers to support students with learning disabilities in identifying main idea and
supporting details. More studies are needed investigating the effectiveness of graphic
organizers when applied to identifying main idea and supporting details.
This study attempts to add to the existing research on graphic organizers, focusing
on their success with identification of main idea and details specifically. Identifying main
idea and supporting details is a key reading skill, necessary for the comprehension of
informational text. This study will focus on middle-school age readers who are classified
with a specific learning disability in reading and are currently functioning below grade
level. Identifying main idea and supporting details is a key reading skill, necessary for
the comprehension of nonfiction informational text.
This study builds on the research of Singleton and Filce (2015). In their article,
“Graphic Organizers for Secondary Students with Learning Disabilities,” Singleton and

4
Filce discuss the benefits of using graphic organizers with secondary students with
learning disabilities. They suggest that graphic organizers lessen the cognitive demands
placed upon these students when asked to comprehend a new text. In addition, they
recommend that graphic organizers be used along with teacher modeling to ensure that
the graphic organizer is being utilized effectively (Singleton & Filce, 2015).
Purpose of the Study
This study will investigate the use of a graphic organizer on the identification of
main idea and supporting details in nonfiction text by sixth grade students with specific
learning disabilities. Students will be given various informational texts at their individual
functioning grade levels and will be asked to identify the main idea and the supporting
details within the text. Students will be asked to do this with and without the use of a
graphic organizer.
After identifying main idea and supporting the details, students will be given a
brief multiple-choice comprehension assessment based on the text. At the end of the
study, the students will be given a survey to evaluate their satisfaction with the use of
graphic organizers to identify main idea and supporting details in nonfiction text.
The purpose of this study is to: (a) determine if the use of a graphic organizer
increases the identification of main idea and supporting details in a nonfiction text, (b)
determine if the use of a graphic organizer will increase the comprehension assessment
scores of students with specific learning disabilities in reading, and (c) evaluate student
satisfaction with using graphic organizers to identify main idea and supporting details
from a nonfiction text.

5
Research Questions
1. Will the use of a graphic organizer increase the identification of main idea and
supporting details from a nonfiction text by students with specific learning
disabilities in reading?
2. Will the use of a graphic organizer increase the comprehension assessment scores
of students with specific learning disabilities in reading?
3. Will students be satisfied with the use of a graphic organizer to identify main idea
and supporting details?

6
Chapter 2
Review of the Literature
There are an estimated 8 million students in grades four through twelve that are
not reading on grade level (Biancarosa & Snow, 2006). Although these students may be
able to physically read the words aloud, they often fail to understand the content of what
they are reading (Biancarosa & Snow, 2006). Problems with reading are even more
prevalent in the special education community, as at least 80% of students with learning
disabilities not only struggle with comprehending text, but also with decoding new words
(Gersten, et al., 2001). As a result, reading nonfiction texts becomes increasingly
difficult for students with learning disabilities throughout their academic careers. The
introduction to new vocabulary and unknown topics leads to low comprehension in these
students (Kim et al., 2004). Graphic organizers are a useful visual tool to support
students in the comprehension of these advanced texts (Singleton & Filce, 2015).
This chapter provides a review of the research related to the reading
comprehension of students with learning disabilities, particularly those in the secondary
grades. Specifically, this chapter will discuss the skill of identifying main idea and
supporting detail to comprehend text, and the utilization of graphic organizers as an
instructional strategy to support comprehension.
Reading Profile of Students with Learning Disabilities
The vast majority of students with learning disabilities (LD) have difficulties with
reading and show significant reading deficits (Boulineau, Fore, Hagan-Burke, and Burke,
2004, Gersten et al., 2001). It is estimated that 21% of secondary students with LD read
five or more grade levels below average (Solis, Ciullo, Vaughn, Pyle, Hassaram, &

7
Lerous, 2012). Specifically, students with LD in reading have difficulties in the area of
reading comprehension and often fail to actively self-monitor their comprehension
(Watson, Gable, Gear, & Hughes, 2012). Despite repeated instruction, many students
with LD fail to utilize previously-taught reading strategies when facing new text (Gajria,
Jitendra, Sood, & Sacks, 2007). Students with LD often have difficulty connecting their
prior knowledge to new information and distinguishing between essential and
nonessential information in text, particularly in challenging nonfiction texts (Singleton &
Filce, 2015).
In an article considering the problems facing students with LD who have
weakness in the area of reading comprehension, Watson, Gable, Gear, and Hughes (2012)
report that deficiencies in reading comprehension can negatively impact student
performance across curricula. A lack of academic success leads to frustration in the
classroom and in turn can lead to escape-motivated classroom behavior. In turn, truancy
and high school dropout rates are above average among students with LD. Watson et al.
(2012) recommend explicit instruction in the areas of paraphrasing, inferencing, story
mapping, and other evidence-based reading strategies. Additionally, Watson et al. (2012)
recommend that content area teachers use graphic organizers to assist students with LD in
creating an organized schema when reading informational text.
Informational Text
The goal of reading is to gain meaning from text. In elementary grades, students
learn to read, while in secondary grades, students read to learn (Gajria et al., 2007). The
purpose of reading nonfiction or informational text is typically to obtain new information
on a specific topic or concept. In general, secondary students are expected to learn this

8
new information through reading independently even when content-area textbooks are
typically written above grade level and lack clear organization (Dexter & Hughes, 2011,
Gajria, et al., 2007, Mastropieri, Scruggs, and Graetz, 2003, Singleton & Filce, 2015).
Many secondary students fail to make the switch from the teacher-led reading
instruction of elementary grades to the independent reading in the secondary grades,
especially those with LD (Dexter & Hughes, 2011, Singleton & Filce, 2015). In
secondary grades, expository texts on unfamiliar topics often include technical
vocabulary and abstract concepts, making the texts difficult for struggling readers,
particularly those with LD (Dexter & Hughes, 2011, Mastropieri et. al, 2003). Because
students with LD make up about 7% of the school-age population in the United States
(Gersten et al., 2001), teachers in the content-specific secondary grades must use tools
such as a graphic organizers to assist in their students’ comprehension of complex
nonfiction text (Dexter & Hughes, 2011, Singleton & Filce, 2015).
Main Idea
Identifying main idea in text is a key building block of a student’s reading
comprehension. Before he or she can successfully move on to other essential reading
skills, the student must be able to effectively identify the main idea of a text (Lord, 2015).
The ability to properly identify main idea aids in a student’s ability to draw inferences,
read critically, summarize, and remember what was read (Watson et al., 2012). In order
to identify the main idea, the student must be able to separate relevant information from
irrelevant information, as well as create a summative statement about the passage as a
whole (Lord, 2015).
9
Many teachers teach main idea in its beginning stages using fictional text (Lord,
2015). As students continue to secondary grades, themes of texts become a distraction
when trying to identify main idea and supporting details. Therefore, secondary teachers
should focus on nonfiction informational texts with familiar topics for their student
population (Lord, 2015). In their article, Watson et al. (2012) discuss two evidence-
based practices, Paraphrasing Strategy and Summarization Strategy. Paraphrasing
Strategy and Summarization Strategy are used as tools to teach students how to identify
main idea. Paraphrasing Strategy requires the reader to use his or her own words to state
the gist of the text, while Summarization Strategy requires the reader to eliminate
irrelevant information to condense the text. Once mastered, both strategies will assist
students with LD in identifying main idea.
Graphic Organizers
Because they are stimulated throughout their daily lives, 21st century learners are
becoming increasingly visually dependent. Therefore, many students find success in
utilizing a visual tool, like graphic organizers, to assist with reading comprehension (Sam
& Rajan, 2013). Graphic organizers can be used to alleviate some of the stress students
with LD feel when reading a complex text. Graphic organizers provide a framework to
organize new information in a meaningful way, making the task of learning new
information less daunting (DiCecco & Gleason, 2002, Singleton & Filce, 2015). Graphic
organizers are a useful tool to help students with LD to visually understand concepts
within a text, as they help students to organize new information and focus solely on
important information in the text (DiCecco & Gleason, 2002). While facilitating
learning, graphic organizers help students to create an organized schema and activate

10
prior knowledge when faced with an unfamiliar text or abstract concept (Dexter &
Hughes, 2011, Watson, et al., 2012).
A study conducted by DiCecco and Gleason (2002) to investigate the effects of
graphic organizers on attaining relational knowledge from expository texts included 24
middle school students with LD. As a result of the study, DiCecco and Gleason found
that students with LD often have difficulty in content area classes when expected to gain
new content knowledge from reading informational text, especially when reading from a
textbook, where key ideas and relationships are not made clear. In turn, they struggle to
infer, make connections, and separate key ideas from insignificant details in
informational text. Although struggles with inferencing, making connections, and
separating key ideas from insignificant details are regularly seen in secondary students
with LD, content area teachers typically do not address these reading comprehension
concerns in the classroom. Students with LD need tools and strategies put into place to
interpret information from these nonfiction texts. As a result of the study, DiCecco and
Gleason found that of the 12 students given a graphic organizer, nine increased their
relational knowledge statements with the use of graphic organizers.
Graphic organizers can be utilized by students with LD throughout the entire
reading process (Singleton & Filce, 2015). In the pre-reading stage, graphic organizers
assist in brainstorming and activating prior knowledge. During reading, graphic
organizers keep students on task, highlighting important information and distinguishing
between essential and nonessential details. In the post-reading stage, graphic organizers
can be used to recall important information, summarize key ideas, assess comprehension,
and reinforce new information from the text (Singleton & Filce, 2015). Graphic

11
organizers have shown to be effective in the following reading tasks; identifying main
idea and supporting details, understanding new vocabulary, distinguishing fact from
opinion, display connections within a text, and making inferences. The success of
graphic organizers lies in their ability to allow students to approach new information
cognitively and organize it in a meaningful manner. Graphic organizers also help
students to connect new information to prior knowledge, turning the new information into
concrete concepts (Kim et al., 2004; Sam & Rajan, 2013).
Bolineau, Fore, Hagan-Burke, and Burke (2004) conducted a study on the use of
story-mapping to increase text comprehension in elementary students with LD. Story-
mapping is used to assist students in recognizing relevant story elements and utilizes a
graphic organizer to visually organize significant information. In this study, the
participants were six students in grades 3-5 with LD. The study used an ABC design to
examine the effects of story-mapping on reading comprehension performance. After
administering baseline probes in Phase A, teachers taught the elements of story grammar
through explicit instruction utilizing a story map as a guide in Phase B. Once all students
were able to complete a story map based on key story-grammar elements with 90%
accuracy, the participants moved on to completing story maps independently in Phase C.
The maintenance data from Phase C showed improvement. From Phase A to C, the mean
percentage correct improved 53 points, from 31% to 84% correct overall. The results of
this study suggest that story-mapping improves accuracy of identifying story-grammar
elements when used by students with LD. Study results align with the findings of
DiCecco and Gleason (2002) showing the positive effects of story-mapping on the
reading comprehension of students with LD.

12
Building off of the success of the previously mentioned studies, teachers of
students with LD should consider graphic organizers as tools to facilitate critical thinking
and to prepare students for eventual independent learning, specifically gaining new
content knowledge from expository texts (Singleton & Filce, 2015). To promote the
effectiveness, teachers must explicitly model the correct usage of the graphic organizers
and demonstrate its success when applied to the task. (Singleton & Filce, 2015).
Research also suggests that graphic organizers must be used in a very specific
way to support students with LD. In order to be effective, graphic organizers need to be
specific to the task, as well as the students’ learning needs and ability levels. (Baxendell,
2003; Singleton & Filce, 2015). When choosing a graphic organizer, teachers need to
specify the task they would like the students to focus on and the graphic organizer should
correlate to the function of the task. (Singleton & Filce, 2015). In addition, graphic
organizers need to be used consistently. Students should know the type of graphic
organizer appropriate for different tasks within the classroom (Baxendell, 2003).
However, teachers should be wary of students becoming reliant on teacher-created
graphic organizers. Once mastered, students should be able to create their own task-
specific graphic organizers independently (Singleton & Filce, 2015).
Graphic organizers are evolving to meet the needs of 21st century learners.
Although many teachers use paper graphic organizers, there is a shift happening towards
computer-based graphic organizers. Mastropieri, Scruggs and Graetz (2003) conducted a
study assessing student use of a graphic organizer software, Inspiration, on the
comprehension of struggling readers. The study focused on tenth grade students in an
inclusive classroom setting and included students both with and without LD. At the

13
beginning of the study, students were given explicit instruction on how to navigate and
utilize the Inspiration software, focusing on using Inspiration to facilitate the creation of
graphic organizers. Then, the students were asked to independently create their own
graphic organizers using the Inspiration software and utilize those graphic organizers
during teacher-led lessons. Mastropieri, Scruggs, and Graetz (2003) found that
Inspiration was not only user friendly, but also showed improvement in student learning.
Pretest and posttest data indicated that the students in the study retained about 32% more
new information presented through expository history texts when allowed to use the self-
created graphic organizers, utilizing the Inspiration software. In addition, the students
studied reported having a strong preference towards using the software and indicated
future use both at home and in school. However, the teachers polled in the study showed
apprehension towards using the software and reported a lack of confidence when using it
as an instructional aid. The study calls for additional teacher training to build confidence
with instructional interventions, such as Inspiration.
Dexter and Hughes (2011) conducted a meta-analysis on graphic organizers and
students with LD and identified 16 studies investigating the impact of graphic organizers
on reading comprehension. Within the examined studies, Dexter and Hughes were able
to classify graphic organizers into 5 general categories: Cognitive Mapping, Semantic
Mapping, Sematic Feature Analysis, Syntactic/Semantic Feature Analysis, and Visual
Display. When identifying main idea and supporting details, Semantic Mapping is most
often used. Semantic Mapping assists the student in focusing on key concepts, even in
complex expository text. In Sematic Mapping, the graphic organizer helps the student to
isolate relevant information while discarding details irrelevant to the task. Through the

14
graphic organizer, teachers and students create a visual representation of the relationships
among concepts during and after reading. Typically, students are given the key concept
by the teacher. The key concept is placed in the center or top of the graphic organizer
surrounded by a box or oval. It is connected to other boxes or oval using lines, which are
meant to represent the functions mandated by the task. For example, the main idea would
be put in the center box with lines connecting to additional boxes meant to contain
supporting details. Semantic Mapping creates a visual organization of the relationships
between key ideas and concepts within a text, including main idea and supporting details
(Dexter & Hughes, 2011).
Dexter and Hughes (2011) examined the effects of graphic organizers on different
subject areas through posttest data. Through their meta-analysis, Dexter and Hughes
found that graphic organizers, when used in relation to reading comprehension for
students with LD, are successful. Large posttest effects were shown with the use of
graphic organizers in reading, specifically when utilizing Semantic Mapping. To achieve
success, Dexter and Hughes recommend that teachers deliver explicit instruction using
the graphic organizer and extensively model the use of that graphic organizer. To
validate these claims, the meta-analysis calls for more research on the use of graphic
organizers with students with LD, specifically those in the secondary grades.
The utilization of a graphic organizers may improve success when identifying
main idea and supporting details in a nonfiction text for students with LD. Success can
only be found if the graphic organizer is appropriate to the task and the students’ ability
levels (Singleton & Filce, 2015). As students become more familiar with using graphic
organizers, they should be creating their own graphic organizers for use throughout the

15
writing process and should be supported in using self-monitoring techniques (Singleton
& Filce, 2015, Watson et. al, 2012).
Summary
This study aims to investigate the effectiveness of a graphic organizer on the
identification of main idea and supporting details from a nonfiction text by students with
LD. The study will utilize a Semantic Mapping graphic organizer to assist students in
organizing new information and isolating key ideas and concepts, leading to the
successful identification of main idea and supporting details. The goal of this study is to
add to the existing research supporting the use of graphic organizers to improve the
reading comprehension of students with LD.

16
Chapter 3
Methodology
Setting and Participants
This study included eight sixth-grade students from a middle school in a low-
income, high-needs suburban school district in central New Jersey. The school district
contains five elementary schools, one middle school, one junior high school, one high
school, and one administration building. There are approximately 2,700 students in the
district; 430 of those students are currently enrolled in the district’s one middle school.
The middle school includes students in grades five and six. The typical school day at the
middle school runs for six hours and twenty-five minutes. The amount of actual
instructional time is four hours and fifty-four minutes. Of that time, the middle school
students receive 87 minutes of English Language Art instruction. The students
participating in the study also receive an additional 42 minutes of supplemental reading
instruction three times per week.
According to the New Jersey School Performance Report (New Jersey
Department of Education, 2015), 58.6% of the students in the middle school are Black,
35.6% of the students are Hispanic, 3.5% of the students are White, 2.1% of the students
are Asian and 0.2% of the students are Pacific Islander. Roughly 50% of the community
speaks English, while approximately 29% speak Spanish and 15% speak a variant of
Creole. Focusing solely on the middle school population, 14% of the students are
students with disabilities, 71.6% of the population is considered economically
disadvantaged, and 3.5% of the population is considered English Language Learners.
17
Due to the high number of economically disadvantaged students, the entire middle school
qualifies for Title I and receives state funding.
All of the students participating in this study are classified with specific learning
disabilities in reading. Although they are sixth-grade students, all of the participating
students read at a fourth-grade level. Due to their reading difficulties, these students
receive supplemental reading instruction in addition to their English language arts
classes. Also, half of the students participating in this study have 504 plans for attention
deficit hyperactivity disorder (ADHD) diagnoses or other physical disabilities.
Participant 1. JG is a sixth-grade Hispanic, female student who is currently
receiving special education services and has an Individualized Education Plan. She is
classified as having a specific learning disability in both reading and math. Currently,
she receives support from a special education teacher in math and English language arts.
Under a consultative model, she meets with a special education teacher once a week to
receive services for her remaining classes. JG is a shy, reluctant reader who currently
reads on a fourth-grade level.
Participant 2. SL is a sixth-grade Black, male student who is currently receiving
special education services and has an Individualized Education Plan. He is classified as
having a specific learning disability in reading and is also classified as visually impaired.
SL is legally blind, but wears glasses to help correct the problem. He has a 504 plan
relating to his vision, giving him preferential seating and large print when requested.
Currently, he receives support from a special education teacher in only his English
language arts class. SL is an enthusiastic reader who currently reads on a fourth-grade
level. He enjoys reading aloud in class and reads for pleasure at home.

18
Participant 3. JO is a sixth-grade Black, female student who is currently
receiving special education services and has an Individualized Education Plan. She is
classified as having a specific learning disability in both reading and math. Currently,
she receives support from a special education teacher in math and English language arts.
Under a consultative model, she meets with a special education teacher once a week to
receive services for her remaining classes. JO also receives 504 services related to her
ADHD diagnosis, inattentive type. She deals with organizational issues and has
difficulty focusing while reading. She currently reads on a fourth-grade level.
Participant 4. EP is a sixth-grade Hispanic, male student who is currently
receiving special education services and has an Individualized Education Plan. He is
classified as having a specific learning disability in reading. Currently, he receives
support from a special education teacher in only his English language arts class. EP
speaks Spanish with his family at home, but never received services as an ELL. SL
currently reads on a fourth-grade level. He is tech savvy and only reads for pleasure on
his tablet.
Participant 5. AR is a sixth-grade Hispanic, male student who is currently
receiving special education services and has an Individualized Education Plan. He is
classified as having a specific learning disability in both reading and math. Currently, he
receives support from a special education teacher in math and English language arts.
Under a consultative model, he meets with a special education teacher once a week to
receive services for his remaining classes. Although born in the United States, AR has
been classified as an ELL since Kindergarten and speaks Spanish at home. He receives

19
ELL services in English language arts only. He currently reads on a fourth-grade level.
He is unfocused in class and is reluctant to complete his schoolwork.
Participant 6. IS is a sixth-grade Hispanic, male student who is currently
receiving special education services and has an Individualized Education Plan. He is
classified as having a specific learning disability in reading. Currently, He receives
support from a special education teacher in English language arts only. IS also receives
504 services related to his ADHD diagnosis, hyperactive/impulsive type. His 504 plan
primarily addresses behavior related to his ADHD and IS’s teachers must follow a strict
behavior modification plan for him. He is negative towards reading and is reluctant to
read in class. He currently reads on a fourth-grade level.
Participant 7. JT is a sixth-grade Hispanic, female student who is currently
receiving special education services and has an Individualized Education Plan. She is
classified as having a s learning disability in both reading and math. Currently, she
receives support from a special education teacher in math and English language arts.
Under a consultative model, she meets with a special education teacher once a week to
receive services for her remaining classes. JT also receives 504 services related to her
ADHD diagnosis, combined type. Her 504 plan primarily deals with behavior related to
her ADHD. At the request of her parents, JT recently began a behavior modification plan
to improve performance in school. She is a reluctant reader, currently reading on a fourth
grade level.
Participant 8. KW is a sixth-grade Black, male student who is currently
receiving special education services and has an Individualized Education Plan. He is
classified as having a specific learning disability in both reading and math. Currently, he

20
receives support from a special education teacher in math and English language arts.
Under a consultative model, he meets with a special education teacher once a week to
receive services for his remaining classes. He currently reads on a fourth-grade level.
Procedure
The intervention was implemented over a five-week period from December 2016
to January 2017. The teacher met with the group of students three times per week for
forty-two minutes. The group of students typically met with the teacher for reading
intervention during this time. The group met Mondays, Tuesdays, and Thursdays from
9:30am to 10:12am. The group consisted of eight sixth-grade students, five male and
three female.
Baseline (A1). Sessions 1 through 3 took place over a one week period. During
these sessions, the students were assessed without the intervention and with little
guidance from the teacher. The assessment results from these sessions were used to
gather baseline data on each student in regards to their identification of main idea and
supporting details in nonfiction texts, as well as their reading comprehension of these
texts. In each session, the students were given a short, nonfiction reading passage and a
main idea and supporting details questions sheet, as well as a short reading
comprehension quiz based on the passage. The students read and completed the question
sheet and quiz independently. Figure 1 displays the main idea question sheet.

21
Figure 1. Main Idea Question Sheet
Instruction. Sessions 4 through 9 took place over a two week period. Sessions 4,
5, and 6 were instructional. During sessions 4, 5, and 6, the teacher modeled using the
graphic organizer to identify main idea and supporting details in a nonfiction text. Each
session, the teacher read a passage along with the class and completed a graphic
organizer displayed at the front of the room while reading. The teacher stopped to
explain each step and to answer student questions. After modeling, the teacher read a

22
second passage with the class, and together the class filled out the graphic organizer
while reading.
Intervention (B1). During sessions 7, 8, and 9, the students began to work
independently again. Using the intervention as it was taught to them, the students read
one passage each day while completing a graphic organizer to identify main idea and
supporting details. After reading, the students used their graphic organizer to answer the
questions on the main idea and supporting details questions sheet. Once that was
completed, the students answered 5 multiple choice questions on a quiz based on the
passage. Figure 2 displays the graphic organizer.
Figure 2. Main Idea and Supporting Details Sheet

23
Baseline (A2). Sessions 10 through 12 took place during a one-week period.
During these sessions, the intervention was removed. The students were again given a
short, nonfiction reading passage and a main idea and supporting details questions sheet,
as well as a short reading comprehension quiz based on the passage. The students read
and completed the question sheet and quiz independently without the use of a graphic
organizer.
Intervention (B2). Sessions 13 through 15 took place during a one-week period.
For these sessions, the intervention was present once again. During each session, the
students read one passage while completing a graphic organizer to identify main idea and
supporting details. After reading, the students used their graphic organizer to answer the
questions on the main idea and supporting details questions sheet. Once that was
complete, the students answered 5 multiple choice questions on a quiz based on the
passage.
Social Validity. On the last day, Session 15, the students were given a Likert
scale type survey to indicate their feelings towards the intervention. The students were
asked to answer honestly about their feelings towards using graphic organizers, in
particular using them to identify main idea and supporting details in a nonfiction text.
Figure 3 displays the survey given to the participants.

24
Figure 3. Student Satisfaction Survey
Variables
The independent variable in the study was the experimental intervention of the
utilization of a graphic organizer to assist in identifying main idea and supporting details.
This intervention aimed to increase students’ success with that skill, as well as improve
reading comprehension. The dependent variables in the study were the students’
identification of main idea and supporting details, and reading comprehension.

25
ABAB Design
This study was conducted using an ABAB design. The students were given
nonfiction texts at their reading level. After reading, they were asked to write the main
idea of the passage and three details that support it. During each phase, the student’s
comprehension was also assessed through post-reading quizzes. The students were
assessed first three times without the intervention to gain a baseline (A1). Then, they
were given direct instruction and interventions using graphic organizers. Utilizing the
graphic organizer intervention, they were assessed again three times to determine its
success (B1). Next, they were assessed without the intervention again three times (A2).
Lastly, the students were assessed again three times using graphic organizers (B2). At
the end of the study, the students completed a Likert scale based survey, reporting their
satisfaction level in regards to the use of graphic organizers to identify main idea and
supporting details.

26
Chapter 4
Results
A single subject ABAB design study was implemented to investigate the effects of a
graphic organizer on the identification of main idea and supporting details in nonfiction
text by eight, sixth-grade students with specific learning disabilities. The research
questions to be answered follow:
1. Will the use of a graphic organizer increase the identification of main idea and
supporting details from a nonfiction text by students with specific learning
disabilities in reading?
2. Will the use of a graphic organizer increase the comprehension assessment scores
of students with specific learning disabilities in reading?
3. Will students be satisfied with the use of a graphic organizer to identify main idea
and supporting details?
The students were assessed at the beginning of the study using three nonfiction
texts to gain a baseline. During each assessment, the students were instructed to identify
the main idea and three supporting details of each passage and to answer five multiple-
choice comprehension questions based on the text. Next, the students were given direct
instruction on using a graphic organizer to help identify main idea and supporting details.
The students were then assessed again three times, using the graphic organizer as a
strategy to assist in identifying main idea and supporting details. This procedure was
repeated for a second baseline and intervention phase.
Group Results
Table 1 shows the mean percentage scores for each baseline and intervention

27
stage for all eight participants. Additionally, the table shows the mean scores for the
group as a whole.
Table 1
Mean Main Idea and Supporting Details and Comprehension Data Across All Phases
MAIN IDEA AND
SUPPORTING DETAILS
IDENTIFICATION
(Mean %)
COMPREHENSION
(Mean %)
Difference
Between
Baseline
(A1) and
Intervention
(B2)
Partic-
ipant
Base
line
(A1)
Inte
rven
tion
(B1)
Base
line
(A2)
Inte
rven
tion
(B2)
Base
line
(A1)
Inte
rven
tion
(B1)
Base
line
(A2)
Inte
rven
tion
(B2)
Ma
in I
dea
an
d S
upp
ort
ing
Det
ail
s M
ean
%
Co
mp
reh
ensi
on
M
ean
%
1 100 100 100 100 73 87 80 93 0 20
2 83 100 92 92 73 100 67 93 9 20
3 0 83 16 92 60 80 67 87 92 27
4 58 92 75 100 53 80 53 80 42 27
5 0 0 0 0 60 60 60 60 0 0
6 0 0 0 0 40 73 33 67 0 27
7 100 100 100 100 33 60 40 67 0 34
8 17 92 0 83 47 80 60 73 66 26
MEAN 44.8 70.9 47.9 70.9 54.9 77.5 57.5 77.5 26.1 22.6

28
The Baseline was taken on leveled passages for each of the eight participants. All
eight participants read on a fourth-grade level. Each student read a passage on their
reading level. After reading, each student identified the main idea and three supporting
details in writing and answered 5 multiple-choice questions on a comprehension quiz.
For the identification of main idea and supporting details, the students earned one point if
they properly identifying the main idea and one point for each correct supporting detail
and their scores were a percentage out of 100. For comprehension, the students were
given one point for each correct answer and their score was a percentage out of 100.
During the Baseline Phase, the students were tested this way three times. During the
Intervention Phase, the students were tested again three times using passages on their
reading level. This time, they were asked to use a graphic organizer while reading to help
identify the main idea and supporting details in each passage. The Baseline and the
Intervention Phase were both repeated to gather additional data.
In examining the identification of main idea and supporting details, the results for
the overall group show a Baseline (A1) of 44.8%. During the first Intervention Phase
(B1), the group mean increased to 70.9%. During the second Baseline (A2), the mean
was 47.9% for the overall group. Lastly, during the second Intervention Phase (B2), the
group mean again increased to 70.9%.
In examining comprehension, the results for the overall group show a Baseline
(A1) of 54.9%. During the first Intervention Phase (B1), the group mean increased to
77.5%. During the second Baseline (A2), the mean was 57.5% for the overall group.
Lastly, during the second Intervention Phase (B2), the group mean increased again to
77.5%.
29
As a group, the mean increased 26.1 percentage points in the identification of
main idea and supporting details from the first Baseline (A1) to the second Intervention
Phase (B2). Individually, half of the participants showed no change from the first
Baseline (A1) to the second Intervention (B2). The remaining participants increased their
scores. The participants increased their mean comprehension scores 22.6 percentage
points as a group from the first Baseline (A1) to the second Intervention Phase (B2). All
participants increased their scores from Baseline (A1) to Intervention (B2) in the area of
comprehension.
Individual Results
Figure 4 illustrates the main idea and supporting detail percentage scores for
Participant 1 across all four phases. Of note, Participant 1 was included in the study
based on need in the area of comprehension only. Participant 1 did not have need in the
area of identifying main idea and supporting details as evidenced by consistent high
scores. For Baseline (A1), Participant 1 scored 100%. She consistently scored 100% for
Intervention (B1), Baseline (A2), and Intervention (B2), as well.

30
Figure 4. Participant 1 Main Idea and Supporting Details Identification
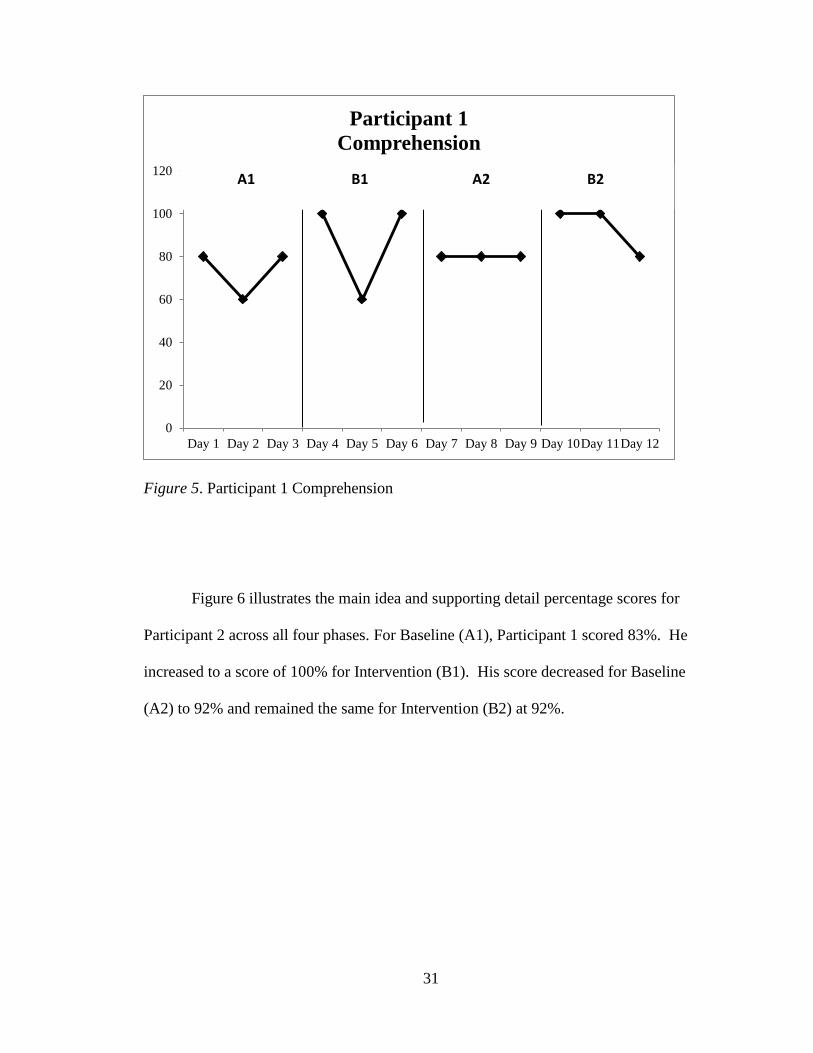
Figure 5 illustrates the comprehension percentage scores for Participant 1 across
all four phases. During Baseline (A1), she scored a mean of 73%. For Intervention (B1),
her score increased to a mean of 87%. During Baseline (A2), her score decreased to a
mean of 80%, but increased again during Intervention (B2) to 93%.
0
20
40
60
80
100
120
Day 1 Day 2 Day 3 Day 4 Day 5 Day 6 Day 7 Day 8 Day 9 Day 10Day 11Day 12
Participant 1
Main Idea and Supporting Details Identification
A1 B1 A2 B2
31
Figure 5. Participant 1 Comprehension
Figure 6 illustrates the main idea and supporting detail percentage scores for
Participant 2 across all four phases. For Baseline (A1), Participant 1 scored 83%. He
increased to a score of 100% for Intervention (B1). His score decreased for Baseline
(A2) to 92% and remained the same for Intervention (B2) at 92%.
0
20
40
60
80
100
120
Day 1 Day 2 Day 3 Day 4 Day 5 Day 6 Day 7 Day 8 Day 9 Day 10Day 11Day 12
Participant 1
Comprehension
A1 B1 A2 B2

32
Figure 6. Participant 2 Main Idea and Supporting Details Identification
Figure 7 illustrates the comprehension percentage scores for Participant 2 across
all four phases. During Baseline (A1), he scored a mean of 73%. For Intervention (B1),
his score increased to a mean of 100%. During Baseline (A2), his score decreased to a
mean of 67%, but increased again during Intervention (B2) to 93%.
0
20
40
60
80
100
120
Day 1 Day 2 Day 3 Day 4 Day 5 Day 6 Day 7 Day 8 Day 9 Day 10Day 11Day 12
Participant 2
Main Idea and Supporting Details
Identification
A1 B1 A2 B2

33
Figure 7. Participant 2 Comprehension
Figure 8 illustrates the main idea and supporting detail percentage scores for
Participant 3 across all four phases. For Baseline (A1), Participant 3 scored 0%. She
increased to a score of 83% for Intervention (B1). Her score decreased for Baseline (A2)
to 16% and increased to 92% for Intervention (B2).
0
20
40
60
80
100
120
Day 1 Day 2 Day 3 Day 4 Day 5 Day 6 Day 7 Day 8 Day 9 Day 10Day 11Day 12
Participant 2
Comprehension
A1 B1 A2 B2

34
Figure 8. Participant 3 Main Idea and Supporting Details Identification
Figure 9 illustrates the comprehension percentage scores for Participant 3 across
all four phases. During Baseline (A1), she scored a mean of 60%. For Intervention (B1),
her score increased to a mean of 80%. During Baseline (A2), her score decreased to a
mean of 67%, but increased again during Intervention (B2) to 87%.
0
20
40
60
80
100
120
Day 1 Day 2 Day 3 Day 4 Day 5 Day 6 Day 7 Day 8 Day 9 Day 10Day 11Day 12
Participant 3 Main Idea and Supporting Details
Identification

35
Figure 9. Participant 3 Comprehension
Figure 10 illustrates the main idea and supporting detail percentage scores for
Participant 4 across all four phases. For Baseline (A1), Participant 4 scored 58%. He
increased to a score of 92% for Intervention (B1). His score decreased for Baseline (A2)
to 75% and increased to 100% for Intervention (B2).
0
20
40
60
80
100
120
Day 1 Day 2 Day 3 Day 4 Day 5 Day 6 Day 7 Day 8 Day 9 Day 10Day 11Day 12
Participant 3
Comprehension

36
Figure 10. Participant 4 Main Idea and Supporting Details Identification
Figure 11 illustrates the comprehension percentage scores for Participant 4 across
all four phases. During Baseline (A1), he scored a mean of 53%. For Intervention (B1),
his score increased to a mean of 80%. During Baseline (A2), his score decreased to a
mean of 53%, but increased again during Intervention (B2) to 80%.
0
20
40
60
80
100
120
Day 1 Day 2 Day 3 Day 4 Day 5 Day 6 Day 7 Day 8 Day 9 Day 10Day 11Day 12
Participant 4
Main Idea and Supporting Details Identification

37
Figure 11. Participant 4 Comprehension
Figure 12 illustrates the main idea and supporting detail percentage scores for
Participant 5 across all four phases. For Baseline (A1), Intervention (B1), Baseline (A2),
and Intervention (B2), Participant 5 consistently scored 0% due to incorrect responses.
0
20
40
60
80
100
120
Day 1 Day 2 Day 3 Day 4 Day 5 Day 6 Day 7 Day 8 Day 9 Day 10Day 11Day 12
Participant 4
Comprehension

38
Figure 12. Participant 5 Main Idea and Supporting Details Identification
Figure 13 represents the comprehension scores of Participant 5. In the area of
comprehension, for Baseline (A1), Intervention (B1), Baseline (A2), and Intervention
(B2), Participant 5 consistently scored a mean of 60%.
0
0.1
0.2
0.3
0.4
0.5
0.6
0.7
0.8
0.9
1
Day 1 Day 2 Day 3 Day 4 Day 5 Day 6 Day 7 Day 8 Day 9 Day 10Day 11Day 12
Participant 5
Main Idea and Supporting Details Identification

39
Figure 13. Participant 5 Comprehension
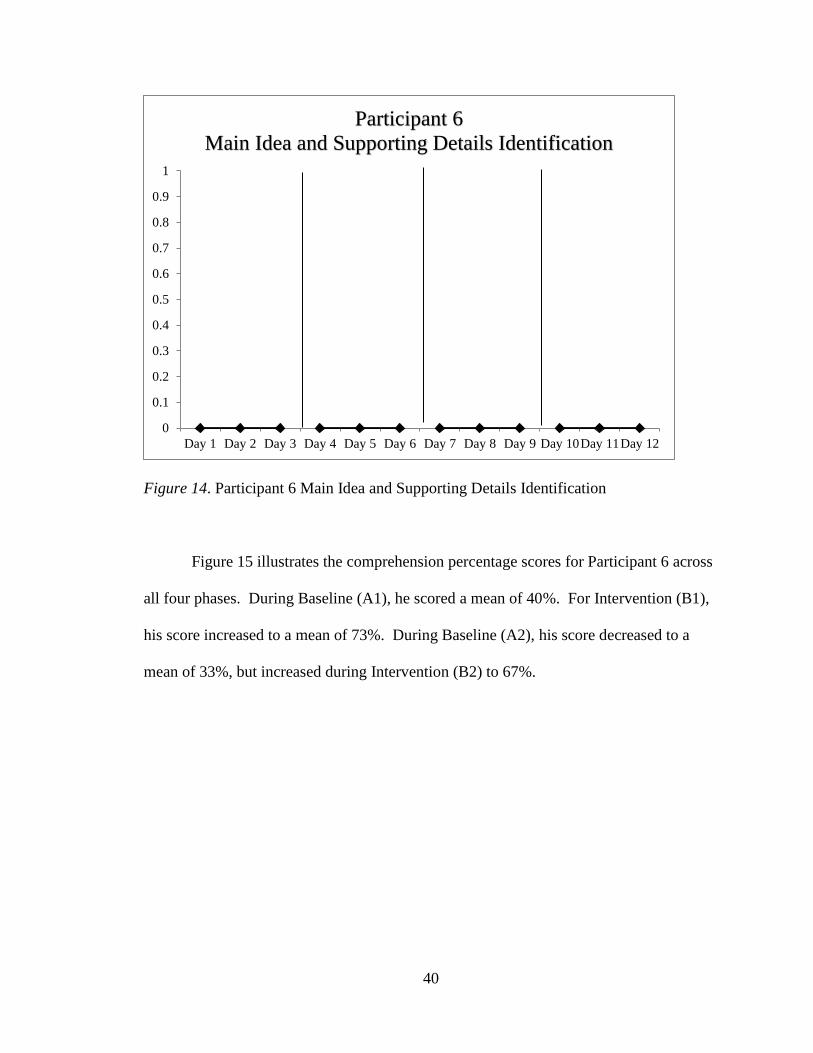
Figure 14 illustrates the main idea and supporting detail percentage scores for
Participant 6 across all four phases. For Baseline (A1), Intervention (B1), Baseline (A2),
and Intervention (B2), Participant 6 consistently scored 0% due to incorrect responses.
0
10
20
30
40
50
60
70
80
90
Day 1 Day 2 Day 3 Day 4 Day 5 Day 6 Day 7 Day 8 Day 9 Day 10Day 11Day 12
Participant 5
Comprehension
40
Figure 14. Participant 6 Main Idea and Supporting Details Identification
Figure 15 illustrates the comprehension percentage scores for Participant 6 across
all four phases. During Baseline (A1), he scored a mean of 40%. For Intervention (B1),
his score increased to a mean of 73%. During Baseline (A2), his score decreased to a
mean of 33%, but increased during Intervention (B2) to 67%.
0
0.1
0.2
0.3
0.4
0.5
0.6
0.7
0.8
0.9
1
Day 1 Day 2 Day 3 Day 4 Day 5 Day 6 Day 7 Day 8 Day 9 Day 10Day 11Day 12
Participant 6
Main Idea and Supporting Details Identification

41
Figure 15. Participant 6 Comprehension
Figure 16 illustrates the main idea and supporting detail percentage scores for
Participant 7 across all four phases. Similar to Participant 1, Participant 7 was included
in the study based on need in the area of comprehension only. Participant 7 consistently
scored 100% across all phases in the area of main idea and supporting detail.
0
10
20
30
40
50
60
70
80
90
Day 1 Day 2 Day 3 Day 4 Day 5 Day 6 Day 7 Day 8 Day 9 Day 10Day 11Day 12
Participant 6
Comprehension

42
Figure 16. Participant 7 Main Idea and Supporting Details Identification
Figure 17 illustrates the comprehension percentage scores for Participant 7 across
all four phases. During Baseline (A1), she scored a mean of 33%. For Intervention (B1),
her score increased to a mean of 60%. During Baseline (A2), her score decreased to a
mean of 40%, but increased again during Intervention (B2) to 67%.
0
20
40
60
80
100
120
Day 1 Day 2 Day 3 Day 4 Day 5 Day 6 Day 7 Day 8 Day 9 Day 10Day 11Day 12
Participant 7
Main Idea and Supporting Details Identification

43
Figure 17. Participant 7 Comprehension
Figure 18 illustrates the main idea and supporting detail percentage scores for
Participant 8 across all four phases. For Baseline (A1), Participant 8 scored 17%. He
increased to a score of 92% for Intervention (B1). His score decreased for Baseline (A2)
to 0% and increased to 83% for Intervention (B2).
0
10
20
30
40
50
60
70
Day 1 Day 2 Day 3 Day 4 Day 5 Day 6 Day 7 Day 8 Day 9 Day 10Day 11Day 12
Participant 7
Comprehension

44
Figure 18. Participant 8 Main Idea and Supporting Details Identification
Figure 19 illustrates the comprehension percentage scores for Participant 8 across
all four phases. During Baseline (A1), he scored a mean of 47%. For Intervention (B1),
his score increased to a mean of 80%. During Baseline (A2), his score decreased to a
mean of 60%, but increased during Intervention (B2) to 73%.
0
20
40
60
80
100
120
Day 1 Day 2 Day 3 Day 4 Day 5 Day 6 Day 7 Day 8 Day 9 Day 10Day 11Day 12
Participant 8
Main Idea and Supporting Details Identification

45
Figure 19. Participant 8 Comprehension
Survey Results
Research question three asked, will students be satisfied with the use of a graphic
organizer to identify main idea and supporting details? All students completed a Likert
scale satisfaction survey at the end of the study. Results were tallied and calculated into
percentages. Table 2 represents the percentage of students that responded in each
category to each statement.
0
20
40
60
80
100
120
Day 1 Day 2 Day 3 Day 4 Day 5 Day 6 Day 7 Day 8 Day 9 Day 10Day 11Day 12
Participant 8
Comprehension

46
Table 2
Student Satisfaction Survey
Statement 5
Strongly
Agree
(%)
4
Agree
(%)
3
Neutral
(%)
2
Disagree
(%)
1
Strongly
Disagree
(%)
1. I found graphic
organizers to be easy to
use.
25 50 25 0 0
2. I enjoyed using the
graphic organizer in class.
12.5 37.5 37.5 12.5 0
3. I found that the graphic
organizer helped me to
identify main idea and
supporting details.
25 37.5 25 12.5 0
4. I would rather use a
graphic organizer to assist
in identifying main idea
and supporting details
than to not use one.
12.5 12.5 75 0 0
5. The graphic organizer
was a distraction as I read.
0 0 25 25 50
6. I would use graphic
organizers in other classes
or setting to help me
manage new information.
50 37.5 12.5 0 0
7. I would use graphic
organizers to assist with
other reading skills (e.g.
summarizing, cause and
effect, sequencing, etc.)
50 37.5 0 12.5 0
8. I would recommend
using graphic organizers
to my friends.
37.5 12.5 37.5 0 12.5
Results of the survey suggest the participants were in favor of using a graphic
organizer. Fifty percent of the participants agreed with the statement, “I found graphic
organizers to be easy to use.” For the statement, “I enjoyed using the graphic organizer

47
in class,” 37.5% agreed, while 37.5% were undecided. Seventy-five percent of the
participants were undecided about the statement, “I would rather use a graphic organizer
to assist in identifying main idea and supporting details than to not use one. Fifty percent
of the participants strongly disagreed with the statement, “The graphic organizer was a
distraction as I read.” Fifty percent of the participants strongly agreed with the
statements, “I would use graphic organizers in other classes or settings to help me
manage new information” and “I would use graphic organizers to assist with other
reading skills (e.g. summarizing, cause and effect, sequencing, etc.).” For the statement,
“I would recommend using graphic organizers to my friends,” 37.5% of the participants
said that they strongly agreed, while 37.5% were undecided.

48
Chapter 5
Discussion
The purpose of this study was to evaluate the effectiveness of graphic organizers
on the identification of main idea and supporting details from nonfiction texts by students
with learning disabilities. This study utilized a single subject ABAB design to investigate
the effect graphic organizers had on the reading comprehension of eight 6th
grade
students with learning disabilities identifying main idea and supporting details in
nonfiction text. The following research questions were examined:
1) Will the use of a graphic organizer increase the identification of main idea and
supporting details from a nonfiction text by students with specific learning disabilities
in reading?
2) Will the use of a graphic organizer increase the comprehension assessment scores of
students with specific learning disabilities in reading?
3) Will students be satisfied with the use of a graphic organizer to identify main idea and
supporting details?
Findings
The results of this study show that the use of graphic organizers improved
identification of main idea and supporting details from a nonfiction text, as well as
improved the comprehension of nonfiction text, for students with LD. When graphic
organizers were used, the majority of participants improved their assessment scores.
As a group, the participants improved 26.1 mean percentage points from Baseline
(A1) to Intervention (B2) for main idea and supporting detail identification. Four of the
participants showed an improvement in main idea and supporting detail identification

49
when using the graphic organizer intervention. These findings are in alignment with the
findings of Sam and Rajan (2013) that graphic organizers are an effective visual tool to
improve the identification of main idea and supporting details. Graphic organizers assist
students in independently identifying specific information from the text and successfully
applying that information to a specific reading strategy, such as the identification of main
idea and supporting details. Two of the participants however, Participants 5 and 6, did not
show any improvement and received consistent scores of 0 throughout. Their scores
were results of incorrect responses. Participant 5’s incorrect responses may be due to a
language barrier, as he receives ELL services. Participant 6’s incorrect responses may be
due to lack of focus because of his ADHD diagnosis.
In the area of comprehension, the participants improved 22.6 mean percentage
points on their assessments from Baseline (A1) to Intervention (B2). Unlike the main
idea and supporting details identification, nearly all of the participants improved in this
area. When the graphic organizer intervention was used, 7 of 8 participants showed
growth in their comprehension assessment scores. Only one participant, Participant 5,
remained consistent with a mean score of 60% throughout. Again, this may be due to
Participant 5’s ELL classification. Findings in the area of reading comprehension in the
present study align with the findings of Kim et al. (2016) that graphic organizers improve
the reading comprehension for students with learning disabilities. This coincides with the
finding of DiCecco and Gleason (2002) that the utilization of graphic organizers by
student with learning disabilities specifically improves comprehension of informational
text.

50
Results of the Likert student satisfaction survey suggest the participants were
satisfied with the graphic organizer intervention. Overall, the participants found the
graphic organizer easy to use. They enjoyed using the graphic organizer and felt that it
helped them to identify main idea and supporting details. Also, the majority of the
participants reported they would use a graphic organizer to assist with other reading skills
and in other classes.
Limitations
There were several limitations to this study. The main limitation was time. Due
to time restraints, the study was only able to take place during a five-week period. The
study may have generated higher results had each phase lasted longer, particularly the
intervention phases.
An additional limitation was student attendance. Originally, 10 students were
participating in the study. However, two of those students had excessive absences during
the study; therefore, their data was not considered valid. The study may have shown
different outcomes with the data collected from those students.
Lastly, the study utilized various nonfiction passages, ranging in topic. Student
interest level in in the various topics covered can be considered a limitation.
Implications
This study adds to the research that implies that students with learning disabilities
benefit from using graphic organizers to improve reading skills. The successful use of
graphic organizers as an intervention to identify main idea and supporting details may
lead other educators to consider similar interventions to improve the reading
comprehension of students with LD. Teachers should create graphic organizers specific

51
to the skill being taught and should remain consistent with that graphic organizers
whenever addressing that skill. This study implies that using graphic organizers
improves the identification of main idea and supporting details in students with LD, as
well as improves their comprehension overall.
In addition, the majority of the participants in the study enjoyed using the graphic
organizers and found them easy to use. The participants also felt that the graphic
organizers helped them to identify main idea and supporting details and would both use
graphic organizers to assist with other reading skills and in other classes. Their opinions
suggest that their reading comprehension may improve overall with the continued use of
graphic organizers. Singleton and Filce (2015) recommended the utilization of graphic
organizers to support reading comprehension in students with LD. Their research implies
that students with LD will more easily attain new information from expository text when
utilizing a graphic organizer and their success with graphic organizers will improve both
student motivation and achievement across the content areas (Singleton & Filce, 2015).
In the future, more research is needed to see what specific types of graphic
organizers prove most beneficial for the identification of main idea and supporting
details. As suggested by DiCecco and Gleason (2002) additional research is needed in
the area of the use of graphic organizers, specifically to determine the effects graphic
organizer design and teacher instruction have on specific reading skills. Findings of the
present study also suggest more research is needed to determine the effects of graphic
organizers on other reading skills, particularly for students with LD.
52
Conclusions
The results of this study show an increase in the successful identification of main
idea and supporting details in nonfiction text, as well as the comprehension of nonfiction
text when a graphic organizer is used. However, the degree of increased success varied
between participants in regards to the identification of main idea and supporting details.
Overall, the results of this study revealed an increase in the identification of main idea
and supporting details from an informational text by students with learning disabilities, as
well as an increase in their comprehension of a text when a graphic organizer was used.
In addition, this study also reveals that the participants felt they benefitted from using
graphic organizers while reading informational text.

53
References
Baxendell, B. (2003). Consistent, coherent, creative: The 3 C’s of graphic organizers.
Exceptional Children 35(3), 46-53.
Biancarosa, C., & Snow, C. E. (2006). Reading next—A vision for action and research in
middle and high school literacy: A report to Carnegie Corporation of New York
(2nd ed.). Washington, DC: Alliance for Excellent Education.
Boulineau, T., Fore, C., Hagan-Burke, S., & Burke, M. D. (2004). Use of story-mapping
to increase the story-grammar text comprehension of elementary students with
learning disabilities. Learning Disability Quarterly, 27(2), 105-121.
Dexter, D. D., & Hughes, C. A. (2011). Graphic organizers and students with learning
disabilities: A meta-analysis. Learning Disability Quarterly, 34(1), 51-72.
DiCecco, V. M., & Gleason, M. M. (2002, July/August). Using graphic organizers to
attain relational knowledge from expository text. Journal of Learning Disabilities,
35(4), 306-320.
Gajria, M., Jitendra, A. K., Sood, S., & Sacks, G. (2007). Improving comprehension of
expository text in students with LD. Journal of Learning Disabilities, 40(3), 210-
225.
Gersten, R., Fuchs, L. S., Williams, J. P., & Baker, S. (2001). Teaching reading
comprehension strategies to students with learning disabilities: A review of
research. Review of Educational Research, 71(2), 279-320.
Kim, A., Vaughn, S., Wanzek, J., & Wei, S. (2004, March/April). Graphic organizers and
their effects on the reading comprehension of students with LD: A synthesis of
research. Journal of Learning Disabilities, 37(2), 105-118.
Lord, K. M. (2015). Determining the main idea: Instructional strategies that work. Kappa
Delta Pi Record,51(3), 138-142.
Mastropieri, M. A., Scruggs, T. E., & Graetz, J. E. (2003). Reading comprehension
instruction for secondary students: Challenges for struggling students and
teachers. Learning Disability Quarterly, 26(2), 103.
Sam D, P., & Rajan, P. (2013, January 9). Using graphic organizers to improve reading
comprehension for middle school ESL students. English Language Teaching,
6(2), 155-170.
Solis, M., Ciullo, S., Vaughn, S., Pyle, N., Hassaram, B., & Leroux, A. (2011). Reading
comprehension interventions for middle school students with learning
disabilities. Journal of Learning Disabilities, 45(4), 327-340.

54
Singleton, S. M., & Filce, H. G. (2015, September). Graphic organizers for secondary
students with learning disabilities. Teaching Exceptional Children,20(10), 1-8.
Watson, S. M., Gable, R. A., Gear, S. B., & Hughes, K. C. (2012). Evidence-based
strategies for improving the reading comprehension of secondary students:
Implications for students with learning disabilities. Learning Disabilities
Research & Practice, 27(2), 79-89.