the effects of food price increaseson urbanhouseholdfood commodities expenditures in ghana
DESCRIPTION
ÂTRANSCRIPT

Journal of Economics and Sustainable Development
ISSN 2222-1700 (Paper) ISSN 2222
Vol.4, No.6, 2013
The Effects of Food
Commodities Expenditures i
Department of Agricultural Economics and Agribusiness, P. O. Box LG 68, University of Ghana,
Email:
Department of Agricultural Economics and Agribusiness, P. O. Box LG 68, University of Ghana,
Legon
Abstract
The paper analyses the elasticities of urban food demand using household survey data. Expenditure endogeneity
and truncated expenditures were controlled in the estimation process using the “Augmented Regression Approach”
and Heckman two-stage procedure respectively.
education, sex, and age of household head have significant influences on food expenditures by urban households.
The marginal expenditure shares show that cereals and
to constitute important share of Ghanaian urban food expenditure as they collectively constitute about 78% of
future food expenditure.The study finds that urbanisation generally presents market opp
local economy, and this potential can fully be exploited if appropriate agricultural policy is focused on increasing
food production rather than guaranteed prices.
Key words: Ghana, Urban, LAIDS, Demand, Food, Elasticities
1. Introduction
Ghana’s urban1 population has been increasing rapidly since 1970’s. According to the Ghana Statistical Service
(GSS, 2012) report, 50.9 percent of Ghanaians live in urban areas as at 2010 and this proportion has been
projected to reach 63 percentby 2025.Urbanisationmaypose a threat to household food security and demand if
the rate of increase in urban population does not correspond to increases in food supply by the largely rural
producers.Urban food demand outstripping food supply may result in food
phenomenon is the contribution of the increase in population of India and China to rising global food prices in
China (Zezzaet al. 2009).On the other hand, rising urban population also expands the market for rural food
products and thus an opportunity for thriving agribusinesses.
The average annual growth rate of Ghana’s urban population within the last decade has been 3.4 percent (GSS,
2012) and GDP growth rate recorded 13.6 percent in 2011 (GoG, 2012).Population and econ
up urbanisation which results in increase in demand for food. Ghana recently attained middle
likely due to rising incomes. It is expected that expenditure patterns particularly on food items will also change.
Urban households generally have higher income than rural households and hence are likely to consume more
high valued foods than low valued foods.
Urban households are mainly net buyers of food. An average of 40.4 percent of household income is spent on
food in Ghana (GSS, 2008). Ghanaian urban households involved in agriculture are estimated to be 28.2 percent
of urban households (GSS, 2008).There is limited information onurban food demand in Ghana. This
paperattempts to bridge the knowledge gap in urban food demand in Gh
households as more vulnerable to food price increases(Ackah & Appleton, 2007; Haq
1Urban area is defined to be a settlement of at least 5000 inhabitants
d Sustainable Development
1700 (Paper) ISSN 2222-2855 (Online)
70
ood Price Increaseson UrbanHousehold
Commodities Expenditures in Ghana
Yaw Bonsu Osei-Asare (Corresponding author)
Department of Agricultural Economics and Agribusiness, P. O. Box LG 68, University of Ghana,
Legon-Accra, Ghana.
Email:[email protected], Tel: +233 (0) 275515517
Mark Eghan
Department of Agricultural Economics and Agribusiness, P. O. Box LG 68, University of Ghana,
Legon-Accra, Ghana., Email: [email protected]
The paper analyses the elasticities of urban food demand using household survey data. Expenditure endogeneity
and truncated expenditures were controlled in the estimation process using the “Augmented Regression Approach”
tage procedure respectively. Household demographic characteristics such as household size,
education, sex, and age of household head have significant influences on food expenditures by urban households.
The marginal expenditure shares show that cereals and bread,roots and tubers, fish and vegetables will continue
to constitute important share of Ghanaian urban food expenditure as they collectively constitute about 78% of
future food expenditure.The study finds that urbanisation generally presents market opp
local economy, and this potential can fully be exploited if appropriate agricultural policy is focused on increasing
food production rather than guaranteed prices.
Ghana, Urban, LAIDS, Demand, Food, Elasticities
population has been increasing rapidly since 1970’s. According to the Ghana Statistical Service
(GSS, 2012) report, 50.9 percent of Ghanaians live in urban areas as at 2010 and this proportion has been
025.Urbanisationmaypose a threat to household food security and demand if
the rate of increase in urban population does not correspond to increases in food supply by the largely rural
producers.Urban food demand outstripping food supply may result in food price increases. Evidence of this
phenomenon is the contribution of the increase in population of India and China to rising global food prices in
. 2009).On the other hand, rising urban population also expands the market for rural food
ducts and thus an opportunity for thriving agribusinesses.
The average annual growth rate of Ghana’s urban population within the last decade has been 3.4 percent (GSS,
2012) and GDP growth rate recorded 13.6 percent in 2011 (GoG, 2012).Population and econ
up urbanisation which results in increase in demand for food. Ghana recently attained middle
likely due to rising incomes. It is expected that expenditure patterns particularly on food items will also change.
s generally have higher income than rural households and hence are likely to consume more
high valued foods than low valued foods.
Urban households are mainly net buyers of food. An average of 40.4 percent of household income is spent on
, 2008). Ghanaian urban households involved in agriculture are estimated to be 28.2 percent
of urban households (GSS, 2008).There is limited information onurban food demand in Ghana. This
paperattempts to bridge the knowledge gap in urban food demand in Ghana. Several studies cite urban
households as more vulnerable to food price increases(Ackah & Appleton, 2007; Haqet al.,
Urban area is defined to be a settlement of at least 5000 inhabitants.
www.iiste.org
HouseholdFood
n Ghana
Department of Agricultural Economics and Agribusiness, P. O. Box LG 68, University of Ghana,
Tel: +233 (0) 275515517
Department of Agricultural Economics and Agribusiness, P. O. Box LG 68, University of Ghana,
The paper analyses the elasticities of urban food demand using household survey data. Expenditure endogeneity
and truncated expenditures were controlled in the estimation process using the “Augmented Regression Approach”
Household demographic characteristics such as household size,
education, sex, and age of household head have significant influences on food expenditures by urban households.
bread,roots and tubers, fish and vegetables will continue
to constitute important share of Ghanaian urban food expenditure as they collectively constitute about 78% of
future food expenditure.The study finds that urbanisation generally presents market opportunities for Ghana’s
local economy, and this potential can fully be exploited if appropriate agricultural policy is focused on increasing
population has been increasing rapidly since 1970’s. According to the Ghana Statistical Service
(GSS, 2012) report, 50.9 percent of Ghanaians live in urban areas as at 2010 and this proportion has been
025.Urbanisationmaypose a threat to household food security and demand if
the rate of increase in urban population does not correspond to increases in food supply by the largely rural
price increases. Evidence of this
phenomenon is the contribution of the increase in population of India and China to rising global food prices in
. 2009).On the other hand, rising urban population also expands the market for rural food
The average annual growth rate of Ghana’s urban population within the last decade has been 3.4 percent (GSS,
2012) and GDP growth rate recorded 13.6 percent in 2011 (GoG, 2012).Population and economic growth spurs
up urbanisation which results in increase in demand for food. Ghana recently attained middle-income status
likely due to rising incomes. It is expected that expenditure patterns particularly on food items will also change.
s generally have higher income than rural households and hence are likely to consume more
Urban households are mainly net buyers of food. An average of 40.4 percent of household income is spent on
, 2008). Ghanaian urban households involved in agriculture are estimated to be 28.2 percent
of urban households (GSS, 2008).There is limited information onurban food demand in Ghana. This
ana. Several studies cite urban
et al., 2008;Sadoulet &

Journal of Economics and Sustainable Development
ISSN 2222-1700 (Paper) ISSN 2222
Vol.4, No.6, 2013
Janvry, 2009;Muhammedet al., 2010
what will be the future trend of urban food demand? How do increases in food prices affect urban household
food demand? The paper assesses the effects of increase in food prices on urban household food consumption in
Ghana. Specifically, the study estimates price and incom
using household data from the Ghana Living Standard Survey Fifth round (GLSS5).
The estimated elasticities of demand obtained in the study will be relevant in analysing the impacts of domestic
trade by urban households in the Ghanaian economy. A thorough understanding of the nature of food expenditure
patterns and how these patterns change over time has the potential ofinfluencing the design of appropriate
policies that will improve food security in u
should direct food policy in terms of providing adequate market for food products in Ghana. The demand
parameters help to understand the food demand structure of Ghana. Furthermore, the esti
provide a useful framework for analysing the impacts of food policies on households in general. It is therefore
imperative to examine how urban consumers react to changes in food prices. The rest of the paper is structured
as follows: section 2 outlines the Linear Almost Ideal Demand Systems (LAIDS)model specification. In section
3, the description of the data is presented whilstsection 4 presents and discusses the results of the LAIDS model.
Section 5 presents the conclusions of the pa
2. Model Specification and Estimation
2.1. Almost Ideal Demand System (AIDS)
The AIDS model has been widely applied in empirical demand studies since its conception in 1980. According to
Buse (1994), a closer examination of 207 accessible citations
used the Linear Approximate version of the AIDS model and that 23 of the 25 papers used the LA/AIDS model
for estimating demand functions. Following Deaton and Muellbauer (1980), the AIDS model is specified
�� � �� � ∑ �� log � � �� log (�P
wherewi is the budget share devoted to commodity i in the commodity groups, p
commodity j,� is total expenditure of the household on foo
estimated with � as the error term of the model. P is a translog price index defined by:
log P � �� � ∑ �� log � � �� ∑ ∑ ���
The use of the price index in (2) raises estimation difficulties caused by the non
Originally, Deaton and Muellbauer (1980) suggested the use of Stone’s price index defined by:
log � � ∑ ������ log �
but the use of stone’s price index causes a problem of simultaneity in the model because, the budget share (w
serves as both dependent and independent variable in the model (Eales & Unnevehr, 1988; and Moschini,
1995). Following Moschini (1995), a Laspeyres pri
According to Moschini(1995) the Laspeyres price index is specified as:
log���� � ∑ ������� log����
Where��� is the geometric mean budget share of the
Substituting equation (4) into the AIDS model (1) gives the Linearised Almost Ideal Demand System (LAIDS)
as :
�� � ��� � ∑ �� log � � ���ln(�)
where ��� � �� � ����� � ∑ �����retain their previous interpretation.
d Sustainable Development
1700 (Paper) ISSN 2222-2855 (Online)
71
et al., 2010; and Alem & Soderbom, 2012). As Ghana’s urban population increases,
future trend of urban food demand? How do increases in food prices affect urban household
food demand? The paper assesses the effects of increase in food prices on urban household food consumption in
Ghana. Specifically, the study estimates price and income elasticities of demand for eleven food groups in Ghana
using household data from the Ghana Living Standard Survey Fifth round (GLSS5).
The estimated elasticities of demand obtained in the study will be relevant in analysing the impacts of domestic
by urban households in the Ghanaian economy. A thorough understanding of the nature of food expenditure
patterns and how these patterns change over time has the potential ofinfluencing the design of appropriate
policies that will improve food security in urban Ghana.The knowledge of the pattern of urban food consumption
should direct food policy in terms of providing adequate market for food products in Ghana. The demand
parameters help to understand the food demand structure of Ghana. Furthermore, the esti
provide a useful framework for analysing the impacts of food policies on households in general. It is therefore
imperative to examine how urban consumers react to changes in food prices. The rest of the paper is structured
section 2 outlines the Linear Almost Ideal Demand Systems (LAIDS)model specification. In section
3, the description of the data is presented whilstsection 4 presents and discusses the results of the LAIDS model.
Section 5 presents the conclusions of the paper.
Model Specification and Estimation
Almost Ideal Demand System (AIDS)
The AIDS model has been widely applied in empirical demand studies since its conception in 1980. According to
Buse (1994), a closer examination of 207 accessible citations revealed that 68 of the 89 empirical applications
used the Linear Approximate version of the AIDS model and that 23 of the 25 papers used the LA/AIDS model
for estimating demand functions. Following Deaton and Muellbauer (1980), the AIDS model is specified
�P
) � �� (1)
is the budget share devoted to commodity i in the commodity groups, pjis the nominal price of
is total expenditure of the household on food commodities, , � �"# �are all parameters to be
as the error term of the model. P is a translog price index defined by:
� � log � log (2)
of the price index in (2) raises estimation difficulties caused by the non-linearity of parameters.
Originally, Deaton and Muellbauer (1980) suggested the use of Stone’s price index defined by:
(3)
se of stone’s price index causes a problem of simultaneity in the model because, the budget share (w
serves as both dependent and independent variable in the model (Eales & Unnevehr, 1988; and Moschini,
1995). Following Moschini (1995), a Laspeyres price index is used to substitute for the Stone’s Price index in (3).
According to Moschini(1995) the Laspeyres price index is specified as:
(4)
is the geometric mean budget share of the ith
commodity.
Substituting equation (4) into the AIDS model (1) gives the Linearised Almost Ideal Demand System (LAIDS)
)- ∑ ����� ln % � ��� (5)
�� ln &� ' and &� is the mean price of the jth
commodity, all other variables
their previous interpretation.
www.iiste.org
; and Alem & Soderbom, 2012). As Ghana’s urban population increases,
future trend of urban food demand? How do increases in food prices affect urban household
food demand? The paper assesses the effects of increase in food prices on urban household food consumption in
e elasticities of demand for eleven food groups in Ghana
The estimated elasticities of demand obtained in the study will be relevant in analysing the impacts of domestic
by urban households in the Ghanaian economy. A thorough understanding of the nature of food expenditure
patterns and how these patterns change over time has the potential ofinfluencing the design of appropriate
rban Ghana.The knowledge of the pattern of urban food consumption
should direct food policy in terms of providing adequate market for food products in Ghana. The demand
parameters help to understand the food demand structure of Ghana. Furthermore, the estimated parameters can
provide a useful framework for analysing the impacts of food policies on households in general. It is therefore
imperative to examine how urban consumers react to changes in food prices. The rest of the paper is structured
section 2 outlines the Linear Almost Ideal Demand Systems (LAIDS)model specification. In section
3, the description of the data is presented whilstsection 4 presents and discusses the results of the LAIDS model.
The AIDS model has been widely applied in empirical demand studies since its conception in 1980. According to
revealed that 68 of the 89 empirical applications
used the Linear Approximate version of the AIDS model and that 23 of the 25 papers used the LA/AIDS model
for estimating demand functions. Following Deaton and Muellbauer (1980), the AIDS model is specified as:
is the nominal price of
are all parameters to be
linearity of parameters.
Originally, Deaton and Muellbauer (1980) suggested the use of Stone’s price index defined by:
se of stone’s price index causes a problem of simultaneity in the model because, the budget share (wi)
serves as both dependent and independent variable in the model (Eales & Unnevehr, 1988; and Moschini,
ce index is used to substitute for the Stone’s Price index in (3).
Substituting equation (4) into the AIDS model (1) gives the Linearised Almost Ideal Demand System (LAIDS)
commodity, all other variables

Journal of Economics and Sustainable Development
ISSN 2222-1700 (Paper) ISSN 2222
Vol.4, No.6, 2013
For AIDS model to be consistent with demand theory, the following restrictions are imposed on the AIDS model:
Adding Up
∑ �� � 1���� ∑ �� � 0���� ∑ �� � 0����
Homogeneity
∑ �� � 0
Symmetry
�� � ��
Eleven (11) food groups are considered in this paper and the data recorded zero expenditure for some food
commodities. To account for selection bias, Heckman (1979) suggested a two
correct the potential selection bias. The Heckman procedure is estimated in two stages. The first stage involves
estimation of a dichotomous-choice probit model to calculate for the Inverse Mills Ratio (IMR) for each household.
The probit model gives the probability that a given household will consume a particular food commodity. The
second stage involves the use of the calculated IMR as an instrument in the food commodity demand model.
Following Osei-Asare (2004), the probit model is specified as
*� � �� � ��+ � ,�and
Where *� denotes the decision to consume commodity group
socio-demographic characteristics and prices with
function and an associated cumulative distribution function
from the probit model in (9). The IMR (
- � .�/,0�1�/,0�
From (5), the system of eleven demand equations to be estimated are specified as:
�� � �� � 2�+� � ��� ln � � ��� ln��3 ln 3 � ���� ln �� � ���� (11)
where ��denotesbudget share for ith
and Fat; 6= Fruits; 7= Vegetables; 8= Pulse and Nuts; 9= Roots and Tubers; 10= Food away from home(
and 11= Others), + denotes vector of socio
parameters to be estimated, 455 678denotesInverse Mills Ratio, ln expenditure, ��denotesLaspeyres price index,
The differences in household’s characteristics will result in different expenditure patterns of households.
Therefore, the need to include demographic characteristics of house
emphasised. To account for socio-
approach by Osei-Asare (2004) by applying the linearised demographic translation. This approach preserves the
linearity of the LAIDS model. The demographic translation (
2�+� � 9�:;< � 9�==>6+< � 9?><@where, AGE denotes age of household head, HHSIZE denotes household size, SEX denotes biological description
d Sustainable Development
1700 (Paper) ISSN 2222-2855 (Online)
72
For AIDS model to be consistent with demand theory, the following restrictions are imposed on the AIDS model:
0 (6)
(7)
(8)
Eleven (11) food groups are considered in this paper and the data recorded zero expenditure for some food
commodities. To account for selection bias, Heckman (1979) suggested a two-stage estimation pro
correct the potential selection bias. The Heckman procedure is estimated in two stages. The first stage involves
choice probit model to calculate for the Inverse Mills Ratio (IMR) for each household.
ives the probability that a given household will consume a particular food commodity. The
second stage involves the use of the calculated IMR as an instrument in the food commodity demand model.
Asare (2004), the probit model is specified as:
(9)
*� � A1 if commodity I is consumed 0 otherwise P
denotes the decision to consume commodity group i by a household, Z a vector of household
demographic characteristics and prices with ,�~ R�0,1�. .�+, �� , a univariate standard normal probability
function and an associated cumulative distribution function S�+, ��are formed using the estimated parameters
from the probit model in (9). The IMR (-) is derived by:
(10)
From (5), the system of eleven demand equations to be estimated are specified as:
� � ��? ln ? � ��T ln T � ��U ln U ���V ln V � ��W�� ln �� � ��Xln��/���Z � -�678 � [� 455 � ��
th commodity group (1= Bread and Cereals; 2=Meat; 3= Fish; 4= Dairy; 5 = Oils
and Fat; 6= Fruits; 7= Vegetables; 8= Pulse and Nuts; 9= Roots and Tubers; 10= Food away from home(
denotes vector of socio-economic variables for the ith
equation,
denoteserror term instrument used to correct expenditure endogeneity,
�denoteslogarithm of price for the ith
commodity group,
speyres price index, ��denotes a constant for the ith
food commodity group.
The differences in household’s characteristics will result in different expenditure patterns of households.
Therefore, the need to include demographic characteristics of households in demand models cannot be over
-demographic effects on urban food expenditures, this paper follows the
Asare (2004) by applying the linearised demographic translation. This approach preserves the
The demographic translation (2�+�) is expressed as:
><@ � 9T<2\ (12)
where, AGE denotes age of household head, HHSIZE denotes household size, SEX denotes biological description
www.iiste.org
For AIDS model to be consistent with demand theory, the following restrictions are imposed on the AIDS model:
Eleven (11) food groups are considered in this paper and the data recorded zero expenditure for some food
stage estimation procedure to
correct the potential selection bias. The Heckman procedure is estimated in two stages. The first stage involves
choice probit model to calculate for the Inverse Mills Ratio (IMR) for each household.
ives the probability that a given household will consume a particular food commodity. The
second stage involves the use of the calculated IMR as an instrument in the food commodity demand model.
by a household, Z a vector of household
, a univariate standard normal probability
are formed using the estimated parameters
W ln W � ��] ln ] �
s; 2=Meat; 3= Fish; 4= Dairy; 5 = Oils
and Fat; 6= Fruits; 7= Vegetables; 8= Pulse and Nuts; 9= Roots and Tubers; 10= Food away from home(FAFH);
equation, , �, [ �"# - denote
denoteserror term instrument used to correct expenditure endogeneity,
commodity group, � denotestotal food
food commodity group.
The differences in household’s characteristics will result in different expenditure patterns of households.
holds in demand models cannot be over
demographic effects on urban food expenditures, this paper follows the
Asare (2004) by applying the linearised demographic translation. This approach preserves the
where, AGE denotes age of household head, HHSIZE denotes household size, SEX denotes biological description

Journal of Economics and Sustainable Development
ISSN 2222-1700 (Paper) ISSN 2222
Vol.4, No.6, 2013
of household head (1=male, 0=otherwise)
education, 1= primary, 2= J.S.S/M.S.L.C, 3= S.S.S/vocational, 4= technical/training colleges and 5= tertiary).
Expenditure endogeneity is controlled using the Augmented Regression Approach pro
Robin (1999).To avoid singular matrix during estimation due to the use of budget share equations, the demand
equation of “other food” is dropped from the system of demand equations. The parameters of the omitted budget
share equation are retrieved by using the property of adding
aggregates are estimated simultaneously by using the Zellner’s Seemingly Unrelated Regressions (SUR)
procedure with STATA version 11.
Following Ackah and Appleton (2007), the elasticities are computed at sample means as follows:
(i) Expenditure Elasticity
^� � _ `ab cd_ `ab � � 1 � e �
fdg e _fd
_ `ab �g � 1
(ii) Marshallian (Uncompensated) Elasticity
4� � _ `ab cd_ `ab hi
� �9� � e �fd
g j _fd_ `ab hi
k
(iii) Hicksian (Compensated) price elasticity as estimated from the Slutsky equation:
,�� � 4� � ^��
(iv) Marginal Expenditure shares (Abdulai
l� � ^���
where9� is the Kronecker delta defined by:
9� � A 1 for I � m 0 0therwise
P
3. Data
The Ghana Living Standard Survey Round Five (GLSS5) developed by the Ghana Statistical Service (GS
the main expenditure data set utilised. The GLSS is a multi
information on different dimensions of living conditions of Ghanaians. The GLSS has enough information to
estimate total food consumption of each household in the form of expenditure on the commodities consumed.
The GLSS5 sampled 8,687 households that were interviewed between September 2005 and September 2006:3618
(41.65%) of households lived in urban areas. Exactly 2935 urban households wer
management processes. The regional distribution of the sample is presented in Table 1.
Individual food commodities were aggregated into eleven (11) food groups: Bread & Cereals, Tubers & Roots, Fish,
Meat, Oils & Fats, Nuts & Pulse, Dairy, Vegetables, Fruits,
“Others” food group is used to represent all other food commodities that do not fall under any of these aggregates.
The price data from GSS was collected separately since t
markets. Hence, the regional average retail prices of fifty
community prices. These individual prices were later weighted by the respective geome
commodity to compute the aggregate commodity prices using the Laspeyres price index. The prices for these
commodities for the years 2005 and 2006 were used for the analysis.
4. Results and Discussions
d Sustainable Development
1700 (Paper) ISSN 2222-2855 (Online)
73
of household head (1=male, 0=otherwise), EDU denotes educational level of household head (0= no formal
education, 1= primary, 2= J.S.S/M.S.L.C, 3= S.S.S/vocational, 4= technical/training colleges and 5= tertiary).
Expenditure endogeneity is controlled using the Augmented Regression Approach proposed by Blundell and
Robin (1999).To avoid singular matrix during estimation due to the use of budget share equations, the demand
equation of “other food” is dropped from the system of demand equations. The parameters of the omitted budget
are retrieved by using the property of adding-up. The demand model for the remaining ten food
aggregates are estimated simultaneously by using the Zellner’s Seemingly Unrelated Regressions (SUR)
n (2007), the elasticities are computed at sample means as follows:
1 � e0dfd
g (13)
Marshallian (Uncompensated) Elasticity
k � �9� � endif�d
g � e0df�d
g ��
Hicksian (Compensated) price elasticity as estimated from the Slutsky equation:
(15)
Marginal Expenditure shares (Abdulai et al.,1999):
(16)
is the Kronecker delta defined by:
The Ghana Living Standard Survey Round Five (GLSS5) developed by the Ghana Statistical Service (GS
the main expenditure data set utilised. The GLSS is a multi-purpose survey of households in Ghana that collects
information on different dimensions of living conditions of Ghanaians. The GLSS has enough information to
of each household in the form of expenditure on the commodities consumed.
GLSS5 sampled 8,687 households that were interviewed between September 2005 and September 2006:3618
(41.65%) of households lived in urban areas. Exactly 2935 urban households were used for the analysis after data
management processes. The regional distribution of the sample is presented in Table 1.
Individual food commodities were aggregated into eleven (11) food groups: Bread & Cereals, Tubers & Roots, Fish,
ts & Pulse, Dairy, Vegetables, Fruits, Food away from home (FAFH)
“Others” food group is used to represent all other food commodities that do not fall under any of these aggregates.
The price data from GSS was collected separately since the GLSS5 did not capture commodity prices at the local
markets. Hence, the regional average retail prices of fifty-eight (58) food commodities were used to substitute for
community prices. These individual prices were later weighted by the respective geome
commodity to compute the aggregate commodity prices using the Laspeyres price index. The prices for these
commodities for the years 2005 and 2006 were used for the analysis.
www.iiste.org
, EDU denotes educational level of household head (0= no formal
education, 1= primary, 2= J.S.S/M.S.L.C, 3= S.S.S/vocational, 4= technical/training colleges and 5= tertiary).
posed by Blundell and
Robin (1999).To avoid singular matrix during estimation due to the use of budget share equations, the demand
equation of “other food” is dropped from the system of demand equations. The parameters of the omitted budget
up. The demand model for the remaining ten food
aggregates are estimated simultaneously by using the Zellner’s Seemingly Unrelated Regressions (SUR)
n (2007), the elasticities are computed at sample means as follows:
(14)
Hicksian (Compensated) price elasticity as estimated from the Slutsky equation:
The Ghana Living Standard Survey Round Five (GLSS5) developed by the Ghana Statistical Service (GSS) is
purpose survey of households in Ghana that collects
information on different dimensions of living conditions of Ghanaians. The GLSS has enough information to
of each household in the form of expenditure on the commodities consumed.
GLSS5 sampled 8,687 households that were interviewed between September 2005 and September 2006:3618
e used for the analysis after data
Individual food commodities were aggregated into eleven (11) food groups: Bread & Cereals, Tubers & Roots, Fish,
FAFH) and “Others”. The
“Others” food group is used to represent all other food commodities that do not fall under any of these aggregates.
he GLSS5 did not capture commodity prices at the local
eight (58) food commodities were used to substitute for
community prices. These individual prices were later weighted by the respective geometric mean of that food
commodity to compute the aggregate commodity prices using the Laspeyres price index. The prices for these

Journal of Economics and Sustainable Development
ISSN 2222-1700 (Paper) ISSN 2222
Vol.4, No.6, 2013
4.1 Description of Socio-Demogra
The socio-demographic characteristics of the sample are summarised in Table 2.The majority (72%) of the sample
were males. The majority of the sampled household heads were aged between 25 and 54 years collectively
constituting about 76.5% of the sample. The age distribution of the sample shows that the majority of household
heads are in the active labour force. Majority of the households had 1 to 3 persons per household and about 45.1%
of the sample had household size greater or equal to the
Very few (0.2%) of the sampled household heads had no formal education whilst the majority (51.3%) of the
sample had Junior Secondary School or Middle School education. The sample showed that only 12.5% of the
household heads had attained tertiary level of education. In general, about 88% of the household heads in the
sample had attained at least basic education.
4.2 Demographic Effects of LAIDS Model
The parameter estimates for the LAIDS model are presented in T
equations were significant at 1 percent significance level. Themagnitudes of the coefficients of the demographic
characteristics have no direct economic interpretations. However, the signs of the coefficien
the relationship between the variables and the budget shares. The discussions will therefore be focused on the
relationships.
For cereals and bread equation, all the socio
levelfor age, sex and household size, and at 10 percent significant level for educational level of household head.
Sex of the household head is the most influential factor as it recorded a higher coefficient value of
implying that male household heads have a lower budget share on cereals food group in Ghana. Apart from
household size, all the other factors had a negative relationship with budget share on cereals and bread food
group. Household size having positive relationship with budget s
cereals is a major staple food group of Ghanaian households and as expected, household size increases results in
increases in household budget for cereals.
The meat equation also recorded significant level
expenditures. All the socio-demographic characteristics were significant at 1 percent significance level except
age of household head which was significant at 10 percent significance level. Again, apart f
head, all other variables had positive relationship with budget shares on meat. Female
have more budget shares allocated to meat than male
shares on meat also increases, this result was not expected because meat is a high valued food commodity and as
such, as household size increases, ceteris paribus, the percapita expenditure within a particular household is
expected to fall and hence budget share on meat
had positive relationship with meat food group. Ceteris paribus, higher education should be commensurable with
good jobs and thus leading to higher incomes, and meat being a high valued food
expected that higher educated household heads would spend more on meat.
Fish, one of the important sources of protein in Ghanaian diet, has all the householdsocio
characteristics influencing the allocation of budget shar
had no significant influence on fish budget shares. As household size increases, budget share on fish also
increases. Similarly, as the age of household head increases, the budget shares on fish comm
increases. For dairy equation, only sex and educational level of household heads influence budget shares on
dairy significantly. Female-headed households tend to have higher budget shares on dairy than male
households. Educational level is positively related to budget shares on dairy.
All other demographic variables influence budget shares of fruits and vegetables at 5 percent significant
levelsexcept age of household head. More educated household heads spend higher budget shares on fru
household heads with lower education whiles larger households spend less budget on fruits. With regards to
vegetable consumption, increases in both household size and age of household head results in increases of
expenditure allocation on with vegetable consumption whiles educational level has negative effect on vegetable
consumption. Male-headed households consume less vegetables than female headed households whilst they
rather expend more on fruit consumption.
d Sustainable Development
1700 (Paper) ISSN 2222-2855 (Online)
74
Demographic Variables
demographic characteristics of the sample are summarised in Table 2.The majority (72%) of the sample
were males. The majority of the sampled household heads were aged between 25 and 54 years collectively
the sample. The age distribution of the sample shows that the majority of household
heads are in the active labour force. Majority of the households had 1 to 3 persons per household and about 45.1%
of the sample had household size greater or equal to the national average of 4 persons per household.
Very few (0.2%) of the sampled household heads had no formal education whilst the majority (51.3%) of the
sample had Junior Secondary School or Middle School education. The sample showed that only 12.5% of the
ousehold heads had attained tertiary level of education. In general, about 88% of the household heads in the
sample had attained at least basic education.
Demographic Effects of LAIDS Model
The parameter estimates for the LAIDS model are presented in Table 3. The chi-squares for all the ten estimated
equations were significant at 1 percent significance level. Themagnitudes of the coefficients of the demographic
characteristics have no direct economic interpretations. However, the signs of the coefficien
the relationship between the variables and the budget shares. The discussions will therefore be focused on the
For cereals and bread equation, all the socio-demographic characteristics were significant at 1 percent si
levelfor age, sex and household size, and at 10 percent significant level for educational level of household head.
Sex of the household head is the most influential factor as it recorded a higher coefficient value of
sehold heads have a lower budget share on cereals food group in Ghana. Apart from
household size, all the other factors had a negative relationship with budget share on cereals and bread food
group. Household size having positive relationship with budget share on cereal is not surprising. This is because,
cereals is a major staple food group of Ghanaian households and as expected, household size increases results in
increases in household budget for cereals.
The meat equation also recorded significant levels of socio-demographic influences on household meat
demographic characteristics were significant at 1 percent significance level except
age of household head which was significant at 10 percent significance level. Again, apart f
head, all other variables had positive relationship with budget shares on meat. Female-headed households tend to
have more budget shares allocated to meat than male-headed households. As household size increases, budget
also increases, this result was not expected because meat is a high valued food commodity and as
such, as household size increases, ceteris paribus, the percapita expenditure within a particular household is
expected to fall and hence budget share on meat will also fall. As expected, educational level of household head
had positive relationship with meat food group. Ceteris paribus, higher education should be commensurable with
good jobs and thus leading to higher incomes, and meat being a high valued food commodity, it should be
expected that higher educated household heads would spend more on meat.
Fish, one of the important sources of protein in Ghanaian diet, has all the householdsocio
characteristics influencing the allocation of budget shares to it except educational level of household head that
had no significant influence on fish budget shares. As household size increases, budget share on fish also
increases. Similarly, as the age of household head increases, the budget shares on fish comm
increases. For dairy equation, only sex and educational level of household heads influence budget shares on
headed households tend to have higher budget shares on dairy than male
is positively related to budget shares on dairy.
All other demographic variables influence budget shares of fruits and vegetables at 5 percent significant
levelsexcept age of household head. More educated household heads spend higher budget shares on fru
household heads with lower education whiles larger households spend less budget on fruits. With regards to
vegetable consumption, increases in both household size and age of household head results in increases of
etable consumption whiles educational level has negative effect on vegetable
headed households consume less vegetables than female headed households whilst they
rather expend more on fruit consumption.
www.iiste.org
demographic characteristics of the sample are summarised in Table 2.The majority (72%) of the sample
were males. The majority of the sampled household heads were aged between 25 and 54 years collectively
the sample. The age distribution of the sample shows that the majority of household
heads are in the active labour force. Majority of the households had 1 to 3 persons per household and about 45.1%
national average of 4 persons per household.
Very few (0.2%) of the sampled household heads had no formal education whilst the majority (51.3%) of the
sample had Junior Secondary School or Middle School education. The sample showed that only 12.5% of the
ousehold heads had attained tertiary level of education. In general, about 88% of the household heads in the
squares for all the ten estimated
equations were significant at 1 percent significance level. Themagnitudes of the coefficients of the demographic
characteristics have no direct economic interpretations. However, the signs of the coefficient tell the direction of
the relationship between the variables and the budget shares. The discussions will therefore be focused on the
demographic characteristics were significant at 1 percent significant
levelfor age, sex and household size, and at 10 percent significant level for educational level of household head.
Sex of the household head is the most influential factor as it recorded a higher coefficient value of -0.023
sehold heads have a lower budget share on cereals food group in Ghana. Apart from
household size, all the other factors had a negative relationship with budget share on cereals and bread food
hare on cereal is not surprising. This is because,
cereals is a major staple food group of Ghanaian households and as expected, household size increases results in
demographic influences on household meat
demographic characteristics were significant at 1 percent significance level except
age of household head which was significant at 10 percent significance level. Again, apart from sex of household
headed households tend to
headed households. As household size increases, budget
also increases, this result was not expected because meat is a high valued food commodity and as
such, as household size increases, ceteris paribus, the percapita expenditure within a particular household is
will also fall. As expected, educational level of household head
had positive relationship with meat food group. Ceteris paribus, higher education should be commensurable with
commodity, it should be
Fish, one of the important sources of protein in Ghanaian diet, has all the householdsocio-demographic
es to it except educational level of household head that
had no significant influence on fish budget shares. As household size increases, budget share on fish also
increases. Similarly, as the age of household head increases, the budget shares on fish commodities also
increases. For dairy equation, only sex and educational level of household heads influence budget shares on
headed households tend to have higher budget shares on dairy than male-headed
All other demographic variables influence budget shares of fruits and vegetables at 5 percent significant
levelsexcept age of household head. More educated household heads spend higher budget shares on fruits than
household heads with lower education whiles larger households spend less budget on fruits. With regards to
vegetable consumption, increases in both household size and age of household head results in increases of
etable consumption whiles educational level has negative effect on vegetable
headed households consume less vegetables than female headed households whilst they
Journal of Economics and Sustainable Development
ISSN 2222-1700 (Paper) ISSN 2222
Vol.4, No.6, 2013
Roots and tubers, another staple foo
variables at 1 percent significance levels. Larger households and female headed households allocate more
budgetto roots and tubers whiles household heads with higher education have
roots and tubers. The budget share equation for FAFH food group had household size, sex and age of household
head influencing demand at 1 percent significant level with all of them having negative effects on budget shares
for FAFH.
4.3 Expenditure Elasticities and Marginal Budget Shares
The parameter estimates from the LAIDS model are used to derive the expenditure elasticities of demand for the
food groups as well as the marginal budget shares using the formulae outlined in
expenditure elasticities and the marginal budget shares are presented in Table 4. The first and second columns give
the expenditure elasticities and marginal budget shares respectively. The expenditure elasticity measures the
responsiveness of demand to a percentage change in expenditure.
All expenditure elasticities are positive. The positive expenditure elasticities imply that all the food commodities
under consideration are normal goods, meaning that expenditures on these f
This is consistent with consumer demand theory. The most expenditure elastic food group is the “others” food
group (2.613) followed, by cereals (1.3578), meat (1.3361), and roots and tubers (1.3261) with FAFH having
least expenditure elasticity.
The study finds that, as income grows in urban Ghana, expenditures on cereals, meat, vegetables and roots and
tubers are going to rise more than proportionate to income growth. As income grows as evident in consistent
growth GDP, the market potential for cereals, meat, roots and tubers and vegetables will also increase. This is a
positive signal for supply response of these food groups. With 6 out of 11 food groups registering elastic
expenditure elasticities of demand, ur
subsector in the Ghanaian economy.
The marginal budget shares measures the future allocation of any increases in income. From the estimates of the
marginal budget shares, if househol
expected to spend out of the income increase, about 24 percent on cereals and bread, 15 percent on roots and tubers,
14 percent on fish and 13 percent on vegetables.
4.4. Price Elasticities
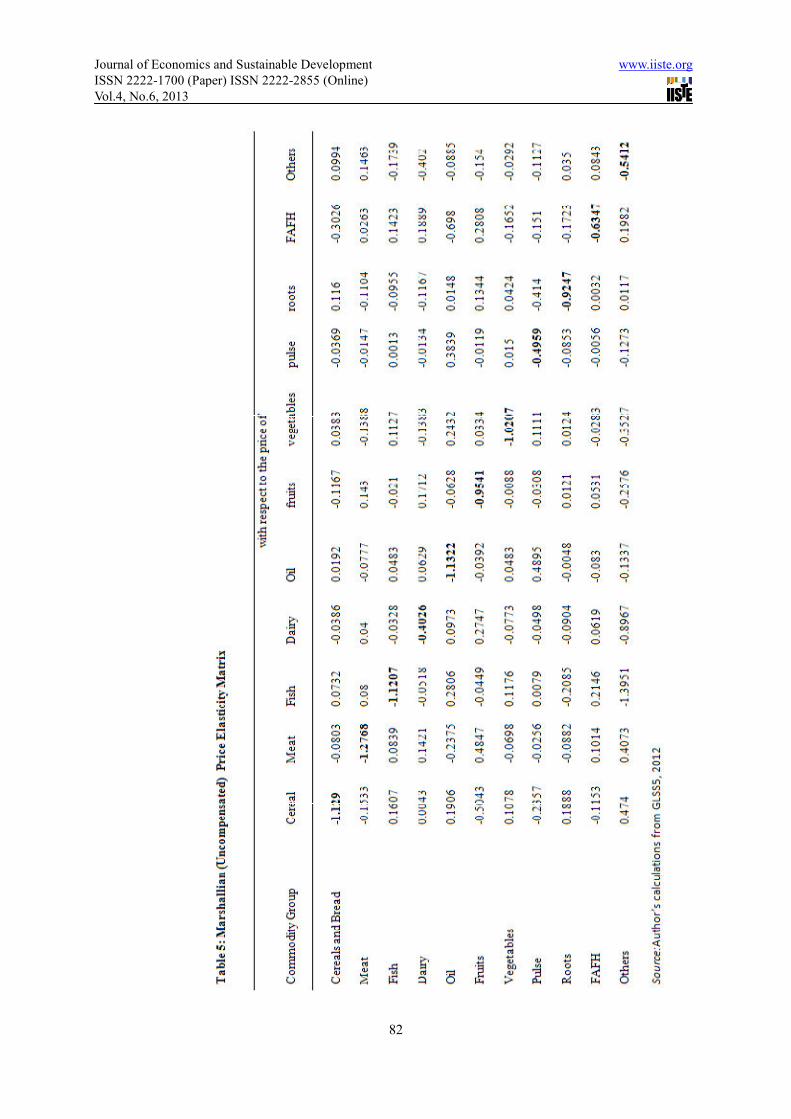
The marshallian (uncompensated) price elasticity matrix is presented in Table 5. Both own and cross price
elasticities are presented. Price elasticity of demand measures the degree of responsiveness of demand to a
percentage change in the price of a
consistent with consumer demand theory. Negative own price elasticity means that an increase in the price of the
food group results in a decrease in demand for that food group. The
along the major diagonal in Table 5. Cereals and bread, meat, fish, oils and vegetables are relatively own price
elastic whiles the rest of the food commodities are own price inelastic. Meat is highly elast
elasticity of -1.28 suggesting that when the price of meat increases by 1 percent, demand for meat will reduce by
1.28 percent and vice versa.
All cross price elasticities are inelastic as they are all less than 1 in absolute terms. This
response of one food group to changes in the price of other food groups. This result is expected because there is
less substitutability between food groups; substitutability easily occurs within food groups. Positive cross pri
elasticity implies that the commodities are substitutes while negative cross price elasticities indicate that the
commodities are compliments. The cross price elasticities are generally low in absolute values suggesting that the
degree of responsiveness of demand for one food group to the price of another food group is low.
The compensated price elasticities as presented in Table 6
in affecting consumption of the food groups under consideration. Aga
elasticities are negative, implying that the necessary condition of concavity of the cost function used to derive
the AIDS model is fulfilled (Osei-Asare, 2004).
d Sustainable Development
1700 (Paper) ISSN 2222-2855 (Online)
75
Roots and tubers, another staple food group in Ghanaian diet is significantly influenced by all the demographic
variables at 1 percent significance levels. Larger households and female headed households allocate more
budgetto roots and tubers whiles household heads with higher education have less budget shares allocated to
roots and tubers. The budget share equation for FAFH food group had household size, sex and age of household
head influencing demand at 1 percent significant level with all of them having negative effects on budget shares
Expenditure Elasticities and Marginal Budget Shares
The parameter estimates from the LAIDS model are used to derive the expenditure elasticities of demand for the
food groups as well as the marginal budget shares using the formulae outlined in (13) and (16). The calculated
expenditure elasticities and the marginal budget shares are presented in Table 4. The first and second columns give
the expenditure elasticities and marginal budget shares respectively. The expenditure elasticity measures the
responsiveness of demand to a percentage change in expenditure.
All expenditure elasticities are positive. The positive expenditure elasticities imply that all the food commodities
under consideration are normal goods, meaning that expenditures on these food items rise with increase in income.
This is consistent with consumer demand theory. The most expenditure elastic food group is the “others” food
group (2.613) followed, by cereals (1.3578), meat (1.3361), and roots and tubers (1.3261) with FAFH having
The study finds that, as income grows in urban Ghana, expenditures on cereals, meat, vegetables and roots and
tubers are going to rise more than proportionate to income growth. As income grows as evident in consistent
wth GDP, the market potential for cereals, meat, roots and tubers and vegetables will also increase. This is a
positive signal for supply response of these food groups. With 6 out of 11 food groups registering elastic
expenditure elasticities of demand, urbanisation coupled with income growth presents a huge market for the food
subsector in the Ghanaian economy.
The marginal budget shares measures the future allocation of any increases in income. From the estimates of the
marginal budget shares, if household income should increase, on the average, the Ghanaian urban consumer is
expected to spend out of the income increase, about 24 percent on cereals and bread, 15 percent on roots and tubers,
14 percent on fish and 13 percent on vegetables.
The marshallian (uncompensated) price elasticity matrix is presented in Table 5. Both own and cross price
elasticities are presented. Price elasticity of demand measures the degree of responsiveness of demand to a
percentage change in the price of a commodity. As expected, all own price elasticities are negative, which is
consistent with consumer demand theory. Negative own price elasticity means that an increase in the price of the
food group results in a decrease in demand for that food group. The own price elasticities are shown in bold figures
along the major diagonal in Table 5. Cereals and bread, meat, fish, oils and vegetables are relatively own price
elastic whiles the rest of the food commodities are own price inelastic. Meat is highly elast
1.28 suggesting that when the price of meat increases by 1 percent, demand for meat will reduce by
All cross price elasticities are inelastic as they are all less than 1 in absolute terms. This indicates that there is weak
response of one food group to changes in the price of other food groups. This result is expected because there is
less substitutability between food groups; substitutability easily occurs within food groups. Positive cross pri
elasticity implies that the commodities are substitutes while negative cross price elasticities indicate that the
commodities are compliments. The cross price elasticities are generally low in absolute values suggesting that the
of demand for one food group to the price of another food group is low.
The compensated price elasticities as presented in Table 6, measures the strength of the pure substitution effects
in affecting consumption of the food groups under consideration. Again, as expected, all compensated own price
elasticities are negative, implying that the necessary condition of concavity of the cost function used to derive
Asare, 2004).
www.iiste.org
d group in Ghanaian diet is significantly influenced by all the demographic
variables at 1 percent significance levels. Larger households and female headed households allocate more
less budget shares allocated to
roots and tubers. The budget share equation for FAFH food group had household size, sex and age of household
head influencing demand at 1 percent significant level with all of them having negative effects on budget shares
The parameter estimates from the LAIDS model are used to derive the expenditure elasticities of demand for the
(13) and (16). The calculated
expenditure elasticities and the marginal budget shares are presented in Table 4. The first and second columns give
the expenditure elasticities and marginal budget shares respectively. The expenditure elasticity measures the
All expenditure elasticities are positive. The positive expenditure elasticities imply that all the food commodities
ood items rise with increase in income.
This is consistent with consumer demand theory. The most expenditure elastic food group is the “others” food
group (2.613) followed, by cereals (1.3578), meat (1.3361), and roots and tubers (1.3261) with FAFH having the
The study finds that, as income grows in urban Ghana, expenditures on cereals, meat, vegetables and roots and
tubers are going to rise more than proportionate to income growth. As income grows as evident in consistent
wth GDP, the market potential for cereals, meat, roots and tubers and vegetables will also increase. This is a
positive signal for supply response of these food groups. With 6 out of 11 food groups registering elastic
banisation coupled with income growth presents a huge market for the food
The marginal budget shares measures the future allocation of any increases in income. From the estimates of the
d income should increase, on the average, the Ghanaian urban consumer is
expected to spend out of the income increase, about 24 percent on cereals and bread, 15 percent on roots and tubers,
The marshallian (uncompensated) price elasticity matrix is presented in Table 5. Both own and cross price
elasticities are presented. Price elasticity of demand measures the degree of responsiveness of demand to a
commodity. As expected, all own price elasticities are negative, which is
consistent with consumer demand theory. Negative own price elasticity means that an increase in the price of the
own price elasticities are shown in bold figures
along the major diagonal in Table 5. Cereals and bread, meat, fish, oils and vegetables are relatively own price
elastic whiles the rest of the food commodities are own price inelastic. Meat is highly elastic with own price
1.28 suggesting that when the price of meat increases by 1 percent, demand for meat will reduce by
indicates that there is weak
response of one food group to changes in the price of other food groups. This result is expected because there is
less substitutability between food groups; substitutability easily occurs within food groups. Positive cross price
elasticity implies that the commodities are substitutes while negative cross price elasticities indicate that the
commodities are compliments. The cross price elasticities are generally low in absolute values suggesting that the
of demand for one food group to the price of another food group is low.
measures the strength of the pure substitution effects
in, as expected, all compensated own price
elasticities are negative, implying that the necessary condition of concavity of the cost function used to derive

Journal of Economics and Sustainable Development
ISSN 2222-1700 (Paper) ISSN 2222
Vol.4, No.6, 2013
The compensated price elasticity assumes that the c
household utility constant. The compensated price elasticities of demand are generally smaller in absolute values
than the uncompensated price elasticities. The dynamics of the compensated price elastici
uncompensated elasticities; the only difference is that the absence of income effect in the compensated price
elasticities makes it smaller in absolute values. With income compensation, only demand for cereals and bread,
and oils,are own price elastic. A change in the price of any of them will result in more than proportionate change
in quantity demanded of that food commodity group.
5. Conclusions and Policy Implications
The study sought to model urban food demand in Ghana using hou
estimating a complete demand system for eleven food groups using the LAIDS model. Household demographic
characteristics such as household size, education, sex and age of household head have significant influences on
food expenditures by urban households. Changes in these socio
overall food demand in Ghana. The most significantdemographic variables are household size and sex of
household head. The results of the study indicate
food groups except fruits and dairy. This implies that increase in urban population will result in demand
increases for various food groups and this has a huge potential of expansion in urb
crops.Agriculture policy in Ghana should focus much on food production to meet the bigger market that awaits
it.
All the food groups used in this paper were normal goods (positive expenditure elasticities and negative own
price elasticities). The marginal expenditure shares show that cereals and bread,roots and tubers, fishand
vegetables will continue to constitute important share of Ghanaian urban food expenditure as they collectively
constitute about 78% of future food expenditure.Expe
vegetables and roots and tubers are elastic.This implies that increasing incomes of urban households likely to
result from economic growthpresentshuge market for rural farmers. The own price
most food groups, implying that urban consumers are very sensitive to changes in food prices. The recent
increases in food prices are likely to affect nutritional status of urban households. The study finds that
urbanisation generally presents market opportunities for Ghana’s local economy and this potential can fully be
exploited if appropriate agricultural policy is focused on increasing food production rather than guaranteed
prices.
References
Abdulai, A., Jain, D. K. & Sharma, A. K. (1999).Household Food Demand Analysis in India.
Agricultural Economics, 50(2): 316
Ackah, C. & Appleton, S. (2007). Food Price Changes and Consumer Welfare in Ghana in the 1990s. School of
Economics, University of Nottingham:
Alem, Y. & Soderbom, M. (2012).
Food Price Shock. World Development,
Blundell, R. & Robin, J. M. (1999). Estimation in Large and Disaggregated Dem
Conditionally Linear Systems.
Buse, A. (1994). Evaluating the linearized Almost Ideal Demand System.
Economics, 74: 781 – 793
Deaton, A. S. & Muellbauer, J. (1980). An Almost Ideal Demand System.
312-326.
Eales, J. S. & Unnevehr, L. J. (1988). Demand For Beef And Chicken Products: Seperability And Structural
Change. American Journal of Agricultural Economics,
d Sustainable Development
1700 (Paper) ISSN 2222-2855 (Online)
76
The compensated price elasticity assumes that the consumer has been compensated with income to keep the
household utility constant. The compensated price elasticities of demand are generally smaller in absolute values
than the uncompensated price elasticities. The dynamics of the compensated price elastici
uncompensated elasticities; the only difference is that the absence of income effect in the compensated price
elasticities makes it smaller in absolute values. With income compensation, only demand for cereals and bread,
e own price elastic. A change in the price of any of them will result in more than proportionate change
in quantity demanded of that food commodity group.
Conclusions and Policy Implications
The study sought to model urban food demand in Ghana using household consumption expenditure data by
estimating a complete demand system for eleven food groups using the LAIDS model. Household demographic
characteristics such as household size, education, sex and age of household head have significant influences on
ood expenditures by urban households. Changes in these socio-demographic factors can have effects on the
overall food demand in Ghana. The most significantdemographic variables are household size and sex of
household head. The results of the study indicate that larger household sizes have higher budget shares for all the
food groups except fruits and dairy. This implies that increase in urban population will result in demand
increases for various food groups and this has a huge potential of expansion in urb
crops.Agriculture policy in Ghana should focus much on food production to meet the bigger market that awaits
All the food groups used in this paper were normal goods (positive expenditure elasticities and negative own
ties). The marginal expenditure shares show that cereals and bread,roots and tubers, fishand
vegetables will continue to constitute important share of Ghanaian urban food expenditure as they collectively
constitute about 78% of future food expenditure.Expenditure elasticities for cereals and bread, meat, oils and fats,
vegetables and roots and tubers are elastic.This implies that increasing incomes of urban households likely to
result from economic growthpresentshuge market for rural farmers. The own price elasticities were elastic for
most food groups, implying that urban consumers are very sensitive to changes in food prices. The recent
increases in food prices are likely to affect nutritional status of urban households. The study finds that
generally presents market opportunities for Ghana’s local economy and this potential can fully be
exploited if appropriate agricultural policy is focused on increasing food production rather than guaranteed
rma, A. K. (1999).Household Food Demand Analysis in India.
, 50(2): 316-327.
Ackah, C. & Appleton, S. (2007). Food Price Changes and Consumer Welfare in Ghana in the 1990s. School of
Economics, University of Nottingham: CREDIT Research Paper 07/03.
Alem, Y. & Soderbom, M. (2012).Household-Level Consumption in Urban Ethiopia: The Effects of a Large
World Development, 40(1): 146-162.
Blundell, R. & Robin, J. M. (1999). Estimation in Large and Disaggregated Demand Systems: An Estimator for
Conditionally Linear Systems. Journal of Applied Econometrics: 14: 209 – 232
Buse, A. (1994). Evaluating the linearized Almost Ideal Demand System.American Journal of Agricultural
793
bauer, J. (1980). An Almost Ideal Demand System.American Economic Review
Eales, J. S. & Unnevehr, L. J. (1988). Demand For Beef And Chicken Products: Seperability And Structural
American Journal of Agricultural Economics, 70(3): 521 – 532.
www.iiste.org
onsumer has been compensated with income to keep the
household utility constant. The compensated price elasticities of demand are generally smaller in absolute values
than the uncompensated price elasticities. The dynamics of the compensated price elasticities are similar to the
uncompensated elasticities; the only difference is that the absence of income effect in the compensated price
elasticities makes it smaller in absolute values. With income compensation, only demand for cereals and bread,
e own price elastic. A change in the price of any of them will result in more than proportionate change
sehold consumption expenditure data by
estimating a complete demand system for eleven food groups using the LAIDS model. Household demographic
characteristics such as household size, education, sex and age of household head have significant influences on
demographic factors can have effects on the
overall food demand in Ghana. The most significantdemographic variables are household size and sex of
that larger household sizes have higher budget shares for all the
food groups except fruits and dairy. This implies that increase in urban population will result in demand
increases for various food groups and this has a huge potential of expansion in urban markets for food
crops.Agriculture policy in Ghana should focus much on food production to meet the bigger market that awaits
All the food groups used in this paper were normal goods (positive expenditure elasticities and negative own
ties). The marginal expenditure shares show that cereals and bread,roots and tubers, fishand
vegetables will continue to constitute important share of Ghanaian urban food expenditure as they collectively
nditure elasticities for cereals and bread, meat, oils and fats,
vegetables and roots and tubers are elastic.This implies that increasing incomes of urban households likely to
elasticities were elastic for
most food groups, implying that urban consumers are very sensitive to changes in food prices. The recent
increases in food prices are likely to affect nutritional status of urban households. The study finds that
generally presents market opportunities for Ghana’s local economy and this potential can fully be
exploited if appropriate agricultural policy is focused on increasing food production rather than guaranteed
rma, A. K. (1999).Household Food Demand Analysis in India.Journal of
Ackah, C. & Appleton, S. (2007). Food Price Changes and Consumer Welfare in Ghana in the 1990s. School of
Level Consumption in Urban Ethiopia: The Effects of a Large
and Systems: An Estimator for
232
American Journal of Agricultural
American Economic Review, 70:
Eales, J. S. & Unnevehr, L. J. (1988). Demand For Beef And Chicken Products: Seperability And Structural

Journal of Economics and Sustainable Development
ISSN 2222-1700 (Paper) ISSN 2222
Vol.4, No.6, 2013
Government of Ghana (2012). Budget Statement and Economic Policy of the Government of Ghana for the 2010
Financial year. Accra.
Ghana Statistical Service(2008).Ghana Living Standards Survey Report of The Fifth Round (GLSS 5)
Ghana Statistical Service(2012).2010 Population and Housing Census, Summary Report of Final Results.
Press Limited, Accra.
Haq, Z., Nazli H., & Meilke, K. (2008).Implications of high food prices for poverty in Pakistan.
Economics 39 supplement 477
Heckman, J. J., (1979). Sample Selection Bias as A Specification Error.
Moschini, G. (1995). Units of Measurement and the Stone Index in Demand System Estimation.
Journal of Agricultural Economics
Muhammed S., Gheblawi, M. S. & Al
The Households In United Arab Emirates.
Osei-Asare, Y. B. (2004). Household Water Security and Water Demand in
University Studies: Series 5, Economics and Management. Vol. 3152.
Sadoulet, E. & Janvry, A. (2009).The Impact of Rising Food Prices on Household Welfare in India.
California at Berkeley. Retrieved October 17
http://www.irle.berkeley.edu/workingpapers/192
Zezza, A., Davis, B., Azzarri, C., Covarrubias, K., Tasciotti, L. & Anriquez, G. (2009). The Impact of Rising
Food Prices on the Poor. International Association of Agricultural Economists
China, August 16-22.
Appendices
List of Tables
Table 1: Regionaldistribution of the sample
Region Frequency
Ashanti 674
Brong Ahafo 212
Central 212
Eastern 272
Greater Accra 997
Northern
Upper East
Upper West
Volta 154
Western 249
Total 2,935
Table 2: Summary of Socio-Demographic Variables used
Variable
d Sustainable Development
1700 (Paper) ISSN 2222-2855 (Online)
77
. Budget Statement and Economic Policy of the Government of Ghana for the 2010
Ghana Living Standards Survey Report of The Fifth Round (GLSS 5)
2010 Population and Housing Census, Summary Report of Final Results.
Haq, Z., Nazli H., & Meilke, K. (2008).Implications of high food prices for poverty in Pakistan.
39 supplement 477–484
J., (1979). Sample Selection Bias as A Specification Error. Journal of Econometrica,
Moschini, G. (1995). Units of Measurement and the Stone Index in Demand System Estimation.
Journal of Agricultural Economics. 17: 63-68.
awi, M. S. & Al-Neyadi S. A.(2010).Analysing The Impacts of Increase In Food Prices on
The Households In United Arab Emirates. Emirate Journal of Food and Agriculture
Household Water Security and Water Demand in the Volta Basin of Ghana
University Studies: Series 5, Economics and Management. Vol. 3152.
The Impact of Rising Food Prices on Household Welfare in India.
California at Berkeley. Retrieved October 17, 2011 from,
http://www.irle.berkeley.edu/workingpapers/192-09.pdf.
Zezza, A., Davis, B., Azzarri, C., Covarrubias, K., Tasciotti, L. & Anriquez, G. (2009). The Impact of Rising
Food Prices on the Poor. International Association of Agricultural Economists
Table 1: Regionaldistribution of the sample
Frequency Percentage
674 22.96
212 7.22
212 7.22
272 9.27
997 33.97
92 3.13
44 1.50
29 0.99
154 5.25
249 8.48
2,935 100.00
Demographic Variables used
Frequency Percentage
www.iiste.org
. Budget Statement and Economic Policy of the Government of Ghana for the 2010
Ghana Living Standards Survey Report of The Fifth Round (GLSS 5)
2010 Population and Housing Census, Summary Report of Final Results. Sakoa
Haq, Z., Nazli H., & Meilke, K. (2008).Implications of high food prices for poverty in Pakistan.Agricultural
Journal of Econometrica, 47(1).
Moschini, G. (1995). Units of Measurement and the Stone Index in Demand System Estimation.American
Analysing The Impacts of Increase In Food Prices on
Emirate Journal of Food and Agriculture, 22 (5): 367-376.
the Volta Basin of Ghana, European
The Impact of Rising Food Prices on Household Welfare in India.University of
, 2011 from,
Zezza, A., Davis, B., Azzarri, C., Covarrubias, K., Tasciotti, L. & Anriquez, G. (2009). The Impact of Rising
Food Prices on the Poor. International Association of Agricultural Economists Conference, Beijing,

Journal of Economics and Sustainable Development
ISSN 2222-1700 (Paper) ISSN 2222
Vol.4, No.6, 2013
Source: Author’s calculations from GLSS5, 2012
Age (years)
15 – 24
25 – 34
35 – 44
45 – 54
55 – 64
> 64
Total
Sex
Female
Male
Total
Level of Education
None
Primary
J.S.S./ Middle School
S.S.S./Training Colleges
Tertiary
Total
Household Size
1 – 3
4 – 6
7 – 9
> 9
Total
d Sustainable Development
1700 (Paper) ISSN 2222-2855 (Online)
78
Author’s calculations from GLSS5, 2012
221 7.5
851 29.0
796 27.1
599 20.4
288 9.8
180 6.1
2935 100.0
833 28.4
2102 71.6
2935 100.0
5 0.2
361 12.3
1507 51.3
695 23.7
367 12.5
2935 100.0
1611 54.9
1018 34.7
265 9.0
41 1.4
2935 100.0
www.iiste.org

Journal of Economics and Sustainable Development
ISSN 2222-1700 (Paper) ISSN 2222
Vol.4, No.6, 2013
d Sustainable Development
1700 (Paper) ISSN 2222-2855 (Online)
79
www.iiste.org

Journal of Economics and Sustainable Development
ISSN 2222-1700 (Paper) ISSN 2222
Vol.4, No.6, 2013
d Sustainable Development
1700 (Paper) ISSN 2222-2855 (Online)
80
www.iiste.org

Journal of Economics and Sustainable Development
ISSN 2222-1700 (Paper) ISSN 2222
Vol.4, No.6, 2013
d Sustainable Development
1700 (Paper) ISSN 2222-2855 (Online)
81
www.iiste.org
Journal of Economics and Sustainable Development
ISSN 2222-1700 (Paper) ISSN 2222
Vol.4, No.6, 2013
d Sustainable Development
1700 (Paper) ISSN 2222-2855 (Online)
82
www.iiste.org

Journal of Economics and Sustainable Development
ISSN 2222-1700 (Paper) ISSN 2222
Vol.4, No.6, 2013
d Sustainable Development
1700 (Paper) ISSN 2222-2855 (Online)
83
www.iiste.org

This academic article was published by The International Institute for Science,
Technology and Education (IISTE). The IISTE is a pioneer in the Open Access
Publishing service based in the U.S. and Europe. The aim of the institute is
Accelerating Global Knowledge Sharing.
More information about the publisher can be found in the IISTE’s homepage:
http://www.iiste.org
CALL FOR PAPERS
The IISTE is currently hosting more than 30 peer-reviewed academic journals and
collaborating with academic institutions around the world. There’s no deadline for
submission. Prospective authors of IISTE journals can find the submission
instruction on the following page: http://www.iiste.org/Journals/
The IISTE editorial team promises to the review and publish all the qualified
submissions in a fast manner. All the journals articles are available online to the
readers all over the world without financial, legal, or technical barriers other than
those inseparable from gaining access to the internet itself. Printed version of the
journals is also available upon request of readers and authors.
IISTE Knowledge Sharing Partners
EBSCO, Index Copernicus, Ulrich's Periodicals Directory, JournalTOCS, PKP Open
Archives Harvester, Bielefeld Academic Search Engine, Elektronische
Zeitschriftenbibliothek EZB, Open J-Gate, OCLC WorldCat, Universe Digtial
Library , NewJour, Google Scholar