the effects of dissolved oxygen and enological treatments ...703254/fulltext02.pdf · oxygen and...
TRANSCRIPT

Degree project work
The effects of dissolved
oxygen and enological
treatments on quality
parameters in wine and cider
Author: Johan Ragnemalm
Supervisor: Annika Nilsson
Examiner Kjell Edman
Semester: VT14, 2014:L2Subject: Chemistry
Level: First cycle
Course code: 2KE01E

i
Abstract Dissolved oxygen has previously been shown to affect the colour and sensory properties
of red and white wine during storage. A number of different wines and wine based
sparkling ciders are made at Kiviks Musteri AB. The aim of this work is to study the
effects of dissolved oxygen and different enological treatments on sensory quality and
colour of red wine and sparkling apple cider during storage at different temperatures.
The effects of fermentation and fining on foaming ability of pear wine are also studied.
Samples of red wine were taken after different processing steps such as pumping,
sulphuration, pasteurization and filling. To evaluate the effects of the processes on the
wine, dissolved oxygen, colour and free SO2 were measured in each. Measurements
were also made on samples of red wine stored at either 38°C or room temperature for
different amounts of time. Sensory evaluations were also made of the wine samples.
Colour was measured by measuring absorbance at 420, 520 and 620 nm. Dissolved
oxygen was also measured after different processing steps during production of apple
cider. To study the effects of dissolved oxygen on cider, three different batches of apple
cider were produced, with different concentrations of dissolved oxygen. The samples
were stored at either 38°C or room temperature for one week. Measurements of
absorbance at 420 nm and free SO2, along with sensory evaluation were made on the
cider samples before and after storage. Fermentation and fining of pear wine were made
in small scale and the foaming ability was compared to that of large scale factory
produced wine.
Pumping and filling had negative impact on the flavour of red wine. Colour intensity
increased while free SO2 decreased during storage of red wine. The sensory quality
decreased during storage and a higher storage temperature had a distinctive impact on
this decrease. Dissolved oxygen had no noticeable effect on changes in sensory
properties of neither red wine nor cider during storage. A higher concentration of
dissolved oxygen was correlated to a higher increase in colour intensity of red wine
though. A higher decrease was also seen in free SO2 in red wine samples with higher
dissolved oxygen content when stored at 38°C. Fermentation had a large impact on
foaming properties of pear wine. Small scale wine fermentation resulted in much lower
foaming ability than large scale fermentation.

ii
Sammanfattning Syrehalten i viner har i tidigare studier visat sig kunna påverka både färg- och
smakförändringar i vinerna under längre tids lagring. På Kiviks Musteri AB i Skåne
produceras en mängd olika sorters vin och vinbaserade cidrar. Målet med den här
studien är att studera vilken effekt syrehalten har på smak och färg i viner och cidrar
från Kiviks Musteri som får lagras i olika temperaturer. Effekten av olika processteg
under produktionen studeras också. Slutligen studeras även hur skumbildningen i
päronvin påverkas av jäsning och klarning av vinet.
Prover av rödvin togs efter de olika processtegen vinet genomgår på Kiviks Musteri.
Proverna lagrades olika länge i antingen 38°C eller rumstemperatur. Färgstyrka och
smak analyserades på proverna före och efter lagringen. Syrehalten analyserades också i
proverna direkt efter att de tagits och svavelhalten i proverna analyserades före och efter
lagringen för att mäta hur mycket proverna oxiderades under lagringen. Mätningar av
syrehalt gjordes även efter olika processteg under produktionen av äppelcider på Kiviks
Musteri. Vilken effekt syrehalten har på äppelcider studerades genom att tre olika satser
äppelcider med olika syrehalt tillverkades. Prover från dessa lagrades en vecka i
antingen 38°C eller rumstemperatur. Därefter analyserades färgstyrka, svavelhalt och
smak på proverna. Hur skumbildning i päronvin påverkas av jäsning och klarning
studerades genom att päronvin fick jäsa och klarnas antingen i stor skala i musteriets
tankar eller i liten skala på ett laboratorium. Skumbildningen mättes genom ett test där
vinprover blandades med kolsyrat vatten.
De processer som inverkade starkast på smaken på rödvin var pumpning och tappning,
vilka gav tydliga smakförsämringar. När rödvin lagrades så minskade svavelhalten
medan färgstyrkan ökade. En försämring av smaken skedde också under lagringen,
särskilt när vinet lagrades i 38°C. Syrehalten hade ingen tydlig påverkan på smaken av
vare sig rödvin eller äppelcider. Syrehalten i rödvin hade däremot ett svagt samband
med ökningen i förgstyrka i rödvin. Syrehalten hade även ett samband med
minskningen av svavelhalten i de prover av rödvin som lagrades i 38°C.
Skumbildningen i päronvin påverkades väldigt starkt av jäsningen, medan klarningen
hade begränsad effekt. Skumbildningen var vesäntligt mycket lägre i päronvin som jäst i
liten skala på laboratoriet än i det vin som jäst i musteriets tankar.
Key words Red wine; apple cider; pear wine; dissolved oxygen; oxidation; foaming; fining agents
Acknowledgements This work was financed by Kiviks Musteri AB. The staff members at Kiviks Musteri
involved in the sensory evaluations are greatfully thanked for their contribution. I also
want to thank all of the other staff members at Kiviks Musteri whom have been
providing assistance and information throughout this project. Finally I would like to
thank my two supervisors, Annika Nilsson, Director R&D at Kiviks Musteri AB, and
Anna Blücher, Senior Lecturer at Linnæus University.
iii
Table of contents
1 Introduction _________________________________________________________ 1 1.1 The chemistry of wine _____________________________________________ 3 1.2 Foaming in wines and ciders ________________________________________ 4 1.3 Oxygen and wine _________________________________________________ 5 1.4 Stabilization and fining of wine ______________________________________ 7
1.4.1 Effects of fining agents on the foaming properties of wines and ciders ____ 8
1.5 Aims of this project ______________________________________________ 10
2 Materials and Methods _______________________________________________ 11 2.1 Validation of different techniques for varying dissolved oxygen content in tap
water _____________________________________________________________ 11 2.2 Validation of different methods for measuring dissolved oxygen with Winkler
titration method ____________________________________________________ 11 2.3 Measurements of dissolved oxygen content at different water reservoirs at Kiviks
Musteri ___________________________________________________________ 11 2.4 Red wine sampling _______________________________________________ 11 2.5 Analyses of quality parameters in red wine ____________________________ 13 2.6 Analysis of changes in dissolved oxygen during the production of apple cider 13 2.7 Effects of dissolved oxygen content on quality parameters in apple wine _____ 15
2.7.1 Small scale laboratory production of apple cider ____________________ 15
2.7.2 Analyses of quality parameters in apple cider ______________________ 15
2.8 Effects of different processing steps on the foaming properties of pear base wine
_________________________________________________________________ 16 2.8.1 Foaming test ________________________________________________ 16
2.8.2 Production of pear base wine, GVP 50, 11,3 _______________________ 16
2.8.3 Analysis of the effects on foaming properties _______________________ 17
2.8.4 Analyses of the effects of different types of activated charcoal used in fining
on foaming and sensory properties of pear base wine _____________________ 17
3 Results and discussion ________________________________________________ 18 3.1 Varying the dissolved oxygen content in tap water ______________________ 18
3.2 Comparison of the different measuring methods for dissolved oxygen _______ 18
3.3 Dissolved oxygen content in water reservoirs at Kiviks Musteri ____________ 19
3.4 Effects of different processing steps on quality parameters in red wine ______ 19 3.5 Effects of dissolved oxygen and different storing conditions on quality parameters
in red wine ________________________________________________________ 21
3.6 Dissolved oxygen content in cider after different processing steps __________ 24 3.7 Effects of dissolved oxygen on quality parameters in apple cider ___________ 26
3.8 Effects of fermentation and fining on the foaming ability of pear base wine. __ 27
4 Conclusions ________________________________________________________ 31
References ___________________________________________________________ 32

1
1 Introduction Wine is traditionally the name of the product received when fermenting grape or fruit
juices, converting sugar to alcohol. The name wine usually refers to grape wine while
wines made from other fruits than grapes often are named after the primary products
used, for example rice wine or apple wine.
At Kiviks Musteri a number of different apple/pear wines are made, called base wines.
These are used as ingredients in ciders. One apple wine is made from fresh apple juice
from apples grown in Kivik and another apple wine and a pear wine are made from
concentrate. Other base wines are made as mixtures of the primary base wines. The fruit
juice or concentrate are mixed with water, glucose syrup, citric acid and yeast nutrient
salt before fermentation is started by adding dried yeast. The tank in which the
fermentation is carried out is open during the whole fermentation process and the wine
is continuously stirred to remove as much carbon dioxide as possible. The sugar- and
alcohol contents are measured in the wine each day during fermentation. When the
alcohol content reaches the desired value the wine is sulphurated with potassium
metabisulphite (K2S2O5) to kill the yeast and stop fermentation.
The definition of cider varies between different regions and countries. According to
Swedish legislation the term cider is the name of a product containing fermented and
non-fermented fruit juice from apples and/or pears. The juice has to make up to a
minimum of 15 percentages of the product by volume but may be from concentrate.
Other ingredients allowed in a cider in Sweden are water, sugar, natural flavourings and
food additives approved in EU legislation. Juices from other fruits than apples or pears
may not be added to the cider but flavourings from other fruits are allowed. The alcohol
in a cider may only derive from fermented juices (1).
The ciders at Kiviks Musteri are made from base wines made at the factory and juice
from concentrate. The ingredients are mixed whereafter the cider is filtrated,
pasteurized, cooled, carbonated and transferred to an isolated tank standing outdoors.
Before being bottled the cider is carbonated and filtrated again. The cider is bottled in a
counterpressure filler with carbon dioxide as filling gas. For ciders without added
preservatives besides sulphite the bottles are pasteurized a second time. A schematic
diagram of the production of apple cider at Kiviks Musteri is shown in figure 1.
In addition to making their own apple and pear cider and wine, Kiviks Musteri also
receives red wine produced in Spain. This is sulphurated, pasteurized and filled in Tetra
Prisma® packages. The wine arrives to the factory in trucks and the wine is pumped to
an open deaeration tank. Before entering the tank the wine is infused with nitrogen gas
in the pipe to reduce the dissolved carbon dioxide content. The wine is continuously
pumped from the deaeration tank to a storage tank so that the deaeration tank is never
too full with wine. This is to allow gas bubbles formed during the nitrogen infusion to
leave the wine before it is pumped to the storage tank. The storage tank has twice the
storage capacity of the incoming trucks, which means that two trucks of wine are
required to fill the storage tank. When the tank is filled potassium metabisulphite is
added to the wine. The wine is then pumped to the packaging line at the factory where it
is pasteurized and filled in Tetra Prisma® packages. A schematic diagram of the
procedures from receiving the wine to filling it in Tetra Prisma® packages is shown in
figure 2.

2
Figure 1. Schematic diagram of the processing steps during production of apple cider at Kiviks Musteri.
Crosshatched lines mark separations between different lines at the factory. The ingredients added
automatically are added by pumping them through pipes from tanks while reading the amount added on a
display. The ingredients added manually are weighed and added to the mixing tank through a large
funnel.
Automatic addition of ingredients to
mixing tank
Mixing ingredients
• Water • Apple base wine
• Apple concentrate
• Sugar solution
Manual addition of ingredients to
mixing tank
• Citric acid
• Flavourings
• K2SO
3
Filtering
Pasteurization
Carbonation
Pumping to storage tank
Second carbonation
Second filtering
Filling

3
Figure 2. Schematic diagram of the processing steps from the receiving to the filling of red wine at
Kiviks Musteri. The crosshatched line marks a separation between different lines at the factory.
1.1 The chemistry of wine Wine is a complex composition of a number of organic acids, alcohols, carbohydrates,
nitrogen compounds, phenolic compounds, volatile, odoriferous compounds among
others (2). One notable compound is the tartaric acid, which is not very widespread in
nature, except for grapes, which often contains tartaric acid concentrations of several
g/l. Tartaric acid has a pKa of 3.01 and highly contributes to the acidity of grapes and
wine (2).
A very important chemical group for the colour and sensory qualities of especially red
wines is the vast number of different phenolic compounds (2). Common for all phenolic
substances is that they contain a phenolic ring. The phenols include the chemical groups
of flavonoids, anthocyanins and tannins amongst others. Flavonoids are predicated on
two benzene cycles bonded by an oxygenated heterocycle and are often yellow
pigments (2). The molecular structure of the flavonoid subgroups flavones and
isoflavans is shown in figure 3.
Incoming truck with wine
Pumping to deaeration tank
Pumping to storage tank
N2
infusion
Addition of K
2SO
3
Pasteurization
Filling (Tetra Prisma®)

4
(a) (b)
Figure 3. a) Molecular structure of the backbone for flavones. b) Molecular structure of the backbone for
isoflavans.
Anthocyanins are glucosides of anthocyanidins, which are a subgroup to flavonoids
where the heterocycle is an unsaturated cation. The anthocyanin form is much more
stable than the anthocyanidin form. Anthocyanins are mostly located in the skin of
grapes and are red pigments (2). Molecular structures of anthocyanidins and
anthocyanin 3-monoglucosides, the most common type of anthocyanins in grapes (2),
are shown in figure 4.
(a) (b) Figure 4. a) Molecular structure of anthocyanidins. b) Molecular structure of anthocyanin 3-
monoglucosides.
Tannins are by definition phenolic compounds able to bind to and create stable
combinations with various organic compounds including proteins and polysaccharides
(2). To be able to create these stable combinations the tannin molecules are pretty large,
their molecular weight usually range between 600 and 3500 Da (2). Tannins and
anthocyanins have been shown to contribute to astringency and bitterness of red wines,
tannins more so than anthocyanins (3, 4). The astringency of tannins arises when they
bind to glycoproteins in the saliva (2).
1.2 Foaming in wines and ciders Foam is a dispersion of air bubbles in a liquid. For foam to form there needs to be
surfactants present that can adsorb to the air-water interface and reduce the interfacial
tension. The foaming properties of a surfactant are briefly divided into foaming capacity
and foam stability. The capacity is the amount of interfacial area that can be created per
quantity unit of the surfactant. The stability is the rate at which the created foam can
withstand influences of gravitation and mechanical impacts and how much time the

5
foam will take to decline. In foods proteins are very common surfactants. Proteins have
the ability to migrate spontaneously to an air-water or oil-water interface as they contain
both hydrophilic and hydrophobic residues. The ability of a protein to adsorb to the
interface is dependent on the number of larger hydrophobic areas, hydrophobic patches,
on the protein surface. Many large hydrophobic areas on the protein surface make
spontaneous adsorption to the interface more likely (5).
Several studies have shown that proteins in sparkling wines and ciders increase foaming
ability in the beverages (6-9). The results vary regarding the influence of proteins on the
stability of the foam. Foam stability had a positive correlation with proteins in one study
(6), a negative correlation with proteins in another study (8) and no correlation in a third
(9). This could be explained with the results from two other studies, showing that
proteins and other polypeptides with high molecular mass contribute to foam stability
(7, 10), whereas polypeptides of low molecular mass destabilize foam (7).
It has also been shown that acidity (8, 9) and total polysaccharides (6) can increase
foaming ability. Acidic polysaccharides however, did show a negative correlation (11)
or no correlation (6) with foaming ability depending on the method used for
polysaccharide determination. Pectin, despite being an acidic polysaccharide, did, in a
study by Narchi et al. (12), benefit foam formation in the presence of proteins in viscous
model foods consisting of modified glucose syrups. Pectins are usually not present in
grape wine by the end of the fermentation process as they have been broken down by
pectolytic enzymes in the fruits (2). Dahlström (13) has also shown that the pear base
wine made at Kiviks Musteri contains no pectin.
Picinelli Lobo et al. (9) have shown that the yeast strain affects the foaming properties
of sparkling ciders. Ciders made with wine yeast had higher foam formation ability than
ciders made with cider yeast, but no differences were seen in foam stability. They also
showed that higher alcohol content decreased foaming ability and dissolved carbon
dioxide increased foaming ability (9).
1.3 Oxygen and wine During ageing of red wines there is a desirable change of colour from red-bluish for
fresh wines to a more reddish-brown colour in aged wines, as a result of several
reactions between the different compounds in the wine (14) One of the major type of
reactions is condensations between anthocyanins and other phenols, mainly flavan-3-ols
(14-16). One of the groups of compounds formed during aging is pyranoanthocyanins
(14).
The amount of oxygen exposure during long-time storage of red wines has been shown
to affect the polyphenol content and colour of red wines during storage and ageing (14,
17). Some polyphenols decreases while some increases, dependent on oxygen exposure
(14, 17). Many of the phenols present in wine are important contributors to the sensory
characteristics. They also function as antioxidants, which may explain why the phenol
content is affected by oxygen (18). Losses of anthocyanins and flavan-3-ols in red
wines have been shown to be directly correlated with exposure to oxygen during storage
and they seem to be the primary targets of oxidation (17). Increased oxygen exposure
also causes additional losses of free SO2 during storage (17). SO2 is traditionally used as
an antioxidant in wines and the loss of SO2 content may be a reliable way to measure
the degree of oxidation. In apples, the polyphenol compound caffeoylquinic acid is the
primary target of oxidation (19). The oxidation products results from coupling between
6
the caffeoylquinic acids with other molecules of caffeoylquinic acids or catechins or
dimeric flavan-3-ols (19). Catechins and procyanidins, the polymeric form of catechins,
are amongst the most abundant polyphenols in cider apples (19).
In a study by Caillé et al. (20), a comparison was made on the changes during storage in
Grenache red wines subjected to different amounts of oxygen. Different amounts of
oxygen were dissolved in the wines before bottling and the oxygen exposure after
bottling were controlled in the wines by using different closure types. A higher oxygen
exposure both before and after bottling resulted in more orange colour of the wines after
ten months of storage. Higher dissolved oxygen content before bottling resulted in
lower colour intensity after the storage while higher exposure after bottling resulted in
higher colour intensity. Oxygen exposure after bottling increased the “caramel” and
“fruity” odours while the “animal” odour decreased. Animal odour was described as
“intensity of leather: stable and animals odours” (20).
Godden et al. (21) made a comparison between different bottle closures on a Semillon
white wine. There were distinct differences in colour, SO2 concentration and sensory
characteristics between wines with different closures after a year of storage. Low SO2
concentration, likely caused by a higher oxygen permeability of the closure, was
correlated with an increase in browning (absorbance at 420 nm) and a higher “oxidized”
aroma. The initial oxygen content did not have any noticeable effect though (21).
Similar results have been reported by Skouroumounis et al. (22), who also concluded
that neither too high nor too low oxygen exposure during storage is desirable to achieve
the appropriate sensory qualities for white wines. According to the authors, the
definition of “too low” or “too high” oxygen exposure depends on the properties of each
wine (22).
Mas et al. (23) found that the differences caused by different closures, and thus different
oxygen exposures, during storage were much more noticeable in white than in red
wines.
Most processes a wine goes through before reaching the customers more or less affect
the dissolved oxygen content (DO content) in the wine (24). Castellari et al. (24)
divided wine making processes in “low enrichment” treatments and “high enrichment”
treatments . Processes classified as low enrichment, which increased the oxygen content
in the wines by up to 0.3 mg/l, were for example pumping, filtration and filling in
bricks, bag in box or kegs. The definition “brick” in the study probably refers to Tetra
Brik® packages or similar. High enrichment treatments, which increased the oxygen
content by more than 0.3 mg/l, were for example racking, centrifugation, refrigeration
and filling in glass bottles. The single process that increased the oxygen content the
most, and sometimes totally saturated the wine with oxygen was continuous tartaric
stabilization systems. Continous tartaric stabilization is a process used to remove
tartaric acid from wines, as tartaric acid may otherwise bind cations during storage,
forming precipitations several months after fermentation (2). For the bottling there was
a difference between different bottling systems. Counterpressure fillers introduced the
most oxygen, on average an addition of about 1 mg/l, but the difference was quite large
between the different systems tested (24).

7
1.4 Stabilization and fining of wine A number of treatments are usually required after fermentation to acquire well tasting
products with consistent quality. Clarity is a very important quality parameter,
especially in white wines. Fining and filtering are used to remove unwanted particles
and substances that may cause turbidity. Fining is the procedure of adding substances
that binds to particles in the wine that may cause turbidity or deposits during storage.
The added substances create deposits when they form complexes with particles in the
wine which can then be separated from the wine to ensure long-term clarity and
stability. Some of the most commonly used fining agents are proteins, bentonite,
siliceous earths and polyvinylpolypyrrolidone (PVPP) (2). To prevent bacterial or fungi
spoilage during storage most wines and ciders are pasteurized and preservatives are
added to some (2).
Fining always includes the addition of some type of protein (2). Commonly used are
gelatine, isinglass, casein, plant proteins or albumin from eggs or blood, though blood
albumin is not permitted in the EU (2). Isinglass derives from the swim bladder of
certain fish species and is mainly consisting of collagen. The proteins used in fining are
positively charged at the pH of wine (2). The particles present in wine have an excess of
negative charges in total (2). Especially tannins and some polysaccharides are among
these particles. The fining proteins form complexes with the negatively charged
particles, producing flocculations that grow and precipitate (2).
Bentonites are hydrated aluminium phyllosilicates, mainly montmorillonite
((Na/Ca)0.33(Al/Mg)2Si4O10(OH)2·nH2O). The sodium or calcium ions are exchangeable
and depending on which ion they bind the bentonites are called sodium bentonite or
calcium bentonite. Bentonite swells greatly when it absorbs water and has a large and
negatively charged surface with great adsorption ability that binds the Na+/Ca
2+-ions
(2). Sodium bentonite is most common when fining wine (2). When treating wine the
adsorption surface release the sodium ions and effectively binds proteins (2, 25).
Bentonite is widely used to treat white wines, in which they bind grape proteins that
otherwise may cause turbidity and deposits if they flocculate (2). Bentonite is also used
in red wine where it is able to bind some anthocyanins, tannins and polysaccharides that
otherwise can precipitate during ageing (2).
A siliceous earth is a concentrated suspension of non-aggregated silica particles in a
water solution, called a sol. They are used together with proteins, usually gelatines or
isinglass, when fining white wines (2). As silica particles are negatively charged they
flocculate and settle when neutralized by the positively charged proteins, much like
tannins (2). White wines have lower tannin contents than red wines and the silica
particles bind to and remove excessive proteins (2). This accelerates the clarification
process and ensures that no protein fining agents are left in suspension (2).
PVPP binds strongly to and form precipitates with tannins, much like protein fining
agents (2). It is also effective in reducing the overall phenol content and other
oxidizable compounds (2). This can be utilized to reduce browning tendencies in white
wines (2).
The wine at Kiviks Musteri is fined by adding bentonite, silica sol and gelatine. For the
wines made from concentrate activated charcoal is also added. Products of activated
charcoal are often used to remove unpleasant smells or off-flavours (2). At Kiviks
Musteri the intention is to reduce the overall colour intensity and fermented flavour, as

8
the ciders those base wines are intended for often are flavoured with flavourings from
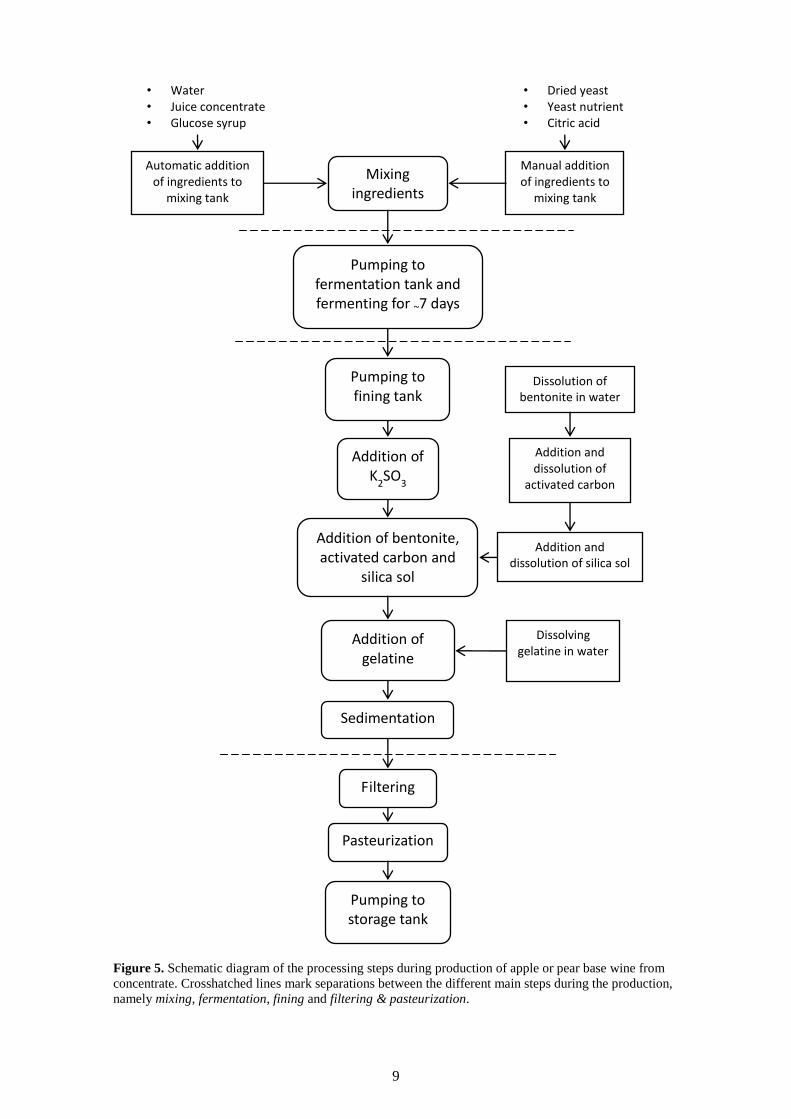
other fruits than apple and pear. After settling the wine is filtered and pasteurized. A
schematic diagram of the production of base wine from concentrate at Kiviks Musteri,
including the mixing and fermenting steps, is shown in figure 5.
1.4.1 Effects of fining agents on the foaming properties of wines and ciders
Bentonite used in fining has been shown to reduce the foaming formation and stability
in sparkling wines, which is most likely due to the elimination of foam favouring
proteins (8, 26). The same results have been acquired by Dahlström (13) and
Mårtensson (27) on two different base wines at Kiviks Musteri. Higher addition of
bentonite to an extent where the foam stability is significantly reduced did result in a too
large increase in sediment height in an apple base wine at Kiviks Musteri to be a
practical method of reducing foam stability (27). Furthermore, if bentonite is used
together with gelatine the reducing effects on foam formation may disappear or even be
reversed (28). However, this effect of gelatine was not seen on pear base wine at Kiviks
Musteri (13). Dahlström also showed that activated charcoal had a reducing effect on
foam stability if used in a sufficiently high quantity (13).
9
Figure 5. Schematic diagram of the processing steps during production of apple or pear base wine from
concentrate. Crosshatched lines mark separations between the different main steps during the production,
namely mixing, fermentation, fining and filtering & pasteurization.
Automatic addition of ingredients to
mixing tank
Pumping to fermentation tank and fermenting for ~7 days
Pumping to fining tank
Addition of bentonite, activated carbon and
silica sol
Mixing ingredients
• Water • Juice concentrate
• Glucose syrup
Manual addition of ingredients to
mixing tank
• Dried yeast • Yeast nutrient • Citric acid
Dissolution of bentonite in water
Addition and dissolution of
activated carbon
Addition and dissolution of silica sol
Addition of gelatine
Dissolving gelatine in water
Addition of K
2SO
3
Sedimentation
Filtering
Pasteurization
Pumping to storage tank
10
1.5 Aims of this project The main aim of this project is to evaluate the changes in dissolved oxygen in apple
cider and red wine during the different processing steps at the factory at Kiviks Musteri.
The effects of the amount of dissolved oxygen on the changes in sensory attributes and
colour of the beverages during storage will be investigated. Furthermore, a study will be
made on the effects on foaming properties during the different processing steps in the
production of pear base wine. A comparison of the effects on foaming properties will be
made between factory production of pear base wine and small scale production at the
laboratory. The effect of two different enzymes on the foaming properties of pear base
wine will also be studied.
11
2 Materials and Methods
2.1 Validation of different techniques for varying dissolved oxygen content in tap water Two different methods of varying DO content in tap water were tested. The first method
was to boil the water for a set number of minutes with subsequent cooling. The other
method was to blend the water for a set number of minutes, either with a rod mixer or in
an L5M-A Laboratory Mixer from Silverson at a set number of rpm. Tap water without
treatment was used as reference. DO content was measured two times in each water
sample with a pH/oxi 340i with a CellOx 325 Dissolved Oxygen (DO) electrode from
WTW. Boiled water and reference water was also measured one time with an orbisphere
3650 from Hach Company. Comparisons were made between the different methods of
varying DO content and between the measuring devices. Reproducibility for the boiling
and blending methods was tested by analysing several samples with the pH/oxi 340i and
CellOx 325 electrode. Measurements were made on eight samples blended for three
minutes, six samples blended for five minutes and six samples boiled for five minutes.
2.2 Validation of different methods for measuring dissolved oxygen with Winkler titration method Two samples of distilled water were treated according to the two different methods
described above and a third was used as reference. DO content in the samples was
measured with the pH/oxi 340i with a brand new CellOx 325 DO Electrode, with the
orbisphere 3650 and with a titration test kit for dissolved oxygen, “Oxygen Test
Method: titrimetric, acc. To Winkler, with titration pipette MColortestTM” from Merck
Millipore. Three different titrations were made on a sample of tap water with the test kit
to test the reproducibility of the measuring method. DO content in that sample was also
measured one time with the pH/oxi 340i.
2.3 Measurements of dissolved oxygen content at different water reservoirs at Kiviks Musteri The sample taking procedure was carried out by filling 0,5 l plastic bottles of water
from the sample taking taps until overflowing. Samples were taken from the tap in the
laboratory, the water storage tank used at water supply in the production of wine and
cider, the pool at the water treatment plant and from the incoming water from each of
the three water drilling holes that were in use at the time. Finally another sample was
taken from the pool at the water treatment plant after a couple of hours.
DO content and temperature were measured in each sample within half an hour after
taking the sample, using a pH/oxi 340i with a CellOx 325 DO Electrode.
2.4 Red wine sampling Samples of wine were taken in connection with the arrival of a truck with a load of red
wine to the factory. The wine was pumped to a storage tank. The tank was already half
filled with wine that had been pumped from another truck the day before. The wine
samples were prepared by filling one litre plastic bottles with wine until overflowing. In
the case of foaming during filling the filling continued until the foam had run off, to the
highest extent possible.

12
The first sample was taken from the wine in the half filled storage tank. The next
sample was taken on the new wine, from the storage tank on the truck. Three samples
were then taken during pumping of the wine from the truck. One was taken from the
pipe just before the deaeration tank when nitrogen infusion was turned off. The second
was taken from the same pipe but with nitrogen infusion and the third from the pipe just
before the storage tank. When all of the wine had been pumped to the storage tank
another sample was taken from the storage tank. Finally a sample was taken from the
storage tank after potassium metabisulphite had been added. When the wine was packed
at the factory two packages of wine were collected during the beginning of the filling
procedure, just after the sample from the storage tank was collected, and two more just
before the ending, when the storage tank was almost empty. An overview of the sample
points can be seen in table 1.
Table 1. Overview of the sample points for red wine samples.
Sample
Number Sample point
1 Storage tank before transferring the new wine
2 Storage tank on the truck
3 Pipe before deaeration tank without nitrogen
4 Pipe before deaeration tank with nitrogen
5 Pipe before storage tank
6 Storage tank after transferring the wine
7 Storage tank after K2S2O5 addition
8 Packed product, beginning of filling procedure
9 Packed product, end of filling procedure
The wine samples, excluding samples number one, five and the packed products, were
divided into two 33 cl glass bottles each. The headspace in the bottles was filled with a
modified atmosphere, using a product called Private Preserve. The Private Preserve
was used to blow a mix of nitrogen, carbon dioxide and argon into the headspace of the
bottles, whereafter they were capsuled as fast as possible. The bottles were pasteurized
to 83°C and cooled. A glass bottle from each main sample was stored dark at 38°C for
one week and the other bottle in a dark place at room temperature for one month. One
package of wine from each of the two sample points during the filling procedure was
stored dark at 38°C for one week.
Four packages of red wine were taken from the factory and put in a dark place at 38°C
and another four were put in a dark place at room temperature for different amount of
times. The packages had been filled approximately during the middle of the filling
procedure at the factory. The storage times for the packages stored at 38°C were two
days, seven days, 13 days and 20 days. The wines stored at room temperature were
stored for four weeks, thirteen weeks, twenty-six weeks and thirty-nine weeks
respectively. The storage times were chosen from the equivalence relation shown in
table 2, used by Kiviks Musteri.

13
Table 2. Equivalence relation between storage times at 38°C and 20°C of liquid product samples. Storage
for a set amount of time at 38°C is supposed to simulate storage for the equivalent amount of time at
20°C. The equivalence relationship is based on earlier tests made by the factory staff.
Storage time at 38°C Storage time at 20°C
2 days 4 weeks
7 days 13 weeks
13 days 26 weeks
20 days 39 weeks
The samples were stored dark to prevent possible oxidation reactions caused by
exposure to light.
2.5 Analyses of quality parameters in red wine Dissolved oxygen was measured in all the samples described in table 1 using a pH/oxi
340i with a CellOx 325 DO Electrode. Free SO2 was measured by acidifying samples of
wine with H2SO3 and then titrate with 0,01 M I2 solution in a TIM 845 Titration
Manager from TitraLab. Absorbances at 420, 520 and 620 nm were measured in all
samples, diluted ten times with distilled water, in a spectrophotometer. The absorbances
in the original samples were calculated from the measurements on the diluted samples.
A sensory evaluation by four experienced, but not professional, wine connoisseurs
working at the factory was also made on all of the samples. The instructions were to
identify possible differences in smell and taste between the samples. The wine samples
were poured into numbered wine glasses within half an hour before the evaluation. The
samples were numbered in chronological order but the connoisseurs did not know
anything about the differences between them.
Measurements of free SO2 and absorbance at 420, 520 and 620 nm and sensory
evaluations were made, using the same methods as earlier, after the respective storage
times on the samples put in storage.
2.6 Analysis of changes in dissolved oxygen during the production of apple cider When the production of a batch of apple cider, Astrakan dry 7 %, was started at the
factory, samples from the storage tanks for the liquid ingredients were taken in 500 ml
plastic bottles. Samples of 500 ml were also taken from the mixing tank after mixing the
ingredients added automatically, after the addition of citric acid and flavourings and
after the addition of potassium metabisulphite. DO content was measured in the samples
using a pH/oxi 340i with a CellOx 325 DO Electrode. An overview of the sample points
is shown in table 3.
Table 3. Overview of the sample points during production of Astrakan dry 7 %.
Sample point
Base wine
Apple concentrate
Water from storage tank
Cider before addition of citric acid and flavourings
Cider after addition of citric acid and flavourings
Cider after addition of K2S2O5 and blending

14
The production of another type of apple cider, Herrgårdscider apple, was also followed.
For the DO measurements the same pH/oxi 340i was used as in the previous
measurements, but with another, brand new, CellOx 325 DO Electrode. The first sample
was taken from the mixing tank after the addition of all of the ingredients except some
of the water. A sample was also taken after the rest of the water had been added and
another after the cider had been mixed in the tank for ten minutes. The samples were
transferred to 33 cl glass bottles which were sealed with capsules until the measurement
of DO content was made two hours later.
One day later samples were taken on the cider from the pipe it was pumped through
before it was to be filtered, from after the filtering and from the storage tank it was
pumped to after it had been pasteurized. An overview of the samples taken during
production of Herrgårdscider apple is shown in table 4.
Table 4. Overview of the samples taken during production of Herrgårdscider apple.
Sample point
Water from storage tank
Mixing tank after addition of ingredients
Mixing tank after 10 min of mixing
Mixing tank the next day
The next tank after pumping the cider from the mixing tank
After filtering
Storage tank after pasteurization and carbonation
Samples were taken from the filling line for the cider Astrakan half dry 2.2 % and DO
content was measured. Two samples were collected and analyzed immediately at each
point. The samples were taken from the pipe before the carbonating step, from the pipe
after the carbonating, from the pipe after the filtering and from the pipe just before the
filling machine. DO content was then measured in two bottles of cider immediately
after filling and from two additional bottles after they had been stored an hour in a
refrigerator. An overview of the samples taken during filling of Astrakan half dry 2.2 %
is shown in table 5.
Table 5. Overview of the samples points during filling of Astrakan half dry 2.2 %.
Sample point
Storage tank
After carbonation
After filtering
Before filling
After filling, pasteurization and cooling
After 1 hour in refrigerator

15
2.7 Effects of dissolved oxygen content on quality parameters in apple wine 2.7.1 Small scale laboratory production of apple cider
To study the effects of DO content on quality parameters in cider three batches of two
litres each of apple cider were made at the laboratory according to the recipe for
Astrakan dry 7%. A “low oxygen” cider, a “high oxygen” cider and a reference cider
were made. The ingredients were mixed in a plastic beaker with an L5M-A Laboratory
Mixer at 2 000 rpm for two minutes. For the reference cider nothing else was done. For
the low oxygen cider the water was heated and boiled for 5 minutes before being added.
The high oxygen cider was mixed heavier than the other two, at 4 000 rpm for five
minutes.
Each batch of cider was carbonated in a Sodastream soda maker before it was divided
into five 33 cl glass bottles. The headspace of the bottles from the low oxygen cider and
the reference cider were filled with a modified atmosphere, using the Private Preserve
bottle. The headspaces in the bottles of the high oxygen cider were filled with nitrogen.
The bottles were then slowly heated to 72°C, turned upside down for 10 seconds and
cooled. Free SO2 was then measured in one of the bottles from the high oxygen cider
with a TIM 845 Titration Manager.
Two bottles from each of the batches of cider were stored dark at 38°C for a week and
another two bottles from each batch were stored dark at room temperature for a week.
Ten bottles of Astrakan dry 7 % were collected from the factory. Three of the bottles
were and stored dark at room temperature for one month. Five of the bottles were stored
dark at 38°C for various amounts of time. One of them was stored for two days, two for
one week and the remaining two for 13 and 20 days respectively.
2.7.2 Analyses of quality parameters in apple cider
Before carbonation and bottling, DO content was measured in each batch of cider made
at the laboratory with a pH/oxi 340i with a CellOx 325 DO Electrode. Free SO2 was
measured in the batches with a TIM 845 Titration Manager. One day after carbonation,
bottling and pasteurization, DO content and free SO2 was measured again, in one bottle
from each batch of cider and in one of the factory produced bottles. Absorbance at 420
nm was then measured, in a spectrophotometer, on the cider in the already opened
bottles of cider made at the laboratory and in another bottle of cider from the factory.
After storage free SO2 and absorbance at 420 nm were measured in the bottles. A
sensory evaluation by two wine connoisseurs was made on one bottle from each batch
that had been stored at 38°C for one week, one bottle from the factory that had been
stored at 38°C for one week and on one of the bottles from the reference cider that had
been stored at room temperature for one week. Cider from the bottles was poured into
numbered wine glasses within half an hour before the evaluation. The instructions to the
connoisseurs were to identify possible differences in smell and taste between the
samples. The connoisseurs did not know anything about the differences between the
samples.

16
2.8 Effects of different processing steps on the foaming properties of pear base wine 2.8.1 Foaming test
The test of foaming ability in the wine was made according to the following procedure.
A 100 ml graduated cylinder is filled to the 50 ml mark with sample. Carbonated water
is poured into the cylinder and the time for the liquid surface to reach the 100 ml mark
without the foam overflowing is measured. The time from when the pouring of
carbonated water starts until the foam breaks up is also measured.
2.8.2 Production of pear base wine, GVP 50, 11,3
Two mixtures of 25 litres each of pear wine was made in two plastic buckets, according
to the recipe for GVP 50, 11.3. Sugar content was measured in the wines using an
RFM80 Refractometer from Bellingham + Stanley Ltd and Titratable acidity was
measured using a TIM 845 Titration Manager. Additional amounts of pear concentrate
had to be added to both of the wines and citric acid to one of them to reach the
appropriate sugar content of 20.3 – 20.7 °Bx and acidity of 0.40 – 0.44 g/l tartaric acid.
Measurement of sugar contents in the wines in the buckets were made once a day during
fermentation, except during the weekend, which occurred on the fourth and fifth day of
the fermentation. A fermentation of pear wine was started at the factory the day before
the wines at the laboratory. The results from the sugar content measurements the factory
staff made on this wine were written down. When the sugar contents in the wines had
reached 8.0 °Bx or below, potassium metabisulphite was added until free SO2 content
reached 60-65 mg/l.
To one of the buckets of wine 0.4 g each of the two enzymes Beerzym CHILL and
Fructozym®
UF from Erbslöh Geisenheim AG were added. Fining was then started on
both wines after they had been aerated for 15 minutes with an aquarium pump.
Bentonite, activated carbon, silica sol and gelatine were dissolved in tap water and
added to the wines. After the addition of fining agents, the wines were mixed
thoroughly and left to settle.
When the fermentation of the wine at the factory was finished and potassium
metabisulphite had been added, 5 litres were collected in a plastic can. Four litres of this
were then transferred to a glass beaker where fining was started in the same way as the
wines fermented at the laboratory.
After the wines had settled for two days they were filtered. The wines made at the
laboratory were manually filtered through AFST 110 filter plates using filtering kits
from the laboratory. Tap water was first filtered through the filters until the filtered
water no longer had a noticeable woody taste. Two days later 5 g (0.2 g/l) of potassium
sorbate were added to both wines. The turbidity of the wines was measured in a 2100N
Turbidimeter from Hach Company. As the turbidity was too high turbidity was then
also measured on samples taken from the surface of the wines filtered through 25 mm
syringe filters (polyethersulfone membrane, pore size 0.45 µm).

17
2.8.3 Analysis of the effects on foaming properties
A foaming test was made on both of the wines made at the laboratory prior to
fermentation. Foaming tests were also made on both of the wine mixtures and on the
wine that was being fermented at the factory once a day during the fermentation,
concurrently with the measurements of sugar content. After fining and settling two foam
tests were made on samples from the surface of each of the wines fermented at the
factory. After filtration and addition of potassium sorbate, three different tests were
made on samples from both of the wines, which had been filtered through the syringe
filters.
Three foam tests were also made on filtered samples from the wine fermented at the
factory but fined at the laboratory, and three foam tests were made on filtered samples
from wine both fermented and fined at the factory.
2.8.4 Analyses of the effects of different types of activated charcoal used in fining on foaming and sensory properties of pear base wine
A 5 l plastic can was filled with GVP 50, 11,3 that had been fermented at the factory,
after addition of potassium metabisulphite. Another 5 l plastic can were filled with the
same wine but after fining agents had been mixed into it at the factory. The can without
fining agents was divided into four 1 l plastic beakers. Fining was started in all of these
in the same way as before, but with different activated charcoal products. The first was
fined using the product generally used at the factory and at the previous experiments.
The second was fined using a product intended to reduce flavour but less so colour. The
third was fined using a product intended to mainly reduce colour intensity. The last was
fined using a 50/50 distribution of the products used in the second and third beaker. The
wines were left to settle until the next day together with the 5 l can of wine where fining
agents were added at the factory. Foam tests and measurements on free SO2, titratable
acidity, sugar content and absorbance at 420 nm were made on samples from all of the
wines filtered through syringe filters. Absorbance was measured on two samples from
each wine. A sensory evaluation by three experienced wine connoisseurs from the
factory staff were made on filtered samples of the wines. The samples were put in
numbered wine glasses within half an hour before the evaluation. The instructions were
to compare each of the wines where fining agents were added at the laboratory with the
one where fining agents were added at the factory as reference. The connoisseurs did
not know anything about the differences between the samples.

18
3 Results and discussion
3.1 Varying the dissolved oxygen content in tap water Average DO content in tap water blended for five minutes with L5M-A Laboratory
Mixer was 4,9 mg/l, according to the pH/oxi 340i. Measurements on four out of six
samples gave very similar values of about 5.0 mg/l while the other two were lower. The
lowest was 4.6 mg/l. The standard deviation was 0,19 mg/l. Average DO content in
water boiled for five minutes was 1,02 and the standard deviation 0,10 mg/l, when
measuring with the pH/oxi 340i. Immediately after taking it from the tap, the water
contained about 3.6 - 3.7 mg/ l of dissolved oxygen. Just a few measurements were
made with the orbisphere 3650, as the liquid flow through the measuring instrument
was too low during the measurements. However, the orbisphere 3650 yielded lower
values, 1.2 mg/l dissolved oxygen for untreated tap water and 0.6 mg/l for boiled. No
correlation were seen between DO content and temperature in either of the samples
measured throughout this project. As the temperature of a solution affects the maximum
amount of oxygen that can be dissolved in the solution it is possible that temperature
has minimum impact on DO content as long as the solution is not saturated.
Furthermore, most of the samples measured throughout this project were measured
immediately after preparation, which means that the rate at which equilibrium arises in
the samples is irrelevant.
3.2 Comparison of the different measuring methods for dissolved oxygen
The comparison of the different methods for measuring DO content is illustrated in
table 6. The DO electrode used with the pH/oxi 340i is brand new, and not the same as
the one used when doing the previous measurements on tap water. In comparison, the
new electrode gives much higher values than the older one. However, the new electrode
and the titration kit resulted in more similar values. As both these products are brand
new and correspond quite well with each other they should be closer to the correct
values than the orbisphere and the old electrode. The orbisphere 3650 displayed very
low values even when DO content was higher, but was better at measuring low values.
Even at low values though, the orbisphere 3650 gave lower values than the other
measuring methods.
Table 6. DO content in samples of distilled water after different preptreatments, measured using three
different methods. The pH/oxi 340i was used with new DO-electrode and the old electrode was not
included in the comparison.
Water
pretreatment
DO content,
measured with a
pH/oxi 340i, (mg/l)
DO content, measured
with an orbisphere
3650 (mg/l)
DO content,
measured by
titration (mg/l)
Blended 8.38 2.32 7.3
Boiled 1.85 1.63 2.0
Untreated 6.36 2.22 5.7
The reproducibility test for the titration method for measuring DO content gave a
calculated standard deviation of 0.153 for DO content in tap water. The mean value of
the measurements was 7.53 mg/l. The pH/oxi 340i still gave a slightly higher value, 7.7
mg/l.

19
As the different measuring devices for measuring DO content available at the factory
give very different results the values achieved by the different devices should not be
compared to each other. However, it seems that any of the devices can be used to
correctly separate a number of samples in order of DO content. The methods used do
not provide answers to whether the difference in DO content between equivalent
samples depends on the actual difference or the accuracy of the measuring method.
3.3 Dissolved oxygen content in water reservoirs at Kiviks Musteri There were no distinct differences in DO content in the water from water reservoirs at
the factory. Interestingly though, the incoming water to the pool at the water treatment
plant contained much less dissolved oxygen than the water already stored in the pool.
Even when measuring later in the day when a lot of the water in the pool presumably
had turned over the DO content had not changed. The temperature did not vary much
and showed no correlation with DO content. DO content at the sample points are shown
in table 7.
Table 7. DO-content in the water from the different water reservoirs. The measurements were made with
a pH/oxi 340i with the old DO electrode.
Sample point DO content
(mg/l)
Tap in the laboratory 4.00
Pool at the plant, midmorning 4.24
Pool at the plant, afternoon 4.28
Water tank at the wine house 4.30
Water from drilling hole no. 2 1.77
Water from drilling hole no. 4 1.66
Water from drilling hole no. 5 1.15
3.4 Effects of different processing steps on quality parameters in red wine Pumping the red wine from the truck to the storage tank did not affect DO content
much.
DO content was higher when the wine was pumped from the truck without infusion of
nitrogen and when the wine was pumped to the storage tank. Both of these samples
were collected from taps directly from the pipes. No record was made on which samples
foamed the most during filling of the sample bottles but one explanation may be that the
pumping introduces air bubbles in the wine. This could cause more oxygen to dissolve
in the samples after sealing the sample bottles.
Pasteurization followed by filling the wine into Tetra Prisma® packages lowered the
amount of dissolved oxygen in the wine, as did addition of K2S2O5. DO content was
also lower towards the end of the filling procedure. A decrease in DO content was not
seen in any of the sysmtems studied by Castellari et al. (24). The type of pasteurization
system used at the factory is unknown, so it is difficult to tell if the pasteurization may
be the cause of the loss of dissolved oxygen.

20
The amount of free SO2 content in the wine increased with addition of sulphite.
Nitrogen infusion caused a small increase in free SO2 while the pumping through the
first pipeline from the truck to the deaeration tank decreased it. The reasons for the
differences are unknown but could depend upon measuring errors. The consistency of
the measuring results from the three sample points before the addition of SO2
contradicts this though. Free SO2 content was lower in the wine after pasteurization and
filling. It is hard to tell if the loss in free SO2 occurred during the pasteurization or the
filling. The changes in DO and free SO2 contents during the processing steps are shown
in table 8. The temperature did not vary much nor showed any patterns with the other
parameters during processing and filling, neither did the absorbance.
Free SO2 content increased when the wine was infused with nitrogen, and decreased
when the wine was pumped to the deaeration tank without nitrogen infusion. Pumping
of the wine after the deaeration tank did not affect the free SO2 content. The reason for
these differences remains unknown, but there is the possibility of measuring errors. The
consistency of the measuring results from the three sample points before the addition of
SO2 contradicts this though.
Table 8. Changes in DO-content, free SO2 and absorbance at 420, 520 and 620 mm in red wine during
pumping, sulphuration, pasteurization and filling.
Sample point DO content
(mg/l)
Free SO2
(mg/l)
Abs at
420 nm
Abs at
520 nm
Abs at
620 nm
Storage tank before
transferring the new
wine
1.18 30.0 2.75 4.01 0.79
Storage tank on the truck 1.11 28.5 2.74 4.00 0.78
Pipe before deaeration
tank without N2 infusion 2.23 26.1 2.77 4.00 0.80
Pipe before deaeration
tank with N2 infusion 1.11 30.1 2.68 3.93 0.79
Pipe before storage tank 1.38 30.1 2.81 4.09 0.80
Storage tank after
transferring the wine 1.15 30.1 2.79 4.08 0.81
Storage tank after
K2S2O5 addition 0.90 43.9 2.63 3.73 0.74
Packed product,
beginning of filling
procedure
0.78 39.3 2.75 3.87 0.76
Packed product, end of
filling procedure 0.54 39.0 2.60 3.68 0.73
Between the samples from the truck before the pumping to the packed and pasteurized
products the odours described as “fruitiness” or “berryness” by the connoisseurs
decreased from the first to the last sample. This decrease, according to two of the four

21
connoisseurs participating in that analysis, occurred foremost after the first pumping
and after the pasteurization and filling. As no sample could be taken between the
pasteurization and the filling it is hard to say which has the most influence. It is likely
though that heat treatment can have an impact on the sensory properties. The results
also indicate that mechanical treatments can have a negative impact on the sensory
properties of red wine.
3.5 Effects of dissolved oxygen and different storing conditions on quality parameters in red wine Free SO2 in red wine decreased over time when the wine was stored at 38°C, as seen in
table 9. Absorbance at 420 and 520 nm also increased, while absorbance at 620 nm didn
not change. The changes seemed to be reversed during the last seven days of storage.
Table 9. Changes in free SO2 and absorbance at 420, 520 and 620 nm in packed products of red wine,
taken out during the middle of the filling procedure at the factory, stored at 38°C. One separate package
of wine was analysed at each time. The reason for this was to avoid possible effects on later
measurements by introduction of additional oxygen when the packages are opened prior to the
measurements.
Time of
storage
Free SO2
(mg/l)
Abs at
420 nm
Abs at
520 nm
Abs at
620 nm
None 42.67 2.65 3.89 0.76
2 days 39.46 2.72 3.93 0.77
7 days 38.43 2.74 3.90 0.76
13 days 32.26 2.85 4.05 0.78
20 days 32.51 2.81 3.96 0.76
Free SO2 in the package of red wine stored 26 weeks at room temperature was 25 mg/l.
Absorbance was 3,012 at 240 nm, >3,5 at 520 nm and 0,903 at 620 nm. The taste of the
wine was (judged as) acceptable.
After the wine taken out from the different processing steps had been pasteurized and
stored at 38°C for one week the same changes were seen in free SO2 and absorbance in
all samples. Free SO2 decreased and absorbance at 420, 520 and 620 nm increased. The
same changes were also seen in wine stored at room temperature for one month. Free
SO2 changed with about the same amount in all samples, independently of the storage
condition, except for the sample from the storage tank after K2S2O5 addition.
Absorbance at 420, 520 and 620 nm increased more in the samples stored at room
temperature for one month. Free SO2 and absorbance at 420, 520 and 620 nm in the
stored samples are shown in table 10.

22
Table 10. Free SO2 and absorbance at 420, 520 and 620 nm in red wine taken out from different points
between the pumping, sulphuration, pasteurization and filling processes after storage at 38°C for one
week or at room temperature for one month.
Sample taking point Sample
no
Free SO2
(mg/l)
Abs at
420
Abs at
520
Abs at
620
Storage at 38°C for one week:
Storage tank on the truck 1 16.0 3.28 4.52 0.89
Pipe before deaeration
tank without nitrogen 2 11.5 3.45 4.77 0.96
Pipe before deaeration
tank with nitrogen 3 16.0 3.38 4.75 0.94
Storage tank before
transferring the new
wine
4 16.1 3.31 4.71 0.96
Storage tank after
K2S2O5 addition 5 33.9 3.03 4.29 0.84
Packed product,
beginning of filling
procedure
6 33.9 2.82 4.02 0.78
Packed product, middle
of filling procedure 7 38.4 2.74 3.90 0.76
Packed product, end of
filling procedure 8 38.4 2.71 3.94 0.75
Storage at room temperature for one month:
Storage tank on the truck 1 16.6 3.44 4.78 0.97
Pipe before deaeration
tank without nitrogen 2 11.4 3.61 4.95 0.99
Pipe before deaeration
tank with nitrogen 3 15.8 3.33 4.73 0.97
Storage tank before
transferring the new
wine
4 15.9 3.53 4.97 1.02
Storage tank after
K2S2O5 addition 5 24.8 3.17 4.39 0.88
Packed product, middle
of filling procedure 7 38.8 2.68 3.92 0.76

23
There was a somewhat linear correlation between initial DO content and loss of free
SO2 in all samples stored a week at 38°C except in the sample from the pipe before the
deaeration tank which had not been infused with nitrogen, in which the loss of free SO2
was lower than expected. No correlation was seen between initial DO content and loss
of free SO2 in samples stored a month at room temperature. On the other hand loss of
free SO2 is almost similar in four of the five samples as the corresponding samples
stored a week at 38°C, while the sample from the storage tank after K2S2O5 addition
diverge a lot. This means that the same correlation possibly could be seen between
oxygen and SO2 in samples stored a month at room temperature if a larger number of
samples would be analysed. This would preferably also be made with duplicates or
triplicates of each sample to get more convincing results.
Decrease in free SO2 during storage at room temperature was greater than expected. The
amount of free SO2 was almost the same as after a week at 38°C, which is supposed to
be equivalent to more than three months at 20°C. On the other hand, when looking at
table 8, most of the decrease in free SO2 during the storage at 38°C occurred within the
first two days, which would be equivalent to a month at 20°C. Furthermore the
temperature in the laboratory may have been above 20°C.
The increase in colour intensity, expressed as the sum of the absorbance at 420, 520 and
620 nm, was in general higher in samples with higher initial DO content. There was no
clear correlation though. This contradicts the results from Caillé et al. (20), who found
that micro-oxygenation before bottling resulted in lower colour intensity after storage.
On the other hand the storage time in that study was much longer and the colour of red
wine changes during ageing independent of oxygen as well (14-16), which means that
the impact of initial DO content could decrease over time. Caillé et al. (20) also found
that higher oxygen exposure during storage resulted in higher colour intensity, which
indicates that the colour intensity of red wine indeed increases with higher exposure to
oxygen and corresponds to the results of this study . Furthermore, the stepwise
measurements of wine stored at 38°C showed a decrease in colour intensity towards the
end of the storage.
The samples stored a month at room temperature had slightly higher colour intensity
than the ones stored a week at 38°C. Yet again the changes during storage in room
temperature are greater than expected.
After the wine had been stored for one week at 38°C all of the samples tasted and
smelled bad according to the connoisseurs, except the one from the truck which was
mediocre. Even the sample from the truck was described as “rough” or “oxidized” in
taste by two of them though. The samples stored for one month in room temperature
were more appealing and the wine from the truck was described much in the same way
after a month of storage as before storage. It still had a higher “fruitiness” or
“berryness” than the other samples after one month at room temperature. From the
descriptions from all but one of the connoisseurs the conclusion was that the sample
from the pipe before the deaeration tank which had not been infused with nitrogen was
the worst tasting after a week at 38°C. Two described it as “oxidized” in smell and taste.
It did not diverge from the other samples after a month at room temperature though.
Three connoisseurs described the packed product from the beginning of the filling
procedure as one of the worst with an indication of mould after a week at 38°C, while
two thought the one from the end of the filling procedure was among the better. The

24
wine from the storage tank and the packed product had the least appealing smell after a
month at room temperature.
In general the sensory quality of red wine was worse after storage for a week at 38°C
than after storage for a month at room temperature. Storage temperature is seemingly
very important for the sensory changes in red wine and even the package stored for six
months at room temperature was acceptable. In comparison temperature had much
lesser influence on the increase in colour intensity. Oxygen and SO2 had very little
influence on the sensory changes during storage. High DO content led to oxidized off
odours after a week at 38°C, but not after a month at room temperature. The wine from
the truck was clearly the most appealing, even after pasteurization and storage.
Mechanical treatment of a wine therefore may be an important factor in the sensory
qualities of the wine. Nevertheless, one must consider that these results derive from the
opinions of a few connoisseurs made on a few number of samples. As no duplicates
were used, the differences between individual samples are unclear. These results are not
enough to verify that the differences in sensory quality between the samples actually
derive from the different processing steps. The differences between individual samples
exposed to the same treatments should be studied before establishing the magnitude of
these findings.
3.6 Dissolved oxygen content in cider after different processing steps Changes in DO content during production of two different apple ciders, Astrakan dry 7
% and Herrgårdscider apple 0,3 % are shown in table 11 and 12. The measurements
were made with a pH/oxi 340i but different DO electrodes were used during the
measurements for each cider. Measurements after the filtering, pasteurization and
carbonation steps were only made for the Herrgårdscider apple 0,3 %.
Table 11. DO content in samples taken from the cider ingredients and the cider mixture after different
steps in the production of Astrakan dry 7 %. The temperature in the samples varied between 17.2 and 19.2
°C. The measurements were made with a pH/oxi 340i.
Sample point DO content
(mg/l)
Base wine 2.20
Apple concentrate 0.82
Water from storage tank 3.93
Cider before addition of
citric acid and flavourings 3.58
Cider after addition of
citric acid and flavourings 4.09
Cider after addition of
K2S2O5
and blending
4.13
25
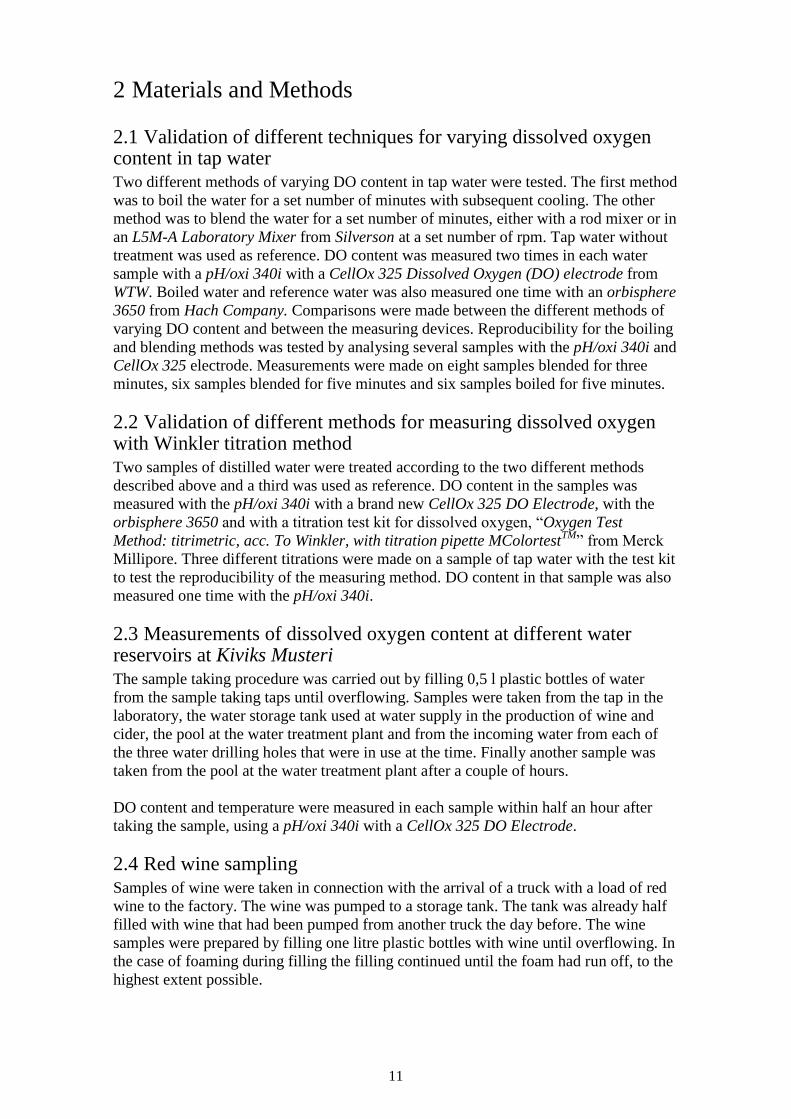
Table 12. DO content in the water used for the cider production and in the cider during different steps in
the production of Herrgårdscider apple. The temperature in the samples varied between about 16 and
18°C in all of the samples but the last one, where the temperature was about 7°C. The measurements were
made with a pH/oxi 340i.
Sample point DO content
(mg/l)
Water from storage tank 8.17
Mixing tank after addition of
ingredients 8.94
Mixing tank after 10 min of
mixing 9.05
Mixing tank the next day 8.95
The next tank after pumping
the cider from the mixing tank 9.21
After filtering 8.97
Storage tank after
pasteurization and carbonation 0.79
Pumping and mixing introduced small quantities of oxygen into the cider.
Pasteurization and carbonation, however, eliminated almost all of the oxygen in the
cider. In the filling line the cider is also carbonated, filtered and pasteurized a second
time. The results from the measurements made after the processing steps in the filling
line are shown in table 13.
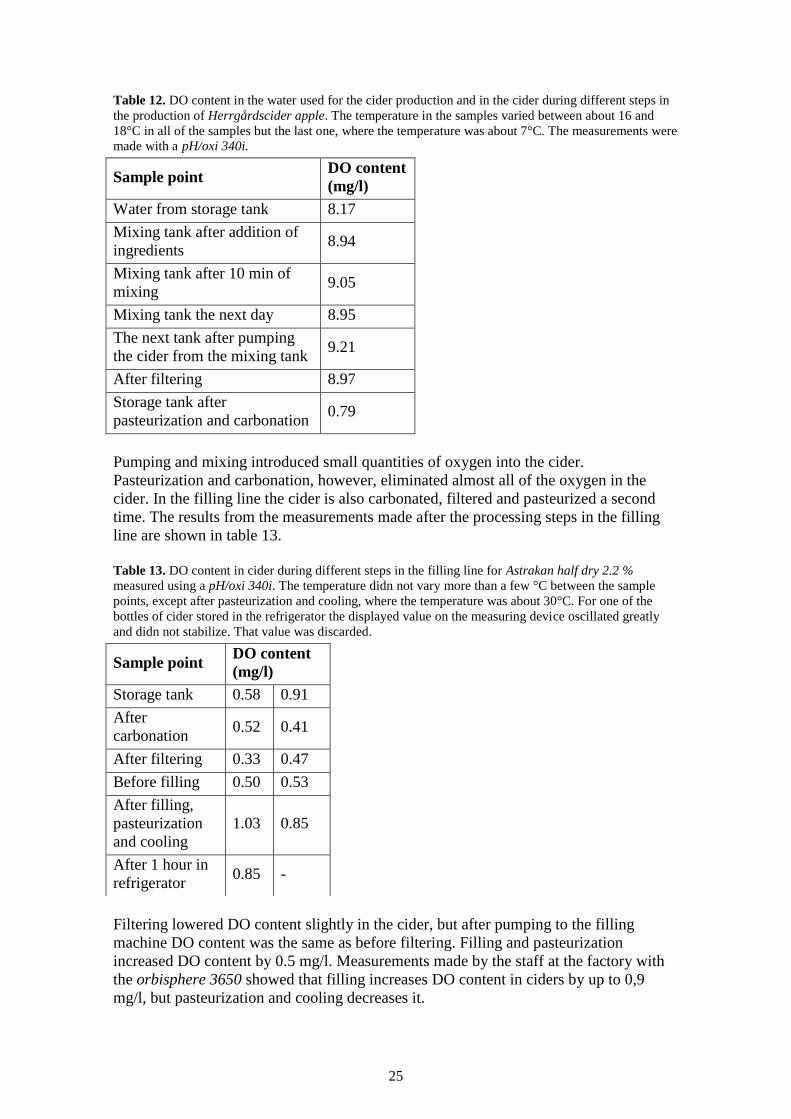
Table 13. DO content in cider during different steps in the filling line for Astrakan half dry 2.2 %
measured using a pH/oxi 340i. The temperature didn not vary more than a few °C between the sample
points, except after pasteurization and cooling, where the temperature was about 30°C. For one of the
bottles of cider stored in the refrigerator the displayed value on the measuring device oscillated greatly
and didn not stabilize. That value was discarded.
Filtering lowered DO content slightly in the cider, but after pumping to the filling
machine DO content was the same as before filtering. Filling and pasteurization
increased DO content by 0.5 mg/l. Measurements made by the staff at the factory with
the orbisphere 3650 showed that filling increases DO content in ciders by up to 0,9
mg/l, but pasteurization and cooling decreases it.
Sample point DO content
(mg/l)
Storage tank 0.58 0.91
After
carbonation 0.52 0.41
After filtering 0.33 0.47
Before filling 0.50 0.53
After filling,
pasteurization
and cooling
1.03 0.85
After 1 hour in
refrigerator 0.85 -

26
According to these results DO content in the liquid ingredients used in ciders is of
minor concern for DO content in the final product as almost all of the oxygen is
eliminated during the carbonation of the cider. The same can therefore be said for the
different processing steps preceding the carbonation and for the production of base
wines used as ingredients in ciders. Most of the oxygen in the final product is
introduced during the filling of the bottles. The bottling system used at the factory is a
counterpressure filler, the type of system that resulted in the highest increase in DO
content in the study by Castellari et al. (24).
3.7 Effects of dissolved oxygen on quality parameters in apple cider One day after carbonation, bottling and pasteurization of the three batches of apple cider
made at the laboratory DO content was highest in the high oxygen cider and lowest in
the low oxygen cider. Free SO2 was highest in the reference cider and lowest in the high
oxygen cider. The values are shown in table 14.
Table 14. Free SO2, DO content and absorbance at 420 in bottles from the different cider batches the day
after carbonation, bottling and pasteurization and in a bottle of cider produced at the factory.
Cider sample Free SO2
(mg/l)
DO content
(mg/l)
Abs at
420 nm
Reference 35.04 1.61 0.120
Low oxygen 34.56 1.44 0.119
High oxygen 30.03 2.16 0.119
Factory produced 39.93 1.80 0.083
Before carbonation, bottling and pasteurization free SO2 was highest in the low oxygen
cider. Free SO2 increased by 0.5-2 mg/l during carbonation, bottling and pasteurization
in both the reference cider and the high oxygen cider. DO content decreased by about 50
% during carbonation, bottling and pasteurization. Absorbance at 420 nm did not differ
between the laboratory produced ciders but it was much lower at the factory produced
cider. During a week of storage at 38°C free SO2 decreased in all bottles. Absorbance at
420 nm decreased slightly as well. However, decrease in absorbance was not significant
in the factory produced bottle (p = 0.05). Amount of free SO2 and absorbance at 420 in
the samples are shown in table 15.
Table 15. Free SO2 and absorbance at 420 in bottles from the different cider batches after a week of
storage at 38°C.
Cider sample Free SO2 (mg/l) Abs 420
Reference 29.48 29.64 0.112 0.113
Low oxygen 29.47 30.91 0.114 0.114
High oxygen 24.95 25.38 0.114 0.114
Factory produced 23.32 25.01 0.079 0.080
No correlation was found between initial DO content and decrease in free SO2. Free
SO2 was lowest in the high oxygen cider both before and after storage. Decrease in free
SO2 was much greater in the cider produced at the factory, though. The reason for this
difference remains unknown. Decrease in both free SO2 and absorbance at 420 nm
directly contradicts the results from other studies (21, 22) and the suggestion that

27
oxidation during storage causes browning in the ciders. Those studies were made on
white wine and not cider but oxidation reactions are likely to cause browning in cider as
well as some oxidation products from apple juice absorbs at 420 nm (19).
Free SO2 decreased in the samples stored a week at room temperature as well, but the
decrease was much smaller. The highest decrease was seen in the reference, 1.08 mg/l.
There was also a slight decrease in absorbance but not significant for either of the
samples (p = 0.05).
The low oxygen cider was described as less fruity after a week at 38°C than the
reference cider while the high oxygen cider was described as fruitier than the reference
cider by the connoisseurs. The factory produced cider was the fruitiest amongst the
samples stored at 38°C while the opinions on the reference cider stored at room
temperature differed between the two connoisseurs. In this case higher initial DO
content had a positive effect on the sensory quality during storage of the ciders
produced at the laboratory. As the absorbance at 420 nm was not affected either there is
a possibility that mainly sulphite oxidised while most other oxidizable substances did
not. Furthermore a low exposure to oxygen has shown a beneficial effect on the sensory
quality of white wine (22) and this may apply to apple cider as well.
Stepwise measurements on cider bottles stored at 38°C verified that free SO2 greatly
decreases and absorbance at 420 nm slightly decreases over time, as shown in table 16.
Table 16. Initial DO content and free SO2 and absorbance at 420 nm in factory produced bottles of cider
after storage at 38°C for various amounts of time. The values for the cider stored for seven days are
calculated mean values from the values from the two factory produced bottles presented in table 15.
Time of storage DO content
(mg/l)
Free SO2
(mg/l)
Abs at
420 nm
None 1.4 39.93 0.083
2 days - 33.93 0.080
7 days - 24.17 0.080
13 days - 19.34 0.078
20 days - 16.28 0.079
Apple cider produced at the factory and stored one month at room temperature had on
average 26.74 mg/l free SO2 and absorbance 0.080 at 420 nm. Decrease in free SO2 and
absorbance at 420 nm was therefore only slightly lower than in in apple cider stored a
week at 38°C.
3.8 Effects of fermentation and fining on the foaming ability of pear base wine. Fermentation time of the wines produced at the laboratory was six days and
fermentation time of the wine produced at the factory was ten days. This means that
fermentation time of pear base wine was shorter when fermentation was made in a
smaller scale. The results of the foam tests during the fermentation of the wines are
presented in figure 8.
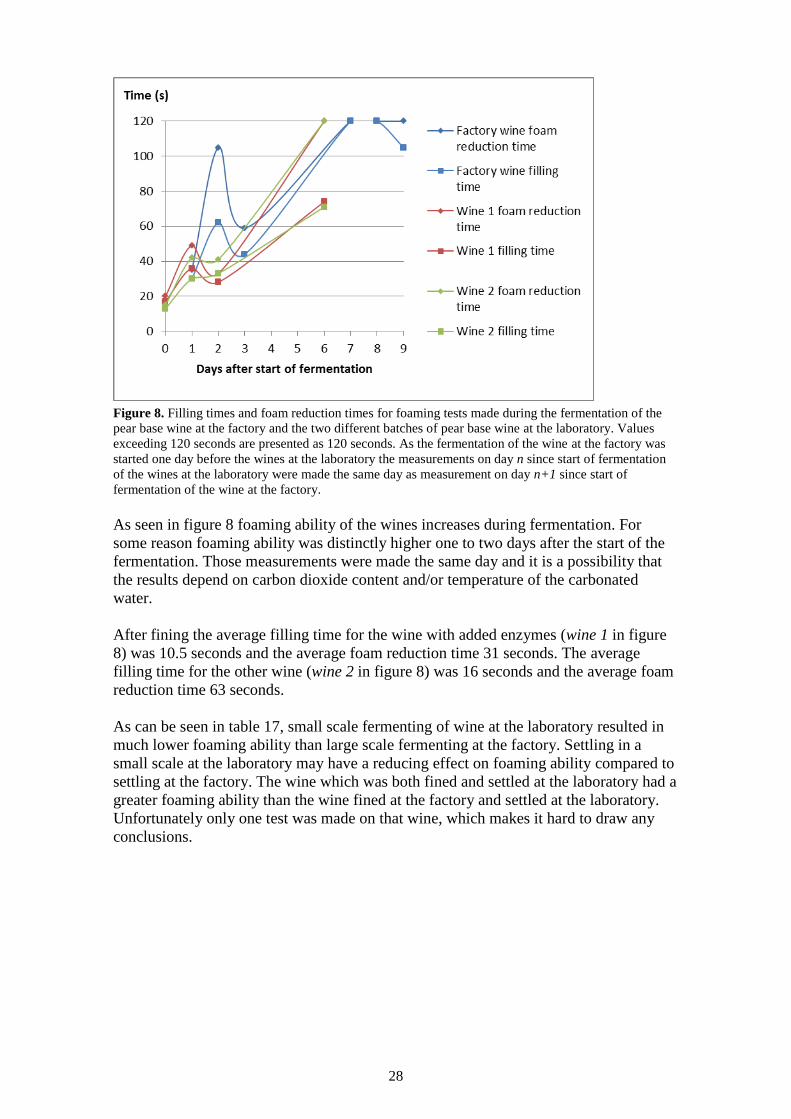
28
Figure 8. Filling times and foam reduction times for foaming tests made during the fermentation of the
pear base wine at the factory and the two different batches of pear base wine at the laboratory. Values
exceeding 120 seconds are presented as 120 seconds. As the fermentation of the wine at the factory was
started one day before the wines at the laboratory the measurements on day n since start of fermentation
of the wines at the laboratory were made the same day as measurement on day n+1 since start of
fermentation of the wine at the factory.
As seen in figure 8 foaming ability of the wines increases during fermentation. For
some reason foaming ability was distinctly higher one to two days after the start of the
fermentation. Those measurements were made the same day and it is a possibility that
the results depend on carbon dioxide content and/or temperature of the carbonated
water.
After fining the average filling time for the wine with added enzymes (wine 1 in figure
8) was 10.5 seconds and the average foam reduction time 31 seconds. The average
filling time for the other wine (wine 2 in figure 8) was 16 seconds and the average foam
reduction time 63 seconds.
As can be seen in table 17, small scale fermenting of wine at the laboratory resulted in
much lower foaming ability than large scale fermenting at the factory. Settling in a
small scale at the laboratory may have a reducing effect on foaming ability compared to
settling at the factory. The wine which was both fined and settled at the laboratory had a
greater foaming ability than the wine fined at the factory and settled at the laboratory.
Unfortunately only one test was made on that wine, which makes it hard to draw any
conclusions.

29
Table 17. Foam reduction times and filling times for foaming tests made after fining and filtering of the
pear base wine fermented at the factory and the batches of pear base wine fermented at the laboratory. All
of the samples have been filtered through syringe filters.
Wine sample Filling time
(s)
Foam reduction
time (s)
Fermented, fined and settled at the factory
>120 >120
>120 >120
116 >120
Fermented and fined at the factory, settled at the
laboratory
85 >120
82 >120
70 >120
Fermented at the factory, fined and settled at the
laboratory >120 >120
Wine 1, fermented, fined and settled at the
laboratory*
11 23
9 21
8 18
Wine 2, fermented fined and settled at the
laboratory
13 35
10 30
7 24 *Contains the enzymes Beerzym CHILL and Fructozym
® UF.
The enzymes Beerzym CHILL and Fructozym®
UF had a reducing effect on the foaming
ability of pear base wine, but the effect was less noticeable after filtering the wine.
Fermentation had by far the greatest effect on foaming ability. Small scale fermentation
at the laboratory led to distinctly less foaming in the wines. Future research should
focus on studying the reason for this difference.
The small beneficial effect of the enzymes is somewhat surprising. Beerzym CHILL is a
product supposed to increase foam stability in beer (29). Fructozym is mainly a
pectinase (30) and therefore should have no to little effect in the pear base wine from
Kiviks Musteri, as the wine is free from detectable pectin according to a pectin test (13).
No effects were seen on the foaming ability, titratable acid, alcohol content or sugar
content in pear base wine when different types of activated charcoals were used in
fining. As can be seen in table 19, there was a difference in absorbance at 420 nm. The
charcoal currently used at Kiviks Musteri resulted in the lowest absorbance and the
charcoal intended for reduced flavour resulted in the highest absorbance. Titratable acid,
alcohol content and sugar content were higher when fining agents were added at the
factory.

30
Table 19. Absorbance at 420 nm, titratable acid, alcohol content and sugar content in pear base wine after
fining, using different types of activated charcoal. The sample for which the fining agents were added at
the factory was collected from the fining tank after the factory staff had added the agents to the tank. The
rest were fined in smaller quantities at the laboratory.
Fining method Abs at
420 nm
Titratable
acid (mg/l)
Alcohol
content (%)
Sugar content
(°Bx)
Adding fining
agents at factory,
settling at lab
0.030 0.679 10.7 7.9
Standard fining
agents 0.030 0.658 9.76 7.4
Charcoal 1
(reduced flavour) 0.041 0.651 9.56 7.35
Charcoal 2
(reduced colour) 0.035 0.663 9.72 7.4
Mix of charcoal
1+2 0.037 0.664 9.89 7.35
Compared to the wine fined at the factory wine fined with charcoal intended for reduced
flavour was perceived more “acidic”. Wine fined with charcoal intended for reduced
colour was “richer” and “fruitier” in taste than the others and most pleasant. It was also
the one which diverged most from the others. Wine fined with a mixture of the two was
perceived “watery” in comparison with the wine from the factory. That one was the
most correspondent to the factory wine in “fruitiness” and “body” though.
The activated charcoal product currently in use at Kiviks Musteri was, when compared
to the other products, very effective at reducing both the overall flavour and absorbance
at 420 nm of pear base wine. It was the most effective at reducing absorbance at 420 nm
amongst the tested products.

31
4 Conclusions In this study it was seen that pumping and pasteurization followed by filling in Tetra
Prisma® packages had negative impacts on the fruitiness of red wine. This was still
noticeable after storage at 38°C or room temperature for different amount of times. Free
SO2 decreased and colour intensity increased during storage of red wine at 38°C and at
room temperature. Higher DO content resulted in a higher increase in colour intensity
after storage at both 38°C and room temperature. Higher DO content also resulted in a
greater decrease in free SO2 when the wine was stored at 38°C, but not when it was
stored at 20°C. The sensory quality of red wine was reduced during storage but was not
affected by DO content. Storage temperature had a much greater impact on reduction of
the sensory quality than on changes in colour intensity and free SO2. Both the storage
temperature and time have to be taken into account when looking at the changes in red
wine during storage. In this study a longer storage period of red wine could not
accurately be simulated by just increasing the storage temperature.
DO content in apple cider does not change much during mixing of the cider. Dissolved
oxygen is however eliminated to a great extent during carbonation and most of the
dissolved oxygen in the final product is introduced during the filling procedure. Higher
initial DO content in apple cider produced at the laboratory had a beneficial effect on
fruitiness in the cider after storage. The amount of data available through this study is
too low to draw any conclusions from this though. Neither free SO2 nor absorbance at
420 nm was affected by DO content during storage of apple cider. Data from a larger
number of samples would have been desirable here as well.
The foaming ability of pear base wine was greatly reduced when fermentation was done
in a much smaller scale. The enzymes Beerzym CHILL and Fructozym®
UF had a very
small but noticeable reducing effect on foaming ability while the choice of activated
charcoal product had no effect. In comparison to other activated charcoal products the
charcoal currently in use at Kiviks Musteri is effective at reducing both flavour and
colour intensity of pear base wine.

32
References 1. Cider, LIVSFS 2005:11 (2005).
2. Ribéreau-Gayon P, Glories Y, Maujean A, Dubourdieu D. Handbook of Enology,
The Chemistry of Wine: Stabilization and Treatments. 2 ed. England: Wiley; 2006. 450
p.
3. Brossaud F, Cheynier V, Noble AC. Bitterness and astringency of grape and wine
polyphenols. Australian Journal of Grape and Wine Research: Blackwell Publishing
Ltd; 2001. p. 33-9.
4. Kennedy JA. Grape and wine phenolics: Observations and recent findings. Ciencia e
investigación agraria. 2008;35:107-20.
5. Fennema OR, Parkin KL, Damodaran S. Fennema's Food Chemistry. 4 ed. USA:
CRC Press, Taylor & Francis Group; 2008. 1160 p.
6. Moreno- rribas , ueyo E, ieto F , Mart n-Álvarez PJ, Polo MC. Influence of the
polysaccharides and the nitrogen compounds on foaming properties of sparkling wines.
Food Chemistry. 2000;70(3):309-17.
7. Blanco-Gomis D, Mangas-Alonso JJ, Junco-Corujedo S, Gutiérrez-Álvarez MD.
Characterisation of sparkling cider by the yeast type used in taking foam on the basis of
polypeptide content and foam characteristics. Food Chemistry. 2009;115(1):375-9.
8. Andrés-Lacueva C, López-Tamames E, Lamuela-Raventós RM, Buxaderas S, de la
Torre-Boronat MdC. Characteristics of Sparkling Base Wines Affecting Foam
Behavior. Journal of Agricultural and Food Chemistry. 1996;44(4):989-95.
9. Picinelli Lobo A, Fernandez Tascon N, Rodriguez Madrera R, Suarez Valles B.
Sensory and Foaming Properties of Sparkling Cider. Journal of Agricultural and Food
Chemistry. 2005;53(26):10051-6.
10. Blanco-Gomis D, Mangas-Alonso JJ, Junco-Corujedo S, Gutiérrez-Álvarez MD.
Cider roteins and Foam Characteristics: Contribution to Their Characterization.
Journal of Agricultural and Food Chemistry. 2007;55(7):2526-31.
11. Girbau-Solà T, López-Tamames E, Buján J, Buxaderas S. Foam Aptitude of Trepat
and Monastrell Red Varieties in Cava Elaboration. 1. Base Wine Characteristics.
Journal of Agricultural and Food Chemistry. 2002;50(20):5596-9.
12. Narchi I, Vial C, Djelveh G. Effect of protein–polysaccharide mixtures on the
continuous manufacturing of foamed food products. Food Hydrocolloids.
2009;23(1):188-201.
13. Dahlström K. How fining agents affect the tendency of pear base wine to form and
stabilize foam. Linnaeus University, School of Natural Sciences; 2010. p. 43.
14. Atanasova V, Fulcrand H, Cheynier V, Moutounet M. Effect of oxygenation on
polyphenol changes occurring in the course of wine-making. Analytica Chimica Acta.
2002;458(1):15-27.
15. Remy S, Fulcrand H, Labarbe B, Cheynier V, Moutounet M. First confirmation in
red wine of products resulting from direct anthocyanin–tannin reactions. Journal of the
Science of Food and Agriculture. 2000;80(6):745-51.
16. Bishop PD, Nagel CW. Characterization of the condensation product of malvidin
3,5-diglucoside and catechin. Journal of agricultural and food chemistry.
1984;32(6):1022-6.
17. Wirth J, Morel-Salmi C, Souquet JM, Dieval JB, Aagaard O, Vidal S, et al. The
impact of oxygen exposure before and after bottling on the polyphenolic composition of
red wines. Food Chemistry. 2010;123(1):107-16.

33
18. Foti MC. Antioxidant properties of phenols. J Pharm Pharmacol. 2007;59(12):1673-
85.
19. Bernillon S, Guyot S, Renard CMGC. Detection of phenolic oxidation products in
cider apple juice by high-performance liquid chromatography electrospray ionisation
ion trap mass spectrometry. Rapid Communications in Mass Spectrometry.
2004;18(9):939-43.
20. Caillé S, Samson A, Wirth J, Diéval JB, Vidal S, Cheynier V. Sensory
characteristics changes of red Grenache wines submitted to different oxygen exposures
pre and post bottling. Anal Chim Acta. 2010;660(1-2):35-42.
21. Godden P, Francis L, Field J, Gishen M, Coulter A, Valente P, et al. Wine bottle
closures: physical characteristics and effect on composition and sensory properties of a
Semillon wine 1. Performance up to 20 months post-bottling. Australian Journal of
Grape and Wine Research. 2001;7(2):64-105.
22. Skouroumounis GK, Kwiatkowski MJ, Francis IL, Oakey H, Capone DL, Duncan
B, et al. The impact of closure type and storage conditions on the composition, colour
and flavour properties of a Riesling and a wooded Chardonnay wine during five years'
storage. Australian Journal of Grape and Wine Research. 2005;11(3):369-77.
23. Mas A, Puig J, Lladoa N, Zamora F. Sealing and Storage Position Effects on Wine
Evolution. Journal of Food Science. 2002;67(4):1374-8.
24. Castellari M, Simonato B, Tornielli GB, Spinelli P, Ferrarini R. Effects of different
enological treatments on dissolved oxygen in wines. Italian journal of food science.
2004;16(3):387-97.
25. Siebert KJ, Lynn PY. Mechanisms of Adsorbent Action in Beverage Stabilization.
Journal of Agricultural and Food Chemistry. 1997;45(11):4275-80.
26. Vanrell G, Canals R, Esteruelas M, Fort F, Canals JM, Zamora F. Influence of the
use of bentonite as a riddling agent on foam quality and protein fraction of sparkling
wines (Cava). Food Chemistry. 2007;104(1):148-55.
27. Mårtensson E. Foaming in Apple Wine. Linnaeus University, School of Natural
Sciences; 2010. p. 57.
28. García M, Aleixandre J, Álvarez I, Lizama V. Foam aptitude of Bobal variety in
white sparkling wine elaboration and study of volatile compounds. European Food
Research and Technology. 2009;229(1):133-9.
29. Beerzym CHILL. Erbslöh Geisenheim AG; 2012.
30. Fructozym® UF. ERBSLÖH Geisenheim AG; 2009.

I