the effects of cocaine and heroin price on drug-related
TRANSCRIPT

Journal of Health Economics xxx (2005) xxx–xxx
The effects of cocaine and heroin price on drug-relatedemergency department visits
Dhaval Dave∗Bentley University and National Bureau of Economic Research, Department of Economics,
175 Forest Street, AAC 195, Waltham, MA 02452, USA
Received 30 October 2004; received in revised form 5 August 2005; accepted 11 August 2005
Abstract
This paper estimates the empirical relationship between cocaine and heroin prices and drug-related hospitalED admissions for 21 U.S. cities. These outcomes bypass some of the problems with self-reports anddirectly measure a component of healthcare costs associated with heavy drug usage. The price elasticityof the probability of a cocaine and heroin episode is estimated at−0.27 and−0.10, respectively. A 10%increase in prices can prevent 10,723 cocaine and heroin-related ED visits, with cost savings between $21million and $47 million. These low magnitudes of the drug outcome-price response have implications forthe cost-effectiveness of enforcement-driven price increases.© 2005 Elsevier B.V. All rights reserved.
JEL classification:I1
Keywords:Cocaine; Heroin; Drug abuse; Emergency department; Price
1. Introduction
Much of current drug control policy in the United States focuses on interdiction programsaimed at stopping the flow of drugs. The U.S. spends approximately $26 billion a year towardsapprehension and punishment of drug offenders, the bulk of this aimed at dealers and sellers (Officeof National Drug Control Policy, 2001). From an economic perspective, such drug enforcement,by raising the cost of supplying drugs to the U.S. market, acts as a non-monetary tax and increases
∗ Tel.: +1 781 891 2268; fax: +1 212 817 1597.E-mail address:[email protected].
0167-6296/$ – see front matter © 2005 Elsevier B.V. All rights reserved.doi:10.1016/j.jhealeco.2005.08.003
JHE-1011; No. of Pages 23

2 D. Dave / Journal of Health Economics xxx (2005) xxx–xxx
the transaction price of drugs.1 Hence, a critical question concerns the extent to which drug useresponds to prices, especially heavy or problematic use. Since manipulating prices is one modeof control that the public sector can exercise on the market for addictive unhealthy substances,empirical estimates of the relation between price variations and illicit drug consumption are keyto informing and shaping public policy.
This paper estimates the empirical relationship between the prices of cocaine and heroin andobjective indicators of their use. The set of outcomes is drug-related emergency room admissionswhere cocaine and heroin are cited, derived from the Drug Abuse Warning Network (DAWN).While this study is related to the new and growing empirical literature dealing with the pricesensitivity of illegal drug consumption, it improves upon the prior estimates in a number ofways. The illegal drug use indicators employed in much of the literature are based on self-reportsand may be measured inaccurately. In contrast, the indicators used in the present study are analternative measure based on objective outcomes related to consumption. Moreover, much of theliterature, by relying on self-reported national surveys, does not consider consumption by certainsubgroups, who may behave very differently from the population at large. The persons sampledin DAWN are not representative of the general population. In particular, the focus is on personswhose substance use resulted in a visit to a hospital emergency room. These individuals are muchmore likely to be hardcore or chronic users of drugs than the users reflected in national surveys.Thus, they also impose the heaviest costs on society and are the target of much illegal drug policy.There were 19,698 deaths from drug-induced causes in 2000, up over 16% since 1998. Healthcare costs associated with drug abuse were estimated at around $15 billion for 2000, an increaseof almost 40% since 1992 (ONDCP, 2003). In this respect, an estimate of the effect of drug priceson drug-related emergency department (ED) episodes is valuable in that it directly relates drugprices, an instrument of enforcement efforts, to the health consequences of heavy drug use.
Many studies based on survey data also rely on the respondent’s state of residence as thegeographic unit. Consequently, when estimating price responsiveness, these researchers have hadto employ a state-average price despite the fact that there is considerable inter-city variation indrug prices even within a given state. This measurement error may lead to biased estimates. Thepresent study overcomes this limitation by computing and merging drug prices at the city level.This analysis further exploits the time-series of city cross-sections and estimates various fixedeffects specifications to account for endogeneity and control for unmeasured factors that may becorrelated with price and consumption.
The remainder of the study proceeds as follows. Section2 reviews prior empirical studiesdealing with the price sensitivity of the consumption of illegal drugs. Section3 describes the dataassembled for use in this study. Section4 outlines the analytical models that guide the empiricalspecifications. Section5 presents the results and Section6 offers some concluding remarks.
2. Prior studies
There is a rapidly growing empirical literature by economists dealing with the price sensitivityof consumption of illegal drugs. These demand studies primarily draw on illegal drug prices
1 Costs for drug suppliers increase because: (1) they are forced to use underground distribution and transportationchannels that can be hidden from authorities, (2) some drug shipments are captured by the authorities and destroyed, (3)suppliers are forced to use the threat of violence or other relatively costly methods to enforce their contracts rather thanuse the court system and (4) because of fines and imprisonment.

D. Dave / Journal of Health Economics xxx (2005) xxx–xxx 3
derived from local purchases made by drug enforcement agents while undercover. The studiestypically combine these prices with self-reported measures of drug use from such national surveysas the National Household Survey of Drug Abuse (NHSDA) and Monitoring the Future.Grossmanet al. (2002)provides a good review of this literature.
While the weight of the evidence from these studies suggests that cocaine and heroin usedo respond negatively to price, there is little consensus about the magnitudes of the own-priceelasticities. The illegal drug use indicators in the studies just cited may be plagued by inaccuraciesif self-reports are subject to response error, and such surveys also fail to capture many hardcoreor chronic drug users.2 These considerations have led researchers to consider the price sensitivityof outcomes related to drug consumption.Model (1993)finds that marijuana-related hospitalemergency room episodes are positively related to marijuana decriminalization, based on quarterlydata from 1975 to 1978 for 21 metropolitan statistical areas (MSA) in the Drug Abuse WarningNetwork (DAWN). This study capitalizes on the decriminalization of the possession of smallamounts of marijuana by 11 U.S. states between 1973 and 1978. This presumably reduced thefull price of marijuana. Model does not include the money price of marijuana or other drugs inher study.Caulkins (2001b)estimates an elasticity of the number of hospital emergency roommentions for cocaine with respect to own-price of−1.30 and an elasticity of the number of hospitalemergency room mentions for heroin with respect to own-price of−0.84. Caulkins employs anannual U.S. time series constructed from DAWN for the years 1978 to 1996. His models simplyregress the given outcomes on price and do not control for any other factors that may have variedover time or for time trends.
Crane et al. (1997)employ aggregate time series from DAWN in order to estimate the priceelasticity of demand for cocaine ranging from−0.29 to−0.63. This study also fails to control fortime trends.Hyatt and Rhodes (1995)find that cocaine price is negatively related to the number ofcocaine emergency room episode mentions, from DAWN. While this study adds city indicators tocontrol for unobserved factors at the city level, it also does not control for time trends or any otherfactors that may have shifted over time. Furthermore, the price of cocaine is not adjusted for infla-tion. Since year indicators are not included, this leads to biased estimates. Thus, it is difficult toascertain from these studies whether the negative correlation between the outcomes and price rep-resents a causal effect or whether it reflects a spurious correlation due to other unobserved factors.
3. Data
The empirical work is based on objective outcomes related to cocaine and heroin consumptionderived from the Drug Abuse Warning Network (DAWN). Since the early 1970’s, DAWN hasprovided information on the use of emergency departments (ED) in the U.S. for the treatment ofdrug-related health problems. It is an ongoing national probability survey conducted annually in21 large metropolitan areas by the Substance Abuse and Mental Health Services Administration(SAMHSA).3 A consistently sampled time-series of the 21 cities from 1990 to 2002 was obtained
2 For instance, since drug use is significantly higher among respondents who live in households considered unstable,the NHSDA’s bias towards sampling stable households is likely to overlook many heavy drug users. A comparison ofheavy cocaine users in the NHSDA with those in other sources shows a marked difference with respect to demographiccharacteristics. In the NHSDA, income is higher, unemployment is lower and fewer respondents report using more thanone drug. SeeRhodes et al. (2001).
3 The DAWN cities are Atlanta, Baltimore, Boston, Buffalo, Chicago, Dallas, Denver, Detroit, Los Angeles, Miami,Minneapolis, New Orleans, New York City, Newark, Philadelphia, Phoenix, St. Louis, San Diego, San Francisco, Seattleand Washington, D.C.

4 D. Dave / Journal of Health Economics xxx (2005) xxx–xxx
from SAMHSA. DAWN collects information on patients seeking hospital emergency department(ED) treatment related to their use of an illicit drug. For the more recent years, DAWN alsodocuments the reason for the ED admission, the majority of which are due to drug overdose,chronic effects, withdrawal, and seeking detoxification, and the rest are due to accident or injury,unexpected reaction, or other undocumented reasons. To be included in DAWN, the patient mustbe age 6 years or older, be treated in the hospital’s emergency department, and have a probleminduced by or related to drug use, regardless of when the drug ingestion occurred. Eligible hospitalsin the DAWN sample are non-Federal, short-stay general hospitals that have a 24-hour emergencydepartment. Within each participating facility, a trained reporter, usually a nurse or a member ofthe ED or medical records staff, is responsible for reviewing medical charts for indications notedby the treating physician that the episode was drug-related.
A drug episode is defined as an emergency department visit that is directly related to the useof an illegal drug or the non-medical use of a legal drug.4 In addition, DAWN also identifiesthe substances associated with the drug abuse episodes. Up to four substances may be reportedor “mentioned” for each drug-related episode; thus, the total number of mentions exceeds thenumber of episodes. Much of the time, however, only one drug is mentioned. Based on thesedata, a variable measuring the probability of a drug-related episode is defined as total drug-related ED episodes in each metropolitan statistical area (MSA) divided by population. For thesample analyzed in this study, there are 314 such episodes per 100,000 persons. Similar rates arealso defined for cocaine mentions and heroin mentions. There are 119 cocaine mentions and 65heroin mentions per 100,000 persons. DAWN medical crises occur in a small fraction of the drugabusing population. Data from the National Comorbidity Survey show that about 6% of the adultpopulation was diagnozed with a drug abuse or dependence disorder in 1991 (Kessler et al., 1994).Applied to the mean MSA population for 1991, this translates to about 215,000 individuals with adrug disorder. The mean number of drug-related episodes for the same year was 9574. This meansthat about 22 additional serious abusers are required to generate one extra DAWN drug episode.Thus, these outcomes defined from DAWN are intended to capture serious health consequencesrelated to hardcore drug use. Means for the DAWN sample are presented inTable 1.
Since the outcomes are measured at the metropolitan level, additional MSA-level socioeco-nomic variables are included in all models to capture time-varying trends within cities. Personalincome per capita is derived from theBureau of Economic Analysiswebsite and deflated by thenational consumer price index reported by theBureau of Labor Statistics. Total MSA populationis obtained from the U.S.Bureau of Census. Indicators measuring the percentage of MSA pop-ulation that is male, black, other race, Hispanic, ages 16–24, ages 25–54, high school graduateand college graduate are constructed from the Current Population Survey March supplements.In order to capture local labor market conditions, the unemployment rate in each MSA is alsoincluded in all models. Data on unemployment are obtained from the Bureau of Labor Statistics,and in some cases also calculated from the March supplements of the Current Population Survey.
Indicators of local enforcement efforts are also appended. Variables measuring the probabilityof arrest for drug possession and drug sale are computed from the FBI’s Uniform Crime ReportingSystem. Ideally, the probability of arrest is constructed by dividing the total number of arrestsin each category by the total number of drug users and dealers in the MSA or some proxy fortotal drug activity. However, as there are no reliable estimates of the number of drug users and
4 Since one person may make repeated visits, the number of ED episodes reported in DAWN is not synonymous withthe number of individuals seeking such treatment.

D. Dave / Journal of Health Economics xxx (2005) xxx–xxx 5
Table 1Sample means
Variable Definition Mean
Drug episode rate Total drug-related emergency department episodesin each MSA divided by MSA population
0.00314 (0.0013)
Logistic drug episodes log of the odds of drug episode rate −5.83725 (0.3939)Cocaine mention rate Total number of times cocaine was mentioned in
the emergency department drug episodes in eachMSA divided by MSA population
0.00119 (0.0007)
Logistic cocaine mentions log of the odds of cocaine mention rate −6.95386 (0.7111)Heroin mention rate Total number of times heroin was mentioned in
the emergency department drug episodes in eachMSA divided by MSA population
0.00065 (0.0007)
Logistic heroin mentions log of the odds of heroin mention rate −7.88686 (1.1038)Cocaine price Price of one pure gram of cocaine, based on all
purchases, divided by the annual nationalconsumer price index
79.44819 (24.8081)
Heroin price Price of one pure gram of heroin, based on allpurchases, divided by the annual nationalconsumer price index
421.81320 (369.0345)
Personal income Per capita personal income in each MSA, dividedby the annual national consumer price index
17.97189 (2.9212)
Unemployment Unemployment rate in each MSA 0.05684 (0.0195)Male Percent of MSA population that are male 0.47808 (0.0186)Black Percent of MSA population that are black 0.15887 (0.1014)Other Percent of MSA population that are of a race other
than white or black0.05648 (0.0500)
Hispanic Percent of MSA population that are Hispanic 0.12326 (0.1421)Age 16–24 Percent of MSA population that are aged 16–24 0.16357 (0.0213)Age 25–54 Percent of MSA population that are aged 25–54 0.59095 (0.0387)High school Percent of MSA population that are high school
graduates0.80084 (0.0544)
College Percent of MSA population that are collegegraduates
0.26220 (0.0586)
Response rate Responding sample hospitals as a fraction of totaleligible hospitals
80.14469 (9.4100)
log response rate log of response rate 4.37665 (0.1218)Drug possession arrest rate Total number of arrests in each MSA due to any
drug possession divided by MSA population0.00411 (0.0020)
Drug violation arrest rate Total number of arrests in each MSA due to anydrug violation divided by MSA population
0.00601 (0.0028)
Drug sale arrest rate Total number of arrests in each MSA due to anydrug sale or trafficking divided by MSApopulation
0.00177 (0.0013)
Cocaine sale arrest rate Total number of arrests in each MSA due tococaine sale or trafficking divided by MSApopulation
0.00112 (0.0012)
Marijuana sale arrest rate Total number of arrests in each MSA due tomarijuana sale or trafficking divided by MSApopulation
0.00034 (0.0003)
Population Total MSA Population 3755332 (2373686)Observations 273
Notes:Standard deviations are in parentheses. Number of observations listed represents the maximum number. For somevariables, the actual sample size is slightly less due to missing information.

6 D. Dave / Journal of Health Economics xxx (2005) xxx–xxx
dealers by MSA, the denominator is proxied by total MSA population. Variables measuring thetotal number of arrests in each MSA due to any drug possession, any drug sale or trafficking, anydrug-related violation, sale or trafficking in cocaine or opiates and sale or trafficking in marijuanaare used to create the corresponding arrest rates.
Data on cocaine and heroin prices are computed from purchases made by undercover drugenforcement agents. Information on these purchases including cost, weight and purity is recordedby the Drug Enforcement Agency (DEA) in their System to Retrieve Information from DrugEvidence (STRIDE). The advantage of STRIDE’s transaction-level data is that they directly reflectprices on the street. These prices are expected to be relatively accurate because any unreasonableprice offer by a DEA agent may raise suspicion on the dealer’s part and endanger the agent.However, because the transactions are of varying size and quality, the cost of each drug must bestandardized.5
Standardized prices of one pure gram of cocaine and heroin in a given metropolitan area for agiven year are derived in the following manner:
log costijt = π0 + π1(log predicted purityijt + log weightijt)
+π2j
∑MSAj + π3t
∑yeart + π4jt
∑MSAj × yeart + υijt (1)
The subscripts denote theith transaction in thejth MSA for yeart. Cost refers to the total costof the purchase, weight is the total gram weight of the purchase, and purity is the weight of thepure drug found in the purchase as a fraction of the total purchase weight. MSA and year refer todichotomous indicators of each, and MSA× year refers to indicators of the interaction betweenthe two. Predicted purity is obtained from a first-stage regression of actual purity on all of theseother explanatory variables.6 The price of one pure gram of the drug in MSA j for yeart is thenimputed as
exp (π0 + π2j + π3t + π4jt) (2)
In the above procedure, purity is treated as endogenous because purchases may depend on expectedrather than actual purity (Caulkins, 1996). Identification is achieved by constraining the coefficienton predicted purity to equal that on weight in the second-stage regression (see Footnote 6). In thisstudy, price series based on purity treated as exogenous and estimating(1) with the coefficientsunconstrained were experimented with in all models. There are no material changes in the resultsor conclusions. STRIDE data are available from 1974 to 2003, and all years are used to impute theprice series for the periods represented in DAWN. There are 93,004 usable cocaine transactionsand 41,088 usable heroin transactions.7 All price series are deflated by the national CPI. The mean
5 For instance,Caulkins and Padman (1993)andRhodes et al. (1994)show that there are sizable discounts for “whole-sale” or large quantity purchases of cocaine.
6 Eq.(1)can be justified by defining the price of one pure gram of drug as: price= cost/(pure quantity of drug)π1, wherepure quantity is purity times total weight. Hereπ1 captures any non-linear effects of quantity on price, for example dueto quantity discounts. In log-linear form, this is log price = log cost− π1 log purity− π1 log weight. It is assumed that thestandardized price varies between cities and over time. Thus, log price =a+bMSA +c year +dMSA × year. Substitutingthis expression in the log-linear formulation results in an estimable form, Eq.(1).
7 In order to maximize the sample size in subsequent estimation, heroin prices that are missing in any given MSA forany given year are imputed by the weighted mean of the prices for all other available MSA’s in that particular state. About3% of the DAWN sample are affected by this imputation. Results are not sensitive to alternately omitting the missingvalues.

D. Dave / Journal of Health Economics xxx (2005) xxx–xxx 7
real price (in 1982–1984 dollars) of one pure gram of cocaine is $79.45. The mean real heroinprice is $421.81.
One of the advantages of this study is that the drug prices are computed and merged at thecity level. Many prior studies relying on national self-reported survey data used state-averageprices despite the fact that drug prices seem to vary widely from city to city. The variation indrug prices across cities and within cities can be related to cost and supply-side factors. Forexample in the DAWN sample, cocaine prices are lowest in port-of-entry cities like San Diego,Los Angeles, Miami, and New York, and highest in interior cities like Minneapolis, Saint Louis,and Detroit.Kuziemko and Levitt (2004)find that even within a given city, STRIDE cocaineprices from 1986 through 1996 are positively related to state-level indicators of the certainty ofpunishment, measured by the per capita number of drug arrests, and the severity of punishment,measured by the fraction of drug arrests resulting in imprisonment.Basov et al. (2001)arguethat due to the illicit, secretive nature of the drug trade, both production and sales are more laborintensive compared to legal markets. Most of these jobs are also likely to be filled by low-skilledemployees, youths, or others with fewer outside opportunities. Their study shows that cocaineand heroin prices from STRIDE are positively related to the state-specific relative unskilled wagein a time series of states from 1974 to 1999. These two studies further confirm that DEA drugprices do indeed reflect costs of retailing including expected penalties and labor costs.8
The underlying assumption is that drug prices vary across cities and over time as a result ofchanges in distribution and shipping costs, labor costs, resources expended towards enforcementand apprehension of dealers, and severity of penalties. In this case, the supply curve for cocaineand heroin is infinitely elastic. If the supply curve is instead positively sloped, then estimates ofthe demand price elasticity are biased downwards in absolute magnitude and may be regarded asconservative lower-bound estimates. As the supply curve becomes more elastic, the bias decreases,ceteris paribus. Supply of drugs are likely to be relatively price elastic since the marginal costof actual production is a small component of the observed street price; most of the money pricereflects enforcement and penalties aimed at sellers.9 Miron’s (2003) detailed analysis indicatesthat the price of cocaine and heroin are as much as four times and 19 times larger, respectively,compared to a legal market. Even if simultaneity bias is mitigated, there may still be policyendogeneity wherein drug policy, which in turn affects drug prices, is itself a function of drug use.First-differenced instrumental variables models are estimated, which account for both simultaneityand policy endogeneity.
4. Empirical framework
The objective of this study is to assess the extent to which outcomes related to cocaine andheroin consumption respond to cocaine and heroin prices. Since illicit drugs are ultimately con-sumer goods, this question can be framed within the context of consumer theory. Maximizing autility function in every period subject to a basic budget constraint yields the following demand
8 A report by the National Research Council (Manski et al., 2001) andHorowitz (2001)note that because purchasesin STRIDE are motivated by criminal investigations, they do not represent a random sample of drug prices in the U.S.Nonetheless, as long as the sampling limitations are stable over time, these data can still accurately capture changes inthe cost of drugs. Also seeCaulkins (2001a)for a discussion of the utility in using STRIDE.
9 The observed drug price consists of the marginal cost of production plus expected penalties for suppliers. The supply-money price elasticity can be shown to equal the elasticity of supply with respect to the marginal production cost timesthe ratio of the full price to the marginal production cost.

8 D. Dave / Journal of Health Economics xxx (2005) xxx–xxx
function10:
Dlt = α1Plt + α2P2t + δ1S1t + δ2S2t + β1It + β2Yt + εt (3)
Eq.(3)states that the demand for any illicit drug (D1) depends on its own price (P1), the price of theother drug (P2), the addictive stocks of the own drug and the other drug (S1 andS2), income (I), andother characteristics (Y) such as the individual’s age, gender, race, and education. The parameterof interest,α1, is hypothesized to be negative under the law of the downward sloping demandfunction. The cross-price effectα2 is positive if the two drugs are economic substitutes, negativeif they are economic complements, and zero if independent. The parameterδ1 is hypothesized tobe greater than zero due to the positive reinforcement of past addictive consumption on currentconsumption. This intertemporal complementarity between past and current consumption is thehallmark of economic models of addiction. The cross-reinforcement effectδ2 may be zero orpositive. Since the accumulated addictive stocks of each drug are unobserved, they can be proxiedby past consumption, which in turn can be proxied by the past prices of drugs.
The set of outcomes employed from DAWN is the number of times cocaine and heroin arecited in drug-related ED episodes, divided by total MSA population. DAWN does not sampleall eligible hospitals. Ideally, the probability of having a cocaine or heroin induced ED episodeshould be measured relative to the “potential” population, that is individuals living in an areawithin a sampled MSA that directs medical crises to a participating DAWN ED (Model, 1993).This probability can be written as
prob(mention|total pop)= prob(mention|potential pop)× prob(potential pop|total pop)
(4)
The probability of a drug mention relative to the appropriate potential population can be furtherexpressed as
prob(mention|potential pop)
= prob(report|potential pop, ED, crisis, use)
×prob(ED|potential pop, crisis,use)× prob(crisis|potential pop, use)
×prob(use|potential pop) (5)
Substituting(5) into (4) and taking the log of both sides results in
log prob(mention|total pop)
= log prob(report|potential pop,ED,crisis,use)+ log prob(ED|potential pop,crisis,use)
10 The individual’s current utility depends on current consumption of the addictive goods (D1 andD2), the non-addictivegood (X), and also on the stock of the addictive goods (S1 andS2) accumulated through past consumption. In additionto positive and diminishing marginal utility inA andX, the utility function also satisfies other restrictions. First is thereinforcement effect, wherein the stocks of addictive consumption positively affect current marginal utility of the addictivegoods:UDiSi
= ∂2Ut/DitSit > 0, i = 1, 2. Second is the tolerance effect, wherein the addictive stocks negatively affectcurrent utility: USi
= ∂Ut/∂Sit < 0, i = 1, 2. This can also reflect harmful addiction since past consumption of drugscan lower current utility due to detrimental health effects. There may also be cross-reinforcement effects so that theaddictive stock of one drug may affect the current consumption of the other by affecting its current marginal utility:UDiSi
= ∂2Ut/∂DitSjt ≥ 0, i �= j.
D. Dave / Journal of Health Economics xxx (2005) xxx–xxx 9
+log prob(crisis|potential pop,use)+ log prob(use|potential pop)
+log prob(potential pop|total pop) (6)
This identity stresses that many factors contribute to a DAWN drug mention. First, an individualmust be part of the potential population and using drugs. He must then experience some crisisor medical emergency, which results in a visit to a participating ED. Finally, hospital personnelmust identify this episode as drug-related. The probability of drug use and the probability of crisis(which are a monotonic function of the intensity or chronicity of use) depend on the demandfactors derived earlier in Eq.(3). The probability of being part of the potential population relativeto the total population is proxied by the number of hospitals participating in DAWN as a fractionof total eligible hospitals. The conditional probabilities of an ED visit and a drug report are relatedto emergency room visitation practices and any non-reporting or misreporting by the ED staff.There is no a priori reason to believe that these probabilities have systematically varied over timewithin cities; thus, they may be modeled as part of the unobserved area and year effects. Thesesubstitutions yield the following estimable specification, which can be interpreted as a reduced-form relationship of the demand and cost factors affecting drug-related emergency departmentvisits
log
(A1it
1 − A1it
)= α1P1it + α2P2it + λ1P1it−1 + λ2P2it−1 + β1Iit + β2Yit
+β3Rit + εit, whereεit = µi + ηt + νit (7)
The subscripts denote theith MSA for year t. A is the probability of a drug episode, andYrepresents the vector of observable determinants of use, besides price and income, and is proxiedby the unemployment rate, various MSA-level socioeconomic characteristics, and drug-relatedarrest rates. All models also include the log of the hospital response rate,Rit . The disturbance ismodeled with two-way error components whereµi denotes the unobservable area fixed effects,ηt denotes the unobservable time fixed effects, andνit is the remainder stochastic error term.All regressions are estimated in logistic form, where the dependent variable is measured as thelog of the odds ratio. Since the original outcomes are rates between zero and one, the logistictransformation ensures that the predicted rate or probability also lies in this range.11 Estimatedstandard errors are adjusted for autocorrelation within each city. Under an addiction paradigm,current drug-related outcomes will be a function of contemporaneous and past drug prices. Analternative rationale for(7) is that drug-related health emergencies are produced not just by currentuse but also by the cumulative effects of past use, which is a function of past prices.
This fixed effects procedure is inconsistent if city drug prices or the policies that determinethem might depend on outcomes related to substance use, or as is more likely the lagged drug-related outcomes. This possibility is sometimes referred to as policy endogeneity. There are twocritical issues. The first is that there is an unmeasured fixed effect that is correlated with right-hand-side variables. In the context of this research, the fixed effect may be city or state sentiment(e.g., religiosity) towards drug use that also influences drug prices and enforcement. The secondissue is that price may be predetermined and not strictly exogenous because past shocks to druguse or drug-related health emergencies may be correlated with current prices. Thus, current price
11 The elasticity of the probability of a drug-related ED visit with respect to price is calculated asα1 (1−A)P. Themarginal effect of price on this probability isα1 (1−A)A.

10 D. Dave / Journal of Health Economics xxx (2005) xxx–xxx
is predetermined in that it is correlated with all past disturbances
E(Pit νis) �= 0 for s < t and E(Pitνis) = 0 for s = t (8)
Consider a simple version of(7). For convenience, LOit refers to log (Ait /1−Ait) and the yeareffects are ignored. The area fixed effects can be removed by first differencing
LOit − LOit−1 = α1(Pit − Pit−1) + β1(Iit − Iit−1) + β2(Yit − Yit−1)
+ β3(Rit − Rit−1) + (νit − νit−1) (9)
If price is a predetermined variable then the orthogonality assumption is violated sincePit iscorrelated withνit−1. The fixed effects or first-differenced specification is no longer consistent.
In order to check for potential policy endogeneity, two informal tests are performed. First,following Model (1993), specifications with a series of lagged and leading prices are estimated. Ifchanges in drug outcomes are caused by changes in enforcement or prices as opposed to changesin prices being caused by these outcomes, then larger outcomes should not occur until after anydecreases in price and vice versa. In specifications with lagged and leading price series, only thecoefficients on contemporaneous and lagged prices should be significant. The lead prices shouldbe insignificant. If the leading prices are significant, however, this could be evidence of policyendogeneity.12
A second test estimates specifications with various lagged enforcement variables to proxy forpast shocks to demand that may also be affecting current prices. Consider the baseline equationagain, where the disturbance termνit is divided into two componentsωit andϕit
LOit − LOit−1 = α1(Pit − Pit−1) + β1(Iit − Iit−1) + β2(Yit − Yit−1)
+ β3(Rit − Rit−1) + (ωit − ωit −1) + (ϕit − ϕit−1) (9a)
Here,ϕit is a pure stochastic disturbance term that is uncorrelated with all past, current, andfuture values of the explanatory variables. However,ωit represents unobserved shocks to pastuse that may also affect current prices, making price predetermined and statistically endogenous.This endogeneity is similar to omitted variables bias in an intertemporal context. Conditionalon ω, price is strictly exogenous with respect to the remainder disturbance term. Therefore, ifvariables measuring such shocks can be included in the models, then the coefficients on pricecan be analyzed to gauge the extent of such endogeneity. Past enforcement efforts may proxy forthese shocks to some extent. For instance, higher arrest rates related to drug violations or salesmay affect current drug consumption and also influence future drug prices. If the price effects arerobust in specifications that control for these lagged enforcement variables, then it is likely thatprice is not predetermined.
The possibility that price is not strictly exogenous is also treated explicitly by applying theArellano–Bond estimator.Arellano and Bond (1991)show that the orthogonality conditions in adynamic panel data model can be exploited to obtain valid instruments for (Pit −Pit−1). If priceis predetermined, all lagged levels (Pit−1 and older) can be used to instrument for the difference
12 Significant lead prices may also be construed as evidence of rational addiction (Becker and Murphy, 1988). Howeverin the present context, it is unlikely that users are able to forecast drug prices far in advance, as much as 1 year. SeeGruberand Koszegi (2001).

D. Dave / Journal of Health Economics xxx (2005) xxx–xxx 11
as long as theνit are not serially correlated.13 If the drug price is not just predetermined but alsopurely endogenous (for instance due to simultaneity between supply and demand) such thatE(Pitνis) �= 0 for s≤ t, then the orthogonality conditions allow levels of drug prices lagged two ormore periods to serve as instruments. Levels of the other exogenous variables in the model canalso enter the instrumental matrix.
The elasticity of drug mentions with respect to drug use is unambiguously positive, sincethe negative health consequences of addictive consumption are well documented.14 Also, bydefinition, the majority of the ED episodes and mentions in the DAWN sample are causallyrelated to dependent drug use. Thus, the sign and significance of the estimated elasticity of a drugmention with respect to price informs on the unobserved price elasticity of problematic drug use.The price elasticity of drug episodes and mentions is also relevant because it measures the direct“reduced-form” effect of drug prices, an instrument of enforcement and public policy, on health.
5. Results
Before turning to the results,Fig. 1visually depicts the strong negative relationship betweendrug-related ED episodes and drug prices. The series reveal that total ED drug episodes increasedby about 55% from 1990 to 2002 as the prices of cocaine and heroin declined.15 The sharpestincrease occurred in heroin mentions, by over 160%, which coincides with the steepest drop inheroin price of around 72%. Cocaine price declined by about 42% over this period, coincidingwith a 72% increase in cocaine-related ED mentions. This is only suggestive since these figures donot control for time trends or other confounders. The multivariate models address this possibility.
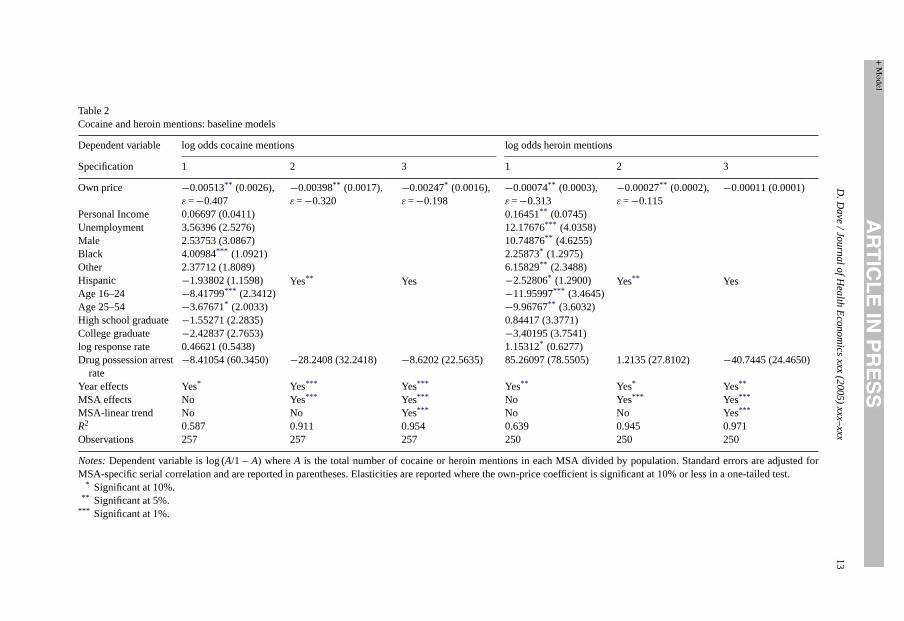
Table 2presents estimation of Eq.(7) excluding the lagged and cross-prices. All specificationsinclude the drug price, MSA-level socioeconomic covariates, the DAWN response rate, the drugpossession arrest rate, year effects, and then progressively add MSA effects and MSA-specificlinear trends. Cocaine price is negative and statistically significant in all specifications, and theelasticity of the probability of a cocaine mention with respect to own price ranges from−0.20to −0.41. Specification 2, which includes both year and MSA effects, yields a price elasticityof −0.32. The next specification adds indicators of an MSA-specific linear trend, where onlydeviations around a linear trend, within each city, are used for identification. The price effectremains marginally significant, and the elasticity decreases in value to−0.20. The addition ofMSA-specific linear trends causes the MSA-level covariates to lose joint significance. Thesecovariates may already be controlling for trends within MSA’s to a large extent. The largest gainin adjustedR2 results from the addition of MSA effects; including MSA-linear trends raises theadjustedR2 by a relatively small amount. In subsequent analyses, fixed effects specificationswithout city-specific trends are emphasized. The estimated price elasticity of heroin mentions is
13 If the νit are not serially correlated, there is still first-order autocorrelation between the first-differenced errors. Thus,a test of no autocorrelation inνit translates to testing whether there is second-order or higher degree autocorrelation inthe differenced errors. These tests are presented in the results (Baltagi, 2002).14 SeeThe Economic Costs of Alcohol and Drug Abuse in the United States 1992(Harwood et al., 1992).15 The decline in the real cocaine price has been attributed to the development of a production sector and the learning-
by-doing that followed the reintroduction of cocaine into the U.S. market in the 1970s after prolonged absence. Therewas also vertical integration in the chain of distribution, which reduced the costs of retailing and wholesaling. Costs alsodeclined from a shift to low-cost labor as unemployed residents of urban ghettos replaced the professionals who dealtdrugs during the 1970s and 1980s. SeeGrossman et al. (1998, 2002). Heroin prices declined due to a shift in the heroinmarketplace in the U.S. as drug cartels in Mexico and Colombia began to eclipse the southeast Asian suppliers. Most ofthe heroin now entering the U.S. originates from these two countries.

12 D. Dave / Journal of Health Economics xxx (2005) xxx–xxx
Fig. 1. ED indicators and drug prices.Note:Underlying values are based on population-weighted means. All values arenormalized to 1990 levels.
estimated at−0.12 in the fixed effects model. The sign of the sample response rate in DAWN ispositive, as expected from Eq.(6).
The estimates inTable 2are based on all hospital ED admissions where cocaine or heroin ismentioned. DAWN provides the reasons for the ED admission from 1995 onwards, including drugoverdose, chronic effects, withdrawal, seeking detoxification, accidental injury, unexpected reac-tion, or other. Models were also estimated for alternative measures of dependent use that includedonly those admissions resulting form drug overdose, chronic effects, withdrawal, or detoxification,which make up the vast majority of admissions. The elasticities for cocaine and heroin mentionswere somewhat smaller in magnitude, by about 30–50%, but still remain statistically significantat conventional levels. The smaller elasticities do not qualitatively affect the conclusions and areexpected if these alternative measures are capturing the heaviest of the heavy users. Subsequentanalyses are based on all ED admissions in order to maximize the sample period and precision. Inaddition, there may be greater errors in classification over time due to differential administrativeand reporting policies. Focusing on all drug-related ED admissions also underscores the fact thatthese individuals’ drug use has resulted in a hospital ED admission, which by definition makesthe drug use more serious regardless of cause.
D.Dave/Jo
urnalofHealthEconomics
xxx(2005)xxx–
xxx13
Table 2Cocaine and heroin mentions: baseline models
Dependent variable log odds cocaine mentions log odds heroin mentions
Specification 1 2 3 1 2 3
Own price −0.00513** (0.0026),ε =−0.407
−0.00398** (0.0017),ε =−0.320
−0.00247* (0.0016),ε =−0.198
−0.00074** (0.0003),ε =−0.313
−0.00027** (0.0002),ε =−0.115
−0.00011 (0.0001)
Personal Income 0.06697 (0.0411)
Yes** Yes
0.16451** (0.0745)
Yes** Yes
Unemployment 3.56396 (2.5276) 12.17676*** (4.0358)Male 2.53753 (3.0867) 10.74876** (4.6255)Black 4.00984*** (1.0921) 2.25873* (1.2975)Other 2.37712 (1.8089) 6.15829** (2.3488)Hispanic −1.93802 (1.1598) −2.52806* (1.2900)Age 16–24 −8.41799*** (2.3412) −11.95997*** (3.4645)Age 25–54 −3.67671* (2.0033) −9.96767** (3.6032)High school graduate −1.55271 (2.2835) 0.84417 (3.3771)College graduate −2.42837 (2.7653) −3.40195 (3.7541)log response rate 0.46621 (0.5438) 1.15312* (0.6277)Drug possession arrest
rate−8.41054 (60.3450) −28.2408 (32.2418) −8.6202 (22.5635) 85.26097 (78.5505) 1.2135 (27.8102) −40.7445 (24.4650)
Year effects Yes* Yes*** Yes*** Yes** Yes* Yes**
MSA effects No Yes*** Yes*** No Yes*** Yes***
MSA-linear trend No No Yes*** No No Yes***
R2 0.587 0.911 0.954 0.639 0.945 0.971Observations 257 257 257 250 250 250
Notes:Dependent variable is log (A/1−A) whereA is the total number of cocaine or heroin mentions in each MSA divided by population. Standard errors are adjusted forMSA-specific serial correlation and are reported in parentheses. Elasticities are reported where the own-price coefficient is significant at 10% or less in a one-tailed test.
* Significant at 10%.** Significant at 5%.
*** Significant at 1%.

14 D. Dave / Journal of Health Economics xxx (2005) xxx–xxx
Similar to self-reports, but for different reasons, there may also be underreporting in the DAWNdata. Several states have adopted statutes that allow health insurers to legally deny coverage foran injury caused by alcohol or illicit drug use. Hospital administrators in such states may have anincentive to not report the ED admission as drug-related for reimbursement purposes.Rivara et al.(2000)conducted a survey of insurance commissioners in the 50 states plus D.C. to determine theprevalence of such statutes. Of the 18 states represented in DAWN, 12 states plus D.C. had suchexclusions, two states allowed such exclusions with certain additional restrictions, and three statesdid not have any such statutes. Restricting the sample to the 13 states with strong statutes or the 15states with any statute does not substantially affect the magnitudes or significance of the elasticityestimates. Pooled models with an interaction between the drug price and a dichotomous indicatorfor a strong statute or any statute were also estimated. The interaction term was insignificant in allsuch models. This suggests that while there may be underreporting in DAWN, the underreportingdoes not appear to systematically vary over time across states in a way that is correlated withdrug prices. This is not the case in survey-based data, where the underreporting is positivelycorrelated with intensity of use and negatively correlated with price leading to biased estimatesof the elasticity (Dave, 2004).
Table 3expands the baseline model by including the contemporaneous and 1- and 2-year laggedprices. The current prices are negative and significant for both cocaine and heroin in the fixedeffects specifications. Adding these lagged prices does not substantially reduce the magnitude ofthe current price elasticity for either drug. The cocaine elasticity is very similar to those fromthe baseline models, and ranges from−0.21 to−0.29. The 1-year lagged cocaine price elasticityis −0.28, not much weaker than the effect of contemporaneous price. The coefficients of thecontemporaneous and lagged prices can be used to calculate the long-run price elasticity of theprobability of a cocaine mention, which measures the full current and future effects of a change incurrent price. It is about twice the magnitude of the short-run elasticity, and is estimated at−0.54.The contemporaneous heroin price elasticity ranges from−0.11 to−0.15. The range is tighter thanbefore since the upper bound estimates obtained from the year-effects models are more in line withthe other specifications. Thus, adding lagged prices makes some difference when MSA indicatorsare not present to capture some of their effect. The 1-year lagged price elasticity is about−0.09,and the 2-year lagged price elasticity is−0.12. The effects of past heroin prices on the currentlikelihood of a heroin related ED visit are also relatively substantial and of a similar magnitude tothe effect of current price. The long-run elasticity is−0.29. Negative and significant lagged priceeffects are consistent with the addictive properties of cocaine and heroin and the ensuing positiveintertemporal reinforcement effect. Since the dependent variable is a proxy for health, it is alsoconsistent with the addictive substance having cumulative detrimental effects on health.
Specifications 4 and 5 inTable 3provide a check for policy endogeneity. These models aresimilar to those discussed above except that they add 1-year leading prices in addition to the currentand lagged prices. Significantly negative lead price-effects may indirectly inform on the presenceof policy endogeneity. All specifications include the 1-year lagged and leading own prices.16 Theevidence does not point to the presence of policy endogeneity. The contemporaneous and long-run price elasticities remain relatively robust to the inclusion of the leads, and current cocaine orheroin related ED episodes do not seem to be affected by future prices.
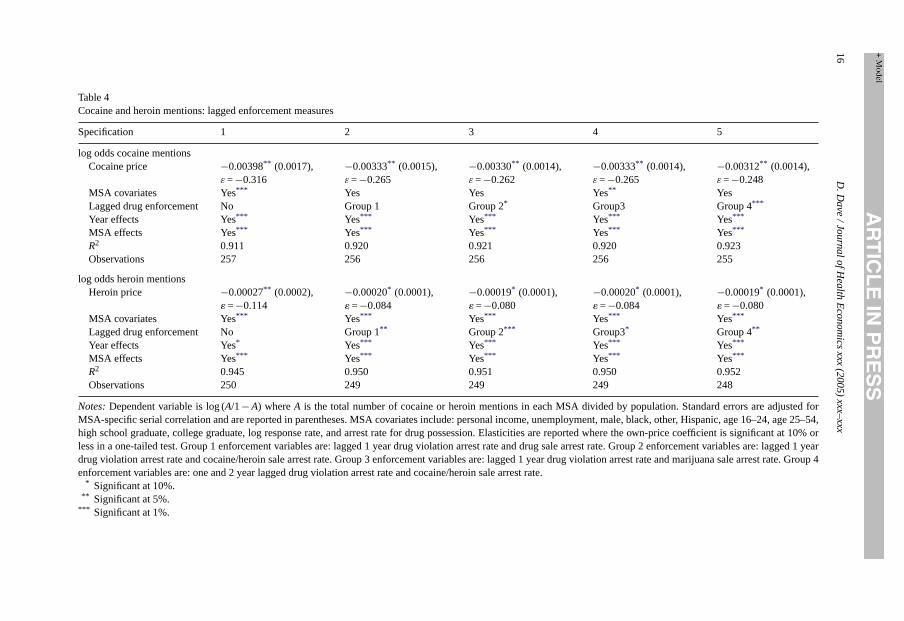
Table 4presents specifications that include lagged enforcement variables in order to controlfor any unobserved shocks to past drug-related outcomes and current prices. One set of lagged
16 Other leading and lagging structures yielded similar results.

D.Dave/Jo
urnalofHealthEconomics
xxx(2005)xxx–
xxx15
Table 3Cocaine and heroin mentions: lagged and leading prices
Specification 1 2 3 4 5
log odds cocaine mentionsOwn price −0.00236* (0.0017),
ε =−0.212−0.00334*** (0.0013),ε =−0.268
−0.00300** (0.0016),ε =−0.242
−0.00346*** (0.0013),ε =−0.278
−0.00333** (0.0014),ε =−0.268
1 Year lagged own price −0.00368* (0.0022),ε =−0.301
−0.00337** (0.0015),ε =−0.276
−0.00281* (0.0017),ε =−0.230
−0.00317** (0.0016),ε =−0.260
−0.00303** (0.0015),ε =−0.248
2 Year lagged own price −0.00061 (0.0018) −0.00069 (0.0011) −0.00099 (0.0009) – −0.00074 (0.0011)1 Year leading own price – – – −0.00138 (0.0011) −0.00143 (0.0371)Long run elasticity ε =−0.507 ε =−0.539 ε =−0.467 ε =−0.533 ε =−0.512MSA covariates Yes*** Yes*** Yes*** Yes Yes**
Year effects Yes*** Yes*** Yes*** Yes Yes***
MSA effects No Yes*** Yes*** Yes Yes***
MSA-linear trend No No Yes*** No NoR2 0.579 0.914 0.956 0.952 0.914Observations 255 255 255 243 254
log odds heroin mentionsOwn price −0.00035** (0.0002),
ε =−0.152−0.00025* (0.0002),ε =−0.107
−0.00011 (0.0001) −0.00031** (0.0001),ε =−0.133
−0.00024** (0.0001),ε =−0.103
1 Year lagged Own Price −0.00048*** (0.0001),ε =−0.222
−0.00020** (0.0001),ε =−0.093
−0.00006 (0.0001) −0.00015* (0.0001),ε =−0.70
−0.00019** (0.0001),ε =−0.088
2 Year lagged own price −0.00061*** (0.0001),ε =−0.319
−0.00023*** (0.0001),ε =−0.121
−0.00010* (0.0001),ε =−0.048
− −0.00023*** (0.0001),ε =−0.120
1 Year leading own price – – – −0.00016 (0.0002) −0.00021 (0.0002)Long run elasticity ε =−0.619 ε =−0.293 ε =−0.048 ε =−0.198 ε =−0.283MSA covariates Yes*** Yes*** Yes Yes** Yes***
Year effects Yes Yes* Yes*** Yes** Yes**
MSA effects No Yes*** Yes*** Yes*** Yes***
MSA-linear trend No No Yes*** No YesR2 0.693 0.952 0.975 0.952 0.956Observations 243 243 243 242 239
Notes:Dependent variable is log (A/1−A) whereA is the total number of cocaine or heroin mentions in each MSA divided by population. Own price refers to cocaine price inthe logistic cocaine mention models, and heroin price in the logistic heroin mention models. Standard errors are adjusted for MSA-specific serial correlation and are reportedin parentheses. MSA socioeconomic covariates include: personal income, unemployment, male, black, other, Hispanic, age 16–24, age 25–54, high school graduate, collegegraduate, log response rate, and arrest rate for drug possession. Elasticities are reported where the own-price coefficient is significant at 10% or less in a one-tailed test.
* Significant at 10%.** Significant at 5%.
*** Significant at 1%.
16D.Dave/Jo
urnalofHealthEconomics
xxx(2005)xxx–
xxx
Table 4Cocaine and heroin mentions: lagged enforcement measures
Specification 1 2 3 4 5
log odds cocaine mentionsCocaine price −0.00398** (0.0017),
ε =−0.316−0.00333** (0.0015),ε =−0.265
−0.00330** (0.0014),ε =−0.262
−0.00333** (0.0014),ε =−0.265
−0.00312** (0.0014),ε =−0.248
MSA covariates Yes*** Yes Yes Yes** YesLagged drug enforcement No Group 1 Group 2* Group3 Group 4***
Year effects Yes*** Yes*** Yes*** Yes*** Yes***
MSA effects Yes*** Yes*** Yes*** Yes*** Yes***
R2 0.911 0.920 0.921 0.920 0.923Observations 257 256 256 256 255
log odds heroin mentionsHeroin price −0.00027** (0.0002),
� =−0.114−0.00020* (0.0001),� =−0.084
−0.00019* (0.0001),� =−0.080
−0.00020* (0.0001),� =−0.084
−0.00019* (0.0001),� =−0.080
MSA covariates Yes*** Yes*** Yes*** Yes*** Yes***
Lagged drug enforcement No Group 1** Group 2*** Group3* Group 4**
Year effects Yes* Yes*** Yes*** Yes*** Yes***
MSA effects Yes*** Yes*** Yes*** Yes*** Yes***
R2 0.945 0.950 0.951 0.950 0.952Observations 250 249 249 249 248
Notes:Dependent variable is log (A/1−A) whereA is the total number of cocaine or heroin mentions in each MSA divided by population. Standard errors are adjusted forMSA-specific serial correlation and are reported in parentheses. MSA covariates include: personal income, unemployment, male, black, other, Hispanic, age 16–24, age 25–54,high school graduate, college graduate, log response rate, and arrest rate for drug possession. Elasticities are reported where the own-price coefficient is significant at 10% orless in a one-tailed test. Group 1 enforcement variables are: lagged 1 year drug violation arrest rate and drug sale arrest rate. Group 2 enforcement variables are: lagged 1 yeardrug violation arrest rate and cocaine/heroin sale arrest rate. Group 3 enforcement variables are: lagged 1 year drug violation arrest rate and marijuana sale arrest rate. Group 4enforcement variables are: one and 2 year lagged drug violation arrest rate and cocaine/heroin sale arrest rate.
* Significant at 10%.** Significant at 5%.
*** Significant at 1%.
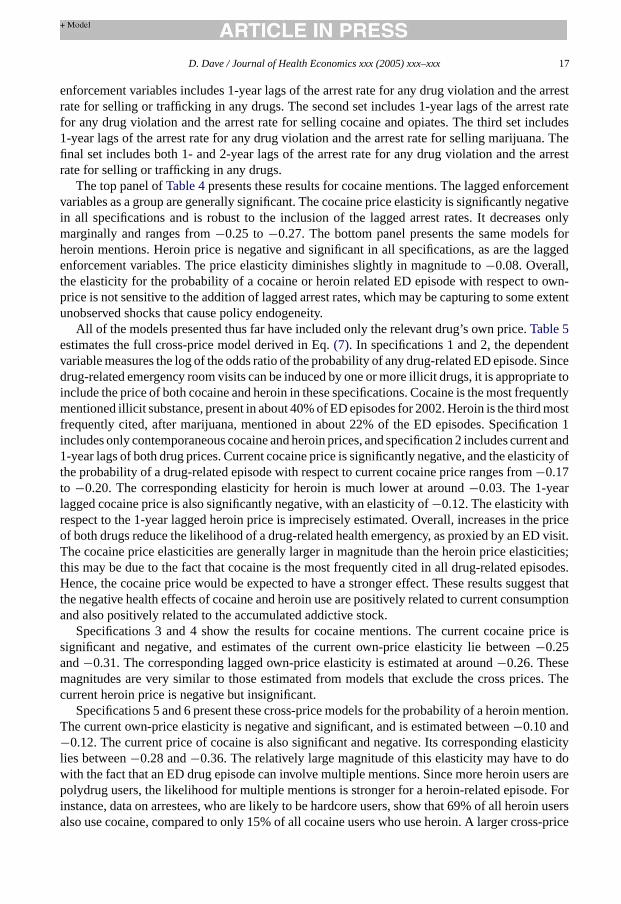
D. Dave / Journal of Health Economics xxx (2005) xxx–xxx 17
enforcement variables includes 1-year lags of the arrest rate for any drug violation and the arrestrate for selling or trafficking in any drugs. The second set includes 1-year lags of the arrest ratefor any drug violation and the arrest rate for selling cocaine and opiates. The third set includes1-year lags of the arrest rate for any drug violation and the arrest rate for selling marijuana. Thefinal set includes both 1- and 2-year lags of the arrest rate for any drug violation and the arrestrate for selling or trafficking in any drugs.
The top panel ofTable 4presents these results for cocaine mentions. The lagged enforcementvariables as a group are generally significant. The cocaine price elasticity is significantly negativein all specifications and is robust to the inclusion of the lagged arrest rates. It decreases onlymarginally and ranges from−0.25 to−0.27. The bottom panel presents the same models forheroin mentions. Heroin price is negative and significant in all specifications, as are the laggedenforcement variables. The price elasticity diminishes slightly in magnitude to−0.08. Overall,the elasticity for the probability of a cocaine or heroin related ED episode with respect to own-price is not sensitive to the addition of lagged arrest rates, which may be capturing to some extentunobserved shocks that cause policy endogeneity.
All of the models presented thus far have included only the relevant drug’s own price.Table 5estimates the full cross-price model derived in Eq.(7). In specifications 1 and 2, the dependentvariable measures the log of the odds ratio of the probability of any drug-related ED episode. Sincedrug-related emergency room visits can be induced by one or more illicit drugs, it is appropriate toinclude the price of both cocaine and heroin in these specifications. Cocaine is the most frequentlymentioned illicit substance, present in about 40% of ED episodes for 2002. Heroin is the third mostfrequently cited, after marijuana, mentioned in about 22% of the ED episodes. Specification 1includes only contemporaneous cocaine and heroin prices, and specification 2 includes current and1-year lags of both drug prices. Current cocaine price is significantly negative, and the elasticity ofthe probability of a drug-related episode with respect to current cocaine price ranges from−0.17to −0.20. The corresponding elasticity for heroin is much lower at around−0.03. The 1-yearlagged cocaine price is also significantly negative, with an elasticity of−0.12. The elasticity withrespect to the 1-year lagged heroin price is imprecisely estimated. Overall, increases in the priceof both drugs reduce the likelihood of a drug-related health emergency, as proxied by an ED visit.The cocaine price elasticities are generally larger in magnitude than the heroin price elasticities;this may be due to the fact that cocaine is the most frequently cited in all drug-related episodes.Hence, the cocaine price would be expected to have a stronger effect. These results suggest thatthe negative health effects of cocaine and heroin use are positively related to current consumptionand also positively related to the accumulated addictive stock.
Specifications 3 and 4 show the results for cocaine mentions. The current cocaine price issignificant and negative, and estimates of the current own-price elasticity lie between−0.25and−0.31. The corresponding lagged own-price elasticity is estimated at around−0.26. Thesemagnitudes are very similar to those estimated from models that exclude the cross prices. Thecurrent heroin price is negative but insignificant.
Specifications 5 and 6 present these cross-price models for the probability of a heroin mention.The current own-price elasticity is negative and significant, and is estimated between−0.10 and−0.12. The current price of cocaine is also significant and negative. Its corresponding elasticitylies between−0.28 and−0.36. The relatively large magnitude of this elasticity may have to dowith the fact that an ED drug episode can involve multiple mentions. Since more heroin users arepolydrug users, the likelihood for multiple mentions is stronger for a heroin-related episode. Forinstance, data on arrestees, who are likely to be hardcore users, show that 69% of all heroin usersalso use cocaine, compared to only 15% of all cocaine users who use heroin. A larger cross-price

18D.Dave/Jo
urnalofHealthEconomics
xxx(2005)xxx–
xxx
Table 5Drug episodes, cocaine mentions, heroin mentions: cross-price effects
Dependent variable log odds drug episodes log odds cocaine mentions log odds heroin mentions
Specification 1 2 3 4 5 6
Cocaine price −0.00248*** (0.0009),ε =−0.196
−0.00217*** (0.0006),ε =−0.172
−0.00389** (0.0019),ε = 0.309
−0.00316** (0.0013),ε = 0.251
−0.00454*** (0.0015),ε = 0.360
−0.00356*** (0.0011),ε = 0.283
Heroin price −0.00006* (0.00003),ε =−0.025
−0.00008*** (0.00003),ε =−0.034
−0.00003 (0.0001) −0.00007 (0.0001) −0.00024** (0.0002),ε =−0.101
−0.00029** (0.0002),ε = 0.122
1 Year laggedcocaine price
– −0.00154** (0.0009),ε =−0.124
– −0.00326** (0.0017),ε =−0.263
– 0.00214 (0.0014)
1 Year lagged heroinprice
– −0.00003 (0.00004) – −0.00006 (0.0001) – −.00014 (0.0001)
MSA covariates Yes Yes Yes** Yes** Yes** Yes**
Year EFFECTS Yes** Yes** Yes*** Yes*** Yes* Yes**
MSA effects Yes*** Yes*** Yes*** Yes*** Yes*** Yes***
R2 0.888 0.896 0.912 0.921 0.947 0.951Observations 249 244 249 244 249 244
Notes:Dependent variable is log (A/1−A) whereA is the total number of drug-related ED episodes, cocaine mentions, or heroin mentions in each MSA divided by population.Standard errors are adjusted for MSA-specific serial correlation and are reported in parentheses. MSA covariates include: personal income, unemployment, male, black, other,Hispanic, age 16–24, age 25–54, high school graduate, college graduate, log response rate, and the drug possession arrest rate. Elasticities are reported where the price coefficientis significant at 10% or less in a one-tailed test.
* Significant at 10%.** Significant at 5%.
*** Significant at 1%.

D.Dave/Jo
urnalofHealthEconomics
xxx(2005)xxx–
xxx19
Table 6Cocaine and heroin mentions: Arellano–Bond estimator
Specification 1 2 3 4 5 6
log odds cocaine mentionsOwn drug price −0.00288** (0.0017),
ε =−0.229−0.00344** (0.0018),ε =−0.273
−0.00291** (0.0013),ε =−0.231
−0.00303** (0.0012),ε =−0.240
−0.00275** (0.0013),ε =−0.218
−0.00314*** (0.0011),ε =−0.249
1 Year lagged ownprice
– – −0.00293**
(0.0016)−0.00264* (0.0017) −0.00274** (0.0015) −0.00250* (0.0016)
2 Year lagged ownprice
– – – – −0.00034 (0.0010) −0.00016 (0.0009)
Long run elasticity – – ε =−0.463 ε =−0.450 ε =−0.436 ε =−0.447AR(1) 0.096 0.079 0.106 0.140 0.155 0.173AR(2) 0.335 0.426 0.102 0.117 0.099 0.097Contemporaneous
price treatmentPredetermined Endogenous Predetermined Endogenous Predetermined Endogenous
log odds heroin mentionsOwn drug price −0.00018** (0.0001),
ε =−0.076−0.00025** (0.0001),ε =−0.105
−0.00027*** (0.0001),ε =−0.114
−0.00028** (0.0001),ε =−0.118
−0.00019** (0.0001),ε =−0.080
−0.00020* (0.0001),ε =−0.084
1 Year lagged owndrug price
– – −0.00016** (0.0001) −0.00014** (0.0001) −0.00023*** (0.0001) −0.00019** (0.0001)
2 Year lagged owndrug price
– – – – −0.00039*** (0.0001) −0.00035*** (0.0001)
Long run elasticity – – ε =−0.181 ε =−0.177 ε =−0.341 ε =−0.312AR(1) 0.035 0.023 0.007 0.007 0.007 0.006AR(2) 0.911 0.949 0.574 0.598 0.415 0.545Contemporaneous
price treatmentPredetermined Endogenous Predetermined Endogenous Predetermined Endogenous
Notes:Dependent variable is log (A/1−A) whereA is the total number of cocaine or heroin mentions in each MSA divided by population. Own price refers to cocaine price inthe logistic cocaine mention models, and heroin price in the logistic heroin mention models. Standard errors are adjusted for MSA-specific serial correlation and are reportedin parentheses. MSA socioeconomic covariates include: personal income, unemployment, male, black, other, Hispanic, age 16–24, age 25–54, high school graduate, collegegraduate, log response rate, and arrest rate for drug possession. Elasticities are reported where the own-price coefficient is significant at 10% or less in a one-tailed test. In allmodels, lagged drug prices are tsreated as predetermined.
* Significant at 10%.** Significant at 5%.
*** Significant at 1%.

20 D. Dave / Journal of Health Economics xxx (2005) xxx–xxx
elasticity of cocaine price with respect to a heroin mention may just be reflecting a larger own-priceelasticity of cocaine price with respect to a cocaine mention for those heroin mentions that alsoinvolve cocaine. The lagged prices are insignificant. While the negative sign suggests that cocaineand heroin are complements, caution must be exercised in such an interpretation. Since up to fourdrugs can be mentioned for any given ED drug episode, a cocaine mention does not indicate thatonly cocaine was used. In fact, for the year 2002 only 28% of cocaine mentions involved solelycocaine.17 Nevertheless, these cross-price elasticities do not contradict prior studies, which alsosuggest a complementary relationship between these two drugs (Saffer and Chaloupka, 1999;Dave, 2004).
The models with leading prices and lagged enforcement rates did not substantially alter theestimates of the price elasticity, suggesting that the results are robust to policy endogeneity.Table 6directly accounts for the possibility that drug prices may be predetermined or structurallyendogenous by applying the Arellano-Bond estimator. The top panel presents the results forcocaine use. Specifications 1, 3, and 5 treat the current drug price as predetermined, where it iscorrelated with all past disturbances due to policy endogeneity. Specifications 2, 4, and 6 treatthe current price as endogenous, where it is also correlated with the current disturbance due tosimultaneity between supply and demand. Alternative specifications add lagged price effects. Thecontemporaneous cocaine price elasticity is only slightly diminished in magnitude, ranging from−0.22 to−0.27. As before, the long-run elasticity is about twice this magnitude. The bottom panelpresents similar estimation for heroin mentions. The short-run heroin price elasticity is estimatedto be between−0.08 and−0.12, and the long-run elasticity is between−0.31 and−0.34.
Treating the cocaine and heroin prices as predetermined or endogenous and instrumenting forthem does not substantially alter the results. It should also be noted that there is no evidence ofautocorrelation in any of the models; no autocorrelation in non-differenced errors is equivalent tono autocorrelation beyond the first order in first-differenced errors. This is a necessary conditionfor the validity of past levels as instruments for current differences in the A–B procedure. Assuch, the instrumental set “passes” the test of overidentifying restrictions in all cases. If policyendogeneity is interpreted as an intertemporal omitted variables bias, then it will lead to impureserial correlation in the disturbance term. The lack of serial correlation suggests that policyendogeneity is not likely. This is consistent with the inferences drawn from the prior checks forsuch specification bias.
6. Conclusions
The persons sampled in DAWN constitute an important subgroup of hardcore drug users,which is often not captured by national surveys. Since these persons are more likely to be serioususers, impose the heaviest costs on society, and are the targets of much illegal drug policy, studyingoutcomes related to their addictive consumption behavior is important from a public policy stance.Results indicate that the elasticity of the probability of a cocaine mention with respect to ownprice is about−0.27, and the own-price elasticity of the probability of a heroin mention is about−0.10. These elasticities are robust to various specification checks and controls for unobservablesand endogeneity.
17 From 1995 onwards, DAWN disaggregates the cocaine and heroin mentions into single drug mentions and multipledrug mentions. Cross-price effects are theoretically better estimated with the single drug mentions. In models, whichemployed admissions where only cocaine and only heroin are mentioned, the own-price effects are not substantiallydifferent. The cross-price effects however are imprecise.

D. Dave / Journal of Health Economics xxx (2005) xxx–xxx 21
Serious drug-related health problems as proxied by ED visits are more likely correlated withhardcore or heavy drug use than with casual use. The Drug Use Forecasting (DUF) system, main-tained by the National Institute of Justice, samples and administers urine tests to arrestees in majormetropolitan areas in the U.S. This subpopulation, representative of all arrestees, characterizesheavy, hardcore drug users (Dave, 2004). Using an overlapping sample of 16 cities from 1990through 2000, the structural elasticity of the probability of drug-related ED visits with respectto the probability of drug use for heavy users can be estimated: 1.39 for cocaine and 0.91 forheroin.18 The price elasticity of heavy or hardcore drug use can then be imputed by dividing theDAWN elasticities from this study by the above structural elasticities. This yields a cocaine useelasticity of about−0.20 and a heroin use elasticity of−0.11. These estimates are consistent withDave (2004), which used objective drug use indicators based on urinalysis from the Drug UseForecasting system to estimate cocaine and heroin participation elasticities for hardcore users of−0.23 and−0.08, respectively.
The analyses from DAWN indicate that drug prices directly affect the “bottom line”, that ishigher prices improve health outcomes. The contemporaneous elasticity understates the full effectby a magnitude of about one-half. In a fixed population, the elasticity estimates from this studyimply that a 10% increase in the current price of cocaine will prevent about 4687 cocaine-relatedED visits nationwide this year and an additional 4739 ED visits in the future. A correspondingincrease in heroin price will prevent about 1014 heroin-related ED visits nationwide this yearand an additional 1763 ED visits subsequently.19 Hospital and ambulatory costs attributed todrug abuse were estimated at $1.04 billion for 2000 (ONDCP, 2001). About 45% of all hospitalemergency department drug-related episodes involved cocaine or heroin in 2000.20 Applyingthis proxy share, cocaine and heroin-related hospital and ambulatory costs are approximately$466 million or higher. A 10% increase in cocaine and heroin price will prevent about 10,723cocaine and heroin-related hospital emergency room episodes, which translates into direct hospitalcost savings of $21.1 million.21 On the other extreme, if one assumes that cocaine and heroinare responsible for all of the hospital costs, the savings amount to $47.1 million. Since studies(Kuziemko and Levitt, 2004; Grossman and Chaloupka, 1998) have shown that drug prices arepositively related to enforcement efforts, they represent a tool by which the public sector canexercise control over the market for illicit, addictive, unhealthy substances and related outcomes.However, solely based on hospital cost savings, the enforcement resources necessary to drivea 10% increase in cocaine and heroin prices are most likely not cost-effective.22 Even if othercosts of drug abuse are brought into play, it is not readily apparent that further enforcement andinterdiction driven increases in drug prices are necessarily cost-effective (seeDave, 2004). Whilethe share of law enforcement has risen from 36 to 53% over the past 15 years, resources aimed atshifting demand, such as treatment and prevention, have remained at about one-third of the drug
18 While these structural elasticities indicate a strong correlation between heavy drug use and drug-related ED visits,they should be interpreted with care since they do not account for the level or intensity of consumption.19 These estimates are based on the elasticity estimates inTable 3and nationwide drug related ED visits in 2000. If the
cross-price effects are negative, then more drug-related ED visits will be prevented.20 This is likely an overestimate because episodes may involve multiple drugs. However, cocaine and heroin are also
likely to comprise a disproportionately larger component of hospital costs than the other drugs.21 This is a net reduction in episodes after accounting for multiple drug mentions. In the drug use forecasting system,
about 13.8% of arrestees who use cocaine or heroin consume both drugs.22 Estimates suggest that such an increase in drug prices requires an increase in drug control spending of at least $2–$3
billion, to which must be added other external costs of enforcement such as productivity losses from imprisonment andthe cost of resources expended by suppliers to evade detection.

22 D. Dave / Journal of Health Economics xxx (2005) xxx–xxx
control budget. The low magnitudes of the drug outcome-price response suggest that additionalincreases in the drug control budget should consider a larger role for demand-driven interventions.
Acknowledgements
Funding for this research was provided by a grant from the Robert Wood Johnson Founda-tion’s Substance Abuse Research Program to the National Opinion Research Center, University ofChicago. I would like to thank Michael Grossman, Gary Becker, Erdal Tekin, and two anonymousreferees for valuable comments and suggestions. I am indebted to Judy Ball and the SubstanceAbuse and Mental Health Services Administration for providing the DAWN data. I am very grate-ful to the John M. Olin Foundation for providing post-doctoral research support at the WhartonSchool, University of Pennsylvania.
References
Arellano, M., Bond, S., 1991. Some tests of specification for panel data: Monte Carlo evidence and an application toemployment equations. Review of Economic Studies 58, 277–297.
Baltagi, B.H., 2002. Econometric Analysis of Panel Data. John Wiley and Sons, New York.Basov, S., Jacobson, M., Miron, J.A., 2001. Prohibition and the market for illegal drugs: an overview of recent history.
World Economics 2 (4), 133–158.Becker, G.S., Murphy, K.M., 1988. A theory of rational addiction. Journal of Political Economy 96 (4), 675–700.Bureau of Census website:www.census.gov.Bureau of Economic Analysis website:www.bea.gov.Bureau of Labor Statistics website:www.bls.gov.Caulkins, J.P., 2001a. Should the DEA’s STRIDE data be used for economic analyses of markets for illegal drugs: comment.
Journal of the American Statistical Association 96, 1263–1264.Caulkins, J.P., 2001b. Drug prices and emergency department mentions for cocaine and heroin. American Journal of
Public Health 91 (9), 1446–1448.Caulkins, J.P., 1996. Estimating elasticities of demand for cocaine and heroin with duf data, Working Paper (Pittsburgh:
Heinz School of Public Policy, Carnegie Mellon University).Caulkins, J.P., Padman, R., 1993. Quantity discounts and quality premia for illicit drugs. Journal of the American Statistical
Association 88, 748–757.Crane, B.D., Rivolo, A.R., Comfort, G.C., 1997. An Empirical Examination of Counterdrug Interdiction Program Effec-
tiveness. Institute for Defense Analysis, Alexandria, Virginia.Dave, D., 2004. Illicit drug use among arrestees and drug prices, NBER Working Paper 10648.Grossman, M., Chaloupka, F.J., 1998. The demand for cocaine by young adults: a rational addiction approach. Journal of
Health Economics 17 (4), 427–474.Grossman, M., Chaloupka, F.J., Shim, K., 2002. Illegal drug use and public policy. Health Affairs 21, 134–144.Gruber, J., Koszegi, B., 2001. Is addiction rational? Theory and evidence. Quarterly Journal of Economics 116 (4),
1261–1303.Harwood, H., Fountain D., Livermore, G., 1992. The economic costs of alcohol and drug abuse in the United States
(Rockville, MD: National Institutes of Health, 1998).Horowitz, J.L., 2001. Should the DEA’s STRIDE data be used for economic analyses of markets for illegal drugs. Journal
of the American Statistical Association 96, 1254–1262.Hyatt Jr., R.R., Rhodes, W., 1995. The Price and purity of cocaine: the relationship to emergency room visits and death,
and to drug use among arrestees. Statistics in Medicine 14, 655–668.Kessler, R.C., McGonagle, K.A., Zhao, S., Nelson, C.B., Hughes, M., Eshleman, S., Wittchen, H.U., Kendler, K.S., 1994.
Lifetime and 12-month prevalence of DSM-III-R psychiatric disorders in the United States: Results from the NationalComorbidity Survey. Archives of General Psychiatry 51, 8–19.
Kuziemko, I., Levitt, S., 2004. An empirical analysis of imprisoning drug offenders. Journal of Public Economics 88,2043–2066.
Manski C.F., Pepper. J.V., Petrie, C.V. (Eds.), 2001. Informing America’s policy on illegal drugs: what we do not know keepshurting us, Committee on Data and Research for Policy on Illegal Drugs, National Research Council (Washington,DC: National Academy Press).

D. Dave / Journal of Health Economics xxx (2005) xxx–xxx 23
Miron, J., 2003. The effect of drug prohibition on drug prices: evidence from the markets for cocaine and heroin. Reviewof Economics and Statistics 85 (3), 522–530.
Model, K.E., 1993. The effect of marijuana decriminalization on hospital emergency room drug episodes: 1975–1978.Journal of the American Statistical Association 88 (423), 737–747.
Office of National Drug Control Policy, 2003. Drug policy information clearing house fact sheet (Washington, DC: Officeof National Drug Control Policy).
Office of National Drug Control Policy, 2001. The economic costs of drug abuse in the United States: 1992–1998(Washington, DC: Office of National Drug Control Policy).
Office of National Drug Control Policy, 2001. The National Drug Control Strategy: 2001 Annual Report (Washington,DC: Office of National Drug Control Policy).
Rhodes, W., Hyatt, R., Scheiman, P., 1994. The price of cocaine, heroin, and marijuana, 1981–1983. The Journal of DrugIssues 24, 383–402.
Rhodes, W., Johnston, P., Han, S., McMullen, Q., Hozik, L., 2001. Illicit Drugs: Price Elasticity of Demand and Supply.ABT Associates.
Rivara, F., Tollefson, S., Tesh, E., Gentilello, L., 2000. Screening trauma patients for alcohol problems: are insurancecompanies barriers? The Journal of Traum: Injury, Infection and Critical Care 48, 115–118.
Saffer, H., Chaloupka, F.J., 1999. The Demand for illicit drugs. Economic Inquiry 37 (3), 401–411.