the effects of carbohydrate loading 48 hours prior to a
TRANSCRIPT

Copyright is owned by the Author of the thesis. Permission is given for a copy to be downloaded by an individual for the purpose of research and private study only. The thesis may not be reproduced elsewhere without the permission of the Author.

The effects of carbohydrate loading 48 hours
prior to a simulated squash match.
Aaron Raman
BSc (Hons)
A thesis submitted towards the attainment of Master of Science (MSc)
in Exercise and Sport Science.
Massey University, Palmerston North, New Zealand
2012

i
Acknowledgment
I am grateful to everyone whom has been involved, given me support and encouragement
throughout the course of this journey.
To Dr. Matthew Barnes, thank you for providing me with your support and knowledge in the
area of exercise science. You have helped me develop my research skills throughout my
years at Massey University.
To my supervisor(s) Dr. Toby Mündel, thank you for your continuous encouragement,
support and your role as an important supervisor who has taught me a lot of the skills that I
have learned throughout my years as a postgraduate student.
To Associate Professor Stephen Stannard and Mr Paul Macdermid, thank you for your
contribution in this study, your intelligence in the area of study and academic experience.
To the participants of the study, who endured one of the toughest challenges they will ever
face in a game of squash.
And finally, to my friends and family who have supported me during this time.

ii
Table of Contents
Acknowledgment ....................................................................................................................... i
Table of Figures....................................................................................................................... iv
List of Tables ........................................................................................................................... iv
Abstract ..................................................................................................................................... 1
Introduction .............................................................................................................................. 2
Literature Review .................................................................................................................... 3
Exercise intensity and fuel selection ...................................................................................... 3
Background of carbohydrate feeding on performance ........................................................... 5
Carbohydrate ingestion three to four hours before exercise ............................................... 6
Summary ............................................................................................................................. 7
High intensity exercise ........................................................................................................... 8
Carbohydrate utilization during intermittent exercise ........................................................ 8
Carbohydrate feeding 2-3 days before intermittent exercise ............................................... 10
Summary ........................................................................................................................... 12
Muscle glycogen metabolism ............................................................................................... 14
Glycogen breakdown............................................................................................................ 15
Muscle glycogen synthesis ................................................................................................... 18
Summary ........................................................................................................................... 20
Squash background .............................................................................................................. 21
Squash metabolism ........................................................................................................... 21
Exercise protocols ............................................................................................................. 22
Squash and nutrition ......................................................................................................... 25
Summary ........................................................................................................................... 27
Summary and Rationale ....................................................................................................... 29
Hypotheses ........................................................................................................................... 30
Methods ................................................................................................................................... 31
Experimental Overview........................................................................................................ 31
Subjects ............................................................................................................................. 31
Preliminary Session .......................................................................................................... 31
Experimental Protocol .......................................................................................................... 32
Glycogen depletion and dietary manipulation .................................................................. 32
Simulated squash match ................................................................................................... 33

iii
Experimental Procedures...................................................................................................... 36
Measurements ................................................................................................................... 37
Statistical analysis............................................................................................................. 38
Results ..................................................................................................................................... 39
Discussion................................................................................................................................ 46
Interpretation of results ........................................................................................................ 46
Metabolic .......................................................................................................................... 46
Physiological .................................................................................................................... 48
Subjective rating ............................................................................................................... 48
Design of match simulation.................................................................................................. 49
Design of study..................................................................................................................... 50
Practical Applications .......................................................................................................... 51
Limitations ........................................................................................................................... 52
Conclusion .............................................................................................................................. 54
References ............................................................................................................................... 55
iv
Table of Figures
Figure 1. Cross-over concept ..................................................................................................... 4
Figure 2. Breakdown of glycogen by phosphorolysis and the release of glucose . ................ 16
Figure 3. Mechanism to the activation of glycogen phosphorylase......................................... 17
Figure 4. Glycogen synthesis via elongation of glycogen primer molecule using UDPG as a
glucosyl donor. ...................................................................................................... 19
Figure 5. Overview of experimental procedures. ..................................................................... 33
Figure 6. On-court schematic and position of Fusion timing gates. ........................................ 34
Figure 7. Time-line of events during each squash trial. ........................................................... 37
Figure 8. RER (mean ± SEM) during each trial.. .................................................................... 39
Figure 9. Rate of carbohydrate oxidation (mean ± SEM) during each trial.. .......................... 40
Figure 10. Rate of fat oxidation (mean ± SEM) during each trial.. ......................................... 41
Figure 11. O2 (mean ± SEM) during each trial. .................................................................... 41
Figure 12. CO2 (mean ± SEM) during each trial.. ................................................................. 42
Figure 13. Heart rate (mean ± SEM) during each trial. ........................................................... 43
Figure 14. Glucose concentration (mean ± SEM) during each trial. ....................................... 44
Figure 15. Lactate concentration (mean ± SEM) during each trial. ......................................... 44
Figure 16. Performance time (mean ± SEM) during each trial. ............................................... 45
Figure 17. RPE (mean ± SEM) during each trial. .................................................................... 45
List of Tables
Table 1. Summary of studies incorporating glycogen synthesis between 22.5 and 72h. ........ 13
Table 2. Studies that have included nutritional interventions in relation to squash
performance. .............................................................................................................. 28

1
Abstract
Squash is a high-intensity, intermittent racket sport that is played by over 15 million people
worldwide (Eime & Finch, 2002). Unlike other racquet sports such as tennis, squash has had
limited attention in the area of sports nutrition and exercise performance. Furthermore, the
effect of carbohydrate ingestion in the days (48 hours) leading up to a squash match has not
been explored. Eight squash players who were graded at a Squash New Zealand grade of C1
or above were recruited. Following a familiarisation subjects completed two further trials
which consisted of a bout of exhaustive exercise prior to completing a simulated squash
match, following a controlled diet for 48 hours in between initial exhaustive exercise bout
and match simulation. The match simulation was aimed to mimic the expected metabolic
changes during a five-set match lasting about an hour to incorporate the endurance factor of
exercise. Performance was measured by the time required to complete each set, which was
designed to last ~12 minutes followed by a rest period of ~120 seconds in order to collect
measurements. The interventions were assigned in a randomised, single-blind, cross-over
design. The interventions consisted of a standardised diet with additional energy intake via
the form of a ‘sports drink’. The high-carbohydrate (11.1g·kg-1
) diet was primarily delivered
in the form of a carbohydrate-containing solution containing maltodextrin; whilst the calorie-
matched low-carbohydrate (2.1 g·kg-1
) drink was made from a combination of milk powder,
protein powder and oil. Oxygen uptake, respiratory exchange ratio (RER), fat and
carbohydrate oxidation, and heart rate were continuously collected throughout the trial. Blood
glucose and lactate samples were obtained before and after each squash set. Rating of
Perceived Exertion (RPE) was also recorded after each set. There was an overall main effect
of the intervention as seen from RER (p = 0.016). The difference in RER was further
supported by a significant difference seen in fat (p = 0.011) and carbohydrate (p = 0.013)
oxidation. Though an interaction of performance time and the intervention was progressing
towards significance (p = 0.076), it narrowly missed the α-value of 0.05 to achieve
significance. A significant main effect of the trial was not present in both blood glucose and
lactate (p > 0.05). However, blood glucose and lactate had a significant effect of time of p =
0.005 and p < 0.001, respectively. These results point towards a beneficial effect of
carbohydrate ingestion on squash performance. However, further research will be required to
support the findings of this study.

2
Introduction
Squash is a popular racket sport that is played by over 15 million people worldwide (Eime &
Finch, 2002). It is played by both males and females of all ages and can be taken on at any
skill level. It is beneficial to health as it challenges several aspects of fitness including aerobic
and anaerobic capacity, flexibility, and speed. A squash match is played over three to five
sets and can last up to three hours during a five-set match (Steininger & Wodick, 1987).
Being the sport of interest in this study, squash has received limited attention from the sport
science community and therefore the physiological stresses during match play are poorly
understood. Hence, the rationale behind this study was to gain a better understanding of the
metabolic, physiological, and nutritional aspect of squash. Previous squash research has
primarily concentrated on game analysis (Girard et al., 2007), with only a handful of studies
investigating on-court performances via match simulations (Romer et al., 2001,Kingsley et
al., 2006,Girard et al., 2007).
This study aimed to simulate a five-set match, provoking the relevant physiological stresses
required for success in competition. A nutritional intervention was introduced to this study
which adds to the current literature, which had the aim of investigating the effect of
carbohydrate loading on simulated squash performance. Unlike many other sports where
there is a plethora of well-researched findings on the importance of carbohydrate on
performance, this has not been researched in squash. Sensibly, we hypothesized that a high
carbohydrate diet in the days prior to a simulated squash match would increase carbohydrate
oxidation during the match, and thereby improve match performance.
The literature review covers a brief background of published knowledge regarding
carbohydrate loading and feeding during exercise, the effect of carbohydrate stores in relation
to performance, the processes of muscle glycogen depletion and synthesis, previous literature
on high-intensity exercise, and a background of previous research and methodology used in
squash-related research.

3
Literature Review
Exercise intensity and fuel selection
It is well understood that as exercise intensity increases, the proportion of energy produced
from carbohydrate increases. This is due to two factors: 1) the increasing engagement of
glycolytic fibres in the motor units sequentially recruited with increasing muscular tensions;
and 2) the increase in activity of glycolysis promoting enzymes which occurs with cellular
energetic stress. These effects are illustrated in the Crossover Concept (Figure 1). In a whole
body context, fat is the main fuel source utilised at rest. When exercise is initiated, an
increased proportion of energy will be derived from carbohydrate substrate whilst fat
utilisation declines in relative terms. The crossover point occurs at around 70% of O2max,
but is dependent upon a number of factors including training status and nutritional status.
Further evidence of increased carbohydrate utilisation can be seen from the study of Saltin &
Karlsson (1971) where the rate of glycogen depletion in the quadriceps muscle increased as
exercise intensity increased. The optimal exercise intensity for the depletion of carbohydrate
was found to be at 75% O2max in which muscle glycogen values were approaching zero at
the point of fatigue. Conversely, at maximal (100% O2max) and supra-maximal (>100%
O2max) exercise intensities, glycogen depletion was not as severe because exhaustion likely
occurred from non-fuel-related causes (probably cardiovascular in origin). Clearly,
carbohydrate, particularly muscle glycogen, is the main source of energy for moderate- to
high-intensity exercise.
There is a difference between trained and untrained participants in the utilization of
carbohydrate during exercise. Well-trained participants possess a higher absolute oxygen
uptake whilst maintaining a lower RER than an untrained participant at the same absolute
intensity.
The higher circulating lactate levels seen in untrained individuals for the same relative
workload can be, in part, explained by the fact that when trained individuals exercise at low-
intensity, a greater proportion of the muscle fibres recruited are more oxidative and can
utilize fat. Hence, in well-trained people, lower glycogen utilisation is observed and minimal
lactate is produced. The seminal work by Henneman and colleagues (Mendell, 2005) who
developed the ‘Size Principle’ for motor unit recruitment, showed that as muscular tension

4
increases, larger motor units are recruited which are more glycolytic in their energetic
requirement. This will, of course, result in increased lactate production in the exercising
muscle. Training results in a shift to more oxidative fibres in those motor units utilized during
training (Dudley et al., 1982). An untrained individual recruits glycolysis-reliant fibres more
quickly as muscular tension must be increased, so is more glycogen dependent as intensity
increases (Saltin & Karlsson, 1971). In other words, a larger breakdown of muscle glycogen
is experience in untrained subjects which at least partly explains the increased lactate
concentrations at the same absolute workload for this group (Saltin & Karlsson, 1971).
Figure 1. Crossover concept (Brooks & Mercier, 1994).

5
Background of carbohydrate feeding on performance
Pre-exercise nutritional interventions have been of interest to human physiologists since the
early twentieth century. Nearly a century ago it was suggested by Christensen & Hansen
(1939) that the ability to perform prolonged exercise is dependent on the type of diet before
exercise, and that high carbohydrate diets provided an ergogenic advantage. Previous
research has found that exercise capacity is related to the degree of glycogen stored in the
muscle. Therefore as the duration of exercise progresses, the availability of glycogen as a fuel
source becomes more limited from being utilised during exercise. The consequence of
reduced muscle glycogen stores then impacts on exercise performance and/or capacity
(Bergström et al., 1967,Hermansen et al., 1967).
Most research investigating fuel utilization during exercise, including that described above,
has employed constant load, endurance exercise. Yet, most game sports are intermittent in
nature, with varying degrees of intensity over 60-90 minutes. An early study by Hermansen et
al. (1967) investigated the effects of intermittent exercise in muscle glycogen concentrations
and found that the oxidation rate of carbohydrates was extremely high and constant
throughout a 20-minute period of intermittent exercise at 75% of O2max. These researchers
also found that there was a close relationship between the rate of glycogen utilised along with
the amount of carbohydrates combusted. As a result of this and subsequent studies, it is now
well established that muscle glycogen content decreases during intermittent work and
glycogen stores may be close to being completely emptied at the point of exhaustion.
Prior to the introduction of the of the biopsy needle (Bergström & Hultman, 1966), samples
were taken by the open biopsy technique. In the late 1960s, Bergstrom and colleagues
performed many studies investigating the effect of diet and exercise on muscle glycogen
concentration. In one of these studies (Bergström & Hultman, 1966), the authors showed that
when a muscle was previously exercised then provided with carbohydrate, its ability to
accrue glycogen when carbohydrate was eaten was significantly greater than the other leg
which did not take on the prior contractile activity. Further research by the same group
(Bergström et al., 1967) showed that when prior glycogen depleting exercise was followed by
a high carbohydrate diet, the amount of glycogen stored within skeletal muscle was much
greater than if a low carbohydrate diet was consumed. Thence developed a regime, variously
termed ‘glycogen super-compensation’ or ‘carbohydrate loading’ whereby endurance athletes
employed to maximise muscle glycogen levels prior to an important event. The protocol

6
consisted of three days of a high fat and protein diet, followed by another three days of a high
carbohydrate diet with periods of exercise within a 7-day period. The parallel exercise
protocol consisted of cycling to exhaustion at a work load corresponding to around 75% of
the subjects O2max on the first day, followed by a maintenance (low) training workload on
the following days to keep muscle glycogen levels low.
Laboratory-based research on glycogen super-compensation showed that endurance cycling
performance time was improved by at least 100% with the use of this traditional ‘loading’
regime. On the other hand, muscle glycogen concentrations after three days of a fat and
protein diet following a bout of exhaustive work proved to be unsuccessful in resynthesising
muscle glycogen to more than 50 percent of its initial value. The results of this study was
further supported from the RER and lactate values taken during exercise which corresponded
with the high-carbohydrate diet by demonstrating higher RER and lactate values when
compared to the fat and protein (control) diet. This indicated greater utilisation of
carbohydrate, greater use of larger motor units and thus generating greater force development
within the muscle (Bergström et al., 1967).
Carbohydrate ingestion three to four hours before exercise
Increasing carbohydrate intake three to four hours before exercise has been found to increase
muscle glycogen concentrations. Coyle et al. (1985) investigated the effects of a high
carbohydrate meal four hours before 105 minutes of exercise at 70% O2max in endurance-
trained cyclists. The trial was compared to a 16-hour dietary fast. As expected, muscle
glycogen was significantly higher with pre-exercise feeding. However, the post exercise
glycogen levels were not significantly different. This indicates that the total muscle glycogen
utilised during the course of exercise was greater following pre-exercise feeding. This was
supported by an increase in carbohydrate oxidation which would have been derived from the
increased muscle glycogen stores.
A more recent study by Wright et al. (1991) investigated the effects of various combinations
of carbohydrate feeding and timing before or during exercise. Subjects consumed 5g·kg-1
body weight of a carbohydrate solution in a 25% carbohydrate solution which was made out
of 21% glucose polymers and 4% sucrose. Following consumption of the carbohydrate
solution, subjects rested for three hours before commencing exercise consisting of cycling at
70% of O2max until exhaustion. When compared to a placebo, the RER was significantly

7
higher following pre-exercise carbohydrate feeding indicating a higher rate of carbohydrate
oxidation. The result of this study found that a three-hour pre-exercise carbohydrate feeding
resulted in a 19% improvement in total work output when compared to the trial without any
carbohydrates. The improvement in performance suggests that the carbohydrate feeding
delayed fatigue by maintaining carbohydrate availability. This would perhaps allow longer
use of the larger motor units prior to fatigue (Wright et al., 1991). This supports the results of
the previously discussed study by Coyle et al. (1985) in which the increase in carbohydrate
oxidation may have been due to an increase in muscle glycogenolysis or an increase in
glucose uptake.
Even though carbohydrate feeding in the hours before exercise may result in a transient fall
of glucose following the onset of exercise and a blunting of free fatty acid mobilisation, these
metabolic perturbations are not detrimental to performance due to the increase in
carbohydrate availability which compensates for greater carbohydrate oxidation and/or
utilisation (Coyle et al., 1985,Wright et al., 1991).
Summary
Exercise intensity is closely related to fuel selection and utilization; vis-à-vis, the proportion
of carbohydrates utilised for energy production increases with exercise intensity. It thus
follows that endurance and intermittent exercise performance is also closely related to the
amount of stored glycogen in the muscle at the onset of exercise. High carbohydrate diets,
especially in the days (and even hours) following previous exercise, have the ability to
maximize muscle glycogen concentrations. The majority of relevant research, however, has
only studied endurance, constant-load exercise.

8
High intensity exercise
Carbohydrate utilization during intermittent exercise
As previously discussed, high-intensity, intermittent exercise is known to deplete muscle
glycogen stores since it engages the larger (more glycolytic) motor units which rely heavily
upon glycogen to support their energetic needs (Saltin & Essen, 1971). The end of a football
match, for example, will result in low glycogen concentrations in the major locomotor
muscles, and to facilitate recovery, carbohydrates must be quickly replenished (Bangsbo et
al., 2007).
Many sports such as soccer, tennis, and basketball involve bouts of all-out effort or maximal
exercise during a prolonged period of continuous exercise of submaximal intensity (Smekal
et al., 2001,Bangsbo et al., 2007). During a single bout of dynamic maximal exercise lasting
less than 10 seconds, much energy is provided through anaerobic pathways; glycogenolysis
leading to the formation of lactate and through the breakdown of phosphocreatine (Boobis et
al., 1982). Gaitanos et al. (1993) investigated the contribution of glycogenolysis and Creatine
Phosphate (PCr) degradation to energy provision during ten six-second sprints on a cycle
ergometer with 30 seconds of recovery between sprints. The magnitude of glycogen that was
used anaerobically in the first 6-second bout was 44.1% while PCr degradation contributed to
49.6% of energy production. Following the tenth six-second sprint, the contribution of energy
from anaerobic sources was reduced to 35.6%. Anaerobic glycolysis contributed to only
16.1% as the glycolytic rate had dropped 7.6 times from its original rate. Though the
contribution of anaerobic glycolysis was reduced in the final sprint, it is likely that there was
an increased reliance on aerobic metabolism of glycogen as a fall in muscle glycogen was
observed. The reduction of power output and total work production is supported by Spriet et
al. (1989) who also found a reduced average power output and total work production as the
number of exercise bouts progressed. The authors found that reduced contribution from
glycogenolysis was one explanation which may have affected the decline in performance.
Down-regulation of glycogen phosphorylase activity was also affected by an increasing
hydrogen ion, H+ concentration [H
+]. The increased [H
+] may have interfered with the
calcium ion, Ca2+
concentration [Ca2+
], activation thereby decreasing the amount of Ca2+
released from the sarcoplasmic reticulum resulting in a reduced force production and
phosphorylase activation of the affected muscle fibres (Spriet et al., 1989).

9
A later study by Hargreaves et al. (1998) investigated muscle metabolism in human muscle
following repeated bouts of high-intensity exercise. Like the studies mentioned previously, a
decline in muscle glycogen was observed as the number of sprints increased. The authors
found that though peak power and work decreased during the initial three bouts, this was not
evident in the fourth sprint. This may be explained through methodological differences in
comparison to previous studies as the subjects cycled for 30 minutes between 30-35%
O2max between the third and fourth bout which would have facilitated the removal of
lactate and H+ ions from blood and muscle while minimising resynthesis of muscle glycogen.
Though not significantly different, there was an increase in muscle glycogen following the 3rd
exercise bout which may explain the increase in performance in the final sprint. Similarly to
Spriet et al. (1989), Hargreaves et al. (1998) are in support of other factors such as PCr
availability and the concentration of H+ ion which may affect performance as similar changes
were seen.
The studies discussed above found that the rate of glycogenolysis contributes to the reduction
in performance seen with repeated bouts of high intensity effort. It also supports the
contribution of anaerobic glycolysis during intermittent exercise. Since squash is an
intermittent sport which can be completed over a prolonged period of time, the amount of
glycogen stored in muscle would theoretically influence performance, even more so when
exercise is prolonged from the aerobic component of glycogen utilisation.
It has been previously shown that nearly full replenishment of glycogen stores is possible in
both type I and type II fibres within the first 24 hours following exercise-induced glycogen
depletion (Piehl, 1974). A study by Nicholas and co-authors (Nicholas et al., 1997) was
designed to investigate the restoration of intermittent high-intensity running capacity
following a diet containing additional energy in the form of carbohydrate or fat and protein.
An additional amount of carbohydrates were calculated from the daily intake (5.4g·kg-1
) in
order to increase each subject’s daily intake to 10g·kg-1
. Subjects were prescribed the diet
with additional carbohydrates or an isocaloric diet in the form of fat and protein over a 22-
hour recovery period following the first shuttle run test. Following the recovery period,
subjects repeated the prolonged, intermittent, high-intensity shuttle run test. The results found
that subjects were able to run for 5.8 ± 1.7 minutes longer in the carbohydrate trial when
comparing the difference in performance time across experimental conditions. This
improvement in endurance capacity allowed subjects to run 1.1 ± 0.3km further.

10
Carbohydrate feeding 2-3 days before intermittent exercise
Carbohydrate loading in the days leading up to intermittent exercise have been previously
studied (Jenkins et al., 1993,Casey et al., 1996,Balsom et al., 1999). The efficacy of a loading
period between 24 and 72 hours has been investigated by Piehl et al. (1974) and Blom et al.
(1987). A summary can be seen in Table 1 along with intermittent exercise completed after a
short bout of carbohydrate feeding in the days leading to exercise. Jenkins and co-authors
(1993) conducted a similar study to Snyder and colleagues (1993) looking at the effects of
carbohydrate intake on performance on supramaximal intermittent exercise. Participants
consumed a moderate CHO diet for 3 days before the first of two intermittent tests and were
then randomly assigned to either a high, moderate or low carbohydrate diet for 3 days in
between the first and second intermittent test. The intermittent tests consisted of five 60-
second all-out periods of cycling with each period separated by five minutes of passive
recovery. The authors found that participants who consumed a moderate or high CHO diet
before the second maximal intermittent test significantly improved their average work output
by 2.3% and 5.6%, respectively. In support of these improvements in performance, a
significant relationship was found between the changes in work output and changes in
carbohydrate consumption. Interestingly, the changes in work output between low
carbohydrate and the moderate/high carbohydrate groups did not show a similar relationship
with O2 values during exercise.
Casey et al. (1996) found no improvement following 3 days of a high carbohydrate diet in
work performed during four bouts of isokinetic cycling. Subjects went through a vigorous
glycogen depletion protocol followed by 3 days of either a low (< 10%) or high (>80%)
carbohydrate diet. The morning following the diet, subjects completed 30 minutes of cycling
followed by a two hour recovery period before completing the four repeated bouts of 30-
second maximal exercise. No significant differences were seen when comparing total work
production during each bout of exercise before and after a high carbohydrate diet. However
after a low carbohydrate diet, work decreased during the first three bouts of maximal
exercise, but it had no effect thereafter.
Balsom and co-authors (1998) investigated the effects of a low- (4%) versus high-
carbohydrate (67%) diet for 48 hours before completing an exercise regime. Two exercise
protocols were completed 24 hours apart, on two occasions separated by at least one week.
The first protocol consisted of 15 six-second bouts of high-intensity exercise with 30 seconds

11
of rest between periods. The second exercise protocol 24 hours later consisted of repeated
six-second bouts of high-intensity exercise completed to the point of fatigue. Muscle
glycogen was depleted 24 hours before completing the first protocol. The findings from the
study found that following the high-carbohydrate diet, subjects were able to maintain a higher
power output over the first protocol consisting of fifteen 6-secound bouts and completed an
average of 183 more sprints in the second protocol where high-intensity exercise was
repeated until fatigue. Since high intensity exercise is associated with a rapid utilisation of
muscle glycogen, the maintenance of a higher average power output is in support of an
increased availability of muscle glycogen (Gaitanos et al., 1993). This is supported by
glycogen concentrations which were significantly higher post-exercise following the high-
carbohydrate trial. Since the second exercise protocol can last for at least 30 minutes, it was
suggested that aerobic energy production plays a role in resynthesising ATP during this
contractile activity. This is in support of Gaitanos et al. (1993) who suggested that there was
a decrease in the contribution of anaerobic metabolism and a subsequent shift towards
aerobic metabolism from repeated bouts of high-intensity exercise.
Therefore evidence of carbohydrate feedings before intermittent exercise still remains
equivocal and needs to be investigated further. There is also further support for an increased
aerobic contribution to energy production during exercise following repeated bouts of high-
intensity exercise as ATP turnover declines (Spriet et al., 1989,Bogdanis et al., 1996). The
reduced contribution of anaerobic glycolysis may also be supported by a reduced average
power output during the last sprint. This can be explained by a higher mean power output in
the first sprint where energy would have mainly been derived from PCr and anaerobic
glycogenolysis. The reduced power output from an increased contribution of aerobic
glycogenolysis may be explained by the muscle fibre type contribution as type II fibres are
more glycolytic which support the higher mean average power output during the first sprint.

12
Summary
Sports such as squash, soccer and tennis consist of intermittent high-intensity bouts.
However, since these sports can last for a prolonged period of time, the energy demands shift
from an anaerobic source to greater use of the aerobic pathways. Carbohydrate feedings two
to three days before short duration high-intensity intermittent tests have been found to result
in an improvement in exercise performance of between 2.3% to 5.6%. Recent work
investigating the effect of carbohydrate ingestion during prolonged intermittent exercise was
found to be effective in studies simulating a soccer match and the duration of other sports
such as hockey and basketball. However, available literature on carbohydrate ingestion on
racket sports such as squash is very limited and has not received as much attention as it
should have as the nature of the sport relies on a high proportion of carbohydrate utilisation.

13
Table 1. Summary of studies incorporating glycogen resynthesis between 22.5 - 72h with/without an intermittent exercise test.
Study Participants Depletion/Initial Protocol CHO intake Performance protocol Muscle glycogen Outcome of the study
Piehl et al.
(1974)
4 active males Glycogen resynthesis
following glycogen depletion
for 2 hours (1h of endurance
exercise and repeated sprints)
60% CHO diet for 46
hours.
Glycogen = 23mmol ↑ to
124mmol glucose units/kg.
Glcyogen ↓ from 125 to 23mmol glucose units/kg.
46h recovery ↑ to 124mmol glucose units/kg.
Blom et al.
(1987)
6 trained (T) and
untrained (UT)
runners
Glycogen resynthesis
following exhaustive running
@ 75% VO2max
400g : 600g
before : after exercise
↑ before exercise in (T) – 110
to 180 mmol/kg. ↑ glycogen
in T and UT after 3 days.
Glycogen ↑ 26 to 87mmol/kg, and ↑ 57 to 127
mmol/kg in UT and T, respectively (p < 0.001).
Fallowfield &
Williams
(1993)
16 males Ingested CHO after treadmill
run @ 70% VO2max for 90 min
or until exhaustion
CHO = 5.8 (C) or
8.8g/kg (CHO) BW
during a 22.5hr
recovery
Repeated treadmill run.
None measured. CHO trial ↑ time by 9.21 minutes. However, ↓
performance time by 15.57 minutes following
control trial.
Jenkins et al.
(1993)
14 moderately
trained males
1st visit :VO2max
2nd
and 3rd
: Maximal Interval
Test (MIT).
3 diets lasting 3 days
each: low (12%),
moderate (55%) or a
high (80%) CHO
diet.
Repeat of interval test
(MIT2)
None measured. Moderate and high-CHO ↑ work output by 2.3% and
5.6% respectively, when compared to low-CHO diet.
Casey et al.
(1996)
11 healthy males Glycogen depletion; Repeated
cycling to exhaustion at 75%
VO2max.
2 CHO diets - three
days each; low
(<10%) and high
(>80%)
30 min. cycling at 75%
VO2max with 2h recovery
followed by four 30-s
sprints
None measured. No change in total work production before and after
high CHO intake. Total work production ↓ in first 3
bouts following low-CHO intake. No change in 4th
bout.
Balsom et al.
(1999)
7 active males Cycling for 90 min @ 70%
VO2max + supramaximal
intermittent bouts.
2 diets: Low (4%) vs
High (67%) CHO
diet for 48h.
Short (IExshort) and long
(IExlong) intermittent
exercise during and at the
end of feeding period,
respectively.
Glycogen before IExshort and
IExlong was sig. ↓ following L-
CHO diet compared with H-
CHO.
↓ work completed in L-CHO vs H-CHO. 265% ↑ in
performance following H-CHO diet. Glycogen
concentration significantly ↓ at point of fatigue in L-
CHO vs H-CHO, 58 vs 181mmol/kg (dry weight).

14
Muscle glycogen metabolism
Glycogen utilisation
Gollnick et al. 1973a found that complete glycogen depletion occurred during prolonged
exhaustive work at 65% O2max. This suggests that all muscle fibres were used at some
point in time during prolonged exercise. Five trained and untrained subjects were instructed
to cycle at this workload for three hours or to the point of exhaustion. The trained subjects
completed the three hours of exercise, whilst the remaining subjects lasted between 110 and
120 minutes.
The initial glycogen concentration for the untrained and trained groups was 96 & 182
mmol·kg-1
, respectively. These values declined to 11 and 34 mmol·kg-1
, respectively which
identifies that the inability for untrained subjects to work beyond two hours was probably
related to having lower initial muscle glycogen (Gollnick et al., 1973a). The authors found
that initial glycogen depletion occurred in the ST fibres. Additional ST motor units were
recruited in order to maintain the ability to develop tension. When the ST fibres were
glycogen depleted, FT fibres were recruited which led to their sequential glycogen loss.
During high-intensity exercise, with a calculated resistance of 150% of subjects’ aerobic
power, the low-oxidative, fast-glycolytic fast twitch fibres were the first to become glycogen
depleted. Subjects performed six one-minute bouts at the calculated power output. The
average pre-exercise glycogen was 132mM of glucose units·kg-1
. Following the first bout of
exercise, this declined by 20%. There was a linear decline in glycogen following each
successive sprint that was completed. The calculated average of final glycogen content was
49mM of glucose units·kg-1
(Gollnick et al., 1973b).
The findings from this current study (Gollnick et al., 1973b) found that FT fibres were
recruited at the onset of heavy, high-intensity exercise. Though ST fibres were probably
utilised during exercise, the glycogen stores would not have depleted as rapidly as FT fibres
as it has a greater aerobic capacity than type II fibres. Their lower glycolytic potential may
have also prevented the rapid depletion of glycogen.
A later study by Gollnick et al. (1974) examined the pattern of selective glycogen depletion
in human muscle fibres following exercise of varying intensity; low, medium and high
intensity which corresponded to ~31%, 64% and 84%, respectively of the subject’s O2max.

15
The results from this study support Gollnick’s previous studies in which ST fibres are the
first to lose glycogen during exercise at a workload lower than 100% of O2max. It also
confirms that FT fibres are only depleted of glycogen before ST fibres at supramaximal
workloads.
During exercise at the lightest workload, total glycogen depletion was modest as expected.
However, selective glycogen depletion did occur in ST fibres at an early stage following the
onset of exercise which confirms the previous results (Gollnick et al., 1973a). Exercising at
the highest workload resulted in exhaustion in 60 minutes from the depletion of glycogen in
ST fibres. However, an interesting point can be made in which there was still a substantial
amount of glycogen available in FT fibres following termination of exercise.
A study by Vollestad et al. (1984) required subjects to exercise to exhaustion at 75% of
O2max. Subject’s glycogen levels were similar in both fibre types at rest. After 40 minutes
of exercise, a large proportion of type I and type IIa fibres were emptied of glycogen. The
results from this study showed that all type I and type IIa fibres were recruited from the start
of submaximal exercise at 75% O2max. This result is in agreement with an earlier study
conducted by Andersen & Sjogaard (1976) in which glycogen depletion occurred in type I,
IIa and IIb fibres during 14 minutes of exercise at a higher exercise intensity.
In summary, high-intensity exercise results in the recruitment of type II muscle fibres which
results in greater muscle glycogen depletion from those highly glycolytic fibres. On the other
hand, lower intensity exercise that can be endured for prolonged periods recruit type I fibres
(Gollnick et al., 1973a,Gollnick et al., 1973b,Piehl et al., 1974,Greenhaff et al., 1994). These
two concepts need to be applied in the glycogen depletion bout for the proposed Masters
study as the degree of depleted muscle glycogen is imperative before carbohydrate feeding.
This is also important as participants in the study are not endurance trained athletes and
therefore will not be able to follow traditional depletion methodologies such as cycling for
two hours.
Glycogen breakdown
Glycogen stores in the liver and kidneys are broken down to release glucose into the blood by
an enzyme called glycogen phosphorylase. The glycogen chain which is broken down is
released as glucose-1-phosphate (G-1-P) and the associated glycogen chain that was attached
to it. G-1-P is then converted to glucose-6-phosphate (G-6-P) by phosphoglucomutase. G-6-P
16
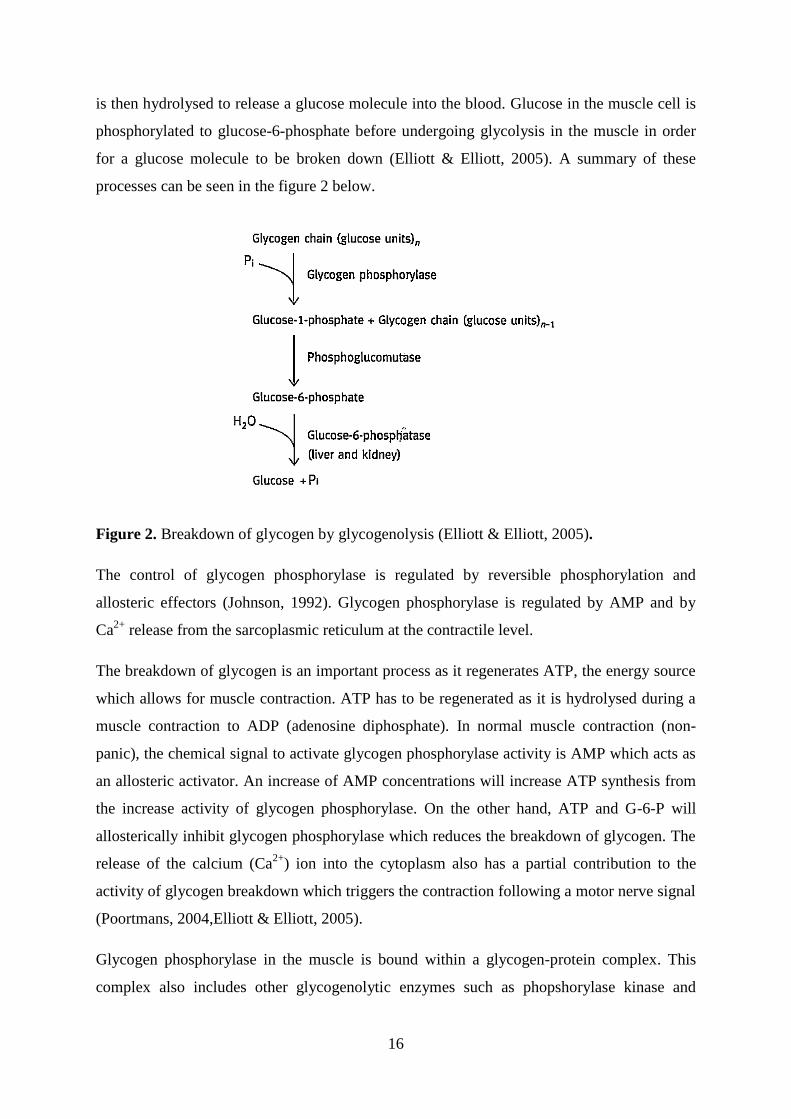
is then hydrolysed to release a glucose molecule into the blood. Glucose in the muscle cell is
phosphorylated to glucose-6-phosphate before undergoing glycolysis in the muscle in order
for a glucose molecule to be broken down (Elliott & Elliott, 2005). A summary of these
processes can be seen in the figure 2 below.
Figure 2. Breakdown of glycogen by glycogenolysis (Elliott & Elliott, 2005).
The control of glycogen phosphorylase is regulated by reversible phosphorylation and
allosteric effectors (Johnson, 1992). Glycogen phosphorylase is regulated by AMP and by
Ca2+
release from the sarcoplasmic reticulum at the contractile level.
The breakdown of glycogen is an important process as it regenerates ATP, the energy source
which allows for muscle contraction. ATP has to be regenerated as it is hydrolysed during a
muscle contraction to ADP (adenosine diphosphate). In normal muscle contraction (non-
panic), the chemical signal to activate glycogen phosphorylase activity is AMP which acts as
an allosteric activator. An increase of AMP concentrations will increase ATP synthesis from
the increase activity of glycogen phosphorylase. On the other hand, ATP and G-6-P will
allosterically inhibit glycogen phosphorylase which reduces the breakdown of glycogen. The
release of the calcium (Ca2+
) ion into the cytoplasm also has a partial contribution to the
activity of glycogen breakdown which triggers the contraction following a motor nerve signal
(Poortmans, 2004,Elliott & Elliott, 2005).
Glycogen phosphorylase in the muscle is bound within a glycogen-protein complex. This
complex also includes other glycogenolytic enzymes such as phopshorylase kinase and

17
protein kinase (Entman et al., 1980). The activity of glycogen phosphorylase a is closely
related to the concentration of Ca2+
that is released from the sarcoplasmic reticulum. When
muscle contraction occurs, the conversion of phosphorylase b to a is initiated as a result of
the activation of phosphorylase kinase. Phosphorylase kinase is activated following Ca2+
binding to its calmodulin subunit, resulting from an increased concentration of Ca2+
which is
released from the sarcoplasmic reticulum during the excitation-contraction coupling (Cohen
et al., 1980).
At the hormonal level, glycogen phosphorylase is activated by glucagon and epinephrine in
the liver, and by epinephrine only in the muscle (Stallknecht et al., 1998). In an emergency
situation (flight-or-fight response), the conversion of phosphorylase b to a is most active
during the absence of AMP. Following the binding of epinephrine to the hormone-receptor in
the muscle, this activates adenylate cyclase to convert ATP to cAMP. cAMP activates protein
kinase A (PKA). The activation of PKA activates phosphorylase b kinase via
phosphorylation, which goes on to phosphorylate phosphorylase b to phosphorylase a. A
summary of this conversion can be seen in the figure below (Elliott & Elliott, 2005).
Figure 3. Mechanism to the activation of glycogen phosphorylase (Elliott & Elliott, 2005).

18
Muscle glycogen synthesis
Restoration of muscle glycogen following endurance exercise is very slow unless a
carbohydrate-rich food is provided. However, when an adequate amount of carbohydrate is
consumed by an athlete immediately after exercise and at two-hour intervals, the rate of
muscle glycogen is rapidly increased and maintained for up to six hours following exercise
(Ivy et al., 1988,Reed et al., 1989). It is well known that the rate of glycogen storage is
consistent for the first couple hours following termination of prolonged exhaustive exercise.
However, no added benefit has been found rate of glycogen storage by increasing the amount
of carbohydrate consumption in the 6 hours following exercise (Ivy et al., 1988). This
highlights the timing importance of carbohydrate intake for glycogen resynthesis is at its
highest and most effective rate following exhaustive exercise.
The rate of glycogen synthesis in human muscle fibres at a depleted state is well related to the
activity of the enzyme, glycogen synthetase (Bergstrom et al., 1972). From the results
through periodic acid-Schiff (PAS) staining, the author found that resynthesis of glycogen
began almost immediately after exercise-induced glycogen depletion. Furthermore, it was
suggested that the entire initial feedings of various amount of carbohydrate was converted to
muscle glycogen. This increase of initial glycogen immediately following exercise can be
attributed to the activity of glycogen synthase (glycogen synthetase; interchangeably used)
(Bergström et al., 1967). In addition to the immediate resynthesis of glycogen following
exercise-induced glycogen depletion, it has been reported that faster glycogen resynthesis
occurs in type II fibres due to the greater glycogen synthase activity in type II fibres
(Blanksby et al., 1973,Piehl, 1974)
Glycogen synthase is the enzyme that catalyses the transfer of the glucose moiety of Uridine
Diphosphate-glucose (UDPG) to the outer chains of glycogen, resulting in the enlargement of
the glycogen molecule (Taylor et al., 1972).

19
Figure 4. Glycogen synthesis via elongation of glycogen primer molecule using UDPG as a
glucosyl donor (Elliott & Elliott, 2005).
Glycogen synthase exists in two interconvertible enzymatic forms; glycogen synthase I, is
the non-phosphorylated form of the enzyme which is normoally active. I stands for
independent, which is independent of G-6-P. The other form, glycogen synthase D is the
phosphorylated form. It is opposite of glycogen synthase I whereby it is normally active, but
can be activated in the presence of G-6-P, as it is dependent on G-6-P.
Glycogen synthase D is converted to glycogen synthase I when it is dephosphorylated by
protein phosphatase. The conversion is reversed when glycogen synthase I is phosphorylated
by either phosphorylase kinase or PKA. Since glycogen synthase D is dependent on G-6-P,
an increased concentration of G-6-P will therefore induce glycogen synthesis. Furthermore,
an increase concentration of insulin will further activate protein phosphatase resulting in
activating of glycogen synthase (Houston, 1995,Elliott & Elliott, 2005).
The activity of this enzyme is inhibited when glycogen levels are high. However, when the
glycogen level is reduced as a result of exercise, the inhibitory effect of the enzyme declines
resulting in an increase in the activity of the I form of glycogen synthase (Bergstrom et al.,
1972,Taylor et al., 1972,Piehl, 1974). Piehl, 1974 also suggested from the study that
glycogen resynthesis was equally as a fast, if not faster in FT fibres, which were not as
glycogen depleted after exercise as ST fibres were. Further investigation is needed to confirm
the higher glycogen synthase activity in FT fibres as compared to ST fibres. As mentioned
briefly earlier, a relationship between glycogen content and the percentage of the activity of
20
the I form exists. This is an inverse relationship between glycogen content and synthase I
activity at a low glycogen level. Furthermore, there was no increase in synthetase I activity
when the glycogen levels were above the normal mean value at rest (Bergstrom et al., 1972).
Following exhaustive exercise, it has been shown that consuming between 525 to 648g of
carbohydrate during the first 24 hours after running will result in the increase of muscle
glycogen and return muscle glycogen values to its pre-exercise values (Costill et al., 1981).
Burke et al. 1995 suggested that the dietary guideline for optimal daily glycogen synthesis to
be between 8 to 10g of absolute carbohydrate intake per kg per day. However in more recent
literature, Burke and co-authors have suggested that carbohydrate intake for fuel needs for
athlete for moderate exercise should be 5 to 7g·kg-1
·day-1
(Burke, 2010).
In terms of percentage of total daily energy intake that should be derived from carbohydrate,
this is calculated to be around 65 to 70% of energy intake. The study by Burke et al. (1995)
found that there was no further increase in muscle glycogen levels when compared between a
control diet (7 g·kg-1
·day-1
of carbohydrate) and a matched energy diet (11.8 g·kg-1
·day-1
of
carbohydrate). Therefore this result supports the previous statement for optimal carbohydrate
intake exists between 8 to 10 g·kg-1
·day-1
. However, this is in disagreement with Acheson et
al. (1988) who suggested that the glycogen storage capacity in man is around 15 g·kg-1
·day-1
.
However, methodological differences may attribute to the disagreement between these
recommendations.
Summary
Muscle glycogen can be depleted following a previous bout of exhaustive exercise. The
exercise protocol completed plays a role in the proportion of type I or II fibres that are
depleted. Prolonged exercise at 65% O2max have been found to be effective in depleting
muscle glycogen. Initial muscle glycogen depletion occurred in type I fibres, followed by the
eventual recruitment and sequential glycogen depletion in type II fibres in order to maintain
the ability to develop tension. However, it was later discovered that exercise intensity is a
determinant of the muscle fibres that are recruited. High intensity exercise results in the
recruitment of type II fibres which are more glycolytic leading to glycogen depletion of those
fibres. Two enzymes in the breakdown and synthesis of glycogen are glycen phosphorylase
and glycogen synthetase. Glycogen phosphorylase is activated by AMP, and inhibited by
ATP and G-6-P. On the other hand, the active I form of glycogen synthetase is present in the

21
absence of G-6-P. An inverse relationship between glycogen content and the activity of the I
form exists, whereby the lower the glycogen concentration, the higher the activity of the I
form which will stimulate glycogen synthesis.
Squash background
Squash metabolism
Since squash is a high-intensity, intermittent sport which can last up to several hours (Sharp
et al., 1998), both (aerobic) endurance and anaerobic capacity are important to be able to
perform well at a competitive level (Girard et al., 2005).
Match analyses, though rare, have found that players covered a mean distance of only 12m
during rallies lasting between 16 to 21 seconds and have reported post-match blood lactate
concentration of 8 mmol·L-1
(Mercier et al., 1987).
Chin et al. (1995) has previously compared the intensity of squash through mean heart rates
between squash players from different parts of the world. The author found that the mean
heart rate of 168 beats per minute (bpm) or 89.8 % heart rate max (HRmax) of the participants
was similar to physically fit players and players from South Africa (Van Rensburg et al.,
1982) and Australia (Pyke et al., 1974). The maximum lactate value observed during the
treadmill and squash-specific test were 11.0 mmol·L-1
and 10.8 mmol·L-1
, respectively. This
shows that the maximal intensity from the squash-test closely replicates the intensity of
maximal steady state rhythmic exercise such as treadmill running (Candau et al., 1998).
The use of a portable gas analyser is currently the most effective solution for assessing
metabolic changes during game sports such as squash and has previously been used by Todd
et al. (1998) and Girard et al. (2007) to observe the metabolic demands of the game.
Nevertheless, there has been limited previous research on the physiological requirements or
changes that occur in a squash match. Available information indicates that HRmax in squash
competitions was similar to the age-related HRmax. A recent review of racket sports by Lees,
(2003) found that the mean heart rate often exceeded 75% of the HRmax. On-court oxygen
uptake has also been estimated from the heart rate recorded during matches from players of
similar standards to each other (Van Rensburg et al., 1982). However, this method of

22
estimating oxygen uptake is inaccurate because on-court heart rate can be influenced by
factors such as ambient temperature, humidity, stress of competition or use of the arms
(Girard et al., 2007). For these reasons, this method has also been known to overestimate
oxygen uptake during high-intensity intermittent exercise (Ballor & Volovsek, 1992).
Exercise protocols
Squash is characterized by movements incorporating frequent bursts of rapid acceleration and
deceleration over short distances in a range of directions; involving frequent turning, lunging
and side-stepping with regular short recovery periods (Wilkinson et al., 2009b).
It has been previously suggested that competitive squash consists of high-intensity,
intermittent activity lasting between 10 to 20 second with a work to rest ratio of 1:1. Previous
match-play analysis has observed a mean rally time of 13.6 seconds with 49% of rallies
lasting 10 seconds or less and 80% lasting less than 20 seconds (Montpetit, 1990).
Meanwhile other authors have suggested that the mean duration of a rally is between 5 and 20
seconds with rest periods of between 7 and 8 seconds (Sharp et al., 1998). This can be
confirmed from the results of Girard et al. (2007) who found that rally durations lasted less
than 21 seconds and greater than 21 seconds were 67% and 33%, respectively. This was also
in support of previous findings indicating that 80% of rallies lasted less than 20 seconds and
49% of rallies lasted for 10 seconds or less in professional and A-grade players (Montpetit,
1990).
It is, of course, very difficult to make measurements, particularly of physical performance,
during competition, so a simulated match model is necessary. One of the difficulties in
collating the small amount of scientific information regarding squash relates to the different
simulated model used in different studies. A standard exercise protocol has not been agreed
upon as the nature of the sport results in the difficulty in developing a protocol that can
account for reaction time, skill and/or match fitness.
The use of on-court sprints such as ‘court-ghosting’ is commonly used during training as it
involves multiple direction changes, reflecting the high frequency of change-of-direction that
occurs during a match (Sherman et al., 2004).
A variety of squash-specific exercise protocols have been used in the last couple of decades
for research purposes. These range from an incremental treadmill test, to an on-court ghosting

23
protocol to the more specific squash-simulation matches (Steininger & Wodick, 1987,Romer
et al., 2001,Girard et al., 2005,Bottoms et al., 2006,Girard et al., 2007).
One of the first on-court squash protocol was developed by Steininger & Wodick in 1987.
This procedure was devised to mimic the physiological demands and techniques of squash
movement. The authors arranged 3 lamps on each side wall of the squash court; front corners,
middle of the side-walls and back corners. These lamps were connected to a computer which
was located outside the court. Each lamp had a squash ball mounted under each lamp.
Different sequences of light flashes were selected according to the exercise intensity. Players
were required to react and run from a central point of the squash court (the ‘T’) toward each
of the balls as soon as the corresponding bulb was lit and to strike it in an appropriate
manner. This was performed in 3-minute periods of exercise. There were 12 light pulses per
minute initially with a total of 36 dashes at the first stage. The intensity was increased by 6
pulses (or dashes) per level until exhaustion was reached. The results from this study found
that the test of validity of the protocol was sufficient to estimate the level of fitness from
measurements during exercise of a protocol closely replicating squash.
However, the limitation of this protocol was that the intensity and duration are unlike that of
squash match-play. This is due to the incremental maximal test which does not occur during a
squash match. However, the outcome of an incremental squash-test as such may be useful to
players and coaches as a quantification of squash-specific endurance.
Examples of on-court ghosting being used as an exercise protocol have been previously
incorporated by Romer et al.(2001) and Girard et al. (2005). Romer and co-authors’ ghosting
routine consisted of 10 sets of 2 repetitions of ghosting. Each repetition required participants
to simulate positional shots at 6 positions during a game of squash; front left and right corner,
back left and right corner, right-forehand volley and a left-forehand volley. The end of each
set was met with 30 seconds of passive recovery.
The protocol used by Girard et al. 2005 consisted of two incremental protocols; a treadmill
test and a squash graded test. The treadmill test initiated at 10 km·h-1
followed by increases
of 1 km·h-1
every two minutes until voluntary exhaustion. The squash test consisted of two
bouts of nine shuttle runs (a stage). This was used as it simulated the repeated nature of multi-
directional displacement as seen in a game of squash. The nine displacements included two
forward, three lateral, and four backward courses, performed randomly. A 10-second rest

24
period was taken between each stage and a 30-second rest between the end of stage three and
the beginning of stage four (end of warm up period).
Another study from which an on-court squash protocol was used was completed by Bottoms
et al. (2006). The authors investigated the effects of carbohydrate ingestion on skill
maintenance during a squash-specific test. The exercise protocol consisted of on-court shuttle
running for 20 minutes, running between the front and back wall of the squash court along
with the tempo of a metronome. Following the shuttle run, subjects performed three, three-
minute intervals of maximal effort court-ghosting to all corners of the court with a one-
minute rest interval.
A recent investigation by Kingsley et al. (2006) developed and used two on-court squash
simulation protocols that closely replicated the physiological demands of elite junior squash.
The multistage squash test required players to complete simulated rallies that lasted for one
minute. During each subsequent stage, the time allowed to reach each court position was
reduced progressively. Stages were separated by seven seconds of recovery. The participants
completed the test until voluntary exhaustion. The second squash test; the squash simulation
protocol (SSP) consisted of four simulated rallies of varying length (between six to eleven
shots performed by the participant) and movement patterns. These factors were used to
replicate typical rallies as obtained from analysis of elite male squash. This simulation
protocol also had the same seven-second recovery period. The squash simulation protocol
lasted 12.2 minutes in which 24 rallies were simulated; resulting in a total of 186 simulated
shots.
The results from the protocol by Kingsley et al. (2006) found no differences between the
length of play, physiological responses or RPE during intense match-play and the SSP which
highlights the similarities and replicability of the SSP to a normal squash match. This
supports the reason why many other researches have used squash simulation as an exercise
protocol. These recent studies have shown that on-court squash specific tests have become
more popular in squash-related research and that the use of on-court ghosting is repeatedly
used as it closely simulates the multi-directional movement patterns as seen in squash.
A more recent paper by Girard et al. (2007) took squash-testing to a new level by requesting
subjects to play three squash games in order to simulate the physiological responses from an
actual match. Here, participants carried a portable gas analyser whilst playing 3 competitive
squash games against a player of similar standard. During each game O2, heart rate, RER,
25
breathing frequency and expired volume were measure in five-second averages. There was a
two-minute rest period in between each game. These games were performed according to the
normal ‘point-per-rally’ scoring method. Since this protocol could not be controlled and was
mainly descriptive, the focus of the protocol was on collecting physiological and metabolic
data using the portable gas analyser during the three-game match simulation.
Creating a squash-specific exercise protocol provides a unique challenge to exercise
physiologists as the test would have to simulate a squash match as accurately as possible in
order to examine squash performance. This difficulty arises as the game intensity and the
patterns of activity are difficult to quantify and replicate precisely. As a result, the protocol
employed in this thesis had to be developed in order to evaluate the effect of constantly
changing physiological demands along with the need to replicate the stochastic nature of
squash movements. The neuromuscular ability to rapidly accelerate and decelerate is a crucial
performance marker in squash but it is likely to go undetected by a test that uses predictable
movement sequences; such as a fixed pattern to simulate a rally. Hence a protocol was
developed with a randomly sequenced pattern of shots to simulate a rally in each set.
Squash and nutrition
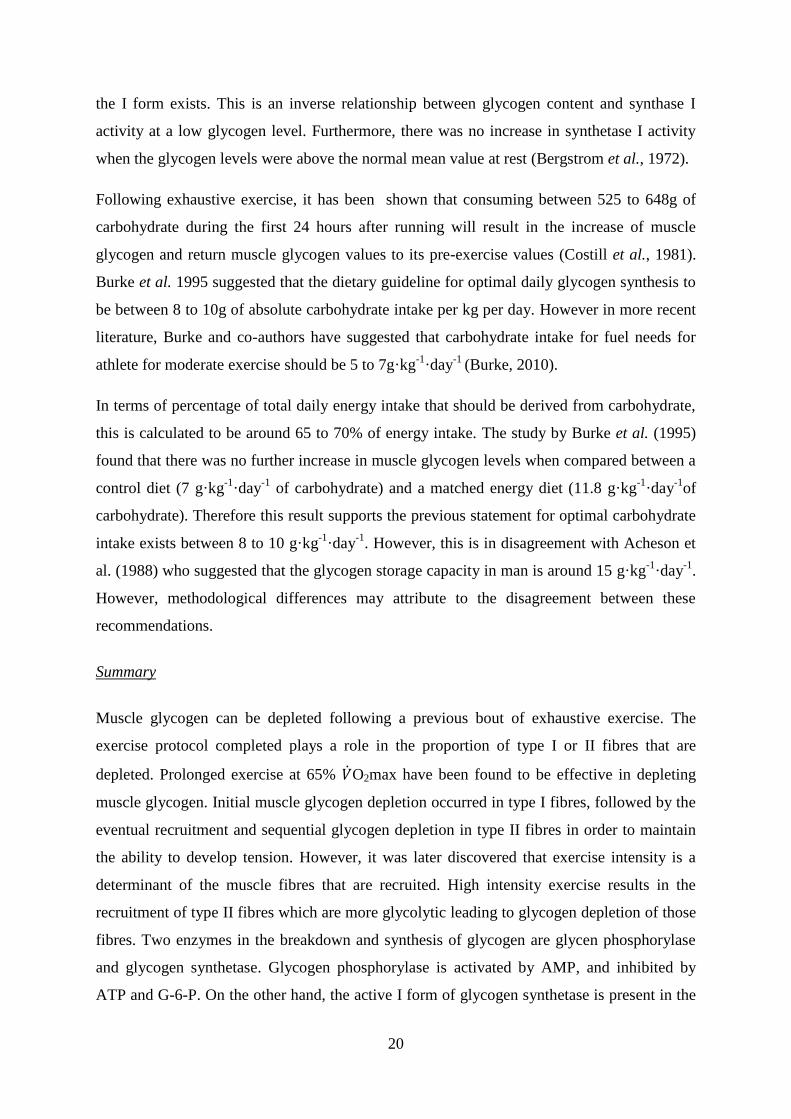
Only a handful of studies have looked at a nutritional component on its effect on squash
performance (Noakes et al., 1982,Graydon et al., 1998,Romer et al., 2001,Bottoms et al.,
2006), a summary can be seen in Table 2 below. A study conducted by Noakes et al. (1982)
investigated the metabolic response in squash following pre-exercise carbohydrate ingestion.
Subjects were given either 250ml of tap water or the same volume of water with 67g of
additional carbohydrates dissolved in the solvent. These drinks were consumed 25 minutes
before a 90-minute squash match. Blood samples were collected following the warm-up
period, at 15 minutes, 45 minutes and 90 minutes. The results found that the metabolic effect
of 67g of carbohydrate ingestion 25 minutes before exercise had little effect. As expected,
glucose, insulin and growth hormone levels were elevated for at most, the first 15 minutes of
the game. This result is likely to be explained by the rise in insulin levels leading to
hypoglycaemia. This is in line with previous work by Costill et al. (1977) who found a fall in
blood glucose levels following ingestion of 75g of carbohydrates 45 minutes before a
treadmill run.

26
One of the first studies looking at carbohydrate ingestion on the skill aspect of squash was
conducted in 1988 by Graydon and co-authors. Eight subjects were given a glucose polymer
at a dose of 8g per 100ml per kg of body weight diluted in a solution. The protocol of the trial
was to complete three simulated games of squash whilst consuming half of the solution
before the first game and a quarter after each of game 1 and 2. The accuracy test was
conducted with a feeder and required participants to move from the ‘T’ (centre of the court)
to hit a straight forehand drive into the back corner of the court. The scores given followed a
marking scheme in which higher points will be awarded if the ball landed close to the back
corner of the court. The results of the study found that there was a trial and time interaction
effect (p < 0.01) and also a significant main effect of the trial (p < 0.001). This indicated that
the participants were able to maintain accuracy of performance in the carbohydrate feeding
trial but not in the placebo trial.
Another nutritional study was conducted by Romer et al. (2001) who looked at the effects of
creatine supplementation on simulated positional play. Participants were required to perform
an on-court ghosting routine which was intended to simulate shots played during a match.
Participants were supplemented four times a day over five days. The ghosting routine has
been previously explained in the previous section summarising the various squash protocols
that have been previously used. The authors found that there was an improvement in the
mean sprint time in the experimental group of 3.2%. The results also showed that there was a
significant improvement in time between sets 2 and 10 following creatine supplementation
compared to the placebo condition. This is the only study investigating the effects of creatine
supplementation on squash which has found a beneficial effect on squash performance.
A more recent study by Bottoms et al. (2006) have repeated the original work from Graydon
et al. (1988), with the exception of using a valid skill test which has been assessed in
previous pilot work. The study used a double-blind cross-over design. Participants were
provided with two beverages (total volume of 1 litre) which were consumed over the duration
of the protocol. The carbohydrate-containing drink was made up to a 6.4% carbohydrate-
containing beverage with a suitable placebo drink. Participants completed several tests which
included a visual and auditory reaction test, maximal voluntary contraction fatigue test,
shuttle running, on-court ghosting and a squash skill test. The results from the study found
that skill declines following exercise in an absence of carbohydrate supplementation, while
some evidence of skill maintenance is present following carbohydrate ingestion.

27
It is clear that apart from investigating the effect of carbohydrate and fluid supplementation
during exercise, there is a dearth of good scientific research concerning the importance of diet
on squash performance. Given the reliance upon carbohydrate, and in particular muscle
glycogen as fuel for high intensity intermittent exercise, there is scope to investigate how
dietary carbohydrate content prior to a match may be manipulated to optimize performance.
Unfortunately, available literature on nutritional studies on squash is not as widely available
as tennis. A recent review (Hornery et al., 2007) has identified several tennis studies that
have included a carbohydrate intervention and performance measures on various tests
(ground stroke accuracy, the Sargent vertical jump test, sprint test etc.) looking into ways to
mitigate a performance decrement in tennis. Some of the studies mentioned have found a
performance benefit following the consumption of carbohydrates which increases the
plausibility of researching a carbohydrate intervention in squash. Though previous
carbohydrate-related studies used in squash have only investigated changes in skill and sprint
outcomes, a match simulation following a nutritional strategy in the days leading to an event
is yet to be investigated. Therefore the intended study in this thesis will be one of few, if not
the only ‘carbohydrate-loading’ study available in squash literature.
Summary
Although receiving some recent scientific attention, the science of squash is limited
compared to other sports such as cycling, soccer or tennis. Due to the difficulty in
investigating exercise performance in squash, earlier studies consisted of match analysis and
match observation only. However, advances in technology have allowed for more targeted
research to be conducted in order to assess the physiological and metabolic demands
experienced in simulated competition. This was particularly aided by the introduction of
portable gas analysis and timing devices which can be worn and store data. The use of more
specific exercise protocols has also led to higher quality research which increases face-
validity of the sport; from an incremental speed test to the more realistic squash match
simulations. Nevertheless, there is a gap in the literature concerning what is optimal
nutritional practice for squash competition, especially in relation to pre-competition diet.

28
Study Participants Protocol Intervention Measurements Outcome of the study
Noakes et
al. (1982)
6 experienced
squash players
Drinks consumed 25 min
before the start of a 90-min
match, on two separate
occasions.
250mls water vs
250mls solution
containing 67g of
CHO.
3 x 10ml venous blood
samples: before, 15 and 45
min into the match.
Result: mild hyperglycaemia, ↑ GH and blood lactate
concentrations which plateaued after 45 minutes.
Progressive ↑ free fatty acid concentrations.
Graydon
et al.
(1988)
8 club standard
male players
Drinks consumed 30 min
prior to simulated match
before game 1, and after
games 1 and 2.
8g/100ml/kg of CHO
vs placebo sugar-free
drink
Rating of perceived
exertion (RPE), heart rate
(HR) and accuracy test
were measured.
19% ↓ in performance accuracy in placebo.
No change in performance accuracy in CHO trial.
Non-significant ↑ in HR was seen as the number of
games ↑. CHO may have attenuated ↑ in RPE.
Romer et
al. (2001)
9 competitive
squash players
Subjects performed on-court
ghosting routine involving
10 sets of 2 repetitions of
simulated positional play.
Creatine vs control
group supplemented
four times daily for five
days with 0.075g/kg of
creatine monohydrate
and maltodextrin,
respectively.
HR, lactate and
performance sprint times
were measured.
The experimental (creatine) group improved mean set
sprint time by 3.2% (0.8) when compared to the control
group, whilst an improvement of 4.7% (0.3) was
evident for all 10 sprints in the creatine group in
comparison to control group
Bottoms et
al. (2006)
16 squash
players
A 2-hour fast completed
before attending test. 1L
beverage consumed over the
duration of the protocol.
2 beverages; orange-
flavoured CHO-
containing (6.4%)
beverage and placebo.
2 trials measuring pre- and
post-exercise performance.
Completed reaction time
(RT) test, wrist flexion
maximal voluntary
contractions, squash skills
test and on-court ghosting.
CHO ingestion no main effect on total skill scores. ↓
9% ↓ total score pre- to post-exercise in placebo, and
1% ↑ following CHO. Improved in RT in CHO trial. A
significant difference in blood glucose was also seen
between trials, but blood lactate response during trials
was not significant.
Table 2. Studies that have included nutritional interventions in relation to squash performance.

29
Summary and Rationale
Carbohydrate supplementation and its effect on endurance performance has been a well-
researched topic. Recent studies have started to further investigate the influence of
carbohydrate supplementation in high-intensity intermittent exercise (Bangsbo et al.,
1992,Bussau et al., 2002,Fairchild et al., 2002). This has taken step forward as a couple of
studies have now looked at carbohydrate supplementation on a specific sport such as seen in
a soccer simulation test (Bangsbo et al., 1992,Ali & Williams, 2009).
Literature on squash is limited and is not as widely available as other mainstream sports such
as soccer and tennis. Previous research has looked at physiological profiles of squash players
from different countries and age groups (Van Rensburg et al., 1982,Chin et al.,
1995,Kingsley et al., 2006). The metabolic and physiological responses in squash is also
another area which has had similar attention to the physiological profiles of squash players
(Blanksby et al., 1973,Garden et al., 1986,Mercier et al., 1987,Montpetit, 1990,Sharp et al.,
1998). In recent years, research output on squash has increased and more studies simulating
squash match-play (Steininger & Wodick, 1987,Romer et al., 2001,Girard et al.,
2005,Kingsley et al., 2006,Girard et al., 2007) have emerged which have led to the validation
of these tests (Wilkinson et al., 2009a,Wilkinson et al., 2009b,Wilkinson et al., 2009c).
Though there have been a couple of studies which have looked at the metabolic and
physiological responses during a squash match simulation with the use of a portable gas-
analyser (Todd et al., 1998,Girard et al., 2007), a nutritional strategy has not been
investigated using this method. Previous studies testing ergogenic aids such as creatine and
carbohydrate supplementation on skill and accuracy have been looked at, but the influence of
carbohydrate feedings on a prolonged squash-match simulation have not been tested.
Nevertheless, this presents a challenge for researchers such as myself to take and to
investigate a ‘field-test’ which is never as straight-forward and cannot be as strictly
controlled as a treadmill run simulating a marathon or a 40-km bicycle ride on a cycle
ergometer.

30
The aim for the following Masters research project is to look at the effects of carbohydrate
feeding following a bout of exercise-induced glycogen depletion during a 48-hour recovery
period. The rationale of the study follows:
1. Develop a match simulation based on match data analysis that can closely replicate a
real-life squash match to last for a prolonged period of time.
2. Test the efficacy and influence of a carbohydrate feeding strategy on squash
performance.
3. To add to the current library of scientific research papers available on squash as a
sport.
4. Have a better understanding of the metabolic and physiological responses that occur
during a squash match since previous studies have only tested for short periods.
Hypotheses
1. The nutritional intervention will successfully show a difference in RER from an
additional carbohydrate intake of 9 g·kg-1
body weight.
2. The results of the study will show a similar pattern in fuel utilisation following
prolonged exercise, changing from high carbohydrate oxidation to an increase in fat
oxidation.
3. A difference in performance time is expected to be seen, as previous research on
carbohydrate feedings show a general improvement in performance.

31
Methods
Experimental Overview
Nine healthy and recreationally active male squash players at a Squash New Zealand grade of
C1 or above (played at least three times a week and had been competing for at least five
years) were recruited and completed a simulated squash match which lasted for ~60 minutes
following 48 hours of a dietary intervention. Data from eight subjects is displayed as the
ninth subject was not able to complete the second trial. The simulated squash match consisted
of five sets lasting for ~12 minutes each. Participants were instructed to complete each set as
quickly as possible and to treat each set as they would in a competitive match. The protocol
developed was aimed to simulate the physiological responses during a squash match. Each
subject completed a single-blind, cross-over design of two experimental trials that took place
at the same time of day and were separated by at least 8 days. Performance and/or trial bias
was avoided by use of a counter-balanced study design and by enforcing the same level of
encouragement to subjects in order to perform with maximal effort.
Subjects
Nine healthy and recreationally active males agreed to participate in this study. The subjects’
characteristics were (mean ± SD): age 24 ± 8 years, height 1.8 ± 0.1 m, weight 76.9 ± 6.8 kg.
Each subject was fully informed of the experimental procedures and possible risks before
giving informed, written, consent. The protocol was approved by the Institutional Human
Ethics committee and performed according to the Declaration of Helsinki.
Preliminary Session
At least a week before the first experiment trial, subjects reported to the squash courts for a
familiarisation session to the protocol of the experimental trial. The familiarisation session
required subjects to complete a short run through of the simulated squash match. They ran
through five lighted timing gates in a random order at different intensities to firstly, get used
to the idea of the protocol and secondly, to familiarise themselves to the intensity of the
protocol when exercising maximally. Subjects completed several rounds of the simulation
until they were comfortable with how the protocol worked along with the lighting and audio
cues that was incorporated with the timing gates. Subjects also completed the familiarisation
32
session with the portable gas system attached; which allowed subjects to get used to the extra
weight and also to the feeling of running with the mask attached from the portable gas
analyser.
Experimental Protocol
Glycogen depletion and dietary manipulation
Before each experimental trial, subjects completed a bout of strenuous exercise in order to
reduce muscle glycogen. The glycogen depletion bout consisted of running the ‘Yo-Yo
Intermittent Recovery Level 1’ (IR1) test to exhaustion to focus on depleting type II muscle
fibres followed by a 30-minute treadmill run at 85% of heart rate max (HRmax; as calculated
from the Yo-Yo IR1 test) to focus on depleting type I muscle fibres. Subjects also ran with a
2% incline on the treadmill. Upon completion of the depletion bout, subjects were assigned to
either a high-carbohydrate (H-CHO; 11.1g·kg-1
) or low-carbohydrate (L-CHO; 2.1g·kg-1
)
treatment. Subjects were provided with a standardised low-carbohydrate (1.3g·kg-1
) diet to
follow over 48h. The energy intake for the standardised diet provided was identical for all
subjects. More importantly, the high- or low-carbohydrate treatment was mixed in a 2.1L
solution that was isocaloric within subjects. The high-carbohydrate drink was made up of
maltodextrin with a dextrose equivalent of 10 units. The low-carbohydrate drink consisted of
200g milk powder (Pams whole milk powder, New Zealand) and 120g of protein powder
(DNA Nutrition, New Zealand) in order to create a standard base of energy content, flavour
and palatability. The difference in energy content between the high- and low-carbohydrate
drink was calculated and then balanced with olive oil (Pams olive oil, New Zealand) for the
low-carbohydrate drink. Since individual variability in dietary proportions exists, subjects
were allowed to eat additional foods which only contained protein and/or fat in order to
minimise dietary carbohydrate intake. This was repeated for the subsequent trial.

33
Figure 5. Overview of experimental procedures.
Simulated squash match
The protocol for the squash match was created to simulate a five-set match to last ~60
minutes. Five timing gates (Fusion Smartspeed, Australia) were used to simulate a home base
(the ‘T’) and four shots at each corner of the court. Each set was designed to last for ~12
minutes each. The match was simulated by subjects starting from the centre of the squash
court, also known as the ‘T’. The first of five timing gates was located at the ‘T’ and served
as the home (start and finish) gate to one of four other timing gates located in each corner of
the squash court. Each ‘rally’ required subjects to run from the ‘T’ to and from the four gates

34
in a random pattern as fast as they could. This order of movement in the set had been
randomly generated during the development of the protocol. Subjects used a squash racket to
break the laser on the timing gate; in order to simulate a shot. Subjects completed a total of
30 rallies per set. The general outline of the set-up can be seen in the diagram below.
Figure 6. On-court schematic and position of Fusion timing gates.

35
It may be worth pointing out that the squash protocol used in this study was developed from
new based on previous squash research in order to produce a modern protocol that can
accurately measure performance and reaction time. This meant that protocol had to be created
by creating a run sheet with the proportion of shots played in the front and back court
considered along with the random distribution to the four gates (See Appendices). This was
done so that the software engineers of the timing gates can then create a software code for the
gate system to work in order to generate a simulated squash protocol. Since all subjects
completed the same protocol, this meant that the total distance covered during the squash
simulation protocol is identical.
The distribution of shots played in the protocol was derived from real match analysis where
74% of the match was found to be played from back corner movements and 26% from front
corner movements. This allowed the match simulation to be as realistic as possible since top-
level players tend to rally more at the back of court. Four gates were used as shot positions
based from a previously validated squash-specific test (Wilkinson et al., 2009a).
Several studies that have used squash simulation as an exercise protocol. Steininger &
Wodick, (1987) conducted a simple but effective squash simulation protocol using audio and
visual cues to simulate players running toward a ‘shot’ and striking the balloon with the
corresponding bulb that was lit.
Kingsley et al. (2006) have recently found that there were no differences between the length
of game play, physiological responses (heart rate and blood lactate concentrations) or
perceived exertion recorded during intense match-play and a squash simulation protocol.
Consistent patterns of players’ movement during squash match-play has encouraged players
to incorporate ‘court-ghosting’ as part of their training in order to improve in their squash-
specific movements without hitting a ball. Since these movements are similar to that seen
during match-play, simulating this movement over a period of ~60 minutes was used in order
to create a controlled and consistent squash simulation protocol.
Furthermore, this type of protocol is more suitable as the incremental squash-specific test
(Wilkinson et al., 2009a) does not adequately simulate squash match-play as it is preferred as
a protocol to quantify squash-specific endurance (Kingsley et al., 2006). The rest period was
chosen to be 10 seconds long as various studies (Girard et al., 2005,Kingsley et al.,
2006,Wilkinson et al., 2009a) have incorporated a rest period of between 7 to 16 seconds.
Previous studies by Girard et al. (2007) and Montpetit, (1990) have reported that the mean

36
duration of a squash rally lasted between 16 and 21 seconds. Since the protocol of the current
study looked at a prolonged (~60 minutes) period of squash simulation, the five-set protocol
had to be designed to last around 12 minutes each. Therefore each ‘rally’ of four shots,
should last around 15 seconds each with 10 seconds of rest in between each rally.
Experimental Procedures
Subjects were requested to refrain from exercise, caffeine and alcohol for at least 24 hours
before the glycogen depletion bout. Subjects were also asked to keep a food diary from the
day before the depletion bout until the simulated squash match (four days in total). After 48
hours of the dietary intervention subjects arrived at the squash courts to complete the
simulated squash match.
The portable gas analyser (Cortex Metamax 3B, Germany) was turned on and calibrated at
least 30 minutes before the arrival of subjects by calibrating for digital barometric pressure
reader (Cortex, Germany), volume (Hans Rudolph 3L, USA), oxygen and carbon dioxide
concentrations. Upon the arrival of subjects at the squash courts following the 48h recovery
diet, subjects changed into the appropriate sporting attire following a nude body weight
measurement. Subjects were then seated for five minutes before resting blood lactate (Lactate
Pro, Arkray Inc, Kyoto, Japan) and glucose (Accu-Chek Advantage, USA) were collected via
finger prick blood sampling method (Accu-Chek Safe-T-Pro Plus, Germany). Once collected,
the portable gas analyser was attached to the subject and subjects then completed a five
minute warm-up.
Upon commencement of the trial, continuous breath-by-breath recording with the portable
gas analyser was active until completion of the trial. Time-point markers were entered to
identify the beginning and ending of each set. At the end of each set, a rating of perceived
exertion (RPE) was immediately recorded after subjects exited the court, followed by the
collection of blood lactate and glucose. RPE was measured on the 15-grade Borg rating of
perceived exertion scale; from 6 to 20 (Borg, 1970). Subjects were also given a standardised
volume (2ml·kg-1
) of water to drink between sets to maintain hydration status. At the end of
the trial, final blood glucose and lactate samples were collected. Subjects then toweled off
and measured their final nude body weight.

37
Measurements
The subjects’ height and weight were measured using a stadiometer (Seca, Bonn, Germany;
accurate to 0.1cm and scale (Jadever, Taiwan; accurate to 0.01kg). Heart rate was monitored
using a Polar heart rate monitor (Polar T11, Polar Electro, Finland) which was wirelessly
transmitted and recorded into the software included with the gas analyser (Metamax, Cortex,
Germany). Expired gases were continuously collected for the duration of each experimental
trial via the portable gas analyser. The expired gases were analysed for CO2 and O2
concentrations and volume, and values converted to STPD. Rates of O2 uptake ( O2), CO2
elimination ( CO2) and the respiratory exchange ratio (RER) were calculated.
Carbohydrate and fat oxidation was calculated using the algorithm developed by Frayn which
ignores the concentration of nitrogen and the utilisation of protein (Frayn, 1983).
A summary of the protocol can be seen in Figure 7 below.
Figure 7. Time-line of events during each squash trial.

38
Statistical analysis
Dependent variables (RER, O2, CO2, RPE, carbohydrate and fat oxidation, heart rate,
glucose, lactate and performance time) were analysed using a two-way (trial x time) repeated
measures analysis of variance (ANOVA). Where a significant time effect was present, post-
hoc analysis to determine specific differences was used using the Bonferroni correction.
A one-way ANOVA was completed for RER, carbohydrate oxidation and fat oxidation as
they were found to have a significant trial effect. All data were assessed for sphericity and the
Huynh-Feldt correction was used if necessary. All data were analysed using SPSS statistical
software (V. 18, Chicago, IL, USA) with a priori statistical significance set at p < 0.05. All
data are reported as mean ± standard error of mean (SEM).

39
Results
Figure 8 shows the respiratory exchange ratio (RER) over a period of five sets. There was a
significant effect of time (p < 0.001), and trial (p < 0.05) such that RER decreased in both
trials from 0.86 ± 0.02 to 0.76 ± 0.02 and 0.8 ± 0.01 to 0.75 ± 0.01 in the H-CHO and L-CHO
trial, respectively. However there was no significant time by trial interaction seen (p > 0.05).
Figure 8. RER (mean ± SEM) during each trial. * denotes significantly different at the
particular time point (p < 0.05), + denotes significantly different than set 1 (p < 0.01), ∆
denotes significantly different than set 2 (p < 0.05).
Figure 9 shows the rate of carbohydrate oxidation over a period of five sets. There was a
significant effect of trial (p < 0.05), and time (p < 0.01) such that oxidation rates decreased
from 1.38 ± 0.21 to 0.40 ± 0.16 g·min-1
(L-CHO) and 2.32 ± 0.45 to 0.64 ± 0.39 g·min-1
(H-
CHO). However there was no significant time by trial interaction seen (p > 0.05).

40
Figure 9. Rate of carbohydrate oxidation (mean ± SEM) during each trial. There was a
significant main effect between trials (p < 0.05). * denotes significantly different at the
particular time point (p < 0.05), + denotes significantly different than set 1 (p < 0.05),
∆ denotes significantly different than set 2 (p < 0.05).
Figure 10 shows the rate of fat oxidation over a period of five sets. There was a significant
effect of trial (p < 0.05) such that the rate of fat oxidation started at 1.05 ± 0.19 g·min-1
and
increased to 1.68 ± 0.23 g·min-1
in the H-CHO trial, unlike the L-CHO trial which had a
small increase in fat oxidation starting from 1.44 ± 0.15 g·min-1
to 1.61± 0.13 g·min-1
. There
was neither a significant time effect nor a significant time x trial interaction seen (p > 0.05).

41
Figure 10. Rate of fat oxidation (mean ± SEM) during each trial. * denotes significantly
different at the particular time point (p < 0.05).
Figure 11 shows the rate of oxygen uptake over a period of five sets. There was a significant
effect of time (p < 0.05) such that oxygen uptake increased (H-CHO) and decreased (L-CHO)
after the first 3 sets. However, there was neither a significant trial effect (p > 0.05) nor a time
by trial interaction effect (p > 0.05). No significant differences in post-hoc between time
points were found.
Figure 11. O2 (mean ± SEM) during each trial.

42
Figure 12 shows the rate of Carbon Dioxide production over a period of five sets. There was
a significant effect of time (p < 0.001) such that set 4 (p < 0.05) and set 5 (p < 0.01) were
lower than set 1, and set 4 was similarly lower than set 2 (p < 0.05). This is displayed by the
similar descending trend in both trials as time progressed. There was neither a significant trial
effect (p > 0.05) nor a time by trial interaction effect (p > 0.05).
Figure 12. CO2 (mean ± SEM) during each trial. + denotes significantly different than set 1
(p < 0.05), ∆ denotes significantly different than set 2 (p < 0.05).

43
Figure 13 shows the changes in heart rate over a period of five sets. There were neither a
significant effect of time (p > 0.05) nor trial (p > 0.05), and no significant effect of a time by
trial interaction (p > 0.05).
Figure 13. Heart rate (mean ± SEM) during each trial.
Figure 14 shows the changes in the concentration of glucose over a period of five sets.
Following the end of the first set, there was a similar increase in glucose concentration
following the rest period (5 mmol·L-1
± 0.21 L-CHO; 5 mmol·L-1
± 0.33 H-CHO) in both
trials (7.3 mmol·L-1
± 0.54 L-CHO; 7.6 mmol·L-1
± 0.71 H-CHO). There was a significant
effect of time (p < 0.01). However, there were no significant differences in the post-hoc
analysis. There was neither a significant effect of trial (p > 0.05) nor a time by trial
interaction (p > 0.05).

44
Figure 14. Glucose concentration (mean ± SEM) during each trial.
Figure 15 shows the changes in lactate concentration over a period of five sets. There was a
significant effect of time (p < 0.001) such that lactate increased at rest from 1.9 ± 0.49 to 5.5
± 0.92 mmol·L-1
and 2.0 ± 0.50 to 6.1 ± 0.63 mmol·L-1
at the end of the first set in L-CHO
and H-CHO trial, respectively. Both trials followed a similar trend from rest where there was
an initial increase in lactate concentration from rest. Lactate values then continued to drop
until the 3rd
set which was when a different pattern was seen. There was neither a significant
effect of trial (p > 0.05) nor a time by trial interaction (p > 0.05).
Figure 15. Lactate concentration (mean ± SEM) during each trial. + denotes significantly
different than rest (p < 0.05).

45
Figure 16 shows the changes of performance time over a period of five sets. There was no
significant effect of time (p > 0.05), trial (p > 0.05) or a time by trial interaction (p > 0.05).
Figure 16. Performance time (mean ± SEM) during each trial.
Figure 17 shows the changes in RPE over a period of five sets. There was a significant effect
of time (p < 0.01) such that RPE started and ended at the same point in both trials; 17 to 20.
Figure 17. RPE (mean ± SEM) during each trial. + denotes significantly different than set 5
(p < 0.05).

46
Discussion
Interpretation of results
This study was undertaken primarily to test the hypotheses that ingestion of a high
carbohydrate diet in the days leading to simulated squash performance will: 1) reveal an
increase in carbohydrate utilization during exercise; 2) that the simulated squash
performance, like other high intensity game sports, will show an increase in fat oxidation as
the game progresses; and 3) that this will be associated with improved simulated
performance.
In confirmation of the primary hypothesis, RER measurements indicate a significantly greater
rate of carbohydrate utlilisation during the high carbohydrate trial. The data clearly show a
difference in RER indicating that the preferred fuel utilised during the duration of the match-
simulation was different between trials. This also confirms the success of the intervention.
However, despite the success of the intervention, a significant improvement in performance
time was not detected, though a strong trend towards improved performance in the
carbohydrate trial can be seen in Figure 16.
Since both heart rate and RPE were not significantly different between trials, this indicated
that subjects were exercising at the same intensity as required at all points in time. Heart rate
results (average of 167 and 169 bpm in the low- and high-carbohydrate trial, respectively) are
also comparable to previous work which expected heart rate to reach a minimum of 150 beats
per minute during a squash match (Montpetit, 1990). RPE followed a similar pattern such that
the same values were seen in the first and last set, and were different from each other.
Metabolic
The average RER values of the low-carbohydrate and high-carbohydrate trials were 0.76 and
0.80, respectively. The difference in fuel utilisation is most likely explained by the increased
amount of muscle glycogen that was stored in the high carbohydrate condition (Bergström et
al., 1967). However, as muscle glycogen was not measured this cannot be confirmed.
Nevertheless, a bout of exhaustive exercise before a period of a high-carbohydrate diet
increases the activity of glycogen synthase and allows for a greater rate of glycogen synthesis
and storage when glucose becomes available to the muscle (Bergström et al., 1967). Since the
consequence of carbohydrate loading is now a well-established physiological effect, it was

47
assumed that the capacity of muscle glycogen storage from a dose of 9 g·kg-1
of additional
carbohydrate intake would synthesise muscle glycogen to an equivalent magnitude to other
studies (Hawley et al., 1997,Bussau et al., 2002).
Previous literature has shown that exercise intensity is related to the fuel utilised (Brooks &
Mercier, 1994), though cause and effect is hard to establish. That is, it is difficult to
determine whether the increase in intensity mediated the increased RER, or that the increased
RER due to fuel availability allowed a greater intensity. In the current study, the higher RER
in the high-carbohydrate trial may indicate higher exercise intensity compared to the low-
carbohydrate trial, though increased performance (and thus intensity) did not quite reach
significance. That intensity was not significantly different only permits the explanation that
increased glycogen concentrations in the high carbohydrate condition encouraged greater
glycogen utilisation.
In terms of the secondary hypothesis (i.e. that carbohydrate utilization would decrease as the
trial increased in duration), the expected outcome was observed. Taken together (main
effect), the difference in RER through time indicated a reduction in carbohydrate utilization
towards the end of the simulated performance trials. This was also reflected in the significant
(main effect of time) decrease in carbohydrate oxidation. The rate of carbohydrate oxidation
was close to 1g/min higher following the first set in the high-carbohydrate trial than the low-
carbohydrate trial. The rate of fat oxidation mirrors this trend but the main effect of time on
calculated rate of fat oxidation did not reach significance.
It is interesting to note that the rate of fat oxidation is greater in the high-carbohydrate than
the low-carbohydrate trial in the final set. This observation is difficult to explain with the data
available. Reduced efficiency in fuel utilisation may be another explanation to the difference
in fat oxidation.
The application of this study is to provide knowledge regarding dietary carbohydrate over
two days prior to competition and its effect on squash performance. Unfortunately an effect
for time, trial and an interaction was not seen for performance time. Hence we cannot
definitively state that a high carbohydrate diet is beneficial to squash performance. However,
a p-value of 0.076 for the time by trial interaction points towards an ergogenic effect of the
high carbohydrate diet. This is likely the result of a type 2 error as what seems to be a large
difference in performance time between trials was not significant (Figure 16). Therefore if an
extra one or two subject were completed, this would potentially reveal a significant effect.
48
During the high carbohydrate trial, the rate of oxygen uptake is maintained at a higher level
compared with the low carbohydrate trial. This may be reflective of the improved
performance time for the fourth and fifth set. Additionally, the performance times were seen
to be quicker during the high carbohydrate trial from the second set onwards. However, this
observation cannot be confirmed since there were no significant effects of time, trial or an
interaction despite a time by trial interaction which was approaching significance. A likely
explanation to the improved times in the high-carbohydrate trial may be attributed to greater
power or speed being produced as a greater proportion of carbohydrates were available to the
contracting muscle.
Physiological
The lactate concentrations for both trials at rest averaged at 2.0 mmol·L-1
. The average lactate
concentration of all squash sets were 4.3 and 5.4 mmol·L-1
in the low- and high-carbohydrate
trials, respectively. Interestingly, individual values here are comparable (9.1 mmol·L-1
) to
that of Mercier et al. (1987) who reported lactate values as high as 8 mmol·L-1
for highly
skilled players against an opponent of equal ability. The mean increase in blood lactate in the
present study is also comparable to that of Noakes et al. (1982) who found a mean lactate
increase of 2.5 mmol·L-1
. Mean lactate increase of the present study were 2.4 and 3.3
mmol·L-1
in the low- and high-carbohydrate trials, respectively. The lower increase in lactate
in the low-carbohydrate trial is likely to be due to the reduced exercise intensity and the fact
that glycogen is not as readily available as a substrate for glycolysis. The higher lactate
concentration thus indicates a higher contribution of energy from glycogenolysis since
plasma glucose concentrations were not different between conditions.
Subjective rating
RPE in both trials were of the same value following the end of the first and last set. This
supports the level of effort participants are committing to each trial. However, it was
interesting to note that RPE was not lower in the high-carbohydrate trial. This is inconsistent
with previous literature (Davis et al., 1997) where, when carbohydrate was made available
during the trial in the form of a beverage ,increased carbohydrate intake was associated with a
lower RPE. However, when any well-trained persons undertake self-paced exercise
performance it is expected that, regardless of conditions, they will choose an intensity which
relates to their highest sustainable pace, and this is likely to be related to perceived exertion
(Ulmer, 1996).
49
Design of match simulation
There are a number of reasons to why a good scientific description of racket sports such as
squash is not as widely available as tennis or other high-intensity intermittent sports such as
football. These include the level of professionalism of the game – more money means a
greater scientific effort in investigating what can produce optimal performance. Another issue
is the practicality of research in a small environment and a general lack of research interest in
the sport. However, scientific research on squash is progressing with several relevant studies
being undertaken in more recent times (Montpetit, 1990,Chin et al., 1995,Sharp et al.,
1998,Todd et al., 1998,Romer et al., 2001,Girard et al., 2005,Bottoms et al., 2006,Kingsley
et al., 2006,Girard et al., 2007,Wilkinson et al., 2009a,Wilkinson et al., 2009b,Wilkinson et
al., 2009c).
The design of the current study had been adapted from several studies to accommodate and
develop a modern face-valid squash simulation to mimic a practical five-game match lasting
approximately an hour. Thus, each set had to be designed to last around 12 minutes. In the
case of individuals completing the set between 11 and 12 minutes, this would have been
counteracted from fatigue as performance time was generally slower as the duration of
exercise progressed. Several studies have shown that a large proportion of squash rallies last
for a period of less than 20 seconds (Montpetit, 1990,Sharp et al., 1998,Girard et al., 2007).
The rest periods that have been incorporated for these squash trials were between 7 to 10
seconds (Sharp et al., 1998,Girard et al., 2005,Kingsley et al., 2006). With the latter of these
parameters in mind, the exercise protocol was developed to include 4 shots per rally. Each
rally lasted around 15 seconds, with a 10 second rest period. There were a total of 30 rallies
that were completed in each set. The duration of each set was calculated to last for 12.5
minutes using the above example. This duration is likely to change as exercise progresses as
participants will either improve or decline in performance time. In addition to the design of
the protocol, the logistics of how the match-simulation was completed was also important to
make the simulation as realistic as possible to a real encounter. Previous match data analysis
have found that shot distribution in a match were 74% in the back corners and 26% in the
front corners. This distribution of shots adds support to the design of the study and adds to its
validity as top level players tend to rally more at the back of the court (Wilkinson et al.,
2009a).

50
The current protocol was similar to that of Kingsley et al. (2006) who designed a squash
simulation protocol that lasted for 12.2 minutes and consisted of 24 rallies which included
between 6 to 11 shots in each rally. This resulted in a total of 186 simulated shots. On the
other hand, the current study completed 120 simulated shots from 30 rallies. More
importantly, it should be kept in mind that the purpose of this simulation was to simulate
prolonged exercise (at least 60 minutes) and that the design of the simulation had to be
reliable to allow for a treatment effect to be resolved. This goal was achieved as most
subjects were able to complete both trials with maximal effort, which really simulates the
intensity of a real squash match (one subject was not able to complete both trials due to an
unrelated injury). Furthermore, feedback from the participants indicated that the design of the
protocol was successful in replicating a squash match and that it was as hard, if not harder
than a squash match, especially during the last two sets.
Design of study
A 48-hour feeding period before an exercise event has previously been shown to be long
enough to refill glycogen following exercise-induced glycogen depletion (Piehl, 1974). An
additional carbohydrate intake of 9g·kg-1
of body weight was supplemented to a standardised
diet provided to participants. The diet was provided in order to control the macronutrient
composition of participants’ diet as well as maintaining a controlled and consistent energy
intake across all participants. As mentioned in the Methods section, participants were allowed
to add additional foods to their diet since variation in dietary proportions of subjects cannot
be excluded. In this case, subjects were encouraged to eat only protein and/or fat rich foods in
order to minimise carbohydrate intake. Only two subjects found that the provided diet was
not sufficient to maintain daily satiety. The additional foods consumed by participants were
reported to be in the form of grilled chicken breast and/or canned tuna.
The exercise-induced glycogen depletion bout consisted of two types of running exercise;
Yo-Yo intermittent recovery test and a treadmill run. These two exercises were necessary as
the proven glycogen depletion bouts of endurance running or cycling described in the
literature would not have been able to be completed by squash players. Upon completion of
the depletion bout, subjects were immediately advised to start consuming their ‘recovery’
drinks which were made up of either low- or high-carbohydrate drinks. Though it would have
been ideal to have three interventions in this study; low, “normal” and a high carbohydrate
diet, the normal carbohydrate diet was not included in this study as it would have been
51
extremely difficult to gain particpants’ full commitment since each trial required commitment
for a period of four days in order to control for diet, exercise and the completion of each trial.
The logistics of running three interventions for a relatively new area of research in a sport
such as squash may have also been unnecessary at the present time since it was still to be
established if a diet high in carbohydrates would be beneficial in improving squash
performance. The main purpose of this study was to identify whether or not a high-
carbohydrate diet would improve squash performance. Therefore the low-carbohydrate diet
was the most appropriate diet to determine the performance effect of additional carbohydrates
on squash performance.
Practical Applications
The use of carbohydrate supplementation in squash has had very little attention. Previous
work by Noakes and co-authors, (1982) found that pre-ingestion of carbohydrates 25 minutes
before a squash match may impair the normal metabolic response to squash and may
adversely affect performance. This is due to the lowered glucose and free fatty acid
concentrations. A hypoglycemic effect has also been concluded in another related study
looking at pre-exercise carbohydrate ingestion (Costill et al., 1977).
On the other hand, skill maintenance has been found to be better when a 6.4% carbohydrate
beverage was consumed during the duration of exercise (Bottoms et al., 2006). In comparison
to a placebo beverage, carbohydrate ingestion was found to significantly improve shot
accuracy and visual reaction time. Auditory reaction time was also improved, but this was
evident in both the placebo and carbohydrate trial. The use of this ergogenic aid to maintain
the skill aspect of squash is practical as many carbohydrate-electrolyte containing drinks are
readily available and vary between 6-8% in carbohydrates. This makes the practice of this
method likely, and anecdotally, is actually widely practiced in squash tournaments.
However, carbohydrate feeding during a game and dietary carbohydrate content in the days
prior to a game are two different occasions in which the timing of carbohydrate intake will
produce various results between the events.
The results from the present study certainly suggest that the practice of maximizing
carbohydrate intake in the days prior to competition should be considered. Certainly
ingesting additional carbohydrates on top of a normal diet would not cause any harm nor

52
would it be detrimental to performance and if two matches were schedule for the same day
the likelihood of a better performance with two days of prior carbohydrate supplementation is
high.
Limitations
The obvious limitation of the present study was the absence of muscle glycogen from
participants to provide a mechanistic explanation for the observations. However, since the
topic of carbohydrate loading is well researched, and a clear difference in RER was seen, we
are confident in our explanations (above).
An expected result from the failure to measure muscle glycogen is the lack of ability to
measure the difference in glycogen concentrations pre- and post-exercise. A previous study
by Rauch et al. (2003) suggested a theory in which the presence of a pacing strategy may
influence the performance outcome between a carbohydrate-loaded and a non-loaded
individual. This can be explained from the authors’ finding from which the non-loaded
subjects resulted at the same endpoint of muscle glycogen concentration regardless of initial
muscle glycogen concentration. This suggested that the non-carbohydrate loaded subjects
paced themselves at a lower workload throughout the trial in order to reach a similar
endpoint. The explanation to this theory was the possibility of a chemoreceptor in the muscle
which “is used by the central nervous system to calculate optimum pacing strategy”. This
suggestion was introduced as subjects decreased their power output during a 2-hour
submaximal ride when they had an abundance of glycogen reserves. The lowest value was
seen between the 30 and 32 minute mark, but reached peak values during the final 1-2
minutes of a 1-hour time trial which followed from the 2-hour submaximal ride. Therefore,
this certainly suggests that power output was constrained for the first 58 minutes of the time
trial, with the use of a ‘pacing strategy’ instead of a limitation of muscle glycogen.
In relation to the current study, this should have been ameliorated as subjects were instructed
to exercise maximally in both trials in order to maintain the consistency of the high-intensity
nature of the sport allowing the expected metabolic perturbation to take place when playing a
competitive match. Nevertheless, a pacing strategy cannot be disregarded as subjects knew
the endpoint of the trial, as opposed to a real match where it can only be decided on the day.
Therefore the suggestion of a pacing strategy may be possible and if present, is only natural.
The instruction of exercising maximally and treating the match simulation as a competitive

53
match to simulate the high-intensity nature of the match at all times highlights the thought of
minimising any external factors which may influence the result of the study.
Though data for nine subjects were collected initially, the incomplete trial from one of the
subjects resulted in the use of data from only eight subjects. This resulted in the outcome of
the study to be slightly underpowered. This was evident in the performance time where a time
by trial interaction was approaching significance. Part of the problem with the pool of these
subjects was the fact that the pool of subjects who fitted the inclusion criteria was limited.
Having better access to more players from across the country would have ameliorated this
issue. Due to the small sample size and available participants, the grade level of players
ranged between A grade and C1. Having a larger pool to recruit subjects from would also
minimise this issue, allowing more A grade players to be recruited which will give an
improved consistency across results as all participants would be of an equal skill and/or
fitness level. Nevertheless, recruitment of good players for this study means that application
of the results to this level and probably also the elite, is warranted.
A feeding period of two days was used as other studies have used a feeding period of
between two to three days, thus providing support to the chosen methodology. However
using a 24-hour feeding period may be more realistic, especially when since the recovery
period faced between games in tournaments may be less than 24 hours. Future research could
investigate carbohydrate ingestion on squash performance by ingesting a carbohydrate
beverage in between each game which is commonly seen in competitive matches, yet no
research has ever been carried out on this. Another possible study could look at carbohydrate
feeding four hours before exercise which has been shown to be beneficial to endurance
exercise performance.

54
Conclusion
The practice of carbohydrate loading is common in endurance events such as a marathon or a
cycle race which covers a long distance over each race. Additional carbohydrate intake
loading is practiced to super-compensate the muscle with glycogen following previous
exhaustive exercise in order to initially deplete muscle glycogen stores which in turn
increases the activity of glycogen synthase to maximise glycogen storage capacity
(Bergström et al., 1967,Karlsson & Saltin, 1971,Taylor et al., 1972,Piehl, 1974,Ivy et al.,
1988). Research on a nutritional intervention during prolonged, high-intensity intermittent
exercise such as squash is scarce. This study is only one of a handful of other studies that
have implemented a nutritional intervention to improve an aspect of squash performance in
either the form of skill and accuracy (Graydon et al., 1998,Bottoms et al., 2006) or an
improvement in exercise performance (Romer et al., 2001).
This study has investigated the effect of carbohydrate ingestion on squash performance, 48
hours following a strenuous bout of exercise. The exercise bout consisted of an aerobic and
anaerobic exercise bout. The two exercises were completed as a treadmill run and an
intermittent sprint test were aimed to deplete glycogen in type I and type II muscle fibres,
respectively.
Subjects were provided with an additional 9g·kg-1
of carbohydrates on top of a standardised
low-carbohydrate diet. The experimental trial consisted of a squash-simulation match which
was designed to last for around 60 minutes, by simulating a 5-set match in order to provoke
the physiological changes as expected during prolonged exercise, but more importantly to
examine the ergogenic effect of carbohydrate ingestion 48 hours before prolonged exercise.
The intervention of the experiment was successful, as supported from a difference in RER
and from a greater utilisation of carbohydrate. However, this did not result in a significant
effect of performance time. A possible explanation to this could be as a result of the study
being slightly underpowered. However, the p-value of an interaction between the intervention
and performance time was very close to achieving significance. Therefore, this effect cannot
be discounted and more data will be collected in the near future in order to get more power
for publication. A significant interaction for this parameter would indicate that an increase in
carbohydrate intake would support previous studies on carbohydrate feeding, resulting in an
improvement in exercise performance. In this case, it would be an ergogenic effect by
delaying fatigue in the form of maintaining speed or power, not endurance capacity.

55
References
Acheson K,Schutz Y,Bessard T,Anantharaman K,Flatt J & Jequier E (1988). Glycogen storage capacity and de novo lipogenesis during massive carbohydrate overfeeding in man. The American Journal of Clinical Nutrition 48, 240-247.
Ali A & Williams C (2009). Carbohydrate ingestion and soccer skill performance during prolonged intermittent exercise. Journal of Sports Sciences 27, 1499-1508.
Andersen P & Sjogaard G (1976). Selective glycogen depletion in the subgroups of type II muscle fibres during intense submaximal exercise in man. Acta Physiologica Scandinavica 96, 2b.
Ballor D & Volovsek A (1992). Effect of exercise to rest ratio on plasma lactate concentration at work rates above and below maximum oxygen uptake. European Journal of Applied Physiology and Occupational Physiology 65, 365-369.
Balsom P,Gaitanos G,DERLUND K & Ekblom B (1999). High intensity exercise and muscle glycogen availability in humans. Acta Physiologica Scandinavica 165, 337-345.
Bangsbo J,Iaia FM & Krustrup P (2007). Metabolic response and fatigue in soccer. International journal of sports physiology and performance 2, 111.
Bangsbo J,Norregaard L & Thorsoe F (1992). The effect of carbohydrate diet on intermittent exercise performance. International Journal of Sports Medicine 13, 152-157.

56
Bergström J,Hermansen L,Hultman E & Saltin B (1967). Diet, muscle glycogen and physical performance. Acta Physiologica Scandinavica 71, 140-150.
Bergström J & Hultman E (1966). Muscle glycogen synthesis after exercise: an enhancing factor localized to the muscle cells in man. Nature 210, 309-310.
Bergstrom J,Hultman E & Roch-Norlund A (1972). Muscle glycogen synthetase in normal subjects. Scandinavian Journal of Clinical and Laboratory Investigation 29, 231-236.
Blanksby B,Elliott B & Bloomfield J (1973). Telemetered heart rate responses of middle-aged sedentary males, middle-aged active males and" a" grade male squash players. The Medical Journal of Australia 2, 477-481.
Bogdanis GC,Nevill ME,Boobis LH & Lakomy H (1996). Contribution of phosphocreatine and aerobic metabolism to energy supply during repeated sprint exercise. Journal of Applied Physiology 80, 876-884.
Boobis L,Williams C & Wootton S (1982). Human muscle metabolism during brief maximal exercise. The Journal of Physiology 338, 21P-22P.
Borg G (1970). Perceived exertion as an indicator of somatic stress. Scandinavian Journal of Rehabilitation Medicine 2, 92-98.
Bottoms LM,Hunter AM & Galloway SDR (2006). Effects of carbohydrate ingestion on skill maintenance in squash players. European Journal of Sport Science 6, 187-195.

57
Brooks GA & Mercier J (1994). Balance of carbohydrate and lipid utilization during exercise: the" crossover" concept. Journal of Applied Physiology 76, 2253-2261.
Burke L (2010). Fueling strategies to optimize performance: training high or training low? Scandinavian Journal of Medicine & Science in Sports 20, 48-58.
Bussau VA,Fairchild TJ,Rao A,Steele P & Fournier PA (2002). Carbohydrate loading in human muscle: an improved 1 day protocol. European Journal of Applied Physiology 87, 290-295.
Candau R,Belli A,Millet G,Georges D,Barbier B & Rouillon J (1998). Energy cost and running mechanics during a treadmill run to voluntary exhaustion in humans. European journal of applied physiology and occupational physiology 77, 479-485.
Casey A,Short A,Curtis S & Greenhaff P (1996). The effect of glycogen availability on power output and the metabolic response to repeated bouts of maximal, isokinetic exercise in man. European Journal of Applied Physiology and Occupational Physiology 72, 249-255.
Chin M,Steininger K,So R,Clark C & Wong A (1995). Physiological profiles and sport specific fitness of Asian elite squash players. British Journal of Sports Medicine 29, 158-164.
Christensen EH & Hansen O (1939). Arbeitsfahigkeit und ernahrung. Scand Arch Physiol 81, 160-171.

58
Cohen P,Klee CB,Picton C & Shenolikar S (1980). Calcium control of muscle phosphorylase kinase through the combined action of calmodulin and troponin. . Annals of the New York Academy of Sciences 356, 151-161.
Costill D,Coyle E,Dalsky G,Evans W,Fink W & Hoopes D (1977). Effects of elevated plasma FFA and insulin on muscle glycogen usage during exercise. Journal of Applied Physiology 43, 695-699.
Costill D,Sherman W,Fink W,Maresh C,Witten M & Miller J (1981). The role of dietary carbohydrates in muscle glycogen resynthesis after strenuous running. The American Journal of Clinical Nutrition 34, 1831-1836.
Coyle EF,Coggan AR,Hemmert M,Lowe RC & Walters TJ (1985). Substrate usage during prolonged exercise following a preexercise meal. Journal of Applied Physiology 59, 429-433.
Davis J,Jackson D,Broadwell M,Queary J & Lambert C (1997). Carbohydrate drinks delay fatigue during intermittent, high-intensity cycling in active men and women. International Journal of Sport Nutrition 7, 261-273.
Dudley GA,Abraham WM & Terjung RL (1982). Influence of exercise intensity and duration on biochemical adaptations in skeletal muscle. Journal of Applied Physiology 53, 844-850.
Eime R & Finch C (2002). Have the attitudes of Australian squash players towards protective eyewear changed over the past decade? British Journal of Sports Medicine 36, 442-445.
Elliott WH & Elliott DC. (2005). Biochemistry and molecular biology. Oxford University Press.

59
Entman M,Keslensky S,Chu A & Van Winkle W (1980). The sarcoplasmic reticulum-glycogenolytic complex in mammalian fast twitch skeletal muscle. Proposed in vitro counterpart of the contraction-activated glycogenolytic pool. Journal of Biological Chemistry 255, 6245-6252.
Fairchild TJ,Fletcher S,Steele P,Goodman C,Dawson B & Fournier PA (2002). Rapid carbohydrate loading after a short bout of near maximal-intensity exercise. Medicine & Science in Sports & Exercise 34, 980.
Fallowfield J & Williams C (1993). Carbohydrate intake and recovery from prolonged exercise. International Journal of Sport Nutrition 3, 150-164.
Frayn K (1983). Calculation of substrate oxidation rates in vivo from gaseous exchange. Journal of Applied Physiology 55, 628-634.
Gaitanos GC,Williams C,Boobis L & Brooks S (1993). Human muscle metabolism during intermittent maximal exercise. Journal of Applied Physiology 75, 712.
Garden G,Hale P,Horrocks P,Crase J,Hammond V & Nattrass M (1986). Metabolic and hormonal responses during squash. European Journal of Applied Physiology and Occupational Physiology 55, 445-449.
Girard O,Chevalier R,Habrard M,Sciberras P,Hot P & Millet GP (2007). Game analysis and energy requirements of elite squash. Journal of Strength and Conditioning Research 21, 909-914.

60
Girard O,Sciberras P,Habrard M,Hot P,Chevalier R & Millet G (2005). Specific incremental test in elite squash players. British Journal of Sports Medicine 39, 921-926.
Gollnick P,Armstrong R,Saubert C,Sembrowich W,Shepherd R & Saltin B (1973a). Glycogen depletion patterns in human skeletal muscle fibers during prolonged work. Pflügers Archiv European Journal of Physiology 344, 1-12.
Gollnick P,Armstrong R,Sembrowich W,Shepherd R & Saltin B (1973b). Glycogen depletion pattern in human skeletal muscle fibers after heavy exercise. Journal of Applied Physiology 34, 615.
Graydon J,Taylor S & Smith M (1998). The effect of carbohydrate ingestion on shot accuracy during a conditioned squash match. Science and Racket Sports II, 68.
Greenhaff P,Nevill M,Soderlund K,Bodin K,Boobis L,Williams C & Hultman E (1994). The metabolic responses of human type I and II muscle fibres during maximal treadmill sprinting. The Journal of Physiology 478, 149.
Hawley JA,Palmer GS & Noakes TD (1997). Effects of 3 days of carbohydrate supplementation on muscle glycogen content and utilisation during a 1-h cycling performance. European Journal of Applied Physiology and Occupational Physiology 75, 407-412.
Hermansen L,Hultman E & Saltin B (1967). Muscle glycogen during prolonged severe exercise. Acta Physiologica Scandinavica 71, 129-139.
Hornery DJ,Farrow D,Mujika I & Young W (2007). Fatigue in tennis: mechanisms of fatigue and effect on performance. Sports Medicine 37, 199-212.
61
Houston ME. (1995). Biochemistry primer for exercise science. Human Kinetics.
Ivy J,Lee M,Brozinick J & Reed M (1988). Muscle glycogen storage after different amounts of carbohydrate ingestion. Journal of Applied Physiology 65, 2018-2023.
Jenkins D,Palmer J & Spillman D (1993). The influence of dietary carbohydrate on performance of supramaximal intermittent exercise. European Journal of Applied Physiology and Occupational Physiology 67, 309-314.
Johnson L (1992). Glycogen phosphorylase: control by phosphorylation and allosteric effectors. The FASEB journal 6, 2274-2282.
Karlsson J & Saltin B (1971). Diet, muscle glycogen, and endurance performance. Journal of Applied Physiology 31, 203.
Kingsley M,James N,Kilduff L,Dietzig R & Dietzig B (2006). An exercise protocol that simulates the activity patterns of elite junior squash. Journal of Sports Sciences 24, 1291-1296.
Mendell LM (2005). The size principle: a rule describing the recruitment. Journal of Neurophysiology 93, 3024-3026.
Mercier M,Beillot J,Gratas A,Rochcongar P,Lessard Y,Andre A & Dassonville J (1987). Adaptation to work load in squash players: laboratory tests and on court recordings. The Journal of Sports Medicine and Physical Fitness 27, 98-104.

62
Montpetit R (1990). Applied physiology of squash. Sports Medicine 10, 31.
Nicholas C,Green P,Hawkins R & Williams C (1997). Carbohydrate intake and recovery of intermittent running capacity. International Journal of Sport Nutrition 7, 251-260.
Noakes T,Cowling J,Gevers W & Van Niekerk J (1982). The metabolic response to squash including the influence of pre-exercise carbohydrate ingestion. South African Medical Journal 62, 721–723.
Piehl K (1974). Time Course for Refilling of Glycogen Stores in Human Muscle Fibres Following Exercise Induced Glycogen Depletion. Acta Physiologica Scandinavica 90, 297-302.
Piehl K,Adolfsson S & Nazar K (1974). Glycogen storage and glycogen synthetase activity in trained and untrained muscle of man. Acta Physiologica Scandinavica 90, 779-788.
Poortmans JR. (2004). Principles of exercise biochemistry. Karger.
Pyke S,Elliott C & Pyke E (1974). Performance testing of tennis and squash players. British Journal of Sports Medicine 8, 80-86.
Rauch H,Gibson ASC,Lambert E & Noakes T (2003). A signalling role for muscle glycogen in the regulation of pace during prolonged exercise. British Journal of Sports Medicine 39, 34-38.

63
Reed M,Brozinick Jr J,Lee M & Ivy J (1989). Muscle glycogen storage postexercise: effect of mode of carbohydrate administration. Journal of Applied Physiology 66, 720-726.
Romer L,Barrington J & Jeukendrup A (2001). Effects of oral creatine supplementation on high intensity, intermittent exercise performance in competitive squash players. International Journal of Sports Medicine 22, 546-552.
Saltin B & Essen B (1971). Muscle glycogen, lactate, ATP and CP in intermittent exercise. Muscle metabolism during exercise, New York, 419-424.
Sharp N,Lees A,Maynard I,Hughes M & Reilly T (1998). Physiological demands and fitness for squash. Science and racket sports II, 3-13.
Sherman R,Creasey T & Batterham A (2004). An on-court, ghosting protocol to replicate physiological demands of a competitive squash match, pp. 1. Psychology Press.
Smekal G,Von Duvillard SP,Rihacek C,Pokan R,Hofmann P,Baron R,Tschan H & Bachl N (2001). A physiological profile of tennis match play. Medicine & Science in Sports & Exercise 33, 999-1105.
Spriet L,Lindinger M,McKelvie R,Heigenhauser G & Jones N (1989). Muscle glycogenolysis and H+ concentration during maximal intermittent cycling. Journal of Applied Physiology 66, 8-13.

64
Stallknecht B,Vissing J & Galbo H (1998). Lactate production and clearance in exercise. Effects of
training. A mini‐review. Scandinavian Journal of Medicine & Science in Sports 8, 127-131.
Steininger K & Wodick R (1987). Sports-specific fitness testing in squash. British Journal of Sports Medicine 21, 23-26.
Taylor A,Thayer R & Rao S (1972). Human skeletal muscle glycogen synthetase activities with exercise and training. Canadian Journal of Physiology and Pharmacology 50, 411-415.
Todd M,Mahoney C & Wallace W (1998). 13 The efficacy of training routines as a preparation for competitive squash. Science and racket sports II, 91.
Ulmer HV (1996). Concept of an extracellular regulation of muscular metabolic rate during heavy exercise in humans by psychophysiological feedback. Cellular and Molecular Life Sciences 52, 416-420.
Van Rensburg J,Van der Linde A,Ackerman P,KEIL-BLOCK A & Strydom N (1982). Physiological profiles of squash players. South African Journal for Research in Sport, Physical Education and Recreation 5, 25-66.
VØLLESTAD MK,VAAGE O & HERMANSEN L (1984). Muscle glycogen depletion patterns in type I and subgroups of type II fibres during prolonged severe exercise in man. Acta Physiologica Scandinavica 122, 433-441.
Wilkinson M,Leedale-Brown D & Winter E (2009a). Validity of a squash-specific test of change-of-direction speed. International Journal of Sports Physiology and Performance 4, 2.

65
Wilkinson M,Leedale-Brown D & Winter EM (2009b). Reproducibility of physiological and performance measures from a squash-specific fitness test. International Journal of Sports Physiology and Performance, 41-53.
Wilkinson M,Leedale-Brown D & Winter EM (2009c). Validity of a squash-specific test of change-of-direction speed.
Wright D,Sherman W & Dernbach A (1991). Carbohydrate feedings before, during, or in combination improve cycling endurance performance. Journal of applied physiology (Bethesda, Md: 1985) 71, 1082.

66
Appendices
Participant information sheet
PARTICIPANT INFORMATION SHEET
The effects of carbohydrate loading 48 hours prior to a simulated squash match.
Researchers: Aaron Raman
Ph (06) 356 9099 ext 5871
Dr. Toby Mundel
Ph (06) 356 9099 ext 7763
A/Prof Steve Stannard
Ph (06) 356 9099 ext 81584
You are invited to participate in a study evaluating the effect of pre-exercise carbohydrate loading on simulated
squash performance. Participation in this study is on a voluntary basis and you have the right to pull out, or ask
questions at any time. This project forms part of my MSc.
Why are we doing this study?
Squash is an ever growing sport, currently with more than 15 million players worldwide. The impact of nutrition
on squash performance is an area which has had very limited attention with only a few studies having previously
Institute of Food, Nutrition and
Human Health
Private Bag 11 222
Palmerston North
New Zealand
Telephone: 64 6 350 4336
Facsimile: 64 6 350 5657
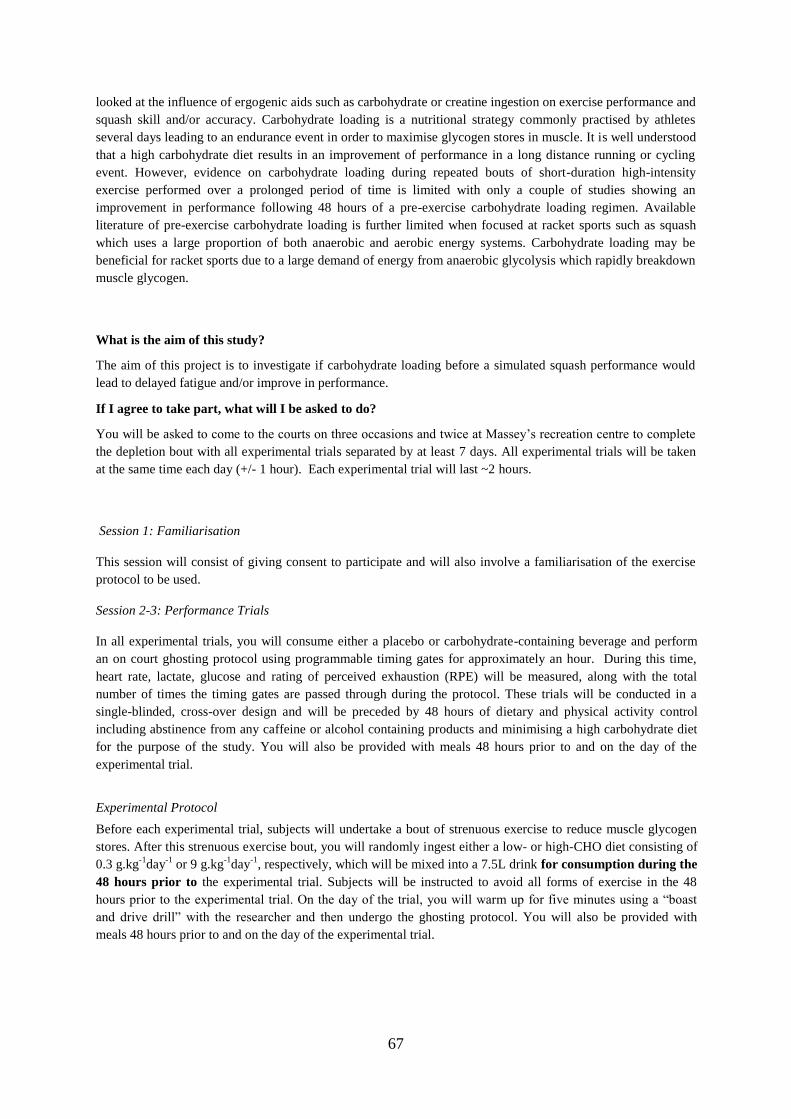
67
looked at the influence of ergogenic aids such as carbohydrate or creatine ingestion on exercise performance and
squash skill and/or accuracy. Carbohydrate loading is a nutritional strategy commonly practised by athletes
several days leading to an endurance event in order to maximise glycogen stores in muscle. It is well understood
that a high carbohydrate diet results in an improvement of performance in a long distance running or cycling
event. However, evidence on carbohydrate loading during repeated bouts of short-duration high-intensity
exercise performed over a prolonged period of time is limited with only a couple of studies showing an
improvement in performance following 48 hours of a pre-exercise carbohydrate loading regimen. Available
literature of pre-exercise carbohydrate loading is further limited when focused at racket sports such as squash
which uses a large proportion of both anaerobic and aerobic energy systems. Carbohydrate loading may be
beneficial for racket sports due to a large demand of energy from anaerobic glycolysis which rapidly breakdown
muscle glycogen.
What is the aim of this study?
The aim of this project is to investigate if carbohydrate loading before a simulated squash performance would
lead to delayed fatigue and/or improve in performance.
If I agree to take part, what will I be asked to do?
You will be asked to come to the courts on three occasions and twice at Massey’s recreation centre to complete
the depletion bout with all experimental trials separated by at least 7 days. All experimental trials will be taken
at the same time each day (+/- 1 hour). Each experimental trial will last ~2 hours.
Session 1: Familiarisation
This session will consist of giving consent to participate and will also involve a familiarisation of the exercise
protocol to be used.
Session 2-3: Performance Trials
In all experimental trials, you will consume either a placebo or carbohydrate-containing beverage and perform
an on court ghosting protocol using programmable timing gates for approximately an hour. During this time,
heart rate, lactate, glucose and rating of perceived exhaustion (RPE) will be measured, along with the total
number of times the timing gates are passed through during the protocol. These trials will be conducted in a
single-blinded, cross-over design and will be preceded by 48 hours of dietary and physical activity control
including abstinence from any caffeine or alcohol containing products and minimising a high carbohydrate diet
for the purpose of the study. You will also be provided with meals 48 hours prior to and on the day of the
experimental trial.
Experimental Protocol
Before each experimental trial, subjects will undertake a bout of strenuous exercise to reduce muscle glycogen
stores. After this strenuous exercise bout, you will randomly ingest either a low- or high-CHO diet consisting of
0.3 g.kg-1
day-1
or 9 g.kg-1
day-1
, respectively, which will be mixed into a 7.5L drink for consumption during the
48 hours prior to the experimental trial. Subjects will be instructed to avoid all forms of exercise in the 48
hours prior to the experimental trial. On the day of the trial, you will warm up for five minutes using a “boast
and drive drill” with the researcher and then undergo the ghosting protocol. You will also be provided with
meals 48 hours prior to and on the day of the experimental trial.
68
Blood Collection
Capillary blood will also be collected from a finger throughout each trial (before, during and after) to analyse for
blood lactate and glucose. There will be a total of 6 blood samples collected in each trial.
Exercise Protocol
The protocol for the glycogen-depleting exercise will consist of a ‘Yo-Yo intermittent test’ which consists of 2 x
20m sprints which increases in speed over time interspersed with 10 seconds of recovery time. You will run till
exhaustion in order to deplete muscle glycogen to its greatest extent. During the experimental trial, you will be
required to perform an on-court ghosting protocol using programmable timing gates that is a modification of the
protocol based from Wilkinson et al. (2009). The protocol involves you to start on the “T” position and running
to each timing gate as it lights up and emits a noise – a gate is placed in each of the four corners of the court. The
player then places his racket in the middle of the gate and returns to the T as quickly as he can, and gets ready
for the next timing gate to activate – there is slight delay between passing through a timing gate and activation of
the next gate in order to let the player return to the T. The order and sequence of the gate activations are
programmed into the timing gates by the researcher prior to the experiment and are based on actual squash
match analysis data. The timing gates are programmed so that the protocol is split into rallies of differing length
with a rest of eight seconds between rallies. Furthermore, based on match analysis data, the protocol is divided
into five ‘games’ each of twelve minutes duration. Between each game, a 90 second break will be given to you
where you will go off court and drink 150ml of water. You are asked to perform at your best ability for the
duration of the trial.
Experimental Measures
In all experimental trials, heart rate will be measured prior to, during every 90-second break of the protocol and
upon completion of the exercise task. Furthermore, ratings of perceived exertion (RPE) will be taken during
every 90-second break and upon completion of the ghosting protocol. Finger prick samples of blood lactate and
glucose (via capillary blood) will also be measured before, during the 90-second intervals and upon completion
of each trial. The time taken to trigger each gate will be taken as the measure of performance.

69
Summary of Protocol
Wilkinson M, Leedale-Brown D & Winter EM (2009). Validity of a squash specific fitness test. International
Journal of Sports Physiology and Performance 4, 29-40.
What are the risks?
Squash places large amounts of stress on the body in terms of joints and muscles and the cardiovascular system.
For this reason, you must pass selection criteria (see the health screening questionnaire) before participating.
Since blood glucose will be measured, if any abnormalities are seen during the trial, participants will be
notified. You will be advised to see your GP if an abnormal blood glucose level is observed.
Additionally, a high carbohydrate diet might provide you with a bloating feeling or extra wind.
What are the benefits?
You will receive reimbursement for your time with a voucher and will also be provided with food for ~48 hours.
What are my rights?
- You can ask questions on any aspect of the project at any time, and we will do our best to answer them
to your satisfaction.
- As a participant in the study you will provide information on the understanding that your name will not
be used unless you give permission to the researcher.
- You have the right to view your own data at any stage and have it explained to you.
- You will also be given access to a summary of the project findings when it is concluded.
- You can withdraw from the project at any time, without giving any reason and without penalty.

70
What about compensation for injury?
If physical injury results from your participation in this study, you should visit a treatment provider to make a
claim to ACC as soon as possible. ACC cover and entitlements are not automatic and your claim will be
assessed by ACC in accordance with the Injury Prevention, Rehabilitation and Compensation Act 2001. If your
claim is accepted, ACC must inform you of your entitlements, and must help you access those entitlements.
Entitlements may include, but not be limited to, treatment costs, travel costs for rehabilitation, loss of earnings,
and/or lump sum for permanent impairment. Compensation for mental trauma may also be included, but only if
this is incurred as a result of physical injury.
Am I eligible?
Although voluntary, your participation will also be confirmed on criteria relating to health and safety; namely,
in this study we are seeking healthy, moderately active squash playing (play squash a minimum of 3 times per
week) males aged between 18-40 and currently holding a New Zealand Squash grade of C2 or above. For
health/safety reasons, you should not participate if any of the following apply to you:
- You have any known heart or cardiovascular condition or if a member of your family died below the
age of fifty (50) as a result of a heart condition.
- You have (a) condition(s) that could be made worse by exercise.
- You have ever had an injury or any medical condition that you think may affect your ability to sense
pain or discomfort.
- You are taking prescribed medication.
- You have any other reason to consider that you are not in good health and of average, or better than
average, fitness.
Anything else I need to know?
You will be asked to wear your normal squash shorts, shirt and footwear that you feel comfortable exercising in.
Water will be provided throughout the testing procedure. We would also like you to fill in a food and physical
activity diary and you will need to be well hydrated (on arrival you will be provided with 500mL water to
optimise hydration status).
All data obtained from this study will be kept strictly confidential. Data will be identified as a code only. Results
will be made available to you at the completion of the study.

71
If you are interested in taking part:
Contact:
Aaron Raman
School of Sport and Exercise
Massey University, Palmerston North Campus
Palmerston North, New Zealand
Phone: (021) 2122 897
e-mail: [email protected]
“This project has been reviewed and approved by the Massey University Human Ethics
Committee: Southern A, Application 11/20. If you have any concerns about the conduct of
this research, please contact Professor Julie Boddy, Chair, Massey University Human Ethics
Committee: Southern A telephone 06 350 5799 x 2541, email

72
Health screening questionnaire
Pre-Exercise Health Screening Questionnaire
Name: ______________________________________________________________
Address: ____________________________________________________________
Phone: _______________________________
Age: ________________
This questionnaire has been designed to identify the small number of persons (15-69 years of age) for whom
physical activity might be inappropriate. The questions are based upon the Physical Activity Readiness
Questionnaire, originally devised by the British Columbia Dept of Health (Canada), as revised by Thomas et al.
(1992) and Cardinal et al. (1996), with the added requirements of the Massey University Human Ethics
Committee. The information provided by you on this form will be treated with the strictest confidentiality.
You should be aware that even amongst healthy persons who undertake regular physical activity there is a risk
of sudden death during exercise. Though extremely rare, such cases can occur in people with an undiagnosed
heart condition. If you have any reason to suspect that you may have a heart condition that will put you at risk
during exercise, you should seek advice from a medical practitioner before undertaking an exercise test.
Please read the following questions carefully. If you have any difficulty, please advise the exercise specialist
who is conducting the exercise test. Please answer all of the following questions by ticking only one box for
each question:

73
1. Has your doctor ever said that you have a heart condition and that you should only do physical activity
recommended by a doctor?
Yes No
2. Do you feel a pain in your chest when you do physical activity?
Yes No
3. In the past month have you had chest pain when you were not doing physical activity?
Yes No
4. Do you lose your balance because of dizziness or do you ever lose consciousness?
Yes No
5. Is your doctor currently prescribing drugs (for example, water pills) for your blood pressure or heart
condition?
Yes No
6. Do you have a bone or joint problem that could be made worse by vigorous exercise?
Yes No
7. Do you know of any other reason why you should not do physical activity?
Yes No

74
8. Have any immediate family had heart problems prior to the age of 60?
Yes No
9. Have you been hospitalized recently?
Yes No
10. Do you play squash 3 or more times per week?
Yes No
11. Do you have diabetes or any other medical conditions which may put you at risk from a high
carbohydrate intake?
Yes No
12. Are you lactose intolerant?
Yes No
13. Are you allergic to any artificial sweeteners?
Yes No If yes, please explain :
s

75
14. Are you taking any of the following pharmaceutical preparations?
Yes No
o Antihypertensive (high blood pressure) medications of any sort
o Antiarrhythmic drugs
o Allergy, cold and flu, or cough preparations containing pseudoephedrine
o Bronchodilators containing: theophylline, albuterol, epinephrine (adrenaline)
o Pseudoephedrine
I have read, understood and completed this questionnaire.
Signature: ________________________________________ Date: ___________________
References
Thomas S, Reading J and Shephard RJ. (1992) Revision of the Physical Activity Readiness Questionnaire
(PAR-Q). Can J Sport Sci 17(4): 338-345.
Cardinal BJ, Esters J and Cardinal MK. (1996) Evaluation of the revised physical activity readiness
questionnaire in older adults. Med Sci Sports Exerc 28(4): 468-472

76
Consent form
CONSENT FORM
Project Title: The effects of carbohydrate loading 48 hours prior to a simulated
squash match.
I have read the Information Sheet and have had the details of the study explained to me. My questions have
been answered to my satisfaction, and I understand that I may ask further questions at any time.
I agree to participate in this study under the conditions set out in the Information Sheet.
Signature: Date:
Full Name - printed
Institute of Food, Nutrition and
Human Health
Private Bag 11 222
Palmerston North
New Zealand
Telephone: 64 6 350 4336
Facsimile: 64 6 350 5657
77
Ethical letter of approval(Christensen & Hansen, 1939,Andersen & Sjogaard,
1976,Costill et al., 1977,VØLLESTAD et al., 1984,Acheson et al., 1988,Fallowfield &
Williams, 1993,Todd et al., 1998,Rauch et al., 2003)

78
Set list of timing gates
Range: From 1 to 4 - Unsorted
Set 1 Set 2 Set 3 Set 4 Set 5 1 3 1 3 1
1 & 2 are front gates
2 4 3 4 4
3 & 4 are back gates
3 2 2 3 3 4 4 3 2 1
74% back = 89 gates
3 1 3 3 4
26% front = 31 gates
2 3 3 2 4 4 3 2 3 1 4 3 4 3 3 1 2 3 4 1 3 2 4 2 3 3 4 1 3 2 2 1 4 3 3 3 3 4 3 3 4 3 3 4 4 2 2 4 1 4 2 4 3 4 2 1 4 3 3 1 4 1 4 4 3 3 3 4 1 1 3 3 3 2 3 3 4 2 3 3 4 4 3 4 1 1 1 4 3 4 4 4 1 3 3 1 3 4 4 4 4 2 3 3 3 2 3 3 2 4 3 4 1 3 1 4 1 3 3 1 3 4 2 1 4 4 3 4 3 3 3 2 2 4 4 4 4 4 4 3 4 3 4 3 3 3 4 3 1 4 2 1 3 3 2 3 2 4 3 3 1 4 1 3 1 3 4 3 1 4 3 3 3 3 4 1 4 2 2 3 4 3 3 4 4 4 2 4 3 1 3 3 3 4 3 3 3 3 4 2 4 2 4 2 4

79
1 2 1 2 4 2 3 3 4 4 3 2 4 4 3 2 4 4 3 4 4 3 2 2 1 4 4 1 1 4 4 3 3 4 2 3 4 3 4 4 2 4 4 3 3 3 3 2 4 4 3 3 1 3 4 2 3 4 3 1 3 3 3 3 4 4 4 3 2 4 3 3 4 4 1 2 2 2 3 2 3 3 3 4 3 3 4 4 4 4 4 2 1 2 4 1 3 3 3 3 4 3 4 3 3 3 2 2 3 3 4 4 3 1 3 4 1 3 3 2 4 4 2 4 3 3 4 3 3 4 4 3 3 1 3 2 3 3 1 4 3 4 4 3 1 3 4 3 3 3 4 4 3 3 3 2 1 4 1 4 3 3 4 3 3 4 2 3 4 4 4 4 4 3 4 3 4 4 4 1 4 3 3 4 3 3 4 4 1 3 4 4 4 1 3 4 3 4 3 1 4 3 3 1 4 1 4 1 4 4 3 1 1 3 4 3 3 4 3 4 4 4 1 2 1 3 3 4 4 2 4 2 1 3 4 1 3 3 4 3 4 4 2 3 3 1 4 4 3 4

80
3 3 4 4 4 3 4 2 2 3 4 3 4 3 2 3 3 1 3 3 3 2 3 1 1 3 3 1 3 4 2 4 3 4 3 3 3 4 4 3 4 2 3 3 4 1 3 4 3 4 3 4 3 2 3 4 1 3 4 2 3 4 4 1 3 3 3 3 4 4 4 3 2 3 3 1 4 1 4 3 4 1 4 3 1 2 4 1 3 4 3 3 4 3 4 3 3 3 1 3 4 4 4 2 4 1 4 4 3 2 3 1 3 3 4