the effects of birth spacing on infant and child mortality ... effects of birth spacing on infant...
TRANSCRIPT
The Effects of Birth Spacing on Infant and Child Mortality, Pregnancy Outcomes, and Maternal Morbidity and Mortality in Matlab, Bangladesh JULIE DAVANZO, ABDUR RAZZAQUE, MIZANAUR RAHMAN, AND LAUREN HALE WITH KAPIL AHMED, MEHRAB ALI KHAN, GOLAM MUSTAFA, AND KANIZ GAUSIA
WR-198
October 2004
WORK ING P A P E R
This product is part of the RAND Labor and Population working paper series. RAND working papers are intended to share researchers’ latest findings and to solicit informal peer review. They have been approved for circulation by RAND Labor and Population but have not been formally edited or peer reviewed. Unless otherwise indicated, working papers can be quoted and cited without permission of the author, provided the source is clearly referred to as a working paper. RAND’s publications do not necessarily reflect the opinions of its research clients and sponsors.
is a registered trademark.

THE EFFECTS OF BIRTH SPACING ON INFANT AND CHILD MORTALITY, PREGNANCY OUTCOMES, AND MATERNAL MORBIDITY AND
MORTALITY IN MATLAB, BANGLADESH*
Julie DaVanzo (RAND), Abdur Razzaque (ICDDR,B), Mizanur Rahman (Pathfinder International), and Lauren Hale (RAND),
with Kapil Ahmed (Pathfinder International), Mehrab Ali Khan (ICDDR,B), AHM Golam Mustafa (ICDDR,B), and Kaniz Gausia (ICDDR,B)**
* This paper was made possible through support provided by the Office of Population and
Reproductive Health of the Center for Population, Health, and Nutrition, Bureau for Global Programs of the U.S. Agency for International Development (USAID) under the terms of Cooperative Agreement No. HRN-A-00-00-00003-00 awarded to the CATALYST Consortium. The Consortium is a partnership between Pathfinder International and the Academy for Educational Development, the Centre for Development and Population Activities, Meridian Group International, Inc., and PROFAMILIA/Colombia. The first draft of this report was reviewed by the USAID Expert Panel. The views expressed are those of the authors and do not reflect the opinions of the staff of the United States Agency for International Development. Please do not quote or cite without the authors’ permission.
An earlier version of this paper, on the effects of birth spacing on pregnancy outcomes and infant and child mortality, was presented at USAID on March 30, 2004; at the annual meeting of the Population Association of America, in Boston, on April 2, 2004; and at a meeting of the Systematic Literature Review Expert Panel at the CATALYST Consortium, on April 29, 2004, in Washington, D.C.
The authors thank Stan Becker for his helpful comments and Suzanne Knecht for her guidance. They also thank Greg Ridgeway and Lionel Galway for their statistical advice.
** Julie DaVanzo is the principal investigator, and Mizanur Rahman and Abdur Razzaque are the co-principal investigators. Rahman and Razzaque developed the data files, with assistance from Mustafa Golam and Kapil Ahmed. Lauren Hale has worked with DaVanzo, with advice from Rahman and Razzaque, on the analyses of infant and child mortality and of pregnancy outcomes and on the analyses in Chapter 7. Mizanur Rahman has taken the lead on the analysis of maternal mortality and prepared the chapter on those analyses; Kapil Ahmed assisted with that analysis. Abdur Razzaque has taken the lead on the analyses of maternal morbidity and prepared the chapter on this; Mehrab Ali Khan and AHM Golam Mustafa assisted with these analyses, and Kaniz Gausia has provided useful advice.
ii
TABLE OF CONTENTS
ABSTRACT ___________________________________________________________ iv
I. INTRODUCTION __________________________________________________ 1
II. WHY BIRTH SPACING MIGHT AFFECT PREGNANCY OUTCOMES, INFANT AND CHILD MORTALITY, AND MATERNAL MORBIDITY AND MORTALITY _ 4
III. STUDY SETTING, DATA, AND METHODS ____________________________ 6
Study Setting and Data________________________________________________ 6
Methods ____________________________________________________________ 9
IV. EFFECTS OF BIRTH AND PREGNANCY SPACING ON INFANT AND CHILD MORTALITY AND PREGNANCY OUTCOMES _____________________ 20
Effects of Interbirth and Inter-Outcome Intervals and of Controlling for Gestation of Pregnancy on Infant and Child Mortality ____________________ 20
How Do Effects of Short Inter-Outcome Intervals Vary by the Type of Outcome of Preceding Pregnancy? _____________________________________________ 22
Effects of Inter-Outcome Intervals with Other Variables Controlled_________ 23
Do the Effects of Reproductive Patterns Vary Across Population Subgroups? _ 27
How Do the Magnitudes of the Effects of Short Intervals Compare to Those of Other High-Risk Factors? ____________________________________________ 27
How Does Controlling for Breastfeeding and Immunizations Alter the Estimates of the Effects of Inter-Outcome Intervals?_______________________________ 28
How Does the Duration of the Preceding Interpregnancy Interval Affect Whether that Pregnancy Results in a Live Birth?_________________________________ 32
Influences on Pregnancy Duration _____________________________________ 33
How Would Mortality Change If All Intervals Were 3-5 Years Long?________ 34
Do Differences in Reproductive Patterns between the MCH-FP and Comparison Areas Explain Why Infant and Child Mortality Rates are Lower in the MCH-FP Area? _____________________________________________________________ 36
Discussion and Conclusions ___________________________________________ 37
V. EFFECTS OF INTERPREGNANCY INTERVALS, THE MCH-FP PROGRAM, AND SOCIOECONOMIC FACTORS ON MATERNAL MORTALITY IN MATLAB, BANGLADESH _______________________________________________________ 49
Background ________________________________________________________ 49
Methods and Procedures _____________________________________________ 54
Results ____________________________________________________________ 59
Discussion__________________________________________________________ 64

iii
VI. INTERPREGNANCY INTERVALS AND MATERNAL MORBIDITY IN MATLAB, BANGLADESH______________________________________________ 77
Introduction________________________________________________________ 77
Study Population____________________________________________________ 78
Data and Definitions of Variables Considered in Our Analyses _____________ 79
Results ____________________________________________________________ 80
Discussion__________________________________________________________ 84
VII. CHARACTERISTICS OF WOMEN WHO HAVE VERY SHORT OR VERY LONG INTERVALS ___________________________________________________ 93
VIII. CONCLUSION _________________________________________________ 100
REFERENCES ______________________________________________________ 109
APPENDICES _______________________________________________________ 114

iv
ABSTRACT
Using a large, high-quality longitudinal dataset on around 145,000 pregnancy outcomes gathered over a period of more than twenty years from an experimental setting in Matlab, Bangladesh, we seek a better understanding of the effects of the lengths of interbirth intervals on infant and child mortality and on maternal mortality and morbidity.
We find that, compared with intervals of 3-5 years in duration, preceding interbirth intervals of less than 24 months in duration are associated with significantly higher risks of early neonatal mortality, and that interbirth intervals of less than 36 months are associated with significantly higher risks of late neonatal mortality, post-neonatal mortality, and child mortality. Effects of short intervals are stronger the younger the child. A short preceding interval also increases the risk that the index pregnancy will result in a non-live birth (particularly an induced abortion) or a premature live birth. A short subsequent interpregnancy interval is also associated with a significantly higher risk of mortality for the index child. These effects persist when we control for potentially confounding factors (prematurity, breastfeeding, immunizations, and demographic and socioeconomic variables).
Women with short interpregnancy intervals have a significantly higher risk of pre-eclampsia, high blood pressure, and premature rupture of membranes compared to those with an interval of 27-50 months. A preceding interpregnancy of less than six months duration is associated with a somewhat elevated risk of maternal mortality compared to intervals of 27-50 months, but the relative risk is not statistically significant.
Women with very long interpregnancy intervals (75+ months) have a significantly higher risk of pre-eclampsia, proteinuria, high blood pressure, and edema compared to women with intervals of 27-50 months. Very long interpregnancy intervals are also associated with significantly higher risks of maternal mortality. However, long inter-outcome intervals do not significantly increase the risk of infant or child mortality.
A number of the relationships we find in our analyses of infant and child mortality and maternal morbidity are consistent with the maternal depletion hypothesis. We also find some support for the competition hypothesis Pregnancies following short inter-outcome intervals (<36 months) are more likely to be to women who live in the Comparison Area of Matlab. This suggests that women in the MCH-FP Area are better able to use contraception to control the spacing of their pregnancies. More than half (57 percent) of all inter-outcome intervals of known duration in our data are less than 36 months in length. Since intervals of less than 36 months are associated with higher levels of infant and child mortality and some maternal morbidities, there is plenty of opportunity in Bangladesh to reduce these adverse health outcomes by improving the spacing of pregnancies. Rates of infant and child mortality would be 5.8-9.4 percent lower if all inter-outcome intervals were 3-5 years in duration.
1
I. INTRODUCTION
There is renewed programmatic interest in the effects of birth spacing on infant,
child, and maternal health and survival because family planning programs have the
potential to affect the timing of pregnancies. For example, in response to recent research
that suggests that birth intervals of at least three years may be associated with better
health outcomes for mothers and children, communication campaigns in several countries
have already begun using a 3-year spacing message. USAID is currently supporting the
Optimal Birth Spacing Initiative, which seeks to provide advice on how programs can
best promote optimal spacing. Understanding the size of the effects of birthspacing and
reasons for them and identifying the groups for whom they are greatest will provide
useful information for guiding the formulation of the most effective policies to improve
birthspacing.
Every year nearly 11 million children die before their fifth birthday; 99 percent of
these deaths occur in developing countries (UNICEF, 2003). The relationship between
short birth intervals and high infant and child mortality has been established in a wide
range of populations (e.g., Miller et al., 1992; Miller, 1991; Winikoff, 1983; Millman and
Cooksey, 1987; Rutstein, 2000, 2003a, 2003b). In addition, several studies (e.g.,
Rutstein, 2000, in a cross-country analysis), show that very long intervals (at least five
years in length) are associated a slight increase in mortality. However, few studies of the
effects of birthspacing have adequately adjusted for potentially confounding factors such
as prematurity, breastfeeding, whether the birth was intended, and socioeconomic factors.
Adjusting for these characteristics, as we do in this paper, enables a clearer understanding
of the size of the effects of birth intervals of various lengths, the reasons for these effects,
and the population subgroups for which the effects are largest.
Every year over 54 million women suffer from complications during pregnancy
and childbirth. Of those, about 1.5 million die; 99 percent of these deaths occur in the
developing countries (World Health Organization, 1993; World Health Organization and
United Nations Children’s Fund, 1996). However, there have been only a few studies
(e.g., Conde-Agudelo and Belizán, 2000) of the effects of pregnancy spacing on maternal
morbidity and mortality. These suggest that very short intervals may be associated with

2
some types of morbidities, and that very long intervals may be associated with poorer
outcomes also. In this paper we assess the extent to which pregnancy spacing affects
maternal morbidity and mortality in Bangladesh, and whether programs that attempt to
change birthspacing patterns can help reduce such adverse outcomes for women. Such a
health rationale has long been one of the reasons for supporting family planning
programs in developing countries.
Using a large, high-quality longitudinal dataset gathered over a period of more than
twenty years from an experimental setting in Matlab, Bangladesh, we seek a better
understanding of the effects of the lengths of birth intervals on infant and child mortality
and on maternal mortality and morbidity. We also consider how the length of time since
the last birth or pregnancy affects whether a pregnancy results in a live birth (vs. a
miscarriage, abortion, or stillbirth) and the duration of pregnancy. This paper addresses
the following research questions:
1) To what extent does the length of the preceding birth interval affect the risks
of infant and child mortality?
2) Are the interval effects U-shaped, i.e., are both too short and too long intervals pernicious? (and exactly what durations define too-short and too-long?)
3) To what extent is the “effect” of longer interbirth intervals due to there being a
non-live birth between the two births that define the interval? How do the effects of interbirth intervals compare to those of inter-outcome intervals (the interval back to the last pregnancy outcome, regardless of whether it was a live birth)?
4) To what extent is the effect of a short inter-outcome interval on infant and
child mortality due to short gestation of the index pregnancy? What are the separate effects of the interpregnancy interval (the interval between the preceding pregnancy outcome and the conception of the index pregnancy) and of the duration of gestation of the index pregnancy?
5) To what extent are the apparent effects of short or long intervals on infant and
child mortality due to factors such as breastfeeding and immunizations that are correlated with pregnancy spacing?
6) At what ages of child are the interval effects greatest? In particular, do the
effects of the length of the preceding interval differ across subperiods of infants and childhood?

3
7) Does the duration of the subsequent interval affect the likelihood of survival of the index child when appropriate attention is given to the reverse causality that can arise because subsequent intervals may be short because the index child died?
8) To what extent do the effects of short intervals on infant and child mortality
appear to be due to maternal depletion? To what extent do they appear to be due to competition among closely spaced siblings?
9) Does the interval between the preceding pregnancy outcome and the
conception of the index pregnancy affect the outcome of the index pregnancy (whether it results in a live birth or not) and duration of the gestation of the index pregnancy, e.g., whether the baby is born prematurely?
10) How does the length of the interpregnancy interval preceding a pregnancy
affect the woman’s likelihood of morbidity during that pregnancy and her chance of dying from pregnancy-related causes? Are the interval effects on maternal outcomes U-shaped, i.e., are both too short and too long intervals pernicious?
11) Do the effects of intervals on infant, child, and maternal health and survival
remain when those of other potentially confounding variables (e.g., mother’s age and education) are controlled?
12) How do the magnitudes of the health risks associated with “high-risk” inter-
outcome intervals compare to those for other explanatory variables associated with a higher risk of poor maternal, infant, and outcomes?
13) Do the effects of intervals differ across subgroups of the population? Are
there certain subgroups for whom effects are larger than others? 14) What are the characteristics of the women who have the intervals lengths
associated with poorer pregnancy, infant, child, and maternal outcomes?
In Chapter II we briefly review the reasons why pregnancy spacing might affect
pregnancy outcomes, infant and child mortality, and maternal morbidity and mortality,
and what the literature has found about these relationships. Chapter III describes the
setting for our study and the data and methods we use in our analyses. The next three
chapters present the results of our analyses of infant and child mortality and pregnancy
outcomes (Ch. IV), maternal mortality (Ch, V), and maternal morbidity (Ch. VI) and
discuss their implications. Chapter VII describes the characteristics of women who have
very short and very long intervals. The final chapter presents our conclusions.

4
II. WHY BIRTH SPACING MIGHT AFFECT PREGNANCY OUTCOMES, INFANT AND CHILD MORTALITY, AND MATERNAL MORBIDITY AND MORTALITY
There is limited empirical evidence on the intervening process through which
preceding/subsequent birth intervals operate to influence perinatal, infant, and child
mortality. The adverse consequences of a short interval for infant and child survival and
maternal mortality and morbidity have been attributed to the biological effects related to
the “maternal depletion syndrome” or more generally the woman not fully recuperating
from one pregnancy before supporting the next one (which, may lead, for example, to
anemia and premature rupture of membranes). (For recent literature reviews, see Conde-
Agudelo, 2004, and Dewey and Cohen, 2004.) Other mechanisms that have been
hypothesized to possibly contribute to a detrimental effect of a short preceding interval
on infant and child survival are (1) behavioral effects associated with competition
between siblings (e.g., competition for parental time or material resources among closely-
spaced siblings), (2) the inability (or lack of desire) to give a child adequate attention if
his or her birth came sooner than desired; and (3) disease transmission among closely
spaced siblings. Several of these have been discussed extensively in the literature (e.g.,
DaVanzo et al., 1983; National Research Council, 1989; Miller, 1991). Much less
attention has been given to why very long intervals might have an adverse effect; Conde-
Agudelo and Belizán (2000) provide a nice discussion about this. Note that some of
these mechanisms, e.g., maternal depletion, apply to preceding pregnancies regardless of
the outcome, though they may depend on the duration of the preceding pregnancy, while
others, e.g., competition and spread of disease, will only come into play if the preceding
child is still alive.
There are a number of reasons why there may appear to be a relationship between
pregnancy- and birth-spacing on the one hand and pregnancy, infant, child, and maternal
outcomes on the other hand without the effect being causal. For example, holding
constant the length of time between a preceding birth and the conception of the index
pregnancy, the shorter the duration of index pregnancy, the shorter will be the interval
between births. Since prematurity increases the risk of infant mortality, a shorter
gestation of pregnancy could be a reason why a short preceding interbirth interval is

5
related to infant mortality. Or interbirth intervals may be long because there is an
intervening non-live birth, and the types of women who have non-live births may also be
less healthy or give birth to less healthy children. As another example, if women who are
less careful about their own and their children’s health care tend to the ones who have
shorter intervals, an apparent effect of short intervals when no other variables are
adjusted for may actually reflect these other factors. Other possibilities are that longer
breastfeeding both improves infants’ survival chances and lengthens the intervals
following their birth. This could explain a relationship between the length of the
subsequent pregnancy interval and the survival of the child born at the beginning of that
interval.
Further review of relevant literature can be found in Chapters IV, V, and VI
ahead.

6
III. STUDY SETTING, DATA, AND METHODS
Study Setting and Data
Our study uses data from the Matlab subdistrict of Bangladesh, a poor, traditional,
religiously conservative, country in South Asia. The rural Bangladeshi subdistrict of
Matlab is well known for its Demographic Surveillance System (DSS), operated by the
International Centre for Diarrhoeal Disease Research, Bangladesh (ICDDR,B). Since
1966, the Centre for Health and Population Research of the International Centre for
Diarrhoeal Disease Research, Bangladesh (ICDDR,B) has maintained a Demographic
Surveillance System (DSS) that covers a large population (220,000 people in 2002) and
has collected data on pregnancy outcomes in two otherwise-similar areas—the
“Treatment” and “Comparison” Areas. The Comparison Area is typical of much of
Bangladesh in contraceptive practice (ICDDR,B Centre for Health and Population
Research, 2000), fertility (Mitra et al., 1994), abortion (Khan et al., 1986), and maternal
mortality (Alauddin,1986; and Khan, Jahan, and Begum, 1986). The DSS collects
information on pregnancies, births, deaths, migrations, marriages, divorces, and
household splits. Currently DSS events are collected by Community Health Research
Workers (CHRWs)1 through monthly household visits, supervised by a Field Research
Supervisor (FRS). (Until 1999, CHRWs recorded events through fortnightly household
visits and, accompanied by the Field Research Supervisor (FRS), visited the household
every six weeks to complete the DSS registration form.)
The DSS data we use to study pregnancy outcomes, and infant, child, and
maternal mortality contain information on a large number of pregnancies and births
(145,816 pregnancies and 128,328 births between 1982 and 2002), a sizable number of
infant and child deaths (around 13,556 deaths before age 5), and a considerable number
of maternal deaths (450 between 1982 and 2002). The DSS data on the timing of
pregnancy outcomes and of deaths are of very high quality because they have been
collected during regular household visits (every two weeks until 1997 and every month
since then) by trusted female community health workers.
1 These workers used to be referred to as Community Health Workers (CHWs) and are referred to as
such in much of the rest of this report.
7
Since October 1977, half of the DSS area has been exposed to the MCH-FP
intervention of the ICDDR,B, which provides better family planning and health services,
while people in the other half of the area, known as the Comparison Area, receive the
standard government services.2 In addition to the standard government Health and
Family Welfare Centres available in both areas, the Treatment Area also has ICDDR,B
sub-centres that provide maternal and child health and family planning services that are
better than those available in the Comparison Area.3 Contraceptive use, antenatal care,
child immunization, and utilization of other child health services are all substantially
greater in the MCH-FP (or “Treatment”) Area than in the Comparison Area. This has
resulted in lower fertility and mortality in the MCH-FP Area compared to the
Comparison Area. The fertility and mortality differences between the areas have become
smaller over time due to improvements in the government services, but they are still
substantial. The experimental difference in the services between the two areas allows us
to compare the effects of more intensive family planning and health services with those
of more limited services while holding other key factors constant and to see if the effects
of birthspacing differ between the two areas.
There are four health centers in the MCH-FP Area; each covers a population of
over 25,000. These centers are equipped to provide basic emergency obstetric care for
the catchment area and are posted with a trained nurse-midwife along with a paramedic.
These nurse-midwives and paramedics have been trained to provide antenatal care, treat
minor pregnancy and delivery complications, conduct normal deliveries, and refer cases
with serious complications to Matlab Hospital. At the health center, the nurse-midwife
examines the women clinically and administers simple laboratory tests. A substantial
portion of the health information is also verified by a female medical officer who visits
the center from the Matlab head office every week.
2 Married women in the Comparison Area were supposed to (but didn’t always) receive the standard
visits every two months from female welfare assistants of the government family planning program who provide counseling and supply pills and condoms. In the Treatment, or MCH-FP, Area, community health workers (CHWs) visited married women of reproductive age every two weeks to provide counseling about family planning services and to deliver injectables, pills, and condoms at the doorstep.
3 E.g., the MCH-FP Area is characterized by greater contact among clients, workers, and supervisors as well as greater availability and a broader mix of contraceptive methods than is available in the Comparison Area.
8
The data for our analyses of maternal morbidity come from the MCH-FP Area of
Matlab, which has a population of over 100,000. Since 1996, the Reproductive Health
Unit of the ICDDR,B has been collecting data on maternal morbidity from women who
visit a health center for an antenatal check-up. In the MCH-FP Area, all pregnant women
are given a card, known as the “pictoral” card, by the community health research worker
(CHRW) when their pregnancies are identified by the CHRWs during their monthly
household visits for collecting data for the DSS and also for the Record Keeping System
(RKS). The woman keeps the card and brings it when visiting the health center for
service. The card was designed to record not only service uptake information, including
antenatal check-up, delivery and postnatal check-up, but also contains behavior change
communication messages regarding, for example, pregnancy danger signs, pregnancy
planning and maternal nutrition. More information about these data is provided in
Chapter VI.
Another strength of the Matlab data for our analyses of pregnancy outcomes and
infant, child, and maternal mortality is that they cover a long period of time (early 1980s
to early 2000s) during which there have been remarkable changes in fertility and
mortality in Bangladesh. The total fertility rate declined from 6.5 children per woman in
the mid-1970s to 3.2 in 1998-2000, and the infant mortality rate declined from 100 infant
deaths per 1,000 live births in the mid-1970s to 67 per 1,000 in 1998-2002. During the
same period, the child mortality rate (1-4 years) declined from 25 per 1,000 to 6 per
1,000, and the maternal mortality ratio declined from about 5 to 3.2 per 1,000 live births
(NIPORT, Macro, JHU, and ICDDR,B, 2003). However, even though mortality rates
have fallen, their levels are still relatively high and provide large numbers of deaths for
analysis. For example, the infant mortality rate in Bangladesh in the year 2000, of 60
infant deaths per 1,000 live births, was 12 times the average in “high-income” countries,
and the under-five mortality rate, of 83 deaths before the fifth birthday per 1,000 live
births, was nearly 14 times the average in “high-income” countries (World Bank, 2002).
Moreover, our data contain information on a number of variables that may affect
birthspacing and/or mortality or morbidity, e.g., age and education of the mother,
household space (a proxy for the household’s economic status), religion, duration of the
pregnancy, contraceptive use, breastfeeding, whether the pregnancy was intended, and

9
the immunization status of children under the age of five. These may affect pregnancy
spacing, and they may also the outcomes that we consider, and, if not controlled, could
contribute to associations between birthspacing and these outcome measures. Some of
these data have been collected for the entire Matlab area, while others, at least until
recently, were only collected in the MCH-FP Area.
Methods Dependent Variables and the Samples Used for Analyses of Them Our analyses of infant and child mortality consider the following dependent
variables and samples:
early neonatal mortality: whether a live-born child died in the first week of life. This analysis uses a sample of the 125,720 live singleton births reported in the DSS. Of these, 3,631 (2.9%) died during the first week of life.
late neonatal mortality: whether an infant who survived the first week of life (n = 121,936) died in the next three weeks. Of these, 1,734 (1.4%) died during the second through fourth week of life.
post-neonatal mortality: whether an infant who survived the first four weeks of life (n = 119,718) died before his or her first birthday. Of these, 3,684 (3.1%) died during this subperiod.
child mortality: whether children who survived until their first birthday (n =110,191) died before their fifth birthday. Of these, 3,323 (3.0%) died between their first and fifth birthdays.
Because multiple births have a considerably higher risk of mortality, we exclude them
(3,043 children in all) from most of our analyses of infant and child mortality.
We also conduct an analysis where pregnancy outcome is the dependent
variable. In this analysis, the sample is 142,773 reported pregnancies that occurred
between 1982 and 2002, resulted in a singleton live birth or a non-live birth, and are
documented in the DSS data. We explain when whether the pregnancy ended with a
miscarriage (5.6%), induced abortion (3.3%), stillbirth (3.0%), or live birth (88.0%). For
this same sample we also estimate equations explaining the duration of pregnancy,
separately for pregnancies that ended with a live birth or stillbirth, a miscarriage, or an
induced abortion.

10
For our analyses of maternal mortality, the sample is 142,948 pregnancies that
occurred between 1982 and 2002, of which 363 died during pregnancy or in the 42 days
following pregnancy from pregnancy- or birth-related causes. The number of maternal
deaths in our data is considerably greater than the number that Conde-Agudelo and
Belizán (2000) consider in their widely cited study of the effects of interpregnancy
intervals on maternal mortality in Latin America, despite the fact that we have data on
only about one quarter the number of pregnancies that they considered.
Our analyses of maternal morbidity use data from the “pictoral” cards described
above and focus on complications that occurred during the third trimester of pregnancy
(170 days or more after the last menstrual period). These analyses are based on
information on women who visited health centers during their third trimester of the
pregnancy. If the woman made more than one visit during the third trimester, we
consider the last such visit. Data on maternal morbidity from the “pictoral” cards are
supplemented with data from the DSS database on maternal age, pregnancy history
(gravidity and loss of pregnancy), education of women, household space, and religion.
The DSS identifies 21,244 pregnancy outcomes in the MCH-FP Area that
occurred in the study period during which data on maternal morbidity were collected
(1996-2002). We focus on 11,122 (52.4%) of these in which the woman came to the
health center for antenatal check-up during the third trimester of the pregnancy.4 We
consider the last visit the woman made during the third trimester.
The pregnancy complications we consider are:
high blood-pressure (diastolic 90 mm Hg or greater), which is found for
3.3 percent of our observations;
anemia (clinical), which is found for 18.6 percent of our observations;
edema (clinical), which is found for 21.9 percent of our observations;
proteinuria (clinical), which is found for 4.4 percent of our observations;
bleeding (clinical), which is found for 0.5 percent of our observations;
4 Our analyses exclude 8,879 pregnancies of women who had no antenatal visits and 1,243 where the
woman visited the health center during the first or second trimester but not during the third. In Chapter VI, we explore the differences between the women who visited a health center during their third trimester of pregnancy and those who did not.

11
premature rupture of membranes (clinical), which is found for 1.5
percent of our observations; and
pre-eclampsia, which is defined as the presence of any two of the three
conditions of edema, proteinuria, or high blood pressure; this is found for
2.7 percent of our observations.
Measures of Interbirth and Interpregnancy Intervals Many previous studies of the effects reproductive spacing on infant, child, and
maternal health and survival have used data from birth histories and have considered the
interval between births – the interbirth interval – as their measure of spacing. This is
probably the appropriate measure for looking at the effect of competition from another
young child in the family. (In fact, for this to be the case, that preceding child had to
have survived to the time under consideration.)
However, the interbirth interval includes the duration of the index pregnancy,
which may have its own effect of infant and child mortality. Furthermore, in some cases
there is a non-live birth between two live births, in which case the interbirth interval will
include two (or more) interpregnancy intervals. Some of the hypotheses about why
reproductive spacing may affect maternal and infant health and survival have to do with
the interpregnancy interval. E.g., it is the interval between pregnancies (and, for live
births, perhaps after the end of intensive breastfeeding) during which the woman
“recuperates” from the preceding pregnancy. Furthermore, an intervening non-live birth
may reflect something about the mother’s health that may affect her risk of mortality
during a subsequent pregnancy or the health of her children. The diagrams below
illustrate these concepts.
1. Interbirth interval duration (IBI) = Birth date of index child - birth date of
preceding live birth
2. Inter-outcome interval duration (IOI) = Date of termination of index pregnancy -
Date of termination of preceding pregnancy (even if preceding pregnancy had a
non-live birth outcome)
12
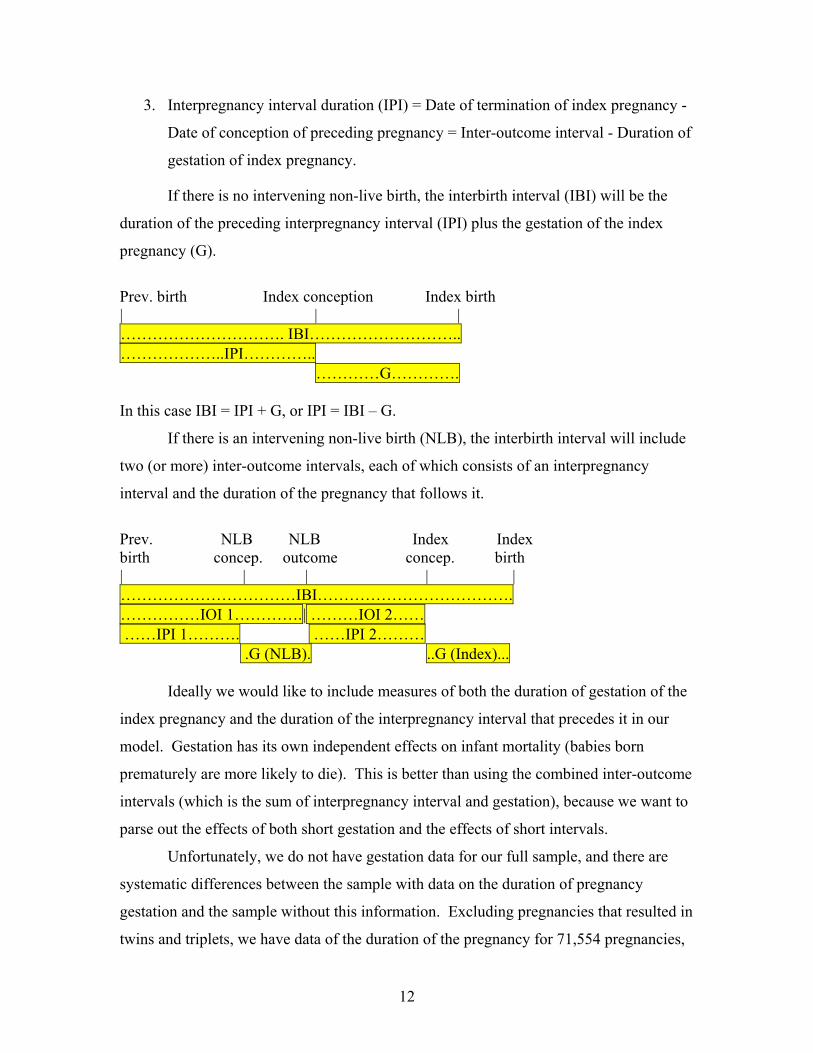
3. Interpregnancy interval duration (IPI) = Date of termination of index pregnancy -
Date of conception of preceding pregnancy = Inter-outcome interval - Duration of
gestation of index pregnancy.
If there is no intervening non-live birth, the interbirth interval (IBI) will be the
duration of the preceding interpregnancy interval (IPI) plus the gestation of the index
pregnancy (G).
Prev. birth Index conception Index birth | | | …………………………. IBI……………………….. ………………..IPI………….. …………G…………. In this case IBI = IPI + G, or IPI = IBI – G.
If there is an intervening non-live birth (NLB), the interbirth interval will include
two (or more) inter-outcome intervals, each of which consists of an interpregnancy
interval and the duration of the pregnancy that follows it.
Prev. NLB NLB Index Index birth concep. outcome concep. birth | | | | | ……………………………IBI………………………………. ……………IOI 1………….| ………IOI 2…… ……IPI 1………. ……IPI 2……… .G (NLB). ..G (Index)...
Ideally we would like to include measures of both the duration of gestation of the
index pregnancy and the duration of the interpregnancy interval that precedes it in our
model. Gestation has its own independent effects on infant mortality (babies born
prematurely are more likely to die). This is better than using the combined inter-outcome
intervals (which is the sum of interpregnancy interval and gestation), because we want to
parse out the effects of both short gestation and the effects of short intervals.
Unfortunately, we do not have gestation data for our full sample, and there are
systematic differences between the sample with data on the duration of pregnancy
gestation and the sample without this information. Excluding pregnancies that resulted in
twins and triplets, we have data of the duration of the pregnancy for 71,554 pregnancies,

13
but this information is missing for 71,218 pregnancies. Not only are gestation data not
available for the Comparison Area until recently, but also, within the MCH-FP Area, the
children of the women for whom we don’t know gestation are more likely to die during
infancy or childhood than those for whom we do know gestation. Rather than focus only
on this selected sample and lose many cases in the process, we use the approach of
considering the entire sample, including gestation for those for whom we know it and
including a missing dummy variable identifying those for whom we don’t know the
duration of gestation. We are able to show mathematically that if we include inter-
outcome intervals and gestation in the models, the estimated effect of inter-outcome
intervals would be the same as the effect of interpregnancy intervals. In particular, if the
effects of intervals and gestation are linear, the coefficient (b) for the inter-outcome
interval variable will be the same as if it were the interpregnancy interval.
IOI = IPI + G (1)
IPI = IOI - G (2)
IM = a + b (IPI) + c (G ) (3)
IM= a + b (IOI - G) + c (G) (4) (using Equation 2 for IPI)
IM= a + b (IOI) – b (G) + c (G) (5)
IM= a + b (IOI) + (c-b) (G) (6)
Where
IOI = The duration of the inter-outcome interval
IPI = The duration of the interpregnancy interval
G = The duration of gestation of the index pregnancy
IM = Infant mortality of the index birth
I.e., even though IPI refers to time between pregnancies and IOI refers to time between
outcomes, their coefficients (b) are identical.
Hence, for a linear specification, it is sufficient to use IOI (which we know for the
vast majority of our sample) instead of IPI (which we can calculate accurately only for a

14
selected sample) as long as we also control for G. Although in our empirical analyses of
infant and child mortality in Chapter IV we allow the effect of both IOI and gestation to
be nonlinear (by using dummy indicators for categories of durations), the effects we
estimate for our indicators of IOI should give us essentially the same ones we would get
if we’d used indicators of IPI as long as we also control for G. Granted, we don’t know
G for many cases, but we deal with this by including an additional control for Gestation
Unknown.
The analyses of maternal mortality assign a duration of pregnancy depending on
the outcome of the pregnancy and use this to estimate the duration of the interpregnancy
interval. In the analyses of maternal mortality and morbidity, the interpregnancy interval
is defined as the time elapsed between the woman’s last pregnancy outcome and the date
of the last menstrual period for the index pregnancy. Although conception typically
occurs at two weeks (or more) after the last menstrual period, the measure we use is the
same as that used in the recent study by Conde-Agudelo and Belizán (2000), to which we
compare our results. For calculating the interpregnancy interval, the date of the
preceding pregnancy outcome was taken from the DSS database using unique
identification number maintained by the system. These methodologies are described in
more detail in Chapters V and VI, respectively.
In our analyses of infant and child mortality, we investigate the effects of seven
categories of inter-outcome intervals:
less than 15 months between the preceding outcome and the birth of the index
child 15 months to 17 months
18 months to 23 months
24 months to 35 months
36 months to 59 months
60 months to 83 months, and
84 or more months.
15
We have chosen these categories to correspond to those used in previous studies
and those considered in the policy debate (e.g., whether to change the recommendation
that births should be spaced at least two years apart to a recommendation that the optimal
interbirth interval is three to five years), but also consider subgroups between which we
found significant differences (e.g., 60-83 months vs. 84 or more months). We have
looked at subgroups within the interval categories mentioned above (e.g., each one-year
group within the 3-5-year category), but the effects of these various subgroups didn’t
differ significantly from one another, so we have combined them.
Because of our large number of observations, we have large sample sizes for each
of the intervals we consider; these are shown below in Figures III-1 and III-2. This
allows us to look at narrower distinctions and shorter birth intervals than many previous
researchers have. For example, Cleland and Sathar (1984), Rutstein (2003), and Koenig
et al. (1990) used interval groupings that were defined as <2 years, 2-3 years, 3-4 years,
and 4+ years. Miller et al. (1992) considered shorter intervals, but only investigated a
dichotomous distinction of <15 months versus 15 or more months. Thus our analysis
provides a more detailed look at the risk associated with each interval length.
Our analyses that consider interpregnancy intervals (e.g., our analyses of maternal
outcomes) consider groupings that correspond to the above categories for full-term index
pregnancies. E.g., the shortest interval in those analyses is an interpregnancy interval less
than 6 months, which corresponds to inter-outcome interval of less than 15 months that
ended in a full-term live birth.
Our sample also includes first pregnancies, for which there isn’t a length of the
preceding interval. The analyses include a dichotomous indicator for first parity to
identify such births and adjust for the fact that first births tend to have poorer outcomes.
Our sample also includes some pregnancies for which we don’t know the length of the
preceding interval (e.g., because the preceding outcome occurred before our study period
or before the woman migrated into the study area). This group is identified by a “missing
information” dichotomous indicator.

16
Distributions of Inter-Outcome and Interbirth Intervals
Excluding pregnancies that resulted in live-born twins and triplets, there are
142,773 pregnancy outcomes in our sample. Approximately 29 percent of those are from
first pregnancies, and hence don’t have a preceding interpregnancy interval. In addition,
for 22,770 non-first pregnancies, we do not know the date of the preceding pregnancy
outcome, and hence do not know the length of the preceding inter-outcome interval. This
generally occurs because the preceding pregnancy occurred either before the study began
or because the woman migrated into the study area between the preceding and the index
pregnancy. All remaining pregnancies are associated with an interbirth and an inter-
outcome interval. The total number of interbirth intervals is smaller than the number of
inter-outcome intervals because there are fewer live births than pregnancies.
The distributions of the inter-outcome and interbirth intervals of known duration
are depicted in Figures III-1 and II-2, respectively. Of inter-outcome intervals of known
duration, 9,622 are less than 15 months in duration. As a percentage of all inter-outcome
intervals of known length this is 11.1 percent. Because interbirth intervals sometimes
contain more than one inter-outcome interval, the number (n = 3,049) and percentage
(4.3%) of interbirth intervals of known duration that are less than 15 months in duration
are considerably smaller. In all, 57 percent of all inter-outcome intervals of known
duration and 49 percent of all interbirth intervals of known duration are less than 36
months in length. Intervals of 84 months duration or longer account for 4.4 percent of
inter-outcome intervals of known duration and for 5.1 percent of interbirth intervals of
known duration.
Figure III-3 provides shows a distribution of the interpregnancy intervals among
women in the MCH-FP Area. As described above, we must know the gestation duration
in order to calculate the interpregnancy interval, so we only show the distribution for the
cases for which we have this information. Among the pregnancies for which we know
the duration of gestation, slightly over 42 percent of them were preceded by an inter-
pregnancy interval of less than 27 months, which is comparable to a three-year interval
between births for index pregnancies that last nine months. As we will see ahead, short
intervals are less common in the MCH-FP Area than in the Comparison Area.

17
Figure III-1. Distribution of Inter-Outcome Intervals of Known Duration, in Months (excluding first pregnancies and index pregnancies that resulted in twins or triplets) (n=86,752)
9.2%4.4% 11.1% 4.4%
11.6%
29.8%
29.6%
<15 (n=9,622)15-17 (n=3,805)18-23 (n=10,028)24-35 (n=25,832)36-59 (n=25,717)60-83 (n=7,973)84 + (n=3,775)
Figure III-2. Distribution of Interbirth Intervals of Known Duration, in Months (excluding first births and index births that resulted in twins or triplets) (n=71,641)
5.1%11.1%
34.7%
31.8%
10.3%
2.7%4.3%
<15 (n=3,049)15-17 (n=1,927)18-23 (n=7,361)24-35 (n=22,880)36-59 (n=24,830)60-83 (n=7,957)84 + (n=3,637)

18
Figure III-3. Distribution of Interpregnancy Intervals of Known Duration, in Months, in the MCH-FP Area (excluding first pregnancies and index pregnancies that resulted in twins or triplets) (n=38,121)
6.5%
13.5%
37.8%
22.7%
7.7%
2.8%9.0%
<6 (n=3,443)6-8 (n=1,043)9-14 (n=2,927)15-26 (n=8,647)27-50 (n=14,421)51-74 (n=5,155)75 + (n=2,475)
Methods of Estimation
For each of our dependent variables, we estimate an equation explaining the
influences on it of the length of the preceding interval, parity, and other explanatory
variables (which are described below and their means can be seen in Appendix Table 1).
We conduct sensitivity analyses to assess whether the results change depending on the
measure of intervals that we use and on which other explanatory variables are controlled.
For each of the dependent variables for infant and child mortality, we estimate a
Cox proportional hazards model explaining whether the child died during the subperiod
under consideration. This technique enables us to include censored observations in our
analyses (e.g., children who were less than 5 years old at the end of our study period or
those who migrated out of the study area before the end of the subperiod under
consideration).
When pregnancy outcome is our dependent variable of interest, we estimate a
polytomous logit regression that explains how the explanatory variables affect the

19
likelihood of a miscarriage, abortion, or stillbirth, relative to the likelihood of a live birth.
We use OLS to estimate equations explaining the duration of pregnancy.
For maternal morbidity and mortality, we estimate logistic regressions, one for
each symptom/complication considered for the analyses of morbidity.
We have data on 145,816 pregnancies to 56,511 women. We have used the
Cluster command in Stata 7.0 to adjust for the possibility of correlation among
pregnancies to the same woman. Adjusting for clustering does not affect the estimates of
coefficients, but it does alter the standard errors. In all models for which we ran models
that were both adjusted and not adjusted clustering, we did not find much variation in the
levels of significance due to clustering. Correcting for clustering never changed a
coefficient’s level of significance to a lesser level, e g., from p<.01 to p<.05. The
standard errors that we report ahead are not corrected for clustering.
We examine how the effects on each dependent variable differ across our various
interval categories and how these patterns vary across our various dependent variables.
We also assess whether the interval effects change when other covariates, which may be
correlated with both the dependent variable and external duration, are controlled. This
enables us to see the extent to which the interval effects we see when no other variables
are controlled appear to be due to differences in the types of women who have intervals
of different lengths. For example, if more highly educated women are better able to
space their births and take better care of their children, an apparent effect of short
intervals when no other variables are controlled may in part reflect differences in
education. We also use interactions to explore whether the effects of inter-outcome
intervals on a given dependent variable differ across subgroups. E.g., are the effects of
short intervals stronger or weaker in the more recent years covered by our data? Are they
stronger or weaker for the women who live in the MCH-FP Area, which has better family
planning services than the standard government services available in the Matlab
Comparison Area?
We also look at the characteristics of women in each interval category to see if
there are significant differences among those who have short- and medium-length
intervals and those who have very long intervals (which have been found to be
detrimental in several recent studies).

20
IV. EFFECTS OF BIRTH AND PREGNANCY SPACING ON INFANT AND CHILD MORTALITY AND PREGNANCY OUTCOMES
In this chapter, we describe our analyses of the effects of intervals on infant and
child mortality. First we detail the differences between the effects of interbirth and inter-
outcome intervals on mortality in different subperiods of infancy and childhood. Next we
show how the effect of a short interval on first-week mortality varies depending on the
outcome of the preceding pregnancy. Then we compare the results of our analyses before
and after controlling for potentially confounding variables. After that, we investigate
interactions between intervals and other characteristics (to see if interval effects vary
across subgroups), and we compare the magnitudes of the effects of short intervals to
those of other high-risk factors. In the next subsection, we explore whether including
breastfeeding and immunization data in the models reduces the effects of short intervals
on mortality; this analysis uses only the MCH-FP sample. Within the MCH-FP sample,
we also estimate models explaining pregnancy outcomes and gestation length. Returning
to the full sample, we run a simulation of how infant and child mortality would change if
all inter-outcome intervals were between 3 and 5 years in length. Finally, we present an
analysis that investigates the role of reproductive behaviors in explaining the mortality
differences between the MCH-FP Area and the Comparison Area. We conclude this by
discussing with the conclusions and implications of these various analyses.
Effects of Interbirth and Inter-Outcome Intervals and of Controlling for Gestation of Pregnancy on Infant and Child Mortality
In this subsection, we show the results of Cox proportional hazards models for
four subperiods of infancy and childhood: the early neonatal period (first week of life),
the late neonatal period (the second through fourth week of life), the post-neonatal period
(week five through week fifty-two), and childhood (age one year to five years). We
estimate three models for each of these subperiods some of the results are graphed in
Figures IV-1a-d. The full results are shown in Appendix Table 2a-d, and. In Figures IV-
1a-d, the model indicated by squares shows the relative risks of interbirth intervals (live
birth to live birth) of different lengths on mortality relative to interbirth intervals of three
and five years in duration. The model indicated by triangles shows the relative risks of
21
inter-outcome intervals of various lengths on mortality relative to an interval of three to
five-years. Both of these models control for no other characteristics, except for first
birth. One reason that both interbirth intervals and inter-outcome intervals may be short
is because the gestation of pregnancy may be short. Since gestation of pregnancy is
indeed strongly related to survival, we then add in control variables for the duration of
pregnancy in two-week intervals. This model is shown in diamonds in Figures IV-la-d.
As shown in Figures IV-1a-d, for all of these subperiods, the size of the effect of
short intervals decreases when the definition of interval changes from interbirth interval
to inter-outcome interval. For example, for pregnancies occurring after an interbirth
interval of less than 15 months, the relative risk of first-week mortality is 3.90 (p<.001)
compared to an interbirth interval of three to five years. When inter-outcome intervals
are considered instead, the relative risk of first-week mortality associated with an interval
less than 15 months is 2.05 (p<.001) compared to an interval of three-to-five-years. This
finding of short interbirth intervals having a higher risk than similarly short inter-outcome
intervals extends through all four subperiods of infancy and childhood. The difference
between the effect of interbirth intervals and inter-outcome intervals is largest for
neonatal mortality and is still substantial for the post-neonatal period, but it is much
smaller for child mortality. Adding a control for duration of pregnancy to the model that
includes inter-outcome intervals reduces the size of the effect of short intervals but to a
relatively small extent. For example, for babies born after an inter-outcome interval less
than 15 months, the relative risk of first-week mortality is reduced from 2.05 (p<.001) to
1.85 (p<.001) with the addition of the variables measuring the duration of pregnancy.
Short gestation of pregnancy (prematurity) increases the risk that a baby will die in the
early neonatal, late neonatal, and post-neonatal periods, though it does not have a
significant effect on childhood mortality. Very long gestation (40 weeks or more) is also
associated with an increased risk of mortality (relative to a gestation of 36-37 weeks)
during the early neonatal period.
It is noteworthy that the highest-risk interval changes as the subperiod of life
studied progresses. During the neonatal periods, the highest risk of mortality is
associated with the shortest (<15-month) inter-outcome intervals (RR=1.85, p<.001 for
early neonatal and RR=1.50, p<.001, for late neonatal mortality, in the model with

22
controls for gestation). During the post-neonatal period, the highest relative risk of
mortality is associated with inter-outcome intervals of 15-17 months (RR=1.6, p<.001 in
the inter-outcome interval model with controls for gestation). Finally, during childhood,
the highest relative risk of mortality is associated with inter-outcome intervals of 18-23
months (RR=1.44, p<.001, in the inter-outcome interval model with controls for
gestation).
Another noteworthy result is that we do find a significant detrimental effect of
very long interbirth intervals (84+ months) on first-week mortality, but we don’t see a
significant effect of long inter-outcome intervals of this length.
How Do Effects of Short Inter-Outcome Intervals Vary by the Type of Outcome of Preceding Pregnancy?
The difference between the interbirth interval and inter-outcome interval is that
inter-outcome intervals start counting from the preceding pregnancy outcome, regardless
of its type, whereas interbirth intervals start the clock from the preceding live birth. As
we show later (in Chapter VII), many of the very short inter-outcome intervals occur
among women who recently had a non-live birth outcome (i.e., the outcome that begins
the inter-outcome interval is a non-live birth). Since a preceding non-live-birth outcome
may be less depleting than a preceding live birth, both because the preceding pregnancy
may be shorter and because there was no breastfeeding, we explored for interactions
between short intervals and preceding non-live births. We find significant interactions
between the shortest inter-outcome interval and the type of the preceding pregnancy
outcome. As shown in Figure IV-2, for the shortest inter-outcome interval, if the
preceding pregnancy ended in a miscarriage or induced abortion, the effect of a short
interval on early and late neonatal mortality is substantially smaller. This may occur
because the gestation of the preceding pregnancy was shorter and less depleting than the
case for preceding live birth outcomes. We also see the effect of a short inter-outcome
interval is considerably smaller for stillbirths than for live births (though not as small as it
is for miscarriages and abortions). This may occur because for preceding live births there
is likely to be an older child “competing” with the index child, whereas this isn’t the case
23
with stillbirths.5 Also, there is no breastfeeding following a stillbirth. In the models we
describe below, we include these interactions between the shortest inter-outcome interval
variable (<15 months) and the three types of preceding non-live birth outcomes (abortion,
miscarriage, and stillbirth). Our discussions of these models focus on the effects of short
intervals that follow a live birth.
Effects of Inter-Outcome Intervals with Other Variables Controlled We now look at how the effects of inter-outcome intervals change when other
explanatory variables are controlled. The results of the Cox proportional hazards models
are shown in Appendix Table 3, and the results for inter-outcome intervals are shown
graphically in Figures IV-4a-d. The additional explanatory variables are maternal age,6
parity,7 month of birth,8 whether the pregnancy was wanted,9 residence in the MCH-FP
(Treatment) Area,10 maternal education,11 paternal education, religion,12 household
space,13 outcome of the preceding pregnancy,14 interactions between the indicator for the
shortest inter-outcome interval and the outcome of the preceding pregnancy,15 calendar
5 We have also investigated this by distinguishing previous live births that are still alive at the
beginning of the at-risk period we consider from those who have died, because only those are alive “compete”. However, we find a greater effect if the previous child died. We think that this is capturing family-level heterogeneity (mortality risk common across all children born to a woman).
6 Maternal age is coded as <17 years, 18-19, 20-24, 25-29 (reference), 30-34, and 35 and older. 7 Birth parity was categorized as 1st birth, 2nd or 3rd birth (reference), 4th –7th birth, and 8th or higher
birth. 8 Each month received its own dummy variable with December set as the reference category. 9 Unwantedness is a dummy variable with the reference category set as the baby being wanted. This
information comes from the RKS, for 84% of the women wantedness is not known. They are coded with their own dichotomous missing-value variable.
10 Residence is coded as a dichotomous variable where the Treatment Area is coded as 1 and the Comparison Area is coded as 0.
11 Maternal education and paternal education are coded as 0 years (reference), 1-5 years, 6-10 years, and 11-16 years.
12 Muslim is the reference category; Hindu or other religion is coded as 1. 13 Household space is divided into four quartiles, with the lowest quartile (smallest size house) is the
reference category. Another dummy variable is added for the houses of unknown size. 14 Separate dummy variables are included for preceding abortion, preceding miscarriage, and
preceding stillbirth; the reference category is for preceding outcome being a live birth. 15 Our rationale for including preceding pregnancy outcome is described above. We do not,
however, include the death of the preceding child by the time of the birth of the index child. We found that if the preceding live birth died before the index child was born, this increased the risk of mortality of the index child, rather than decreasing it, as the sibling competition hypothesis would suggest. I.e., only if the previous child is alive can it “compete” with the index child. Hence, if the competition hypothesis holds, we would expect the effect of a previous interval to be greater if the child born at the beginning of the interval is still alive. The fact that we find the opposite suggests that a previous child death is mainly

24
year,16 and subsequent pregnancy and birth.17 Below we also present models for the
MCH-FP Area sample that include some additional variables (breastfeeding and
immunization) that we only know women living in that area.
First-Week Mortality
Results for early neonatal mortality, seen in Figure IV-3a, show how the relative
risk of mortality during the first week of life varies by inter-outcome interval length, with
and without controls for additional potentially confounding factors. The highest risk of
mortality during this period is observed for pregnancies following the shortest inter-
outcome interval. When only the inter-outcome interval, type of previous outcome, and
interaction between previous outcome and the shortest inter-outcome are controlled, the
risk associated with the shortest interval where the previous outcome was a live birth18 is
3.67 (p<.001) times the risk of an inter-outcome interval of three-to-five years. When the
other explanatory variables that we consider are controlled, infants born after a previous
inter-outcome interval of <15 months are 3.03 times more likely to die (p<.001) than
those whose births were preceded by an inter-outcome interval of three to five years.
Hence, though reduced somewhat when other variables are controlled, the risk associated
with short intervals remains sizeable and significant. An increased mortality risk remains
present at a statistically significant level (32%, p<.05) for 15-17-month previous inter-
outcome intervals.
Although the results for the other variables are not the focus of this paper, we note
that high maternal education is negatively associated with first-week mortality and that
measuring the fact this family has a higher mortality risk for all of its children. In this case, including an indicator that the previous child died may rob other independent variables of their explanatory power, and we do not include it for this reason. This is better handled through an estimation technique that allows for mother-specific heterogeneity, an approach that we have not yet explored.
16 We consider five periods of calendar years 1982-1986, 1987-1991, 1992-1996, 1997-1999, and 2000-2002 (reference).
17 The variables for subsequent birth and pregnancy are considered only during the first through fifth year of life because this is the only time period for which they are relevant. We use the date of the subsequent live birth outcome to create a dichotomous variable indicating whether the woman had had another birth before the beginning of interval (=1) or not. For the subsequent pregnancy, we estimate the date of subsequent conception by subtracting out 274 days from the day of the outcome if it was a live or still birth. If the subsequent outcome was a miscarriage or an abortion, 91 or 61 days were subtracted, respectively.
18 As noted above, all subsequent discussion of the effect of the shortest interval will deal with the case where the preceding outcome was a live birth.
25
characteristics associated with significantly higher first-week mortality include short
gestation, first birth, young maternal age (<20 years), not being Muslim, being a male
child, and unwantedness.
Late Neonatal Mortality
Figure IV-3b shows a striking effect of adding in the controls for the confounding
factors when estimating the relative risk of mortality during the late neonatal period (i.e.,
the second through fourth week of life). The effects of short intervals become smaller
when other variables are controlled. Even with these other variables controlled, however,
the effects of short inter-outcome intervals remain statistically significant for all lengths
of previous inter-outcome intervals shorter than 24 months (p<.05) relative to the inter-
outcome intervals between three and five years long. The highest risk is again observed
for the shortest interval (<15 months). However, even for the babies born after an
interval of 24-35 months there is an 18 percent increased risk of mortality (p=.055)
during the late neonatal period relative to pregnancies preceded by a three-to-five-year
interval between outcomes.
The effects of the other explanatory variables are similar to what was observed for
first-week mortality model. Again we observe that higher maternal education is
protective against late-neonatal mortality. In addition, short gestations, first births, young
maternal age (<20 years), a December birth, and not being Muslim are associated with
higher risks of mortality during this period. The effect of the pregnancy not being wanted
does not persist at the p<.05 level during this subperiod.
Post-Neonatal Mortality
As shown in Figure IV-3c, during the post-neonatal period (between the 5th and
52nd week of life), controlling for potentially confounding variables substantially reduces
the magnitude of the inter-outcome interval effects. Even with the other variables
controlled, however, post-neonatal mortality is higher after short inter-outcome intervals.
The highest mortality risk for post-neonatal mortality is for pregnancies following inter-
outcome intervals that are shorter than 15 months. The relative risk of post-neonatal
mortality for pregnancies that have this short duration of inter-outcome interval relative
to an inter-outcome interval of three to five years is 1.80 (p<.001). Babies born after an

26
interval of 15-17 months or 18-23 months experience increased risks of post-neonatal
mortality of 78 percent (p<.001) and 52 percent (p<.001), respectively, relative to those
born after a three-to-five-year interval.
During the post-neonatal subperiod, many of the explanatory variables mentioned
above still have significant effects on mortality (first birth, maternal age, gestation length,
and maternal education). In addition, we observe that household space begins to make a
difference, with more household space, which is an indicator of higher socioeconomic
status, being associated with a reduced mortality risk. Being born in May or June is also
associated with a decreased risk of mortality during the post-neonatal subperiod relative
to being born in December. Religion does not have a significant effect on mortality
during this subperiod.
Child Mortality
As shown in Figure IV-3d, the controls for the other variables explain all of the
higher risk of child mortality at the shortest inter-outcome intervals that is seen when
other covariates are not controlled. However, we still observe increased child mortality
associated with inter-outcome intervals of 18-23 months and 24-35 months (29%, p<.01,
and 21%, p<.01, respectively) relative to inter-outcome intervals of three to five years.
During childhood, the magnitudes of the effects of inter-outcome interval length,
maternal age, and pregnancy duration on mortality are much smaller than in the previous
subperiods. This is probably because these are primarily biological variables, whose
effects are greatest shortly after birth. Instead, the magnitudes of the effects of
socioeconomic factors such as household space and maternal education have increased in
size relative to the previous subperiods. Month of birth is unrelated to mortality during
this period.
In this subperiod we also observe that the mother being pregnant by the beginning
of the subperiod increases the relative risk of mortality of the index child (RR=2.33,
p<.001). This provides evidence of an effect of a short subsequent interval on the
mortality of the index birth. The relative risk of mortality for those who had a subsequent
birth is also increased (RR=1.33); however it is not different from 1.0 at a significance
level of p=.10. There were very few women who had already given birth within one year
of having given birth to the index child. Including variables for a subsequent pregnancy

27
and subsequent birth does not reduce the size of the effect of a short preceding intervals
on mortality, however. While male newborns have a higher risk of first-week mortality
than female newborns, female children have a higher risk of child mortality than male
children.
Do the Effects of Reproductive Patterns Vary Across Population Subgroups?
We have explored whether the effects of inter-outcome interval lengths differ
among population subgroups. In particular, using interactions, we investigate whether
the interval effects differ by the mother’s age, parity, time period, maternal education,
and whether the mother lives in the MCH-FP Area. We find that the effects of intervals
do not vary significantly by any of these variables.
In results not presented here, we do find a significant interaction between the
effects of maternal age and first parity, though this interaction is only significant during
the late-neonatal period. The exponentiated coefficient on the interaction between first
parity and the woman’s age being at least 30 corresponds to a relative risk of 2.16
(p<.05). When multiplied by the large main effect of first parity (RR=1.74, p<.001) and
the modest (and insignificant) main effect of age greater than 35 (RR=1.05), we see that a
woman having a first birth at age 35 or higher has a relative risk of late neonatal
mortality of 3.9 relative to a woman in her late 20s having a second or third birth.
How Do the Magnitudes of the Effects of Short Intervals Compare to Those of Other High-Risk Factors?
Another way to assess the importance of pregnancy spacing is to compare the
magnitudes of the mortality risks associated with “high-risk” birth intervals to those for
other explanatory variables associated with a higher risk of mortality. Pregnancies that
follow inter-outcome intervals of less than 15 months have an increased risk of early
neonatal mortality that is 3.03 times that of the lowest-risk group (three-to-five-year
inter-outcome intervals). By contrast, mothers who are less than 18 years old have an
increased risk of first-week mortality of 1.75 times that of the lowest-risk age category
(25-29-year-old women). The effects of maternal education and household size are not
statistically significant for first-week mortality. In the late neonatal period, the effect of a
short inter-outcome interval remains larger than the effects of maternal age and

28
household size on mortality, but it is not larger than the effect of low maternal education.
In the post-neonatal and childhood periods the adverse effects on mortality of little
household space and no education are larger in magnitude than the effect of a short
interval.
How Does Controlling for Breastfeeding and Immunizations Alter the Estimates of the Effects of Inter-Outcome Intervals? In the analyses presented above, we were unable to control for breastfeeding and
immunizations because these variables were not available for the full DSS sample. To
the extent these variables are correlated with inter-outcome intervals, their exclusion may
bias the effects of the effects of intervals. For example, women who breastfeed may have
longer intervals, and longer breastfeeding itself promotes better infant and child health.
Because these variables are only available for the MCH-FP Area and the fact that these
variables are time-varying characteristics, we devote this separate section to an analysis
of effects of factors that we only know for the MCH-FP Area. In assessing the effects of
breastfeeding and immunizations, there is the possibility of reverse causation:
Breastfeeding may be short because a child died. And a child can only be immunized if
he or she lives long enough to be eligible for the immunization. To avoid such reverse
causation, we measure each of these variables at the beginning (or before the beginning)
of the at-risk period under consideration. Hence, we do not consider the first month of
life. But after this, we consider two subperiods of the first year of life and then two
subperiods of childhood, so that we can update our explanatory variables.
In modeling the effects of breastfeeding on mortality there is the potential for the
mother to stop breastfeeding because the child dies or because the child is ill and about to
die, rather than the reverse situation where the cessation of breastfeeding causes the
death. In an effort to avoid this problem of reverse causality, for each subperiod, we
count the number of days the mother breastfeeds up until approximately 90 percent of the
start of the interval. This is similar to the approach used by Habicht et al. (1986). As
noted above, because we can only consider breastfeeding behavior before the start of the
interval, we divided the periods we consider into several smaller subperiods to allow for
greater variation in breastfeeding behavior. The four new subperiods of interest are early

29
post-neonatal (second month to sixth month), late post-neonatal (seventh month to first
birthday), early childhood (13th-18th months), and later childhood (19th month until the
fifth birthday). There are too few individuals with immunization data during the
children’s first year of life to include this information in the models until the 13th-18th
month-subperiod. The results of these Cox proportional hazards models are in Appendix
Tables 4a-d.
Early Post-Neonatal Mortality
For the second month until the sixth month, we estimate two Cox proportional
hazards models. The first model includes all of the explanatory variables we included in
the full model above. A comparison of this model which only includes the MCH-FP
sample to the model using the full sample reveals that the magnitude of the risk of inter-
outcome intervals less than 15 months is smaller for the MCH-FP sample (RR=1.93,
p<.001) than for the full sample (RR=3.03, p<.001). The direction and general
magnitude of the effects of all the other variables are similar. The second model adds an
additional continuous variable indicating the number of days that the mother breastfed up
until day 25. Since the majority of women breastfeed in Bangladesh, the average number
of days of breastfeeding up to and including 25 days is 24.3. For those cases in the
MCH-FP Area for which we do not have breastfeeding information (n=1,734), we gave
the women an average number of breastfeeding days and included a dummy variable
indicating breastfeeding information was missing.19 The breastfeeding duration variable
indicates that there is a strong protective effect of breastfeeding (RR=0.82, p<.001, for
each additional day of breastfeeding during this period).20 The coefficients showing the
effect of inter-outcome intervals on mortality, however, do not change much when
breastfeeding duration is added into the model. For the shortest inter-outcome interval
(<15 months), including breastfeeding days in the model decreases the relative risk of
mortality associated with a short inter-outcome interval from 1.93 (p<.001) to 1.90
(p<.001).
19 Breastfeeding information is missing in the MCH-FP Area for approximately 3.1 percent of the
sample. 20 The coefficient on the breastfeeding unknown variable is very large at RR=8.55 (p<.001). We do
not have an explanation for why the 1,734 women in this unknown category have such a high risk of mortality during this subperiod and subsequent sub periods.
30
Late Post-Neonatal Mortality
For the subperiod between 7 and 12 months (or 183 to 365 days), we estimate the
same Cox proportional hazards models as above. This time the second model includes
breastfeeding duration up until 165 days after birth and a dummy for unknown
breastfeeding duration. For this subperiod, the average number of known days of
breastfeeding is 140.8 days.21
The baseline model shows that the only intervals that are associated with an
increased risk of mortality during this period are inter-outcome intervals of 18-23 months
(RR=1.99, p<.01) and of 24-35 months (RR=1.59, p<.05) relative to an inter-outcome
interval of three to five years. The coefficient on the duration of breastfeeding until the
165th day variable is statistically significant, with a RR=0.985 (p<.001) per day.
However, including the breastfeeding variables barely changes the magnitude of the
estimates of the effects of short intervals (which are RR=1.97, p<.01 for the 18-23 month
interval and RR=1.58, p<.01 for the 24-35 month interval when breastfeeding is
controlled).
Mortality between 12 and 18 Months of Life
For the subperiod of 366 days until 548 days after birth, we find an increased risk
of mortality associated with an inter-outcome interval of 15-to-17 months duration
(RR=1.94, p<.05) relative to inter-outcome intervals of 36 to 59 months. Adding controls
for the duration of breastfeeding up to 328 days and a dummy variable for the duration of
breastfeeding being unknown barely alters the relative risk of dying during this subperiod
associated with an inter-outcome interval of 15 to 17 months (RR=1.93, p<.05 compared
to when breastfeeding is not controlled).
The third model we estimate for this time period adds in dichotomous indicators
of whether the child had a measles shot by time of his or her first birthday and whether
the child had his or her first diphtheria shot by that time. The effects associated with
receiving either of these immunizations are not statistically significant at p<.10, and
adding in these immunization data to the models does not markedly affect the effect of
the 15-17 month inter-outcome interval on mortality (RR=1.99, p<.05).

31
Mortality between 1.5 and 5 Year of Age
The final models of this sort that we show are for the period between 549 days and
1,826 days after birth. The baseline model during this time period shows only one inter-
outcome interval that is associated with a statistically significant association with
mortality: The inter-outcome interval of 60 to 83 months confers a reduced risk of
mortality (RR=0.61, p<.05) relative to inter-outcome intervals of 36-59 months in
duration. For this model, breastfeeding is defined as the number of days the child is
breastfed since birth until the 493rd day. The average number of days of breastfeeding for
this measure is 390.4. That is, women, on average, breastfeed for longer than a year. As
in the other models, for those children with unknown breastfeeding duration, we set their
days of breastfeeding to the mean and include a missing-value indicator. Adding in the
variables for breastfeeding and immunization do not change the size of the effect of
previous inter-outcome intervals by much. During this subperiod, neither the effects of
breastfeeding nor of immunizations are statistically significant.
While there are theoretical reasons to expect that controlling for breastfeeding
would reduce the “effect” of short intervals on mortality, we do not find empirical
evidence to support this. We had a similar expectation that mothers who have short inter-
outcome intervals might be less likely to immunize their children, and that controlling for
immunizations might reduce the effect of short inter-outcome intervals. In fact, however,
there is no significant correlation between inter-outcome interval length and whether the
index child had an immunization by the time he or she was 18 months old (r=.0037,
p=.23, for measles immunization and r=.0018, p=.55, for diphtheria immunization).
Thus, the finding that the inclusion of immunization data does not alter the effect of the
inter-outcome intervals on mortality is not surprising.
21 Women with an unknown number of days of breastfeeding were given the average number of
days (140.8), and, as above, a dummy variable indicating breastfeeding information was missing was included in the model.
32
How Does the Duration of the Preceding Interpregnancy Interval Affect Whether that Pregnancy Results in a Live Birth? To address this question, our measure of the preceding interval is the
interpregnancy interval, since the outcome of a pregnancy is directly related to its
duration; i.e., pregnancies that end in a miscarriage or abortion are shorter than those that
end in a live birth or stillbirth. We estimated a polytomous logistic regression in which
pregnancy outcome is the dependent variable. We explain whether a pregnancy ends in
an induced abortion, a miscarriage, or a stillbirth; live birth is the reference category. The
results of this model are shown in Appendix Table 5, and selected graphical results are
shown in Figure IV-5. Relative to a live birth, short interpregnancy intervals are highly
associated with a very large increase in the odds ratio of a non-live birth outcome. The
odds of having an abortion is 10 (p<.001) times that of having a live birth when a woman
becomes pregnant within 6 months of a previous pregnancy outcome. This suggests that
many of the women who became pregnant within 6 months of a previous pregnancy did
not intend to do so and opted for an abortion to terminate the pregnancy. The odds of
having a miscarriage or a stillbirth after an interpregnancy interval of less than 6 months
are also elevated relative to having a live birth (OR=5.8, p<.001 and OR=2.3, p<.001,
respectively).
Many of the other explanatory variables have statistically significant odds ratios.
For example, unwanted pregnancies are 3.95 (p<.001) times more likely than wanted
pregnancies to end with an induced abortion and 1.56 (p<.001) times more likely to end
in a miscarriage compared to wanted pregnancies. Other things the same, high parity is
associated with a decrease in odds of abortion, miscarriage, and stillbirth, compared to
birth parity of 2 or 3. Higher maternal education (1-5 years and 6-10 years) and paternal
education (6-10 years) are associated with an increased odds of induced abortion relative
to mothers and fathers with no education. Higher maternal education is associated with a
decreased odds ratio of miscarriage or stillbirth relative to mothers with no education.
With regard to maternal age, abortions are least likely among the women aged 18-19 and
20-24, whereas they are most likely among women who are 35 or more (OR=8.74,
p<.001) compared to women aged 25-29. Miscarriages and stillbirths are both more
common among older women, and have generally decreased over time. Non-Muslim

33
women are significantly more likely to have an induced abortion (OR=1.35, p<.001)
relative to Muslim women. Abortions and miscarriages are both least likely to occur
during the month of December.
We find particularly interesting effects of the type of preceding pregnancy
outcome. Having had a preceding pregnancy end with an induced abortion increases the
risk that the current pregnancy will end with an induced abortion (OR=1.86, p<.001)
compared to if the preceding outcome was a live birth. However, if the preceding
pregnancy ended in a miscarriage or a stillbirth, the odds that the index pregnancy will
end with an induced abortion is reduced by 89% and 79%, respectively (p<.001 for both).
This may be due to the fact that women who recently had a non-live birth outcome want
to replace their loss. We find that having any preceding non-live birth outcome
significantly decreased the risk of having a miscarriage for the index pregnancy. There is
a reduction in the odds of having a stillbirth if the preceding pregnancy ended in a
miscarriage. Perhaps women who recently had a non-live birth outcome are taking
additional precautions not to lose the baby to a miscarriage or stillbirth again.
Influences on Pregnancy Duration We estimated three OLS regression models in which gestation in weeks is the
dependent variable. For these analyses, we use interpregnancy intervals (IPIs) as
explanatory variables, rather than inter-outcome intervals (IOIs), because the IOIs include
the duration of the pregnancy in the measure, which in this case is our dependent
variable. Since we consider IPIs, the sample is restricted to the MCH-FP Area—the one
for whom we have high-quality gestation data for a large portion of the sample; 93.7% of
pregnancies reported in the MCH-FP Area have known gestation. For the first model, the
sample is limited to those pregnancies that resulted in a stillbirth or a live birth. The
second model includes only those pregnancies that ended in miscarriage, and the third
model includes only those that ended with an induced abortion. The results of these
models are shown in Appendix Table 6.
There is a statistically significant relationship between short interpregnancy
intervals and gestation for live birth and stillbirths. For inter-pregnancy intervals shorter
than 6 months, for example, gestation duration is 0.31 weeks shorter on average (p<.001)

34
than for pregnancies following 27-to-50-month intervals. For inter-pregnancy intervals
between 6 and 8 months in duration, the reduction in gestation is 0.27 weeks (p<.05)
compared to pregnancies following 27-to-50-month intervals. The magnitudes of these
reductions in gestation are not very large, though they are statistically significant.
Conde-Aguldo’s (2004) systematic review of the literature on the effects of pregnancy
intervals on prematurity finds that approximately two-thirds of the studies found an
association between short intervals and preterm birth, whereas the remaining one-third of
the studies found no association. Other characteristics that relate to pregnancy duration
are month of birth (February is associated with longest gestation, and August with the
shortest), parity (higher parity decreases gestation duration), maternal education (more
education increases gestation), and maternal age (older women have shorter gestation).
For the model that includes only miscarriages, there is no evidence of a
relationship between short interpregnancy intervals and the timing of miscarriages. Older
maternal age (>34) is associated with a shorter gestation among the miscarried
pregnancies, as is a termination date in March or April.
For the sample that includes only pregnancies that end with an induced abortion,
interpregnancy intervals between 9 and 14 months are associated with earlier abortions
(0.86 weeks less than the pregnancies following intervals of 27 to 50 months, p<.05).
Surprisingly, for the pregnancies that end in abortion after very short interpregnancy
intervals (less than 9 months), there is no difference between the duration of the
pregnancy compared to those following intervals of 27 to 50 months. Women with high
maternal education (>11 years) have induced abortions that are 2.3 weeks earlier on
average than women with no education. This is probably because educated women who
have induced abortions in Bangladesh are more likely to use menstrual regulation rather
than less safe methods to terminate their pregnancies (DaVanzo et al., 2004). Menstrual
regulations (MR) are typically done earlier in a pregnancy than other forms of pregnancy
termination because MR is only legal before a pregnancy is clinically confirmed.
How Would Mortality Change If All Intervals Were 3-5 Years Long?
To illustrate the implications of our analyses, we estimate how much lower
mortality would be in each subperiod of infancy and childhood if all intervals between

35
outcomes were 3-5 years in length. We use the full sample of live births controlling for
all of the explanatory variables described above and calculate predicted hazards of dying
when the population has its actual values and then again when all of the inter-outcome
intervals are set to three to five years. We then calculate the ratio of the predicted hazard
with the optimal birth spacing and the predicted hazard of dying with the actual values
for each individual. The numbers we present in the last column of Table IV-1 are the
mean of this ratio subtracted from 1. When all inter-outcome intervals are set to three to
five years, the risk of children dying during the first week is reduced by approximately
5.8 percent. A slightly larger effect is found for the other subperiods of infancy and
childhood.22 Conditional on survival during the first week, the risk of mortality during
the second to fourth week is reduced by 9.4 percent on average when all intervals are set
to three to five years. During the post-neonatal period, if all inter-outcome intervals were
3-5 years, post-neonatal mortality would be reduced by 7.6 percent. Finally, conditional
on survival until the end of the first year, mortality during years 1-5 would be reduced by
8.7 percent, on average, if every woman had a an inter-outcome interval between three
and five years.
Table IV-1. Summary of simulation exercise in which all inter-outcome intervals are set to between three and five years
Subperiod for mortality (each is conditional on survival to the beginning of the subperiod)
Mean ratio of predicted hazard of dying when all inter-outcome intervals are set to 3-5 years to the actual hazard of dying
% reduction in the risk of mortality
Early Neonatal .942 5.8% Late Neonatal .906 9.4% Post-neonatal .924 7.6% Age 1-5 .913 8.7% 22 It may seem surprising that the first-week is the subperiod that has the lowest reduction in overall predicted hazard of mortality compared to the other subperiods of infancy and childhood. The reason for this result is that first-week mortality is higher than in the other subperiods when the preceding inter-outcome interval is less than 15 months, which occurs for only a relatively small proportion of the population. A larger proportion of pregnancies have preceding inter-outcome intervals of 18-23 months and 24-35 months. For those intervals, the subperiods of life where the relative risk of mortality is highest are the second to fourth week and ages 1 through 5. These two subperiods are the ones for which we see the largest reductions in mortality when all births are assumed to have a 3-5-year inter-outcome interval preceding them.
36
Do Differences in Reproductive Patterns between the MCH-FP and Comparison Areas Explain Why Infant and Child Mortality Rates are Lower in the MCH-FP Area?
In Figure IV-6, the line with the triangles shows the relative risks of infant and
child mortality for four subperiods of infancy and childhood for the MCH-FP Area vs.
the Comparison Area. These are based on hazard models in which an indicator for MCH-
FP Area is the only explanatory variable. We can see that the relative risks of infant and
child mortality are significantly lower in the MCH-FP Area than in the Comparison Area
of Matlab in each subperiod that we consider. During the first week of life, living in the
MCH-FP Area reduces the relative risk of mortality by 16 percent (p<.001), and during
weeks 2-4 the risk of mortality is 37 percent lower (p<.001) in the MCH-FP Area.
During the remainder of the first year of life and years 1 through 5, the reductions in
mortality associated with MCH-FP Area residence are 20 percent (p<.001) and 37
percent (p<.001), respectively.
We then add controls for the following aspects of reproductive patterns to the
hazard model: maternal age, parity, the inter-outcome interval, the type of outcome of
the previous pregnancy (i.e., whether a live birth, miscarriage, induced abortion, or
stillbirth), an interaction of previous pregnancy outcome with the indicator for the
shortest inter-outcome interval, duration of gestation of the index pregnancy, and
calendar year. Each of these variables differs between the two areas.
We illustrate this in Table IV-2 for inter-outcome intervals by showing how the
distribution of inter-outcome intervals differs between the MCH-FP Area and the
Comparison Area. Pregnancies in the Comparison Area are more likely to follow shorter
inter-outcome intervals (less than 36 months) than pregnancies in the MCH-FP Area,
while longer intervals, of 36 months or more, are likely to occur among women living in
the MCH-FP Area. A t-test reveals that the difference between the two percentages is
statistically significant (p<.001) for all interval-length categories shown. Since, as we
have shown in this chapter, shorter intervals are associated with significantly higher risks
of infant and child mortality, the difference in the distributions of interval length helps
explain the difference in infant and child mortality rates between the two areas that we
just saw in the green line (with the triangles).

37
The relative risks of mortality associated with living in the MCH-FP Area
compared to the Comparison Area when we control for all of the reproductive variables
mentioned above are shown in the line with the squares in Figure IV-6. Once these
controls are added, we cannot reject the null hypothesis at p<.05 that the relative risk of
mortality associated with living the MCH-FP Area is the same as the relative risk of
mortality associated with living in the Comparison Area. This holds true for all four
subperiods of infancy and childhood that we investigate. This suggests that the protective
effect on infant and child mortality of living in the MCH-FP Area works through altering
the reproductive behaviors of the women living in this area.
Table IV-2. Distributions of inter-outcome intervals among live births in the Comparison and MCH-FP Areas of Matlab
Comparison Area MCH-FP Area
(n=67,165) (n=58,555)
IBI<15 months 0.07 0.05***
IBI: 15-17 months 0.03 0.02***
IBI: 18-23 months 0.08 0.05***
IBI: 24-35 months 0.23 0.14***
IBI: 36-59 months (ref) 0.17 0.20***
IBI: 60-83 months 0.04 0.08***
IBI: 84 plus months 0.02 0.03*** *** Difference is statistically significant at p<.001.
Discussion and Conclusions
In this chapter we have shown that preceding short interbirth and inter-outcome
intervals are associated with higher levels of infant and child mortality and that these
effects, though reduced somewhat, persist when we control for other factors that some
researchers have conjectured might explain why such a relationship is found.
While it is true that a short interbirth or inter-outcome interval is more likely
when the gestation of the index pregnancy is short and that short gestation itself is
associated with higher mortality, the effects of short intervals persist when gestation is
controlled. They are somewhat smaller, but they are still substantial and significant.

38
Controlling for socioeconomic factors also reduces the effect of short intervals,
especially in the later subperiods of infancy and childhood that we consider.
Nonetheless, the effects of short intervals typically remain when these other variables are
controlled. We have in some of our analyses also controlled for breastfeeding and
immunizations – variables that have been conjectured to possibly account for the effects
of short intervals – and find that, while these variables do indeed affect infant and child
mortality, the sizes of the effects of short intervals barely change when these additional
variables are controlled.23 In general, as shown in Appendix 8, the effects of preceding
interbirth intervals on neonatal, infant, and child mortality that we estimate for Matlab are
very similar to those estimated in analyses of the Demographic and Health Surveys data,
such as Rutstein (2003).
The effects of short intervals are strongest in the earliest part of infancy and
decline as the child becomes older. For both the early and late neonatal periods, inter-
outcome intervals shorter than 15 months are the most pernicious. During the late
neonatal period, the effects of short intervals are smaller than they were in the first week
of life (both the absolute sizes of the relative risks and their sizes relative to those of other
factors), but they are still statistically significant for intervals of less than three years
compared to those that are longer. After the first month of life, intervals of less than 18
months are all associated with high post-neonatal mortality; and after the first year of life,
intervals of 18-35 months are the most detrimental.
We also find significant negative effects of subsequent short interpregnancy
intervals on child survival (and we explore this in such a way that it is not subject to the
reverse causality that may have biased estimates of this relationship in other studies). We
see that a child is much more likely to die during a subperiod of later infancy or
childhood if the mother become pregnant before that subperiod. Once this is controlled,
23 Breastfeeding is nearly universal in Bangladesh. In an effort to avoid reverse causality of
breastfeeding being short because children became ill and died, we only consider the duration of breastfeeding up to a short time before the at-risk interval under consideration. Nevertheless, it is possible that there is something very different about the types of women with short breastfeeding in Bangladesh. How controlling breastfeeding affects the size of the effects of short intervals should also be investigated in settings where prolonged breastfeeding is not as common.
39
we do not find, however, that actually having the birth increases the risk of child
mortality.24
The magnitudes of the risks associated with “high-risk” birth intervals are large
compared to those for other explanatory variables associated with a higher risk of infant
or child mortality, especially during the first month of life. Babies born less than 15
months after a preceding pregnancy outcome have an increased risk of early neonatal
mortality that is 3.0 times that of the lowest-risk group (three-to-five-year inter-outcome
intervals). By contrast, for the next highest-risk factor – young maternal age – we find
that mothers who are less than 18 years old have an increased risk of first-week mortality
of 1.7 relative to the lowest-risk age category (25-29 year old women). In the post-
neonatal period and childhood, the adverse effects of low socioeconomic status and no
education on mortality are larger in magnitude than the effect of short birth intervals.
We find that inter-outcome intervals are also associated with adverse pregnancy
outcomes. Pregnancies that are conceived less than 6 months after the preceding
pregnancy outcome are ten times more likely to be aborted, 5.8 times more likely to
result in miscarriage, and 2.3 times more likely to be stillborn than those that correspond
to an inter-outcome interval of three to five years. The abortion result is particularly
striking because it suggests that women care about the spacing of their births and choose
more likely to terminate a pregnancy if it occurs too closely after the previous one. This
complements the finding in other research on Matlab that pregnancies to women who
said earlier that they didn’t want more children are much more likely to be aborted
(Rahman, DaVanzo, and Razzaque, 2001).
Although there has been increased attention recently to the possible detrimental
effects of waiting too long to have the next birth, in this chapter we only see elevated
24 We have not yet (successfully) investigated the effect of cumulative short intervals to see, for
example, whether the effect of a short interval is even stronger if the women previously experienced another short interval, especially if it occurred recently. If one of the reasons for the adverse effects of short intervals is maternal depletion, a second short interval might be particularly detrimental. Nor have we done a fixed-effects (or difference-in-difference) analysis where we compare children within a family to their siblings, to see how the survival of those born after very short or very long intervals compares with that of siblings born after medium-length intervals. In concept, such an analysis could enable the netting out of the effects of unobserved factors (e.g., genetics) that are common to all of a woman’s pregnancies.
Both of these are very complicated because of the reverse causation that intervals are shorter after a child dies, both because of reduced breastfeeding and also because of an effort to replace the child who

40
mortality risks for very long intervals (seven years or longer) for early neonatal mortality
and only when we consider interbirth intervals and do not control for other factors.
Hence, long intervals do not appear to carry an additional risk for infants and children.
However, as will be seen ahead, long intervals can be associated with adverse outcomes
for women.
We don’t find any significant differences in the effects of short intervals across
population subgroups. I.e., the effects are seen in both areas of Matlab, all age groups, all
parities, all years of children’s birth, maternal education, and do not vary significantly
across these subgroups. We do find, however, that there is a strong interaction between
first parity and older woman’s age in this population. Children born to women who wait
until their thirties to have their first child have a much higher risk of late neonatal
mortality. We also see in the next chapter that they have a higher risk of maternal
mortality. This may reflect the selectivity of the type of women who don’t become
pregnant until their thirties, especially in a setting like Matlab where early marriage and a
young age at first birth are the norm. Women who have their first pregnancy at an older
age may have had difficulty becoming pregnant, and the same factors that contributed to
that difficulty might lead to poorer health outcomes for themselves and their children.
Such women merit special attention and monitoring.
Our results shed some light on the reasons why short intervals are associated with
higher mortality. As noted above, some, but relatively little, of the effect is explained by
the fact that shorter interbirth and inter-outcome intervals are associated with shorter
gestations of pregnancy. As the child ages, some of the effect of short inter-outcome
intervals that is seen in bivariate analyses is explained by socioeconomic factors that are
associated with both short intervals and higher risks of mortality.
Our results also give some credence to the maternal depletion hypothesis. We see
that short inter-outcome intervals are more detrimental when they follow a live birth or
stillbirth than when they follow a preceding miscarriage or abortion. Because of their
longer gestation, live births and stillbirths should be more depleting than miscarriages or
abortions. The effects of short inter-outcome intervals are greatest when the preceding
died. A RAND colleague, Arthur van Soest, is doing some work on how to jointly model birthspacing and neonatal mortality that may be relevant to our research.

41
outcome was a live birth. The breastfeeding that follows a live birth leads to further
maternal depletion. Furthermore, if that previous child is still alive at the time of the
index child’s birth, he or she will compete with the index child for the family’s resources
– thus lending some support to the competition hypothesis – though we have found the
interval effects are greater if the preceding live birth died than if it survived, which is not
consistent with the competition hypothesis. The depletion hypothesis is further supported
by our finding that effects are greatest for the shortest intervals (which allow the smallest
time for recuperation from the previous pregnancy) and in the neonatal period, when
physiological factors, such as maternal depletion, are most likely to play a role. The fact
that the most pernicious intervals become longer as the child ages is consistent with
competition, because children who are 2-3 years older than the index child may be as or
more competitive for the family’s time and resources as “older” siblings that are even
closer in age to the index child.
In the past, health professionals have advocated birth intervals of at least two years
in length. Our results are consistent with the findings of recent research (e.g., Conde-
Agudelo, 2002; Rutstein, 2003), from both developed and developing countries, that
shows that even longer intervals are more beneficial for the health of children and
women. Across all of the outcomes that we consider (mortality during various
subperiods of infancy and childhood, and whether the pregnancy ended in the non-live
birth), the interval length that usually has the lowest risk of adverse outcome is three to
five years relative to all shorter intervals. Even for intervals of two to three years, there is
an increased risk of late neonatal (18%) and child mortality (21%) relative to children
born after intervals of three to five years. Thus, the previously defined desired birth
interval of at least two years could arguably be increased to at least three years. Our
simulations imply that, even when a large number of mortality correlates are held
constant, if all pregnancies followed the previous one by three to five years, mortality
rates would be approximately 6-10 percent lower during infancy and childhood.
Our final analysis for this chapter reiterated the importance of improving
reproductive patterns for reducing infant and child. That analysis showed that once we
control for the differences in reproductive patterns between the MCH-FP and
Comparison Areas, there is no additional benefit of living in the MCH-FP area. Thus, it

42
appears that the success of the comprehensive MCH-FP program in Matlab in reducing
infant and child mortality rates is primarily due to in the fact that it has promoted more
healthy reproductive behaviors.
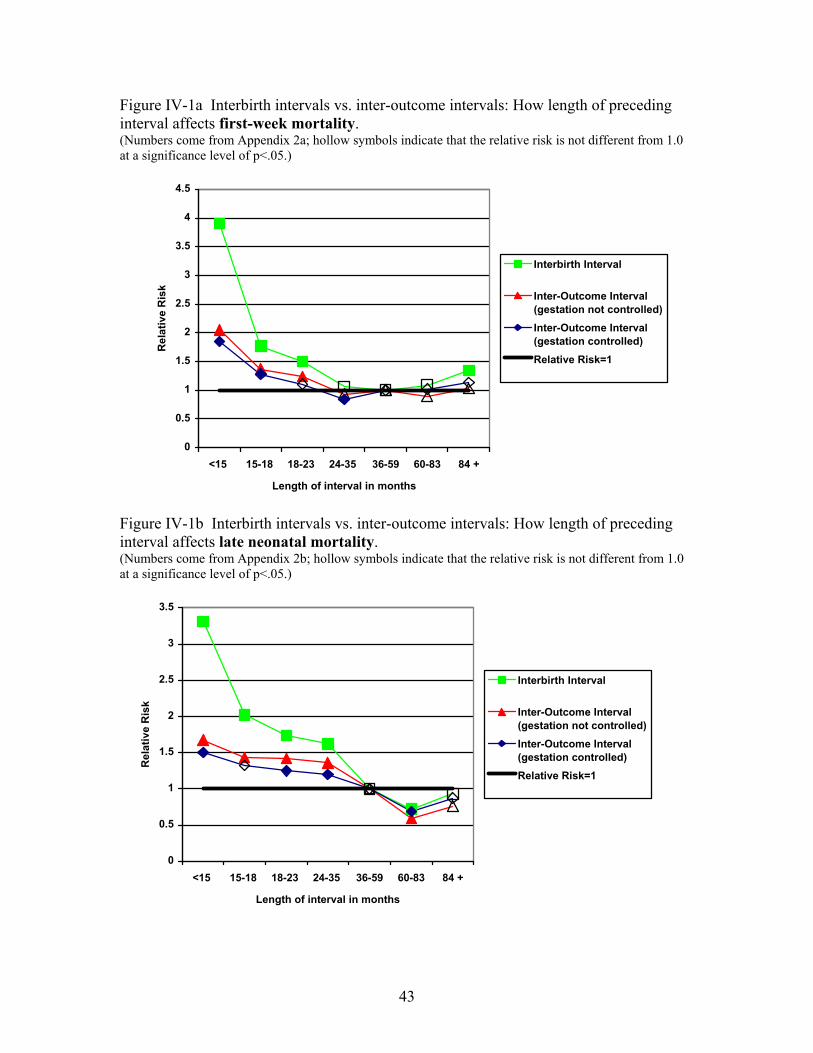
43
Figure IV-1a Interbirth intervals vs. inter-outcome intervals: How length of preceding interval affects first-week mortality. (Numbers come from Appendix 2a; hollow symbols indicate that the relative risk is not different from 1.0 at a significance level of p<.05.)
0
0.5
1
1.5
2
2.5
3
3.5
4
4.5
<15 15-18 18-23 24-35 36-59 60-83 84 +
Length of interval in months
Rel
ativ
e R
isk
Interbirth Interval
Inter-Outcome Interval(gestation not controlled)Inter-Outcome Interval(gestation controlled)Relative Risk=1
Figure IV-1b Interbirth intervals vs. inter-outcome intervals: How length of preceding interval affects late neonatal mortality. (Numbers come from Appendix 2b; hollow symbols indicate that the relative risk is not different from 1.0 at a significance level of p<.05.)
0
0.5
1
1.5
2
2.5
3
3.5
<15 15-18 18-23 24-35 36-59 60-83 84 +
Length of interval in months
Rel
ativ
e R
isk
Interbirth Interval
Inter-Outcome Interval(gestation not controlled)Inter-Outcome Interval(gestation controlled)Relative Risk=1

44
Figure IV-1c Interbirth intervals vs. inter-outcome intervals: How length of preceding interval affects post-neonatal mortality. (Numbers come from Appendix 2c; hollow symbols indicate that the relative risk is not different from 1.0 at a significance level of p<.05.)
0
0.5
1
1.5
2
2.5
<15 15-18 18-23 24-35 36-59 60-83 84 +
Length of interval in months
Rel
ativ
e R
isk
Interbirth Interval
Inter-Outcome Interval(gestation not controlled)Inter-Outcome Interval(gestation controlled)Relative Risk=1
Figure IV-1d Interbirth intervals vs. inter-outcome intervals: How length of preceding interval affects child mortality. (Numbers come from Appendix 2d; hollow symbols indicate that the relative risk is not different from 1.0 at a significance level of p<.05.)
0
0.2
0.4
0.6
0.8
1
1.2
1.4
1.6
1.8
<15 15-18 18-23 24-35 36-59 60-83 84 +
Length of interval in months
Rel
ativ
e R
isk
Interbirth Interval
Inter-Outcome Interval(gestation not controlled)Inter-Outcome Interval(gestation controlled)Relative Risk=1

45
Figure IV-2 Relative risk associated with inter-outcome interval less than 15 months compared to intervals between three and five years for each sub-period of infancy and childhood by type of outcome of preceding pregnancy. (Numbers come from Appendix 2a-d.)
0
0.5
1
1.5
2
2.5
3
3.5
EarlyNeonatalMortality
Late NeonatalMortality
Post NeonatalMortality
ChildhoodMortality
Rel
ativ
e R
isk
Previous Live BirthPrevious StillbirthPrevious MiscarriagePrevious Abortion
Figure IV-3a How length of preceding inter-outcome interval affects first-week mortality without and with controls for other variables. (Numbers come from Appendix 3a; hollow symbols indicate that the relative risk is not different from 1.0 at a significance level of p<.05.)
0
0.5
1
1.5
2
2.5
3
3.5
4
<15 15-18 18-23 24-35 36-59 60-83 84 +
Inter-Outcome Interval (months)
Rel
ativ
e R
isk
Inter-OutcomeInter-Outcome+ControlsRelative Risk=1

46
Figure IV-3b How length of preceding inter-outcome interval affects late neonatal mortality, without and with controls for other variables. (Numbers come from Appendix 3b; hollow symbols indicate that the relative risk is not different from 1.0 at significance level of p<.05.)
0
0.5
1
1.5
2
2.5
3
3.5
<15 15-18 18-23 24-35 36-59 60-83 84 +
Inter-Outcome Interval (months)
Rel
ativ
e R
isk
Inter-Outcome Inter-Outcome+ControlsRelative Risk=1
Figure IV-3c How length of preceding inter-outcome interval affects post-neonatal mortality, without and with controls for other variables. (Numbers come from Appendix 3c; hollow symbols indicate that the relative risk is not different from 1.0 at significance level of p<.05).
0
0.5
1
1.5
2
2.5
<15 15-18 18-23 24-35 36-59 60-83 84 +
Inter-Outcome Interval (months)
Rel
ativ
e R
isk
Inter-OutcomeInter-Outcome+ControlsRelative Risk=1

47
Figure IV-3d How length of preceding inter-outcome interval affects child mortality, without and with controls for other variables. (Numbers come from Appendix 3d; hollow symbols indicate that the relative risk is not different from 1.0 at significance level of p<.05.)
0
0.2
0.4
0.6
0.8
1
1.2
1.4
1.6
1.8
<15 15-18 18-23 24-35 36-59 60-83 84 +
Inter-Outcome Interval (months)
Rel
ativ
e R
isk
Inter-OutcomeInter-Outcome+ControlsRelative Risk=1
Figure IV-4 Relative magnitudes of the effects of shortest inter-outcome interval length
and highest-risk maternal age, maternal education, and housing space on infant and child mortality. (Numbers come from Appendix 3a-d.)
00.5
11.5
22.5
33.5
<15 Months Inter-Outcome IntervalRelative to 36-59Month Interval
(with NoIntervening Non-
live Outcome)
Mother Age 17 orLess Relative to
Age 25-29
No MaternalEducation Relative
to 11-16 Years
Smallest QuartileHousehold Space
Relative to LargestQuartile Household
Space
Rel
ativ
e R
isk First Week
2nd - 4th WeekRest of 1st YearYear 1 to 5

48
Figure IV-5 Odds Ratios of Effect of Duration of Preceding Interpregnancy Interval on Type of Pregnancy Outcome
(Numbers come from Appendix 5; hollow symbols indicate that the relative risk is not different from 1.0 at significance level of p<.05.)
0
2
4
6
8
10
12
<6 6-8 9-14 15-26 27-50 51-74 75 +
Interpregnancy Interval (months)
Odd
s R
atio Abortion
MiscarriageStillbirthLive Birth=1
Figure IV-6. The Effect of Living in the MCH-FP Area on Mortality Across Four
Subperiods of Infancy and Childhood, with and without Controls for Reproductive Patterns
(Numbers come from Appendix 7; hollow symbols indicate that the relative risk is not different from 1.0 at significance level of p<.05.)
0
0.2
0.4
0.6
0.8
1
1.2
Week 1Mortality
Week 2-4Mortality
Remainderof FirstYear
Years 1-5
Subperiod of Life
Rel
ativ
e R
isk
MCH-FP with nocontrols
MCH-FP with controlsfor reproductivebehaviorsRR=1 (ComparisonArea)

49
V. EFFECTS OF INTERPREGNANCY INTERVALS, THE MCH-FP PROGRAM, AND SOCIOECONOMIC FACTORS ON MATERNAL MORTALITY IN MATLAB, BANGLADESH
In this chapter, we attempt to address three sets of questions:
1. Is maternal mortality associated with the duration of the preceding interpregnancy
interval?
2. Do levels and trends in maternal mortality differ between the Treatment (MCH-
FP) and Comparison Areas of Matlab? Is maternal mortality lower in the
Treatment (MCH-FP) Area of Matlab than in the Comparison Area? Is maternal
mortality in the Treatment Area declining faster than in the Comparison Area?
3. How does maternal mortality vary with socioeconomic factors?
To answer these questions, we conduct both bivariate and multivariate analyses of
prospective data from Matlab DSS on nearly 143,000 pregnancy outcomes that occurred
during the period 1982-2002.
Background Interpregnancy Intervals and Maternal Mortality
In the demographic and reproductive health literature it has been asserted that
births that are “too” closely spaced carry a risk both for the child’s and mother’s health
(e.g., Khan et al., 1998; Miller, 1991; Winikoff, 1983; and Winkvist et al., 1992). The
authors and others propose the maternal depletion hypothesis that argues that it takes a
reasonable amount of time for a woman to recover from the physiological stresses
associated with the previous pregnancy. Repeated pregnancies in a short period can lead
to certain morbidities and nutritional deficiencies that are risk factors for own survival
and for their children’s health.
It has been clearly shown in many countries that closely spaced births
detrimentally affect child health, especially child survival (e.g., Cleland et al., 1984;
Rutstein, 2003), and we have shown this for Matlab in the previous chapter. However, it
is much less clear whether there is such an effect on maternal health (morbidity and
mortality).

50
Some studies have documented only a bivariate relationship or a gross effect of
short intervals on maternal mortality (e.g., Anandalakshmy et al., 1993; Miller et al.,
1992; and Winikoff, 1983). It was found that short birth intervals increase the risk of
maternal mortality.
Ronsmans and Campbell (1998) conducted a case-control study in Matlab,
Bangladesh, to study the relationship between the duration of the interpregnancy interval
preceding an index pregnancy (the amount of time between the preceding birth and the
conception of the index pregnancy outcome) and maternal mortality associated with that
index pregnancy. They use estimated interpregnancy intervals under three different
assumptions. They examined all 390 maternal deaths (both from direct obstetric causes
and concomitant causes) that occurred during the period 1982-93 and also 1,169
randomly selected controls from pregnancy outcomes in Matlab during this same
period.25 Logistic regressions were used to control not only for the duration of the
preceding interpregnancy interval but also for the effects of the woman’s age, her
education and religion, and her area of residence. Interpregnancy intervals were
categorized as <9, 9-14, 15-26, 27-38, and 39 and more months. They found no evidence
of a relationship between maternal mortality and the duration of the preceding
interpregnancy interval, and concluded that the widespread claim of the pernicious effect
of close birthspacing on maternal health in the literature is not substantiated. They
recommended that further analyses should consider repeated short intervals, other
socioeconomic factors, and other family-formation variables such as child death and
pregnancy loss experience. They noted that the confounding effects of these variables
could conceal the real effect of short spacing on maternal health. It is possible, however,
that their inclusion of maternal deaths due to concomitant causes may have limited their
ability to find an effect of birthspacing. We do not include such deaths in our analyses.
Ronsmans and Campbell (1998) did an extensive review of the literature, and
found that other studies, too, did not find empirical evidence of effects of birth spacing on
maternal mortality. They hypothesize that these studies, too, may have been hampered
by not being able to control for the host of confounding variables in operation in the
25 We don’t know whether they included pregnancies that resulted in twins or triplets in their
analyses.

51
relationship between maternal health, family formation, life style, reproductive outcome,
and physiological factors which may conceal the real effect of close birth spacing on
maternal mortality.
In a recent study, Conde-Agudelo and Belizán (2000) showed that both maternal
mortality and some maternal morbidity indicators are significantly associated with the
durations of interpregnancy intervals. Maternal mortality was 2.5 times higher among
women who had an interpregnancy interval of less than six months (for index
pregnancies that last nine months, this corresponds to an interbirth interval of 15 months)
than among women having an interpregnancy interval of 18-23. Mortality did not
significantly vary for other interval groups. This is the net effect of the duration of the
interpregnancy interval after controlling for the effects of maternal age, gravidity, body
mass index before pregnancy, history of miscarriage, marital status, education, and
smoking habits. Conde-Agudelo and Belizán also find that eclampsia, third-trimester
bleeding, premature rupture of membranes, puerperal endometritis, and anemia were
significantly higher among women who had an interpregnancy interval of less than six
months than for women who had an interval of 18-23 months. These findings support the
maternal depletion hypothesis indicated above; both mortality and some measures of
morbidity were significantly higher for women who had short interpregnancy intervals.
Pre-eclampsia, postpartum hemorrhage, and gestational diabetes mellitus were not
associated with short interpregnancy intervals. However, Conde-Agudelo and Belizán
find that pre-eclampsia, eclampsia, and third trimester bleeding were higher among
women who had an interpregnancy interval of 60 months or longer.
The study by Conde-Agudelo and Belizán has two important features. The
sample size is exceptionally large: over half a million women giving live births in 19
countries in Latin America and the Caribbean. However, theirs is a hospital-based study,
and the findings may not hold for populations at large, though most of the women in the
countries they study do give birth in a hospital. They consider only those women who
had live births as the index pregnancy outcome. Also, they only consider the sample of
women whose preceding pregnancy (the one right before the index pregnancy) lasted at
least 19 weeks. They exclude from their analyses all women whose preceding pregnancy
was shorter than that.

52
Maternal Survival Improvement in Bangladesh: Trends in Maternal Mortality in the MCH-FP and Comparison Areas
The maternal mortality ratio is high in Bangladesh, although it declined from over
5 maternal deaths per 1,000 live births during the 1980s to around 3 per thousand during
the late 1990s and 2000-2001 (NIPORT 2002). In Jamalpur and Tangail, two rural areas
in the middle-northern region of Bangladesh, maternal mortality ratio was around 6 per
1,000 live births during 1982-83 (Alauddin 1986; Khan et al., 1986). In Matlab, it was
between 5 and 7 per 1,000 live births during the late 1960s and early 1970s (Chen et al.,
1974) and around 5 per 1,000 during the late 1970s to mid-1980s (Koenig et al., 1988).
There has been further decline of maternal mortality to about 3 deaths per 1,000 live
births in Matlab in the early 1990s (Maine et al., 1996; Ronsmans et al., 1997). These
ratios in Matlab and in Bangladesh are roughly 8-10 times higher than what was found in
19 countries in Latin America and the Caribbean during the late 1990s (Conde-Agudelo
and Belizán, 2000). The maternal mortality ratio was about 5 and 0.9 per 1,000 live
births during the 1990s in India and Sri Lanka, respectively
(www.unicef.org/infobycountry).
It is expected that maternal mortality declines with fertility decline. Such a
decline is likely to be associated with various mechanisms of reproductive behavior and
activities of reproductive health programs. The Matlab MCH-FP project is an example.
It has been successful in increasing contraceptive use, thus reducing fertility, and in
increasing child immunization and use of diarrhoeal treatment of children, thus reducing
child mortality. The neighboring otherwise-comparable Comparison Area, which
receives health and family planning services from the regular government program,
experiences higher infant and child mortality and higher fertility than the Treatment Area
(ICDDR,B, 2003). Koenig and his colleagues (1988) found a significantly lower
maternal mortality rate, expressed as deaths per 1,000 women, in the Treatment Area
than the Comparison Area during the late 1970s and the first half of the 1980s. They,
however, found that the maternal mortality ratio, where the denominator is live births,
was similar in the two areas. The lower mortality rate in the Treatment Area was a result
of the lower birth rate leading to fewer maternal deaths. The maternal mortality ratio
more closely measures the risks associated with pregnancies, that is, how likely it is for a

53
woman to experience maternal death once she is pregnant.26 This depends on the
availability of health services for pregnant women, including delivery facilities that can
effectively tackle complications and provide live-saving procedures. During the period
considered by Koenig et al. (1988) the Treatment Area did not have different services for
deliveries than the Comparison Area.
In subsequent years, maternal mortality declined equally in both areas of Matlab.
Maine and her colleagues (1996) and Ronsmans and her colleagues (1997) found that the
principal reason for these declines was associated with women’s increased utilization of
hospitals in a nearby town for delivery and related complications. They found that in
recent years more and more women from both areas went to hospitals for delivery,
especially in cases of complications. They also found that women from villages close to
town or from those villages that have greater transport facilities were more likely to go to
hospitals and therefore had reduced their chances of dying during delivery. These
villages were both from the Treatment and Comparison Areas. It seems that maternal
mortality reduction was associated with the increased institutional deliveries that were
nearly equal in the two areas.
In recent years the MCH-FP project has made systematic efforts to increase
institutional deliveries in the Treatment Area through their sub-centers that are located in
the communities. The Community Health Workers (CHWs) disseminate information to
pregnant women on the desirability of antenatal care and of using professional medical
services during pregnancy and delivery. Women who come for antenatal care are further
counseled to come to ICDDR,B or other delivery centers for delivery and/or whenever
they encounter any problems or complications. ICDDR,B data show that institutional
deliveries have increased remarkably in the Treatment Area recently. Only a few of the
births were delivered in the ICDDR,B sub-centers in the early 1990s. Beginning in 1997
this percentage began increasing, and by 2002 it had increased to over 33 percent. (There
are no comparable data for the Comparison Area, but it is expected that it was around 5-
10 percent during this same period.) It is expected, for this reason, that we will see a
faster decline in maternal mortality in the Treatment Area than in the Comparison Area.
26 The best measure of this, and the one we consider in our analyses, is to use pregnancies, rather
than live births, as the denominator.

54
Socioeconomic Status and Maternal Mortality
No studies in Bangladesh have attempted to systematically examine the
association between maternal mortality and women’s socioeconomic characteristics. In
the past when health infrastructures were not very developed in rural Bangladesh, when
delivery services were not adequately available, when the transportation network was in
its infancy, and moreover, when people were not very conscious about availing
themselves of institutional facilities for childbirth, we would expect that maternal
mortality may not be associated with socioeconomic status. In the last 20 years,
however, Bangladesh has made remarkable progress in education, especially women’s
education, urbanization, and roads and transportation (Caldwell et al., 2000). Increased
rural-to-urban movement and migration and mass communication have made people
more conscious about using modern facilities for health care. Cash flow has increased
with economic improvement associated with more jobs both inside the country and
outside. There are more educated women, and men who are more likely to be health
conscious.
The 2001 Bangladesh Maternal Health Services and Maternal Mortality Survey
(BMHSMMS) cross-tabulated maternal mortality ratio by an economic indicator and by
women’s education and found no significant association (NIPORT, 2004). However, that
study used retrospective data on maternal mortality. One should exercise caution in using
such data, since there may be considerable under- or misreporting of deaths. In a study
that collected prospective data on pregnancy outcomes and associated mortality over a
period of one year in the early 1980s in a rural sub-district of Bangladesh, Alauddin
(1986) observed that better-off families tended to have a higher maternal mortality ratio
than others.
Methods and Procedures
We analyze maternal mortality for a sample of 145,989 pregnancy outcomes that
occurred in Matlab during the period 1982-2002. Our data cover both the Treatment and
Comparison Areas of Matlab.

55
Dependent Variable
Maternal mortality is the dependent variable in this study. We matched death
records with the pregnancy outcomes through the unique identification number of DSS.
We consider all pregnancy outcomes except those that resulted in multiple outcomes
(twins and triplets). We exclude pregnancies that resulted in multiple outcomes mainly
because these outcomes carry a special risk of maternal deaths that should be studied
separately.27 There were 3,041 twins and triplets that are excluded.
The cause of death in DSS is classified under the ICD code recommended by the
World Health Organization. Through regular DSS activities, each death undergoes a
verbal autopsy to identify cause of death. A Health Assistant registers each death in the
DSS area in a form and describes the signs and symptoms of the deceased prior to death.
Other relevant situations that may be related to the death are also described in the form.
Based on the description, a trained medical assistant under the supervision of a committee
of physicians classifies the death according to the ICD code. During the process of
classification, the medical assistant may send the death form to the Health Assistant to
collect further information that may help make a proper diagnosis of the cause of death.
Several codes of death are associated with direct or indirect maternal death. This
approach of classification of death began in the early to mid-1990s.
A female death during pregnancy or within 42 days of delivery is considered to be
a maternal death. Using the ICD classification, we determine whether the death was due
to direct or concomitant causes. An example of the former is a death during delivery due
to eclampsia, whereas an example of the latter is an accidental death during pregnancy.
We consider only direct causes in this study because of our main objective of
examination of the relationship between interpregnancy interval and maternal mortality.
27 We consider 138 women who died during pregnancy. We don’t know whether they were
carrying multiple fetuses.

56
In the DSS, there is little likelihood of underreporting of maternal mortality,28 but
there is the possibility of misclassification of cause of death in general and maternal death
in particular. We made an effort to see whether there were any misclassifications. A
senior project staff member reviewed death forms for all females who were aged 15-49 at
the time of death. In order to determine whether a female death is a maternal death, we
looked to see if there was a pregnancy outcome or if the deceased was pregnant prior to
death. DSS data permit an investigation of these conditions. If one of these conditions
was found, descriptions of circumstances of the death and signs and symptoms of
associated morbidity were further checked and reviewed to see if the classification was
properly done. Following this algorithm, we decided to reclassify the cause of death of
23 deaths from other causes to maternal death. In all, we have a total of 450 maternal
deaths, of which 174 died during pregnancy (Table V-1). There were 125,720 live births,
4,310 stillbirths, 8,047 miscarriages, and 4,697 abortions.
The classification of deaths that occurred during 1988-2002 is obtained through
the procedure we describe above. Our maternal mortality data for the period 1982
through 1987 come from the study conducted by Koenig and his colleagues (1988). See
Koenig et al. (1988) for detailed descriptions of the death classifications used in their
study.
The 174 women who died during pregnancy do not have pregnancy outcomes,
and therefore these were not recorded as pregnancy outcomes in the DSS. We
constructed records for those pregnancies to include in our maternal mortality database.
We also collected relevant information on them from various relevant DSS data files.
Table V-1 shows the number of maternal deaths that occurred during pregnancy,
6 days after the end of the pregnancy, and 7-42 days after the end of the pregnancy,
separately for deaths due to direct causes and those due to concomitant causes. Our study
focuses on the 363 maternal deaths due to direct causes. Of these, 38 percent occurred
during the pregnancy, 39 percent within a week of the end of the pregnancy, and 23
percent occurred 7-42 days after the end of the pregnancy. Deaths due to concomitant
28 It is highly unlikely that the death of an adult will not be reported in the Matlab DSS. Death of a
DSS resident occurring outside of DSS area is also reported, leaving very little chance of under-reporting deaths.

57
causes were less likely to occur within a week of the end of the pregnancy and more
likely to occur 7-42 days afterward than those due to direct causes.
Independent Variables
The length of the interpregnancy interval preceding the pregnancy outcome under
consideration is the variable of main interest in this study. The duration of the
interpregnancy interval is the amount of time between the preceding pregnancy outcome
and the date of conception of the index pregnancy. This interval can be calculated from
DSS data for the entire study period in the Treatment Area but only for the years 2000-
2002 in the Comparison Area. The onset of a pregnancy can be estimated from the date
of a woman’s last menstrual period, which has been recorded as part of women’s
reproductive history in DSS since 1978 in the Treatment Area and since 2000 in the
Comparison Area. In order to include the interpregnancy interval variable for areas all
observations, we estimated the interval under certain plausible assumptions. We first
calculated the interval between the occurrence of the preceding pregnancy outcome and
the occurrence of the index pregnancy outcome (i.e., the inter-outcome interval) for both
areas. We then subtracted 8, 7, 4, and 2 months from this interval to estimate the
interpregnancy interval for index outcomes of live birth, stillbirth, miscarriage, and
abortion, respectively
The number of cases that have missing inter-outcome intervals is fairly large
(n=27,076) and represents about 19 and 25 percent, respectively, of all and all non-first
pregnancies that are included in the analysis (Table V-2). These cases are mostly from
those women who migrated into the DSS area after having one or more pregnancies
elsewhere. The DSS does not collect information on the dates of pregnancies that
occurred prior to migration. Women whose preceding interval is missing tend to have
higher mortality, suggesting a selectivity effect (Table V-2). However, after controlling
for the effects other variables in the logistic regression, we find that women with missing
intervals do not have significantly higher mortality than others (Table V-7).
In order to see how close the estimated intervals are to the actual intervals, we
compared the distributions of estimated and actual intervals in the Treatment Area. The
actual duration of the interpregnancy interval is calculated by subtracting the date of

58
preceding pregnancy outcome from the date of last menstrual period. We found that the
distributions of actual and estimated intervals were comparable. We also compared
maternal mortality ratios by interpregnancy interval, both for estimated and actual
intervals, and found that the ratios are comparable. Furthermore, we estimated a logistic
regression equation with all of the explanatory variables shown in Table V-7 and found
very similar results. We recognize that women typically conceive two weeks (or more)
after the last menstrual period, and hence the date of the last menstrual period is not the
same at the date of conception. However, the measure that we use, the amount of time
between the preceding pregnancy outcome and the last menstrual period before the
conception of the index pregnancy, is the same as that used by Conde-Agudelo and
Belizán (2000).
In calculating the interpregnancy interval, we take into account the fact that if the
preceding outcome was an induced abortion (which is performed on an average at two
months of gestation), the length of the interpregnancy interval following this abortion
may not necessarily have an adverse physiological effect on maternal mortality because
the women were not pregnant for long. Therefore, if the outcome immediately preceding
the index pregnancy was an induced abortion, we calculated the duration of the preceding
interpregnancy interval as the amount of time between the index conception and the
pregnancy outcome before the abortion.29 We also calculated the interpregnancy interval
as the amount of time between the preceding outcome and the index conception,
regardless of type of outcome, and we have also conducted the analyses excluding
women whose previous outcome was an induced abortion. The effects of interpregnancy
intervals on mortality were nearly the same for each of these three approaches.
Methods of Analysis
We examine bivariate variations in maternal mortality per 1,000 pregnancies by
the duration of the interpregnancy interval, woman’s age, her gravidity, her experiences
of child death and pregnancy loss (through abortion, miscarriage, or stillbirth) prior to
this pregnancy, her education, household space as indicator of economic conditions,
religion, and for four time periods – 1982-87, 1988-92, 1993-97, and 1998-2002. We
29 Conde-Agudelo and Belizán (2000) also are concerned about this issue. They exclude from
their analyses women whose preceding pregnancy lasted less than 20 weeks.

59
then estimate a logistic model to see if the relationships of these variables with maternal
mortality changes when the others are controlled.
The categorization of interpregnancy intervals that we analyze is based on the
following two considerations: (1) We want to compare our maternal mortality results
with those of Conde-Agudelo and Belizán (2000); and (2) we want our categories to be
comparable with commonly used interbirth intervals such as less than two years, 2-3
years, 3-5 years, and more than five years.
Results Bivariate Analyses
Table V-2 and Figure V-1 show the likelihood that a pregnancy will end in a
maternal death by the duration of the preceding interpregnancy interval. Table V-2 also
shows this likelihood for first pregnancies. There is a U-shaped relationship between
maternal mortality and the duration of the interpregnancy interval. The lowest
probability of maternal mortality is observed for the 27-50-month interpregnancy
intervals (which, for full-term pregnancies, corresponds to an interbirth interval of 36-59
months, or 3-5 years). Compared to interpregnancy intervals of 27-50 months, risks of
maternal mortality are higher for interpregnancy intervals shorter than 27 months,
especially for those with intervals less than 6 months. For example, the odds of mortality
is 58 percent higher among women who had a conception within six months of the last
pregnancy outcome compared to women who conceived after a period of 27-50 months;
however, this difference is not statistically significant. Mortality risks are also higher, in
fact the risk is the highest of all interval lengths we consider, for very long intervals. The
mortality risk is more than double for women who waited for more than 75 months after
the previous pregnancy outcome to conceive again (which corresponds to a birth interval
of more than seven years for full-term pregnancies) compared to women with an
interpregnancy interval of 27-50 months. This difference is statistically significant
(p<0.05). We also observe that mortality risks are higher for first pregnancies (p<0.001)
and for women whose previous interval length is unknown (p<0.001) than for women
with two or more pregnancies and an interval of 27-50 months.

60
Conde-Agudelo and Belizán (2000) also observed a harmful effect of long
intervals on maternal morbidity (pre-eclampsia and eclampsia) but not on maternal
mortality. In interpreting such an association, they comment that the physiology of a
woman having pregnancy after a long interval seems to behave like that of a woman who
is pregnant for the first time. In our data the risks of mortality are indeed very similar for
women with the first pregnancies (3.66 maternal deaths/1,000 pregnancies) and those
whose pregnancies are preceded by an interval of 75 months or more (3.83/1,000).
In Table V-3 we examine mortality rates cross-tabulated by mother’s age and
gravidity. (Total number of cases is smaller in Table 3 than in Table 2 because of
missing values.) Such an examination can indicate the influence of repeated pregnancies
in short intervals. Consistent with previous studies in Matlab and Bangladesh, we see
that both age and gravidity have a U-shaped relationship with maternal mortality.
Women with first pregnancies had higher mortality risks regardless of age than
women with higher-order pregnancies. Ages 20-24 seem to be safest ones to have the
first pregnancy in Matlab, in that the risk of maternal mortality is lowest for this age
group. Holding constant gravidity, the risk of maternal mortality generally increases with
age beyond age 29. This is especially true for first pregnancies. Women who don’t have
their first pregnancy until their 30s or 40s may have health problems that both made it
more difficult to conceive and increased their risk of maternal mortality. For first
pregnancies, teenagers also have higher risks of mortality than women aged 20-29. In the
marginals by age, we do see higher risks for teenagers, but these seems to largely reflect
the effect of age for first pregnancies as well as the fact that teenagers have a higher
incidence of first pregnancies (which have a higher risk of maternal mortality) than older
women.
Comparing mortality rates for different gravidities within the same age group may
yield insights about the effects of pregnancy spacing. For example, for women aged 25-
29, pregnancies will be more closely spaced for women who have 7-8 pregnancies than
for those who have 5-6 pregnancies if they began childbearing at the same age. In almost
all age groups, there is a tendency for mortality to increase with gravidity, though the rate
of increase is not large. This relationship is consistent with the relationship we observe in
61
Table V-2 between the duration of the interpregnancy interval and the likelihood of
maternal mortality.
In Table V-4, we examine the relationship between maternal mortality and a
woman’s previous experience of child deaths and pregnancy loss. These variables are
likely to be correlated with a woman’s own health status, her health-related behavior,
family environment, and others aspects that influence the overall health of a woman and
her children. We observe in the table that both prior child deaths and pregnancy loss are
risk factors for maternal mortality. The likelihood of maternal mortality was 35 percent
(p<0.05) and 83 percent (p<0.01) higher among women who had one and two or more
child deaths, respectively, prior to the index pregnancy compared with those with none.
Maternal mortality was nearly 60 percent higher (p<0.05) among women who had two or
more prior pregnancy losses through miscarriage, stillbirths, or abortion compared to
women with no previous pregnancy losses. Women with only one pregnancy loss do not
seem to have higher risk of mortality than those with no previous pregnancy losses.
In Table V-5, we observe that maternal mortality is negatively associated with the
woman’s and her husband’s education and with their household space. Women who have
1-5 years of schooling have a 20 percent lower mortality risk than their counterparts with
no schooling (p<0.10). Women with 6-10 years and 11 or more years of schooling had
45 percent (p<0.05) and 43 percent (NS) lower risks of mortality, respectively, than
women with no schooling. Similarly, women had 29, 40, and 43 percent lower risks of
mortality, respectively, if their husbands have 1-5 years or 6-10 years, or 11 or more
years of schooling compared to women whose husbands have no schooling. These
differences in mortality are significant at the 1%, 1%, and 10% levels, respectively.
Women from the “High” household-space group had 35 percent lower mortality than
those in the “Low” group (p<0.05). Mortality in other household-space groups was
similar to that in “Low” group. Non-Muslims, who are mostly Hindu, had slightly but
insignificantly higher (7%) mortality than Muslims.
Table V-6 and Figure V-2 show that the risk of maternal mortality is always lower
in the Treatment Area of Matlab than in the Comparison Area, and that mortality has
generally declined in both areas, but the decline is faster in the Treatment Area,
especially in the more recent years that we consider. In regards to differences between
62
two areas, risks of maternal mortality were 21-25 percent lower in the Treatment Area
than the Comparison Area during the period 1982-1997. During the later period of 1998-
2002, mortality risk was 43 percent lower in the Treatment Area than Comparison Area.
In both areas, over the 1982-2002 period that we consider we see the highest
probability of maternal mortality in 1982-87 and the lowest in 1998-2002 (Table V-6 and
Figure V-2). This difference is significant at the 0.001 level. However, in both areas,
maternal mortality is higher in 1993-97 than in 1988-92, but the difference was not
significant. The increase in maternal mortality between the 1988-92 and 1993-97 periods
may be due to an improvement in the classification of maternal deaths around 1993
(which was mentioned above in the Methods section).
Multivariate Analyses
Table V-7 shows odds ratio estimates from our logistic regression analysis. When
the other explanatory variables that we consider are controlled, we do not find any
evidence that women are at significantly higher risk of mortality following a short
interpregnancy interval. The risks associated with shorter intervals seen earlier in Table
V-2 are each reduced somewhat when other explanatory variables are controlled.
However, women with interpregnancy intervals of 75 months or more (which, for full-
term pregnancies, correspond to interbirth intervals of seven years or more) have more
than two times risk (p< 0.05) of maternal mortality compared to those with
interpregnancy intervals of 27-50 months. The differences between our estimates of the
effects of intervals with and without controls are illustrated in Figure V-3. We explored
whether the effects of intervals on maternal mortality varied between the MCH-FP and
Comparison Areas or by age, education, and the other explanatory variables that we
consider, but we did not find any significant interactions.
Maternal mortality is generally positively associated with the woman’s age after
age 24. The risk of maternal mortality is significantly greater for women aged 25 and
older compared to those aged 20-24, and this risk increases especially after age 30. There
is no evidence that teenagers have higher risks of maternal mortality than their older
counterparts. As mentioned above, the higher mortality observed among teenagers in the
bivariate analysis largely reflects the fact that first pregnancies that have high risks of
mortality, and most of the pregnancies that occur before age 20 are first pregnancies.

63
(For example, in our data, 77, 33, and 6 percent of pregnancies were first pregnancies in
age groups <20, 20-24, and 25-29, respectively.) After controlling for the effects
gravidity and other variables, we see that teenagers and 20-24-year old women have
similar mortality risks. This finding does not support the commonly believed hypothesis
that having a birth before the age of 20 years puts a woman at the risk of her own life.
In the bivariate analysis, mortality risks steadily increase with gravidity,
especially after the third pregnancy. Within an age group, we also observe similar
results. The multivariate regression results of the gravidity-mortality relationship are
puzzling because mortality risk decreases with gravidity, and women with eight or more
previous pregnancies are likely to have significantly lower risk of mortality than others
(Table V-7). The common belief is that mortality would increase with gravidity. There
weren’t strong effects of high gravidity in Table V-3 either. It may be that high gravidity
is associated with other variables that we control in Table V-7. One interpretation of
observed gravidity and maternal mortality relationship is that healthier women who have
lower risks of mortality are likely to be more fecund and to have higher number of
pregnancies. This is a standard reverse-causality explanation of the relationship.
We find even stronger effects of prior child deaths and pregnancy losses in the
logistic regression than in the bivariate analysis. Women who lost one and two or more
children to death had 64 and 83 percent higher risks of maternal mortality, respectively,
than those women whose children did not die. Again, women who had lost one
pregnancy or two or more pregnancies through abortion, miscarriage, or stillbirth had 28
(not significant) and 91 percent (p<.01) higher risks of mortality than those women who
did not have a previous pregnancy loss. As we mention above, these two variables might
reflect the effects general health conditions of the mother influenced by her personal,
family, and environmental circumstances.
Woman’s education has been found in other studies to be a strong determinant of
many different measures of health behavior and health outcomes. We find here that a
woman’s education and her risk of maternal mortality are negatively associated. In the
bivariate associations in Table V-5, the odds ratios of maternal mortality decline nearly
monotonically as education increases. In the multivariate analyses (Table V-7), however,
we observe a significant association only at 10% level and only for the education

64
category 6-10 years of schooling. In results not reported here, women’s education is
negatively and significantly (p<0.05) associated with maternal mortality when entered as
a continuous variable in the logistic regression otherwise like those shown in Table V-7.
We observe a four-percent reduction of mortality for each year of schooling.
Discussion
We analyze prospective data from Matlab DSS on maternal mortality among a
large number of pregnancies during 1982-2002 to investigate the relationship between the
length of the interpregnancy interval that precedes an index pregnancy and maternal
mortality associated with that pregnancy. We use DSS records on pregnancy outcomes to
construct measures of interpregnancy intervals and maternal mortality. Our data on the
latter are unlikely to suffer from the underreporting usually encountered in data on
maternal mortality. Also, our data on maternal mortality, coming from frequent
prospective data collection in an entire population, rather than, say, only deaths occurring
in a hospital or relatives’ reports of women’s deaths, are likely to cover a more
representative sample than those used in many previous studies. The sample size is also
large. Our study has more deaths than Conde-Agudelo and Belizán (2000) have in their
study of over half a million live-birth deliveries in Latin America and the Caribbean.
We find suggestive evidence, based on bivariate analysis, that there may be a
relationship between interpregnancy interval and maternal mortality. A woman with
interpregnancy intervals of less than six months (equivalent to an interbirth interval of
less than 15 months for full-term pregnancies) has around a 60 percent greater chance
(statistically insignificant) of maternal mortality than a woman with an interpregnancy
interval of 27-50 months (which, for full-term pregnancies, corresponds to an interbirth
interval of 36-59 months, or 3-5 years). This greater risk, however, reduces to 30 percent
(statistically insignificant) when we control for the effects of demographic,
socioeconomic, and programmatic variables. This finding of no significant relationship
between short intervals and maternal mortality is consistent with that found in Matlab by
Ronsmans and Campbell (1998), who did a case-control study and controlled the effects
of other relevant variables.

65
We find that an interpregnancy interval of 75 months or longer (equivalent to an
interbirth interval of seven or more years for full-term pregnancies) is pernicious to
maternal health. Maternal mortality is two times higher for such long intervals compared
to interpregnancy intervals of 27 to 50 months. The higher risk of maternal mortality we
find for such very long intervals is consistent with Conde-Agudelo and Belizán’s (2000)
finding that such intervals are associated with higher levels of pre-eclampsia, eclampsia,
and third-trimester bleeding. The analyses of maternal morbidity presented in the next
chapter of this report show that the incidence of pre-eclampsia and high blood pressure is
around two times (and significantly) higher among women with interpregnancy intervals
of 75 or more months than those women with 27-50 month intervals. Based on this
result, a message to a woman who has already been pregnant before and wants to be
pregnant again may be that, for the sake of her own health, she should not wait for more
than six years to become pregnant again.
However, it is possible that this effect is not really a causal effect of long
intervals, but instead that a long interval is itself a reflection of poor maternal health. A
woman in poor health may have difficulty becoming pregnant, and this may lead to a
very long interpregnancy interval. The incidences of malnutrition, anemia, reproductive
tract infections, and other maternal morbidities, alone or in combination with other
illnesses, are high in Bangladesh, as they are in many developing countries. It is quite
possible that women with these conditions develop sub-fecundity, and thus those women
who want to have an additional child may take a long time to conceive. We find that
morbidity incidence was high among women with very long intervals, supporting our
hypothesis. Some studies (not ours, however) have observed an elevated risk of infant
and child mortality for such long intervals. This might also be explained by such a
health-effect mechanism. In our data, three percent pregnancies were with such long
interval of 75 or more months, or seven years of equivalent interbirth interval. Further
research is needed to see if there is a relationship between long interpregnancy intervals
and health conditions.
Maternal mortality risk is similar among teenagers and women aged 20-24 years,
once the effects of gravidity and other variables are controlled for. It is widely believed
in the field of reproductive health that teenage motherhood is detrimental to childbearing

66
including maternal mortality and infant and child mortality. With prospective good-
quality data with large sample size, we find that this not the case for maternal mortality in
Matlab. Our infant and child mortality analyses show that the detrimental effect of
teenage motherhood is limited to the first year of a child’s life.
Maternal mortality risk increases sharply with age after age 30 and thus our
findings strongly suggest that being “too old to have a birth” is detrimental to maternal
survival. This has strong programmatic implications in Bangladesh. Because of early
marriage and childbearing, most women achieve their desired family size, which
averages 2.5 children, before age 30. During the ages 30-49, women on average end up
with about one excess child. This is mainly due to inadequate accessibility to
contraception. Contraceptive method choice in Bangladesh is heavily skewed towards
spacing methods such as pills, injectables, and condoms and traditional methods.
Women who have already achieved their desired family size continue to use these
spacing methods, which have high rates of use-failure and/or discontinuation associated
with side effects. Permanent contraceptive methods or longer-term methods that are
appropriate for limiting fertility are, unfortunately, not popular in Bangladesh. Many
women thus encounter unintended pregnancies. Some abort their pregnancies, and others
end up with a live birth leading to excess births. In other research, we show that abortion
sharply increases with a women’s age (Rahman, DaVanzo, and Razzaque, 2004). Strong
family planning behavioral change communication (BCC) activities coupled with quality
services should be designed to have a balanced contraceptive method mix in which more
and more couples will adopt permanent and longer-term methods for limiting purposes.
This can help reduce the incidence of childbearing beyond age 30 and thus reduce
maternal mortality.
There is, however, a group of women who, because of poor health and adverse
circumstances, find it difficult to become pregnant and then have a live birth. They
continue to try to conceive in the hope of having children. We gave an example above of
how women may have very long birth interval associated with poor health. These
women need help from health programs.
We do not find any evidence that the risk of mortality increases with gravidity.
This does not support the popular belief that having too many children is a risk factor for
67
maternal mortality. Together, our findings do not support the popular understanding that
too young motherhood, too short a birth interval, or too many pregnancies are detrimental
to maternal health. We do find that first pregnancies carry an extra health risk for both
mothers and children. For mothers and the late neonatal period of infancy, this is
especially true for older women. Older women who are pregnant for the first time should
be carefully monitored.
We find, like previous studies, that maternal mortality has been declining in
Matlab. Previous studies found that the decline was similar in Treatment and
Comparison Areas. We find with data from more recent years that the decline in
maternal mortality has been greater in the Treatment than in the Comparison Area in
more recent years. This greater decline in the Treatment Area is associated with greater
use of hospital services for delivery during this period. As mentioned above, over one-
third of deliveries in the Treatment Area took place in ICDDR,B hospitals, which can
tackle complications, provide caesarian sections, and have a strong referral system to
higher-level facilities. In contrast, hospital delivery continues to be less common in the
Comparison Area. An implication is that institutional deliveries should be promoted to
reduce maternal mortality in Bangladesh. Bangladesh has a large government-managed
health infrastructure. The infrastructure includes many facilities that provide deliveries
and are well equipped to manage pregnancy complications and perform caesarian
sections. All 64 districts of the country have emergency obstetric care facilities; there are
a number of other special facilities for emergency obstetric care; and there are a number
of teaching hospitals. There are over 400 Thana Health Complexes at the sub-district
level that provide delivery and complications management but do not have facilities for
doing caesarian sections. However, there is a system of referral from the sub-district to
district level that inhibits use of these facilities. Numerous private clinics have been
established in recent years around the country that provide deliveries including caesarian
sections. Unfortunately, less than 10 percent of deliveries in Bangladesh take place in
such facilities, and many facilities are underutilized. A strong behavior change
communication (BCC) program can promote the idea of giving birth at a hospital. People
now have greater mobility between villages and towns; road network and transport have
greatly increased; health consciousness is steadily increasing through increased education

68
and mass media; women’s education is dramatically increasing; and, moreover, economic
conditions are steadily improving. All these can work synergistically to increase
institutional deliveries in Bangladesh if an appropriate BCC program can be launched
effectively. In rural Bangladesh, some NGOs undertook innovative BCC approaches by
raising community awareness on the need of institutional deliveries, facilitating
community funds to cover hospital costs, and by arranging for the transportation of
pregnant women to hospitals. This has increased institutional deliveries of complicated
cases. The NGO Service Delivery Program’s partner NGOs that provide essential health
services are replicating these approaches in their catchment communities.
We find that maternal education and socioeconomic conditions have a statistically
significant effect on maternal mortality. This is a new finding in Bangladesh. No
previous studies found such a significant relationship. The explanation of no effect of
socioeconomic condition on maternal mortality in the past may be the following: In the
past, even if people from higher socioeconomic groups wanted to have institutional
deliveries, they could not have them because of unavailability of facilities or lack of
transportation to go to facilities. The situations have noticeably improved in recent years.
We find that women who are educated, or whose husbands are educated, or women from
richer families are now less likely to die from pregnancy or childbirth Socioeconomic
conditions, especially the education of women, are improving rapidly. It is expected
maternal mortality will continue to further decline due to socioeconomic improvement.
BCC activities can help to increase women’s understanding of the benefits of institutional
deliveries.
Greater utilization of maternal health services by the more advantaged groups is
likely to increase the inequality of health conditions even further. An effective safety-net
system for improving the health of the poor and the illiterate is needed to help sustain
maternal mortality reduction. The Bangladesh government, for example, is currently
reviewing a scheme that will distribute maternity vouchers that would enable poor
women to have deliveries at hospitals (MOHFW 2004). Implementation of such a
scheme through carefully designed and well-supervised management system should help
reduce the high-levels of maternal mortality in Bangladesh.

69
Table V-1. Direct and concomitant maternal deaths by time of occurrence, Matlab, 1982-2002
Direct causes Concomitant causes Total Time of death Number Percent Number Percent Number Percent
During pregnancy
138 38.0 36 41.4 174 38.7
0-6 days after end of pregnancy
143 39.4 15 17.2 158 35.1
7-42 days after end of pregnancy
82 22.6 36 41.4 118 26.2
Total
363 100.0 87 100.0 450 100.0

70
Table V-2. Probability of maternal death (deaths per 1,000 pregnancies) by the duration of the preceding interpregnancy interval, Matlab, 1982-2002
Interval Probability Odds ratio Number of pregnancies
First pregnancy 3.66 2.22 33,335 <6 months 2.60 1.58 4,228 6-14 1.80 1.09 11,116 15-26 1.86 1.13 25,824 27-50 (RC) 1.65 1.00 27,875 51-74 1.77 1.07 9,057 75+ 3.83 2.32** 4,437 Missing interval 3.07 1.86** 27,076 All 2.54 -- 142,948
RC = Reference category for the odds ratios.
**=p<0.01, ***=p<0.001 (tests of the significance of the difference from the reference category)
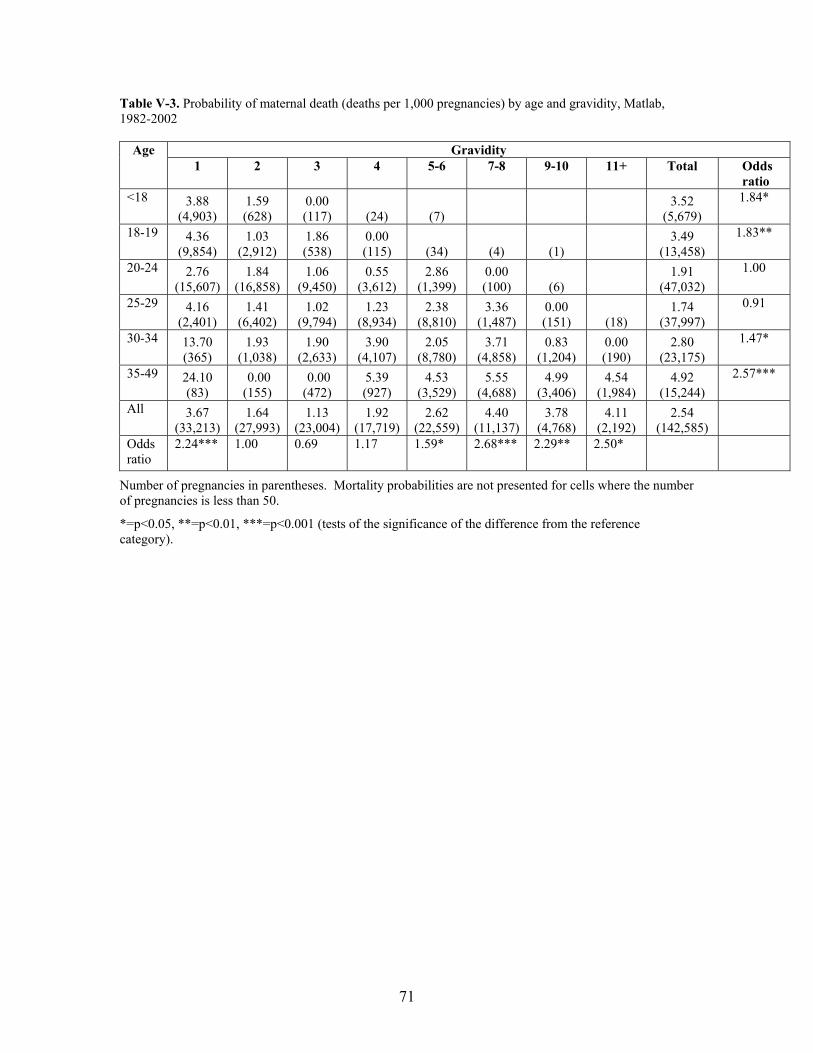
71
Table V-3. Probability of maternal death (deaths per 1,000 pregnancies) by age and gravidity, Matlab, 1982-2002
Gravidity Age 1 2 3 4 5-6 7-8 9-10 11+ Total Odds
ratio <18 3.88
(4,903) 1.59 (628)
0.00 (117) (24) (7)
3.52 (5,679)
1.84*
18-19 4.36 (9,854)
1.03 (2,912)
1.86 (538)
0.00 (115) (34) (4) (1)
3.49 (13,458)
1.83**
20-24 2.76 (15,607)
1.84 (16,858)
1.06 (9,450)
0.55 (3,612)
2.86 (1,399)
0.00 (100) (6)
1.91 (47,032)
1.00
25-29 4.16 (2,401)
1.41 (6,402)
1.02 (9,794)
1.23 (8,934)
2.38 (8,810)
3.36 (1,487)
0.00 (151) (18)
1.74 (37,997)
0.91
30-34 13.70 (365)
1.93 (1,038)
1.90 (2,633)
3.90 (4,107)
2.05 (8,780)
3.71 (4,858)
0.83 (1,204)
0.00 (190)
2.80 (23,175)
1.47*
35-49 24.10 (83)
0.00 (155)
0.00 (472)
5.39 (927)
4.53 (3,529)
5.55 (4,688)
4.99 (3,406)
4.54 (1,984)
4.92 (15,244)
2.57***
All 3.67 (33,213)
1.64 (27,993)
1.13 (23,004)
1.92 (17,719)
2.62 (22,559)
4.40 (11,137)
3.78 (4,768)
4.11 (2,192)
2.54 (142,585)
Odds ratio
2.24*** 1.00 0.69 1.17 1.59* 2.68*** 2.29** 2.50*
Number of pregnancies in parentheses. Mortality probabilities are not presented for cells where the number of pregnancies is less than 50.
*=p<0.05, **=p<0.01, ***=p<0.001 (tests of the significance of the difference from the reference category).

72
Table V-4. Probability of maternal death (deaths per 1,000 pregnancies) by the number of previous child deaths and the number of previous pregnancy losses, Matlab, 1982-2002
Factors Probability Odds ratio Number Prior child deaths None (RC) 2.21 1.00 101,686 1 2.98 1.35* 27,176 2 or more 4.04 1.83*** 14,086 Prior pregnancy losses None (RC) 2.45 1.00 112,185 1 2.51 1.03 22,693 2 or more 3.85 1.57* 8,068 All 2.54 -- 142,948
RC = Reference category for the odds ratios.
*=p<0.05, ***=p<0.001 (tests of the significance of the difference from the reference category).

73
Table V-5. Probability of maternal death (deaths per 1,000 pregnancies) by socio-economic and other factors, Matlab, 1982-2002
Factors Probability Odds ratio Number Woman’s education No schooling (RC) 2.95 1.00 73,785 1-5 years of schooling 2.37 0.80+ 43,497 6-10 years of schooling 1.63 0.55** 23,286 11+ years of schooling 1.68 0.57 2,380 Husband’s education No schooling (RC) 3.08 1.00 69,169 1-5 years of schooling 2.19 0.71** 42,007 6-10 years of schooling 1.85 0.60** 24,870 11+ years of schooling 1.74 0.57+ 6,902 Household space Low (<170 sq. ft.) (RC) 2.82 1.00 38,707 Low – Medium (170-249 sq. ft.) 2.56 0.91 35,106 Medium (250-349 sq. ft.) 2.86 1.01 33,536 High (350 + sq. ft.) 1.87 0.65** 35,364 Religion Muslim (RC) 2.52 1.00 127,426 Non-Muslim 2.71 1.07 15,522 Area Comparison (RC) 2.92 1.00 77,495 Treatment 2.09 0.72** 65,453 All 2.54 -- 142,948
RC = Reference category for the odds ratios.
+=<0.10, **=p<0.01 (tests of the significance of the difference from the reference category).

74
Table V-6. Probability of maternal death (deaths per 1,000 pregnancies) by calendar year and area, Matlab, 1982-2002
Comparison Area Treatment Area Both areas Time
Proba- bility
Odds ratio
Number Proba- bility
Odds ratio
Number Proba- bility
Odds ratio
Number
1982-1987 (RC)
4.25
1.00 24,022 3.35
1.00 19,997 3.84
1.00 44,019
1988-1992 2.21
0.52** 19,921 1.71
0.51** 15,819 1.99
0.52*** 35,740
1993-1997 2.81
0.66* 16,349 2.10
0.63* 14,275 2.48
0.65** 30,624
1998-2002 1.98
0.47*** 17,203 0.85
0.25*** 15,362 1.44
0.38*** 32,565
All
2.92 - 77,495 2.09 - 65,453 2.54 - 142,948
RC = Reference category for the odds ratios.
*=p<0.05, **=p<0.01, ***=p<0.001.
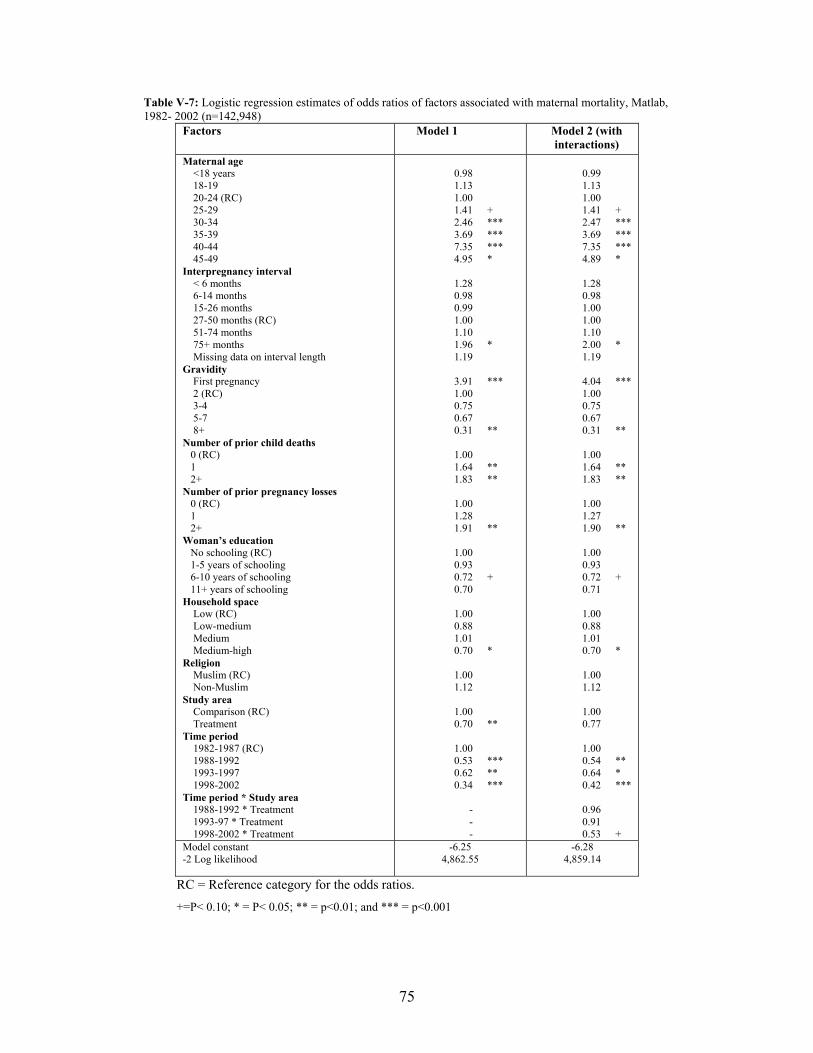
75
Table V-7: Logistic regression estimates of odds ratios of factors associated with maternal mortality, Matlab, 1982- 2002 (n=142,948)
Factors Model 1 Model 2 (with interactions)
Maternal age <18 years 18-19 20-24 (RC) 25-29 30-34 35-39 40-44 45-49 Interpregnancy interval < 6 months 6-14 months 15-26 months 27-50 months (RC) 51-74 months 75+ months Missing data on interval length Gravidity First pregnancy 2 (RC) 3-4 5-7 8+ Number of prior child deaths 0 (RC) 1 2+ Number of prior pregnancy losses 0 (RC) 1 2+ Woman’s education No schooling (RC) 1-5 years of schooling 6-10 years of schooling 11+ years of schooling Household space Low (RC) Low-medium Medium Medium-high Religion Muslim (RC) Non-Muslim Study area Comparison (RC) Treatment Time period 1982-1987 (RC) 1988-1992 1993-1997 1998-2002 Time period * Study area 1988-1992 * Treatment 1993-97 * Treatment 1998-2002 * Treatment
0.98 1.13 1.00 1.41 2.46 3.69 7.35 4.95
1.28 0.98 0.99 1.00 1.10 1.96 1.19
3.91 1.00 0.75 0.67 0.31
1.00 1.64 1.83
1.00 1.28 1.91
1.00 0.93 0.72 0.70
1.00 0.88 1.01 0.70
1.00 1.12
1.00 0.70
1.00 0.53 0.62 0.34
- - -
+ *** *** *** * * *** ** ** ** ** + * ** *** ** ***
0.99 1.13 1.00 1.41 2.47 3.69 7.35 4.89
1.28 0.98 1.00 1.00 1.10 2.00 1.19
4.04 1.00 0.75 0.67 0.31
1.00 1.64 1.83
1.00 1.27 1.90
1.00 0.93 0.72 0.71
1.00 0.88 1.01 0.70
1.00 1.12
1.00 0.77
1.00 0.54 0.64 0.42
0.96 0.91 0.53
+ *** *** *** * * *** ** ** ** ** + * ** * *** +
Model constant -2 Log likelihood
-6.25 4,862.55
-6.28 4,859.14
RC = Reference category for the odds ratios.
+=P< 0.10; * = P< 0.05; ** = p<0.01; and *** = p<0.001
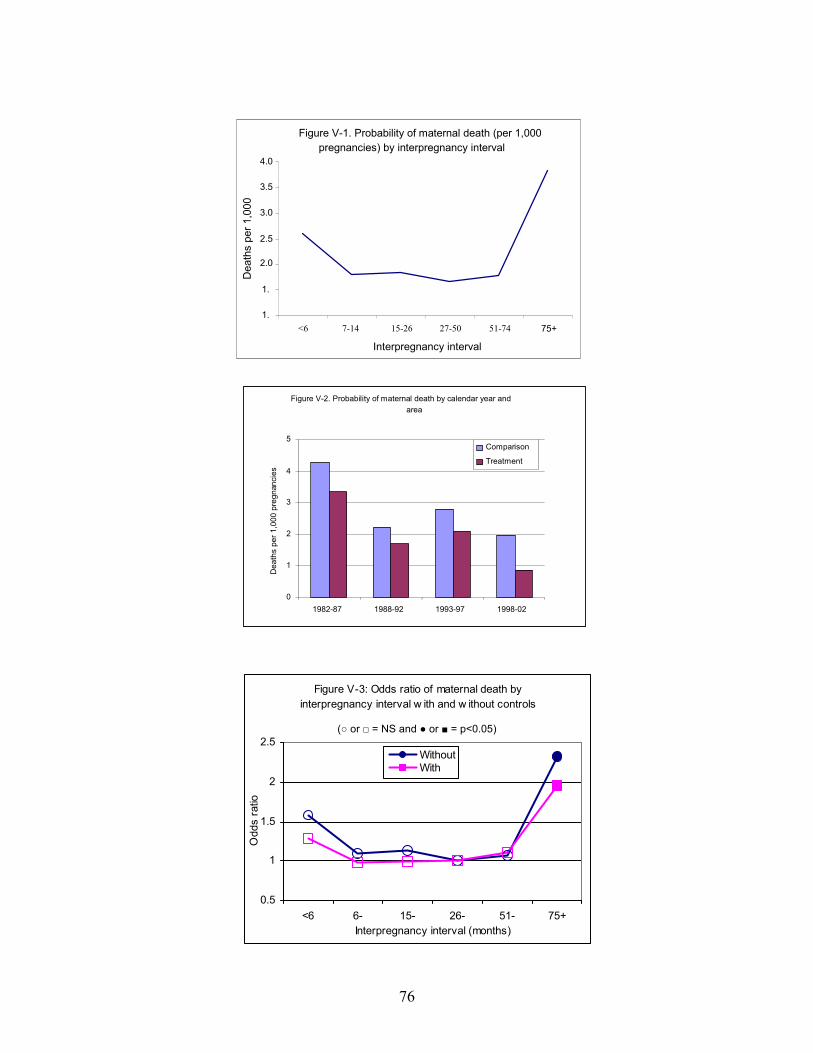
76
Figure V-1. Probability of maternal death (per 1,000
pregnancies) by interpregnancy interval
1.
1.
2.0 2.5
3.0 3.5 4.0
<6 7-14 15-26 27-50 51-74 75+
Interpregnancy interval
Dea
ths
per 1
,000
Figure V-2. Probability of maternal death by calendar year and area
0
1
2
3
4
5
1982-87 1988-92 1993-97 1998-02
Dea
ths
per 1
,000
pre
gnan
cies
Comparison
Treatment
Figure V-3: Odds ratio of maternal death by interpregnancy interval w ith and w ithout controls
0.5
1
1.5
2
2.5
<6 6- 15- 26- 51- 75+Interpregnancy interval (months)
Odd
s ra
tio
WithoutWith
(○ or □ = NS and ● or ■ = p<0.05)
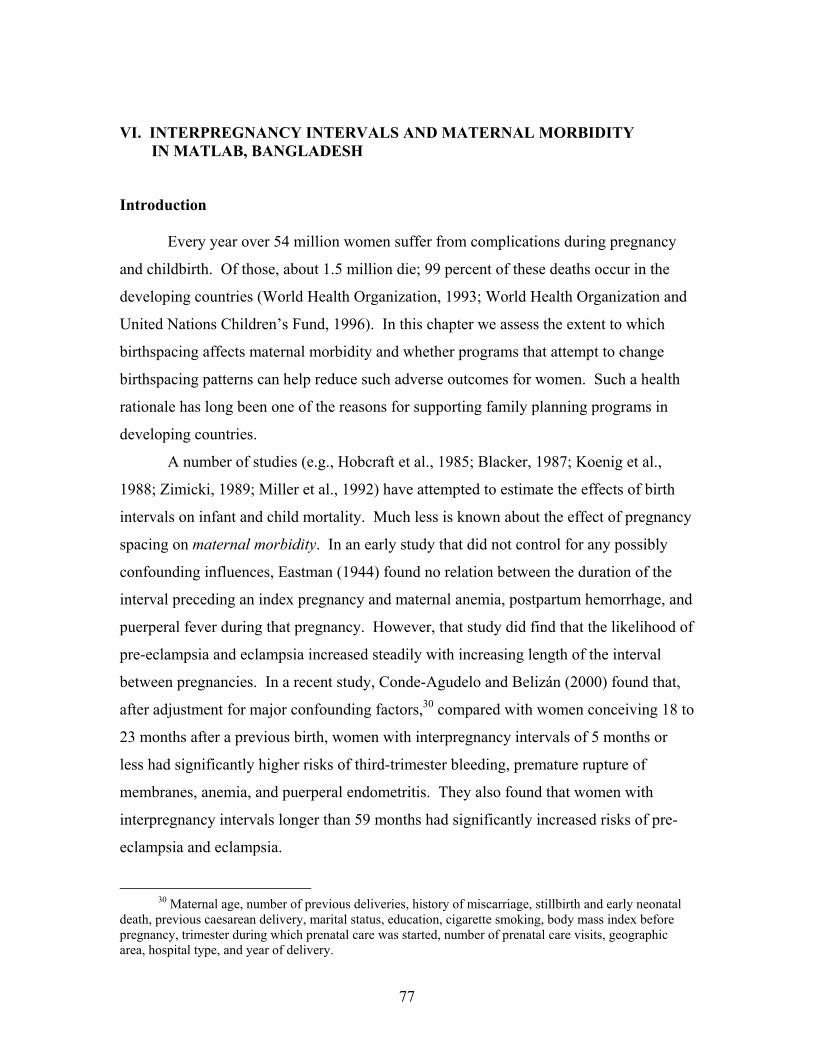
77
VI. INTERPREGNANCY INTERVALS AND MATERNAL MORBIDITY IN MATLAB, BANGLADESH
Introduction
Every year over 54 million women suffer from complications during pregnancy
and childbirth. Of those, about 1.5 million die; 99 percent of these deaths occur in the
developing countries (World Health Organization, 1993; World Health Organization and
United Nations Children’s Fund, 1996). In this chapter we assess the extent to which
birthspacing affects maternal morbidity and whether programs that attempt to change
birthspacing patterns can help reduce such adverse outcomes for women. Such a health
rationale has long been one of the reasons for supporting family planning programs in
developing countries.
A number of studies (e.g., Hobcraft et al., 1985; Blacker, 1987; Koenig et al.,
1988; Zimicki, 1989; Miller et al., 1992) have attempted to estimate the effects of birth
intervals on infant and child mortality. Much less is known about the effect of pregnancy
spacing on maternal morbidity. In an early study that did not control for any possibly
confounding influences, Eastman (1944) found no relation between the duration of the
interval preceding an index pregnancy and maternal anemia, postpartum hemorrhage, and
puerperal fever during that pregnancy. However, that study did find that the likelihood of
pre-eclampsia and eclampsia increased steadily with increasing length of the interval
between pregnancies. In a recent study, Conde-Agudelo and Belizán (2000) found that,
after adjustment for major confounding factors,30 compared with women conceiving 18 to
23 months after a previous birth, women with interpregnancy intervals of 5 months or
less had significantly higher risks of third-trimester bleeding, premature rupture of
membranes, anemia, and puerperal endometritis. They also found that women with
interpregnancy intervals longer than 59 months had significantly increased risks of pre-
eclampsia and eclampsia.
30 Maternal age, number of previous deliveries, history of miscarriage, stillbirth and early neonatal
death, previous caesarean delivery, marital status, education, cigarette smoking, body mass index before pregnancy, trimester during which prenatal care was started, number of prenatal care visits, geographic area, hospital type, and year of delivery.

78
Eastman's study did not control for confounding factors, and the number of
women with short intervals was very small. By contrast, Conde-Agudelo and Belizán
(2000) did control for confounding factors and considered a large sample, from Latin
America and the Caribbean. Their study is hospital based, but is for a setting where most
women deliver in hospital. The data on maternal morbidity for our study are collected at
the facility level. We consider pregnant women living in the MCH-FP Area between
1996 and 2002 who came to a community health center for an antenatal checkup during
the third trimester of pregnancy. We use these data to investigate whether the durations
of interpregnancy intervals (both short and long) affect the likelihood of maternal
morbidity for women who visited a health center during their third trimester of
pregnancy.
Study Population
The data for this study come from the MCH-FP Area of Matlab. Since 1996, the
Reproductive Health Unit of the ICDDR,B has been collecting data on maternal
morbidity from women in the MCH-FP Area who visit a health center for an antenatal
check-up. All pregnant women in that area are given a “pictoral” card by the community
health worker (CHW) when their pregnancies are identified by the CHWs during their
monthly household visits for collecting surveillance data (for the DSS and RKS). The
woman keeps the card and brings it when visiting the health center for service. The card
records information on service uptake, including antenatal check-up, delivery, and
postnatal check-up. It also contains behavior change communication messages regarding,
for example, pregnancy danger signs, pregnancy planning, and maternal nutrition.
There are four health centers in the MCH-FP area; each covers a population of
over 25,000. These centers are equipped to provide basic emergency obstetric care for
the catchment area and are posted with a trained nurse-midwife along with a paramedic.
These nurse-midwives and paramedics have been trained to provide antenatal care, treat
minor complications, conduct normal deliveries, and refer cases with complications to
Matlab Hospital.
At the health center, the nurse-midwife examines the women clinically and
administers simple laboratory tests. A substantial portion of the health information is

79
also verified by a female medical officer who visits the center from the Matlab head
office every week. Our analyses are based on information on those women who visited
health centers during third trimester of the pregnancy. If the woman made more than one
visit during the third trimester, we consider the last such visit. Hence, we consider only
one observation on each pregnancy.31
Data and Definitions of Variables Considered in Our Analyses
Two sources of data are used for the study. Data on maternal age, pregnancy
history (gravidity and loss of pregnancy), education of women, household space, and
religion were taken from the DSS database. Data on maternal morbidity were taken from
the “pictoral” cards mentioned above. In the DSS, the woman’s date of birth is collected
at her first entry into system, while pregnancy history data are updated regularly through
the pregnancy record. For this analysis, maternal age has been calculated at the time of
the detection of the pregnancy (usually 6-10 weeks of gestation).32
The duration of the interpregnancy interval preceding the index pregnancy is
defined as the time elapsed between the date of the woman’s preceding pregnancy
outcome and the date of the last menstrual period before the index pregnancy. Although
conception typically occurs at two weeks (or more) after the last menstrual period, the
measure we use is the same as that used in the recent study by Conde-Agudelo and
Belizán (2000), to which we compare our results. In calculating the duration of the
interpregnancy interval, the date of previous pregnancy outcome was taken from the DSS
database using the unique identification number maintained by the system.
Information on women’s education, household space, and religion are not
regularly updated in the DSS. For all except women who moved to Matlab after 1996,
we use information on women’s education, household space, and religion collected in a
1996 census. For people who moved to Matlab after the 1996 census, education data
were collected at the time they moved into the Matlab area. Women’s education is
31 However, since the data cover seven years, the same women may come for service with more than
one pregnancy. We have multiple observations on 2,449 women. We will investigate the effects of this clustering on our standard errors.
32 Note age is measured at a somewhat different time in this study of maternal morbidity – at the time of the detection of the index pregnancy – than in our study of pregnancy outcomes and infant and child mortality, where it is measured at the time of the outcome
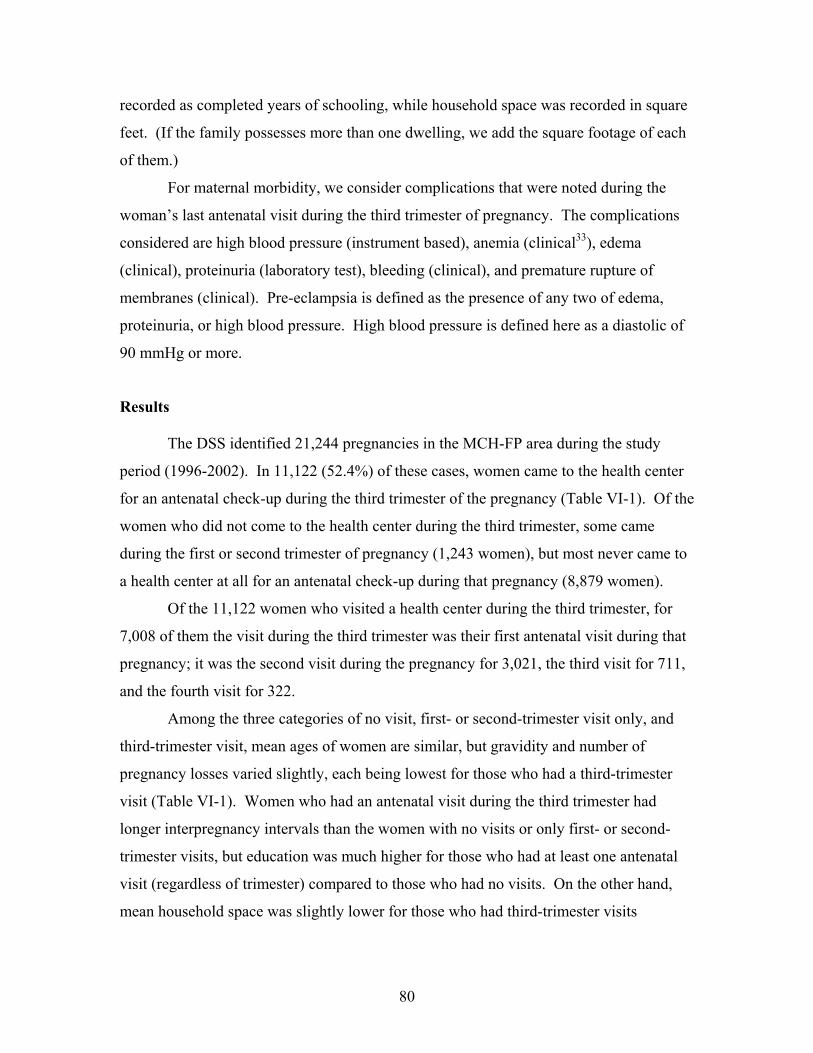
80
recorded as completed years of schooling, while household space was recorded in square
feet. (If the family possesses more than one dwelling, we add the square footage of each
of them.)
For maternal morbidity, we consider complications that were noted during the
woman’s last antenatal visit during the third trimester of pregnancy. The complications
considered are high blood pressure (instrument based), anemia (clinical33), edema
(clinical), proteinuria (laboratory test), bleeding (clinical), and premature rupture of
membranes (clinical). Pre-eclampsia is defined as the presence of any two of edema,
proteinuria, or high blood pressure. High blood pressure is defined here as a diastolic of
90 mmHg or more.
Results
The DSS identified 21,244 pregnancies in the MCH-FP area during the study
period (1996-2002). In 11,122 (52.4%) of these cases, women came to the health center
for an antenatal check-up during the third trimester of the pregnancy (Table VI-1). Of the
women who did not come to the health center during the third trimester, some came
during the first or second trimester of pregnancy (1,243 women), but most never came to
a health center at all for an antenatal check-up during that pregnancy (8,879 women).
Of the 11,122 women who visited a health center during the third trimester, for
7,008 of them the visit during the third trimester was their first antenatal visit during that
pregnancy; it was the second visit during the pregnancy for 3,021, the third visit for 711,
and the fourth visit for 322.
Among the three categories of no visit, first- or second-trimester visit only, and
third-trimester visit, mean ages of women are similar, but gravidity and number of
pregnancy losses varied slightly, each being lowest for those who had a third-trimester
visit (Table VI-1). Women who had an antenatal visit during the third trimester had
longer interpregnancy intervals than the women with no visits or only first- or second-
trimester visits, but education was much higher for those who had at least one antenatal
visit (regardless of trimester) compared to those who had no visits. On the other hand,
mean household space was slightly lower for those who had third-trimester visits

81
compared to the other categories. There is very little difference by religion among the
three groups. None of these differences, however, are statistically significant.
Table VI-2 shows maternal morbidity during third trimester of pregnancy by
whether it was the woman’s first, second, or last antenatal visit during the third trimester.
As mentioned earlier, 11,122 pregnant women visited health center during third trimester
and of them, 4,054 women had more than one visit during the third trimester. In Table
VI-2 we show the incidences of the seven morbidities we consider as measured at three
points in time: at the time of the first antenatal visit during the third trimester (for all
11,122 women who had a third-trimester visit), the second visit (for the 4,054 women
which had a second visit), and the last visit for (all 11,122 women who had a third-
trimester visit some of the “last” visits were first or second visits). We see that, with the
exception of anemia, the incidence of each type of morbidity is always lower during the
first visit than during the second visit, and that the incidence for the last visit is
somewhere in between that for the first and second (which occurs because last visits are
largely a mix of first and second visits). Except anemia, morbidity during the second
visit is significantly higher than during the first visit. There are no significant differences
in morbidity between second and last visit except for proteinuria. The fact that there is a
higher incidence of morbidities for women with a second visit during the third trimester
suggests that those who have a problem detected during their first visit during the third
trimester are more likely to come back for a second visit. In this chapter, we consider
morbidities during the last visit during the third trimester, since that is when women are
most likely to have the morbidities that we analyze.
The incidences of edema and high blood pressure during the last antenatal visit
during the third trimester shown in Table VI-2 are generally similar to those Akhter et al.
(1996) reported for Bangladesh, but that study found a higher level of bleeding than we
do, perhaps because they studied an earlier period of time (1992-94) than we do (1996-
2002). Levels of morbidity reported by Conde-Agudelo and Belizan (2000) are generally
higher than those we find during the last antenatal visit during the third trimester: 1.6
times higher for pre-eclampsia, 2.4 times higher for bleeding, and 4.5 times for premature
33 Clinical means physical examination of the body.

82
rupture of membranes. We do not know the reasons for why the levels appear to be so
much lower in Bangladesh.
Bivariate Results
Table VI-3 shows how the incidences of our various measures of maternal
morbidity during the last antenatal visit during the third trimester of pregnancy vary
according to women’s sociodemographic characteristics. Pre-eclampsia, proteinuria,
high blood pressure, bleeding, premature rupture of membranes, and edema all tend to be
higher for women with short interpregnancy intervals (under 6 months) and long intervals
(over 75 months) compared to intervals of 27-50 months in duration. In the two extreme
interval categories (under 6 and over 75 months), pre-eclampsia, high blood pressure, and
premature rupture of membranes are significantly higher compared to the 27-50-months
interval category, while the likelihoods of proteinuria, anemia, and edema are all
significantly higher for the longest interval category. For the shortest and longest
interpregnancy interval categories, respectively, compared to an interval category of 27-
50 months, pre-eclampsia was 2.4 and 2.2 times more likely, proteinuria was 1.1 and 1.4
times more likely, high blood pressure was 2.0 and 2.5 times more likely, bleeding was
1.8 and 1.2 times more likely, premature rupture of membranes was 2.5 and 1.9 times
more likely, anemia was 1.0 and 1.2 times more likely, and edema was 1.2 and 1.4 times
more likely. All of the morbidities we consider except for anemia are more likely for
first pregnancies compared to higher-order pregnancies with a preceding interval of 27-
50 months. Anemia is significantly lower for first pregnancies compared to higher-order
pregnancies with an interval length of 27-50 months.
Pre-eclampsia and proteinuria have an inverted-U shaped relationship with
women’s age, whereas high blood pressure, bleeding, and edema have a J-shaped
relationship; premature rupture of membranes has a U-shaped relationship; and anemia
has a weak positive relationship (Table VI-3). The risks of morbidities are usually higher
for the lowest gravidity, except for bleeding and anemia, which generally increase
monotonically with gravidity. All morbidities except premature rupture of membranes
and edema are higher, and often substantially so, for those who had two or more previous
pregnancy losses than those with none or one.

83
In our data, more highly educated women have lower levels of bleeding and
anemia (Table VI-3), perhaps because they have a better diet and are more careful in
performing their daily activities during pregnancy than women with less education.
However, more highly educated women have higher levels of pre-eclampsia, proteinuria,
high blood pressure, premature rupture of membranes, and edema than uneducated
women. This may occur because educated women are more likely to visit the health
center when they experience such symptoms. If this is the case, the differentials we see
may be due to the selectivity of the sample rather than to true differences in the incidence
of the morbidity, and this makes the lower levels of bleeding and anemia for more
educated women all the more noteworthy. No systematic morbidity pattern was observed
by household space except for anemia, which occurs more often for women with little
household space. (This may be due to poorer women having a less iron-rich diet.)
Muslims are less likely than non-Muslims to have pre-eclampsia, high blood pressure,
bleeding, and edema, but non-Muslims had slightly lower incidences of proteinuria,
premature rupture of membranes, and anemia than Muslims.
Multivariate Analyses
Table VI-4 presents odds ratios from our logistic regressions. After controlling
for all variables in the regression model, pre-eclampsia and high blood pressure are
significantly more likely for women with preceding interpregnancy intervals of less than
6 months and over 75 months compared to those with intervals of 27-50 months, while
for edema, the odds ratio is significantly higher for intervals over 50 months. We see
similar patterns for proteinuria and premature rupture of membranes, but the interval
effects are not statistically significant. The other morbidities we consider (bleeding and
anemia) do not vary significantly by the duration of the interpregnancy interval in our
multivariate analyses. In general, the relationships between interpregnancy intervals and
morbidity that we see in our multivariate analyses are very similar to those we saw earlier
in our bivariate analyses. (See Figures VI-1a-g.)
Except for premature rupture of membranes, the likelihoods of all other
morbidities are usually lower for the younger age categories, but all morbidities are more
likely in the older age categories compared to ages 20-24. Except for edema, morbidity

84
is higher for those who had two or more pregnancy losses than those with none, though
the differences aren’t always statistically significant.
Except for bleeding and anemia, educated women usually had higher levels of
morbidity than less educated women, and the differences are usually significant. No
consistent morbidity pattern by household space is observed. Non-Muslims have
significantly higher rates of pre-eclampsia and high blood pressure than Muslims. The
same pattern is seen for bleeding and edema, but the differences by religion are not
statistically significant. For the rest of the morbidities, non-Muslims usually have a
lower risk, but the differences are not statistically significant.
Discussion
The data for the study were collected at the facility level and refer to the 52
percent of pregnant women in the MCH-FP area who visited the health center for
antenatal care during their third trimester of pregnancy. Although it is likely that those
women who visited the health center could have experienced more health problems than
those who did not, it is also possible that those who visited the health center were more
health conscious than those who did not.
After controlling for the other variables in our multivariate analyses, we find that
women with short interpregnancy intervals (<6 months) had a higher risk of pre-
eclampsia (p<.01), proteinuria (NS), high blood pressure (p<.10), premature rupture of
membranes (NS, though intervals of 6-14 months are associated with a significantly
higher incidence), anemia (NS), and edema (NS) compared to those with an interval of
27-50 months. Women with very long interpregnancy intervals (75+ months) had a
higher risk of pre-eclampsia (p<.05), proteinuria (NS), high blood pressure (p<.10),
premature rupture of membranes (NS), and edema (p<.01) compared to women with
intervals of 27-50 months. Pre-eclampsia and high blood pressure are significantly
higher for the shortest (<6 months) and longest (75+ months) intervals compared to those
of 27-50 months, while edema is significantly higher for the longest intervals.
Our study has three morbidities (bleeding, premature rupture of membranes, and
anemia) in common with those considered by Conde-Agudelo and Belizán (2000) and
two morbidities (anemia and pre-eclampsia) in common with those studied by Eastman

85
(1944). Premature rupture of membranes was more likely for short interpregnancy
intervals both in Conde-Agudelo and Belizán’s study and our study, while anemia was
more likely for short intervals in Conde-Agudelo and Belizán’s study but not in ours. All
the three studies find a higher likelihood of pre-eclampsia for the longest interpregnancy
intervals, but our study also finds higher pre-eclampsia for the shortest interval duration.
None of these studies found any relation between interpregnancy intervals and anemia,
though we find that the risk of anemia is lowest for women in their first pregnancy.
The implications of these findings are similar to those discussed in the previous chapter.

86
Table VI-1. Women’s socio-demographic characteristics (mean)
by timing of last antenatal visit (if any), MCH-FP area, 1996-2002
Antenatal visit Characteristics
No visit First/second-trimester visit
Third-trimester visit
Interpregnancy interval* (months) 42.6 42.6 43.9 Women’s age (years) 26.4 26.4 26.3 Gravidity 2.9 2.8 2.7 No. of previous pregnancy losses 0.4 0.3 0.3 Women’s education (years) 2.8 4.5 4.3 Household space (sq. feet) 305 300 298 Religion (% Muslim) 87 86 86 n 8,879 1,243 11,122
*First pregnancy excluded. Table VI-2. Incidence of maternal morbidity (per 100 pregnancies) during first, second, and last visits for antenatal care during the third trimester of pregnancy, MCH-FP area, 1996-2002
Third trimester Morbidity
First visit Second visit Last visit
Pre-eclampsia 1.6 *** 3.1 2.7
Proteinuria 3.8 *** 5.7 4.4 +++
High blood pressure 1.8 *** 3.5 3.3
Bleeding 0.3 *** 0.7 0.5
Premature rupture of membranes 0.7 *** 1.6 1.5
Anemia 18.3 17.6 18.6
Edema 18.2 *** 22.9 21.9
*** Difference between first and second visit is statistically significant at p<0001. +++ Difference between second and last visit is statistically significant at p<0.001. *Many last visits were first or second visits.

87
Table VI-3. Maternal morbidity per 1,000 pregnancies according to women’s socio-demographic characteristics, Matlab MCH-FP area, 1996-2002
Characteristics Pre- eclampsia
Protein- uria
High blood
pressure
Bleeding
Premature rupture of
membranes
Anemia
Edema
Woman's age (in years) <20 26.2 40.4 31.0 4.7** 20.8 122.2 217.7 20-24 (RC) 29.8 47.8 31.9 4.7 15.8 136.2 214.6 25-29 26.5 42.6 29.7 2.5 14.3 186.9 *** 206.3 30-34 25.9 42.8 39.3 5.5 11.2 252.0 *** 223.9 35+ 21.1 42.9 36.7 11.1** 13.2 306.9 *** 263.2***
Gravidity 1 37.3 *** 54.8*** 40.1*** 4.5 20.3** 111.4 *** 237.4***
2 (RC) 24.0 36.4 26.5 2.4 12.5 169.3 205.7
3-4 19.4 40.4 30.0 5.9** 13.6 206.3 *** 207.3
5-6 27.3 45.4 36.9* 6.9* 12.0 329.4 *** 235.9**
7+ 21.3 30.9 37.2 9.8** 3.1 405.9 *** 205.5
No. prev. pregnancy losses 0 (RC) 25.9 44.3 31.1 3.4** 14.0 174.1 217.2 1 27.2 40.8 37.3 10.4 19.8* 215.0 *** 229.1 2+ 44.8 * 49.5 56.3* 11.5 15.2 314.0 *** 215.2
Woman's education (in completed years) 0 (RC) 22.1 37.8 25.3 6.9** 12.2 239.6 214.5 1-5 23.4 39.3 32.3 3.5 12.5 186.8 *** 202.2 6+ 35.1 *** 52.8*** 42.0 *** 3.7* 19.7** 124.3 *** 234.3**
Household space Low (RC) 26.1 35.5 33.2 3.8 15.0 205.4 234.9
Low-medium 25.2 54.1*** 30.2 5.5 9.5* 195.4 199.6***
Medium 25.9 45.7* 37.3 6.2 15.7 170.8 *** 209.4**
High 30.3 43.8 31.1 3.9 18.7 172.7 *** 226.3 Religion
Muslim (RC) 25.5 44.7 31.5 4.6 15.7 188.2 217.3
`Non-Muslim 35.0 ** 39.9 41.9** 6.2 10.3 195.3 228.7
Interpregnancy interval (months)
<6 42.2 *** 40.7 45.2*** 7.7 19.2** 212.2 219.0
6-14 19.3 42.4 15.9 7.8 26.5*** 208.6 185.5
15-26 19.9 35.1 30.4 3.6 12.4 236.1 177.7
27-50 (RC) 17.6 35.7 22.6 4.2 7.8 213.2 188.6
51-74 19.4 41.4 26.3 6.3 9.2 229.9 238.5***
75+ 38.3 *** 50.2** 57.6*** 4.9 14.8* 248.8 ** 266.7***
First pregnancy 37.3 *** 54.8* 40.1*** 4.5 20.3*** 111.4 *** 237.4***
Note: RC= reference category Comparison is made with reference category for tests of statistical significance
*p<0.10, **p<0.05, ***p<0.01

88
Table VI-4. Logistic regression estimates of odds ratios of factors associated with maternal morbidity, MCH-FP area, 1996-2002
Covariates Pre- eclampsia
Protein- uria
High blood
pressure Bleeding
Prematurerupture of
membranesAnemia Edema
Interpregnancy interval (in months) <6 2.19 ** 1.20 1.66* 0.95 1.94 1.03 1.16
6-14 1.05 1.23 0.56 1.24 2.86* 0.99 0.93
15-26 1.14 0.89 1.25 0.44 1.44 1.09 0.94
27-50 (RC) 1.00 1.00 1.00 1.00 1.00 1.00 1.00
51-74 1.04 1.15 1.09 1.30 1.24 1.06 1.27***
75+ 2.44 *** 1.24 2.44*** 0.86 1.78 0.99 1.44***
Woman's age (in years) <20 0.71 * 0.67** 0.79 0.97 1.07 1.06 0.91
20-24 (RC) 1.00 1.00 1.00 1.00 1.00 1.12 1.00
25-29 1.43 ** 1.14 1.29 0.43 1.05 1.00 1.10
30-34 1.45 1.05 1.75** 0.71 0.80 1.23 * 1.30***
35+ 1.27 1.31 1.57 1.55 1.34 1.35 ** 1.51***
Gravidity 1 2.17*** 1.86*** 2.07*** 1.76 2.47** 0.67 *** 1.40***
2 (RC) 1.00 1.00 1.00 1.00 1.00 1.00 1.00
3-4 0.66* 1.07 0.88 1.82 1.08 1.03 0.87*
5-6 0.81 1.77 0.91 1.37 0.99 1.78 *** 0.90
7+ 0.37* 0.43 0.86 1.24 0.21 2.41 *** 0.66**
No. prev. pregnancy losses 0 (RC) 1.00 1.00 1.00 1.00 1.00 1.00 1.00
1 0.86 0.98 0.75 0.34*** 0.77 1.07 0.87*
2+ 1.93 * 1.34 1.82** 1.22 1.36 1.13 0.96
Woman's education (in completed years) 0 (RC) 1.00 1.00 1.00 1.00 1.00 1.00 1.00
1-5 1.08 1.06 1.40** 0.48* 0.89 0.82 *** 0.93
6+ 1.43 * 1.28* 1.87*** 0.60 1.23 0.61 *** 1.10
Household space Low (RC) 1.00 1.00 1.00 1.00 1.00 1.00 1.00
Low-medium 0.98 1.51*** 0.93 1.67 0.73 0.93 0.81**
Medium 0.89 1.15 1.08 2.27* 1.11 0.90 0.85**
High 1.02 1.03 0.79 1.54 1.15 1.00 0.92
Religion Muslim (RC) 1.00 1.00 1.00 1.00 1.00 1.00 1.00
Non-Muslim 1.48 ** 0.92 1.85*** 1.46 0.69 0.92 1.08
-2 Log Likelihood 2487.4 3313.4 2827.6 548.9 1484.3 8539.7 10408.8
Model constant§ -4.12 -3.64 -4.08 -4.99 -4.64 -1.42 -1.30
Note: RC=reference category *p<0.10, **p<0.05, ***p<0.01 § This is the constant for the logistic regression

89
Figure VI-1a: Estimated odds ratio of having pre-eclampsia by interpregnancy interval, with and without controls
(Hollow symbols indicate odds ratios that aren't signficantly different from 1.0.)
0.0
0.5
1.0
1.5
2.0
2.5
3.0
3.5
<6 6-14 15-26 27-50 51-74 75+
Interpregnancy interval (months)
Odd
s rat
ios
Pre-eclampsia(with controls)Pre-eclampsia(no controls)RR=1
Figure VI-1b: Estimated odds ratio of having proteinuria by interpregnancy interval, with and without controls
(Hollow symbols indicate odds ratios that aren't signficantly different from 1.0.)
00.20.40.60.8
11.21.41.6
<6 6-14 15-26 27-50 51-74 75+
Interpregnancy interval (months)
Odd
s rat
ios
Proteinuria(with controls)Proteinuria(no controls)RR=1

90
Figure VI-1c: Estimated odds ratio of having high blood pressure by interpregnancy interval, with and without controls
(Hollow symbols indicate odds ratios that aren't signficantly different from 1.0.)
0.0
0.5
1.0
1.5
2.0
2.5
<6 6-14 15-26 27-50 51-74 75+
Interpregnancy interval (months)
Odd
s rat
ios
Blood pressure(with controls)Blood pressure(no controls)RR=1
Figure VI-1d: Estimated odds ratio of having bleeding by interpreganancy interval, with and without controls
(Hollow symbols indicate odds ratios that aren't signficantly different from 1.0.)
0.0
0.5
1.0
1.5
2.0
2.5
<6 6-14 15-26 27-50 51-74 75+
Interpregnancy interval (months)
Odd
s rat
ios
Bleeding (withcontrols)Bleeding (nocontrols)RR=1
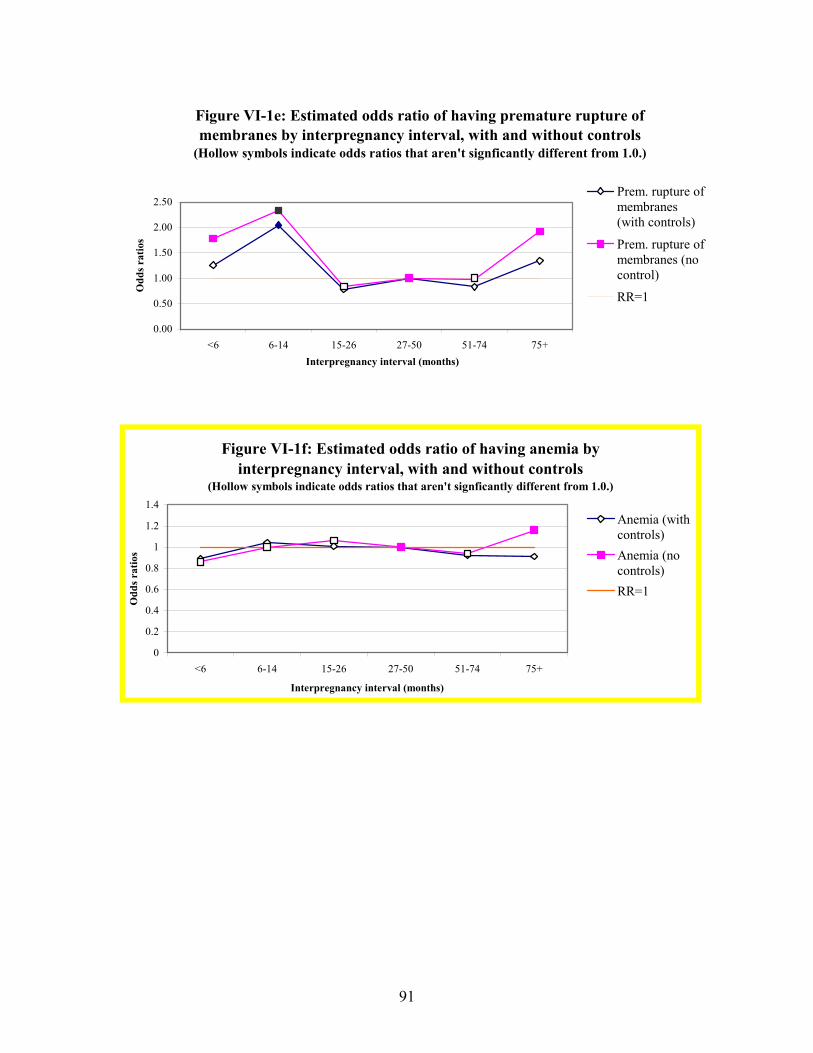
91
Figure VI-1e: Estimated odds ratio of having premature rupture of membranes by interpregnancy interval, with and without controls
(Hollow symbols indicate odds ratios that aren't signficantly different from 1.0.)
0.00
0.50
1.00
1.50
2.00
2.50
<6 6-14 15-26 27-50 51-74 75+Interpregnancy interval (months)
Odd
s rat
ios
Prem. rupture ofmembranes(with controls)
Prem. rupture ofmembranes (nocontrol)
RR=1
Figure VI-1f: Estimated odds ratio of having anemia by interpregnancy interval, with and without controls
(Hollow symbols indicate odds ratios that aren't signficantly different from 1.0.)
0
0.2
0.4
0.6
0.8
1
1.2
1.4
<6 6-14 15-26 27-50 51-74 75+
Interpregnancy interval (months)
Odd
s rat
ios
Anemia (withcontrols)Anemia (nocontrols)RR=1

92
Figure VI-1g: Estimated odds ratio of having edema by interpregnancy interval, with and without controls
(Hollow symbols indicate odds ratios that aren't signficantly different from 1.0.)
0.00
0.20
0.40
0.60
0.80
1.00
1.20
1.40
1.60
<6 6-14 15-26 27-50 51-74 75+
Interpregnancy interval (months)
Odd
s rat
ios
Edema (withcontrols)Edema (nocontrol)RR=1

93
VII. CHARACTERISTICS OF WOMEN WHO HAVE VERY SHORT OR VERY LONG INTERVALS
In this section we describe the characteristics of women who have different
lengths of intervals, so that we can identify the types of women most likely to have very
short intervals as well as those who have very long intervals. We focus on the lengths of
inter-outcome intervals, though in one case we also present interbirth intervals. With that
exception, the findings are very similar for these two measures of intervals.
Pregnancies following short inter-outcome intervals (<36 months) are less likely
to be to women who live in the Treatment Area of Matlab (Fig. VII-1). Only 35.2
percent of the pregnancies that occurred less than 36 months after the previous pregnancy
outcome were to women in the MCH-FP Area as opposed to 53.7 percent of those for
intervals longer than 36 months (p<.001). This suggests that women in the Treatment
Area are better able to use contraception (more often and more effectively) to control the
spacing of their pregnancies.
Women with short intervals are more likely to be of high birth parity than those
with longer intervals (Fig. VII-2). Of pregnancies preceded by an inter-outcome interval
of less than 36 months, 7.7 percent are of 8th birth order or higher, whereas only 4.6
percent of pregnancies that occur after an interval longer than 36 months are 8th birth
order or higher (p<.001). Short intervals enable women to reach high parity (more
quickly). High-parity women also may be more fecund or less likely to use contraception
(effectively) than others.
Women with long inter-outcome intervals (84 months or more) are more likely to
be older at the time of the second outcome of the pair of outcomes that define the interval
(Fig. VII-3). Pregnancies following inter-outcome intervals of 84 months or more are to
women who are on average 34.1 years old, compared with an average age of 28.1 for
women with inter-outcome intervals of less than 84 months (p<.001). Part of this
difference is due to the fact that, for the same age at the outcome at the beginning of an
interval, a longer interval means that women are older at the time of the outcome at the
end of the interval.

94
As shown in Figure VII-4, no education among the mothers is most common
among pregnancies following inter-outcome intervals of 24-35 months. Specifically,
58.2 percent of the women with the 24-35-month inter-outcome interval have no
education. For each of the inter-outcome interval categories, the percentage of women
who are Muslim is between 88 percent and 92 percent.
The mean inter-outcome interval has increased in duration since the 1980s, as
shown in Figure VII-5. Specifically, in the time period between 1982 and 1986, the mean
duration of inter-outcome interval was 24.6 months. In contrast, during the most recent
time period, 2000-2002, the mean duration of inter-outcome interval was 46.8 months.
We use two figures, Figs. VII-6 and VII-7, to show the effect of the type of
outcome of the pregnancy that immediately precedes the index pregnancy. In Fig. VII-6,
we show for each duration of inter-outcome interval the distribution of the types of
outcomes of the pregnancies that began the interval. In particular we show the
percentages of those preceding outcomes that were stillbirths, miscarriages, and induced
abortions. As shown in Fig. VII-6, we observe that over half (57.3 percent) of the inter-
outcome intervals that were less than 15 months in length began with a non-live birth.
Specifically, 8.3 percent of women with very short inter-outcome intervals had the
preceding pregnancy end with an induced abortion, 34.8 percent had the preceding
pregnancy end in miscarriage, and 14.5 percent had the preceding pregnancy end in a
stillbirth. One possible explanation for this for miscarriages and stillbirths, which
presumably are unexpected events, is that is the women want another child soon and
become pregnant again as soon as possible to “replace” the pregnancy they have just lost.
This is analogous to the replacement that follows a child death. An additional
explanation, which applies to all three types of non-live births, is that the women with
previous non-live births are able to become pregnant again sooner than are those with live
births because they were not breastfeeding (which is also a reason that intervals tend to
be shorter following the births of children who die in infancy).
We get very different results in Figure VII-7, where we consider interbirth
intervals and show the proportion of those that included an intervening non-live birth.
This figure shows that the longer the interbirth interval, the more likely it was that there
was a non-live birth between the two births. Nearly 21 percent of the very long interbirth
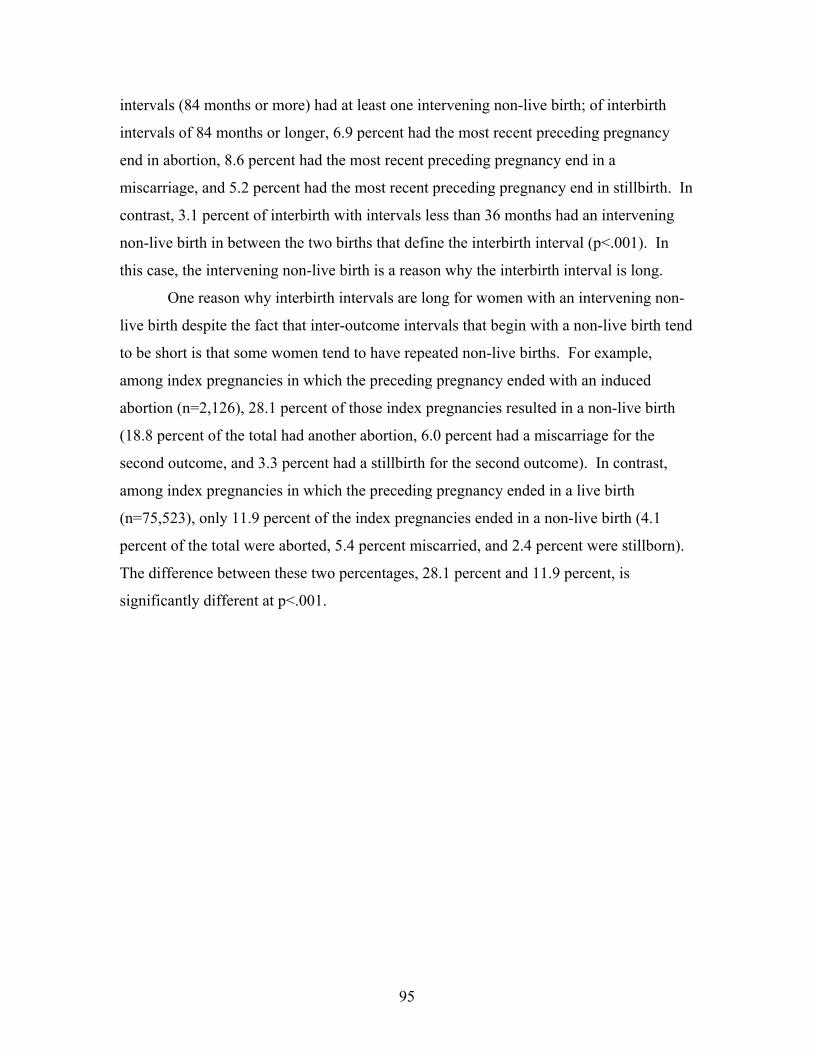
95
intervals (84 months or more) had at least one intervening non-live birth; of interbirth
intervals of 84 months or longer, 6.9 percent had the most recent preceding pregnancy
end in abortion, 8.6 percent had the most recent preceding pregnancy end in a
miscarriage, and 5.2 percent had the most recent preceding pregnancy end in stillbirth. In
contrast, 3.1 percent of interbirth with intervals less than 36 months had an intervening
non-live birth in between the two births that define the interbirth interval (p<.001). In
this case, the intervening non-live birth is a reason why the interbirth interval is long.
One reason why interbirth intervals are long for women with an intervening non-
live birth despite the fact that inter-outcome intervals that begin with a non-live birth tend
to be short is that some women tend to have repeated non-live births. For example,
among index pregnancies in which the preceding pregnancy ended with an induced
abortion (n=2,126), 28.1 percent of those index pregnancies resulted in a non-live birth
(18.8 percent of the total had another abortion, 6.0 percent had a miscarriage for the
second outcome, and 3.3 percent had a stillbirth for the second outcome). In contrast,
among index pregnancies in which the preceding pregnancy ended in a live birth
(n=75,523), only 11.9 percent of the index pregnancies ended in a non-live birth (4.1
percent of the total were aborted, 5.4 percent miscarried, and 2.4 percent were stillborn).
The difference between these two percentages, 28.1 percent and 11.9 percent, is
significantly different at p<.001.
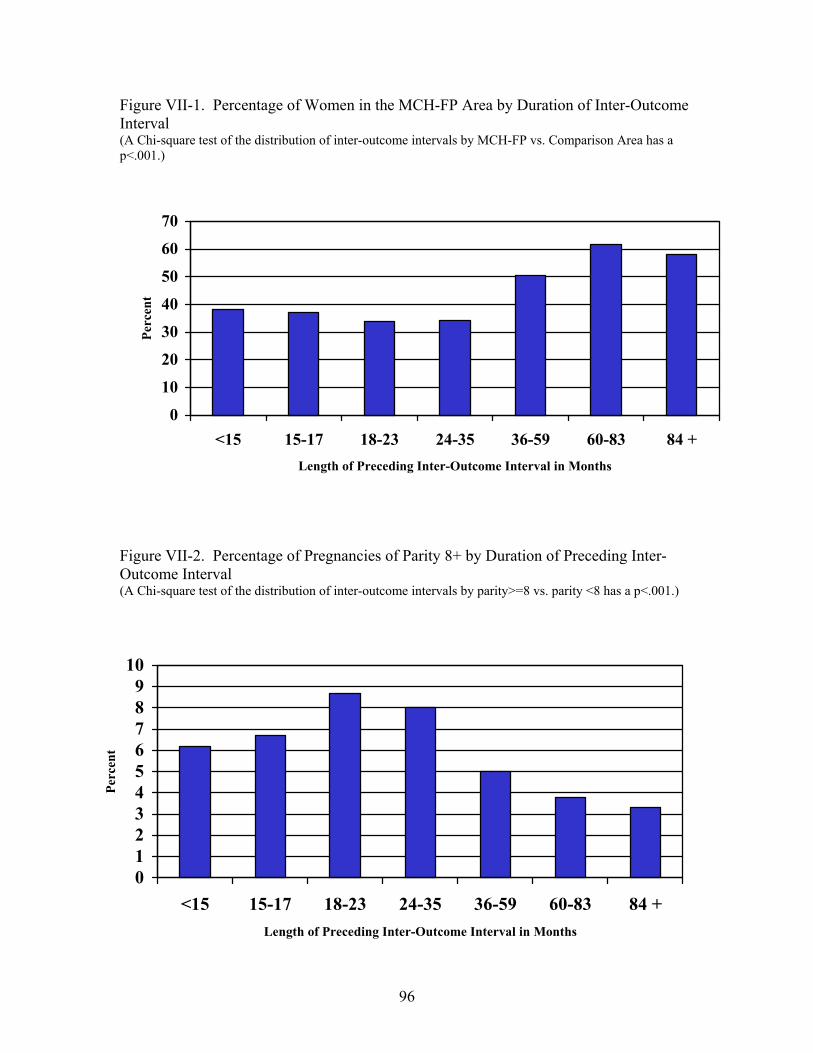
96
Figure VII-1. Percentage of Women in the MCH-FP Area by Duration of Inter-Outcome Interval (A Chi-square test of the distribution of inter-outcome intervals by MCH-FP vs. Comparison Area has a p<.001.)
Figure VII-2. Percentage of Pregnancies of Parity 8+ by Duration of Preceding Inter-Outcome Interval (A Chi-square test of the distribution of inter-outcome intervals by parity>=8 vs. parity <8 has a p<.001.)
0
10
20
30
40
50
60
70
<15 15-17 18-23 24-35 36-59 60-83 84 +Length of Preceding Inter-Outcome Interval in Months
Perc
ent
0123456789
10
<15 15-17 18-23 24-35 36-59 60-83 84 +Length of Preceding Inter-Outcome Interval in Months
Perc
ent

97
Figure VII-3. Mean Age of Women by Duration of Inter-Outcome Interval (A Chi-square test of the distribution of maternal age by inter-outcome intervals has a p<.001.)
Figure VII-4. Percentage Distribution of Mother’s with No Education by Duration of Inter-Outcome Interval (A Chi-square test of the distribution of inter-outcome intervals by no education vs. any education has a p<.001.)
05
10152025303540
<15 15-17 18-23 24-35 36-59 60-83 84 +Length of Preceding Inter-Outcome Interval in Months
Yea
r
0
10
20
30
40
50
60
70
<15 15-17 18-23 24-35 36-59 60-83 84 +Length of Preceding Inter-Outcome Interval in Months
Perc
ent

98
Figure VII-5. Mean Duration of Inter-Outcome Interval by Time Period (The difference between the mean inter-outcome interval for each time period and its adjacent time period is different from 0 at a significance level of p<.001, except for between 1997-1999 and 2000-2002 where p<.01.)
Figure VII-6. Percentage Distribution of Type of Preceding Pregnancy Outcome by Duration of Inter-Outcome Interval. (A Chi-square test of the distributions of previous pregnancy outcome by inter-outcome intervals has a p<.001.)
0
10
20
30
40
50
60
70
<15 15-17 18-23 24-35 36-59 60-83 84+
Length of Preceding Inter-Outcome Interval in Months
Perc
ent
Previous Pregnancy Stillbirth
Previous PregnancyMiscarriagePrevious Pregnancy Abortion
0
10
20
30
40
50
1982-1986 1987-1991 1992-1996 1997-1999 2000-2002Length of Preceding Inter-Outcome Interval in Months
Yea
r
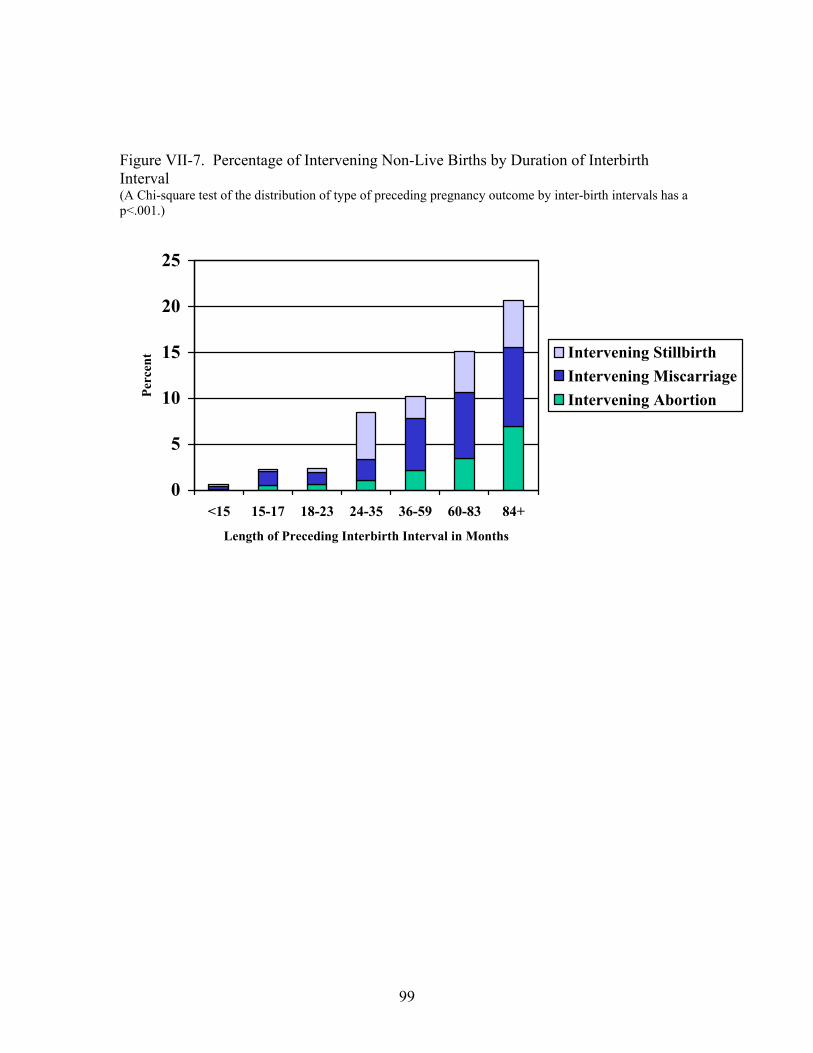
99
Figure VII-7. Percentage of Intervening Non-Live Births by Duration of Interbirth Interval (A Chi-square test of the distribution of type of preceding pregnancy outcome by inter-birth intervals has a p<.001.)
0
5
10
15
20
25
<15 15-17 18-23 24-35 36-59 60-83 84+
Length of Preceding Interbirth Interval in Months
Perc
ent Intervening Stillbirth
Intervening MiscarriageIntervening Abortion

100
VIII. CONCLUSION We conclude by answering the questions posed at the beginning of this report and then discussing some of their implications.
1) To what extent does the length of the preceding birth interval affect the risks of infant and child mortality? 2) Are the interval effects U-shaped? I.e., are both too-short and too-long intervals pernicious? And exactly what durations define too-short and too-long? We have seen that the risks of infant and child mortality vary significantly with the
durations of interbirth intervals when no other variables are controlled. Interbirth
intervals of less than 24 months in duration are associated with significantly higher risks
of early neonatal mortality, compared with intervals of 3-5 years in duration. Interbirth
intervals of less that 36 months are associated with significantly higher risks of late
neonatal mortality, post-neonatal mortality, and child mortality compared to intervals of
3-5 years in duration. For early and late neonatal mortality and post-neonatal mortality,
for intervals of less than 3 years in duration, mortality risk is higher the shorter the
interval; for all three subperiods, the risk is highest for the shortest interbirth interval (less
than 15 months). For childhood mortality, interbirth intervals of 18-23 months duration
are associated with the highest mortality.
For early neonatal mortality, interbirth intervals of 3-5 years duration have the
lowest risk of mortality (though mortality rates are also relatively low and not
significantly different for intervals that are 24-35 months and 60-83 months in length).
For late neonatal mortality, post-neonatal, and childhood mortality, the mortality risk is
lowest for interbirth intervals that are 5-7 years long.
For all four subperiods, mortality risks are somewhat higher for the longest
interbirth intervals that we consider – 7 or more years – than for those that are 5-7 years
long.

101
3) To what extent is the “effect” of longer interbirth intervals due to there being a non-live birth between the two births that define the interval? How do the effects of interbirth intervals compare to those of inter-outcome intervals (the interval back to the last pregnancy outcome, regardless of whether it was a live birth)? It is true that very long interbirth intervals are more likely to contain an intervening
non-live birth than shorter interbirth intervals. Twenty-one percent of interbirth intervals
of a duration of seven or more years included at least one intervening non-live birth,
whereas 3.1 percent of interbirth intervals less than three years duration included a non-
live birth. The effects of very long intervals are somewhat smaller when we consider
inter-outcome rather than interbirth intervals, and the pernicious effects of the longest
interval on early neonatal mortality is no longer statistically significant.
In general, the effect of inter-outcome intervals are smaller than the effect of
interbirth intervals. One reason is that short inter-outcome intervals that began with a
non-live birth have a smaller effect on mortality than those that began with a live birth.
4) To what extent is the effect of a short inter-outcome interval on infant and child mortality due to short gestation of the index pregnancy? What are the separate effects of the interpregnancy interval (the interval between the preceding pregnancy outcome and the conception of the index pregnancy) and of the duration of gestation of the index pregnancy?
Short gestation of pregnancy (prematurity) does indeed increase the risk that a
baby will die in the early neonatal, late neonatal, and post-neonatal periods, though it
does not have a significant effect on childhood mortality. The effects are greater the
more premature the birth and the earlier the subperiod that we consider. (I.e., the effects
are greatest [RR=8.9] for early neonatal mortality for babies born after a gestation of less
than 30 weeks.) Controlling for the duration of the pregnancy reduces the effects of short
inter-outcome intervals to a modest degree and, in a few cases, effects that were
statistically significant when gestation duration was not controlled are not significant
when it is controlled.

102
5) To what extent are the apparent effects of intervals on infant and child mortality due to factors such as breastfeeding and immunizations that are correlated with pregnancy spacing? Although the duration of breastfeeding has strong effect of survival between the
second and eighteenth months of life, controlling for breastfeeding barely changes the
estimates of the effects of inter-outcome intervals on mortality during these subperiods.
Having a diphtheria or measles vaccination prior to the 12-18-months-of-life and
1.5-5-years-of-life subperiods does not affect mortality during those periods.
Furthermore, the likelihoods of having these immunizations are not correlated with
pregnancy spacing. For both of these reasons, controlling for the child’s immunizations
has no effect of our estimates of the effects on inter-outcome intervals on mortality.
6) At what ages of child are the interval effects greatest? In particular, do the effects of the length of the preceding interval differ across subperiods of infancy and childhood? When all of the explanatory variables that we consider are controlled, the largest
relative risk is on early neonatal mortality for inter-outcome intervals of less than 15
months that began with a live birth (RR=3.03). The shortest inter-outcome interval is
also the most pernicious of all interval lengths considered for late neonatal and post-
neonatal mortality, though these are succeedingly smaller (RR=2.33 and 1.80
respectively) than the risk associated with such short intervals for early neonatal
mortality. The risk of childhood mortality is greatest for inter-outcome intervals of 18-23
months (RR=1.29, compared to intervals of 3-5 years), though intervals of 24-35 months
are also more pernicious (RR=1.21) than shorter or longer intervals.
7) Does the duration of the subsequent interval affect the likelihood of survival of the index child when appropriate attention is given to the reverse causality that can arise because subsequent intervals may be short because the index child died? To avoid the possibility of reverse causality, we consider whether the woman
became pregnant again or gave birth before the mortality subperiod under consideration.
We find index children were much more likely to die during childhood (RR=2.33) if the
mother was pregnant again by the time the index child was a year old. We find no
additional significant effect of the woman actually giving birth again before the index
103
child’s first birthday, but this is a rare event. Hence we do see a significant effect of short
subsequent interpregnancy intervals.
8) To what extent do the effects of short intervals on infant and child mortality appear to be due to maternal depletion? To what extent to they appear to be due to competition among closely spaced siblings?
A number of the relationships we find in our analyses of infant and child mortality
are consistent with the maternal depletion hypothesis, as are some we find for maternal
morbidity, discussed below. We see that short inter-outcome intervals are more
detrimental when they follow a live birth or stillbirth than when they follow a preceding
miscarriage or abortion. Because of their longer gestation, live births and stillbirths
should be more depleting than miscarriages or abortions. The effects of short inter-
outcome intervals are greatest when the preceding outcome was a live birth. The
breastfeeding that follows a live birth leads to further maternal depletion (and recall that
prolonged breastfeeding is very common in Bangladesh). Furthermore, if the child born
in the preceding pregnancy is still alive at the time of the index child’s birth, he or she
will compete with the index child for the family’s resources – thus lending some support
to the competition hypothesis – though we have found the interval effects are even
greater if the preceding live birth died than if it survived, which is not consistent with the
competition hypothesis. The depletion hypothesis is further supported by our finding that
effects are greatest for the shortest intervals (which allow the smallest time for
recuperation from the previous pregnancy) and in the neonatal period, when
physiological factors, such as maternal depletion, are most likely to play a role.
The fact that the most pernicious intervals become longer as the child ages is
consistent with competition, because children who are 2-3 years older than the index
child may be as or more competitive for the family’s time and resources as “older”
siblings that are even closer in age to the index child. However, as noted above, the fact
that interval effects are greater if the preceding live birth died than if it survived is not
consistent with the competition hypothesis, but instead appears to reflect a higher family-
level risk for all children in a family. Future research should attempt to control for this
unobserved family-level heterogeneity.

104
9) Does the interval between the preceding pregnancy outcome and the conception of the index pregnancy affect the outcome of the index pregnancy (i.e., whether it results in a live birth or not) and the duration of the gestation of the index pregnancy, e.g., whether the baby is born prematurely? The duration of an interpregnancy interval not only affects the survival of children
born at the end of a pregnancy, it also affects whether the pregnancy results in a live
birth. Short interpregnancy intervals are strongly associated with a very large increase in
the odds ratio of a non-live birth outcome. The odds of having an induced abortion is 10
times that of having a live birth when the woman becomes pregnant within 6 months of
the preceding pregnancy outcome. This suggests that many of the women who became
pregnant within 6 months of the preceding pregnancy did not intend to do so and opted
for an abortion to terminate the pregnancy. The odds of having a miscarriage or a
stillbirth after an interpregnancy interval of less than 6 months are also elevated relative
to having a live birth (OR=5.8 and OR=2.3, respectively).
Short preceding interpregnancy intervals (less than nine months) are also
associated with shorter gestation of pregnancy (i.e., more premature births) for live births
and stillbirths (and interpregnancy intervals of 9-14 months in duration are associated
with earlier induced abortions).
10) How does the length of the interpregnancy interval preceding a pregnancy affect the woman’s likelihood of morbidity during that pregnancy and her chance of dying from pregnancy-related causes? Are the interval effects on maternal outcomes U-shaped? I.e., are both too-short and too-long intervals pernicious?
Women with short interpregnancy intervals (<6 months or 6-14 months) have a
significantly higher risk of pre-eclampsia, high blood pressure, and premature rupture of
membranes compared with those with an interval of 27-50 months. A preceding
interpregnancy of less than six months duration is associated with a somewhat elevated
risk of maternal mortality compared to intervals of 27-50 months, but the relative risk
(RR=1.58 without controls and OR=1.28 with controls) is not statistically significant.
Women with very long interpregnancy intervals (75+ months) have a significantly
higher risk of pre-eclampsia, proteinuria, high blood pressure, and edema compared to
women with intervals of 27-50 months. Very long interpregnancy intervals are also
associated with significantly higher risks of maternal mortality. An interpregnancy

105
interval of 75 months or longer is associated with twice the mortality risk as an interval of
27-50 months.
We also find higher risks of pre-eclampsia, proteinuria, premature rupture of
membranes, edema, and of maternal mortality associated with first pregnancies. The risk
of maternal mortality associated with the first pregnancy is especially high for older
women. (The risk of anemia during pregnancy is significantly lower for first pregnancies
than higher-order ones and does not vary significantly with the length of the preceding
interpregnancy interval.)
Hence we find that both very short and very long interpregnancy intervals are
dangerous for women’s health, as are first pregnancies, especially to older women. For
pre-eclampsia and premature rupture of membranes, shorter intervals have a higher risk
than longer ones, whereas for high blood pressure and maternal mortality, very long
intervals have a higher risk than shorter ones.
The strong associations that we find of very long intervals and late childbearing
with maternal mortality and some morbidities (high blood pressure, anemia [older age
only], and edema) may reflect the fact that women who have difficulty becoming
pregnant may have health problems that also lead to higher risk of morbidity and
mortality. If they do become pregnant, such women merit special attention.
It is worth noting also that once we control for parity and the other independent
variables we consider, we do not find significantly higher maternal morbidity or mortality
for very young women or for high parity (once age is controlled), with the exception or
anemia for the latter.
11) Do the effects of intervals on infant, child, and maternal health and survival remain when those of other potentially confounding variables (e.g., mother’s age and education) are controlled? Adding controls for demographic and socioeconomic factors reduces the relative
risk associated with short inter-outcome intervals on infant and child mortality, but the
effects of short intervals remain statistically significant nonetheless. The sizes of the
reductions become larger as the child ages. That is, the reductions are relatively small in
the earlier neonatal period, are somewhat larger in the rest of the first year of life, and are
largest in the childhood period. After age one, when other variables are controlled,

106
preceding inter-outcome intervals of less than 18 months are no longer associated with
significant reductions in the risk of mortality compared to intervals 3-5 years in length,
but intervals of 18-35 months are still associated with a significantly increased risk of
mortality (of around 20-30%). Most of the socioeconomic and demographic variables
that we consider do have statistically significant effects on infant and child mortality.
Controlling for socioeconomic and demographic factors reduces somewhat the
effect of short interpregnancy intervals on maternal mortality (though the effects are not
statistically significant even without controls), and they also reduce somewhat the
deleterious effects of very long intervals (75+ months), though the effect long intervals
remain sizable and significant even after other variables are controlled.
Controlling for socioeconomic and demographic factors has relatively little effect
on the estimates of the effects of intervals on most morbidities, though it does sometimes
make differences that were statistically significant become insignificant. The largest
differences between controlling and not controlling for other factors are seen for
bleeding, premature rupture of membranes, and anemia. For bleeding, the interval effects
are not statistically significant either without or with controls. For premature rupture of
membranes and anemia, effects that were significant without controls become
insignificant when other variables are controlled.
12) How do the magnitudes of the health risks associated with “high-risk” intervals compare to those for other explanatory variables associated with a higher risk of poor maternal, infant, and outcomes?
The magnitudes of the risks associated with “high-risk” intervals are large
compared to those for other explanatory variables associated with a high risk of infant or
child mortality, especially during the first month of life. Babies born less than 15 months
after a preceding pregnancy outcome have an increased risk of early neonatal mortality
that is 3.0 times that of the lowest-risk group (three-to-five-year inter-outcome intervals).
By contrast, for the next highest-risk factor – young maternal age – we find that mothers
who are less than 18 years old have an increased risk of first-week mortality of 1.7
relative to the lowest-risk age category (25-29 year old women). In the post-neonatal
period and childhood, the adverse effects of low socioeconomic status and no education
on mortality are larger in magnitude than the effect of short intervals.

107
13) Do the effects of intervals differ across subgroups of the population? Are there certain subgroups for whom effects are larger than others? Our analyses of interactions of very short and very long intervals with key
explanatory variables did not reveal any subgroups for whom effects were significantly
greater than the others. Hence our analyses provide no indications that programs
designed to reduce the incidence of intervals that are unhealthy, short or long, should
focus on particular types of women.
14) What are the characteristics of the women who have the intervals lengths associated with poorer pregnancy, infant, child, and maternal outcomes?
Pregnancies following short inter-outcome intervals (<36 months) are more likely
to be to women who live in the Comparison Area of Matlab. This suggests that women
in the MCH-FP Area are better able to use contraception (more often and more
effectively) to control the spacing of their pregnancies.
Short inter-outcome intervals are also more likely to occur for younger women
and those whose preceding pregnancy ended in a non-live birth. Over half (57.3 percent)
of the inter-outcome intervals that were less than 15 months in length began with a non-
live birth, the majority of then miscarriages. It appears that these women want another
child soon and become pregnant again as soon as possible to “replace” the pregnancy
they have just lost. This may also reflect the fact that women with previous non-live
births are able to become pregnant again sooner than those with live births because they
were not breastfeeding.
Very long inter-outcome intervals are more common in the MCH-FP Area of
Matlab. And very long interbirth intervals are much more likely if there was an
intervening non-live birth. Nearly 21 percent of the women with very long interbirth
intervals (84 months or more) had at least one intervening non-live birth.
Other conclusions and implications are presented and discussed at the end of
Chapters IV and V. It is worth reiterating that more than half (57 percent) of all inter-
outcome intervals of known duration in our data are less than 36 months in length. Since
intervals of less than 36 months are associated with higher levels of infant and child

108
mortality and some maternal morbidities, there is plenty of opportunity in Bangladesh to
reduce these adverse health outcomes by improving the spacing of pregnancies. Our
simulations showed that the rates of infant and child mortality would be 5.8-9.4 percent
lower if all inter-outcome intervals were 3-5 years in duration. Furthermore, reducing the
incidence of short intervals will help reduce fertility rates in Bangladesh.

109
REFERENCES Akhter, Halida H., M. E. E. K. Chowdhury, Arindom Sen, “A cross-sectional study on
maternal morbidity in Bangladesh,” BIRPERHT, Dhaka, 1996. Alam, Nurul, “Birth spacing and infant and early childhood mortality in a high fertility
area of Bangladesh: age-dependent and interactive effects,” Journal of Biosocial Science, 27: 393-404, 1995.
Alam, Nurul, and Jeroen K. van Ginneken, “Repeated neonatal deaths in families with
special reference to causes of death,” Paediatric and Perinatal Epidemiology, 13:78-88, 1999.
Alauddin M., “Maternal mortality in rural Bangladesh: The Tangail District,” Studies in
Family Planning, 17(1):13-21, 1986. Anandalakshmy, P. N., P. B. Talwar, K. Buckshee, and V. Hingorani, “Demographic,
socio-economic and medical factors affecting maternal mortality-an Indian experience,” Journal of Family Welfare, 39:1-4, 1993.
Blacker, John G. C., “Health impacts of family planning,” Health Policy and Planning,
2:193-203, 1987. Boerma, J., and George T. Bicego, “Preceding Birth Intervals and Child Survival:
Searching for Pathways of Influence,” Studies in Family Planning, 23(4): 243-256, 1992.
Bongaarts, John, “Does family planning reduce infant mortality rates?” Population and
Development Review, 13 (2): 323-334, 1987. Caldwell, John C., Barkat-e-Khuda, Bruce Caldwell, Indrani Pieris, and Pat Caldwell,
“The Bangladesh Fertility Decline: An Interpretation,” Population and Development Review, 25: 1-67, 1999.
Chen L.C., M. C. Gesche, S. Ahmed, A. I. Chowdhury, and W. H. Mosley, “Maternal
mortality in rural Bangladesh,” Studies in Family Planning, 5, 11: 334-341, 1974. Cleland, John, G., and Z. A. Sathar, “The effect of birth spacing on childhood mortality
in Pakistan,” Population Studies, 38: 401-418, 1984. Conde-Agudelo, Agustin, “Effect of Birth Spacing on Maternal, Perinatal, and Neonatal
Health: A Systematic Review,” Draft report submitted to the CATALYST Consortium, July 2004.

110
Conde-Agudelo, Agustin, “Association between Interpregnancy Intervals and Maternal/Paternal Outcomes in Latin America,” paper presented at OSBI Regional Workshop, Washington, D.C., 2002.
Conde-Agudelo, Agustin, and José Belizán, “Maternal morbidity and mortality associated
with interpregnancy interval,” British Medical Journal, 321:1255-9, 2000. Curtis, Sian L., Ian Diamond, J. W. McDonald, “Birth interval and family effects on
postneonatal mortality in Brazil,” Demography, 30 (1): 34-43, 1993. DaVanzo, Julie, William P. Butz, and Jean-Pierre Habicht, “How biological and
behavioural influences on mortality in Malaysia vary during first year of life,” Population Studies, 37: 381-402, 1983.
DaVanzo, Julie, Mizanur Rahman, Abdur Razzaque, and Clifford Grammich, “Do
Family Planning Services Affect Choice of Abortion Method in Bangladesh?” paper presented at the annual meeting of the Population Association of America, Boston, 2004.
DaVanzo, Julie, and Ellen Starbird, “Correlates of Short Interbirth Intervals in Peninsular
Malaysia: Their Pathways of Influence Through Breastfeeding and Contraceptive Use,” Studies in Family Planning, 22(4): 241-254, 1991.
Dewey, Kathryn G., and Roberta J. Cohen, “Birth Spacing Literature Review: Maternal
and Child Nutrition Outcomes,” Draft report submitted to the CATALYST Consortium, July 2004.
Eastman N.J., “The effect of the interval between births on maternal and fetal outlook,”
Am J Obstet Gyneocol, 47: 445-66, 1944. Fauveau, V., K. Stewart, S. A. Khan, and J. Chakraborty, “Effect on mortality-based
maternal-care programme in rural Bangladesh,” The Lancet, 9: 1183-1186, 1991. Habicht, J-P., J. DaVanzo, and W.P. Butz, “Does Breastfeeding Really Save Lives, or are
Apparent Benefits Due to Biases?,” American Journal of Epidemiology, Vol. 123, No. 2, 1986.
Hobcraft, John N., J. W. McDonald, and Shea O. Rutstein, “Demographic determinants
of infant and early child mortality: A comparative analysis,” Population Studies, 39:363-385, 1985.
ICDDR,B: Center for Health and Population Research, Dhaka, Bangladesh, “Health and
Demographic Surveillance System-Matlab, Registration of Health and Demographic Events 2001,” Scientific Report, No. 90, 2003.

111
ICCDR,B: Centre for Health and Population Research, “Health and Demographic Surveillance System—Matlab: Registration of Demographic and Contraceptive Use 1998,” Scientific Report No. 87, 2000. Dhaka, Bangladesh.
Jahan, F. A., and S. F. Begum, “Maternal mortality in rural Bangladesh: The Jamalpur
District,” Studies in Family Planning, 17(1): 7-12, 1986. Khan, K.S., P.F. Chien, N.B. Khan, “Nutritional stress of reproduction,” Acta. Obstet.
Scand, 77: 395-401, 1998. Khan A., F. Jahan, and S. Begum, “Maternal mortality in rural Bangladesh: the Jamalpur
district,” Studies in Family Planning, 17(1): 95-99, 1986. Khan A., R. Rochat, F. Jahan, and S. Begum, “Induced abortion in a rural area of
Bangladesh,” Studies in Family Planning, 17(2): 95-99, 1986. Koenig Michael A., Vincent Fauveau, A.I. Chowdhury, Jyotsnamoy Chakraborty, and M.
A. Khan, “Maternal mortality in Matlab, Bangladesh: 1976-1985,” Studies in Family Planning, 19(2): 69-80, 1988.
Koenig, Michael A., James F. Phillips, Oona M. Campbell, and Stan D’Souza, “Birth
intervals and childhood mortality in rural Bangladesh,” Demography, 27(2): 251-265, 1990.
Maine, Deborah, Murat Z. Akalin, Jotsnamoy Chakraborty, Andres Francisco, and
Michael Strong, “Why did maternal mortality decline in Matlab?,” Studies in Family Planning, 27(4):179-187, 1996.
Majumder, A.K., “Child survival and its effect on mortality of siblings in Bangladesh,”
Journal of Biosocial Science, 22: 333-347, 1990. Miller, Jane E., “Birth intervals and perinatal health: an investigation of three
hypotheses,” Family Planning Perspectives, 23:62-70, 1991. Miller, Jane E., James Trussell, Anne R. Pebley, and B. Vaughan, “Birth spacing and
child mortality in Bangladesh and the Philippines,” Demography, 29 (2): 305-318, 1992.
Millman, Sara R., and Elizabeth C. Cooksey, “Birth Weight and the Effects of
Birthspacing and Breastfeeding on Infant Mortality,” Studies in Family Planning, 18(4): 202-212, 1987.
Ministry of Health and Family Welfare, HNP Strategic Investment Plan, July 2003 –
June 2010, Dhaka: Ministry of Health and Family Welfare, Government of People’s Republic of Bangladesh, 2004.

112
Mitra, S., M. Ali, S. Islam, A. Cross, and T. Saha, Bangladesh Demographic and Health Survey, 1993-1994. Dhaka, Bangladesh, and Calverton, Maryland: Mitra Associates and Macro International, Inc., 1994.
National Institute of Population Research and Training (INPORT), ORC Macro, Johns
Hopkins University (JHU) and International Centre for Diarrhoeal Disease Research (ICDDR,B), Bangladesh Maternal Health Services and Maternal Mortality-2001, Dhaka, Bangladesh. 2003.
National Institute of Population Research and Training (NIPORT), Bangladesh maternal
mortality and morbidity survey, Dhaka, Bangladesh, 2004. National Research Council, Contraception and Reproduction: Health Consequences for
Women and Children in the Developing World, National Academy Press, 1989. Palloni, Alberto, and Sara Millman, “Effects of Inter-Birth Intervals and Breastfeeding on
Infant and Early Childhood Mortality,” Population Studies, 40(2): 215-236. 1986. Population Reports, “Birth Spacing: Three to five saves lives,” Population Information
Program, Johns Hopkins University, 2002. Potter, Joseph E., “Birth spacing and child survival: A cautionary note regarding the
evidence from the WFS,” Population Studies, 42: 443-450, 1988. Rahman, M., J. DaVanzo, and A. Razzaque, “Socioeconomic, demographic, and
programmatic factors associated with abortion in Matlab, Bangladesh,” Pathfinder International report submitted to the Futures Group International, 2004.
Rahman, M., J. DaVanzo, and A. Razzaque, “Do Better Family Planning Services
Reduce Abortion in Bangladesh?” The Lancet, Vol. 358, No. 9287, September 2001.
Retherford, Robert, D. S. Thapa, B. B. Gubhaju, “To what extent does breastfeeding
explain birth-interval effects on early childhood mortality?,” Demography, 26(3): 439-450, 1989.
Ronsmans, C., and O. Campbell, “Short birth intervals don’t kill women: evidence from
Matlab, Bangladesh,” Studies in Family Planning, 29: 282-90, 1998. Ronsmans, C., Anne-Marie Vanneste, J. Chakraborty, and Jeroen van Ginneken,
“Decline in maternal mortality in Matlab, Bangladesh: A cautionary tale,” The Lancet, 350: 1810-1814, 1997.
Rutstein, Shea, “Effect of birth intervals on mortality and health: Multivariate cross-
country analysis,” MACRO International, 2000.

113
Rutstein, Shea, “Effect of Birth intervals on Mortality and Health: Multivariate Cross Country Analyses,” Presentation to USAID-sponsored Conference on Optimal Birthspacing for Central America, held in Antigua, Guatemala, 2003a.
Rutstein, Shea, “Effects of Preceding Birth and Pregnancy Intervals on Child Mortality
and Nutritional Status in Less Developed Countries: Evidence from the Demographic and Health Surveys,” unpublished paper, ORC Macro, 2003b.
Trussell, James, “Does family planning reduce infant mortality? An exchange,”
Population and Development Review, 14 (1): 171-178, 1988. UNICEF, The State of the World’s Children, 2004, UNICEF, New York, 2003. Van Ginneken, Jeroen K., “Prolonged Breastfeeding as a Birth Spacing Method,” Studies
in Family Planning, 5(6): 210-206, 1974. Winikoff, Beverly, “The effects of birth spacing on child and maternal health,” Studies in
Family Planning, 14 (10): 231-245, 1983. Winkvist, A., K. M. Rasmussen, J. P. Habicht, “A new definition of maternal depletion
syndrome,” American Journal of Public Health, 82: 691-694, 1992. World Bank, 2002 World Development Indicators, World Bank, 2002. World Health Organization “Making Maternity Care More Accessible,” Press Release
No. 59, Geneva, Switzerland: World Health Organization, 1993. World Health Organization and United Nations Children’s Fund 1996, “Revised 1990
Estimates of Maternal Mortality: A New Approach by WHO and UNICEF,” Geneva, Switzerland: World Health Organization.
Zenger, E., “Siblings’ neonatal mortality risks and birth spacing in Bangladesh,”
Demography, 30: 477-488, 1993. Zhu, Bao-Ping, Kathleen M. Haines, Thu Le, Katherine McGrath-Miller, and M.L.
Boulton, “Effect of the interval between pregnancies on perinatal outcomes among white and black women,” American Journal of Obstetrics and Gynecology, 1985:1403-10, 2001.
Zhu, Bao-Ping, R. T. Rolfs, B. E. Nangle, and J. M. Horan, “Effect of the interval
between pregnancies on perinatal outcomes,” The New England Journal of Medicine, 340 (8): 589-594, 1999.
Zimicki, Susan, “The relationship between fertility and maternal mortality,” in
Contraceptive Use and Controlled Fertility, Health Issues for Women and Children, Ed., Allan M. Parnell, Washington, DC, National Academy Press, 1989.

APPENDICES Appendix Table 1. Mean of all Explanatory Variables (n=142,773)
Proportion in the sample Inter-outcome Interval Duration IOI<15 months 0.07IOI: 15-17 months 0.03IOI: 18-23 months 0.07IOI: 24-35 months 0.18IOI: 36-59 months 0.18IOI: 60-83 months 0.06IOI: 84 plus months 0.03IOI unknown 0.16Duration of Pregnancy Gestation Gestation <30 weeks 0.02Gestation 30-31 weeks 0.03Gestation 32-33 weeks 0.05Gestation 34-35 weeks 0.10Gestation 36-37 weeks 0.15Gestation 38-39 weeks 0.09Gestation 40 plus weeks 0.03Gestation unknown 0.53Area Comparison Area 0.54MCH-FP 0.46Wantedness Status Not Wanted 0.01Wanted (RC) 0.15Wantedness unknown 0.84Birth Parity First Birth 0.28Parity 2-3 0.37Parity 4-7 0.30Parity 8 plus 0.05Maternal Education Mother's Ed: 0 years 0.50Mother's Ed: 1-5 years 0.30Mother's Ed: 6-10 years 0.16Mother's Ed: 11-16 years 0.02Mother's Ed unknown 0.02Father’s Education Father's Ed: 0 years 0.23Father's Ed: 1-5 years 0.29Father's Ed: 6-10 years 0.17Father's Ed: 11-16 years 0.05Father's Ed unknown 0.25

115
Maternal Age Mother's Age <18 0.03Mother's Age: 18-19 0.08Mother's Age: 20-24 0.33Mother's Age: 25-29 0.28Mother's Age: 30-34 0.17Mother's Age: 35 plus 0.12Gender34 Female 0.43Male 0.45Religion Non-Muslim 0.11Muslim 0.89Household Space Size House Size: Smallest Quartile 0.29House Size 2nd Quartile 0.29House Size 3rd Quartile 0.13House Size Largest Quartile 0.04House Size unknown 0.04Preceding Pregnancy Outcome Preceding Outcome Live Birth 0.93Preceding Outcome Abortion 0.01Preceding Outcome Miscarriage 0.04Preceding Outcome Stillbirth 0.02Year Year 1982-1986 0.25Year 1987-1991 0.26Year 1992-1996 0.22Year 1997-1999 0.13Year 2000-2002 0.14Month of Outcome January 0.09February 0.07March 0.07April 0.07May 0.07June 0.06July 0.07August 0.08September 0.09October 0.12November 0.12December 0.11
34 Gender of child is only known for live pregnancy outcomes. Thus, these numbers do not add to 1.0.
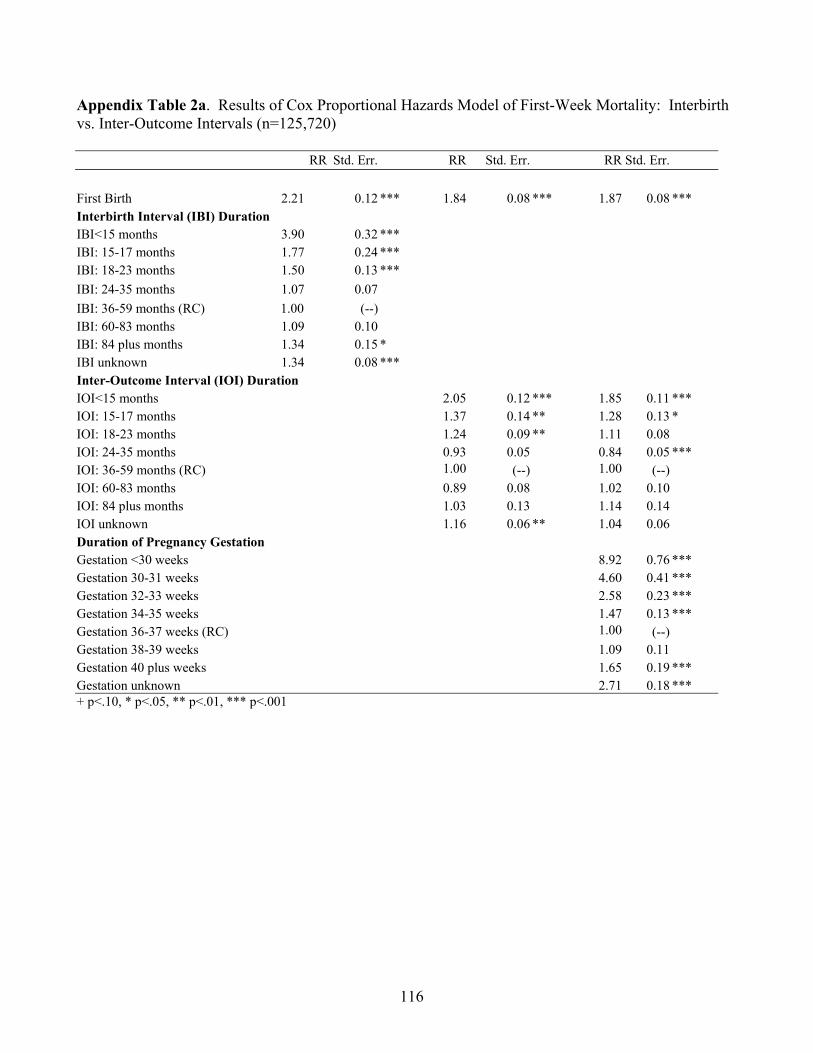
116
Appendix Table 2a. Results of Cox Proportional Hazards Model of First-Week Mortality: Interbirth vs. Inter-Outcome Intervals (n=125,720)
RR Std. Err. RR Std. Err. RR Std. Err. First Birth 2.21 0.12 *** 1.84 0.08 *** 1.87 0.08 *** Interbirth Interval (IBI) Duration IBI<15 months 3.90 0.32 *** IBI: 15-17 months 1.77 0.24 *** IBI: 18-23 months 1.50 0.13 *** IBI: 24-35 months 1.07 0.07 IBI: 36-59 months (RC) 1.00 (--) IBI: 60-83 months 1.09 0.10 IBI: 84 plus months 1.34 0.15 * IBI unknown 1.34 0.08 *** Inter-Outcome Interval (IOI) Duration IOI<15 months 2.05 0.12 *** 1.85 0.11 *** IOI: 15-17 months 1.37 0.14 ** 1.28 0.13 * IOI: 18-23 months 1.24 0.09 ** 1.11 0.08 IOI: 24-35 months 0.93 0.05 0.84 0.05 *** IOI: 36-59 months (RC) 1.00 (--) 1.00 (--) IOI: 60-83 months 0.89 0.08 1.02 0.10 IOI: 84 plus months 1.03 0.13 1.14 0.14 IOI unknown 1.16 0.06 ** 1.04 0.06 Duration of Pregnancy Gestation Gestation <30 weeks 8.92 0.76 *** Gestation 30-31 weeks 4.60 0.41 *** Gestation 32-33 weeks 2.58 0.23 *** Gestation 34-35 weeks 1.47 0.13 *** Gestation 36-37 weeks (RC) 1.00 (--) Gestation 38-39 weeks 1.09 0.11 Gestation 40 plus weeks 1.65 0.19 *** Gestation unknown 2.71 0.18 *** + p<.10, * p<.05, ** p<.01, *** p<.001

117
Appendix Table 2b. Results of Cox Proportional Hazards Model of Late Neonatal Mortality (weeks 2-4): Interbirth vs. Inter-Outcome Intervals (n=121,936) RR Std. Err. RR Std. Err. RR Std. Err. First Birth 2.25 0.18 *** 1.83 0.11 *** 1.87 0.13 ***Interbirth Interval (IBI) Duration IBI<15 months 3.31 0.44 *** IBI: 15-17 months 2.02 0.38 *** IBI: 18-23 months 1.74 0.21 *** IBI: 24-35 months 1.62 0.15 *** IBI: 36-59 months (RC) 1.00 (--) IBI: 60-83 months 0.72 0.12 * IBI: 84 plus months 0.93 0.19 IBI unknown 1.83 0.16 *** Inter-Outcome Interval (IOI) Duration IOI<15 months 1.67 0.16 *** 1.50 0.15 ***IOI: 15-17 months 1.43 0.21 * 1.32 0.20 + IOI: 18-23 months 1.42 0.14 ** 1.25 0.13 * IOI: 24-35 months 1.36 0.10 *** 1.20 0.10 * IOI: 36-59 months (RC) 1.00 (--) 1.00 (--) IOI: 60-83 months 0.59 0.10 ** 0.69 0.12 * IOI: 84 plus months 0.76 0.16 0.87 0.19 IOI unknown 1.53 0.12 *** 1.38 0.11 ***Duration of Pregnancy Gestation Gestation <30 weeks 5.41 0.79 ***Gestation 30-31 weeks 3.77 0.53 ***Gestation 32-33 weeks 2.51 0.33 ***Gestation 34-35 weeks 1.74 0.21 ***Gestation 36-37 weeks (RC) 1.00 (--) Gestation 38-39 weeks 0.85 0.13 Gestation 40 plus weeks 1.00 0.21 Gestation unknown 3.02 0.29 ***+ p<.10, * p<.05, ** p<.01, *** p<.001

118
Appendix Table 2c. Results of Cox Proportional Hazards Model of Post-neonatal Mortality (between day 29 and 365): Interbirth vs. Inter-Outcome Intervals (n=119,718)
RR Std. Err. RR Std. Err. RR Std. Err. First Birth 1.63 0.09 *** 1.41 0.06 *** 1.43 0.07 *** Interbirth Interval (IBI) Duration IBI<15 months 2.28 0.22 *** IBI: 15-17 months 2.25 0.26 *** IBI: 18-23 months 1.93 0.14 *** IBI: 24-35 months 1.33 0.08 *** IBI: 36-59 months (RC) 1.00 (--) IBI: 60-83 months 0.77 0.08 * IBI: 84 plus months 0.97 0.12 IBI unknown 1.73 0.10 *** Inter-Outcome Interval (IOI) Duration IOI<15 months 1.48 0.10 *** 1.39 0.10 *** IOI: 15-17 months 1.69 0.16 *** 1.60 0.15 *** IOI: 18-23 months 1.66 0.11 *** 1.53 0.10 *** IOI: 24-35 months 1.19 0.06 ** 1.10 0.06 IOI: 36-59 months (RC) 1.00 (--) 1.00 (--) IOI: 60-83 months 0.63 0.07 *** 0.69 0.07 *** IOI: 84 plus months 0.92 0.12 0.99 0.13 IOI unknown 1.56 0.08 *** 1.46 0.08 *** Duration of Pregnancy Gestation Gestation <30 weeks 2.39 0.26 *** Gestation 30-31 weeks 2.15 0.20 *** Gestation 32-33 weeks 1.65 0.13 *** Gestation 34-35 weeks 1.09 0.08 Gestation 36-37 weeks (RC) 1.00 (--) Gestation 38-39 weeks 0.89 0.08 Gestation 40 plus weeks 1.00 0.12 Gestation unknown 1.74 0.09 *** + p<.10, * p<.05, ** p<.01, *** p<.001

119
Appendix Table 2d. Results of Cox Proportional Hazards Model of Child Mortality: Interbirth vs. Inter-Outcome Intervals (n=110,191)
RR Std. Err. RR Std. Err. RR Std. Err. First Birth 0.96 0.06 0.90 0.05 + 0.90 0.05 + Interbirth Interval (IBI) Duration IBI<15 months 1.40 0.17 ** IBI: 15-17 months 1.29 0.19 + IBI: 18-23 months 1.70 0.13 *** IBI: 24-35 months 1.54 0.09 *** IBI: 36-59 months 1.00 (--) IBI: 60-83 months 0.63 0.07 *** IBI: 84 plus months 0.72 0.12 * IBI unknown 2.26 0.12 *** Inter-Outcome Interval (IOI) Duration IOI<15 months 1.24 0.10 * 1.17 0.10 + IOI: 15-17 months 1.18 0.15 1.12 0.14 IOI: 18-23 months 1.55 0.12 *** 1.44 0.11 ***IOI: 24-35 months 1.48 0.08 *** 1.37 0.08 ** IOI: 36-59 months (RC) 1.00 (--) 1.00 (--) IOI: 60-83 months 0.64 0.07 *** 0.69 0.08 ***IOI: 84 plus months 0.76 0.13 + 0.81 0.13 IOI unknown 2.25 0.12 *** 2.18 0.12 ***Duration of Pregnancy Gestation Gestation <30 weeks 1.13 0.16 Gestation 30-31 weeks 1.07 0.13 Gestation 32-33 weeks 1.16 0.11 Gestation 34-35 weeks 0.92 0.08 Gestation 36-37 weeks (RC) 1.00 (--) Gestation 38-39 weeks 0.80 0.08 * Gestation 40 plus weeks 1.07 0.13 Gestation unknown 1.54 0.09 ***+ p<.10, * p<.05, ** p<.01, *** p<.001

120
Appendix Table 3a. Results of Cox proportional hazards model of first-week mortality: Effects of inter-outcome intervals with and without controls for other explanatory variables (n=125,720)
RR Std. Err. RR Std. Err. First Birth 2.02 0.09 *** 1.89 0.11 ***Inter-outcome Interval Duration IOI<15 months 3.67 0.29 *** 3.03 0.25 ***IOI: 15-17 months 1.45 0.17 ** 1.32 0.15 * IOI: 18-23 months 1.32 0.11 ** 1.16 0.09 + IOI: 24-35 months 0.99 0.06 0.90 0.06 + IOI: 36-59 months (RC) 1.00 (--) 1.00 (--) IOI: 60-83 months 0.95 0.09 1.03 0.10 IOI: 84 plus months 1.10 0.14 1.08 0.14 IOI unknown 1.23 0.07 *** 1.15 0.08 * Preceding Pregnancy Outcome Preceding Outcome Live Birth (RC) 1.00 1.00 (--) Preceding Outcome Abortion 0.38 0.14 ** 0.77 0.18 Preceding Outcome Miscarriage 0.34 0.06 *** 1.16 0.15 Preceding Outcome Stillbirth 0.44 0.10 *** 1.16 0.18 Inter-outcome Interval * Non-live Prec. Outcome Interaction: IOI<15 months * Prec. outcome abortion 0.70 0.16 0.39 0.14 ** Interaction: IOI<15 months * Prec. outcome miscarriage 1.02 0.13 0.35 0.06 ***Interaction: IOI<15 months * Prec. outcome stillbirth 1.00 0.16 0.45 0.10 ***Duration of Pregnancy Gestation Gestation <30 weeks 8.62 0.75 ***Gestation 30-31 weeks 4.51 0.41 ***Gestation 32-33 weeks 2.51 0.22 ***Gestation 34-35 weeks 1.44 0.13 ***Gestation 36-37 weeks (RC) 1.00 (--) Gestation 38-39 weeks 1.10 0.11 Gestation 40 plus weeks 1.65 0.19 ***Gestation unknown 2.61 0.29 ***Area Comparison Area (RC) 1.00 (--) MCH-FP Area 0.95 0.09 Interaction: Gestation unknown* MCHFP 2.10 0.26 ***Wantedness Status Not Wanted 1.84 0.27 ***Wanted (RC) 1.00 (--) Wantedness unknown 0.86 0.06 * Birth Parity Parity 2-3 (RC) 1.00 (--) Parity 4-7 1.01 0.06 Parity 8 plus 1.35 0.14 ** Maternal Education Mother's Ed: 0 years (RC) 1.00 (--) Mother's Ed: 1-5 years 0.96 0.04

121
Mother's Ed: 6-10 years 0.81 0.05 ***Mother's Ed: 11-16 years 0.82 0.13 Mother's Ed unknown 0.97 0.11 Father’s Education Father's Ed: 0 years (RC) 1.00 (--) Father's Ed: 1-5 years 0.94 0.05 Father's Ed: 6-10 years 0.97 0.05 Father's Ed: 11-16 years 0.99 0.09 Father's Ed unknown 0.92 0.05 Maternal Age Mother's Age <18 1.75 0.16 ***Mother's Age: 18-19 1.36 0.10 ***Mother's Age: 20-24 1.05 0.06 Mother's Age: 25-29 (RC) 1.00 (--) Mother's Age: 30-34 1.04 0.06 Mother's Age: 35 plus 1.06 0.09 Gender Female 0.84 0.03 ***Male (RC) 1.00 (--) Religion Non-Muslim 1.26 0.06 ***Muslim (RC) 1.00 (--) Household Space Size House Size Smallest Quartile (RC) 1.00 (--) House Size 2nd Quartile 0.98 0.04 House Size 3rd Quartile 1.00 0.05 House Size Largest Quartile 0.89 0.06 + House Size unknown 1.00 0.09 Year Year 1982-1986 0.86 0.07 + Year 1987-1991 0.91 0.07 Year 1992-1996 0.90 0.07 Year 1997-1999 0.80 0.07 ** Year 2000-2002 (RC) 1.00 (--) Month of Birth January 1.00 0.07 February 0.88 0.07 March 0.74 0.06 ***April 0.85 0.07 + May 0.85 0.07 + June 0.89 0.08 July 0.93 0.07 August 1.04 0.08 September 1.03 0.07 October 0.99 0.07 November 0.89 0.06 + December (RC) 1.00 (--)
+ p<.10, * p<.05, ** p<.01, *** p<.001

122
Appendix Table 3b. Results of Cox proportional hazards model of late neonatal mortality: Effects of inter-outcome intervals with and without controls for other explanatory variables (n=121,936)
RR Std. Err. RR Std. Err. First Birth 2.04 0.14 *** 1.78 0.16 ***Inter-outcome Interval Duration IOI<15 months 3.02 0.39 *** 2.23 0.30 ***IOI: 15-17 months 1.81 0.30 *** 1.44 0.24 * IOI: 18-23 months 1.62 0.18 ** 1.27 0.14 * IOI: 24-35 months 1.48 0.12 *** 1.18 0.10 + IOI: 36-59 months (RC) 1.00 (--) 1.00 (--) IOI: 60-83 months 0.64 0.11 ** 0.85 0.15 IOI: 84 plus months 0.82 0.18 1.11 0.25 IOI unknown 1.64 0.13 *** 1.13 0.11 Preceding Pregnancy Outcome Preceding Outcome Live Birth (RC) 1.00 (--) 1.00 (--) Preceding Outcome Abortion 0.52 0.23 1.26 0.33 Preceding Outcome Miscarriage 0.71 0.22 0.63 0.15 * Preceding Outcome Stillbirth 0.40 0.16 * 0.94 0.22 Inter-outcome Interval * Non-live Prec. Outcome Interaction: IOI<15 months * Prec. outcome abortion 0.98 0.26 0.50 0.22 Interaction: IOI<15 months * Prec. outcome miscarriage 0.52 0.12 ** 0.75 0.23 Interaction: IOI<15 months * Prec. outcome stillbirth 0.72 0.18 0.36 0.14 * Duration of Pregnancy Gestation Gestation <30 weeks 4.59 0.68 ***Gestation 30-31 weeks 3.36 0.47 ***Gestation 32-33 weeks 2.33 0.30 ***Gestation 34-35 weeks 1.63 0.20 ***Gestation 36-37 weeks (RC) 1.00 (--) Gestation 38-39 weeks 0.92 0.14 Gestation 40 plus weeks 1.01 0.21 Gestation unknown 2.58 0.49 ***Area Comparison Area (RC) 1.00 (--) MCH-FP Area 1.13 0.26 Interaction: Gestation unknown* MCHFP 0.91 0.15 Wantedness Status Not Wanted 1.62 0.44 + Wanted (RC) Wantedness unknown 0.86 0.10 Birth Parity Parity 2-3 (RC) 1.00 (--) Parity 4-7 0.99 0.08 Parity 8 plus 1.27 0.18 + Maternal Education Mother's Ed: 0 years (RC) 1.00 (--) Mother's Ed: 1-5 years 0.87 0.05 *

123
Mother's Ed: 6-10 years 0.73 0.06 ***Mother's Ed: 11-16 years 0.39 0.14 ** Mother's Ed unknown 1.04 0.14 Father’s Education Father's Ed: 0 years (RC) 1.00 (--) Father's Ed: 1-5 years 0.92 0.07 Father's Ed: 6-10 years 0.94 0.08 Father's Ed: 11-16 years 0.67 0.11 * Father's Ed unknown 0.94 0.07 Maternal Age Mother's Age <18 2.17 0.29 ***Mother's Age: 18-19 1.44 0.15 ** Mother's Age: 20-24 1.29 0.10 ** Mother's Age: 25-29 (RC) 1.00 (--) Mother's Age: 30-34 1.22 0.11 * Mother's Age: 35 plus 1.09 0.13 Gender Female 0.95 0.05 Male (RC) 1.00 (--) Religion Non-Muslim 1.25 0.09 Muslim (RC) 1.00 (--) Household Space Size House Size Smallest Quartile (RC) 1.00 (--) House Size 2nd Quartile 0.93 0.06 House Size 3rd Quartile 0.99 0.07 House Size Largest Quartile 0.90 0.08 House Size unknown 0.85 0.13 Year Year 1982-1986 1.65 0.23 ***Year 1987-1991 1.45 0.20 ** Year 1992-1996 1.01 0.14 Year 1997-1999 0.79 0.12 Year 2000-2002 (RC) 1.00 (--) Month of Birth January 0.95 0.09 February 0.73 0.08 ** March 0.62 0.07 ***April 0.56 0.07 ***May 0.68 0.08 ** June 0.63 0.08 ***July 0.66 0.08 ***August 0.71 0.08 ** September 0.79 0.08 * October 0.81 0.07 * November 0.81 0.07 * December (RC) 1.00 (--)
+ p<.10, * p<.05, ** p<.01, *** p<.001
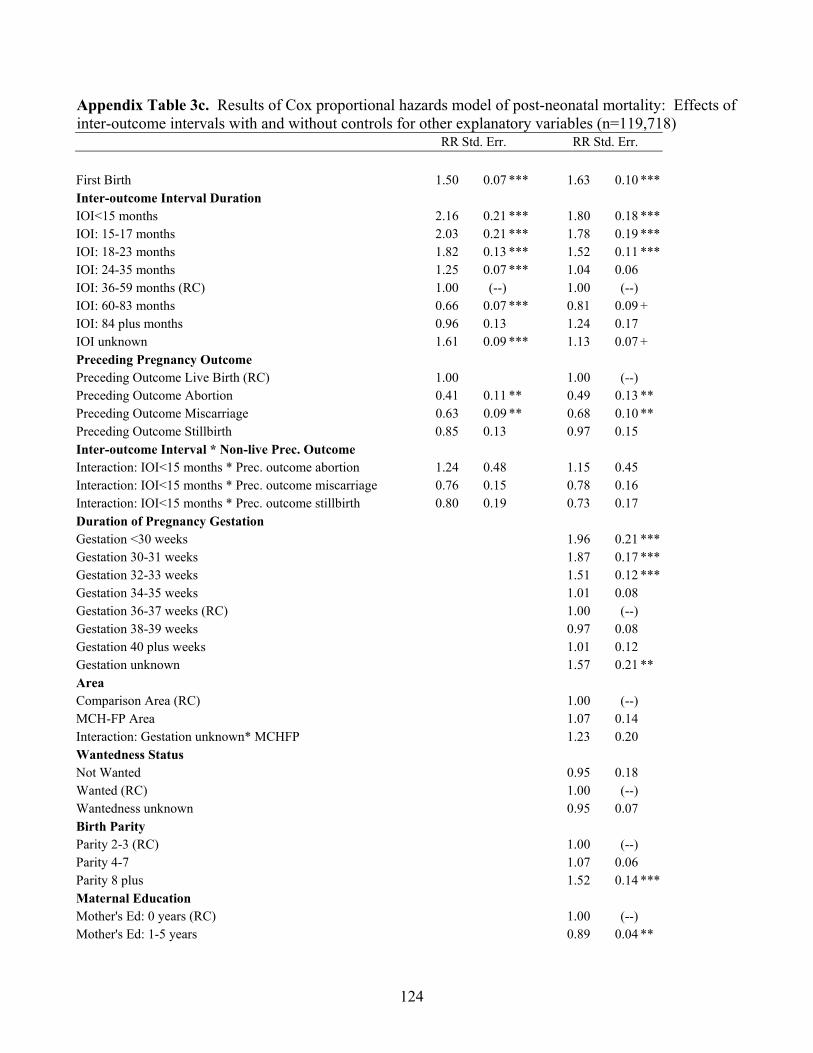
124
Appendix Table 3c. Results of Cox proportional hazards model of post-neonatal mortality: Effects of inter-outcome intervals with and without controls for other explanatory variables (n=119,718)
RR Std. Err. RR Std. Err. First Birth 1.50 0.07 *** 1.63 0.10 ***Inter-outcome Interval Duration IOI<15 months 2.16 0.21 *** 1.80 0.18 ***IOI: 15-17 months 2.03 0.21 *** 1.78 0.19 ***IOI: 18-23 months 1.82 0.13 *** 1.52 0.11 ***IOI: 24-35 months 1.25 0.07 *** 1.04 0.06 IOI: 36-59 months (RC) 1.00 (--) 1.00 (--) IOI: 60-83 months 0.66 0.07 *** 0.81 0.09 + IOI: 84 plus months 0.96 0.13 1.24 0.17 IOI unknown 1.61 0.09 *** 1.13 0.07 + Preceding Pregnancy Outcome Preceding Outcome Live Birth (RC) 1.00 1.00 (--) Preceding Outcome Abortion 0.41 0.11 ** 0.49 0.13 ** Preceding Outcome Miscarriage 0.63 0.09 ** 0.68 0.10 ** Preceding Outcome Stillbirth 0.85 0.13 0.97 0.15 Inter-outcome Interval * Non-live Prec. Outcome Interaction: IOI<15 months * Prec. outcome abortion 1.24 0.48 1.15 0.45 Interaction: IOI<15 months * Prec. outcome miscarriage 0.76 0.15 0.78 0.16 Interaction: IOI<15 months * Prec. outcome stillbirth 0.80 0.19 0.73 0.17 Duration of Pregnancy Gestation Gestation <30 weeks 1.96 0.21 ***Gestation 30-31 weeks 1.87 0.17 ***Gestation 32-33 weeks 1.51 0.12 ***Gestation 34-35 weeks 1.01 0.08 Gestation 36-37 weeks (RC) 1.00 (--) Gestation 38-39 weeks 0.97 0.08 Gestation 40 plus weeks 1.01 0.12 Gestation unknown 1.57 0.21 ** Area Comparison Area (RC) 1.00 (--) MCH-FP Area 1.07 0.14 Interaction: Gestation unknown* MCHFP 1.23 0.20 Wantedness Status Not Wanted 0.95 0.18 Wanted (RC) 1.00 (--) Wantedness unknown 0.95 0.07 Birth Parity Parity 2-3 (RC) 1.00 (--) Parity 4-7 1.07 0.06 Parity 8 plus 1.52 0.14 ***Maternal Education Mother's Ed: 0 years (RC) 1.00 (--) Mother's Ed: 1-5 years 0.89 0.04 **

125
Mother's Ed: 6-10 years 0.66 0.04 ***Mother's Ed: 11-16 years 0.51 0.11 ** Mother's Ed unknown 0.76 0.09 * Father’s Education Father's Ed: 0 years (RC) 1.00 (--) Father's Ed 0.97 0.05 Father's Ed 0.90 0.05 + Father's Ed: 11-16 years 0.94 0.09 Father's Ed unknown 0.99 0.05 Maternal Age 0.96 0.05 Mother's Age <18 1.35 0.14 ** Mother's Age: 18-19 1.09 0.08 Mother's Age: 20-24 1.09 0.06 Mother's Age: 25-29 (RC) 1.00 (--) Mother's Age: 30-34 1.12 0.06 * Mother's Age: 35 plus 1.24 0.09 ** Gender Female 1.04 0.03 Male (RC) 1.00 (--) Religion Non-Muslim 1.05 0.06 Muslim (RC) 1.00 (--) Household Space Size House Size Smallest Quartile (RC) 1.00 (--) House Size 2nd Quartile 0.89 0.04 ** House Size 3rd Quartile 0.90 0.04 * House Size Largest Quartile 0.79 0.05 ***House Size unknown 0.86 0.09 Year Year 1982-1986 2.15 0.22 ***Year 1987-1991 1.89 0.19 ***Year 1992-1996 1.41 0.14 ** Year 1997-1999 1.16 0.12 Year 2000-2002 (RC) 1.00 (--) Month of Birth January 1.06 0.08 February 0.94 0.07 March 0.89 0.07 April 0.80 0.07 ** May 0.72 0.06 ***June 0.71 0.07 ***July 0.99 0.08 August 0.87 0.07 + September 0.88 0.06 + October 1.03 0.07 November 1.06 0.07 December (RC) 1.00 (--)
+ p<.10, * p<.05, ** p<.01, *** p<.001

126
Appendix Table 3d. Results of Cox proportional hazards model of child mortality: Effects of inter-outcome intervals with and without controls for other explanatory variables (n=110,191)
RR Std. Err. RR Std. Err. First Birth 0.93 0.05 0.99 0.07 Inter-outcome Interval Duration IOI<15 months 1.39 0.17 ** 1.11 0.14 IOI: 15-17 months 1.37 0.18 * 1.10 0.14 IOI: 18-23 months 1.65 0.13 *** 1.29 0.10 ** IOI: 24-35 months 1.52 0.09 *** 1.21 0.07 ** IOI: 36-59 months (RC) 1.00 (--) 1.00 (--) IOI: 60-83 months 0.65 0.08 *** 0.78 0.09 * IOI: 84 plus months 0.77 0.13 0.99 0.17 IOI unknown 2.27 0.12 *** 1.39 0.09 ***Preceding Pregnancy Outcome Preceding Outcome Live Birth (RC) 1.00 (--) 1.00 (--) Preceding Outcome Abortion 3.10 1.34 ** 0.43 0.15 * Preceding Outcome Miscarriage 1.23 0.29 0.71 0.12 * Preceding Outcome Stillbirth 0.96 0.28 0.95 0.18 Inter-outcome Interval * Non-live Preg. Outcome Interaction: IOI<15 months * Prec. outcome abortion 0.37 0.12 ** 2.67 1.16 * Interaction: IOI<15 months * Prec. outcome miscarriage 0.64 0.11 ** 1.17 0.28 Interaction: IOI<15 months * Prec. outcome stillbirth 0.81 0.15 0.86 0.25 Duration of Pregnancy Gestation Gestation <30 weeks 0.90 0.13 Gestation 30-31 weeks 0.92 0.11 Gestation 32-33 weeks 1.06 0.10 Gestation 34-35 weeks 0.86 0.07 + Gestation 36-37 weeks (RC) 1.00 (--) Gestation 38-39 weeks 0.86 0.08 Gestation 40 plus weeks 1.03 0.12 Gestation unknown 1.09 0.20 Area Comparison Area (RC) 1.00 (--) MCH-FP Area 0.79 0.14 Interaction: Gestation unknown* MCHFP 1.20 0.26 Wantedness Status Not Wanted 1.11 0.23 Wanted (RC) 1.00 (--) Wantedness unknown 0.92 0.08 Birth Parity Parity 2-3 (RC) 1.00 (--) Parity 4-7 1.26 0.07 ***Parity 8 plus 1.60 0.15 ***Maternal Education Mother's Ed: 0 years (RC) 1.00 (--) Mother's Ed: 1-5 years 0.70 0.03 ***

127
Mother's Ed: 6-10 years 0.57 0.04 ***Mother's Ed: 11-16 years 0.44 0.12 ** Mother's Ed unknown 0.75 0.09 * Father’s Education Father's Ed: 0 years (RC) 1.00 (--) Father's Ed: 1-5 years 0.95 0.05 Father's Ed: 6-10 years 0.87 0.06 * Father's Ed: 11-16 years 0.82 0.10 + Father's Ed unknown 0.99 0.05 Maternal Age Mother's Age <18 1.10 0.15 Mother's Age: 18-19 1.02 0.09 Mother's Age: 20-24 1.00 0.05 Mother's Age: 25-29 (RC) 1.00 (--) Mother's Age: 30-34 1.03 0.06 Mother's Age: 35 plus 0.84 0.06 * Gender Female 1.49 0.05 ***Male (RC) 1.00 (--) Religion Non-Muslim 0.80 0.05 ** Muslim (RC) 1.00 (--) Household Space Size House Size Smallest Quartile (RC) 1.00 (--) House Size 2nd Quartile 0.94 0.04 House Size 3rd Quartile 0.83 0.04 ***House Size Largest Quartile 0.81 0.05 ** House Size unknown 0.71 0.09 ** Year Year 1982-1986 1.94 0.30 ***Year 1987-1991 1.19 0.18 Year 1992-1996 1.00 0.15 Year 1997-1999 0.82 0.13 Year 2000-2002 (RC) 1.00 (--) Month of Birth January 1.07 0.08 February 0.93 0.08 March 1.13 0.09 April 0.96 0.08 May 1.09 0.09 June 0.97 0.09 July 1.02 0.09 August 1.13 0.09 September 1.00 0.08 October 0.99 0.07 November 1.04 0.07 December (RC) 1.00 (--)

128
Subsequent Pregnancy and Birth Not Pregnant at 365 days (RC) 1.00 (--) Pregnant at 365 days 2.33 0.15 ***No Subsequent Birth at 365 days (RC) 1.00 (--) Subsequent Birth at 365 days 1.33 0.48
+ p<.10, * p<.05, ** p<.01, *** p<.001

129
Appendix 4a. Results of Cox Proportional Hazards Model of Early Post-Neonatal Mortality in the MCH-FP Area with and without Controls for Breastfeeding (n=56,075) RR Std. Err. RR Std. Err. First Birth 1.85 0.21 *** 1.85 0.21 *** Inter-outcome Interval Duration IOI<15 months 1.93 0.34 *** 1.90 0.34 *** IOI: 15-17 months 1.76 0.35 ** 1.84 0.37 ** IOI: 18-23 months 1.60 0.23 ** 1.64 0.23 *** IOI: 24-35 months 0.97 0.11 0.97 0.11 IOI: 36-59 months (RC) 1.00 (--) 1.00 (--) IOI: 60-83 months 0.78 0.14 0.77 0.14 IOI: 84 plus months 1.29 0.29 1.21 0.27 IOI unknown 0.95 0.11 0.94 0.11 Preceding Pregnancy Outcome Preceding Outcome Live Birth (RC) 1.00 (--) 1.00 (--) Preceding Outcome Abortion 0.33 0.24 0.31 0.22 Preceding Outcome Miscarriage 0.97 0.23 0.93 0.22 Preceding Outcome Stillbirth 0.72 0.24 0.71 0.24 Inter-outcome Interval * Non-live Preg. Outcome Interaction: IOI<15 months * Prec. outcome abortion 1.50 1.52 1.67 1.69 Interaction: IOI<15 months * Prec. outcome miscarriage 0.58 0.21 0.61 0.22 Interaction: IOI<15 months * Prec. outcome stillbirth 0.46 0.25 0.47 0.26 Duration of Pregnancy Gestation Gestation <30 weeks 2.39 0.31 *** 2.36 0.31 *** Gestation 30-31 weeks 2.07 0.24 *** 2.03 0.23 *** Gestation 32-33 weeks 1.65 0.17 *** 1.60 0.16 *** Gestation 34-35 weeks 1.06 0.10 1.05 0.10 Gestation 36-37 weeks (RC) 1.00 (--) 1.00 (--) Gestation 38-39 weeks 0.94 0.10 0.92 0.10 Gestation 40 plus weeks 1.09 0.16 1.10 0.16 Gestation unknown 2.34 0.30 *** 0.77 0.12 + Wantedness Status Not Wanted 0.91 0.22 0.83 0.20 Wanted (RC) 1.00 (--) 1.00 (--) Wantedness unknown 0.71 0.08 ** 0.69 0.08 ** Birth Parity Parity 2-3 (RC) 1.00 (--) 1.00 (--) Parity 4-7 1.53 0.16 *** 1.58 0.16 *** Parity 8 plus 2.98 0.55 *** 2.88 0.53 *** Maternal Education Mother's Ed: 0 years (RC) 1.00 (--) 1.00 (--) Mother's Ed: 1-5 years 0.82 0.06 * 0.83 0.06 * Mother's Ed: 6-10 years 0.73 0.08 ** 0.73 0.08 ** Mother's Ed: 11-16 years 0.61 0.20 0.51 0.17 * Mother's Ed unknown 0.60 0.13 * 0.60 0.13 *
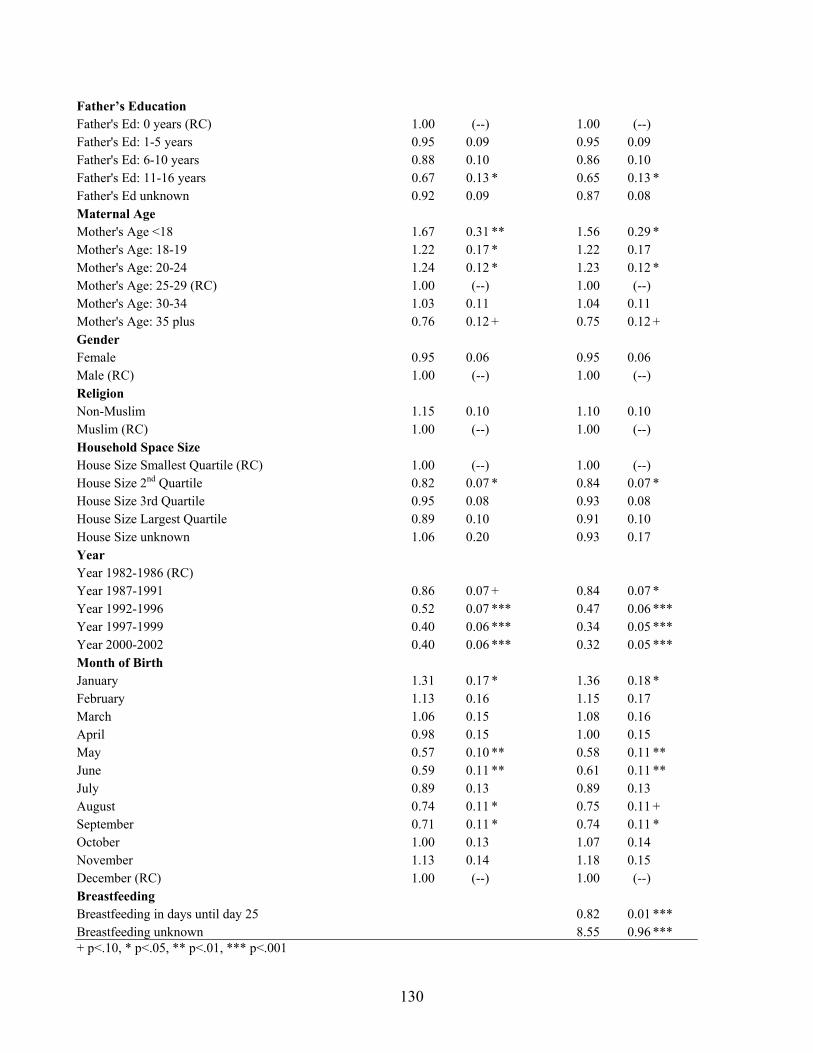
130
Father’s Education Father's Ed: 0 years (RC) 1.00 (--) 1.00 (--) Father's Ed: 1-5 years 0.95 0.09 0.95 0.09 Father's Ed: 6-10 years 0.88 0.10 0.86 0.10 Father's Ed: 11-16 years 0.67 0.13 * 0.65 0.13 * Father's Ed unknown 0.92 0.09 0.87 0.08 Maternal Age Mother's Age <18 1.67 0.31 ** 1.56 0.29 * Mother's Age: 18-19 1.22 0.17 * 1.22 0.17 Mother's Age: 20-24 1.24 0.12 * 1.23 0.12 * Mother's Age: 25-29 (RC) 1.00 (--) 1.00 (--) Mother's Age: 30-34 1.03 0.11 1.04 0.11 Mother's Age: 35 plus 0.76 0.12 + 0.75 0.12 + Gender Female 0.95 0.06 0.95 0.06 Male (RC) 1.00 (--) 1.00 (--) Religion Non-Muslim 1.15 0.10 1.10 0.10 Muslim (RC) 1.00 (--) 1.00 (--) Household Space Size House Size Smallest Quartile (RC) 1.00 (--) 1.00 (--) House Size 2nd Quartile 0.82 0.07 * 0.84 0.07 * House Size 3rd Quartile 0.95 0.08 0.93 0.08 House Size Largest Quartile 0.89 0.10 0.91 0.10 House Size unknown 1.06 0.20 0.93 0.17 Year Year 1982-1986 (RC) Year 1987-1991 0.86 0.07 + 0.84 0.07 * Year 1992-1996 0.52 0.07 *** 0.47 0.06 *** Year 1997-1999 0.40 0.06 *** 0.34 0.05 *** Year 2000-2002 0.40 0.06 *** 0.32 0.05 *** Month of Birth January 1.31 0.17 * 1.36 0.18 * February 1.13 0.16 1.15 0.17 March 1.06 0.15 1.08 0.16 April 0.98 0.15 1.00 0.15 May 0.57 0.10 ** 0.58 0.11 ** June 0.59 0.11 ** 0.61 0.11 ** July 0.89 0.13 0.89 0.13 August 0.74 0.11 * 0.75 0.11 + September 0.71 0.11 * 0.74 0.11 * October 1.00 0.13 1.07 0.14 November 1.13 0.14 1.18 0.15 December (RC) 1.00 (--) 1.00 (--) Breastfeeding Breastfeeding in days until day 25 0.82 0.01 *** Breastfeeding unknown 8.55 0.96 *** + p<.10, * p<.05, ** p<.01, *** p<.001
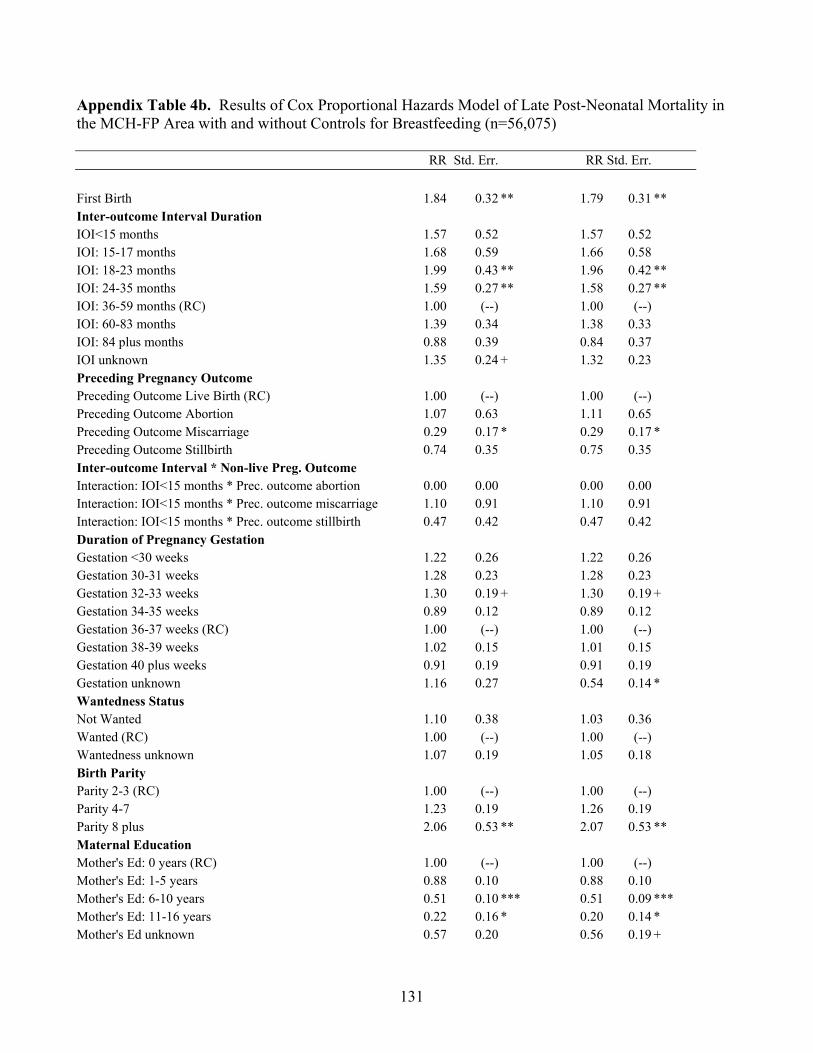
131
Appendix Table 4b. Results of Cox Proportional Hazards Model of Late Post-Neonatal Mortality in the MCH-FP Area with and without Controls for Breastfeeding (n=56,075) RR Std. Err. RR Std. Err. First Birth 1.84 0.32 ** 1.79 0.31 ** Inter-outcome Interval Duration IOI<15 months 1.57 0.52 1.57 0.52 IOI: 15-17 months 1.68 0.59 1.66 0.58 IOI: 18-23 months 1.99 0.43 ** 1.96 0.42 ** IOI: 24-35 months 1.59 0.27 ** 1.58 0.27 ** IOI: 36-59 months (RC) 1.00 (--) 1.00 (--) IOI: 60-83 months 1.39 0.34 1.38 0.33 IOI: 84 plus months 0.88 0.39 0.84 0.37 IOI unknown 1.35 0.24 + 1.32 0.23 Preceding Pregnancy Outcome Preceding Outcome Live Birth (RC) 1.00 (--) 1.00 (--) Preceding Outcome Abortion 1.07 0.63 1.11 0.65 Preceding Outcome Miscarriage 0.29 0.17 * 0.29 0.17 * Preceding Outcome Stillbirth 0.74 0.35 0.75 0.35 Inter-outcome Interval * Non-live Preg. Outcome Interaction: IOI<15 months * Prec. outcome abortion 0.00 0.00 0.00 0.00 Interaction: IOI<15 months * Prec. outcome miscarriage 1.10 0.91 1.10 0.91 Interaction: IOI<15 months * Prec. outcome stillbirth 0.47 0.42 0.47 0.42 Duration of Pregnancy Gestation Gestation <30 weeks 1.22 0.26 1.22 0.26 Gestation 30-31 weeks 1.28 0.23 1.28 0.23 Gestation 32-33 weeks 1.30 0.19 + 1.30 0.19 + Gestation 34-35 weeks 0.89 0.12 0.89 0.12 Gestation 36-37 weeks (RC) 1.00 (--) 1.00 (--) Gestation 38-39 weeks 1.02 0.15 1.01 0.15 Gestation 40 plus weeks 0.91 0.19 0.91 0.19 Gestation unknown 1.16 0.27 0.54 0.14 * Wantedness Status Not Wanted 1.10 0.38 1.03 0.36 Wanted (RC) 1.00 (--) 1.00 (--) Wantedness unknown 1.07 0.19 1.05 0.18 Birth Parity Parity 2-3 (RC) 1.00 (--) 1.00 (--) Parity 4-7 1.23 0.19 1.26 0.19 Parity 8 plus 2.06 0.53 ** 2.07 0.53 ** Maternal Education Mother's Ed: 0 years (RC) 1.00 (--) 1.00 (--) Mother's Ed: 1-5 years 0.88 0.10 0.88 0.10 Mother's Ed: 6-10 years 0.51 0.10 *** 0.51 0.09 *** Mother's Ed: 11-16 years 0.22 0.16 * 0.20 0.14 * Mother's Ed unknown 0.57 0.20 0.56 0.19 +

132
Father’s Education Father's Ed: 0 years (RC) 1.00 (--) 1.00 (--) Father's Ed: 1-5 years 1.07 0.16 1.06 0.15 Father's Ed: 6-10 years 0.88 0.16 0.86 0.15 Father's Ed: 11-16 years 1.47 0.36 1.44 0.36 Father's Ed unknown 1.12 0.16 1.07 0.16 Maternal Age Mother's Age <18 0.94 0.31 0.91 0.30 Mother's Age: 18-19 1.13 0.24 1.15 0.24 Mother's Age: 20-24 1.11 0.16 1.12 0.16 Mother's Age: 25-29 (RC) 1.00 (--) 1.00 (--) Mother's Age: 30-34 0.86 0.15 0.87 0.15 Mother's Age: 35 plus 1.19 0.24 1.19 0.24 Gender Female 1.28 0.12 ** 1.27 0.12 * Male (RC) 1.00 (--) 1.00 (--) Religion Non-Muslim 0.86 0.12 0.84 0.12 Muslim (RC) 1.00 (--) 1.00 (--) Household Space Size House Size Smallest Quartile (RC) 1.00 (--) 1.00 (--) House Size 2nd Quartile 0.79 0.10 + 0.80 0.10 + House Size 3rd Quartile 0.96 0.11 0.98 0.12 House Size Largest Quartile 0.67 0.12 * 0.69 0.12 * House Size unknown 0.52 0.20 + 0.47 0.19 + Year Year 1982-1986 (RC) Year 1987-1991 0.74 0.09 * 0.73 0.09 * Year 1992-1996 0.59 0.11 ** 0.56 0.11 ** Year 1997-1999 0.41 0.10 *** 0.40 0.10 *** Year 2000-2002 0.47 0.11 ** 0.42 0.10 *** Month of Birth January 0.84 0.18 0.83 0.18 February 0.67 0.16 0.66 0.16 + March 0.87 0.19 0.86 0.19 April 0.77 0.18 0.77 0.18 May 0.73 0.18 0.72 0.17 June 0.78 0.19 0.79 0.19 July 0.92 0.20 0.90 0.20 August 0.97 0.20 0.96 0.20 September 0.96 0.19 0.96 0.19 October 1.15 0.20 1.16 0.21 November 0.92 0.17 0.92 0.17 December (RC) 1.00 (--) 1.00 (--) Breastfeeding Breastfeeding in days until day 165 0.98 0.00 *** Breastfeeding unknown 4.19 0.92 *** + p<.10, * p<.05, ** p<.01, *** p<.001

133
Appendix Table 4c. Results of Cox Proportional Hazards Model of Mortality during the 12th – 18th month in the MCH-FP Area, with and without Controls for Breastfeeding and Immunizations (n=51,706) RR Std. Err. RR Std. Err. RR Std. Err. First Birth 1.003 0.20 0.99 0.20 0.97 0.20 Inter-outcome Interval Duration IOI<15 months 0.88 0.38 0.88 0.38 0.86 0.37 IOI: 15-17 months 1.94 0.64 * 1.93 0.64 * 1.91 0.63 * IOI: 18-23 months 1.15 0.31 1.13 0.31 1.12 0.31 IOI: 24-35 months 1.11 0.21 1.10 0.21 1.10 0.21 IOI: 36-59 months (RC) 1.00 (--) 1.00 (--) 1.00 (--) IOI: 60-83 months 0.61 0.19 0.60 0.19 0.60 0.18 + IOI: 84 plus months 1.08 0.40 1.02 0.38 1.01 0.37 IOI unknown 1.25 0.24 1.23 0.23 1.16 0.23 Preceding Pregnancy Outcome Preceding Outcome Live Birth (RC) 1.00 (--) 1.00 (--) Preceding Outcome Abortion 1.14 0.82 1.18 0.85 1.18 0.85 Preceding Outcome Miscarriage 0.55 0.29 0.55 0.29 0.55 0.29 Preceding Outcome Stillbirth 0.46 0.33 0.46 0.33 0.46 0.33 Inter-outcome Interval * Non-live Preg. Outcome Interaction: IOI<15 months * Prec. outcome abortion 0.00 0.00 0.00 0.00 0.00 0.00 Interaction: IOI<15 months * Prec. outcome miscarriage 2.44 1.84 2.46 1.85 2.47 1.86 Interaction: IOI<15 months * Prec. outcome stillbirth 1.85 2.01 1.86 2.02 1.84 2.01 Duration of Pregnancy Gestation Gestation <30 weeks 1.01 0.29 1.00 0.28 1.01 0.29 Gestation 30-31 weeks 1.14 0.26 1.12 0.25 1.12 0.26 Gestation 32-33 weeks 1.26 0.22 1.25 0.22 1.25 0.22 Gestation 34-35 weeks 0.89 0.14 0.89 0.14 0.89 0.14 Gestation 36-37 weeks (RC) 1.00 (--) 1.00 (--) 1.00 (--) Gestation 38-39 weeks 1.14 0.20 1.13 0.19 1.13 0.19 Gestation 40 plus weeks 1.18 0.26 1.19 0.26 1.18 0.26 Gestation unknown 1.61 0.39 * 0.83 0.23 0.80 0.23 Wantedness Status Not Wanted 1.18 0.43 1.15 0.42 1.15 0.42 Wanted (RC) 1.00 (--) 1.00 (--) 1.00 (--) Wantedness unknown 0.96 0.20 0.94 0.19 0.95 0.19 Birth Parity Parity 2-3 (RC) 1.00 (--) 1.00 (--) 1.00 (--) Parity 4-7 1.09 0.17 1.11 0.18 1.10 0.18 Parity 8 plus 1.79 0.54 + 1.77 0.53 + 1.74 0.52 + Maternal Education Mother's Ed: 0 years (RC) 1.00 (--) 1.00 (--) 1.00 (--) Mother's Ed: 1-5 years 0.70 0.10 * 0.70 0.10 ** 0.70 0.10 * Mother's Ed: 6-10 years 0.72 0.14 0.70 0.14 + 0.71 0.14 + Mother's Ed: 11-16 years 0.55 0.34 0.51 0.31 0.52 0.31 Mother's Ed unknown 0.89 0.29 0.88 0.29 0.88 0.29
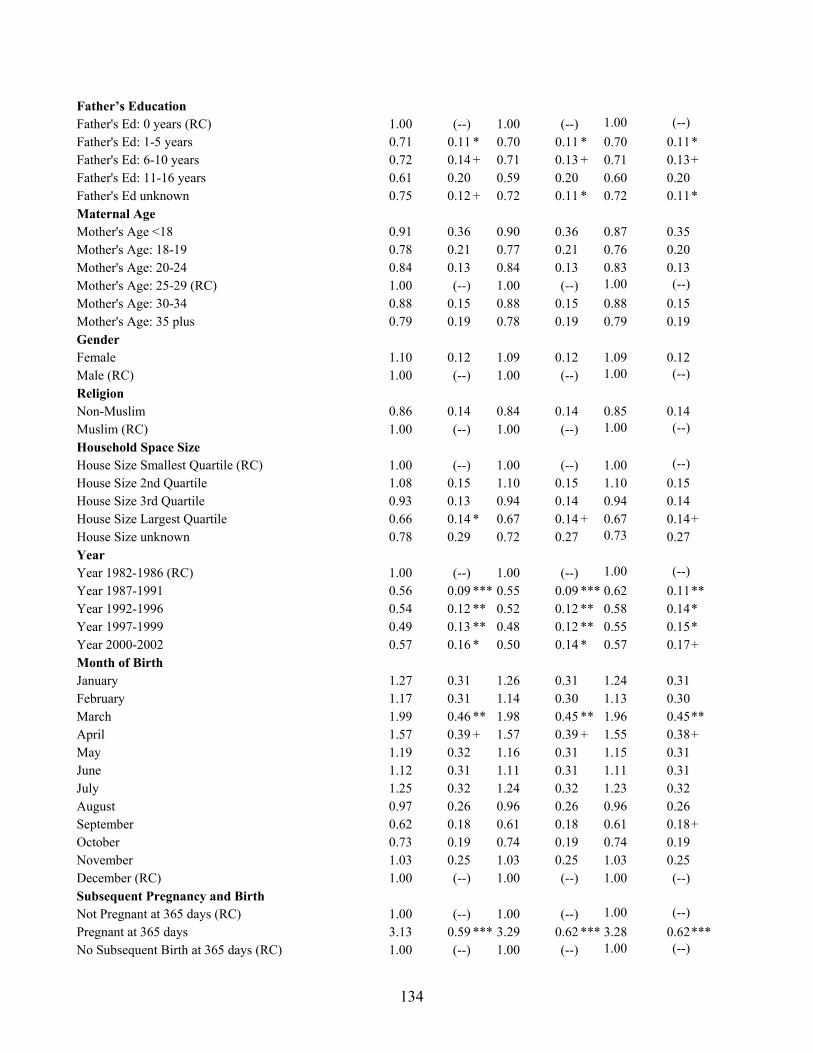
134
Father’s Education Father's Ed: 0 years (RC) 1.00 (--) 1.00 (--) 1.00 (--) Father's Ed: 1-5 years 0.71 0.11 * 0.70 0.11 * 0.70 0.11* Father's Ed: 6-10 years 0.72 0.14 + 0.71 0.13 + 0.71 0.13+ Father's Ed: 11-16 years 0.61 0.20 0.59 0.20 0.60 0.20 Father's Ed unknown 0.75 0.12 + 0.72 0.11 * 0.72 0.11* Maternal Age Mother's Age <18 0.91 0.36 0.90 0.36 0.87 0.35 Mother's Age: 18-19 0.78 0.21 0.77 0.21 0.76 0.20 Mother's Age: 20-24 0.84 0.13 0.84 0.13 0.83 0.13 Mother's Age: 25-29 (RC) 1.00 (--) 1.00 (--) 1.00 (--) Mother's Age: 30-34 0.88 0.15 0.88 0.15 0.88 0.15 Mother's Age: 35 plus 0.79 0.19 0.78 0.19 0.79 0.19 Gender Female 1.10 0.12 1.09 0.12 1.09 0.12 Male (RC) 1.00 (--) 1.00 (--) 1.00 (--) Religion Non-Muslim 0.86 0.14 0.84 0.14 0.85 0.14 Muslim (RC) 1.00 (--) 1.00 (--) 1.00 (--) Household Space Size House Size Smallest Quartile (RC) 1.00 (--) 1.00 (--) 1.00 (--) House Size 2nd Quartile 1.08 0.15 1.10 0.15 1.10 0.15 House Size 3rd Quartile 0.93 0.13 0.94 0.14 0.94 0.14 House Size Largest Quartile 0.66 0.14 * 0.67 0.14 + 0.67 0.14+ House Size unknown 0.78 0.29 0.72 0.27 0.73 0.27 Year Year 1982-1986 (RC) 1.00 (--) 1.00 (--) 1.00 (--) Year 1987-1991 0.56 0.09 *** 0.55 0.09 *** 0.62 0.11** Year 1992-1996 0.54 0.12 ** 0.52 0.12 ** 0.58 0.14* Year 1997-1999 0.49 0.13 ** 0.48 0.12 ** 0.55 0.15* Year 2000-2002 0.57 0.16 * 0.50 0.14 * 0.57 0.17+ Month of Birth January 1.27 0.31 1.26 0.31 1.24 0.31 February 1.17 0.31 1.14 0.30 1.13 0.30 March 1.99 0.46 ** 1.98 0.45 ** 1.96 0.45** April 1.57 0.39 + 1.57 0.39 + 1.55 0.38+ May 1.19 0.32 1.16 0.31 1.15 0.31 June 1.12 0.31 1.11 0.31 1.11 0.31 July 1.25 0.32 1.24 0.32 1.23 0.32 August 0.97 0.26 0.96 0.26 0.96 0.26 September 0.62 0.18 0.61 0.18 0.61 0.18+ October 0.73 0.19 0.74 0.19 0.74 0.19 November 1.03 0.25 1.03 0.25 1.03 0.25 December (RC) 1.00 (--) 1.00 (--) 1.00 (--) Subsequent Pregnancy and Birth Not Pregnant at 365 days (RC) 1.00 (--) 1.00 (--) 1.00 (--) Pregnant at 365 days 3.13 0.59 *** 3.29 0.62 *** 3.28 0.62***No Subsequent Birth at 365 days (RC) 1.00 (--) 1.00 (--) 1.00 (--)

135
Subsequent Birth at 365 days 0.91 0.93 0.88 0.90 0.90 0.92 Breastfeeding Breastfeeding in days until day 165 .996 0.001 ** .996 0.001** Breastfeeding unknown 4.46 1.12 *** 4.25 1.08***Immunizations No Measles shot at 365 days (RC) 1.00 (--) Measles shot at 365 days 0.95 0.13 No Diphtheria shot at 365 days (RC) 1.00 (--) Diphtheria shot at 365 days 0.83 0.15 + p<.10, * p<.05, ** p<.01, *** p<.001

136
Appendix Table 4d. Results of Cox Proportional Hazards Model of Mortality (n=49,712) between 1.5 and 5 years in the MCH-FP Area with and without Controls for Breastfeeding and Immunizations RR Std. Err. RR Std. Err. RR Std. Err. First Birth 0.94 0.12 0.94 0.12 0.92 0.12 Inter-outcome Interval Duration IOI<15 months 1.03 0.26 1.03 0.26 1.01 0.26 IOI: 15-17 months 1.02 0.28 1.02 0.28 1.02 0.28 IOI: 18-23 months 1.01 0.18 1.01 0.18 1.01 0.18 IOI: 24-35 months 1.11 0.13 1.11 0.13 1.12 0.13 IOI: 36-59 months (RC) 1.00 (--) 1.00 (--) 1.00 (--) IOI: 60-83 months 0.61 0.13 * 0.61 0.13 * 0.61 0.13* IOI: 84 plus months 0.97 0.28 0.96 0.28 0.94 0.27 IOI unknown 1.26 0.15 + 1.25 0.15 + 1.17 0.15 Preceding Pregnancy Outcome Preceding Outcome Live Birth (RC) 1.00 (--) 1.00 (--) 1.00 (--) Preceding Outcome Abortion 0.00 0.00 0.00 0.00 0.00 0.00 Preceding Outcome Miscarriage 0.77 0.26 0.77 0.26 0.77 0.26 Preceding Outcome Stillbirth 0.89 0.35 0.89 0.35 0.89 0.35 Inter-outcome Interval * Non-live Preg. Outcome Interaction: IOI<15 months * Prec. outcome abortion 0.83 . 0.82 . 0.84 .Interaction: IOI<15 months * Prec. outcome miscarriage 0.77 0.40 0.76 0.39 0.77 0.40 Interaction: IOI<15 months * Prec. outcome stillbirth 1.11 0.65 1.11 0.65 1.10 0.65 Duration of Pregnancy Gestation Gestation <30 weeks 0.88 0.15 0.89 0.15 0.89 0.15 Gestation 30-31 weeks 0.86 0.13 0.86 0.13 0.86 0.13 Gestation 32-33 weeks 0.98 0.11 0.98 0.11 0.98 0.11 Gestation 34-35 weeks 0.86 0.08 0.86 0.08 0.86 0.08 Gestation 36-37 weeks (RC) 1.00 (--) 1.00 (--) 1.00 (--) Gestation 38-39 weeks 0.77 0.09 * 0.77 0.09 * 0.77 0.09* Gestation 40 plus weeks 1.02 0.14 1.03 0.14 1.02 0.14 Gestation unknown 1.18 0.20 0.83 0.16 0.80 0.16 Wantedness Status Not Wanted 1.01 0.27 1.01 0.27 1.01 0.27 Wanted (RC) 1.00 (--) 1.00 (--) 1.00 (--) Wantedness unknown 0.88 0.13 0.86 0.12 0.87 0.12 Birth Parity Parity 2-3 (RC) 1.00 (--) 1.00 (--) Parity 4-7 1.38 0.14 ** 1.38 0.14 ** 1.37 0.14** Parity 8 plus 1.86 0.36 ** 1.84 0.36 ** 1.79 0.35** Maternal Education Mother's Ed: 0 years (RC) 1.00 (--) 1.00 (--) 1.00 (--) Mother's Ed: 1-5 years 0.76 0.07 ** 0.76 0.07 ** 0.76 0.07** Mother's Ed: 6-10 years 0.64 0.09 ** 0.63 0.09 ** 0.64 0.09** Mother's Ed: 11-16 years 0.43 0.20 + 0.42 0.19 + 0.42 0.19+ Mother's Ed unknown 0.87 0.18 0.87 0.18 0.88 0.18

137
Father’s Education Father's Ed: 0 years (RC) 1.00 (--) 1.00 (--) 1.00 (--) Father's Ed: 1-5 years 0.99 0.11 0.98 0.11 0.99 0.11 Father's Ed: 6-10 years 0.98 0.13 0.97 0.13 0.98 0.13 Father's Ed: 11-16 years 0.92 0.20 0.92 0.20 0.93 0.20 Father's Ed unknown 1.16 0.13 1.15 0.13 1.15 0.13 Maternal Age Mother's Age <18 1.26 0.32 1.27 0.32 1.22 0.31 Mother's Age: 18-19 1.00 0.17 0.99 0.17 0.97 0.17 Mother's Age: 20-24 1.08 0.11 1.08 0.11 1.07 0.11 Mother's Age: 25-29 (RC) 1.00 (--) 1.00 (--) 1.00 (--) Mother's Age: 30-34 1.00 0.11 1.00 0.11 1.00 0.11 Mother's Age: 35 plus 0.83 0.13 0.83 0.13 0.85 0.13 Gender Female 1.38 0.10 *** 1.38 0.10 *** 1.38 0.10***Male (RC) 1.00 (--) 1.00 (--) 1.00 (--) Religion Non-Muslim 0.65 0.08 *** 0.65 0.08 *** 0.65 0.08***Muslim (RC) 1.00 (--) 1.00 (--) 1.00 (--) Household Space Size House Size Smallest Quartile (RC) 1.00 (--) 1.00 (--) 1.00 (--) House Size 2nd Quartile 0.90 0.08 0.91 0.08 0.91 0.08 House Size 3rd Quartile 0.85 0.08 + 0.85 0.08 + 0.85 0.08+ House Size Largest Quartile 0.91 0.11 0.92 0.11 0.92 0.11 House Size unknown 0.72 0.19 0.70 0.18 0.70 0.18 Year Year 1982-1986 (RC) Year 1987-1991 0.66 0.06 *** 0.65 0.06 *** 0.71 0.08** Year 1992-1996 0.53 0.08 *** 0.52 0.08 *** 0.57 0.09***Year 1997-1999 0.44 0.08 *** 0.43 0.08 *** 0.48 0.09***Year 2000-2002 0.32 0.12 ** 0.32 0.11 ** 0.36 0.13** Month of Birth January 1.11 0.16 1.11 0.16 1.10 0.16 February 0.75 0.13 0.75 0.13 + 0.74 0.13+ March 1.00 0.16 1.00 0.16 1.00 0.16 April 0.61 0.12 * 0.62 0.12 * 0.61 0.12* May 1.06 0.17 1.06 0.17 1.06 0.17 June 0.76 0.14 0.76 0.14 0.75 0.14 July 0.97 0.16 0.98 0.16 0.97 0.16 August 1.13 0.17 1.13 0.17 1.13 0.17 September 1.03 0.15 1.02 0.15 1.02 0.15 October 0.82 0.12 0.83 0.12 0.82 0.12 November 0.85 0.12 0.85 0.12 0.85 0.12 December (RC) 1.00 (--) 1.00 (--) 1.00 (--) Subsequent Pregnancy and Birth Not Pregnant at 548 days (RC) 1.00 (--) 1.00 (--) 1.00 (--) Pregnant at 548 days 2.13 0.20 *** 2.15 0.20 *** 2.13 0.20***No Subsequent Birth at 548 days (RC) 1.00 (--) 1.00 (--) 1.00 (--)

138
Subsequent Birth at 548 days 0.85 0.21 0.90 0.22 0.92 0.23 Breastfeeding Breastfeeding in days until day 493 1.00 0.00 1.00 0.00 Breastfeeding unknown 2.96 0.67 *** 2.74 0.63***Immunizations No Measles shot at 548 days (RC) 1.00 (--) Measles shot at 548 days 0.92 0.10 No Diphtheria shot at 548 days (RC) 1.00 (--) Diphtheria shot at 548 days 0.84 0.10 + p<.10, * p<.05, ** p<.01, *** p<.001

139
Appendix Table 5. Results of Polytomous Logistic Regression for Pregnancy Outcome where Live Birth is the Reference Category (n=65,378) Abortion Miscarriage Stillbirth exp(ß) Std. Err. exp(ß) Std. Err. exp(ß) Std. Err. First Birth 4.77 0.10 *** 9.75 0.06 *** 11.06 0.08 *** Interpregnancy Interval Duration IPI<6 months 10.03 0.11 *** 5.81 0.09 *** 2.32 0.13 *** IPI: 6-8 months 3.89 0.21 *** 3.22 0.14 *** 2.43 0.18 *** IPI: 9-14 months 3.02 0.14 *** 2.37 0.10 *** 2.28 0.13 *** IPI: 15-26 months 1.97 0.11 *** 2.15 0.07 *** 1.98 0.09 *** IPI: 27-50 months (RC) 1.00 (--) 1.00 (--) 1.00 (--) IPI: 51-74 months 1.33 0.12 * 1.64 0.08 *** 1.30 0.11 * IPI: 75 plus months 1.74 0.12 *** 1.64 0.10 *** 1.53 0.14 ** IPI unknown 1.63 0.11 *** 1.43 0.08 *** 1.42 0.10 ** Wantedness Status Not Wanted 3.95 0.10 *** 1.56 0.11 *** 1.06 0.17 Wanted (RC) 1.00 (--) 1.00 (--) 1.00 (--) Wanted unknown 0.92 0.09 0.66 0.06 *** 0.76 0.07 *** Birth Parity Parity 2-3 (RC) 1.00 (--) 1.00 (--) 1.00 (--) Parity 4-7 0.57 0.08 *** 0.35 0.06 *** 0.39 0.08 *** Parity 8 plus 0.31 0.15 *** 0.22 0.13 *** 0.27 0.16 *** Maternal Education Mother's Ed: 0 years (RC) 1.00 (--) 1.00 (--) 1.00 (--) Mother's Ed: 1-5 years 1.19 0.07 * 0.94 0.04 0.89 0.06 + Mother's Ed: 6-10 years 1.60 0.08 *** 0.80 0.06 *** 0.71 0.08 *** Mother's Ed: 11-16 years 1.00 0.18 0.56 0.12 *** 0.39 0.18 *** Mother's Ed unknown 0.55 0.31 + 0.64 0.14 ** 0.80 0.17 Father’s Education Father's Ed: 0 years (RC) 1.00 (--) 1.00 (--) 1.00 (--) Father's Ed: 1-5 years 1.16 0.08 + 0.97 0.05 1.12 0.07 + Father's Ed: 6-10 years 1.29 0.09 ** 1.05 0.06 1.15 0.08 + Father's Ed: 11-16 years 1.14 0.13 1.08 0.09 0.92 0.13 Father's Ed unknown 1.02 0.09 0.92 0.06 0.99 0.07 Maternal Age Mother's Age <18 0.84 0.17 0.41 0.10 *** 0.17 0.18 *** Mother's Age: 18-19 0.37 0.15 *** 0.30 0.08 *** 0.24 0.10 *** Mother's Age: 20-24 0.41 0.10 *** 0.35 0.05 *** 0.36 0.07 *** Mother's Age: 25-29 (RC) 1.00 (--) 1.00 (--) 1.00 (--) Mother's Age: 30-34 2.97 0.09 *** 1.79 0.06 *** 2.29 0.08 *** Mother's Age: 35 plus 8.74 0.10 *** 4.55 0.08 *** 4.68 0.10 *** Religion Non-Muslim 1.35 0.08 *** 0.91 0.05 + 1.09 0.07 Muslim (RC) 1.00 (--) 1.00 (--) 1.00 (--) Household Space Size House Size Smallest Quartile (RC) 1.00 (--) 1.00 (--) 1.00 (--)

140
House Size 2nd Quartile 1.21 0.08 * 1.00 0.05 0.94 0.07 House Size 3rd Quartile 1.27 0.08 ** 0.97 0.05 0.95 0.06 House Size Largest Quartile 1.53 0.09 *** 0.94 0.06 0.85 0.08 + House Size unknown 1.66 0.14 *** 0.91 0.05 + 1.05 0.13 Preceding Pregnancy Outcome Preceding Outcome Live Birth (RC) 1.00 (--) 1.00 (--) 1.00 (--) Preceding Outcome Abortion 1.86 0.15 *** 0.48 0.20 *** 1.12 0.22 Preceding Outcome Miscarriage 0.11 0.21 *** 0.45 0.10 *** 0.57 0.14 *** Preceding Outcome Stillbirth 0.21 0.23 *** 0.44 0.12 *** 1.10 0.13 Year Year 1982-1986 (RC) 1.00 (--) 1.00 (--) 1.00 (--) Year 1987-1991 1.41 0.09 *** 0.88 0.06 * 0.84 0.07 * Year 1992-1996 0.91 0.12 0.56 0.07 *** 0.57 0.09 *** Year 1997-1999 0.85 0.13 0.49 0.08 *** 0.48 0.10 *** Year 2000-2002 1.15 0.12 0.70 0.07 *** 0.53 0.10 *** Month of Outcome January 1.21 0.16 1.39 0.10 ** 1.01 0.11 February 1.73 0.15 *** 1.63 0.10 *** 0.89 0.12 March 2.65 0.14 *** 2.08 0.10 *** 1.05 0.11 April 2.65 0.14 *** 2.54 0.09 *** 1.05 0.12 May 2.54 0.14 *** 2.91 0.09 *** 0.99 0.12 June 2.89 0.14 *** 3.13 0.09 *** 0.78 0.13 + July 2.20 0.14 *** 2.66 0.09 *** 0.87 0.12 August 1.74 0.15 *** 2.05 0.09 *** 0.96 0.11 September 1.52 0.14 ** 1.68 0.09 *** 1.03 0.10 October 1.18 0.15 1.37 0.09 ** 0.99 0.10 November 0.90 0.15 1.15 0.10 1.05 0.10 December (RC) 1.00 (--) 1.00 (--) 1.00 (--) Constant 0.003 0.20 *** 0.03 0.12 *** 0.03 0.14 *** + p<.10, * p<.05, ** p<.01, *** p<.001 note: exp(ß) = odds ratio
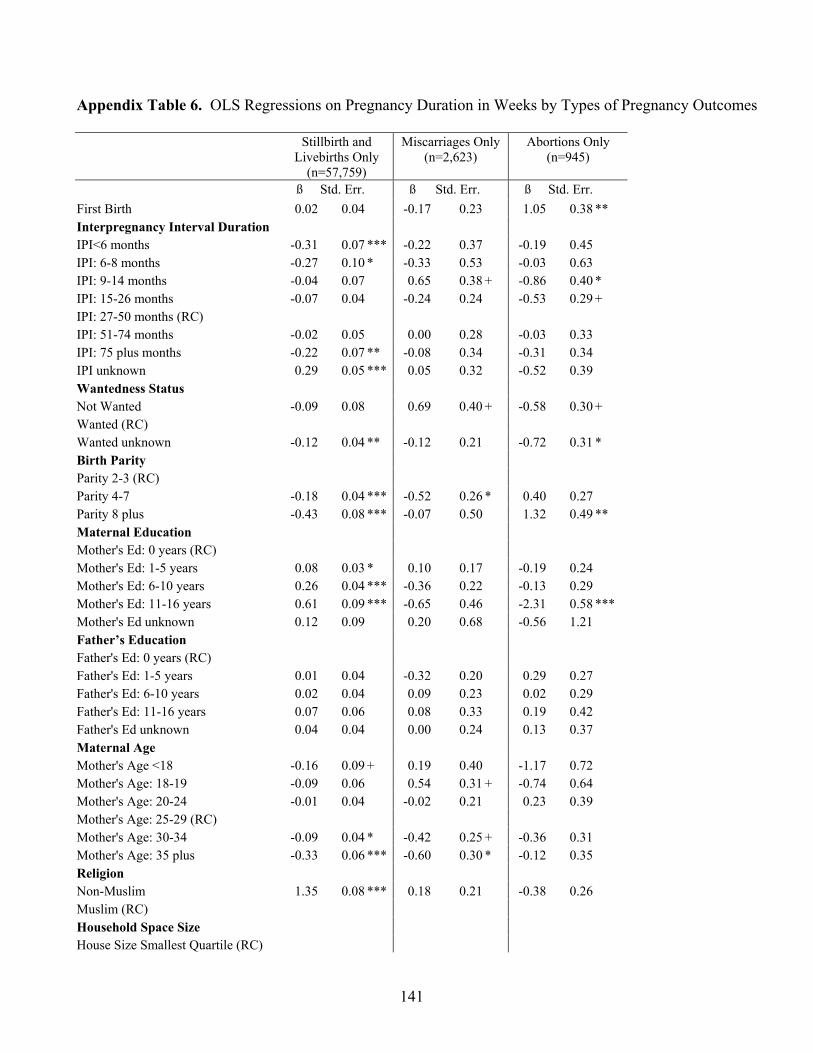
141
Appendix Table 6. OLS Regressions on Pregnancy Duration in Weeks by Types of Pregnancy Outcomes
Stillbirth and Livebirths Only
(n=57,759)
Miscarriages Only (n=2,623)
Abortions Only (n=945)
ß Std. Err. ß Std. Err. ß Std. Err. First Birth 0.02 0.04 -0.17 0.23 1.05 0.38 ** Interpregnancy Interval Duration IPI<6 months -0.31 0.07 *** -0.22 0.37 -0.19 0.45 IPI: 6-8 months -0.27 0.10 * -0.33 0.53 -0.03 0.63 IPI: 9-14 months -0.04 0.07 0.65 0.38 + -0.86 0.40 * IPI: 15-26 months -0.07 0.04 -0.24 0.24 -0.53 0.29 + IPI: 27-50 months (RC) IPI: 51-74 months -0.02 0.05 0.00 0.28 -0.03 0.33 IPI: 75 plus months -0.22 0.07 ** -0.08 0.34 -0.31 0.34 IPI unknown 0.29 0.05 *** 0.05 0.32 -0.52 0.39 Wantedness Status Not Wanted -0.09 0.08 0.69 0.40 + -0.58 0.30 + Wanted (RC) Wanted unknown -0.12 0.04 ** -0.12 0.21 -0.72 0.31 * Birth Parity Parity 2-3 (RC) Parity 4-7 -0.18 0.04 *** -0.52 0.26 * 0.40 0.27 Parity 8 plus -0.43 0.08 *** -0.07 0.50 1.32 0.49 ** Maternal Education Mother's Ed: 0 years (RC) Mother's Ed: 1-5 years 0.08 0.03 * 0.10 0.17 -0.19 0.24 Mother's Ed: 6-10 years 0.26 0.04 *** -0.36 0.22 -0.13 0.29 Mother's Ed: 11-16 years 0.61 0.09 *** -0.65 0.46 -2.31 0.58 *** Mother's Ed unknown 0.12 0.09 0.20 0.68 -0.56 1.21 Father’s Education Father's Ed: 0 years (RC) Father's Ed: 1-5 years 0.01 0.04 -0.32 0.20 0.29 0.27 Father's Ed: 6-10 years 0.02 0.04 0.09 0.23 0.02 0.29 Father's Ed: 11-16 years 0.07 0.06 0.08 0.33 0.19 0.42 Father's Ed unknown 0.04 0.04 0.00 0.24 0.13 0.37 Maternal Age Mother's Age <18 -0.16 0.09 + 0.19 0.40 -1.17 0.72 Mother's Age: 18-19 -0.09 0.06 0.54 0.31 + -0.74 0.64 Mother's Age: 20-24 -0.01 0.04 -0.02 0.21 0.23 0.39 Mother's Age: 25-29 (RC) Mother's Age: 30-34 -0.09 0.04 * -0.42 0.25 + -0.36 0.31 Mother's Age: 35 plus -0.33 0.06 *** -0.60 0.30 * -0.12 0.35 Religion Non-Muslim 1.35 0.08 *** 0.18 0.21 -0.38 0.26 Muslim (RC) Household Space Size House Size Smallest Quartile (RC)
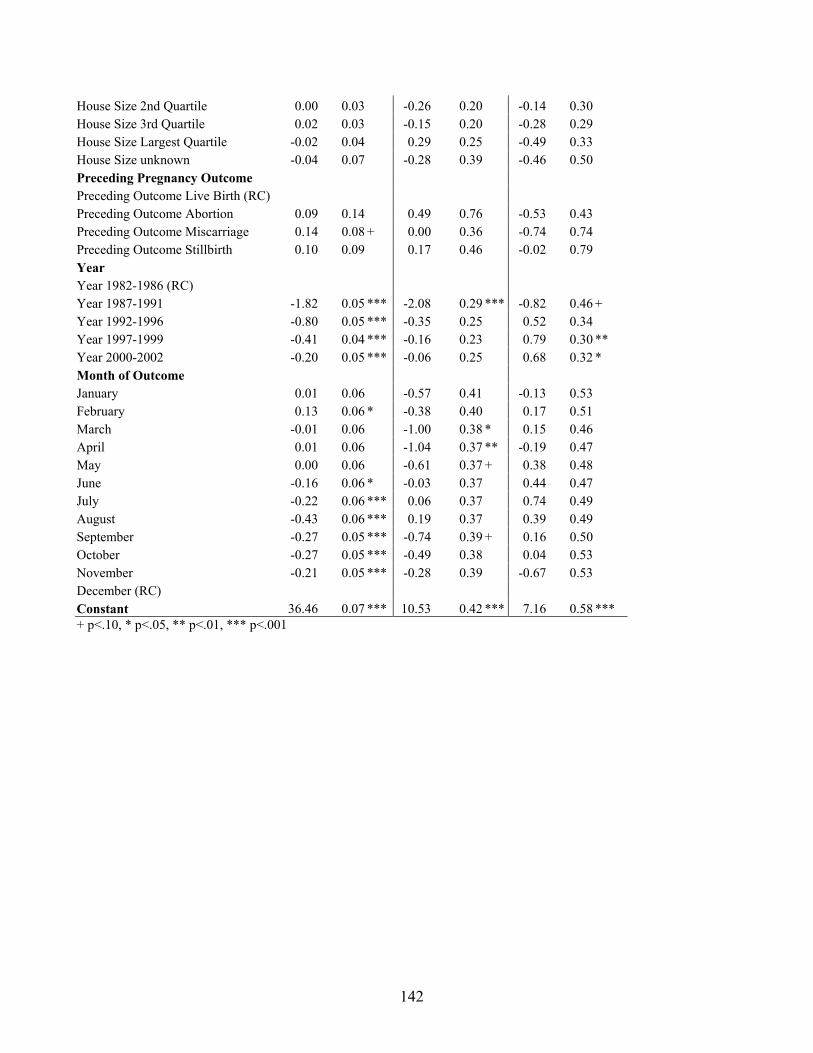
142
House Size 2nd Quartile 0.00 0.03 -0.26 0.20 -0.14 0.30 House Size 3rd Quartile 0.02 0.03 -0.15 0.20 -0.28 0.29 House Size Largest Quartile -0.02 0.04 0.29 0.25 -0.49 0.33 House Size unknown -0.04 0.07 -0.28 0.39 -0.46 0.50 Preceding Pregnancy Outcome Preceding Outcome Live Birth (RC) Preceding Outcome Abortion 0.09 0.14 0.49 0.76 -0.53 0.43 Preceding Outcome Miscarriage 0.14 0.08 + 0.00 0.36 -0.74 0.74 Preceding Outcome Stillbirth 0.10 0.09 0.17 0.46 -0.02 0.79 Year Year 1982-1986 (RC) Year 1987-1991 -1.82 0.05 *** -2.08 0.29 *** -0.82 0.46 + Year 1992-1996 -0.80 0.05 *** -0.35 0.25 0.52 0.34 Year 1997-1999 -0.41 0.04 *** -0.16 0.23 0.79 0.30 ** Year 2000-2002 -0.20 0.05 *** -0.06 0.25 0.68 0.32 * Month of Outcome January 0.01 0.06 -0.57 0.41 -0.13 0.53 February 0.13 0.06 * -0.38 0.40 0.17 0.51 March -0.01 0.06 -1.00 0.38 * 0.15 0.46 April 0.01 0.06 -1.04 0.37 ** -0.19 0.47 May 0.00 0.06 -0.61 0.37 + 0.38 0.48 June -0.16 0.06 * -0.03 0.37 0.44 0.47 July -0.22 0.06 *** 0.06 0.37 0.74 0.49 August -0.43 0.06 *** 0.19 0.37 0.39 0.49 September -0.27 0.05 *** -0.74 0.39 + 0.16 0.50 October -0.27 0.05 *** -0.49 0.38 0.04 0.53 November -0.21 0.05 *** -0.28 0.39 -0.67 0.53 December (RC) Constant 36.46 0.07 *** 10.53 0.42 *** 7.16 0.58 *** + p<.10, * p<.05, ** p<.01, *** p<.001

143
Appendix Table 7a. Results of Cox proportional hazards model of first-week mortality: Effects of MCH-FP area with and without controls for reproductive variables (n=125,720)
RR Std. Err. RR Std. Err. Area Comparison Area (RC) 1.00 (--) 1.00 (--) MCH-FP Area 0.84 0.03 *** 1.03 0.09 Interaction: Gestation unknown* MCHFP 1.08 0.24 Inter-outcome Interval Duration IOI<15 months 3.01 0.24 ***IOI: 15-17 months 1.29 0.15 * IOI: 18-23 months 1.15 0.09 + IOI: 24-35 months 0.89 0.06 + IOI: 36-59 months (RC) 1.00 (--) IOI: 60-83 months 1.07 0.10 IOI: 84 plus months 1.17 0.15 IOI unknown 1.11 0.07 Preceding Pregnancy Outcome Preceding Outcome Live Birth (RC) 1.00 (--) Preceding Outcome Abortion 0.75 0.17 Preceding Outcome Miscarriage 1.18 0.15 Preceding Outcome Stillbirth 1.18 0.18 Inter-outcome Interval * Non-live Prec. Outcome Interaction: IOI<15 months * Prec. outcome abortion 0.38 0.14 ** Interaction: IOI<15 months * Prec. outcome miscarriage 0.35 0.06 ***Interaction: IOI<15 months * Prec. outcome stillbirth 0.44 0.10 ***Duration of Pregnancy Gestation Gestation <30 weeks 8.67 0.75 ***Gestation 30-31 weeks 4.54 0.41 ***Gestation 32-33 weeks 2.53 0.22 ***Gestation 34-35 weeks 1.46 0.13 ***Gestation 36-37 weeks (RC) 1.00 (--) Gestation 38-39 weeks 1.10 0.11 Gestation 40 plus weeks 1.64 0.19 ***Gestation unknown 2.64 0.29 ***Birth Parity First Birth 1.80 0.11 ***Parity 2-3 (RC) 1.00 (--) Parity 4-7 1.04 0.06 Parity 8 plus 1.36 0.14 ** Maternal Age Mother's Age <18 1.68 0.13 ***Mother's Age: 18-19 1.31 0.07 ***Mother's Age: 20-24 (RC) 1.00 (--) Mother's Age: 25-29 0.95 0.05

144
Mother's Age: 30-34 1.00 0.07 Mother's Age: 35 plus 1.04 0.09 Year Year 1982-1986 0.87 0.07 + Year 1987-1991 0.90 0.07 Year 1992-1996 0.95 0.07 Year 1997-1999 0.82 0.07 * Year 2000-2002 (RC) 1.00 (--)
+ p<.10, * p<.05, ** p<.01, *** p<.001

145
Appendix Table 7b. Results of Cox proportional hazards model of late neonatal mortality: Effects of MCH-FP area with and without controls for reproductive variables (n=121,936)
RR Std. Err. RR Std. Err. Area Comparison Area (RC) 1.00 (--) 1.00 (--) MCH-FP Area 0.63 0.03 *** 0.98 0.16 Interaction: Gestation unknown* MCHFP 2.02 0.25 ***Inter-outcome Interval Duration IOI<15 months 2.22 0.29 ***IOI: 15-17 months 1.39 0.23 + IOI: 18-23 months 1.24 0.14 + IOI: 24-35 months 1.18 0.10 + IOI: 36-59 months (RC) 1.00 (--) IOI: 60-83 months 0.87 0.15 IOI: 84 plus months 1.17 0.26 IOI unknown 1.09 0.10 Preceding Pregnancy Outcome Preceding Outcome Live Birth (RC) 1.00 (--) Preceding Outcome Abortion 1.21 0.32 Preceding Outcome Miscarriage 0.65 0.15 + Preceding Outcome Stillbirth 0.95 0.23 Inter-outcome Interval * Non-live Prec. Outcome Interaction: IOI<15 months * Prec. outcome abortion 0.48 0.21 + Interaction: IOI<15 months * Prec. outcome miscarriage 0.71 0.22 Interaction: IOI<15 months * Prec. outcome stillbirth 0.37 0.14 * Duration of Pregnancy Gestation Gestation <30 weeks 4.50 0.66 ***Gestation 30-31 weeks 3.34 0.47 ***Gestation 32-33 weeks 2.34 0.30 ***Gestation 34-35 weeks 1.65 0.20 ***Gestation 36-37 weeks (RC) 1.00 (--) Gestation 38-39 weeks 0.92 0.14 Gestation 40 plus weeks 1.00 0.21 Gestation unknown 2.66 0.50 ***Birth Parity First Birth 1.66 0.15 ***Parity 2-3 (RC) 1.00 (--) Parity 4-7 1.04 0.06 Parity 8 plus 1.36 0.14 ** Maternal Age Mother's Age <18 1.70 0.19 ***Mother's Age: 18-19 1.13 0.10 Mother's Age: 20-24 (RC) 1.00 (--) Mother's Age: 25-29 0.77 0.06 ***

146
Mother's Age: 30-34 0.95 0.09 Mother's Age: 35 plus 0.86 0.11 Year Year 1982-1986 1.78 0.24 ***Year 1987-1991 1.51 0.20 ** Year 1992-1996 1.09 0.15 Year 1997-1999 0.81 0.12 Year 2000-2002 (RC) 1.00 (--)
+ p<.10, * p<.05, ** p<.01, *** p<.001

147
Appendix Table 7c. Results of Cox proportional hazards model of post-neonatal mortality: Effects of MCH-FP area with and without controls for reproductive variables (n=119,718)
RR Std. Err. RR Std. Err. Area Comparison Area (RC) 1.00 (--) 1.00 (--) MCH-FP Area 0.80 0.03 *** 1.10 0.14 Interaction: Gestation unknown* MCHFP 1.21 0.20 Inter-outcome Interval Duration IOI<15 months 1.80 0.18 ***IOI: 15-17 months 1.72 0.18 ***IOI: 18-23 months 1.51 0.11 ***IOI: 24-35 months 1.04 0.06 IOI: 36-59 months (RC) 1.00 (--) IOI: 60-83 months 0.81 0.09 * IOI: 84 plus months 1.23 0.17 IOI unknown 1.11 0.07 + Preceding Pregnancy Outcome Preceding Outcome Live Birth (RC) 1.00 (--) Preceding Outcome Abortion 0.46 0.12 ** Preceding Outcome Miscarriage 0.70 0.10 * Preceding Outcome Stillbirth 0.98 0.15 Inter-outcome Interval * Non-live Prec. Outcome Interaction: IOI<15 months * Prec. outcome abortion 1.12 0.44 Interaction: IOI<15 months * Prec. outcome miscarriage 0.75 0.15 Interaction: IOI<15 months * Prec. outcome stillbirth 0.75 0.17 Duration of Pregnancy Gestation Gestation <30 weeks 1.96 0.21 ***Gestation 30-31 weeks 1.88 0.17 ***Gestation 32-33 weeks 1.53 0.12 ***Gestation 34-35 weeks 1.02 0.08 Gestation 36-37 weeks (RC) 1.00 (--) Gestation 38-39 weeks 0.97 0.08 Gestation 40 plus weeks 1.02 0.12 Gestation unknown 1.62 0.22 ***Birth Parity First Birth 1.53 0.09 ***Parity 2-3 (RC) 1.00 (--) Parity 4-7 1.11 0.06 * Parity 8 plus 1.57 0.14 ***Maternal Age Mother's Age <18 1.28 0.12 * Mother's Age: 18-19 1.03 0.07 Mother's Age: 20-24 (RC) 1.00 (--) Mother's Age: 25-29 0.92 0.05 + Mother's Age: 30-34 1.04 0.07

148
Mother's Age: 35 plus 1.16 0.10 + Year Year 1982-1986 2.34 0.23 ***Year 1987-1991 2.03 0.20 ***Year 1992-1996 1.51 0.15 ***Year 1997-1999 1.19 0.13 + Year 2000-2002 (RC) 1.00 (--)
+ p<.10, * p<.05, ** p<.01, *** p<.001

149
Appendix Table 7d. Results of Cox proportional hazards model of child mortality: Effects of MCH-FP area with and without controls for reproductive variables (n=110,191)
RR Std. Err. RR Std. Err. Area Comparison Area (RC) 1.00 (--) 1.00 (--) MCH-FP Area 0.64 0.02 *** 0.81 0.14 Interaction: Gestation unknown* MCHFP 1.18 0.25 Inter-outcome Interval Duration IOI<15 months 1.11 0.13 IOI: 15-17 months 1.11 0.15 IOI: 18-23 months 1.31 0.10 ***IOI: 24-35 months 1.22 0.07 ** IOI: 36-59 months (RC) 1.00 (--) IOI: 60-83 months 0.79 0.09 + IOI: 84 plus months 1.00 0.17 IOI unknown 1.36 0.09 ***Preceding Pregnancy Outcome Preceding Outcome Live Birth (RC) 1.00 (--) Preceding Outcome Abortion 0.41 0.14 ** Preceding Outcome Miscarriage 0.72 0.12 * Preceding Outcome Stillbirth 0.95 0.18 Inter-outcome Interval * Non-live Prec. Outcome Interaction: IOI<15 months * Prec. outcome abortion 2.74 1.19 * Interaction: IOI<15 months * Prec. outcome miscarriage 1.19 0.28 Interaction: IOI<15 months * Prec. outcome stillbirth 0.88 0.26 Duration of Pregnancy Gestation Gestation <30 weeks 0.91 0.13 Gestation 30-31 weeks 0.94 0.11 Gestation 32-33 weeks 1.08 0.10 Gestation 34-35 weeks 0.87 0.07 + Gestation 36-37 weeks (RC) 1.00 (--) Gestation 38-39 weeks 0.86 0.08 Gestation 40 plus weeks 1.06 0.12 Gestation unknown 1.16 0.21 Birth Parity First Birth 0.95 0.07 Parity 2-3 (RC) 1.00 (--) Parity 4-7 1.32 0.07 ***Parity 8 plus 1.70 0.15 ***Maternal Age Mother's Age <18 1.13 0.15 Mother's Age: 18-19 1.06 0.08 Mother's Age: 20-24 (RC) 1.00 (--) Mother's Age: 25-29 1.00 0.05

150
Mother's Age: 30-34 1.05 0.07 Mother's Age: 35 plus 0.87 0.07 + Year Year 1982-1986 2.11 0.31 ***Year 1987-1991 1.27 0.19 Year 1992-1996 1.06 0.16 Year 1997-1999 0.83 0.13 Year 2000-2002 (RC) 1.00 (--)
+ p<.10, * p<.05, ** p<.01, *** p<.001

151
Appendix 8. How Do the Effects of Interval that We Find for Matlab Compare to Rutstein’s Results for the Demographic and Health Surveys (DHS)
One of the analyses that is widely cited in the recent policy discussion of the Optimal
Birthspacing Initiative is Shea Rutstein’s analysis of data from the Demographic and Health Surveys
(DHS) (e.g., Rutstein, 2003). The DHS project has fielded surveys that collect comparable data in a
large number of countries. The core DHS questionnaire includes a birth history that collects
retrospective information on all woman’s births and the survival status of each. Such data can be used
to construct indicators of mortality and of interbirth intervals. The surveys also collect data on a number
of covariates of infant and child mortality. The DHS data have been widely used for studies of infant
and child mortality.
We investigate how the effects of preceding intervals on infant and child mortality in Matlab
compare to those in Rutstein (2003b), a study that pools data from DHS surveys in 17 countries,
including Bangladesh. To do this, we re-analyze our data using the same types of samples, dependent
variables, measures of interbirth intervals, and analytical methods that Rutstein used. The years in
which the data he uses were collected range from as early as 1992-1993 for India to as recent as 1996-
1997 for Bangladesh. He includes all births that occur within the 15 years prior to the survey.35 He
estimates a logistic regression to assess the effects of interbirth intervals of various durations on the
outcomes of neonatal mortality, infant mortality, and under-5 child mortality. For all three outcomes,
his sample, and ours for this comparative analysis, includes live births, and the outcome variable is death
(death=1, no death=0) during the at-risk period considered (the first 28 days of life, the first year of life,
and the first five years of life).36 We restrict our samples to individuals who did not migrate out during
the at-risk period37 and were born far enough in advance of the end of the study period (December 31,
2002) to have been able to survive to the end of it.38 In all, we consider 124,715, 115,102, and 84,753
singleton live births for our analyses of neonatal, infant, and under-five mortality, whereas Rutstein
considers 278,443 live births.
35 Because he uses retrospective data collected from women of childbearing age at the time of the survey, his data on
earlier years will not include older women, whereas ours do. E.g., since the oldest women in his data at the time of the survey are age 49, the oldest women 15 years before the survey were age 34.
36 Such an approach, where each “older” category includes the one before makes it difficult to assess whether and how the effects of birth interval change as the child becomes older.
37 Due to out-migration before the end of the time period, we lose 537 records for our analysis of neonatal mortality, 5,341 for infant mortality, and 15,734 for under-five mortality.
38 In restricting our sample to children born early enough that we have the opportunity to observe them over the entire at-risk period, we lose 568 births for neonatal mortality, 6,719 for infant mortality, and 30,586 for under-five mortality.

152
To replicate Rutstein’s specification, we included categorical variables for the same categories of
the length of the preceding interbirth interval that he considers (<18 months, 18-23 months, 24-29
months, 30-35 months, 36-41 months, 42-47 months, 48-53 months, 54-59 months, 60 or more months).
In addition, like Rutstein, we control for the sex of the child, birth order (first birth, second or third birth,
fourth through seventh birth, and eighth or higher birth), mother’s age at birth (specified to have a linear
effect), a dichotomous indicator of whether the preceding live birth survived until the birth of the index
child, mother’s education (Rutstein uses none, primary, secondary, and higher as the four categories; we
use 0 years, 1-5 years, 6-10 years, and 11-16 years of education), an index of household wealth (he
considers quintiles of wealth; we use our measure of household space), and an indicator of whether the
child was wanted. Rutstein’s measure of this last variable is retrospective and is only available for the
births that occurred within five years preceding the survey, whereas ours is prospective. Rutstein only
controls for wantedness in the regressions explaining neonatal and infant mortality because he only has
the variable for the more recent births (those which have not lived to age 5), so we do this as well.
Unlike Rutstein, we do not control for the type of provider of prenatal care, the timing of the prenatal
care, the number of prenatal tetanus vaccinations, and whether the birth resulted from a contraceptive
failure, though the last measure is not available for Rutstein in many of the countries where there is low
contraceptive prevalence.39 While Rutstein controls for rural and urban residence, we do not, since all of
the women in our sample are from a rural area of Matlab.
In Appendix Figure 1, we portray the odds ratios of the risk of neonatal mortality (days 1-28) for
each known interbirth interval considered relative to an interbirth interval of 36-41 months. We show
the results from Rutstein’s analysis (the triangles) and those based on our data (the squares). As in
Preceding figures, hollow shapes indicate that the odds ratio is not significantly different from 1.0 at the
5% level. The general shapes of the relationships in our data are the same as Rutstein’s. Specifically,
the highest risk of neonatal mortality is associated with the shortest interbirth interval considered (<18
months) compared to intervals of 36-41 months in length. Rutstein’s analysis finds that the risk
associated with intervals of less than 18 months is 2.6 times the risk associated with an interval of 36-41
months, whereas we find a somewhat a smaller odds ratio, of 2.0. Neither Rutstein’s nor our data show
any sign of an increased risk of neonatal mortality for births after long intervals.
39 We do not control for prenatal care because we only have that information for 2002; we do not have information
on prenatal tetanus vaccinations or contraceptive failure.

153
In Appendix Figures 2 and 3, we present similar portrayals of the results of the logistic
regression for infant mortality and under-five mortality, respectively. Again, we find a generally similar
shape to Rutstein’s analysis, indicating a higher infant mortality risk for pregnancies following intervals
of less than 24 months than those for intervals of 36-41 months. For both infant and child mortality, like
neonatal mortality, Rutstein’s data show a higher odds ratio associated with short intervals relative to
those of 36-41 months long than our data do. For example, Rutstein’s data show an odds ratio of 2.9
associated with intervals of less than 18 months compared to one of 36-41 months, whereas our analyses
imply an odds ratio of 1.9. Rutstein does not find statistically significant effects of long intervals on
infant mortality, and neither do we. He finds that increasingly longer intervals are associated with
significantly lower risks of child mortality, whereas we find no significant differences associated with
increasing interval lengths beyond 23 months.
Hence, we see that even though our specifications are not identical to Rutstein’s and our
estimates of the effects of interbirth intervals are not exactly the same as his, the shapes of the
relationships in the two studies are remarkably similar. The larger effect that he finds of very short
intervals may reflect the possibility that his average short interval (< 18 mos.) is even shorter than ours
because most of the countries he considers have lower levels of breastfeeding than Bangladesh.
The fact that he controls for some variables that we are not able to control (type of provider of
prenatal care, the timing of the prenatal care, the number of prenatal tetanus vaccinations, and whether
the birth resulted from a contraceptive failure) may also explain some of the difference between his
results and ours, though we would expect that controlling for such variables would reduce rather than
increase the deleterious effect of short intervals.
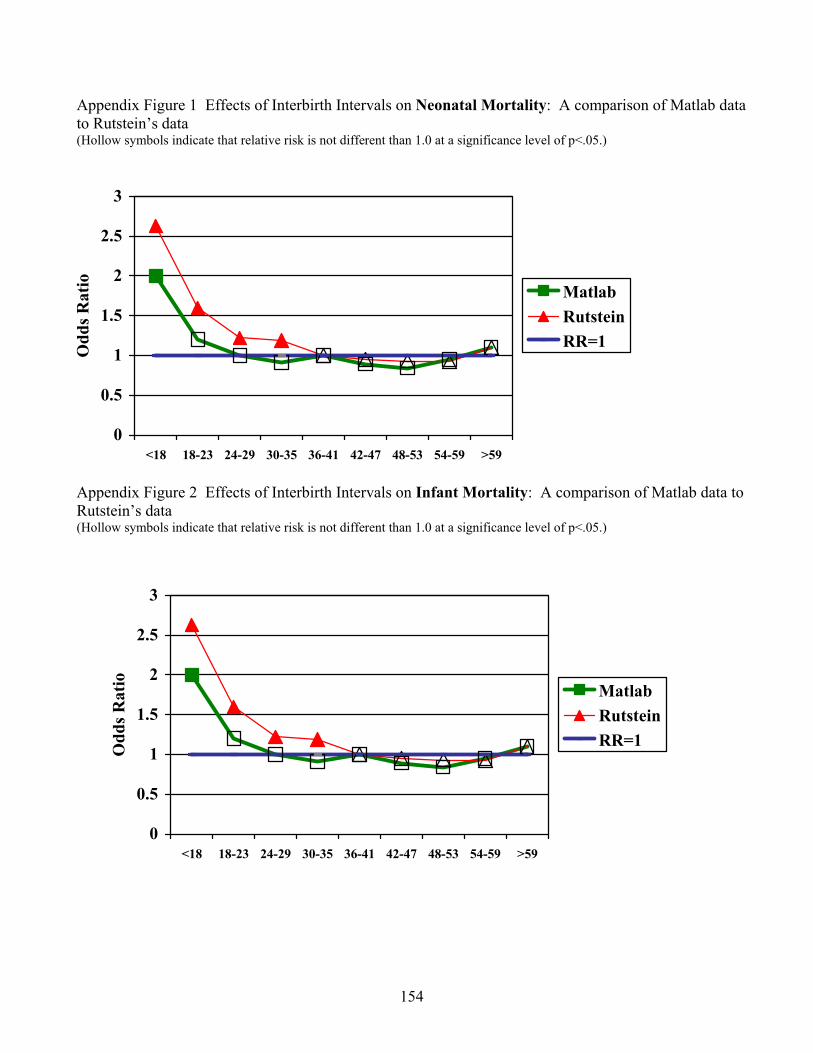
154
Appendix Figure 1 Effects of Interbirth Intervals on Neonatal Mortality: A comparison of Matlab data to Rutstein’s data (Hollow symbols indicate that relative risk is not different than 1.0 at a significance level of p<.05.)
Appendix Figure 2 Effects of Interbirth Intervals on Infant Mortality: A comparison of Matlab data to Rutstein’s data (Hollow symbols indicate that relative risk is not different than 1.0 at a significance level of p<.05.)
0
0.5
1
1.5
2
2.5
3
<18 18-23 24-29 30-35 36-41 42-47 48-53 54-59 >59
Odd
s Rat
io MatlabRutsteinRR=1
0
0.5
1
1.5
2
2.5
3
<18 18-23 24-29 30-35 36-41 42-47 48-53 54-59 >59
Odd
s Rat
io MatlabRutsteinRR=1

155
Appendix Figure 3 Effects of Interbirth Intervals on Under-Five Mortality: A comparison of Matlab data to Rutstein’s data (Hollow symbols indicate that relative risk is not different than 1.0 at a significance level of p<.05.)
0
0.5
1
1.5
2
2.5
3
3.5
<18 18-23 24-29 30-35 36-41 42-47 48-53 54-59 >59
Odd
s Rat
io MatlabRutsteinRR=1