the effects of bird’s nest as a cryoprotective …studentsrepo.um.edu.my/7781/1/thesis.pdf ·...
TRANSCRIPT

THE EFFECTS OF BIRD’S NEST AS A CRYOPROTECTIVE AGENT ON
HUMAN ADIPOSE DERIVED STEM CELLS
KINARROY A/P VAITHIANATHAN
FACULTY OF ENGINEERING
UNIVERSITY OF MALAYA
KUALA LUMPUR
2014

THE EFFECTS OF BIRD’S NEST AS A CRYOPROTECTIVE AGENT ON
HUMAN ADIPOSE DERIVED STEM CELLS
KINARROY A/P VAITHIANATHAN
RESEARCH REPORT SUBMITTED TO THE FACULTY OF
ENGINEERING UNIVERSITY OF MALAYA, IN PARTIAL
FULFILMENT OF THE REQUIREMENT FOR THE DEGREE OF
MASTER OF ENGINEERING (BIOMEDICAL)
2014
ABSTRACT
One of the most popular concepts currently is the use of stem cells in the regenerative
therapy which replaces the lost or dysfunctional part in a human body. In order for a patient
to benefit from such therapies, the stem cell source should be always made available.
Therefore, it is important to preserve these cells so that they are always available for
treatments. Cryopreservation is one of the important methods to preserve cells and tissues
where it can be used for the recovery of damaged tissues and organs. Cryopreservation of
stem cells is mainly to minimize any form of damage to biological materials at very low
temperatures while freezing and also during storage. This issue can be addressed with the
addition of a cryoprotective agent. Dimethyl sulfoxide (DMSO) is a common
cryoprotective agent which is a polar compound originally created for the use as a solvent.
However the use of DMSO may result in the toxicity of cells. The bird’s nest or also known
as edible bird’s nest (EBN) is a health food with many traditional medicinal properties.
Therefore, the objectives of this study are to evaluate the efficiency of EBN to act as a
cryoprotective agent, to evaluate the differentiation ability to express the following
lineages; osteogenic, adipogenic and chondrogenic after cryopreservation with the
respective cryoprotectants (10% DMSO+90% FBS, 5% DMSO+1% EBN+94% FBS and
1% EBN+99% FBS) and to evaluate the proliferative rate of the cryopreserved human
adipose derived stem cells with the respective cryoprotectants (10% DMSO+90% FBS, 5%
DMSO+1% EBN+94% FBS and 1% EBN+99% FBS). This study is designed to evaluate
the ability of EBN to either act as a cryoprotectant to substitute DMSO or to act as a
supplement to DMSO. The human adipose tissue were collected from the PPUM was
isolated and cultured up to second passage. Then, the cells were cryopreserved in the
respective cryoprotectant; 10% DMSO+90% FBS (Control), 5% DMSO+1% EBN+94%
FBS and 1% EBN+99% FBS for a month. After a month, the cells were thawed and
cultured for the following tests; cell viability test, resazurin test and differentiation into
three lineages (adipogenic, chondrogenic and osteogenic). Then, the differentiated lineages
were stained and the respective surface areas were determined. It can be concluded that the
human adipose derived stem cells preserved in 10% DMSO+99%FBS had exhibited a
higher result as compared to cells preserved in 5% DMSO+1% EBN+94%FBS and 1%
EBN+99% FBS. Hence making DMSO still a good and superior cryoprotective agent.
DMSO on its own can support the growth of the cells which can be seen in 10%
DMSO+99% FBS and does not require the presence of EBN. Therefore, it can be
concluded that EBN cannot act as a cryoprotective agent. EBN is better to be used in in
vitro cell culture experiments instead of it as a cryoprotective agent.

ABSTRAK
Salah satu konsep yang paling popular pada masa ini ialah penggunaan sel stem dalam
terapi regeneratif yang menggantikan bahagian yang hilang atau tidak berfungsi dalam
badan manusia. Sumber sel stem harus sentiasa disediakan supaya pesakit dapat memanfaat
daripada terapi ini. Oleh itu, adalah penting untuk memelihara sel-sel ini supaya ia sentiasa
disediakan untuk rawatan. Krioawetan merupakan salah satu kaedah penting untuk
memelihara sel dan tisu di mana ia boleh digunakan untuk pemulihan tisu dan organ yang
rosak. Krioawetan sel stem adalah penting terutamanya untuk mengurangkan sebarang
bentuk kerosakan pada bahan biologi pada suhu yang rendah ketika proses pembekuan dan
penyimpanan. Isu ini boleh ditangani dengan penambahan agen cryoprotektif. Dimetil
sulfoksida (DMSO) adalah ejen krioprotektif yang biasa digunakan, asalnya ia dicipta
untuk digunakan sebagai pelarut. Walau bagaimanapun, penggunaan DMSO boleh
menyebabkan ketoksikan sel. Sarang burung (EBN) adalah makanan kesihatan dengan
pelbagai ciri-ciri perubatan tradisional. Oleh itu, objektif kajian ini adalah untuk menilai
kecekapan EBN untuk bertindak sebagai ejen krioprotektif, bagi menilai kemampuan
pembezaan untuk menyatakan keturunan berikut; adipogenik, osteogenik, dan kondrogenik
setelah dikrioawet dengan krioprotektif masing-masing (10 % DMSO+90 % FBS, 5 %
DMSO+1 % EBN+94 % FBS dan 1 % EBN+99 % FBS) dan juga untuk menilai kadar
proliferative sel stem yang dikrioawet dengan krioprotektif masing-masing (10 %
DMSO+90 % FBS, 5 % DMSO+1 % EBN+94 % FBS dan 1 % EBN+99 % FBS). Kajian
ini bertujuan untuk menilai keupayaan EBN sama ada bertindak sebagai ejen krioprotektif
untuk menggantikan DMSO atau untuk bertindak sebagai tambahan kepada DMSO. Tisu
lemak yang dikumpul daripada PPUM telah diasingkan dan diternak sehingga laluan kedua.

Kemudian, sel dikrioawet dalam krioprotektif masing-masing selama sebulan; 10 %
DMSO+90 % FBS (Kawalan), 5 % DMSO+1 % EBN+94 % FBS dan 1 % EBN+99 %
FBS. Selepas sebulan, sel telah dicairkan dan dikembangkan untuk ujian berikut; sel ujian
daya maju, ujian resazurin dan pembezaan kepada tiga keturunan
(adipogenik, osteogenik, dan kondrogenik). Sel yang dibezakan telah dinoda dan kawasan
permukaan masing-masing telah ditentukan. Kesimpulannya adalah sel stem yang
diperolehi daripada tisu lemak manusia yang dikrioawet dalam 10 % DMSO + 99 % FBS
telah memaparkan hasil yang lebih tinggi berbanding dengan sel-sel yang dikrioawet dalam
5 % DMSO + 1 % EBN + 94 % FBS dan 1 % EBN + 99 % FBS. Maka, boleh disimpulkan
bahawa DMSO adalah ejen krioprotektif yang baik dan unggul. DMSO juga boleh
menyokong pertumbuhan sel-sel tanpa memerlukan kehadiran EBN seperti yang dilihat
dalam 10 % DMSO + 99 % FBS. Oleh itu, boleh disimpulkan bahawa EBN tidak boleh
bertindak sebagai ejen krioprotektif dan ia adalah lebih baik untuk digunakan dalam
eksperimen in vitro dan bukannya sebagai ejen krioprotektif.

ACKNOWLEDGEMENT
Finally, I have completed my final year research report. Many people were involved
throughout this research. First of all I would like to express my greatest gratitude to my
supervisor, Dr. Wan Safwani Wan Kamarul Zaman for her guidance, assistance, patience
and tolerance throughout the whole process of completing this research report. I would like
to further thank my supervisor for her assistance, support and contribution of ideas. I am
also grateful to Prof. Dr. Saad Mekhilef for his guidance on the research report writing in
his research and methodology lectures and not to forget other University Malaya lecturers
in Faculty of Biomedical Engineering for their knowledge and effort to guide me
throughout my research report writing.
Besides that, I would like to express my special gratitude to the lab assistant in
tissue engineering laboratory, Miss Liyana Binti Abu as well as the PhD students in lab
who deserve my warmest appreciation for their cooperation and teamwork in order to
execute certain procedures in the laboratory and during thesis writing. Furthermore, I would
like to thank few of my other course mates who helped me a lot during my laboratory work
and research report writing. Wishing all of them the very best.
Finally, I wish to acknowledge my deepest gratitude to my beloved parents, Mr.
Vaithianathan and Madam Maragathvallie for their moral support. Not to forget to anyone
who has involved in this research either directly or indirectly, their encouragement has
enabled me to complete my final year research report successfully. Thank you so much!

TABLE OF CONTENTS
Page
DECLARATION ii
ABSTRACT iii
ABSTRAK v
ACKNOWLEDGEMENT vii
TABLE OF CONTENTS viii
LIST OF FIGURES xi
LIST OF TABLES xiii
LIST OF SYMBOLS AND ABBREVIATIONS xiv
CHAPTER I
INTRODUCTION 1
CHAPTER II
LITERATURE REVIEW 4
2.1 Stem Cells 4
2.1.1 Properties of Stem Cells 4
2.1.2 Embryonic Stem Cells 5
2.1.3 Adult Stem Cells 6
2.1.4 Adipose Derived Stem Cells 7
2.1.5 Differentiation 8
2.2 Bird’s Nest or Edible Bird’s Nest (EBN) 10
2.2.1 Description 10
2.2.2 Traditional Uses of EBN 11

2.2.3 Biological Compounds 12
2.3 Cryopreservation 14
2.4 Cryoprotective Agent 15
2.5 Research Assays 17
2.5.1 Morphology of Human Adipose Derived Stem Cells 17
2.5.2 Induction Medium and Staining 18
2.5.3 Resazurin Reduction Test 19
2.5.4 Cell Viability Assays 20
CHAPTER III
METHODOLOGY 21
3.1 Sample Collection 22
3.2 Isolation 22
3.3 Trypsinization 23
3.4 Cryopreservation 23
3.5 Thawing Cells 24
3.6 Cell Counting 25
3.7 Cell Morphology 25
3.8 Differentiation Assay 25
3.9 Staining Protocol 27
3.9.1 Alizarin Red 27
3.9.2 Oil-Red-O 27
3.9.3 Alcian Blue Staining 28
3.10 Resazurin Reduction Test 31
3.11 Medium Preparation 33

3.11.1 Basal Medium 33
3.11.2 Complete Medium 33
3.11.3 Phosphate Buffered Saline (PBS) Solution 33
3.11.4 Osteogenic Induction Medium 34
3.11.5 Adipogenic Induction Medium 34
3.11.6 Chondrogenic Induction Medium 35
CHAPTER IV
RESULTS 36
4.1 Cell Viability Test 36
4.2 Resazurin Test 39
4.3. Differentiation Ability 44
4.3.1 Cryoprotectant: 10% DMSO+90% FBS 44
4.3.2 Cryoprotectant: 5% DMSO+1% EBN+94% FBS 46
4.3.3 Cryoprotectant: 1% EBN+99% FBS 48
4.4 Surface Area 50
CHAPTER V
DISCUSSIONS 52
CHAPTER VI
CONCLUSION 55
REFERENCES 56
APPENDIX A 62
APPENDIX B 63
APPENDIX C 72
LIST OF FIGURES
Figure Page
3.1 The overview of the experimental process 21
3.2 Process of Embedding the Cells into the Paraffin Wax 29
3.3 Alcian Blue Staining 30
4.1 Percentage of Cell Viability versus Cryoprotectant 37
4.2 Standard Curve for 10% DMSO+90% FBS 39
4.3 Growth Curve for 10% DMSO+90% FBS 39
4.4 Standard Curve for 5% DMSO+1% EBN+94% FBS 40
4.5 Growth Curve for 5% DMSO+1% EBN+94% FBS 40
4.6 Standard Curve for 1% EBN+99% FBS 41
4.7 Growth Curve for 1% EBN+99% FBS 41
4.8 Comparison of Cell Number for Two Respective Days 42
for the Respective Cryoprotectant
4.9 Stem Cells Preserved in 10% DMSO+90% FBS 43
(Magnification: 4x objective)
4.10 Stem Cells Preserved in 10% DMSO+90% FBS 43
(Magnification: 10x objective)
4.11 Adipogenic (Magnification: 4x objective) 44
4.12 Chondrogenic (Magnification: 10x objective) 44
4.13 Osteogenic (Magnification: 10x objective) 44
4.14 Stem Cells Preserved in 5% DMSO+1% EBN+94% FBS 45
(Magnification: 4x objective)
4.15 Stem Cells Preserved in 5% DMSO+1% EBN+94% FBS 45
(Magnification: 10x objective)
4.16 Adipogenic (Magnification: 4x objective) 46

4.17 Chondrogenic (Magnification: 10x objective) 46
4.18 Osteogenic (Magnification: 10x objective) 46
4.19 Stem Cells Preserved in 1% EBN+99% FBS 47
(Magnification: 4x objective)
4.20 Stem Cells Preserved in 1% EBN+99% FBS 47
(Magnification: 10x objective)
4.21 Adipogenic (Magnification: 4x objective) 48
4.22 Chondrogenic (Magnification: 10x objective) 48
4.23 Osteogenic (Magnification: 10x objective) 48
4.24 Percentage of Surface Area for the Respective 50
Differentiated Lineages versus Cryoprotectant
4.25 Percentage of Surface Area of Adipogenic 51
Differentiation versus Cryoprotectant
4.26 Percentage of Surface Area of Chondrogenic 52
Differentiation versus Cryoprotectant
4.27 Percentage of Surface Area of Osteogenic 53
Differentiation Lineage versus Cryoprotectant
LIST OF TABLES
Table Page
2.1 Difference between Adult and Embryonic Stem Cells 7
2.2 Properties of EBN 13
3.1 Ingredients of Complete Medium 33
3.2 Ingredients of Osteogenic Induction Medium 34
3.3 Ingredients of Adipogenic Induction Medium 34
3.4 Ingredients of Chondrogenic Induction Medium 35
4.1 Percentage of Cell Viability for Cells 36
Preserved in 10% DMSO+90% FBS
4.2 Percentage of Cell Viability for Cells 36
Preserved in 5% DMSO+1% EBN+94% FBS
4.3 Percentage of Cell Viability for Cells 37
Preserved in 1% EBN+99% FBS
4.4 Percentage of Resazurin Reduction and 38
Cell Number for the Respective Cryoprotectant
4.5 Percentage of Surface Area of Cells 49
Preserved in 10% DMSO+90% FBS
4.6 Percentage of Surface Area of Cells 49
Preserved in 5% DMSO+1% EBN+94% FBS
4.7 Percentage of Surface Area of Cells 49
Preserved in 1% EBN+99% FBS
4.8 Percentage of Surface Area of Adipogenesis for the 51
Respective Cryoprotectant
4.9 Percentage of Surface Area of Chondrogenesis for the 52
Respective Cryoprotectant
4.10 Percentage of Surface Area of Osteogenesis for the 53
Respective Cryoprotectant
LIST OF SYMBOLS AND ABBREVIATIONS
DMSO Dimethyl sulfoxide
EBN Edible bird’s nest
% Percentage
ASC Adipose derived stem cell
MSC Mesenchymal stem cell
EGF Epidermal growth factor
ppm Parts per million
mg/kg Milligram per kilogram
Con A Concanavalin A
PHA Phytohaemagglutinin
°C Degree Celsius
pH Power of hydrogen
FBS Fetal bovine serum
°C/minute Degree Celsius per minute
HES Hydroxyethyl Starch
IUPAC International Union of Pure and Applied Chemists
mV Millivolts
TGF-β3 Transforming growth factor beta 3
NADPH Nicotinamide adenine dinucleotide phosphate
FADH Flavin adenine dinucleotide
FMNH Flavin mononucleotide
NADH Nicotinamide adenine dinucleotide

nm Nanometer
ATP Adenosine triphosphate
PBS Phosphate Buffered Saline
rpm Revolutions per minute
mL Millilitre
Po Primary culture
P1 Passage One
P2 Passage Two
P3 Passage Three
Hrs Hours
µL microlitre
g Gram
mg Milligram
mm Millimeter
CHAPTER I
INTRODUCTION
Stem cells are cells with the ability of self renewal and contain the ability to produce multi-
lineage differentiation. Currently, to be useful in tissue engineering, stem cells should be
safe for implantation, possess ability to differentiate into multi-lineages and can be easily
obtained in large numbers. There are several types of stem cells which are generally useful
in tissue engineering which are as follows; hematopoietic stem cells, adipose stem cells,
mesenchymal stem cells and skin stem cells. All these types can easily be accessed and to
be obtained in large numbers. At the same time, they are safe and do not cause immune-
rejection since the samples are autologous (Pirraco et al., 2011; Vacanti et al., 2014). One
of the most popular concepts used currently is the regenerative therapy which replaces the
lost or dysfunctional part in a human body. Using this technique, a lot of focus has been
given on the cardiovascular diseases (Rosen, Myerburg, Francis, Cole, & Marbán, 2014).
Adipose tissue which is found throughout the human body and is commonly
discarded during procedures such as liposuction and cosmetic surgery can be a good source
of stem cells. Their ability to proliferate at high rate and also to produce multi-lineage
differentiation has gain interest in both tissue engineering and regenerative medicine to
treat various diseases and disorders. A lot of these diseases can be treated with stem cells
which are taken from the patient’s body itself. Since adipose tissue gives rise to
mesenchymal stem cells, therefore it is possible for autologous transplantation. In order for

a patient to benefit from such therapies, the stem cell source should be always made
available. Therefore, it is important to preserve these cells so that they are always available
for treatments. Cryopreservation is one of the important methods to preserve cells and
tissues where it can be used for the recovery of damaged tissues and organs. One of the best
options for stem cell preservation is the stem cells banks which will maintain cells in a
viable state for a long period of time. However, donors are suppose to pay for these banks.
It is also said that a mesenchymal stem cells isolated from an adipose tissue which are
cryopreserved are equally the same as the freshly isolated mesenchymal stem cells
(Choudhery, Badowski, Muise, Pierce, & Harris, 2014).
Cryopreservation of stem cells is mainly to minimize any form of damage to
biological materials at very low temperatures while freezing and also during storage. This
issue can be addressed with the addition of a cryoprotective agent. There are two types of
cryoprotectant used for cell preservation which are as follows; intracellular and
extracellular cryoprotectant. One of the most commonly used cryoprotectant is the dimethyl
sulfoxide (DMSO). DMSO is a polar compound which was originally created for the use as
a solvent. However the use of DMSO may result in the toxicity of cells. The ability of
DMSO to induce non lamellar structures in phospholipids and to enhance membrane
permeability may also damage biological membrane at physiological temperature.
Moreover, DMSO also has the ability to induce cell differentiation indicates that it might
exert an influence at the genetic regulation level (Yu & Quinn, 1994). There are also some
natural cryoprotectants which are as follows; sucrose and trehalose which are extracellular
cryoprotectant. The main usage of these sugars is because the cells do not produce or
synthesizes these sugars. At the same time, the sugar molecules are too big to enter the cell
permeable membrane, hence making them an extracellular cryoprotectant. However,

research has concluded that extracellular cryoprotectant is not as efficient as the
intracellular cryoprotectant (Motta, Paraguassú-Braga, Bouzas, & Porto, 2014).
The bird’s nest or also known as edible bird’s nest (EBN) is a health food with
many traditional medicinal properties. It is said to maintain the youthful complexion of an
individual, does speedy recovery from illness, improves appetite, aid in digestion issue and
also boost the immune system. In the traditional Chinese medicine, it is used for curing
tuberculosis, dry coughs, suppressing cough and phlegm, improving ulcer, relieving gastric
troubles and weakness of bronchial ailments (Chan, 2006; Hobbs, 2004; Marcone, 2005).
The extract of EBN is found to be anti-inflammatory in nature where it has suppressed the
production of tumor necrosis factor-alpha. Either than that, it is also able to inhibit the
infections by influenza virus which is facilitated by the N-Acetylneuraminic acid residues
which are present in the EBN. EBN is made up of 62-63% of protein, 25.62-27.26% of
carbohydrates, bioactive mucoid and epidermal growth factor which stimulates cell division
and growth of many epidermal and epithelial tissues (Ma & Liu, 2012; Yang, Cheung, Li,
& Cheung, 2014).
Although many research have been carried out using EBN but nothing would
related to EBN as a cryoprotectant. Therefore, this study was designed to study the ability
of EBN to act as a cryoprotective agent on human adipose derived stem cells. The
objectives of this study are as follows:
1. To evaluate the efficiency of EBN to act as a cryoprotective agent.
2. To evaluate the differentiation ability to express the following lineages;
osteogenic, adipogenic and chondrogenic after cryopreservation with the
respective cryoprotectants (10% DMSO+90% FBS, 5% DMSO+1%
EBN+94% FBS and 1% EBN+99% FBS).

3. To evaluate the proliferative rate of the cryopreserved human adipose
derived stem cells with the respective cryoprotectants (10% DMSO+90%
FBS, 5% DMSO+1% EBN+94% FBS and 1% EBN+99% FBS).
Problem statement: DMSO is a common cryoprotective agent that is known to cause toxic
to the cells. Since EBN has exhibited some good properties, therefore, this study is
designed to evaluate the ability of EBN to either act as a cryoprotectant to substitute DMSO
or to act as a supplement to DMSO.
CHAPTER II
LITERATURE REVIEW
2.1 Stem Cells
2.1.1 Properties of Stem Cells
Stem cells are unspecialized cells that are able to self renew and contain the ability to
produce multilineage differentiation. Two of their properties are as follows; firstly, stem
cells contain the ability to divide many times while retaining the undifferentiated state. This
situation is termed as self-renew. Secondly, under certain or proper conditions these cells
can be induced to produce specialized cells via differentiation. For example; heart muscle
cells, blood cells or nerve cells. Some of the sources of stem cells includes; bone marrow,
embryonic stem cells from inner cell mass, various tissues of the adult body such as fats
and skin, fertilized and unfertilized eggs, gestational tissues such as umbilical cord, york
sac and amniotic fluid and embryonic germ cells from developing gonads of the fetus.
Therefore, stem cells are divided into two main types which are as follows; adult and
embryonic stem cells. A stem cell can be totipotent cells, pluripotent cells, multipotent
cells, unipotent cells or differentiated cells depending on the source of cells obtained.
Traditionally, adult stem cells were thought to give rise to one particular cell type in which
the tissue resides. For example if a blood forming cell is obtained from bone marrow
(hematopoietic stem cell), it will generate red blood cells, white blood cells and platelets.
However further studies suggest that stem cells obtained from tissues may give rise to
several different types of cells which are completely different from where they reside which
is termed as plasticity. For example, hematopoietic stem cell which produces heart muscles
or blood cells producing neurons. Therefore, extensive studies on using adult stem cells for
cell based therapies have become very active areas. Stem cells has many benefits, some of
them are as follows; for gene therapy, to produce tissues and organs which genetically
matches the patient to replace damaged or diseased parts, to test effects of drugs on a
specific lineages, for example cardiac muscle cells, helps develop cures for certain diseases
such as Parkinson, Alzheimer, stroke, arthritis, burns, spinal injury, heart disease, certain
form of cancer and etc and also can be used to study the development of tissue
(Chamberlain, Fox, Ashton, & Middleton, 2007; Mani et al., 2008; Stocchero & Stocchero,
2011).
2.1.2 Embryonic Stem Cells
Embryonic stem cells are obtained from embryos that are produced from eggs via in vitro
fertilization with the permission of the donors and these kinds of stem cells are never
obtained from a pregnant mother. The embryos that are produced are usually four to five
days old and are a hollow microscopic ball of cells which is termed as blastocyst. A
blastocyst contains three structures which are as follows; trophoblast; a layer of cells
surrounding the blastocyst, blastocoels; the hollow cavity inside the blastocyst and the inner
cell mass which is made of a group of 30 cells at one end of the blastcoel. Some of the
advantages of embryonic stem cells are as follows; they are able to proliferate indefinitely,
both totipotent (ability to produce all types of cells) and pluripotent (ability to produce
many types of cells) abilities and they are easily grown in culture. However there are some
disadvantages which are as follows; there is a tendency for these types of cells to be
malignant or to produce tumors since their gene expression is unstable. Secondly, the moral

and human right issues that are involved makes this stem cells least preferred (Biswas &
Hutchins, 2007; A. Smith, 2001).
2.1.3 Adult Stem Cells
Adult stem cells are cells that are undifferentiated found among the differentiated cells in
an organ or tissue. These cells can self-renew and also has ability to differentiate to produce
many types of cells of organs and tissues. The main function of an adult stem cell in a
living organism is to maintain and repair tissues at sites they are found. Some of the sources
of adult stem cells are bone marrow, skin, fats, blood vessels, liver, gut and etc.
Some of the advantages of adult stem cells are as follows; does not involve moral issues,
therefore not controversial, contain pluripotent abilities, ability to differentiate into a
narrow set of cell types hence it is easier to direct then to a particular lineage, can be
clinically used for many diseases, tumour formation can be avoided, ability to differentiate
into different tissue types which is termed as plasticity or transdifferentiation and lastly
immunorejection avoided by obtaining autologous stem cells; which may protect donor
from contamination, viral or bacterial infections. However the disadvantages are as follows;
firstly, the proliferation capacity is limited, short life as compared to embryonic stem cells,
there is a risk of infection to the recipient if the source is allogenic (cells taken from others),
risk to the donor during isolation if autologous source is preferred and culturing adult stem
cells in vitro is difficult and almost impossible for some types of cells as compared to
embryonic stem cells (Palsson & Bhatia; Young & Black, 2004). Table 2.1 summarizes the
difference between adult and embryonic stem cells.

Table 2.1: Difference between Adult and Embryonic Stem Cells (Palsson & Bhatia)
Embryonic Stem Cells Adult Stem Cells
Pluripotent (ability to produce all types of
cells).
Limited capacity to differentiate into
different types of cells. However, some adult
stem cells contain plasticity ability.
Large number of cells can be easily grown
in culture.
Culturing adult stem cells in vitro is difficult
and almost impossible.
Embryonic stem cells from a donor
introduced into a patient cause transplant
rejection.
Autologous source can be obtained from the
patient, expended in culture and
reintroduced into the patient once again.
This avoids immunorejection. Hence,
avoiding the immunosuppressive drugs.
2.1.4 Adipose Derived Stem Cells
Adipose-derived stem cells are important for many therapeutic applications, multipotent
and are plastic adherent isolated which are obtained through collagenase digestion of
adipose tissue. Multipotent means ability to produce limited number of cell types.
Therefore, adipose-derived stem cells can be differentiated into several lineages which are
as follows; chondrogenic, neurogenic, adipogenic and also osteogenic. Some stromal cells
exhibit adipose-derived stem cells characteristics and these cells can be isolated from the
adipose tissue of an adult and grown in vitro and differentiated into adipocytes. Stromal
cells can be isolated in either large or small amounts from the human adipose tissue. In
human, the mesenchymal cells will undergo a complex process of transcription and non-
transcription to produce adipocytes which occurs throughout the human life. Adipocyte
differentiation will result in changes in cell morphology, hormone sensitivity and also gene
expression (Bunnell, Flaat, Gagliardi, Patel, & Ripoll, 2008).
There are several terms used to identify an adipose tissue, which are as follows;
adipose-derived stem cells, adipose-derived adult stem cells, adipose-derived adult stromal
cells, adipose-derived stromal cells, adipose stromal cells, adipose mesenchymal stem cells,
lipoblast, pericyte, pre-adipocyte and processed lipoaspirate cells. Since too many terms

leads to confusion, therefore the International Fat Applied Technology Society has come up
with the term adipose-derived stem cells (ASCs) to identify the isolated, multipotent,
plastic adherent cells. This important as to differentiate it from the plastic adherent adult
stem cells of bone marrow which is termed as multipotent mesenchymal stromal cells
(MSCs) (J. M. Gimble, Katz, & Bunnell, 2007).
2.1.5 Differentiation
Differentiation is a process of treating the unspecialized stem cells under proper conditions
to produce specialized cells. Differentiated cells are cells with a specific function; they
can’t be changed into another cell type or can’t produce stem cells. Since adipose-derived
stem cells are multipotent, therefore their therapeutic values have created interest for
regenerative medicine. The differentiation can be initiated with the addition of specific
induction medium with chemical inducers or cytokines. It is also suggested that
differentiation is age dependent, where the differentiation capacity is higher in culture for
younger patients as compared to the older ones.
Adipogenic differentiation: As the stem cell proliferation takes place, some the cells
will differentiate into preadipocytes. These preadipocytes will undergo a second
differentiation where it will begin to be filled with lipid. The lipid accumulation within cell
vacuoles will result in the droplet appearance.
Osteogenic differentiation: Osteogenesis can be determined via several methods
which are as follows; Alizarin Red staining to demonstrate mineralization, measurement of
calcium and Alkaline Phosphatase (AP) activity and also detection of lineage specific gene
and protein regulations. During osteogenic differentiation, the stem cell proliferates rapidly
and will form tightly packed colonies. Sometimes these colonies will result in dense
nodules which highly elongated spindle shaped cells with large nuclei.

Chondrogenic differentiation: Here, differentiation takes places in three steps.
Proliferation of stem cells will express extracellular matrix called protenin. The protenin
produced will tell the cells to condense into nodules. Cells in these nodules will become
chondrocytes which will secrete proteoglycan and collagen which are necessary for the
formation of cartilage (Bunnell et al., 2008).

2.2 Bird’s Nest or Edible Bird’s Nest (EBN)
2.2.1 Description
The EBN are mainly swiflets, tiny birds about the size of sparrow that feed on insects from
the following order; Hymenoptera (winged ants, fig wasps and bees), Diptera (flies),
Coleoptera (small beetles), Homoptera (leafhoppers) and Ephemenoptera (mayflies) (Lim
et al., 2002). They are found in the following areas; Indian Ocean, Southeast Asia, North
Australia and also the Pacific. The EBN used for human consumption in the Southeast
Asian region is mainly from the genus Collocalia and there are 4 main species that are
consumed which are as follows; Collocalia fuciphaga, Collocalia germanis, Collocalia
maxima, and Collocalia unicolor (Sankaran, 2001).
However in Malaysia the main EBN source comes from the swiflet species of
Aerodromus fuciphagus. These birds construct their nests with their saliva which is
described as glutinous strands of starch. The saliva comes from a pair of large salivary
glands under the tongue and is produced after mating and breeding their young ones in the
nest. The breeding seasons are usually from December to March, April to July and August
to November (Deraman, 2012). Some of the main areas in Malaysia where EBN is source is
found are Sitiawan, Teluk Intan, Kota Bharu, Kuala Terengganu, Parit Buntar, Bukit
Mertajam, Nibong Tebal, Kuantan, Muar, Segamat and many other old townships. EBN
can be mainly divided into two groups which are house nest and cave nest. In Malaysia, the
colour of the EBN is used to grade them accordingly. Usually the red coloured EBN which
is also known as red blood nest is graded as high quality nest; therefore, it is priced
expensive as compared to others (Norhayati Jr, Azman, & Wan, 2010).

2.2.2 Traditional Uses of EBN
Some of the main traditional uses of EBN that are associated with enhancing the health are
as follows; improves the immune system and digestive system which hence improves
appetite, improves complexion and skin tone and prevents flu, cough, phlegm and asthma.
Other uses which have been stated are the ability to enhance the renewal of cells and tissues
and also improving blood circulation and strengthen lungs and kidneys(Lim et al., 2002).
In the traditional Chinese medicine, the EBN is used for the following; for treating
consumptive diseases, curing tuberculosis, dry coughs, suppressing cough and phlegm-
dyspnea (difficulty in breathing), alleviating asthma, hemoptysis (coughing blood),
improving the voice, asthenia, stomach ulcer, relieving gastric troubles, and general
weakness of bronchial ailments. Either than that, it is also used to nourish the kidneys,
lungs heart and stomach to aid renal functions, raise libido, strengthen the immune system,
promote growth, enhance the immune system, improve concentration, increase energy and
metabolism, and regulate circulation (Chan, 2006; Hobbs, 2004; Kong et al., 1987).
It is also believed that consuming EBN often can improve physical and mental
strength and at the same time slows down aging effect hence restoring one’s youthfulness.
Even though there many health benefits that have been claimed, yet the mechanism of
action are still unknown and there is no evidence to support the claims (Norhayati Jr et al.,
2010).
2.2.3 Biological Compounds
The nests that are built by the male swiflets during breeding seasons are entirely from their
saliva. Some of the birds will include feathers while constructing their nests and this
amount is always within 10% of the dry weight. The average content of protein that has
been reported are as follows; (HYDROLYSATES, 2012) at 53.26%, (Marcone, 2005)at 62-
63% and (Kathan & Weeks, 1969) at 32.3%. All 18 types of amino acids that are needed by
a human body are present in the nest with aspartic acid and serine as the major amino acids
present. These amino acids are water soluble in nature and aids in skin healing, cell energy
production, regulates cell function produces antibodies and immunoglobulin which
enhances immune system .
The other common group that is found in the nest is carbohydrate in the form of
glycoprotein. The nest is mainly composed of glycoprotein with the mucin type
glycoprotein which allows it to serve as lubricant and protective agent. The carbohydrate
content is found to be at 27.26% (Marcone, 2005). The carbohydrate components are as
follows; 9% of sialic acid, 7.2% of galactosamine, 5.3% of glucosamine, 16.9% of
galactose and 0.7% of fucose. However, it is stated that sialic acid is the major substitute of
carbohydrate in the EBN (Oda, Ohta, Suga, & Aoki, 1998).
Processed EBN contains a reasonable amount of minerals which are as follows;
sodium (650 ppm), potassium (110 ppm), calcium (1298 ppm), magnesium (330 ppm),
phosphorous (40 ppm) and iron (30 ppm). Hence, sodium, potassium, calcium and
magnesium are said to be the major minerals present in the nest and are mainly important to
activate enzyme reactions in the body (Marcone, 2005). Table 2.2 explains the properties of
EBN.

Table 2.2: Properties of EBN (Chan, 2006; Guo et al., 2006; Ibrahim, Sugimoto, & Aoki,
2000; Kong et al., 1987; MARNI et al.; Matsukawa et al., 2011; Ng, Chan, & Kong, 1986;
Yida, Imam, & Ismail, 2014).
EBN properties Discussion
Antioxidant activity Some of the amino acids for instance cysteine,
methionine, histidine, tryptophan and lysine that are
found in the EBN have been proven for antioxidant
activity. It is said that the hydroxyl and carboxyl
groups in the amino acids are responsible for this for
this activity.
Epidermal growth factor (EGF)-
like activity and mitogenic
effects
The function of EGF is to stimulate the proliferation
of epidermal and epithelial tissues, in cell culture it
stimulates thymidine and amino acid incorporation
into human fibroblasts and also initiates 3T3 fibroblast
cell division.
Partially purified swiftlet nest extracts possess the first
known EGF which induces cell division, tissue
growth, cellular regeneration and cell-mediated
immunity.
It has been demonstrated that the glycoprotein is
capable of promoting cell growth. The EBN extract
that contain glycoprotein are responsible for the
mitogenic response of human peripheral blood
monocytes to stimulate the Concanavalin A (Con A)
or Phytohaemagglutinin (PHA).
Inhibits influenza virus EBN extract has been reported to contain
haemogglutination which possess an inhibiting action
against the influenza virus.
Bacteriostatic and bacteriocidal
activites
EBN contains ovortransferrin-like protein which are
both bacteriostatic and bacteriocidal and is effective in
fighting against infections.
Neurological properties One of the functions of sialic acid is for mediating
gaglioside distribution and structure of the brain. It is
reported that a good amount of sialic acid contributes
to neurological and intellectual functions in infants.
Immunomodulating properties It is said that the glucosamine that is found in the EBN
contain some immunomodulating effects.
Improves skin texture Showed that rats’ bone strength and skin thickness
were increased when administered with 100 mg/kg of
EBN extract.

2.3 Cryopreservation
Cryopreservation is a method of freezing cells or tissues at low temperatures of -196°C in
liquid nitrogen where the metabolic activities of the cells are arrested. Generally, water is
important for living cells to function and therefore we can conclude that freezing of water
can lead to death of cells. Yet, it is said that freezing can preserve cells for a long period of
time without disturbing its viability, where it slows or stops certain biochemical reactions
but accelerates others. The main objective of cryopreservation is to minimize the amount of
damage to the biological material during freezing at low temperature and storage. The
cryopreservation can be achieved at -196°C in liquid nitrogen or above -196°C in
conventional freezer, freeze drying or vitrification. However, it is stated that freezing
biological material at above -196°C (-130°C to be exact) has lower viability in long terms
as compared to storage in liquid nitrogen. Therefore, the conventional freezer is only used
for microbial suspension and for mammalian tissue culture with large number of cells.
During freezing, the cells are exposed continuously to hypertonic solution, therefore it is
necessary to remove a certain amount of water from the cells osmotically to avoid
intracellular freezing. At a slow cooling rate, there is equilibrium between the cells and it’s
external environment. However, the external environment freezes before the internal
medium due to the protective cell membrane layer. This will make the external
environment more hypertonic and thus there forcing the water to flow out from the cells.
Removal of too much of water from the cells may result in the increase of solutes within
the cells; hence the environment is not in equilibrium. At a higher cooling rate there is less
time for the water to flow out of cells resulting in the formation of intracellular ice and
hence causing the cells to be lethal. Therefore, an optimum cooling rate is needed to be
achieved between these two situations. A summary; at slow rate of cooling, cells will die

due to exposure to hypertonic condition for a long period of time whereas, for high rate of
cooling, the cells die due to the formation of intercellular ice. Other challenges that maybe
encountered by the cells are as follows; increase in ionic concentration, extreme viscous of
solution, pH changes, cells becomes closed packed, dehydration and also precipitation of
salts (Anchordoguy, Cecchini, Crowe, & Crowe, 1991; Ozkavukcu & Erdemli, 2002).
2.4 Cryoprotective Agent
The main goal of cryopreservation is to replace some of the water content within the cell
with other components that will not result in large ice crystals. Some of the examples of
these components are DMSO and glycerol. They are generally non-toxic, contains low
molecular weight and also able to permeate cells. Usually cells that are to be freezed in
liquid nitrogen are suspended in this component which is mixed with a medium and serum.
As the medium begins to freeze, the salt concentration in the external environment becomes
greater as compared to the inner of the cells hence forcing water out of the cells and to be
replaced by this cryoprotectant. Thus, reducing cellular damage during freezing process.
Some of other functions of a cryoprotectant are as follows; protects cells by reducing cell
shrinkage, reduces the fraction of solution that is to be frozen and minimizes the formation
of intracellular ice. A cryopreservation medium will contain the following; cryoprotectant,
base medium and protein source. The cryoprotectant is used to protect cells from
mechanical and physical stress and also reducing cellular damage by reducing the
formation of ice crystals. As for the protein source, the most common one used is the fetal
bovine serum (FBS) which serves to protect the cells from any freeze-thawing process
stress. Cells are usually frozen slowly at 1°C/minute (Ozkavukcu & Erdemli, 2002).
Generally, DMSO will permeate into the cell membrane and reduces the amount of
ice crystal formed both internally and externally. However, osmosis and dehydration will

still occur but at a very much lower temperature, hence allowing for the absence of
formation of intracellular ice crystals. Another less commonly used cryoprotectant which is
a high molecular weight polymer which does not permeate the cell membrane yet
contributes to the same effect is the Hydroxyethyl Starch (HES). HES is preferable used
with DMSO. Cryoprotectant such as glycerol is able to form hydrogen bonds with the head
of the lipid which are present in the membrane, hence stabilizing the lipid membrane which
is important for extreme dehydration situation (Arakawa, Carpenter, Kita, & Crowe, 1990).
The amount of cell shrinking and also re-swelling depends on cryoprotectant concentration
as well as the permeability of the cell membrane to both water and cryoprotectant used. As
the cells are thawed, a reverse process will take place; the cells will first swell and then
shrink. If the cell expands too much than it may lead to cell damage and hence it can be
prevented by stepwise removal of the cryoprotectant (Gilmore, Liu, Woods, Peter, &
Critser, 2000).

2.5 Research Assays
2.5.1 Morphology of Human Adipose Derived Stem Cells
After 24 hours of cell isolation, the ASCs would adhered to the respective culture flask,
where as the non adherent cells for example; red blood cells would be floating in the
culture. MSCs are plastic-adherent and posses a spindle shaped cells, which develops into
visible colonies after approximately three days. After the second passage, human adipose
derived stem cells will apprear more uniform with fibroblast-like shape which is similar to
a bone marrow stromal cell.
Adipogenic differentiation: According to (Zhu et al., 2008), no lipid droplets would
be observed in an undeffientiated ASCs, where as ASCs differentiated into adipocytes via
mutiple passage showed intracellular lipid filled droplets in almost 80-90% of the cells in
adipogenic media. The cells contain lipid vesicles with the majority of intracellular space
occupied by droplets and lipid vesicles which gives an expanded morphology. However, at
higher passage number, the differentiation potential decreased with only 40-55% ASCs
differentiated into adipocytes (Csaki, Matis, Mobasheri, Ye, & Shakibaei, 2007).
Osteogenic differentiation: The culture that was incubated for about 3 weeks,
showed multiple layers of cells which could also give rise to dense nodules from which
radiated highly elongated spindle-shaped cells with large nuclei. The ASCs that undergo
osteogenic differentiation is about 90% at passage 4 where the mineralization nodules were
visible to the naked eye. As the passage number increases, the differentiation capacity
decreases.
Chondrogenic differentiation: ASCs cultured (micromass pellet culture or high
density culture) in chondrogenic induction medium contains a round, nodule like
morphology (Csaki et al., 2007).
2.5.2 Induction Medium and Staining
Adipogenesis: Isobutyl-methylxanthine, insulin and dexamethasone are added to the
adipogenic induction medium. Insulin promotes the differentiation of human adipose-
derived stem cells into adipocytes. It is also proven that glucocorticoids in the presence of
insulin are able to promote differentiation of MSCs towards adipogenic lineage. Oil red O
staining can be done to show the presence of intracellular lipid vacuoles (Rampersad,
2012).
Osteogenesis: Ascorbic acid, β-glycerophosphate, and dexamethasone are added to
the osteogenic induction medium. Dexamethasone is needed for osteogenesis of stem cells
as well as for the formation of bone nodule. Ascorbic acid on the other hand functions as a
cofactor in hydroxylation of proline and lysine residues in collagen and also increases the
synthesis of non-collagenous bone matrix proteins. β-glycerophosphate is important for the
calcification of the extracellular matrix. Alizarin red staining can be done to show the
presence of a calcified extracellular matrix (Rampersad, 2012).
Chondrogenesis: Dexamethasone and TGF-β3 are added to the chondrogenic
induction medium promotes chondrogenesis. Glucocorticoids promote chondrogenic
differentiation by enhancing the expression of the cartilage extracellular matrix gene
(Derfoul, Perkins, Hall, & Tuan, 2006). Alcian blue staining can be done to show the
presence of proteoglycans (Guzzo, Scanlon, Sanjay, Xu, & Drissi, 2014).The average
percentage of mineralization or lipid vacuoles or proteoglycans area against the surface area
can be determined via images taken after their respective staining.

2.5.3 Resazurin Reduction Test
Alamar blue is used to monitor the reducing environment of a living cell. The active
ingredient, resazurin is water soluble, non-toxic, stable in medium and possesses cell
membrane permeability. Resazurin (IUPAC name: 7-hydroxy-10-oxidophenoxazin-10-ium-
3-one) is also known as diazo-resorcinol, azoresorcin, resazoin and resazurine. This test
was first used to assess bacterial and yeast contamination in milk in the year 1929.
Resazurin; a highly dichromatic solution is a blue non-fluorescent dye that will be reduced
into resorufin, which is highly fluorescent and pink in color. The function of the dye is to
act as an intermediate to accept electron in the electron transport chain without interfering
the normal transfer of electrons. The oxidation-reduction potential of Alamar blue is +380
mV at pH 7.0, 25 °C. Alamar blue can be reduced by the following; NADPH, FADH,
FMNH2, NADH and cytochromes. Once the indicator dye accepts the electrons, the non-
fluorescent blue color is reduced to pink color. Other enzymes such as diaphorases,
NAD(P)H:quinone oxidoreductase, dihydrolipoamine dehydrogenase, flavin reductase
within the cytoplasm and the mitochondria reductases may also reduce the Alamar blue.
Therefore, the Alamar blue reduction is not solely dependent on the electron transport
where as it can be also the cellular metabolism. The oxidation-reduction state allows the
measurement to be either quantitative; colorimetric and fluorometric readings or
qualitative; changes in color indicating the presence and absence of viable cells.
Spectrophotometric absorbance will be taken at two wavelengths which are as follows; 570
and 600 nm or 540 and 630 nm. Absorbance values will differ according to the microtiter
plate. The fluorescence signals are measured at an excitation wavelength of 530–560 nm
and an emission wavelength of 590 nm (Rampersad, 2012).
2.5.4 Cell Viability Assays
Cell viability assays are commonly used for drug screening. There are various cell
functions to determine this which are as follows; ATP and coenzyme production,
nucleotide uptake an enzyme activity, cell adherence and cell membrane permeability.
Generally, viability assays measures the percentage of viable cells in a suspension which
can be done via dye exclusion stain. Here, cells with intact membrane will exclude the dye
while the cells without an intact membrane with uptake the dye. Examples of dye exclusion
stain are as follows; Trypan Blue, erythrosine and naphthalene black. Trypan blue is
commonly used for measure viability by staining the dead cells (Freshney). It is a rapid,
simple and inexpensive method to assess cell viability (Longo-Sorbello, Say, m, Banerjee,
& Bertino, 2006). In this method, the viability of the cells is determined by counting the
unstained cells with the aid of a microscope (Freshney). According to (Longo-Sorbello et
al., 2006) the dye exclusion test is the ability of the viable cells to be impermeable to the
following dyes; Trypan Blue, erythrosine, naphthalene black and other dyes. When the
security membrane is compromised, there is an uptake of dye by the non viable cells which
will appear as dark blue color where as the viable cells which was not stained will appear as
clear with refractile ring around them. One of the down points of trypan blue staining is
that, the dye can’t be used to differentiate between healthy cells and the viable cells that are
losing their cell functions.

CHAPTER III
METHODOLOGY
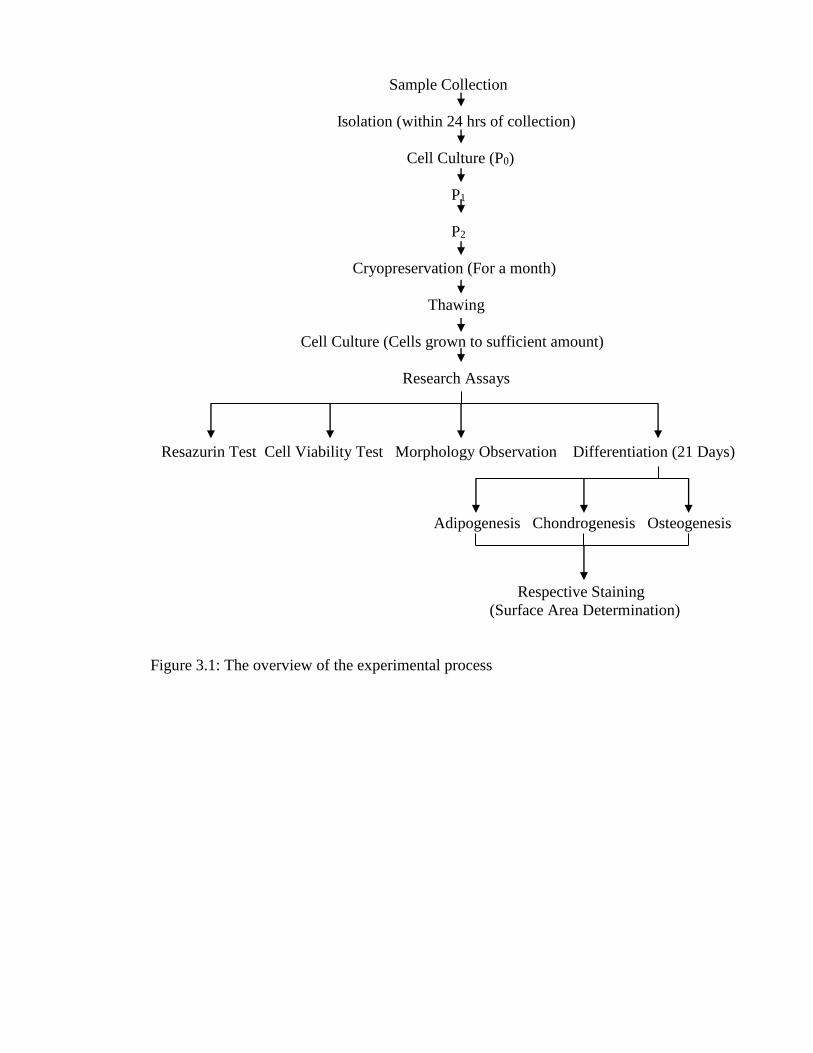
Figure 3.1 shows the overview of the experimental process. Subcutaneous adipose tissue
that was collected was isolated within 24 hours and was cultured up to second passage.
Then, the cells were subjected to cryopreservation for a month in liquid nitrogen. After a
month, the cells were thawed and were grown to sufficient amount to carry out the
following research assays: cell viability test, resazurin test, morphology observation and
differentiation assay. The cells were differentiated into the following lineages: adipogenic,
chondrogenic and osteogenic and the respective stains were carried out.
Sample Collection
Isolation (within 24 hrs of collection)
Cell Culture (P0)
P1
P2
Cryopreservation (For a month)
Thawing
Cell Culture (Cells grown to sufficient amount)
Research Assays
Resazurin Test Cell Viability Test Morphology Observation Differentiation (21 Days)
Adipogenesis Chondrogenesis Osteogenesis
Respective Staining
(Surface Area Determination)
Figure 3.1: The overview of the experimental process

3.1 Sample Collection
The subcutaneous adipose tissue was collected from the C-section patients from Dewan
Bedah, Pusat Perubatan Universiti Malaya. The collected sample was placed in a container
containing saline solution. Prior to collection, the patient’s were presented with a consent
form. This is mainly to protect the human rights. After collection, the sample was brought
back to the laboratory for isolation. The container containing the sample was wrapped with
tissue to prevent any form of exposure to the sun.
3.2 Isolation
Under the laminar air flow, the subcutaneous adipose tissue that was collected was removed
from the container and was placed on a sterile petri dish and was washed twice with
Phosphate Buffered Solution (PBS). Than, with the aid of a sterile tweezer and scissor, the
blood vessels were removed and the remaining tissue was finely chopped. The resulting
tissue was place into a sterile Falcon tube and 6 mL of Collagenase Type I was added to it.
Than, the tube was placed into the shaking incubator for 10 minutes, 37°C and 250 rpm and
was later centrifuged at 10 minutes and 1500 rpm. After centrifuging, the supernatent was
removed with the aid of a pastuer pipette and the remaining solution was washed with PBS.
10 mL of PBS was added and was vortexed and was centrifuged for 10 minutes and 1500
rpm This step is to remove all the oily substances. Than, the supernatent was removed with
the aid of a pastuer pipette. 2 mL of complete medium was added to the pellet that
remained in the tube and was dispersed with the aid of a pipette. The medium containing
the dispersed pellet was divided into two T 25 Flasks. Finally, 5 mL of complete medium
was added to both the flasks (Po) and was incubated at normoxia condition; 21% O2, 5%
CO2 for 24 hours before viewing under the microscope (Zuk et al., 2002).

3.3 Trypsinization
After 24 hours, the cells were viewed under the microscope and the culture medium was
replaced to remove the non-adherent cells. The culture medium was renewed every 2 to 3
days. The human adipose derived stem cells primary culture (Po) was grown to 90%
confluence. Once it has reached 90% confluence, the cells were detached from the culture
flasks with trypsin-EDTA (Gibco). The cell culture was grown up to passage 3 (P3) which
was used for further experiment. Once the cell culture has reached confluence, the cell
culture was trypsinised. The cells were washed with 5 mL PBS. Then, 4 mL of trypsin was
added to the culture and was incubated for 5 minutes. After 5 minutes, the cells were
viewed under the microscope to ensure the cells were detached from the flask. Once the
cells were detached, 5 mL of complete medium was added to the flask to deactivate the
function of trypsin. All the solution was then transferred into a Falcon tube and was
centrifuged for 10 minutes, 1500 rpm. The supernatant was then removed with the aid of a
Pasteur pipette leaving behind the pellet. 4 mL of complete medium was added to the pellet
and was suspended with the aid of the pipette and was divided into four T 25 Flasks.
Finally, complete medium was added to all the flasks and was incubated at normoxia
condition for 24 hours before viewing under the microscope. This process was repeated
until it reaches P3 (Zhu et al., 2008).
3.4 Cryopreservation
In this research, cells were preserved in the respective cryoprotectant which are as follows;
10% DMSO+90% FBS (Serves as Control), 5% DMSO+1% EBN+94% FBS and 1%
EBN+99% FBS.
For all the three groups above, the cells were grown up to P2 and once it reaches
confluence, the cells were cryropreserved. Once the cell culture has reached confluence, the

cell culture was trypsinised. The cells were washed with 5 mL PBS. Then, 4 mL of trypsin
was added to the culture and was incubated for 5 minutes. After 5 minutes, the cells were
viewed under the microscope to ensure the cells were detached from the flask. Once the
cells were detached, 5 mL of complete medium was added to the flask to deactivate the
function of trypsin. All the solution was then transferred into a Falcon tube and was
centrifuged for 10 minutes, 1500 rpm. The supernatant was then removed with the aid of a
Pasteur pipette leaving behind the pellet. 1 mL of the respective cryoprotectant was added
to the pellet and was suspended with the aid of a pipette and was transferred into a cryovial.
The cryovials were placed into Mr. Frosty Freezing Container. The system is designed to
achieve a rate of cooling very close to -1°C/minute, the optimal rate for cell preservation.
The container was placed in -80°C overnight. This step is important because the cells must
be frozen slowly which done by the Mr. Frosty Freezing Container. Then, the vials were
transferred into the liquid nitrogen tank the following day. The cells were cryopreserved for
a month (Liu et al., 2008).
3.5 Thawing Cells
After one month, the cells that were cryopreserved were thawed. The vials were placed in
the water bath at 37°C. Once it has been thawed, under the laminar air flow, 10 mL of
complete medium was added to the cells and was centrifuged at 2000 rpm for 10 minutes.
Then, the supernatant was removed with the aid of a pastuer pipette leaving the pellet
behind where 3 mL of complete medium was added to it. The resulting solution were
suspended. Separately, 90 µL was taken out with aid of a pipette and were transferred into
the centrifuge tube for cell counting. The remaining solution was transferred into a T 25
flask and appropriate amount of complete medium was added to it (Koch, Heerkens,
Thomsen, & Betts, 2007).

3.6 Cell Counting
10 µL of trypan blue was added to 90 µL of the solution containing cells which was taken
out earlier and was suspended with the aid of a pipette. 20 µL of the resulting solution was
taken and was placed onto hemocytometer. Cell counting was done under the microscope
(4x objective). The non-viable cells was stained blue, viable cells remained opaque. Cell
counting was done in triplicates to obtain average (Louis & Siegel, 2011). Equation I
below shows the formula to calculate the percentage of cell viability.
Equation I
Percentage of Cell Viability = Total number viable cells X 100%
Total number of cells
3.7 Cell Morphology
The cell morphology was determined by observing the morphological characteristics of the
MSCs. The cell culture flasks were examined at all medium re-feeding intervals at two to
three days to detect abnormalities in cell morphology. All MSCs should possess fibroblast-
like morphology and at the same time must be plastic-adherent. Once the cells have reached
confluence at passage 3, the cell culture was viewed at 4x and 10x objectives under the
microscope and images were taken (J. Gimble & Guilak, 2003; Zhu et al., 2008).

3.8 Differentiation Assay
Once the cells have reached confluence at P3, the ASCs were seeded into 6 well plates and
were expended to 90% confluence. Osteogenic differentiation was carried out for 21 days.
ASCs were maintained at normoxia condition and the culture medium (osteogenic
induction medium) will be replaced every 2 days. After 21 days, the cells were stained with
Alizarin Red solution to determine the calcium deposits (Zhu et al., 2008).
At the confluence of P3, ASCs were seeded into 6 well plates and were expended to
70% confluence. Adipogenic differentiation was carried out for 21 days. ASCs were
cultured in adipogenic induction medium and were maintained at normoxia condition. After
2 days, adipogenic induction medium was removed and was replaced with complete
medium for the next 2 days. Cyclic treatment was continued for 21 days. After 21 days, the
cells were stained with Oil-red-O Solution. Lipid droplet formation was detected using this
stain to assess MSCs differentiation towards adipocytic phenotype (Zhu et al., 2008).
As for chondrogenic differentiation, at P3, cells were seeded into the T 75 flask and
were expended to 90% confluence. Once it has reached confluence, the cells were detached
and were placed into the 50 mL Falcon tube and were centrifuged for 10 minutes, 2500
rpm. The pellet formed was cultured in the chondrogenic induction medium and was
maintained at normoxia condition. The culture medium was replaced every 2 days for 21
days. After 21 days, the pellet was fixed, dehydrated, cleared and infiltrated and embedded
in paraffin wax. The specimen was sectioned and fished on slides. Then, Alcian Blue
staining was carried out and the resulting slide was viewed under the microscope (Sudo et
al., 2007; Zhu et al., 2008). All the three lineages were stained and were viewed under the
microscope at appropriate objective. Multiple images were taken which were used for
surface area determination.

3.9 Staining Protocol
3.9.1 Alizarin Red
To prepare the Alizarin Red solution, 2g of Alizarin Red powder was mixed with 100 mL
of deionized water in a beaker with the aid of a stirrer. Under the laminar air flow, the
solution was filtered through a 0.25 mm syringe filter (De Bari, Dell'Accio, Tylzanowski,
& Luyten, 2001).
Staining Procedure
Under the laminar air flow, the osteogenic induction medium was removed from the 6 well
plates and the cells were fixed with 2 mL of 10% Formalin and were incubated at 4°C for
10 minutes. After 10 minutes, formalin was removed and was washed with deionized water.
Then, the water was removed from each well and 2 mL of deionized water was added to
each and was left for incubation between two to five minutes at room temperature. After the
incubation period, the deionized water was removed and 2.5 mL of Alizarin Red solution
(pH 4.1-4.3) was added to each well and was incubated at room temperature for 10 minutes.
The stained cells were then extensively washed with PBS to remove excess stain and any
nonspecific precipitation. Then, the plates were viewed under the microscope (10x
objectives). The calcium deposition on the differentiated cells was represented by the
positive red staining (De Bari et al., 2001; Ovchinnikov, 2009).
3.9.2 Oil-Red-O
Under the laminar air flow, a fresh 60% Oil-red-O working solution was prepared from a
stock solution (300 mg Oil-red-O powder in 100 mL isopropanol), was left for 10 minutes
and was filtered through a 0.25 mm syringe filter (De Bari et al., 2001).
Staining Procedure
Under the laminar air flow, the medium was removed from the 6 well plates and the cells
were fixed with 2 mL of 10% Formalin and were incubated at 4°C for 10 minutes. After 10
minutes, formalin was removed and was washed with deionized water. Then, 60%
isopropanol working solution was prepared. The water was removed from each well and 1
mL of 60% isopropanol was added to each and was left for incubation between two to five
minutes at room temperature. After the incubation period, the , 60% isopropanol was
removed and 2.5 mL of Oil-Red-O working solution was added to each well and was
incubated at room temperature for 10 minutes. The stained cells were then washed with
PBS to remove the residual Oil-Red-O. However, the stained cells were not washed
extensively to maintain the hydration for clear viewing. Then, the plates were viewed under
the microscope (4x objective). The lipid formation that was detected using this stain
represented the differentiation of MSCs towards adipocytic phenotype (De Bari et al.,
2001).
3.9.3 Alcian Blue Staining
After 21 days, the medium was removed and the micromass culture pellet was washed with
PBS. For histological analysis, the pellet was first fixed in 10% Formalin for 24 hours.
Then, the pellet was dehydrated in a graded ethanol series, cleared with xylene, infiltrated
with paraffin wax and was embedded in paraffin wax. Next, the specimens were cut into 5
mm thick sections with the aid of a microtome and the paraffin sections were fished onto
slides which were dried on a hot plate at 37°C (De Bari et al., 2001). Figure 3.2 shows the
overview process of embedding the cells into the paraffin wax.

Formalin (24 hours)
50% ethanol (2 hours)
70% ethanol (2 hours)
90% ethanol (2 hours)
100% ethanol (2 hours)
100% ethanol (2 hours)
Xylene (2 hours)
Xylene (2 hours)
Paraffin Wax (2 hours)
Paraffin Wax (2 hours)
Paraffin Wax (2 hours)
Figure 3.2: Process of Embedding the Cells into the Paraffin Wax
The slides with the paraffin sections were deparaffinised in xylene, rehydrated through a
serious of ethanol, rinsed in distilled water and was stained with Alcian Blue to assess the
proteoglycan content. Then, the stained tissue sections were mounted with DPX mounting
and were visualized under the light microscope (10x objective). The differentiated cells
were stained in light blue color (De Bari et al., 2001). Figure 3.3 shows the steps involved
in the Alcian Blue staining.
Dehydration
Clearing
Infiltration

Xylene (5 minutes)
Xylene (5 minutes)
100% ethanol (3 minutes)
95% ethanol (3 minutes)
80% ethanol (3 minutes)
70% ethanol (3 minutes)
50% ethanol (3 minutes)
Alcian Blue (30 minutes)
Distilled Water (2 minutes)
Nuclear Fast Red (10 minutes)
Distilled Water (1 minutes)
95% ethanol (3 minutes)
95% ethanol (3 minutes)
100% ethanol (3 minutes)
100% ethanol (3 minutes)
Xylene (5 minutes)
Xylene (5 minutes)
DPX mounting
Figure 3.3: Alcian Blue Staining
Rehydration
Dehydration
Clearing

3.10 Resazurin Reduction Test
As for resazurin test, the cells were seeded into the 24 well plate based on Equation I and II
below.
Equation I
Cells per mL = the average count per square x the dilution factor x 104 (count 10 squares)
Equation II
Cells per µL = 40 000 x the dilution factor x 100
Cells per mL
After seeding, the plate was incubated for 24 hours under normoxia condition. The
resazurin reduction test was carried out on day 1, day 3, day 7, day 10 and day 14. Under
the laminar air flow, after 24 hours of seeding, the medium was removed and was washed
with PBS. Then, in the dark, 1000 µL (1 mL) of resazurin blue dye was added to the wells
containing cells and two empty wells which serve as control. Once the dye has been added,
the plate was wrapped with aluminium foil and was incubated for three hours under
normoxia condition. After 3 hours, the plate was placed onto the shaking incubator for 10
minutes, 30 rpm. Next, under the laminar air flow, in the dark, 100 µL was taken from each
well and were transferred into the 96 well plate. Triplicates from each well were done. The
96 well plate was wrapped with aluminium foil and was subjected to the microplate reader.
The data obtained from the microplate reader will show the proliferation rate of the samples
(O'Brien, Wilson, Orton, & Pognan, 2000). Using the data obtained, the following results
were calculated using Equation III and IV below to plot both the standard and growth
curve.

Equation III
Percentage of Resazurin Reduction = (εOX) λ2Aλ1 - (εOX) λ1Aλ2 X 100
(εRED) λ1A’λ2 - (εRED) λ2A’λ1
λ1 = 570
λ2 = 600
(εOX)λ2 = 117,216
(εOX)λ1 = 80,586
(εRED)λ1 = 155,677
(εRED)λ2 = 14,652
Aλ1 = Observed absorbance reading for test well
Aλ2 = Observed absorbance reading for test well
A’λ2 = Observed absorbance reading for negative control well
A’λ1 = Observed absorbance reading for negative control well
Equation IV
y = 0.0004x
y = Percentage of Resazurin Reduction
x = Number of cells

3.11 Medium Preparation
3.11.1 Basal Medium
Basal medium is a cell culture medium which is a complex mixture of salts, carbohydrates,
vitamins, amino acids, metabolic precursors and trace elements. One packet of F12:
DMEM powder (Commercial) and 1.2g of sodium bicarbonate was added to 1000 mL of
distilled water in a beaker and were mixed with the aid of a stirrer. Then, the pH was
adjusted to 7.2 with the aid of a pH meter. Under the laminar air flow, the medium was
filtered with the aid of a vacuum pump (A. G. Smith, 1991).
3.11.2 Complete Medium
To enhance cell growth, growth factors, hormones and other proteins are added to the basal
medium. Often this is accomplished by supplementing the basal medium with serum. The
resulting medium is referred to as complete medium. Under the laminar air flow the
ingredients in Table 3.1 were mixed together and were filtered.
Table 3.1: Ingredients of Complete Medium (A. G. Smith, 1991)
Ingredients Volume (mL)
Basal medium (F12: DMEM) 435
10% FBS 50
1% antibiotic-antimycotic solution 5
1% glutamate 5
1% ascorbic Acid 5
Total 500
3.11.3 Phosphate Buffered Saline (PBS) Solution
PBS is buffer solution commonly used in biological research mainly to wash tissues and
cells. It is a water-based salt solution containing sodium phosphate, sodium chloride and in
some formulations, potassium chloride and potassium phosphate. Five PBS tablets were
added to 1000 mL of distilled water in a beaker and were mixed with the aid of a stirrer.

Then, the pH was adjusted to 7.2 with the aid of a pH meter. The PBS solution was
autoclaved (A. G. Smith, 1991).
3.11.4 Osteogenic Induction Medium
Induction medium is a medium that facilitate the differentiation of cells into the specific
lineage. Under the laminar air flow, in the dark, the ingredients in Table 3.2 were mixed
together and were filtered.
Table 3.2: Ingredients of Osteogenic Induction Medium (Peister et al., 2004)
Ingredients Volume
Complete medium 98 mL
β-glycerophosphate 1.2 mL
Ascorbate-2-Phosphate 1 mL
Dexamethasone 100 µL
3.11.5 Adipogenic Induction Medium
Under the laminar air flow, in the dark, the ingredients in Table 3.3 were mixed together
and were filtered.
Table 3.3: Ingredients of Adipogenic Induction Medium (Peister et al., 2004)
Ingredients Volume
Complete medium 97 mL
Indomethacin 1 mL
Insulin Transferrin Selenium (ITS) 588 µL
3-Isobutyl-1-methylxanthine (IBMX) 2.2 mL
Dexamethasone 1 mL

3.11.6 Chondrogenic Induction Medium
Under the laminar air flow, in the dark, the ingredients in Table 3.4 were mixed together
and were filtered.
Table 3.4: Ingredients of Chondrogenic Induction Medium (Peister et al., 2004)
Ingredients Volume
Complete medium 97.5 mL
Insulin Transferrin Selenium (ITS) 1 mL
Insulin Growth Factor-1 (IGF-1) 50 µL
Ascorbate-2-Phosphate 1.2 mL
Dexamethasone 100 µL
L-proline 100 µL
Transforming growth factor beta 3 (TGF-β3) 10 µL

CHAPTER IV
RESULTS
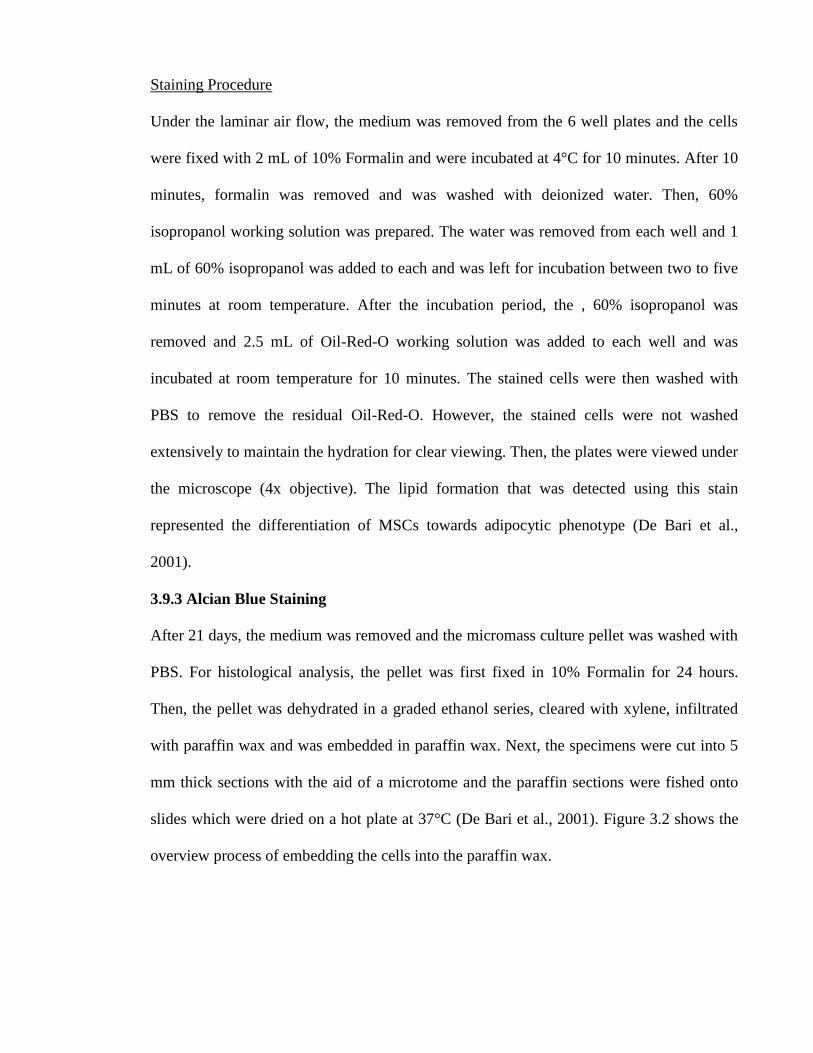
4.1 Cell Viability Test
The cell viability was carried out after thawing the cells and growing it to a confluence of
90% in a T25 flask. Table 4.1, 4.2 and 4.3 shows the percentage of cell viability for cells
preserved in the 10% DMSO+90% FBS, 5% DMSO+1% EBN+94% FBS and 1%
EBN+99% FBS respectively. The bar graph depicted in Figure 4.1 shows the comparison
for the percentage of cell viability (using the mean value) for cells preserved in 10%
DMSO+90% FBS, 5% DMSO+1% EBN+94% FBS and 1% EBN+99% FBS.
Table 4.1: Percentage of Cell Viability for Cells Preserved in 10% DMSO+90% FBS
10% DMSO+90% FBS
Non-viable cells Total cells Viable cells Viability (%)
4 135 131 97.04
14 112 98 87.50
15 120 105 87.50
17 131 114 87.02
4 115 111 96.50
9 119 110 92.44
Mean 91.33
Standard Deviation 4.66
Standard Error 1.90

Table 4.2: Percentage of Cell Viability for Cells Preserved in 5% DMSO+1% EBN+94%
FBS
5% DMSO+1% EBN+94% FBS
Non-viable cells Total cells Viable cells Viability (%)
29 136 107 78.68
19 145 126 86.90
15 107 92 85.98
21 110 89 80.91
21 85 64 75.29
24 105 81 77.14
Mean 80.82
Standard Deviation 4.74
Standard Error 1.93
Table 4.3: Percentage of Cell Viability for Cells Preserved in 1% EBN+99% FBS
1% EBN+99% FBS
Non-viable cells Total cells Viable cells Viability (%)
35 72 37 51.39
46 84 38 45.24
16 81 65 80.25
27 75 48 64.00
25 62 37 59.68
27 73 46 63.01
Mean 60.59
Standard Deviation 12.04
Standard Error 4.92
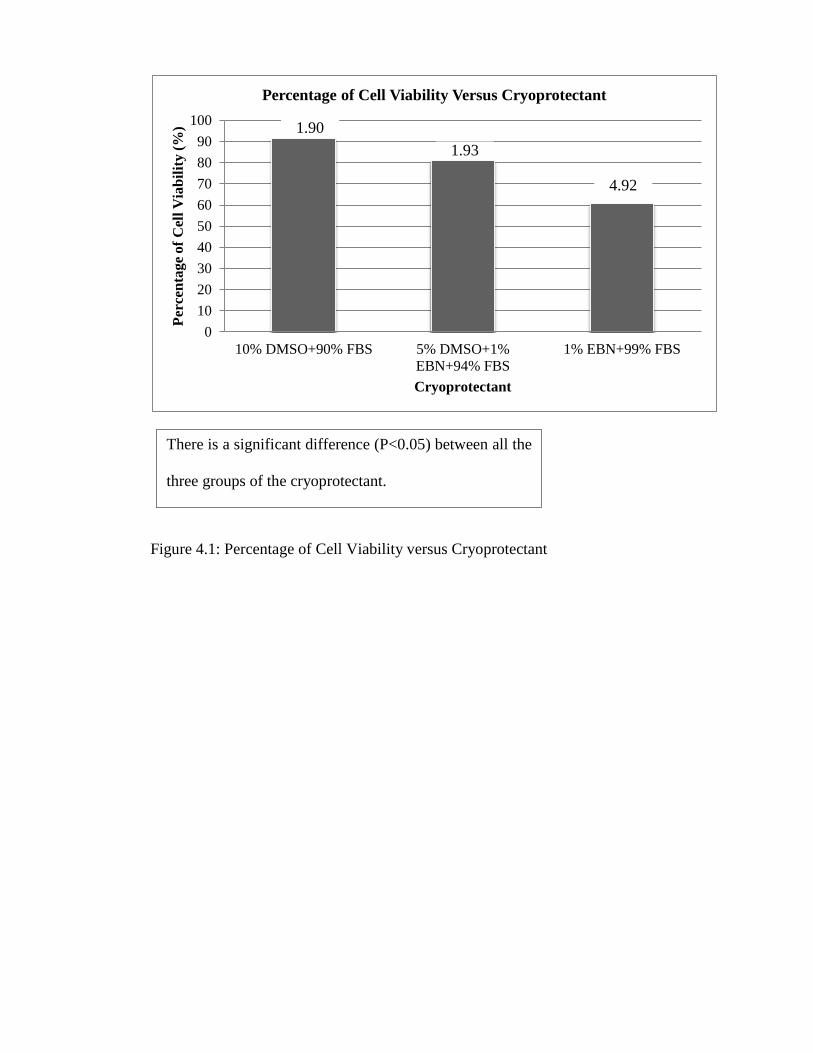
Figure 4.1: Percentage of Cell Viability versus Cryoprotectant
0
10
20
30
40
50
60
70
80
90
100
10% DMSO+90% FBS 5% DMSO+1%
EBN+94% FBS
1% EBN+99% FBS
Per
cen
tag
e o
f C
ell
Via
bil
ity
(%
)
Cryoprotectant
Percentage of Cell Viability Versus Cryoprotectant
1.90
1.93
4.92
There is a significant difference (P<0.05) between all the
three groups of the cryoprotectant.
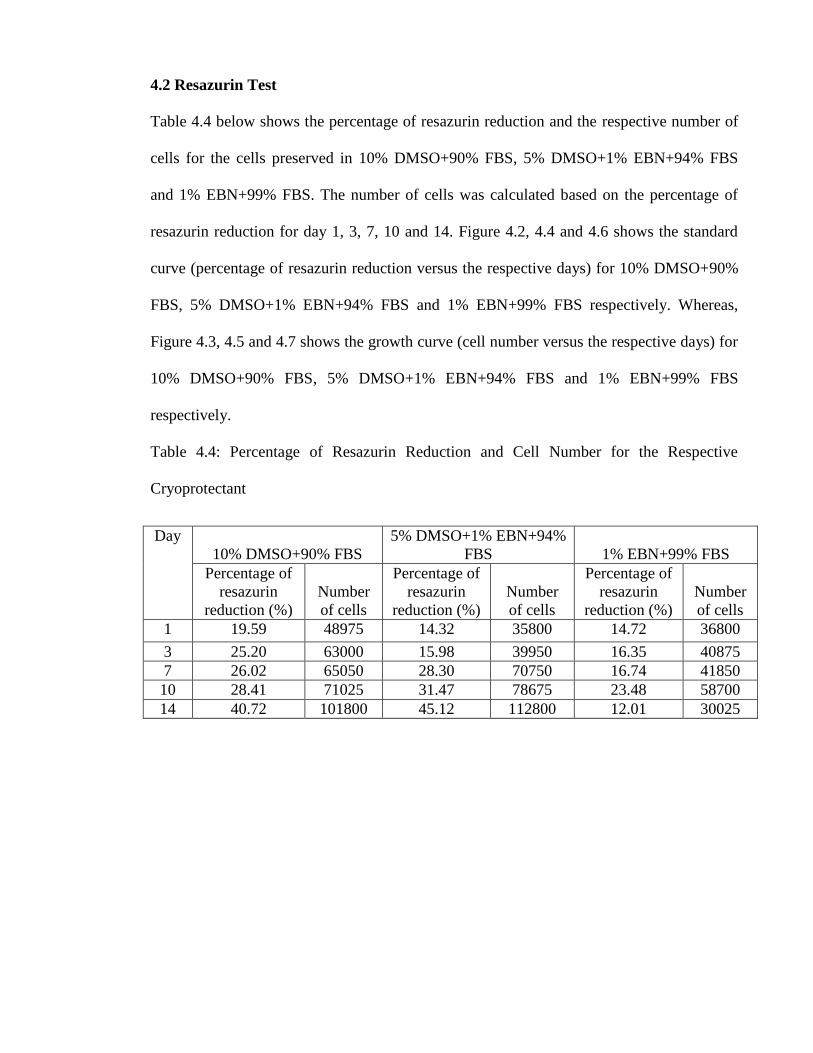
4.2 Resazurin Test
Table 4.4 below shows the percentage of resazurin reduction and the respective number of
cells for the cells preserved in 10% DMSO+90% FBS, 5% DMSO+1% EBN+94% FBS
and 1% EBN+99% FBS. The number of cells was calculated based on the percentage of
resazurin reduction for day 1, 3, 7, 10 and 14. Figure 4.2, 4.4 and 4.6 shows the standard
curve (percentage of resazurin reduction versus the respective days) for 10% DMSO+90%
FBS, 5% DMSO+1% EBN+94% FBS and 1% EBN+99% FBS respectively. Whereas,
Figure 4.3, 4.5 and 4.7 shows the growth curve (cell number versus the respective days) for
10% DMSO+90% FBS, 5% DMSO+1% EBN+94% FBS and 1% EBN+99% FBS
respectively.
Table 4.4: Percentage of Resazurin Reduction and Cell Number for the Respective
Cryoprotectant
Day
10% DMSO+90% FBS
5% DMSO+1% EBN+94%
FBS 1% EBN+99% FBS
Percentage of
resazurin
reduction (%)
Number
of cells
Percentage of
resazurin
reduction (%)
Number
of cells
Percentage of
resazurin
reduction (%)
Number
of cells
1 19.59 48975 14.32 35800 14.72 36800
3 25.20 63000 15.98 39950 16.35 40875
7 26.02 65050 28.30 70750 16.74 41850
10 28.41 71025 31.47 78675 23.48 58700
14 40.72 101800 45.12 112800 12.01 30025

Figure 4.2: Standard Curve for 10% DMSO+90% FBS
Figure 4.3: Growth Curve for 10% DMSO+90% FBS
y = 0.0004xR² = 1
0
5
10
15
20
25
30
35
40
45
0 20000 40000 60000 80000 100000 120000Per
cen
tag
e o
f R
esa
zuri
n R
edu
ctio
n (
%)
Cell Number
Percentage of Resazurin Reduction Versus Day
0
20000
40000
60000
80000
100000
120000
0 2 4 6 8 10 12 14 16
Cel
l N
um
ber
Day
Cell Number Versus Day
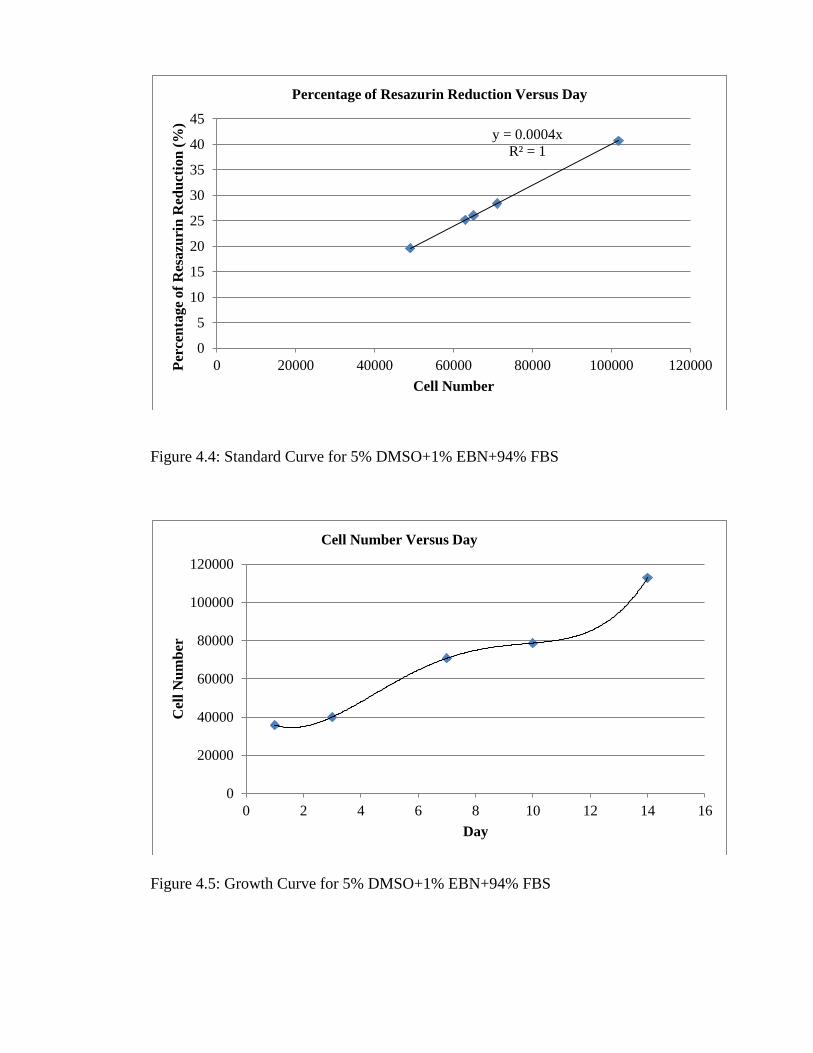
Figure 4.4: Standard Curve for 5% DMSO+1% EBN+94% FBS
Figure 4.5: Growth Curve for 5% DMSO+1% EBN+94% FBS
y = 0.0004x
R² = 1
0
5
10
15
20
25
30
35
40
45
0 20000 40000 60000 80000 100000 120000Per
cen
tag
e o
f R
esa
zuri
n R
edu
ctio
n (
%)
Cell Number
Percentage of Resazurin Reduction Versus Day
0
20000
40000
60000
80000
100000
120000
0 2 4 6 8 10 12 14 16
Cel
l N
um
ber
Day
Cell Number Versus Day

Figure 4.6: Standard Curve for 1% EBN+99% FBS
Figure 4.7: Growth Curve for 1% EBN+99% FBS
y = 0.0004x
R² = 1
0
5
10
15
20
25
0 10000 20000 30000 40000 50000 60000 70000Per
cen
tag
e o
f R
esa
zuri
n R
edu
ctio
n (
%)
Cell Number
Percentage of Resazurin Reduction Versus Day
0
10000
20000
30000
40000
50000
60000
70000
0 5 10 15
Cel
l N
um
ber
Day
Cell number versus Day
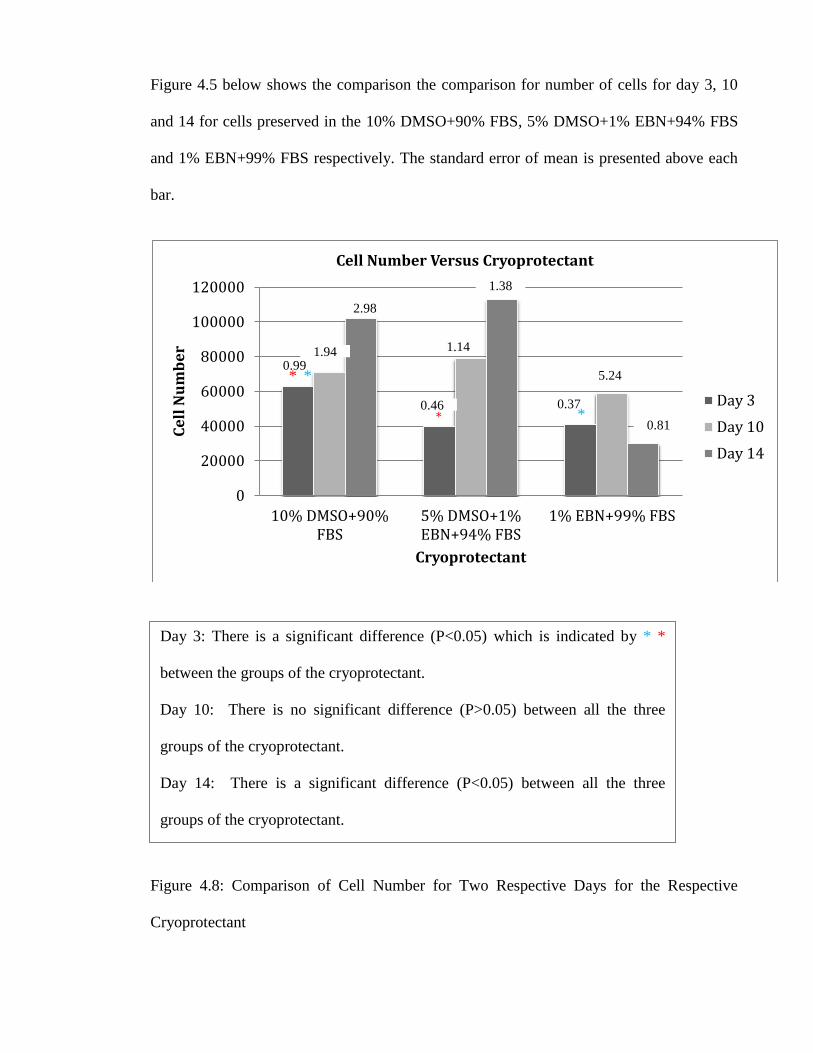
Figure 4.5 below shows the comparison the comparison for number of cells for day 3, 10
and 14 for cells preserved in the 10% DMSO+90% FBS, 5% DMSO+1% EBN+94% FBS
and 1% EBN+99% FBS respectively. The standard error of mean is presented above each
bar.
Figure 4.8: Comparison of Cell Number for Two Respective Days for the Respective
Cryoprotectant
0
20000
40000
60000
80000
100000
120000
10% DMSO+90%FBS
5% DMSO+1%EBN+94% FBS
1% EBN+99% FBS
Ce
ll N
um
be
r
Cryoprotectant
Cell Number Versus Cryoprotectant
Day 3
Day 10
Day 14
0.991.94
2.98
0.46
1.14
1.38
0.37
5.24
0.81
*
*
*
*
Day 3: There is a significant difference (P<0.05) which is indicated by * *
between the groups of the cryoprotectant.
Day 10: There is no significant difference (P>0.05) between all the three
groups of the cryoprotectant.
Day 14: There is a significant difference (P<0.05) between all the three
groups of the cryoprotectant.

4.3. Differentiation Ability
4.3.1 Cryoprotectant: 10% DMSO+90% FBS
Figure 4.9 and 4.10 shows the morphology for cells preserved in 10% DMSO+90% FBS at
a magnification of 4x and 10x objective, before staining.
I. Before Staining
Figure 4.9: Stem Cells Preserved in 10% DMSO+90% FBS (Magnification: 4x objective)
Figure 4.10: Stem Cells Preserved in 10% DMSO+90% FBS (Magnification: 10x
objective)

Figure 4.11, 4.12 and 4.13 shows cells stained with the respective stains for the
differentiation assay for cells preserved in 10% DMSO+90% FBS. Adipogenic
differentiation was stained with Oil Red-O stain, whereas chondrogenic and Osteogenic
were stained with Alcian blue and Alizarin red respectively.
II. After Staining
Figure 4.11: Adipogenic (Magnification: 4x objective)
Figure 4.12: Chondrogenic (Magnification: 10x objective)
Figure 4.13: Osteogenic (Magnification: 10x objective)

4.3.2 Cryoprotectant: 5% DMSO+1% EBN+94% FBS
Figure 4.14 and 4.15 shows the morphology for cells preserved in 5% DMSO+1%
EBN+94% FBS at a magnification of 4x and 10x objective, before staining.
I. Before Staining
Figure 4.14: Stem Cells Preserved in 5% DMSO+1% EBN+94% FBS (Magnification: 4x
objective)
Figure 4.15: Stem Cells Preserved in 5% DMSO+1% EBN+94% FBS (Magnification: 10x
objective)

Figure 4.16, 4.17 and 4.18 shows cells stained with the respective stains for the
differentiation assay for cells preserved in 5% DMSO+1% EBN+94% FBS.
II. After Staining
Figure 4.16: Adipogenic (Magnification: 4x objective)
Figure 4.17: Chondrogenic (Magnification: 10x objective)
Figure 4.18: Osteogenic (Magnification: 10x objective)

4.3.3 Cryoprotectant: 1% EBN+99% FBS
Figure 4.19 and 4.20 shows the morphology for cells preserved in 1% EBN+99% FBS at a
magnification of 4x and 10x objective, before staining.
I. Before Staining
Figure 4.19: Stem Cells Preserved in 1% EBN+99% FBS (Magnification: 4x objective)
Figure 4.20: Stem Cells Preserved in 1% EBN+99% FBS (Magnification: 10x objective)

Figure 4.21, 4.22 and 4.23 shows cells stained with the respective stains for the
differentiation assay for cells preserved in 1%EBN+99% FBS.
II. After Staining
Figure 4.21: Adipogenic (Magnification: 4x objective)
Figure 4.22: Chondrogenic (Magnification: 10x objective)
Figure 4.23: Osteogenic (Magnification: 10x objective)

4.4 Surface Area
Table 4.5, 4.6 and 4.7 shows the percentage of surface area of adipogenesis,
chondrogenesis and osteogenesis for cells preserved in the 10% DMSO+90% FBS, 5%
DMSO+1% EBN+94% FBS and 1% EBN+99% FBS respectively.
Table 4.5: Percentage of Surface Area of Cells Preserved in 10% DMSO+90% FBS
Percentage of Surface Area of 10% DMSO+90% FBS (%)
Adipogenesis Chondrogenesis Osteogenesis
8.09 42.04 5.53
17.73 60.19 9.22
19.17 66.17 7.63
Mean 15.00 56.13 7.46
Standard Deviation 6.02 12.57 1.85
Standard Error 3.48 7.26 1.07
Table 4.6: Percentage of Surface Area of Cells Preserved in 5% DMSO+1% EBN+94%
FBS
Percentage of Surface Area of 5% DMSO+1% EBN+94% FBS (%)
Adipogenesis Chondrogenesis Osteogenesis
15.85 44.03 6.63
19.91 50.43 7.34
17.92 40.76 6.29
Mean 17.89 45.07 6.75
Standard Deviation 2.03 4.92 0.54
Standard Error 1.17 2.84 0.31
Table 4.7: Percentage of Surface Area of Cells Preserved in 1% EBN+99% FBS
Percentage of surface area of 1% EBN+99% FBS (%)
Adipogenesis Chondrogenesis Osteogenesis
5.25 33.26 6.36
7.77 32.00 7.05
10.45 41.70 6.08
Mean 7.82 35.65 6.50
Standard Deviation 2.60 5.27 0.50
Standard Error 1.50 3.05 0.29
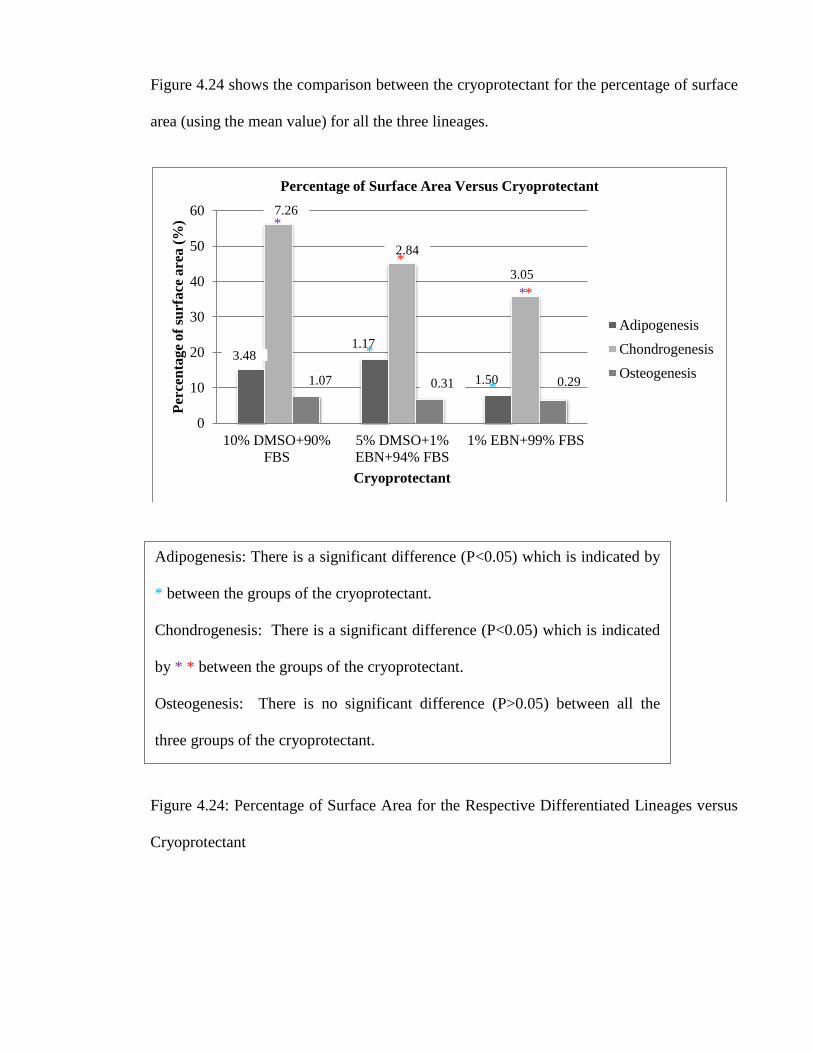
Figure 4.24 shows the comparison between the cryoprotectant for the percentage of surface
area (using the mean value) for all the three lineages.
Figure 4.24: Percentage of Surface Area for the Respective Differentiated Lineages versus
Cryoprotectant
0
10
20
30
40
50
60
10% DMSO+90%
FBS
5% DMSO+1%
EBN+94% FBS
1% EBN+99% FBS
Per
cen
tag
e o
f su
rfa
ce a
rea
(%
)
Cryoprotectant
Percentage of Surface Area Versus Cryoprotectant
Adipogenesis
Chondrogenesis
Osteogenesis
3.48
7.26
1.07
1.17
2.84
0.31 1.50
3.05
0.29
*
*
*
*
*
*
Adipogenesis: There is a significant difference (P<0.05) which is indicated by
* between the groups of the cryoprotectant.
Chondrogenesis: There is a significant difference (P<0.05) which is indicated
by * * between the groups of the cryoprotectant.
Osteogenesis: There is no significant difference (P>0.05) between all the
three groups of the cryoprotectant.

CHAPTER V
DISCUSSION
Based on Figure 4.1, the cells preserved in 10% DMSO+90% FBS has exhibited the highest
percentage of cell viability with a mean of 91.33%. Generally, when a tissue or cells is
subjected to a low temperature, ice crystals will be eventually formed. These crystals may
disrupt the cell membrane leading to death of the cell and hence reducing cell viability.
Therefore, according to (Ozkavukcu & Erdemli, 2002), a cryoprotectant is used to protect
cells from mechanical and physical stress and also reduces the cellular damage by reducing
the formation of ice crystals. Since, the cells preserved in 1% EBN+99% FBS had the
lowest percentage of cell viability with a mean of 60.59%, hence it can be concluded that
EBN perhaps does not have the mechanism to protect cells from mechanical and physical
stress unlike DMSO. Research has concluded that extracellular cryoprotectant is not as
efficient as the intracellular cryoprotectant (Motta et al., 2014). DMSO is an example of
intracellular cryoprotectant which has its own mechanism to protect the cells. Perhaps EBN
does not have the mechanism unlike DMSO to protect the cells. Hence, the viability of cells
is low. Based on the One-way ANOVA shown in Appendix A, there is a significant
difference (P<0.05) between all the three groups of cryoprotectant tested.
Based on Figure 4.3 and 4.5, the growth curve shows a continuous increase in the
number of cell for the cells preserved in both 10% DMSO+90% FBS and 5% DMSO+1%
EBN+94%FBS from Day 1 to Day 14 of the resazurin reduction test. Based on Table 4.4,

the cells preserved in 1% EBN+99% FBS had relatively lower number of cells as compared
to the cells preserved in 10% DMSO+90% FBS and 5% DMSO+1% EBN+94%FBS. The
number of cells for cells preserved in 1% EBN+99% FBS for Day 1, 10 and 14 are as
follows: 36 800, 58 700 and 30 025. This further confirms the cell viability assay. Since the
percentage of cell viability for the cells preserved in 1% EBN+99% FBS was initially low,
therefore, this indicates a low number of cells in the culture and hence resulting in a lower
proliferation rate. According to (Kong et al., 1987), EBN was proven to show an epidermal
growth factor (EGF)-like activity which functions to induce cell division, tissue growth,
cellular regeneration and cell-mediated immunity. It also contains glycoprotein which is
responsible for promoting cell growth and gives them the ability to proliferate. According
to (Roh et al., 2011), EBN strongly promotes proliferation of human adipose derived stem
cells. However, these claims were not reflected on the results. Based on observation on the
research papers above, all these studies were carried out in in vitro cell culture. Hence, it
can be concluded that EBN promotes proliferation when it is in the in vitro cell culture
environment whereas EBN as a cryoprotectant, it does not support the proliferation of the
human adipose derived stem cells. Based on Figure 4.8, on Day 3, there is a significant
difference (P<0.05) between 10% DMSO+90% FBS with 5% DMSO+1% EBN+94%FBS
and 10% DMSO+90% FBS with 1% EBN+99% FBS. On Day 10, there is no significant
difference (P>0.05) between all the three groups of cryoprotectant. Whereas on Day 14,
there is a significant difference (P<0.05) between all the three groups of cryoprotectant
tested.
Based on Figure 4.24, the average percentage of surface area for adipogenic,
chondrogenic and osteogenic lineage for the cells preserved in 1% EBN+99% FBS are
relatively lower as compared to the cells preserved in 5% DMSO+1% EBN+94% FBS and
10% DMSO+99% FBS. The average percentage of surface area for adipogenic,
chondrogenic and osteogenic for cells preserved in 1% EBN+99% FBS are as follows:
7.82%, 35.65% and 6.50% respectively. Some of the studies that are related to the lineages
studied and EBN extracts are as follows: according to (Chua et al., 2013), EBN extracts can
act as a chondro-protective agent for human chondrocytes. Studies have also shown that
rats’ bone strength and skin thickness were increased when administered with EBN extract
(Matsukawa et al., 2011). Both these research papers have shown good results that were not
reflected in the result of this research. Based on observation, again, these papers were
carried out in in vitro cell culture. Hence, it can be concluded that EBN can support
differentiation when it is in an in vitro cell culture environment. In terms of cryoprotectant,
once the cells are thawed and cultured back, EBN does not support differentiation.
Therefore, resulting in poor results. In conclusion, this confirms the statement earlier that
EBN can promote proliferation and differentiation when it is in an in vitro cell culture but
as a cryoprotectant it fails to exhibit the same results. Based on Figure 4.24, there is no
significant difference (P>0.05) between all the three groups of cryoprotectant for
osteogenic lineage. There is a significant difference (P<0.05) seen for both adipogenic and
chondrogenic lineage.
CHAPTER VI
CONCLUSION
Based on the results for the following tests; cell viability test, resazurin reduction test and
differentiation assay, it can be concluded that the human adipose derived stem cells
preserved in 10% DMSO+99%FBS had exhibited a higher result as compared to cells
preserved in 5% DMSO+1% EBN+94%FBS and 1% EBN+99% FBS. Hence making
DMSO still a good and superior cryoprotective agent. DMSO on its own can support the
growth of the cells which can be seen in 10% DMSO+99% FBS and does not require the
presence of EBN. Therefore, it can be concluded that EBN cannot act as a cryoprotective
agent. EBN is better to be used in in vitro cell culture experiments instead of it as a
cryoprotective agent. There has been no study done on EBN as a cryoprotective agent
which is the main limitation of this study. DMSO is known to cause toxicity to cells. The
ability of DMSO to induce non lamellar structures in phospholipids and to enhance
membrane permeability may also damage biological membrane at physiological
temperature. Moreover, DMSO also has the ability to induce cell differentiation indicates
that it might exert an influence at the genetic regulation level (Yu & Quinn, 1994). Some of
the suggestions for future studies are as follows: to study on higher percentage of EBN
extracts with lower concentration of DMSO on the human adipose derived stem cells, to
study EBN extracts with other cryoprotective agents (e.g. trehalose) and also to evaluate the
biosafety of the EBN extracts to be used on human adipose derived stem cells. Any positive

results from these studies can introduce a natural cryoprotectant for cryopreservation of
stem cells which will limit the usage of DMSO on whole, hence, reducing toxicity of
DMSO to the cells.

REFERENCES
Anchordoguy, Thomas J, Cecchini, Christine A, Crowe, John H, & Crowe, Lois M. (1991).
Insights into the cryoprotective mechanism of dimethyl sulfoxide for phospholipid
bilayers. Cryobiology, 28(5), 467-473.
Arakawa, Tsutomu, Carpenter, John F, Kita, Yoshiko A, & Crowe, John H. (1990). The
basis for toxicity of certain cryoprotectants: a hypothesis. Cryobiology, 27(4), 401-
415.
Biswas, Atindriya, & Hutchins, Robert. (2007). Embryonic stem cells. Stem cells and
development, 16(2), 213-222.
Bunnell, Bruce A, Flaat, Mette, Gagliardi, Christine, Patel, Bindiya, & Ripoll, Cynthia.
(2008). Adipose-derived stem cells: isolation, expansion and differentiation.
Methods, 45(2), 115-120.
Chamberlain, Giselle, Fox, James, Ashton, Brian, & Middleton, Jim. (2007). Concise
review: mesenchymal stem cells: their phenotype, differentiation capacity,
immunological features, and potential for homing. Stem cells, 25(11), 2739-2749.
Chan, SW. (2006). Review of scientific research on edible bird’s nest. Department of
Applied Biology and Chemical Technology. The Hong Kong Polytechnic University.
Choudhery, Mahmood S, Badowski, Michael, Muise, Angela, Pierce, John, & Harris,
David T. (2014). Cryopreservation of whole adipose tissue for future use in
regenerative medicine. Journal of Surgical Research, 187(1), 24-35.
Chua, Kien-Hui, Lee, Ting-Hun, Nagandran, Kamini, Yahaya, Nor Hamdan Md, Lee,
Chew-Tin, Tjih, Eddie Tan Ti, & Aziz, Ramlan Abdul. (2013). Edible Bird’s nest
extract as a chondro-protective agent for human chondrocytes isolated from
osteoarthritic knee: in vitro study. BMC complementary and alternative medicine,
13(1), 19.
Csaki, C, Matis, U, Mobasheri, A, Ye, H, & Shakibaei, M. (2007). Chondrogenesis,
osteogenesis and adipogenesis of canine mesenchymal stem cells: a biochemical,
morphological and ultrastructural study. Histochemistry and cell biology, 128(6),
507-520.
De Bari, Cosimo, Dell'Accio, Francesco, Tylzanowski, Przemyslaw, & Luyten, Frank P.
(2001). Multipotent mesenchymal stem cells from adult human synovial membrane.
Arthritis & Rheumatism, 44(8), 1928-1942.
Deraman, Noraini. (2012). Antioxidant studies of cave edible bird’s nest. Universiti
Teknologi MARA.
Derfoul, Assia, Perkins, Geraldine L, Hall, David J, & Tuan, Rocky S. (2006).
Glucocorticoids promote chondrogenic differentiation of adult human mesenchymal
stem cells by enhancing expression of cartilage extracellular matrix genes. Stem
cells, 24(6), 1487-1495.
Freshney, RI. Culture of Animal Cells, 1994. AR Liss, New York.
Gilmore, JA, Liu, J, Woods, EJ, Peter, AT, & Critser, JK. (2000). Cryoprotective agent and
temperature effects on human sperm membrane permeabilities: convergence of
theoretical and empirical approaches for optimal cryopreservation methods. Human
Reproduction, 15(2), 335-343.
Gimble, Jeffrey M, Katz, Adam J, & Bunnell, Bruce A. (2007). Adipose-derived stem cells
for regenerative medicine. Circulation research, 100(9), 1249-1260.
Gimble, JM, & Guilak, F. (2003). Adipose-derived adult stem cells: isolation,
characterization, and differentiation potential. Cytotherapy, 5(5), 362-369.
Guo, Chao-Tan, Takahashi, Tadanobu, Bukawa, Wakoto, Takahashi, Noriko, Yagi,
Hirokazu, Kato, Koichi, . . . Suzuki, Yasuo. (2006). Edible bird's nest extract
inhibits influenza virus infection. Antiviral research, 70(3), 140-146.
Guzzo, Rosa M, Scanlon, Vanessa, Sanjay, Archana, Xu, Ren-He, & Drissi, Hicham.
(2014). Establishment of Human cell Type-Specific iPS cells with Enhanced
Chondrogenic Potential. Stem Cell Reviews and Reports, 10(6), 820-829.
Hobbs, Joseph J. (2004). Problems in the harvest of edible birds' nests in Sarawak and
Sabah, Malaysian Borneo. Biodiversity & Conservation, 13(12), 2209-2226.
HYDROLYSATES, WHITE FUNGUS WF. (2012). PHYSICAL CHARACTERISATIONS
AND ANTIOXIDANT PROPERTIES OF FREEZE DRIED EDIBLE BIRD’S NEST
(EBN) AND. Universiti Teknologi MARA.

Ibrahim, Hisham R, Sugimoto, Yasushi, & Aoki, Takayoshi. (2000). Ovotransferrin
antimicrobial peptide (OTAP-92) kills bacteria through a membrane damage
mechanism. Biochimica et Biophysica Acta (BBA)-General Subjects, 1523(2), 196-
205.
Kathan, Ralph H, & Weeks, Dianna I. (1969). Structure studies of collocalia mucoid: I.
Carbohydrate and amino acid composition. Archives of biochemistry and
biophysics, 134(2), 572-576.
Koch, Thomas G, Heerkens, Tammy, Thomsen, Preben D, & Betts, Dean H. (2007).
Isolation of mesenchymal stem cells from equine umbilical cord blood. BMC
biotechnology, 7(1), 26.
Kong, YC, Keung, WM, Yip, TT, Ko, KM, Tsao, SW, & Ng, MH. (1987). Evidence that
epidermal growth factor is present in swiftlet's (< i> Collocalia</i>) nest.
Comparative Biochemistry and Physiology Part B: Comparative Biochemistry,
87(2), 221-226.
Lim, Chan Koon, Cranbrook, Gathorne Gathorne-Hardy, Cranbrook, Gathorne Gathorne-
Hardy, Zoologiste, Grande Bretagne, Cranbrook, Gathorne Gathorne-Hardy, &
Zoologist, Great Britain. (2002). Swiftlets of Borneo: builders of edible nests:
Natural History Publications (Borneo).
Liu, Guangpeng, Zhou, Heng, Li, Yulin, Li, Gang, Cui, Lei, Liu, Wei, & Cao, Yilin.
(2008). Evaluation of the viability and osteogenic differentiation of cryopreserved
human adipose-derived stem cells. Cryobiology, 57(1), 18-24.
Longo-Sorbello, Giuseppe SA, Say, m, Guray, Banerjee, Debabrata, & Bertino, Joseph R.
(2006). Cytotoxicity and Cell Growth Assays.
Louis, Kristine S, & Siegel, Andre C. (2011). Cell viability analysis using trypan blue:
manual and automated methods Mammalian Cell Viability (pp. 7-12): Springer.
Ma, Fucui, & Liu, Daicheng. (2012). Sketch of the edible bird's nest and its important
bioactivities. Food Research International, 48(2), 559-567.
Mani, Sendurai A, Guo, Wenjun, Liao, Mai-Jing, Eaton, Elinor Ng, Ayyanan, Ayyakkannu,
Zhou, Alicia Y, . . . Shipitsin, Michail. (2008). The epithelial-mesenchymal
transition generates cells with properties of stem cells. Cell, 133(4), 704-715.
Marcone, Massimo F. (2005). Characterization of the edible bird’s nest the “Caviar of the
East”. Food research international, 38(10), 1125-1134.
MARNI, S, MARZURA, MR, NORZELA, AM, KHAIRUNNISAK, M, BING, CH, &
EDDY, AA. PRELIMINARY STUDY ON FREE SIALIC ACID CONTENT OF
EDIBLE BIRD NEST FROM JOHOR AND KELANTAN.
Matsukawa, Noriko, Matsumoto, Megumi, Bukawa, Wakoto, Chiji, Hideyuki, Nakayama,
Keizo, Hara, Hiroshi, & Tsukahara, Takamitsu. (2011). Improvement of bone
strength and dermal thickness due to dietary edible bird’s nest extract in
ovariectomized rats. Bioscience, biotechnology, and biochemistry, 75(3), 590-592.
Motta, Juliana Pessanha Rodrigues, Paraguassú-Braga, Flávio Henrique, Bouzas, Luis
Fernando, & Porto, Luís Cristóvão. (2014). Evaluation of intracellular and
extracellular trehalose as a cryoprotectant of stem cells obtained from umbilical
cord blood. Cryobiology, 68(3), 343-348.
Ng, MH, Chan, KH, & Kong, YC. (1986). Potentiation of mitogenic response by extracts of
the swiftlet's (Collocalia) nest. Biochemistry international, 13(3), 521-531.
Norhayati Jr, MK, Azman, O, & Wan, Nazaimoon W. (2010). Preliminary Study of the
Nutritional Content of Malaysian Edible Bird's Nest. Malaysian journal of nutrition,
16(3), 389-396.
O'Brien, John, Wilson, Ian, Orton, Terry, & Pognan, François. (2000). Investigation of the
Alamar Blue (resazurin) fluorescent dye for the assessment of mammalian cell
cytotoxicity. European Journal of Biochemistry, 267(17), 5421-5426.
Oda, Motomu, Ohta, Shinji, Suga, Takayuki, & Aoki, Tadashi. (1998). Study on food
components: The structure of N-linked asialo carbohydrate from the edible bird's
nest built by Collocalia fuciphaga. Journal of Agricultural and Food Chemistry,
46(8), 3047-3053.
Ovchinnikov, Dmitry. (2009). Alcian blue/alizarin red staining of cartilage and bone in
mouse. Cold Spring Harb Protoc, 5170.
Ozkavukcu, S, & Erdemli, Esra. (2002). Cryopreservation: basic knowledge and
biophysical effects. J Ankara Medical School, 24, 187-196.

Palsson, Bernhard O, & Bhatia, Sangeeta N. Tissue Engineering, 2004: Upper Saddle
River, NJ: Pearson Prentice Hall.
Peister, Alexandra, Mellad, Jason A, Larson, Benjamin L, Hall, Brett M, Gibson, Laura F,
& Prockop, Darwin J. (2004). Adult stem cells from bone marrow (MSCs) isolated
from different strains of inbred mice vary in surface epitopes, rates of proliferation,
and differentiation potential. Blood, 103(5), 1662-1668.
Pirraco, Rogério P, Obokata, Haruko, Iwata, Takanori, Marques, Alexandra P, Tsuneda,
Satoshi, Yamato, Masayuki, . . . Okano, Teruo. (2011). Development of osteogenic
cell sheets for bone tissue engineering applications. Tissue Engineering Part A,
17(11-12), 1507-1515.
Rampersad, Sephra N. (2012). Multiple applications of Alamar Blue as an indicator of
metabolic function and cellular health in cell viability bioassays. Sensors, 12(9),
12347-12360.
Roh, Kyung-Baeg, Lee, Jienny, Kim, Young-Soo, Park, Junho, Kim, Jang-Hyun, Lee,
Jongsung, & Park, Deokhoon. (2011). Mechanisms of edible bird's nest extract-
induced proliferation of human adipose-derived stem cells. Evidence-Based
Complementary and Alternative Medicine, 2012.
Rosen, Michael R, Myerburg, Robert J, Francis, Darrel P, Cole, Graham D, & Marbán,
Eduardo. (2014). Translating Stem Cell Research to Cardiac Disease Therapies:
Pitfalls and Prospects for Improvement. Journal of the American College of
Cardiology, 64(9), 922-937.
Sankaran, R. (2001). The status and conservation of the Edible-nest Swiftlet (< i>
Collocalia fuciphaga</i>) in the Andaman and Nicobar Islands. Biological
Conservation, 97(3), 283-294.
Smith, Austin. (2001). Embryonic stem cells. COLD SPRING HARBOR MONOGRAPH
SERIES, 40, 205-230.
Smith, Austin G. (1991). Culture and differentiation of embryonic stem cells. Journal of
tissue culture methods, 13(2), 89-94.
Stocchero, Ithamar Nogueira, & Stocchero, Guilherme Flosi. (2011). Isolation of stem cells
from human adipose tissue: technique, problems, and pearls Adipose Stem Cells and
Regenerative Medicine (pp. 13-18): Springer.
Sudo, Kazuhiro, Kanno, Megumi, Miharada, Kenichi, Ogawa, Saeri, Hiroyama, Takashi,
Saijo, Kaoru, & Nakamura, Yukio. (2007). Mesenchymal progenitors able to
differentiate into osteogenic, chondrogenic, and/or adipogenic cells in vitro are
present in most primary fibroblast‐like cell populations. Stem cells, 25(7), 1610-
1617.
Vacanti, Charles A, Obokata, Haruko, Kojima, Koji, Westerman, Karen, Yamato,
Masayuki, Okano, Teruo, & Tsuneda, Satoshi. (2014). Erratum: The Potential of
Stem Cells in Adult Tissues Representative of the Three Germ Layers.
Yang, Mei, Cheung, Sau-Ha, Li, Sze Chun, & Cheung, Hon-Yeung. (2014). Establishment
of a holistic and scientific protocol for the authentication and quality assurance of
edible bird’s nest. Food chemistry, 151, 271-278.
Yida, Zhang, Imam, Mustapha Umar, & Ismail, Maznah. (2014). In vitro bioaccessibility
and antioxidant properties of edible bird's nest following simulated human gastro-
intestinal digestion. BMC complementary and alternative medicine, 14(1), 468.
Young, Henry E, & Black, Asa C. (2004). Adult stem cells. The Anatomical Record Part A:
Discoveries in Molecular, Cellular, and Evolutionary Biology, 276(1), 75-102.
Yu, Z, & Quinn, P. (1994). Dimethyl sulphoxide: a review of its applications in cell
biology. Bioscience reports, 14, 259-281.
Zhu, Yanxia, Liu, Tianqing, Song, Kedong, Fan, Xiubo, Ma, Xuehu, & Cui, Zhanfeng.
(2008). Adipose‐derived stem cell: a better stem cell than BMSC. Cell biochemistry
and function, 26(6), 664-675.
Zuk, Patricia A, Zhu, Min, Ashjian, Peter, De Ugarte, Daniel A, Huang, Jerry I, Mizuno,
Hiroshi, . . . Hedrick, Marc H. (2002). Human adipose tissue is a source of
multipotent stem cells. Molecular biology of the cell, 13(12), 4279-4295.
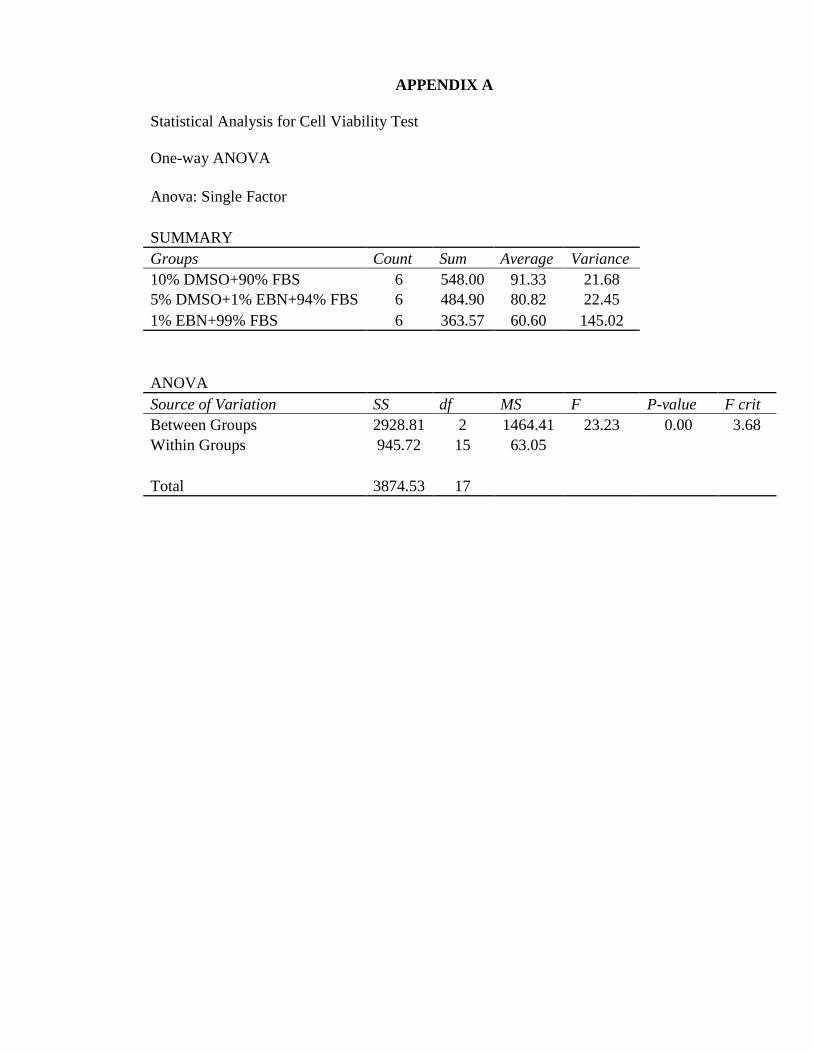
APPENDIX A
Statistical Analysis for Cell Viability Test
One-way ANOVA
Anova: Single Factor
SUMMARY
Groups Count Sum Average Variance
10% DMSO+90% FBS 6 548.00 91.33 21.68
5% DMSO+1% EBN+94% FBS 6 484.90 80.82 22.45
1% EBN+99% FBS 6 363.57 60.60 145.02
ANOVA
Source of Variation SS df MS F P-value F crit
Between Groups 2928.81 2 1464.41 23.23 0.00 3.68
Within Groups 945.72 15 63.05
Total 3874.53 17
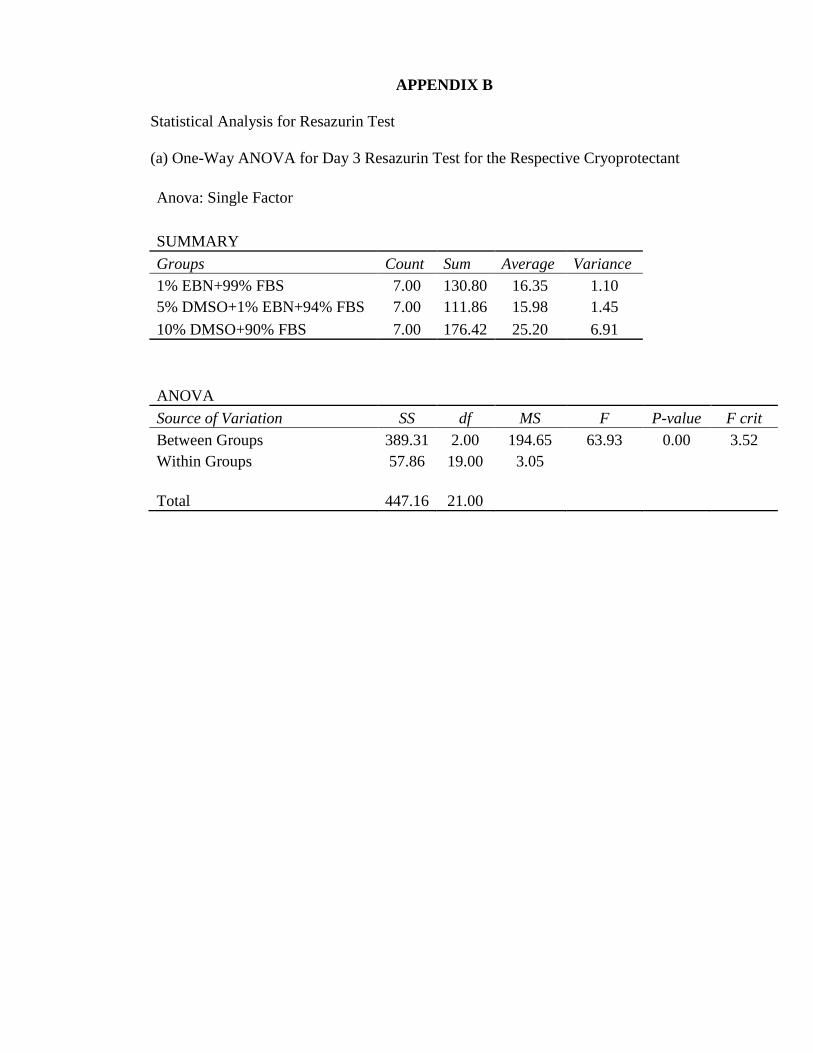
APPENDIX B
Statistical Analysis for Resazurin Test
(a) One-Way ANOVA for Day 3 Resazurin Test for the Respective Cryoprotectant
Anova: Single Factor
SUMMARY
Groups Count Sum Average Variance
1% EBN+99% FBS 7.00 130.80 16.35 1.10
5% DMSO+1% EBN+94% FBS 7.00 111.86 15.98 1.45
10% DMSO+90% FBS 7.00 176.42 25.20 6.91
ANOVA
Source of Variation SS df MS F P-value F crit
Between Groups 389.31 2.00 194.65 63.93 0.00 3.52
Within Groups 57.86 19.00 3.05
Total 447.16 21.00
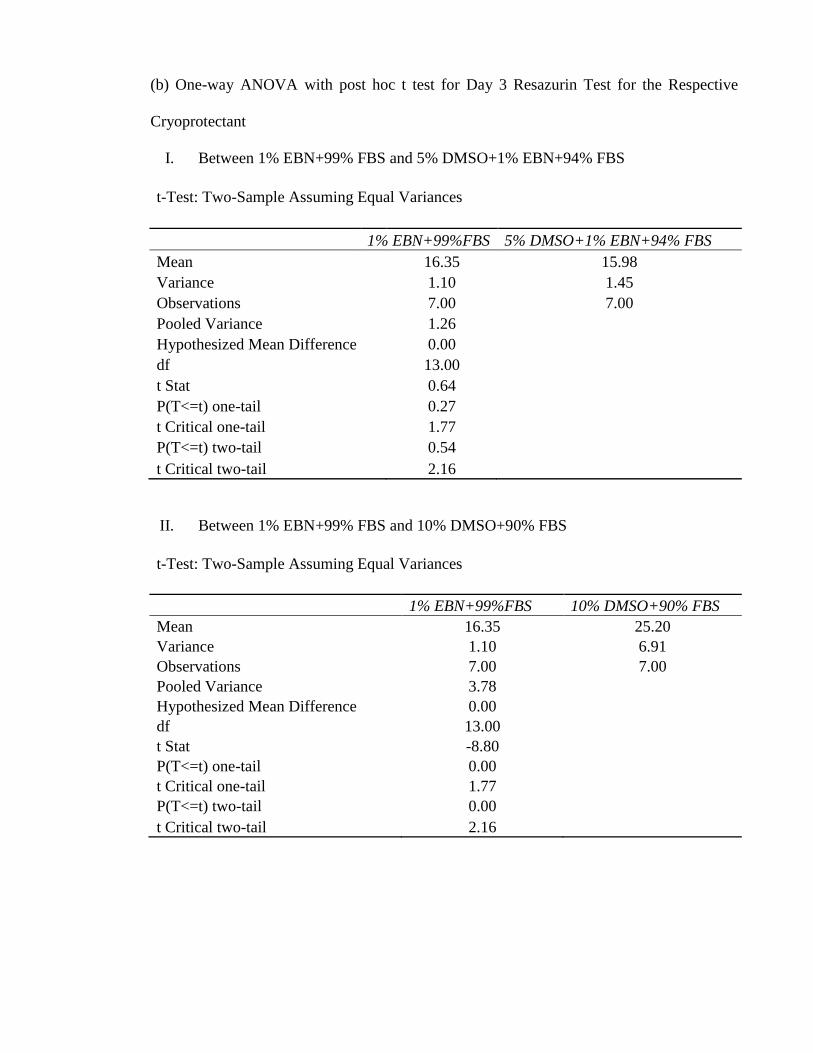
(b) One-way ANOVA with post hoc t test for Day 3 Resazurin Test for the Respective
Cryoprotectant
I. Between 1% EBN+99% FBS and 5% DMSO+1% EBN+94% FBS
t-Test: Two-Sample Assuming Equal Variances
1% EBN+99%FBS 5% DMSO+1% EBN+94% FBS
Mean 16.35 15.98
Variance 1.10 1.45
Observations 7.00 7.00
Pooled Variance 1.26
Hypothesized Mean Difference 0.00
df 13.00
t Stat 0.64
P(T<=t) one-tail 0.27
t Critical one-tail 1.77
P(T<=t) two-tail 0.54
t Critical two-tail 2.16
II. Between 1% EBN+99% FBS and 10% DMSO+90% FBS
t-Test: Two-Sample Assuming Equal Variances
1% EBN+99%FBS 10% DMSO+90% FBS
Mean 16.35 25.20
Variance 1.10 6.91
Observations 7.00 7.00
Pooled Variance 3.78
Hypothesized Mean Difference 0.00
df 13.00
t Stat -8.80
P(T<=t) one-tail 0.00
t Critical one-tail 1.77
P(T<=t) two-tail 0.00
t Critical two-tail 2.16
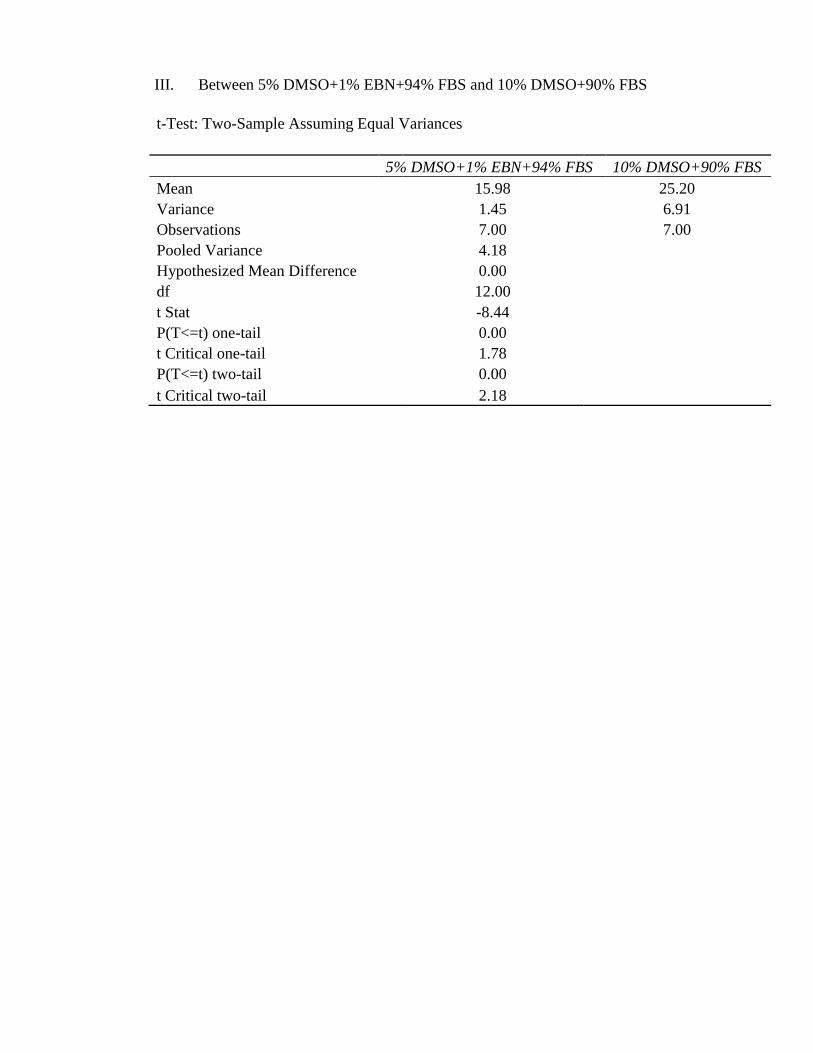
III. Between 5% DMSO+1% EBN+94% FBS and 10% DMSO+90% FBS
t-Test: Two-Sample Assuming Equal Variances
5% DMSO+1% EBN+94% FBS 10% DMSO+90% FBS
Mean 15.98 25.20
Variance 1.45 6.91
Observations 7.00 7.00
Pooled Variance 4.18
Hypothesized Mean Difference 0.00
df 12.00
t Stat -8.44
P(T<=t) one-tail 0.00
t Critical one-tail 1.78
P(T<=t) two-tail 0.00
t Critical two-tail 2.18
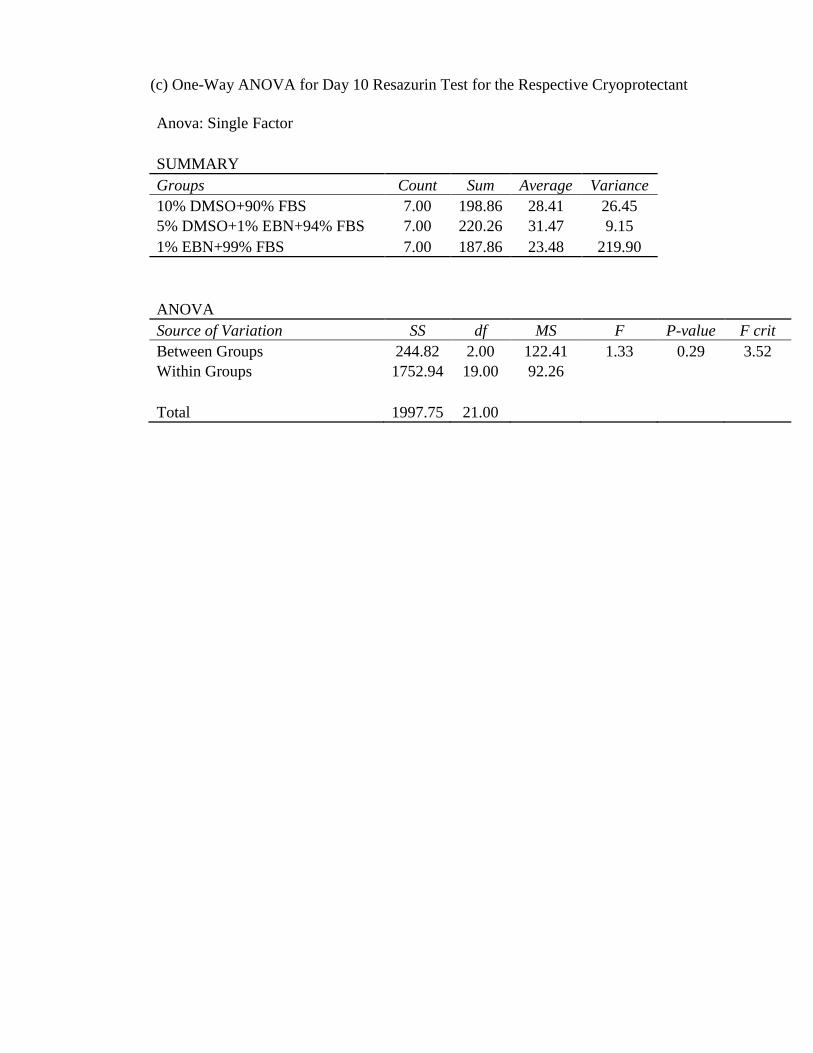
(c) One-Way ANOVA for Day 10 Resazurin Test for the Respective Cryoprotectant
Anova: Single Factor
SUMMARY
Groups Count Sum Average Variance
10% DMSO+90% FBS 7.00 198.86 28.41 26.45
5% DMSO+1% EBN+94% FBS 7.00 220.26 31.47 9.15
1% EBN+99% FBS 7.00 187.86 23.48 219.90
ANOVA
Source of Variation SS df MS F P-value F crit
Between Groups 244.82 2.00 122.41 1.33 0.29 3.52
Within Groups 1752.94 19.00 92.26
Total 1997.75 21.00

(d) One-way ANOVA with post hoc t test for Day 10 Resazurin Test for the Respective
Cryoprotectant
I. Between 10% DMSO+90% FBS and 5% DMSO+1% EBN+99% FBS
t-Test: Two-Sample Assuming Equal Variances
10% DMSO+90% FBS 5% DMSO+1% EBN+94% FBS
Mean 28.41 31.47
Variance 26.45 9.15
Observations 7.00 7.00
Pooled Variance 17.80
Hypothesized Mean Difference 0.00
df 12.00
t Stat -1.36
P(T<=t) one-tail 0.10
t Critical one-tail 1.78
P(T<=t) two-tail 0.20
t Critical two-tail 2.18
II. Between 10% DMSO+90% FBS and 1% EBN+99% FBS
t-Test: Two-Sample Assuming Equal Variances
10% DMSO+90% FBS 1% EBN+99% FBS
Mean 28.41 23.48
Variance 26.45 219.90
Observations 7.00 7.00
Pooled Variance 130.62
Hypothesized Mean Difference 0.00
df 13.00
t Stat 0.83
P(T<=t) one-tail 0.21
t Critical one-tail 1.77
P(T<=t) two-tail 0.42
t Critical two-tail 2.16

III. Between 5% DMSO+1% EBN+94% FBS and 1% EBN+99% FBS
t-Test: Two-Sample Assuming Equal Variances
5% DMSO+1% EBN+94% FBS 1% EBN+99% FBS
Mean 31.47 23.48
Variance 9.15 219.90
Observations 7.00 7.00
Pooled Variance 122.63
Hypothesized Mean Difference 0.00
df 13.00
t Stat 1.39
P(T<=t) one-tail 0.09
t Critical one-tail 1.77
P(T<=t) two-tail 0.19
t Critical two-tail 2.16

(e) One-Way ANOVA for Day 14 Resazurin Test for the Respective Cryoprotectant
Anova: Single Factor
SUMMARY
Groups Count Sum Average Variance
10% DMSO+90% FBS 7.00 265.07 37.87 62.26
5% DMSO+1% EBN+94% FBS 7.00 315.81 45.12 13.39
1% EBN+99% FBS 7.00 96.06 12.01 5.22
ANOVA
Source of Variation SS df MS F P-value F crit
Between Groups 4609.21 2.00 2304.60 89.29 0.00 3.52
Within Groups 490.42 19.00 25.81
Total 5099.63 21.00
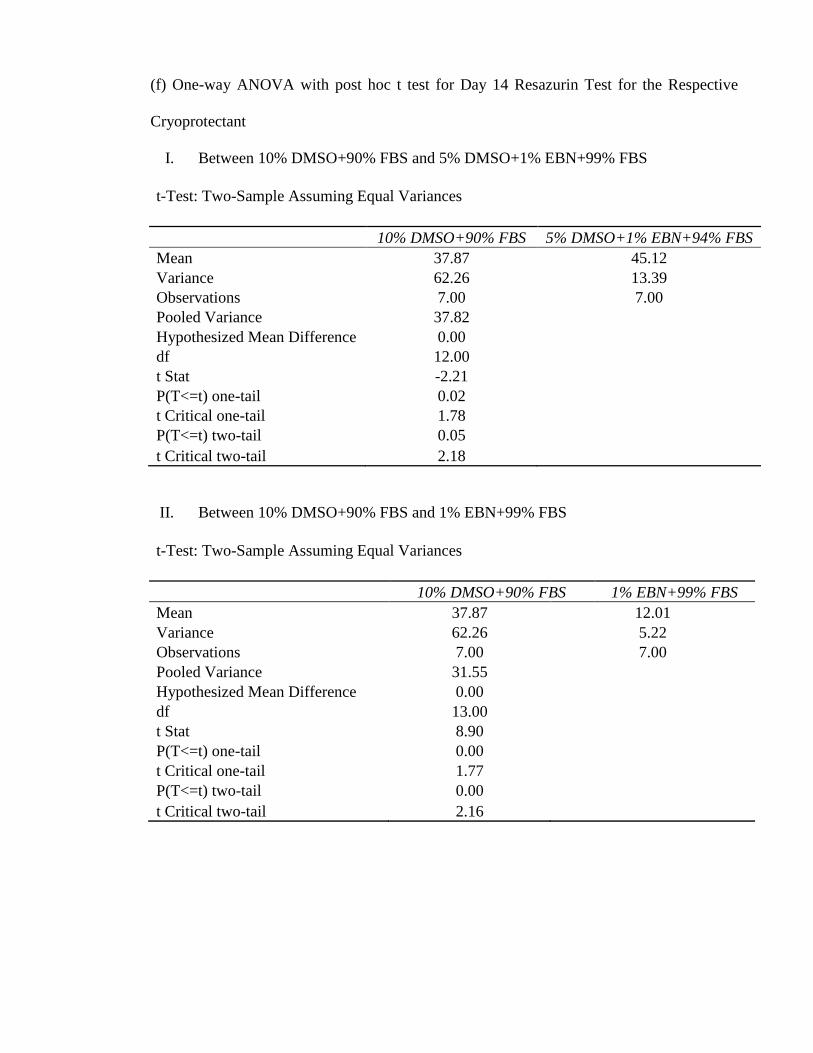
(f) One-way ANOVA with post hoc t test for Day 14 Resazurin Test for the Respective
Cryoprotectant
I. Between 10% DMSO+90% FBS and 5% DMSO+1% EBN+99% FBS
t-Test: Two-Sample Assuming Equal Variances
10% DMSO+90% FBS 5% DMSO+1% EBN+94% FBS
Mean 37.87 45.12
Variance 62.26 13.39
Observations 7.00 7.00
Pooled Variance 37.82
Hypothesized Mean Difference 0.00
df 12.00
t Stat -2.21
P(T<=t) one-tail 0.02
t Critical one-tail 1.78
P(T<=t) two-tail 0.05
t Critical two-tail 2.18
II. Between 10% DMSO+90% FBS and 1% EBN+99% FBS
t-Test: Two-Sample Assuming Equal Variances
10% DMSO+90% FBS 1% EBN+99% FBS
Mean 37.87 12.01
Variance 62.26 5.22
Observations 7.00 7.00
Pooled Variance 31.55
Hypothesized Mean Difference 0.00
df 13.00
t Stat 8.90
P(T<=t) one-tail 0.00
t Critical one-tail 1.77
P(T<=t) two-tail 0.00
t Critical two-tail 2.16

III. Between 5% DMSO+1% EBN+94% FBS and 1% EBN+99% FBS
t-Test: Two-Sample Assuming Equal Variances
5% DMSO+1% EBN+94% FBS 1% EBN+99% FBS
Mean 45.12 12.01
Variance 13.39 5.22
Observations 7.00 7.00
Pooled Variance 8.99
Hypothesized Mean Difference 0.00
df 13.00
t Stat 21.34
P(T<=t) one-tail 0.00
t Critical one-tail 1.77
P(T<=t) two-tail 0.00
t Critical two-tail 2.16

APPENDIX C
Statistical Analysis for Surface Area of Differentiated Lineages
(a) One-Way ANOVA for the Percentage of Surface area of Adipogenesis for the
Respective Cryoprotectant
Anova: Single Factor
SUMMARY
Groups Count Sum Average Variance
10% DMSO+90% FBS 3 44.99 15.00 36.30
5% DMSO+1% EBN+94% FBS 3 53.68 17.90 4.12
1% EBN+99% FBS 3 23.47 7.82 6.76
ANOVA
Source of Variation SS df MS F P-value F crit
Between Groups 161.25 2 80.63 5.13 0.05 5.14
Within Groups 94.36 6 15.73
Total 255.61 8

(b) One-way ANOVA with post hoc t test for Percentage of Surface area of Adipogenesis
for the Respective Cryoprotectant
I. Between 10% DMSO+90% FBS and 5% DMSO+1% EBN+94% FBS
t-Test: Two-Sample Assuming Equal Variances
10% DMSO+90% FBS 5% DMSO+1% EBN+94% FBS
Mean 15.00 17.89
Variance 36.29 4.12
Observations 3.00 3.00
Pooled Variance 20.21
Hypothesized Mean Difference 0.00
df 4.00
t Stat -0.79
P(T<=t) one-tail 0.24
t Critical one-tail 2.13
P(T<=t) two-tail 0.47
t Critical two-tail 2.78
II. Between 10% DMSO+90% FBS and 1% EBN+99% FBS
t-Test: Two-Sample Assuming Equal Variances
10% DMSO+90% FBS 1% EBN+99% FBS
Mean 15.00 7.82
Variance 36.29 6.76
Observations 3.00 3.00
Pooled Variance 21.53
Hypothesized Mean Difference 0.00
df 4.00
t Stat 1.89
P(T<=t) one-tail 0.07
t Critical one-tail 2.13
P(T<=t) two-tail 0.13
t Critical two-tail 2.78

III. Between 5% DMSO+1% EBN and 1% EBN+99% FBS
t-Test: Two-Sample Assuming Equal Variances
5% DMSO + 1% EBN+94% FBS 1% EBN+99% FBS
Mean 17.89 7.82
Variance 4.12 6.76
Observations 3.00 3.00
Pooled Variance 5.44
Hypothesized Mean Difference 0.00
df 4.00
t Stat 5.29
P(T<=t) one-tail 0.00
t Critical one-tail 2.13
P(T<=t) two-tail 0.01
t Critical two-tail 2.78

(c) One-Way ANOVA for the Percentage of Surface area of Chondrogenesis for the
Respective Cryoprotectant
Anova: Single Factor
SUMMARY
Groups Count Sum Average Variance
10% DMSO+90% FBS 3 168.4 56.13 157.91
5% DMSO+1% EBN+94% FBS 3 135.22 45.07 24.19
1% EBN+99% FBS 3 106.96 35.65 27.82
ANOVA
Source of Variation SS df MS F P-value F crit
Between Groups 630.49 2 315.25 4.51 0.06 5.14
Within Groups 419.84 6 69.97
Total 1050.33 8
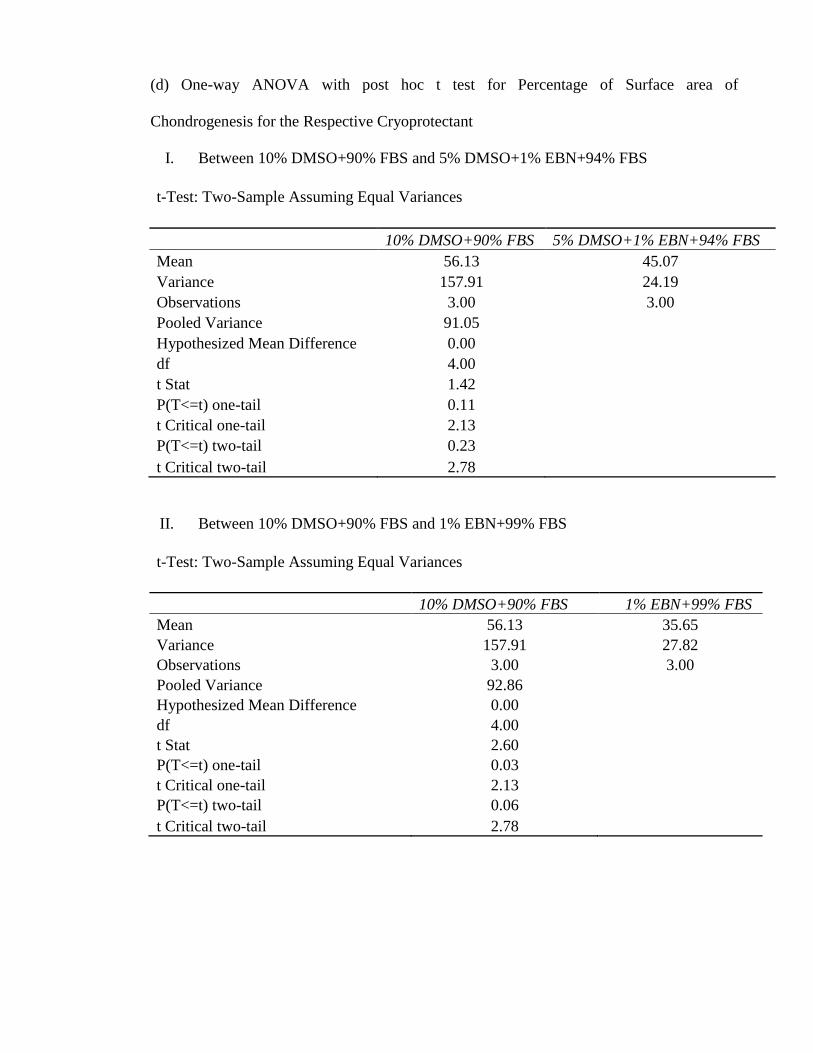
(d) One-way ANOVA with post hoc t test for Percentage of Surface area of
Chondrogenesis for the Respective Cryoprotectant
I. Between 10% DMSO+90% FBS and 5% DMSO+1% EBN+94% FBS
t-Test: Two-Sample Assuming Equal Variances
10% DMSO+90% FBS 5% DMSO+1% EBN+94% FBS
Mean 56.13 45.07
Variance 157.91 24.19
Observations 3.00 3.00
Pooled Variance 91.05
Hypothesized Mean Difference 0.00
df 4.00
t Stat 1.42
P(T<=t) one-tail 0.11
t Critical one-tail 2.13
P(T<=t) two-tail 0.23
t Critical two-tail 2.78
II. Between 10% DMSO+90% FBS and 1% EBN+99% FBS
t-Test: Two-Sample Assuming Equal Variances
10% DMSO+90% FBS 1% EBN+99% FBS
Mean 56.13 35.65
Variance 157.91 27.82
Observations 3.00 3.00
Pooled Variance 92.86
Hypothesized Mean Difference 0.00
df 4.00
t Stat 2.60
P(T<=t) one-tail 0.03
t Critical one-tail 2.13
P(T<=t) two-tail 0.06
t Critical two-tail 2.78

III. Between 5% DMSO+1% EBN+94% FBS and 1% EBN+99% FBS
t-Test: Two-Sample Assuming Equal Variances
5% DMSO+1% EBN+94% FBS 1% EBN+99% FBS
Mean 45.07 35.65
Variance 24.19 27.82
Observations 3.00 3.00
Pooled Variance 26.01
Hypothesized Mean Difference 0.00
df 4.00
t Stat 2.26
P(T<=t) one-tail 0.04
t Critical one-tail 2.13
P(T<=t) two-tail 0.09
t Critical two-tail 2.78

(e) One-Way ANOVA for the Percentage of Surface area of Osteogenesis for the
Respective Cryoprotectant
Anova: Single Factor
SUMMARY
Groups Count Sum Average Variance
10% DMSO+90% FBS 3 22.38 7.46 3.43
5% DMSO+1% EBN+94% FBS 3 20.26 6.75 0.29
1% EBN+99% FBS 3 19.49 6.50 0.25
ANOVA
Source of Variation SS df MS F P-value F crit
Between Groups 1.49 2 0.75 0.57 0.60 5.14
Within Groups 7.92 6 1.32
Total 9.42 8

(f) One-way ANOVA with post hoc t test for Percentage of Surface area of Osteogenesis
for the Respective Cryoprotectant
I. Between 10% DMSO+90% FBS and 5% DMSO+1% EBN+94% FBS
t-Test: Two-Sample Assuming Equal Variances
10% DMSO+90% FBS 5% DMSO+1% EBN+94% FBS
Mean 7.46 6.75
Variance 3.43 0.29
Observations 3.00 3.00
Pooled Variance 1.86
Hypothesized Mean Difference 0.00
df 4.00
t Stat 0.64
P(T<=t) one-tail 0.28
t Critical one-tail 2.13
P(T<=t) two-tail 0.56
t Critical two-tail 2.78
II. Between 10% DMSO+90% FBS and 1% EBN+99% FBS
t-Test: Two-Sample Assuming Equal Variances
10% DMSO+90% FBS 1% EBN+99% FBS
Mean 7.46 6.50
Variance 3.43 0.25
Observations 3.00 3.00
Pooled Variance 1.84
Hypothesized Mean Difference 0.00
df 4.00
t Stat 0.87
P(T<=t) one-tail 0.22
t Critical one-tail 2.13
P(T<=t) two-tail 0.43
t Critical two-tail 2.78

III. Between 5% DMSO+1% EBN+94% FBS and 1% EBN+99% FBS
t-Test: Two-Sample Assuming Equal Variances
5% DMSO+1% EBN+94% FBS 1% EBN+99% FBS
Mean 6.75 6.50
Variance 0.29 0.25
Observations 3.00 3.00
Pooled Variance 0.27
Hypothesized Mean Difference 0.00
df 4.00
t Stat 0.61
P(T<=t) one-tail 0.29
t Critical one-tail 2.13
P(T<=t) two-tail 0.58
t Critical two-tail 2.78