the effects of aerobic exercise on human skeletal …716115/fulltext01.pdfthe effects of aerobic...
TRANSCRIPT
Thesis for Doctoral degree, Östersund 2014
THE EFFECTS OF AEROBIC EXERCISE ON HUMAN SKELETAL MUSCLE ADAPTATIONS TO RESISTANCE EXERCISE
Tommy Lundberg
Main supervisor: Per Tesch
Co-supervisor: Ola Eiken
Department of Health Sciences
Mid Sweden University, SE-831 25 Östersund, Sweden
ISSN 1652-893X,
Mid Sweden University Doctoral Thesis 181
ISBN 978-91-87557-41-5

i
Akademisk avhandling som med tillstånd av Mittuniversitetet i
Östersund framläggs till offentlig granskning för avläggande av
doktorsexamen torsdag 15 maj 2014 klockan 13:00 i sal F229,
Mittuniversitetet Östersund. Seminariet kommer att hållas på
engelska.
THE EFFECTS OF AEROBIC EXERCISE ON HUMAN SKELETAL
MUSCLE ADAPTATIONS TO RESISTANCE EXERCISE
Tommy Lundberg
© Tommy Lundberg, 2014
Department of Health Sciences
Mid Sweden University, SE-831 25 Östersund, Sweden
Telephone: +46 (0)771-975 000
Printed by Mid Sweden University, Sundsvall, Sweden, 2014

ii
ABSTRACT
Aerobic exercise (AE) may interfere with muscle adaptations induced by resistance
exercise (RE). Three experimental campaigns were conducted to explore the
influence of AE on molecular, functional and muscular adaptations to acute and
chronic RE. Twenty-nine men performed unilateral knee extensor RE preceded by
AE (AE+RE). The contralateral leg did RE only. First, the influence of acute AE on
muscle molecular responses to RE performed 6 h later was studied. Subsequently,
this exercise regimen was implemented over 5 weeks training. The relationships
between acute and chronic outcomes were examined and molecular responses to
acute exercise were assessed in untrained and trained muscle. Finally, acute and
chronic responses to AE+RE, interspersed by only 15 min recovery, were
investigated.
Phosphorylation of mTOR and p70S6K was greater after AE+RE than after RE. In
parallel, myostatin was suppressed for a longer time after AE+RE. These results
suggest that AE+RE enhance skeletal muscle anabolic environment more than RE
alone (Paper I). After 5 weeks training, improvements in muscle strength and
power were similar across legs. However, AE+RE prompted a greater increase in
muscle size than RE, suggesting that AE potentiates the hypertrophic stimulus to
RE training without altering muscle function progress (Paper II). Consistent with
changes in whole-muscle size, AE+RE showed greater anabolic molecular
responses than RE. As chronic training blunted this effect, it appears that AE offers
a synergistic hypertrophic stimulus to RE only during short-term training (Paper
III). Although putative regulators of hypertrophy such as p70S6K, myostatin and
PGC-1α4 were examined, no molecular marker correlated with changes in muscle
size, strength or power induced by training. Hence, this study challenges the
concept that single molecular markers are viable predictors of training-induced
muscle adaptations (Paper III–IV). When recovery time between exercise bouts was
reduced to 15 min, AE+RE still produced a more substantial increase in muscle size
than RE. However, progression of concentric strength was blunted. Thus, while
restored muscle function between exercise bouts is a prerequisite for achieving
maximal gains in strength and power, incomplete recovery appears not to
compromise muscle hypertrophy (Paper V).
Collectively, the results suggest that outcomes of AE+RE are impacted by chronic
training and time allowed for recovery between exercise modes. Yet, the current
study offers no support to the view that AE interferes with muscle hypertrophy
induced by RE.
Key words: concurrent training, endurance, gene expression, hypertrophy, muscle
strength and power, protein phosphorylation

iii
SAMMANDRAG
Uthållighetsträning kan försämra muskelns anpassning till styrketräning. Tre
serier av experiment genomfördes för att undersöka effekter av uthållighetsträning
på molekylär, funktionell och muskulär anpassning till akut och kronisk
styrketräning. Tjugonio män utförde enbensstyrketräning som föregåtts av
uthållighetsarbete (AE+RE). Det andra benet utförde enbart styrketräning (RE).
Först undersöktes effekten av uthållighetsträning på molekylär respons vid
styrketräning utförd 6 timmar senare. Sedan implementerades samma
träningsmodell under 5 veckors träning. Förhållandet mellan akut respons och
kronisk anpassning studerades, och akut molekylär respons undersöktes i otränad
och tränad muskel. Slutligen studerades akuta och kroniska effekter av AE+RE, där
träningspassen separerats med endast 15 minuters återhämtning.
Fosforylerat mTOR och p70S6K var högre efter AE+RE jämfört med efter RE.
Samtidigt var myostatin nedreglerat under längre tid efter AE+RE. Dessa resultat
tyder på att kombinerad uthållighets- och styrketräning förstärker muskelns
anabola miljö mer än enbart styrketräning (Artikel I). Efter 5 veckors träning hade
muskelstyrka och power ökat likartat i bägge ben. Trots det ledde AE+RE till större
ökning av muskelsvolym än RE. Uthållighetsarbete synes därmed förstärka det
stimuli för muskeltillväxt som noteras vid enbart styrketräning, utan att
progression av muskelfunktion påverkas (Artikel II). I linje med förändringarna på
helmuskelnivå noterades en mer utpräglad anabol molekylär respons efter AE+RE
jämfört med efter RE. Eftersom denna effekt var avtrubbad i tränad muskel, verkar
det som att uthållighetsarbete är ett synergistiskt stimuli för muskeltillväxt endast
under en kortare period (Artikel III). Trots att påstådda reglerare av hypertrofi
såsom p70S6K, myostatin and PGC-1α4 studerades, korrelerade ingen molekylär
markör med förändringar i muskelstorlek, styrka eller power efter träning.
Därmed uttrycks tvivel om att enskilda molekylära markörer kan förutspå
muskelns anpassning till träning (Artikel III–IV). När återhämtning mellan passen
reducerades till 15 minuter, ledde AE+RE fortfarande till en större ökning av
muskelvolym än RE. Dock försämrades koncentrisk styrkeutveckling av det
föregående uthållighetspasset. Dessa resultat understryker vikten av att återställa
muskelns prestationsförmåga mellan respektive träningspass för nå maximal
utveckling av styrka och power. Ofullständig återhämtning verkar däremot inte
försämra muskelhypertrofi (Artikel V).
Sammantaget visar dessa studier att resultatet av uthållighets- och styrketräning
påverkas av kronisk träning och tid ägnad till återhämtning mellan respektive
träningsform. Däremot finnes inget stöd för att uthållighetsträning begränsar
muskeltillväxt vid styrketräning.

iv
TABLE OF CONTENTS
ABSTRACT ....................................................................................................................... II
SAMMANDRAG ............................................................................................................ III
LIST OF PAPERS ............................................................................................................ VI
ABBREVIATIONS ........................................................................................................ VII
INTRODUCTION .............................................................................................................. 8
MUSCLE ADAPTATIONS TO RESISTANCE EXERCISE ............................................................ 9
Acute responses .............................................................................................................. 9
Chronic effects of resistance training on strength and power ...................................... 10
Muscle hypertrophy ..................................................................................................... 10
MUSCLE ADAPTATIONS TO AEROBIC EXERCISE ............................................................... 15
Acute responses ............................................................................................................ 15
Mitochondrial biogenesis ............................................................................................. 15
Angiogenesis ................................................................................................................ 16
CONCURRENT TRAINING ................................................................................................. 17
The effects of aerobic exercise on muscle adaptations to resistance exercise ................. 17
Proposed mechanisms causing interference ................................................................. 19
AIM AND HYPOTHESIS ..................................................................................................... 21
METHODS ........................................................................................................................ 22
GENERAL DESIGN............................................................................................................. 22
SUBJECTS .......................................................................................................................... 25
EXERCISE EQUIPMENT ...................................................................................................... 25
One-legged aerobic exercise .......................................................................................... 25
Flywheel resistance exercise ......................................................................................... 26
Isokinetic torque assessment ........................................................................................ 26
TESTING PROCEDURES ..................................................................................................... 27
TRAINING PROTOCOLS ..................................................................................................... 27
ACUTE EXERCISE EXPERIMENTS ....................................................................................... 28
MUSCLE BIOPSIES ............................................................................................................. 28
DIET AND EXERCISE CONTROL ......................................................................................... 28
MAGNETIC RESONANCE IMAGING .................................................................................. 29
LABORATORY ANALYSIS .................................................................................................. 30
RNA extraction, reverse transcription and real-time qPCR ........................................ 30
Protein extraction and western blotting ...................................................................... 31

v
Immunohistochemical analysis .................................................................................... 31
Protein concentration ................................................................................................... 32
Enzyme and glycogen assays ....................................................................................... 32
DATA ANALYSIS ............................................................................................................... 32
RESULTS ........................................................................................................................... 33
ACUTE EXERCISE RESPONSES ........................................................................................... 33
AEROBIC EXERCISE TRAINING .......................................................................................... 34
ENDURANCE PERFORMANCE ........................................................................................... 34
RESISTANCE EXERCISE TRAINING .................................................................................... 35
STRENGTH AND POWER PERFORMANCE .......................................................................... 35
MUSCLE HYPERTROPHY AND SIGNAL INTENSITY ............................................................ 37
IMMUNOHISTOCHEMISTRY .............................................................................................. 38
PROTEIN CONCENTRATION ............................................................................................. 39
GLYCOGEN CONTENT ...................................................................................................... 39
ENZYME ACTIVITY ........................................................................................................... 39
GENE EXPRESSION ............................................................................................................ 40
Study I .......................................................................................................................... 40
Study II ........................................................................................................................ 40
Study III ....................................................................................................................... 44
PROTEIN PHOSPHORYLATION .......................................................................................... 46
Study I .......................................................................................................................... 46
Study II ........................................................................................................................ 46
Study III ....................................................................................................................... 46
RELATIONSHIPS BETWEEN ACUTE RESPONSES AND TRAINING OUTCOMES .................... 48
DISCUSSION ................................................................................................................... 49
STUDY DESIGN AND THE UNILATERAL EXERCISE MODEL ................................................ 49
MOLECULAR RESPONSES TO ACUTE CONCURRENT EXERCISE ......................................... 50
MUSCLE HYPERTROPHY IN RESPONSE TO CHRONIC CONCURRENT EXERCISE ................ 51
PROGRESSION OF IN VIVO MUSCLE FUNCTION................................................................. 53
MOLECULAR RESPONSES IN UNTRAINED AND TRAINED MUSCLE .................................. 53
ISOFORM-SPECIFIC EXPRESSION OF PGC-1α ................................................................... 54
RELATIONSHIP BETWEEN ACUTE RESPONSES AND TRAINING OUTCOMES ...................... 55
SUMMARY AND CONCLUSIONS ........................................................................................ 56
PERSPECTIVES .................................................................................................................. 57
ACKNOWLEDGEMENTS ............................................................................................. 59
REFERENCES ................................................................................................................... 60

vi
LIST OF PAPERS
This thesis is based on the following papers, herein referred to by their
Roman numerals:
Paper I Lundberg TR, Fernandez-Gonzalo R, Gustafsson T, Tesch PA.
Aerobic exercise alters skeletal muscle molecular responses to
resistance exercise. Medicine and Science in Sports and Exercise
2012; 44:1680–8.
Paper II Lundberg TR, Fernandez-Gonzalo R, Gustafsson T, Tesch PA.
Aerobic exercise does not compromise muscle hypertrophy
response to short-term resistance training. Journal of Applied
Physiology 2013; 114:81–9.
Paper III Fernandez-Gonzalo R, Lundberg TR, Tesch PA. Acute
molecular responses in untrained and trained muscle
subjected to aerobic and resistance exercise training versus
resistance training alone. Acta Physiologica 2013; 209:283–94.
Paper IV Lundberg TR, Fernandez-Gonzalo R, Norrbom J, Fischer H,
Tesch PA, Gustafsson T. PGC-1α4 expression and exercise-
induced human muscle hypertrophy. Acta Physiologica 2014
(in review).
Paper V Lundberg TR, Fernandez-Gonzalo R, Tesch PA. Exercise-
induced AMPK activation does not interfere with muscle
hypertrophy in response to resistance training in men. Journal
of Applied Physiology 2014; 116:611–20.
In addition, some unpublished data are presented.

vii
ABBREVIATIONS
AE Aerobic exercise
AMP Adenosine monophosphate
AMPK AMP-activated protein kinase
ANOVA Analysis of variance
BF Biceps femoris
BSA Bovine serum albumin
cDNA Complementary deoxyribonucleic acid
CS Citrate synthase
CSA Cross-sectional area
DNA Deoxyribonucleic acid
eEF2 Eukaryotic elongation factor 2
FAK Focal adhesion kinase
FOXO Forkhead box O
GAPDH Glyceraldehyde-3-phosphate dehydrogenase
LDH Lactate dehydrogenase
MAPK Mitogen-activated protein kinase
MGV Mean grey value
miRNA Micro ribonucleic acid
MRI Magnetic resonance imaging
mRNA Messenger ribonucleic acid
mTOR Mechanistic target of rapamycin
MuRF-1 Muscle RING-finger protein-1
NAD Nicotinamide adenine dinucleotide, oxidised
NADH Nicotinamide adenine dinucleotide, reduced
NaOH Sodium hydroxide
PA Phosphatidic acid
PBST Phosphate-buffered saline with tween
PFK Phosphofructokinase
PGC-1α Peroxisome proliferator-activated receptor- gamma coactivator 1 alpha
PVDF Polyvinylidene difluoride
p70S6K p70S6 kinase
QF Quadriceps femoris
qPCR Quantitative polymerase chain reaction
RE Resistance exercise
RF Rectus femoris
RIPA Radioimmunoprecipitation assay
RM Repetition maximum
RNA Ribonucleic acid
RPE Rating of perceived exertion
rpS6 Ribosomal protein s6
RT Room temperature
SD Standard deviation
STARS Striated muscle activator of Rho signalling
VEGF Vascular endothelial growth factor
VI Vastus intermedius
VL Vastus lateralis
VM Vastus medialis
Wmax Maximal workload
4E-BP1 Eukaryotic initiation factor 4E binding protein 1

8
INTRODUCTION
Human skeletal muscle is a highly plastic tissue allowing for marked yet reversible
phenotypic changes in response to altered use. Exercise training induces muscle
adaptations that persist for extended periods of time. These modifications, i.e.
chronic adaptations, are the accumulated result of repeated acute exercise sessions
[65]. Thus, the muscle gradually adapts to repetitive exercise, and after years of
specific training, displays a distinct phenotype reflecting the primary overload-
stimulus imposed. Chronic endurance exercise, characterised by high-volume/low-
force muscle actions, produces e.g. increased mitochondrial and capillary density
[11, 30, 96]. Conversely, resistance exercise, i.e. low-volume/high-force actions,
results in muscle hypertrophy and increased strength and power [158, 193]. These
typical exercise adaptations represent opposite ends of the adaptation continuum
[44] and are manifested in its extremes by e.g. the marathon runner displaying an
exceptionally fatigue-resistant muscle profile, and the powerlifter showing
extraordinary whole-muscle size.
Sports such as football, rugby, boxing, and decathlon require the athlete to
simultaneously possess and train for divergent performance qualities such as
strength, power, endurance and speed. Apart from athletic performance, training
with the goal of enhancing both strength and endurance is vital in e.g. injury
rehabilitation, health promotion, aging, or in individuals calling for effective
exercise countermeasures to combat muscle deconditioning (e.g. astronauts).
Muscle adaptations to these combined exercise regimens typically reside
somewhere in between the extremes of the adaptation continuum. From a
conceptual view, it appears unlikely that skeletal muscle is capable of concurrently
achieving the extreme features displayed by the powerlifter and the marathon
runner. Inevitably, the question has been raised whether skeletal muscle could
comply with aerobic and resistance training simultaneously, without
compromising the desired adaptations.
The effects of combined aerobic and resistance training, commonly referred to as
concurrent training, was originally investigated by Robert Hickson in 1980 [94]. In
that study, 10 weeks of concurrent aerobic and resistance training resulted in
reduced gains in muscle strength compared with resistance training alone. This
pioneer work suggested that aerobic exercise hampers muscle adaptations to
resistance exercise. Since then, numerous studies have explored muscle
adaptations to concurrent training. However, to fully grasp the nature of this
interference effect, the rather distinct muscle adaptations that occur in response to
aerobic and resistance training respectively, should be acknowledged.

9
Muscle adaptations to resistance exercise
The history of resistance training is often traced to ancient Greece and the legend
of Milo of Croton [188]. More anecdotal evidences include the lifelong efforts by
fitness advocates such as Joe Weider and Jack LaLanne, and at a more scientific
level, DeLorme emphasising resistance exercise as a viable method to restore
muscle power and function in patients suffering from weakness [57]. Today, it is
established and common knowledge that resistance exercise increases muscle mass
and strength, and hence employed by athletes to improve sport-specific
performance, and by the general population to promote health, lean body mass
and general fitness. Resistance could be produced by means of free weights,
machines, elastic bands or one’s own body weight. It is generally held coupled
concentric and eccentric muscle actions ought to be executed over a number of sets
and repetitions, and performed a few to several times per week depending on the
goal of the trainee [1]. The acute resistance exercise stimulus is impacted by the
specific mode, intensity, frequency and volume of training. Likewise, the
programme design influences the subsequent adaptations to chronic training.
Therefore, the myriad of possible programme variations and hence end-point
results should be appreciated.
Acute responses
Muscle force production is proportional to the number of cross-bridges formed by
the myofibrillar proteins actin and myosin. With increased loading, progressively
more high-threshold motor units and hence fibres are recruited according to the
size principle of motor unit activation [93]. Despite the high forces and power
produced, resistance exercise is performed at a relatively low energy cost. At the
most, and when exercise involves large muscle groups operating across multiple
joints, oxygen uptake rarely exceeds 50–60% of maximal aerobic power [64].
Despite the low energy demand, a typical resistance exercise session aimed at
promoting muscle accretion mobilises all major metabolic systems. Hence, muscle
phosphocreatine, glycogen and triglyceride utilisation is significant, and blood and
intra-muscular lactate accumulation marked [69, 194]. Resistance exercise
performed at high- and moderate loads shows significant glycogen depletion of
both slow- and fast-twitch fibres [198]. Acute resistance exercise also elicits an
endocrine response that increases receptor interactions and modifies protein
metabolism of muscle [52]. More specifically, local and systemic hormones such as
testosterone, growth hormone and insulin-like growth factors are secreted and
various cytokines are released [124]. It has become evident, however, that the
muscle growth response is intrinsic to skeletal muscle and hence independent of
circulating growth factors [187, 206, 209]. Of particular importance are the

10
intracellular signalling cascades that favour increased protein synthesis in response
to resistance exercise (see below).
Chronic effects of resistance training on strength and power
Numerous studies show that resistance exercise promotes increased maximal
voluntary strength [87, 178]. Enhanced force production is primarily mediated
through increases in muscle size (i.e. hypertrophy) and neural adaptations
favouring greater and more efficient muscle use [68, 137]. It is acknowledged that
the neural factors, such as enhanced neural drive and inter-muscular coordination,
are substantial during the early stages of training and most likely continue to
contribute to strength gains in long-term training paradigms followed by e.g.
olympic-style weightlifters [158, 178]. As the present work employs a resistance
training regime aimed at increasing muscle size, neural mechanisms that may
contribute to increased strength or power, are not discussed or reviewed in detail.
Despite a plethora of resistance training studies, there is still considerable debate
regarding the most effective training programme to improve strength. While e.g.
the American College of Sports Medicine advocates heavy loading (85–100% of 1
RM) and multiple sets to promote increased force [1], these recommendations have
rightfully so been challenged [33, 38, 39]. Nonetheless, and consistent with the
simplistic view that neural adaptations predominate early on, increases in strength
are substantial during the first weeks to months of a resistance training
programme [158, 178]. Later (a few to several months), muscle size and strength
increases in parallel [152, 193]. Athletes exposed to long-term vigorous resistance
training show extraordinary muscle hypertrophy [114, 193, 196].
Muscle hypertrophy
Resistance training induced increases in muscle mass are evident from studies
employing magnetic resonance imaging (MRI), computerised tomography and
ultrasound techniques [73]. In theory, any increase in muscle cross-sectional area
(CSA) could be due to increases in fibre size and/or fibre number (hyperplasia).
However, while the major contributor of muscle growth until early infancy is an
increase in fibre number, adult muscle hypertrophy predominantly occurs through
an increased protein content and CSA of individual fibres [137]. In particular,
resistance training increases area and number of myofibrils of the fast-twitch type
II fibres [73, 200]. Myofibrils occupy about 80% of the fibre volume in human
skeletal muscle [66], with the most abundant myofibrillar proteins being myosin
and actin. Thus, fibre hypertrophy occurs through de novo synthesis and
accumulation of new myofilaments, with concomitant expansion of fibre volume

11
[8, 43, 136]. It is also apparent that resistance training promotes phenotype change
towards an increased percentage of type IIa fibres at the expense of type IIx fibres,
whereas the proportion of type I fibres remains rather unchanged [5, 189].
Morphological changes that may occur in response to resistance training include
an increased fibre pennation angle [3, 73]. While this adaptation exaggerates the
increase in physiological relative to anatomical CSA [3], both measures are good
correlates of whole-muscle force production [17].
Protein synthesis and degradation
The ratio of protein synthesis and degradation determines muscle protein balance.
When muscle protein synthesis exceeds breakdown, the net protein turnover is
positive and accretion of muscle proteins occurs. During acute resistance exercise,
both protein synthesis [41] and breakdown [170] are stimulated such that the net
balance is negative [125]. However, when essential amino acids are consumed
post-exercise, the net protein balance turns positive. Resistance exercise is capable
of increasing muscle protein synthesis above baseline for 48–72 h. The elevation in
muscle breakdown appears to be briefer and less robust (24 h) [170]. Thus the
quantity of contractile proteins reaches a new steady-state level through the
cumulative effect of repeated exercise bouts and feeding. When repeated over an
extended period of time, this summates into muscle hypertrophy [13].
The protein synthetic response induced by resistance exercise is, in part, load and
volume dependent [32, 34], suggesting that both factors are implicated in
stimulating muscle hypertrophy. Albeit not always appreciated, high-volume
aerobic exercise also increases protein synthesis [89, 186], and low-loading
strategies repeated until exhaustion promote muscle growth [150]. However, while
any novel exercise bout induces global protein synthesis of both myofibrillar and
sarcoplasmic protein fractions, chronic training blunts this response [208], resulting
in an attenuated rise in protein synthesis in the trained state [116, 191]. These
findings suggest that cellular responses to aerobic and resistance exercise becomes
more specific to the stimulus applied, eventually promoting contractile protein
accretion more so following resistance than aerobic exercise [125].
Mechanotransduction
It is apparent that the skeletal muscle must possess a sensor(s) that transduces
active or passive tension into a cellular event favouring anabolism [88]. While
metabolic perturbations such as altered calcium flux and redox- and
phosphorylation state may be of importance for this to occur [44], recent research
highlights the membrane lipid phosphatidic acid (PA) and the protein complex
focal adhesion kinase (FAK) as potential key players [53, 216]. Acute loading
disturbs sarcolemma integrity and induces PA, leading to the activation of

12
signalling cascades that regulates protein synthesis [203]. The expression of FAK
increases in response to functional overload and decreases after unloading,
suggesting that FAK senses mechanical loading [70, 80, 217]. Collectively, it
appears that PA and FAK are crucial in converting mechanical strain into an
appropriate intracellular response initiating protein synthesis and muscle growth.
Transcriptional control
Transcriptional regulation of muscle hypertrophy has received attention as new
techniques allow for the analysis of genome-wide responses to exercise [169, 201].
It is well established that resistance exercise alters the expression of genes involved
in diverse functions such as cell growth and differentiation, inflammation, and
proteolysis [88]. While mRNA-levels typically return to baseline within 24 h after
resistance exercise [213], cross-sectional studies suggest that a few genes involved
in regulating muscle mass may be chronically altered after long-term training [174,
190]. As longitudinal studies are in conflict [74, 85], the role of basal transcriptional
activity in regulating muscle mass warrants further exploration.
The gene expression response to acute resistance exercise is implicated in
controlling muscle protein turnover [44]. Among markers exerting transcriptional
control is myostatin, a transforming growth factor-β family member functioning as
a negative regulator of muscle size. Over-expression of myostatin reduces muscle
size [175], and conversely, myostatin-deficient animals and humans display
remarkable muscle mass [145, 184]. Acute resistance exercise diminishes myostatin
expression [134] and hence aids in promoting muscle hypertrophy by reverting its
inhibitory effect on muscle protein synthesis and satellite cell activity [44, 204].
The ubiquitin ligase proteins atrogin-1 and MuRF-1, activated by FOXO
transcription factors, target contractile elements for degradation and hence
promote muscle atrophy [26, 109]. However, while MuRF-1 and atrogin-1 are
linked to muscle breakdown in response to disuse models, the role of these
markers in healthy skeletal muscle remains poorly understood. MuRF-1 increases
in response to resistance exercise [134, 139] whereas atrogin-1 remains unchanged
[214] or decreases [139]. Interestingly, recent reports suggest that MuRF-1
facilitates tissue remodelling in favour of muscle growth [54, 104].
PGC-1α is a transcriptional co-activator implicated in mitochondrial biogenesis
[106]. However, the physiological function of this gene may be isoform-specific
[177]. Indeed, it has been proposed that a novel splice variant, termed PGC-1α4,
controls muscle hypertrophy in response to resistance training [177]. This isoform
is produced by alternative 3' splicing, whereby a stop codon is introduced,
resulting in a protein shorter (truncated) than the full-length PGC-1α. While these

13
findings remain to be further scrutinised, PGC-1α4 has emerged as a tentative key
regulator of muscle hypertrophy in vivo.
The possible role of microRNAs (miRNA) in the muscle adaptive response to
exercise has been acknowledged [56, 95]. miRNAs are non-coding sequences of
mRNA that degrades target transcripts by binding to complementary sequences
[88]. It has been estimated that 30% of the genome involves miRNA processing,
and over-expression has the potential to markedly influence the transcription
profile [95]. Several miRNAs increase in response to resistance exercise and may
take part in regulating training-induced phenotypic changes [56, 117]. Their
precise roles in these processes are, however, uncertain.
Myonuclei addition
During hypertrophy, myonuclei addition could aid in maintaining the myonuclei-
to-cytoplasmic ratio intact and hence protect the capacity for transcription [7, 160].
The addition of new nuclei to existing fibres is mediated through the proliferation
of satellite cells [207]. The importance of satellite cell activity and myonuclei
addition in the hypertrophic process is under debate [111, 112, 127, 141, 202].
Myonuclei content was greater in powerlifters than in untrained controls [110],
and fibre hypertrophy induced by resistance training was paralleled by increased
myonuclei content [112] and satellite cell number [168]. Conversely, hypertrophy
was accompanied by gradually decreased myonuclei domain during 90 days
resistance training [111], and in mouse skeletal muscle, robust muscle growth is
possible even in the absence of satellite cells [141]. Taken together, it appears that
at least modest changes in muscle size are possible without the addition of new
myonuclei [111].
Intracellular signalling responses
Several signalling pathways appear to be involved in the control of muscle mass;
i.e. calcineurin and cytokine signalling, mitogen-activated protein kinases (MAPK),
striated muscle activator of Rho signalling (STARS) and the insulin-like growth
factor route [44, 76, 126]. Exercise-induced increases in protein synthesis are
predominantly due to augmented translation rather than increased mRNA
quantity [211]. Translating mRNA into protein includes the processes of initiation,
elongation and termination [29]. Of particular importance for this process is the
initiation step, which is coordinated by the mechanistic target of rapamycin
(mTOR) complex [151]. mTOR integrates signals from mechanical stimuli, energy
status and nutrients, to coordinate downstream signalling events [101]. Indeed,
activation of mTOR elicits increased protein synthesis after acute resistance
exercise [60], and is crucial for the muscle hypertrophic response [25, 27]. Thus,
inhibited mTOR activity blunts protein synthesis [61] and muscle hypertrophy

14
[27]. Downstream effector targets of mTOR include p70S6 kinase (p70S6K),
eukaryotic initiation factor 4E binding protein 1 (4E-BP1), ribosomal protein S6
(rpS6) and eukaryotic elongation factor 2 (eEF2). Numerous studies support their
role in augmenting protein synthesis in response to resistance training [140, 205].
For example, p70S6K was associated with gains in muscle mass following high-
frequency electrical stimulation in rats [15], and after 14 weeks resistance training
in humans [192]. Moreover, levels of mTOR signalling were paralleled by increases
in protein synthesis after acute resistance exercise and muscle accretion after
chronic training [140]. Thus, translational control of protein synthesis is generally
held as the most crucial molecular event regulating muscle size [205].

15
Muscle adaptations to aerobic exercise
Endurance sports such as long-distance running, road cycling and cross-country
skiing rely primarily on aerobic metabolism and training aims at sustaining a high
power output over an extended period of time. This is achieved through multiple
central and local physiological adaptations. Increased maximal oxygen uptake is
accomplished mainly through increased cardiac output [67], and manifests in high-
calibre endurance athletes displaying remarkably high aerobic power [180]. Work
capacity is further augmented through peripheral muscle adaptations such as
increased muscle oxidative enzyme activity, mitochondrial and capillary density,
and intracellular lipid stores [11, 90, 96, 97, 100].
Acute responses
The increased energy requirement typical of aerobic exercise triggers circulatory,
respiratory and hormonal responses. At the muscle level, increased blood flow and
metabolic perturbations, such as a drop in pH, increase in oxygen demand and
accumulation of AMP, calcium and free radicals [65, 71], are evident. These
primary stressors activate secondary messengers and signalling molecules such as
MAPK and AMP-activated protein kinase (AMPK) to initiate gene transcription
and downstream signalling events [44, 90]. Thus, unlike the adaptive responses to
resistance exercise, peripheral adaptations to endurance exercise are primarily
controlled at the transcriptional level [65]. Similar to resistance training, however,
the end-point training outcome depends on the specific exercise mode, intensity,
frequency and volume.
Mitochondrial biogenesis
Mitochondria increase in size and number in response to endurance training [79].
Mitochondrial content may increase in both subsarcolemmal and intermyofibrillar
regions [99] and in all three fibre types [102]. In parallel, training augments
mitochondrial oxygen uptake and enzyme activity [97]. Hence, the increase in
mitochondrial volume is linearly related to increased oxidative capacity and
endurance performance [100], emphasising the importance of mitochondrial
biogenesis in training-induced improvements of metabolic function and muscle
oxidative capacity.
PGC-1α is a key regulator of mitochondrial biogenesis. PGC-1α activates various
transcription factors, which results in a coordinated expression of mitochondrial
proteins encoded from nuclear and mitochondrial DNA [132]. Single exercise bouts
up-regulate PGC-1α mRNA and protein content [16, 106, 171], and over-expression
of PGC-1α promotes mitochondrial biogenesis and increased oxygen uptake and

16
exercise capacity [212]. Thus, PGC-1α is a master regulator of mitochondrial
biogenesis in response to aerobic training [172].
Angiogenesis
Endurance training induces skeletal muscle capillary proliferation [11]. The
expansion of the capillary network often occurs in parallel with increased maximal
oxygen uptake and is important to meet the higher rate of blood flow and hence
oxygen delivery to the working muscle [181]. Increased capillarity is accomplished
through both sprouting and non-sprouting mechanisms, and stimulated by factors
such as increased blood flow, shear-stress and metabolic perturbations [82].
Regardless of the triggering factor, the vascular endothelial growth factor (VEGF)
is a predominant regulator of angiogenesis [83, 164]. VEGF increases in response to
acute exercise and acts to stimulate angiogenic processes [84]. In further
supporting the role of VEGF, muscle deficiency in VEGF attenuates training-
induced angiogenesis and performance improvements [163, 164].

17
Concurrent training
Although the skeletal muscle adaptations outlined above represent classical end-
point adaptations to resistance and aerobic training, it should be acknowledged
that phenotype changes occur along a continuum and several muscle adaptations
show minor specificity across exercise modes. For example, muscle fibre size may
increase in response to aerobic training [11, 78] and myosin heavy-chain
transformation occurs in the same direction regardless of exercise modality [123].
Moreover, high-volume resistance training may induce capillary proliferation [183]
and increased oxidative enzyme activity [197]. These examples highlight the
complexity of the muscle adaptive response to exercise. At the cell level such
effects are likely influenced by cross talk, redundancy and feedback loops. Thus,
given the limited understanding of the mechanisms dictating classical adaptations
to aerobic and resistance exercise, it is perhaps not surprising that the mechanisms
regulating adaptation to concurrent exercise are poorly explored.
The effects of aerobic exercise on muscle adaptations to resistance exercise
The integration of aerobic and resistance exercise in a training programme has
been termed concurrent training. Since the work of Hickson [94], numerous studies
have investigated various performance indices after concurrent training compared
with specific exercise modes. Collectively, the evidence suggests that resistance
training does not alter maximal oxygen uptake, yet boosts endurance performance
when performed concurrently with aerobic training [2, 18, 131]. Results from
studies examining the effects of aerobic exercise on adaptations to resistance
exercise are equivocal. It is often held, however, that adding aerobic exercise to the
resistance training programme compromises important strength outcomes [14, 91,
155]. Thus, muscle hypertrophy, maximal strength and power, sprint and jump
performance, and explosive strength and rate of force development, are attenuated
after concurrent training [20, 42, 50, 58, 63, 77, 86, 94, 103, 123, 173]. Other studies
have reported no interference [75, 130, 142, 143, 159, 185]. These discordant
findings have been attributed to variations in training protocols, and exercise
modalities employed [130].
Training programme variables
A prerequisite for the interference effect is that both exercise modalities engage the
same muscle group [123]. Once this criterion is met, the outcome of concurrent
training depends on the specific subject sample, training programme and outcome
measure selected. Indeed, concurrent training studies have employed a broad
range of exercise durations, intensities and frequencies of training for the
respective aerobic and resistance exercise mode, making comparisons across
studies difficult, if not impossible.

18
The training volume, dictated by duration and frequency, could readily explain
some of the controversies in the concurrent training literature. Training frequencies
of 2–3 days/week appear not to compromise outcomes of resistance training [130,
142, 143]. Training conducted 5–6 days/week is more likely to do so [20, 77, 94].
This seems to hold true even when the weekly training volume is matched,
suggesting that the scheduling of training sessions is an independent factor to
consider, irrespective of total training volume.
If aerobic and resistance training are scheduled on the same day, some [19, 35], but
not all [49, 81], reports suggest that interference is minute if resistance exercise
precedes aerobic exercise. Exhaustive aerobic exercise impairs neuromuscular
function and reduces performance [21, 129]. Thus, to avoid residual fatigue from a
previous exercise bout, aerobic and resistance exercise should be scheduled on
alternate days. While this strategy allows for normalisation of muscle function
between bouts, it increases the frequency (days/week) of training. As mentioned,
this too may be counterproductive for optimal adaptations to occur. Therefore,
scheduling contrasting exercise modes on the same day interspersed by recovery,
to restore muscle function between bouts, presents and alternative attractive
approach. To date, however, few studies have employed this design and hence its
efficacy remains to be determined.
A recent meta-analysis quantified the importance of various training variables on
the interference effect. As determined by a total of 422 effect sizes, the most severe
interference was noted for peak power performance [210]. Interference was further
exacerbated when the running mode of exercise was employed, and high
(>3days/week) training frequencies and >20–30 min endurance training duration
also negatively impacted adaptations to resistance training [210]. Although these
results are relevant for individuals aiming at developing both strength and
endurance, there have been few attempts to address the potential mechanisms
underpinning the incompatibility of aerobic and resistance exercise.

19
Proposed mechanisms causing interference
Overtraining
Several early concurrent training studies employed high training volumes. Hence
overtraining may simply have explained the interference effect [63]. While the
muscle might struggle to comply with 10 training sessions per week (see the
Hickson study), only a single study reported a more catabolic environment after
concurrent training compared with resistance training alone [123]. Further, if
overtraining were to compromise adaptations to concurrent training, it would
selectively impair adaptations typical of resistance training, since aerobic
adaptations are either augmented or unaffected by concurrent training compared
with aerobic training alone [131].
Residual fatigue and low glycogen content
Aerobic exercise results in residual fatigue, which reduces the capacity for high
force production during a subsequent resistance exercise bout [21, 50]. If employed
chronically, muscle adaptations may be attenuated due to the reduction in day-by-
day training quality [179]. Associated with the fatiguing effects of aerobic exercise
is a decrease in muscle glycogen content [108]. Commencing resistance exercise
with low glycogen concentrations may [51] or may not [37] alter the cellular
response controlling protein synthesis. Allowing time for muscle function to
recover between bouts could therefore be imperative in order to optimise
adaptations to concurrent training.
Neurological factors
Impaired explosive strength, power and rate of force development have been
reported after concurrent training. These outcome variables appear more
susceptible to interference than pure torque/force measures [210], suggesting that
neurological factors may underpin the interference effect. However, in supporting
the neural hypothesis are only a few studies reporting reduced rate of force
development after concurrent training accompanied by a reduction in rapid neural
activation [86, 182].
Blunted hypertrophy through conflicting signalling responses
There is evidence to suggest that aerobic exercise compromises outcomes of
resistance training by blunting the hypertrophic response [50, 123, 173]. While the
mechanisms underlying this effect are not known, it is reasonable to assume such
an interference effect would reside within the muscle. In fact recent human data
suggested that the immediacy of diverse contractile activity after aerobic and
resistance exercise reduces the desired intracellular signalling response produced
by either mode of exercise in isolation [46]. This hypothesis accords with whole-

20
muscle data showing diminished hypertrophy of type I fibres (which are recruited
during both aerobic and resistance exercise) after concurrent aerobic and resistance
exercise, compared with after resistance training only [123, 173].
The thesis of incompatible cellular pathways originates from work with rat skeletal
muscle showing divergent muscle signalling after contrasting modes of exercise
[12, 156]. More specifically, muscles subjected to either high- or low frequency
electrical stimulation, purported to mimic resistance and aerobic exercise
respectively, showed increased mTOR phosphorylation after resistance, but not
aerobic, exercise [12]. Conversely, aerobic exercise induced AMPK activation and
increased protein levels of PGC-1α. While these results infer that mode-specific
signalling through AMPK and mTOR pathways dictates classical end-point
adaptations to chronic aerobic and resistance training, results of human studies are
equivocal. For example, when strength- and endurance-trained athletes performed
their habitual or non-habitual exercise mode, robust anabolic muscle signalling
was noted after the unfamiliar exercise mode only [48]. Moreover, AMPK has been
reported to increase in response to resistance exercise [60], and mTOR to be
induced by aerobic exercise [138]. These findings demonstrate that signalling
divergence in human muscle may not be as clear-cut and distinct as in the rat.
If the understanding of exercise mode-specific signalling responses is poor, the
knowledge about responses to mixed-mode or concurrent training is even more
limited. In the rat, contraction-induced mTOR signalling is inhibited by prior
AMPK activation through endurance exercise [199]. More specifically, translational
signalling is compromised via attenuation of key downstream regulators such as
4E-BP1 and p70S6K. This is consistent with the marked suppression of protein
synthesis following AMPK activation [28], and infers that recovery between bouts
is critical in order to avoid the negative effects of AMPK on muscle growth.
Collectively, the scenario of conflicting molecular pathways offers reasonable
mechanistic support to implicate that concurrent training attenuates myofibre
protein accretion. Nevertheless, it remains that currently no human study
investigating the effects of concurrent training has linked adaptations noted at the
whole-muscle level to mechanistic events inside the cell.

21
Aim and hypothesis
The overarching aim of this thesis was to study the effects of aerobic exercise on
muscle responses and adaptations prompted by acute and chronic resistance
exercise. The specific aims were to:
Paper I Examine acute muscle molecular responses to resistance exercise
preceded (6 h) or not by aerobic exercise
Paper II Study muscle hypertrophy and in vivo muscle function in response
to 5 weeks resistance training preceded (6 h) or not by aerobic
exercise
Paper III Compare acute molecular responses to resistance exercise, preceded
(6 h) or not by aerobic exercise, in untrained and trained muscle and
in relation to chronic adaptations
Paper IV Investigate the expression of PGC-1α splice variants in human
muscle after acute and chronic resistance and concurrent aerobic
and resistance exercise, and in relation to muscle hypertrophy
Paper V Study acute molecular and functional responses, as well as chronic
training adaptations, in response to acute and 5 weeks resistance
training preceded (15 min) or not by aerobic exercise
The overall hypothesis was that aerobic exercise would interfere with the
progression of in vivo muscle function and hypertrophy resulting from resistance
training alone.

22
METHODS
General design
Three experimental studies were performed (Study I–III; Table 1, Fig. 1). In each
study, the effects of aerobic exercise (AE) on muscle responses and adaptations to
resistance exercise (RE) were investigated. Each study employed a unilateral
exercise model in which one leg was subjected to AE and RE (AE+RE), whereas the
other leg served as a control and performed RE only.
In Study I, nine men performed one-legged AE in the morning and four sets of RE
for each leg 6 h (360 min) later (AE-360-RE). Muscle biopsies were obtained from
each leg before and 15 min and 3 h after the RE bout. Tissue samples were
subsequently analysed to determine gene expression and translational signalling
responses (Paper I).
Study II implemented the daily exercise regimen from the first study over 5 weeks
training. Maximal strength and power were determined before and after training,
and peak power was measured during all sessions. M. quadriceps femoris (QF)
volume, CSA, and signal intensity were assessed by MRI. Analysis of muscle
biopsies obtained at rest before and after training, determined fibre-type specific
CSA, gene expression and enzyme and glycogen levels (Paper II). In addition,
before and after training, muscle biopsies were obtained pre- and 3 h post-acute
RE, with and without preceding AE (Fig. 1). Thus, molecular responses in
untrained and trained muscle were assessed and compared across AE+RE and RE,
and the relationships between acute and chronic outcomes were examined (Paper
III). Finally, isoform-specific expression of PGC-1α was studied in response to
acute exercise and chronic training (Paper IV).
In Study III, time for recovery was reduced to 15 min, instead of 6 h, between AE
and RE bouts (AE-15-RE). An acute exercise session was performed employing
either AE-15-RE or RE only. Peak power was measured, and muscle biopsies
obtained immediately before and 3 h after RE determined glycogen levels, gene
expression and protein phosphorylation. The identical AE-15-RE vs. RE regimens
were subsequently implemented in a 5-week training programme. Maximal
strength and power were measured before and after training. QF volume, CSA and
signal intensity were assessed by MRI, and analysis of muscle biopsies obtained at
rest and 72 h after training, determined citrate synthase (CS) activity and glycogen
content (Paper V).

23
Table 1. Overview of the three experimental studies carried out in this thesis
Study I Study II Study III
Design Acute unilateral AE+RE vs. RE.
Chronic (5 weeks) unilateral AE+RE vs. RE. Acute bouts performed before and after the training period.
Chronic (5 weeks) unilateral AE+RE vs. RE. Acute bouts performed before the training period.
Recovery between AE and RE
360 min 360 min 15 min
Subjects N=9 men Age/height/weight: 23 (range 20–27) years 181 ± 6 cm 75 ± 6 kg
N=10 men Age/height/weight: 25 (range 20–33) years 184 ± 6 cm 83 ± 13 kg
N=10 men Age/height/weight: 26 (range 20–35) years 183 ± 7 cm 77 ± 9 kg
Publication Paper I Paper II Paper III Paper IV Paper V
Key outcome measures
▪ Power ▪ Gene expression ▪ Protein phosphorylation
▪ Power ▪ Torque ▪ Muscle size ▪ Immunohistochemistry ▪ Enzyme activity ▪ Gene expression
▪ Gene expression ▪ Protein phosphorylation
▪ PGC-1α isoform expression
▪ Power ▪ Torque ▪ Muscle size ▪ Enzyme activity ▪ Gene expression ▪ Protein phosphorylation
Note: AE = aerobic exercise; RE = resistance exercise

24
Figure 1. Experimental overview of the studies carried out in this thesis. In each study, one leg performed aerobic + resistance exercise
(AE+RE), while the other leg performed resistance exercise only (RE). B = muscle biopsies.

25
Subjects
Subjects (Table 1) were university students who trained to a moderate level and
who engaged in recreational activities, such as skiing and team sports, on a regular
basis (2–3 days/week). They had slight to moderate experience of weight training
before the study, yet had not performed regular or structured RE training during
the past year. The study experiments and procedures including risks and
discomforts were explained before subjects gave their informed written consent to
participate. The study protocols were approved by the Regional Ethical Review
Board in Umeå (Study I and II) and Stockholm (Study III).
Exercise equipment
One-legged aerobic exercise
Unilateral AE was carried out on a modified cycle ergometer (Fig. 2; model 828E,
Monark Exercise AB, Varberg, Sweden) [10, 40]. This particular exercise device
allows for isolated QF muscle use in the concentric mode of knee extension [10].
While seated, an adjustable bar linking the ergometer crank and a custom-made
lightweight plastic boot, worn by the subjects, was set individually to allow for
extensions ranging from 90˚ to 175˚ of knee angle. The flexion phase of the action
was passive such that the inherent flywheel momentum repositioned the leg.
Power and cadence (rpm) were sampled at 2 Hz using a wireless SRM Training
System (SRM GmbH, Jülich, Germany), and analysed using associated software.
Figure 2. The one-legged cycle ergometer used as the aerobic exercise mode.

26
Flywheel resistance exercise
Resistance exercise emphasising QF muscle use was performed in the seated leg
press (Study I) and knee extension mode (Fig. 3; Study I-III). Non-gravity
dependent devices (YoYo Technology Inc., Stockholm, Sweden) described
elsewhere [23, 195] were employed to conduct these exercises. These apparatuses
use the inertia of a spinning flywheel (~4.2 kg; moment inertia 0.11 kg/m2) to offer
unlimited resistance during coupled concentric and eccentric actions. Subjects were
seated and slightly reclined (hip angle ~90°). The range of motion was from ~90°
knee angle to near ~180° (full extension). By knowing the inertia employed, peak
concentric and eccentric torque and power of each repetition were calculated by
measuring rotational velocity (SmartCoach Europe AB, Stockholm, Sweden), and
force (MuscleLab, Langesund, Norway).
Isokinetic torque assessment
Knee extensor maximal isometric and isokinetic torque were assessed before and
after training (see later) using a Cybex II (Lumex Inc., New York, USA)
dynamometer, calibrated before each test. Thigh, hip and chest were stabilised to
the dynamometer chair using straps. Torque was sampled at 100 Hz using
MuscleLab. For all apparatuses used, individual settings were maintained
throughout the studies.
Figure 3. Flywheel knee extension ergometer used for the resistance exercise sessions.

27
Testing procedures
Identical test protocols were employed within a week before and after the training
periods (Study II and III). First, MRI scans were performed (described below).
During the second visit, muscle biopsies (details below) were obtained and during
the third and fourth visit, muscle function was assessed. Peak isokinetic torque
was measured at preset angular velocities of 30, 60, 120, 180, 210 and 270 °/s.
Subjects performed two maximal actions (30 s rest) at each velocity and the best
result represented peak torque. Maximal isometric torque was measured at a fixed
knee angle of 120°. Further, peak torque and power were assessed on the flywheel
ergometer. Subjects performed 2 x 7 repetitions with 2 min rest between sets.
Strong verbal encouragement was used to call for maximal effort. Peak values
were averaged across sets and repetitions. Normalised torque was calculated by
dividing peak knee extension torque with average muscle CSA. An incremental
test assessed maximal workload (Wmax) and endurance performance (time to
exhaustion) on the one-legged cycle ergometer. Resistance was increased by 2.5 N
every 2nd min until failure to maintain the prescribed cadence of 60 rpm. Wmax was
defined as the last successfully completed workload. Capillary blood (20 µl) was
sampled (Study II) from the ear lobe at rest, every 2nd min into exercise, and 1 and 3
min post-exercise. Samples were subsequently placed in a 1 ml haemolysing
solution and analysed for lactate concentration (EKF-diagnostic GmbH,
Magdeburg, Germany). Heart rate was recorded (Polar Electro OY, Kempele,
Finland) continuously throughout the test and subsequently analysed (Polar
ProTrainer 5). Rating of perceived exertion (RPE; central and local) was obtained
every 2nd min, and at exhaustion using the 6–20 Borg scale [31]. Subjects were blind
to any test result to ensure non-biased efforts.
Training protocols
During the 5-week training interventions, subjects completed 15 unilateral AE
sessions (3 non-consecutive days/week), and 12 unilateral RE sessions for both
limbs (2 days/week during week 1, 3 and 5 and 3 days/week during week 2 and 4).
Hence, one limb performed concurrent AE+RE while the other limb was subjected
to RE only. Legs chosen for the AE+RE intervention were randomised in a
counterbalanced manner.
AE comprised 40 min continuous one-legged cycle ergometer exercise. The initial
target load was 70% of the Wmax at a fixed cadence of 60 rpm. However, RPE
(central and local) was obtained every 10th min to customise the workload such
that a very strenuous effort was achieved during each exercise bout. After 40 min,
the workload was increased by ~20 W and subjects were requested to continue
until failure, which occurred within 1–5 min (average 2 min 30 s). Subjects received

28
real-time visual feedback of power and cadence via a computer monitor. Heart rate
was recorded continuously during one randomly selected session each week. In
the same session, capillary blood, for subsequent analysis of lactate concentration,
was sampled (Study II) at rest, every 10th min, and, 1 and 3 min after exercise.
RE was performed 6 h (Study II) or 15 min (Study III) after completion of AE on the
same day. During each session, 4 sets of 7 concentric-eccentric knee extensions
were executed for each leg (alternating leg between sets; 2 min rest) in the flywheel
ergometer. Subjects were requested to perform each repetition with maximal effort,
and were verbally encouraged throughout each set. Peak power for each repetition
was measured and subjects were supervised during all training sessions.
Acute exercise experiments
In each of the three studies, acute exercise bouts of AE+RE and RE were
performed. In the morning of the experimental day, subjects performed the AE
bout, i.e. one-legged cycle ergometer exercise, identically as described for training.
Capillary blood was sampled for analysis of lactate concentration (Study I and II),
and heart rate and RPE were monitored as described above. Subjects then
performed RE 6 h (Study I and II) or 15 min (Study III) after completion of AE (Fig.
1). They executed 4 sets x 7 repetitions in the flywheel configurations. A 2-min rest
was allowed between sets.
Muscle biopsies
Using the percutaneous needle biopsy technique [24], muscle samples (100–200
mg) were obtained from the vastus lateralis (VL) of each leg immediately before,
and 3 h after the RE session (Fig. 1). In Study I, a biopsy from each leg was also
obtained 15 min after acute RE. Furthermore, biopsies were obtained 72 h after the
5-week training periods. Following local anaesthesia administered to the skin and
muscle fascia, biopsies were taken from the mid portion of the muscle through
separate incisions 20 mm apart (moving distal to proximal), using a 5 mm
Bergström-needle with suction applied. Samples were visually inspected, and
excess blood, fat and connective tissue were removed, before frozen in liquid
nitrogen and stored at -80°C until analysis.
Diet and exercise control
Subjects refrained from strenuous physical activity and alcohol for a minimum of
48 h prior to any test day. A standardised meal (pasta, tomato sauce and juice) was
provided at ~8.00 pm on the night before biopsies were obtained. On the

29
experimental day, subjects had a standardised breakfast 2 h prior to the first biopsy
procedure. Lunch consumed ~3 h prior to RE was provided between the bouts in
Study I and II. Breakfast and lunch consisted of commercial energy drinks (Ensure
Plus, Abbott Laboratories Ltd, Maidenhead, UK). Water was allowed ad libitum at
any time. Subjects were requested to record food intake on test days, and replicate
the same diet regimen on corresponding test days after the training period. The
individual testing schedule was very similar (± 2 h) before and after training.
Throughout the studies, subjects were instructed to maintain ordinary daily
activities and routines, and to refrain from strenuous activities involving the lower
limbs.
Magnetic resonance imaging
Identical MRI techniques were employed in Study II and III. Scans were performed
before and 48–72 h after the training periods. To avoid the influence of fluid shifts
on muscle size, subjects rested in the supine position for 1 h prior to scans [22]. T2
weighted cross-sectional images (50 images, 10 mm slice thickness) were
subsequently obtained using a 1.5 Tesla Philips MR Systems Intera unit (Best, The
Netherlands). Anatomical landmarks and standardised positioning ensured that
the same segment was scanned before and after training. CSA (cm2) and signal
intensity (mean grey value; MGV) of each individual QF muscle (Fig. 4; VL, vastus
intermedius (VI), vastus medialis (VM) and rectus femoris (RF)) were analysed
from the image where gluteus maximus was no longer visible and ending with the
last image in which RF appeared. The signal intensity of MRI´s is proportional to
hydrogen concentration and is therefore used as a crude indicator of muscle water
content [166]. Every third image [6] was analysed to quantify CSA and signal
intensity using ImageJ software (National Institutes of Health, Maryland, USA). As
an additional control, signal intensity of biceps femoris (BF) was analysed in the
third image of each subject. Average CSA was multiplied by slice thickness to
obtain final muscle volume.

30
Figure 4. Cross-sectional MRI image displaying the four individual quadriceps muscles. RF
= rectus femoris; VL = vastus lateralis; VI = vastus intermedius; VM = vastus medialis.
Laboratory analysis
RNA extraction, reverse transcription and real-time qPCR
In each study, about 20 mg of muscle tissue was homogenised in TRIzol, and total
RNA was extracted. One µg of total RNA from each sample was used for reverse
transcription into cDNA for a final volume of 20 µl (High-Capacity Reverse cDNA
Transcription Kit, Applied Biosystems, Foster City, CA, USA). Gene expression
(mRNA) was determined using real-time qPCR procedures (ABI-PRISMA 7700
Sequence Detector, Perkin-Elmer Applied Biosystems). Gene-specific primers and
probes (TaqMan) for atrogin-1, MuRF-1, myostatin, PGC-1α and VEGF were
purchased from Applied Biosystems. GAPDH and 18S were used as reference
genes. Reaction and amplification mixes (10 µl) consisted of the diluted (1:100)
cDNA (4.5 µl), TaqMan Fast Universal PCR Master Mix (5.0 µl) and specific
primers (0.5 µl). Subsequent cycling protocols were 2 min at 50°C and 10 min at
90°C followed by 40 cycles at 95°C for 15 s and 60°C for 1 min. Target gene
expression was reported as a ratio to the reference gene using the 2-ΔCT formula
[133].
To examine isoform-specific expression of PGC-1α (Paper IV), primers designed by
Ydfors et al. [215] were used to identify PGC-1α splice variants transcribed from
the proximal promoter (exon 1a; here called PGC-1α-ex1a), and from the
upstream-located alternative promoter (exon 1b; PGC-1α-ex1b). Primers for the
truncated forms of PGC-1α (trunc-PGC-1α) covered the insert of exon 7a and
primers for the non-truncated form of PGC-1α (non-trunc-PGC-1α) covered the
exon 6 and 7b boundaries, excluding the insert sequence. Primers covering exon 2

31
and 3 boundaries represented the full PGC-1α gene (PGC-1α total). The reaction
volume included 5 µl of 1:100 cDNA sample, 7.5 µl SYBR Green PCR Master Mix
(Applied Biosystems), 0.5 µl of forward primers (0.4 µM), 0.5 µl of reverse primers
(0.4 µM) and 1.5 µl of purified water. GAPDH was used as reference gene.
Protein extraction and western blotting
About 30 mg frozen muscle was homogenised in RIPA buffer. Twenty µl of buffer
were used per 1 mg of tissue. After rotating the homogenate for 1 h at 4°C, the
samples were centrifuged at 15,000 g during 10 min at 4°C and the supernatant
was recovered. Protein concentrations were subsequently determined using the
Bradford technique. Thirty (Study III) or 40 (Study I and II) µg of protein per sample
were loaded on 7.5 or 10% SDS precast gels (Bio-Rad, Hercules, California, USA)
and separated through electrophoresis together with a protein ladder. Gels were
subsequently transferred to PVDF membranes, using either a wet transfer of 90
min at 90 V (Study I and II), or the Trans-Blot Turbo Transfer System from Bio-Rad
(Study III). Blocking was completed using fluorescent blocking buffer (Millipore,
Billerica, MA, USA) during 60 min at room temperature (RT). Membranes were
incubated overnight at 4°C with phospho-specific primary antibodies for mTOR
(Ser2448, 1:500), p70S6K (Thr389, 1:1,000), eEF2 (Thr56, 1:1,500), rpS6 (Ser235/236,
1:1,000), 4E-BP1 (Thr37/46, 1:1,000) and AMPKα (Thr172, 1:1,000). All antibodies
were from Cell Signaling Technology (Beverly, MA, USA), except for the antibody
against p70S6K, which was from Santa Cruz Biotechnology (Santa Cruz, CA, USA).
After the overnight incubation, membranes were washed (4 x 5 min) in PBST
(0.1%) and incubated with IRDye secondary antibody (LI-COR Biosciences,
Cambridge, UK) for 60 min at RT. A final series of washes were then performed
before the membranes were scanned using Odyssey SA Infrared Imaging System
(LI-COR Biosciences). The blots were subsequently quantified using ImageJ, and
phosphorylated proteins were expressed relative to total α-tubulin abundance
(1:20,000; Sigma-Aldrich, St. Louis, MO, USA).
Immunohistochemical analysis
In Study II, a ~20 mg portion of each muscle biopsy was oriented for transverse
sectioning and 5 μm cross-sections were cut in a cryostat at -22°C and mounted on
glass slides. Sections were stained using monoclonal antibodies to detect slow
myosin heavy chain (A4.840 from Developmental Studies Hybridoma Bank, Iowa
City, Iowa, USA), cell borders (Merosin IgG1, Novocastra Laboratories Ltd,
Newcastle, UK), capillaries (LamA IgG2a, Novacastra) and myonuclei (DAPI,
Novacastra). The majority of each biopsy section was captured (5–7 images) in x20
magnification (DFC360 FX Leica Microsystems, Wetzlar, Germany). To determine
the frequency of fibres expressing slow myosin heavy chain (type I fibres), and to
measure fibre CSA using custom-developed semi-automated analysis software, an
average of 177 fibres (range 101 to 250) from each sample were analysed. The same

32
sections were used when counting the number of capillaries, which were related to
the number of fibres and to fibre CSA. Muscle fibre myonuclei (sublaminar
placement) were counted in three randomly selected areas (~100 fibres) per biopsy,
and related to the number of fibres and to fibre CSA.
Protein concentration
The protein concentrations of different sub-fractions (total/mixed, sarcoplasmic
and myofibrillar) were determined from samples obtained at rest in Study II. About
15 mg of muscle tissue was manually homogenised in RIPA buffer. The resulting
homogenate was rotated gently for 60 min at 4°C. While 20 µl was used to measure
the mixed/total protein concentration, the remaining portion was centrifuged at
20,000 g for 30 min at 4°C. The supernatant was recovered and taken as the
sarcoplasmic fraction. The pellet was resuspended in a sucrose buffer with NaOH,
then manually homogenised and boiled at 37°C for 60 min. The resulting
homogenate was taken as the myofibrillar fraction. Protein concentrations were
determined through the Bradford technique with BSA as standard.
Enzyme and glycogen assays
Freeze-dried muscle samples (2–3 mg) were homogenised in phosphate buffer
with 0.5% BSA. CS and phosphofructokinase (PFK) activity was subsequently
determined by NAD+–NADH coupled reactions using fluorometric techniques
[135]. Lactate dehydrogenase (LDH) content was assessed through
spectrophotometry. Glycogen was hydrolysed enzymatically to free glucose and
assayed by fluorometry. All enzymatic assays were run in duplicates.
Data analysis
Most dependent variables were analysed by two-way repeated measures ANOVA
(factors time and leg). Variables that were compared in the basal state (e.g. fibre
size, enzyme levels and glycogen content) were analysed by a one-way repeated
measures ANOVA. Pearson’s product moment correlation was used to examine
the relationships between changes in acute molecular responses (p70S6K,
myostatin and trunc-PGC-1α) and training adaptations (muscle volume, fibre size
and peak torque). Data normality was assessed through histograms and the
Shapiro-Wilk test. If deemed necessary, data were log-transformed. Significant
interactions were further examined with simple effect tests and the false discovery
rate procedure was employed after a priori planned pairwise comparisons [55].
The level of significance was set at 5% (P < 0.05). All statistical analyses were
performed using SPSS (SPSS Inc., Chicago, IL, USA). Data are presented as means
± standard deviation (SD).

33
RESULTS
Acute exercise responses
Responses to acute AE are summarised in Table 2. In Study II, average power was
35% greater in the trained compared with the untrained state. RE performance was
similar across legs in Study I and II (Table 3). However, in Study III, the AE+RE leg
showed 10% lower (P < 0.05) peak power than the RE leg.
Table 2. Responses to the acute aerobic exercise bouts
Study I Study II Study III
AE-360-RE AE-360-RE AE-15-RE
Untrained Trained
Average power (W) 38±8 37±5 50±11 37±6
Average HR (bpm) 124±17 122±13 137±14 118±18
HR at exercise completion (bpm) 164±16 164±18 171±17 161±14
Average blood lactate (mmol/l) 3.1±1.1 3.5±0.5 5.3±0.9 -
Blood lactate 1 min post (mmol/l) 4.6±1.4 5.0±1.1 7.2±2.6 -
Blood lactate 3 min post (mmol/l) 4.5±1.4 5.0±1.2 7.3±2.6 -
RPE at 40 min (central; 6–20 units) 14±1 14±2 15±1 13±2
RPE at 40 min (local; 6–20 units) 17±1 17±2 17±1 15±1
RPE at completion (central; 6–20 units) 17±2 16±2 17±1 14±3
RPE at completion (local; 6–20 units) 20±0 19±1 20±1 18±1
Note: Values are mean ± SD. No statistical comparisons were made. HR = heart rate; RPE = rating of perceived exertion
Table 3. Responses to the acute resistance exercise bouts
Knee extension peak power (W)
Knee extension CON power (W)
Knee extension ECC power (W)
Study I
AE-360-RE 350±63 345±64 356±63
RE 357±53 346±52 368±55
Study II Untrained AE-360-RE 361±122 347±113 375±131
RE 372±113 355±105 389±122
Trained AE-360-RE 464±126 451±123 478±130
RE 475±131 460±128 489±133
Study III
AE-15-RE 351±97* 348±101* 354±95*
RE 387±88 382±88 391±90
Note: Values are mean ± SD. * Different (P < 0.05) from RE. CON = concentric; ECC = eccentric

34
Aerobic exercise training
Responses to AE training are outlined in Table 4. Marked improvements in
training performance were seen over the 5 weeks. In Study II, average power
increased 32% from the first to the last session. In Study III, a 36% improvement
was noted.
Endurance performance
In Study II, both legs showed improved endurance (time to exhaustion) after
training, yet the increase was more prominent (time x leg interaction, P = 0.05) after
AE+RE than RE (Table 5). In Study III, time to exhaustion increased (P < 0.05) after
AE+RE and was unchanged after RE.
Table 4. Responses to the aerobic training sessions
Study II Study III
AE-360-RE AE-15-RE
Average power (W) 43±8 46±13
Average power session 1 (W) 37±5 39±7
Average power session 15 (W) 49±10* 53±15*
Average HR (bpm) 124±14 120±17
HR at exercise completion (bpm) 163±16 160±18
RPE at 40 min (central; 6–20 units) 15±1 13±2
RPE at 40 min (local; 6–20 units) 17±1 16±1
RPE at completion (central; 6–20 units) 17±1 16±2
RPE at completion (local; 6–20 units) 20±0 19±1
Note: Values are mean ± SD. * Different (P < 0.05) from session 1. No other statistical comparisons were made. HR = heart rate; RPE = rating of perceived exertion
Table 5. Endurance performance in study II (AE-360-RE) and study III (AE-15-RE)
AE+RE RE
PRE POST ∆% PRE POST ∆%
Time to exhaustion (s) AE-360-RE b, c
590±104 752±129 29 553±98 659±109 19
AE-15-RE
a, b, c 632±105 770±145 22 624±151 654±142 5
Wmax (W) AE-360-RE b, c
50±12 72±19 44 49±12 62±15 27
AE-15-RE
a, b, c 57±15 77±19 35 56±21 62±18 11
Peak HR (bpm) AE-360-RE b, c
158±18 169±12 7 153±17 161±17 5
AE-15-RE b 163±7 168±16 3 160±10 159±15 -1
Note: Values are mean ± SD. Significant effects (P < 0.05): a = interaction; b = leg; c = time. HR = heart rate; Wmax = maximal workload

35
Resistance exercise training
In both Study II and III, peak power rose almost linearly during the 12 RE sessions
(Fig. 5). The increase from the 1st to the 12th session was ~25% for either leg.
However, in Study III, the leg subjected to AE+RE performed ~20% lower (P < 0.05)
peak power compared with RE across the 5-week training.
Figure 5. Peak power measured during each resistance training session in study II (AE-360-
RE) and study III (AE-15-RE). Values are mean ± SD. Significant effects (P < 0.05): b = leg; c = time.
Strength and power performance
In Study II, flywheel peak torque showed comparable increases after AE+RE and
RE. Normalised torque showed a trend (P = 0.08) towards a time x leg interaction
(Table 6), due to a greater increase for RE (19%) than AE+RE (12%). In Study III,
flywheel peak torque also increased after training. However, while peak eccentric
torque increased equally across legs, peak concentric torque increased after RE
(10%, P < 0.05), but not after AE+RE. Hence, concentric torque normalised to
muscle CSA was compromised by the AE+RE intervention (interaction P < 0.05).

36
Table 6. Strength and power performance in study II (AE-360-RE) and study III (AE-15-RE)
AE+RE RE
PRE POST ∆% PRE POST ∆%
Flywheel peak power (W) AE-360-RE c 400±137 514±129 29 406±120 502±126 24
AE-15-RE
c 428±110 496±129 16 435±80 515±109 18
Flywheel peak torque (Nm) AE-360-RE c 218±31 279±59 28 217±35 280±61 29
AE-15-RE
c 249±37 274±50 10 251±34 280±39 12
Flywheel CON torque (Nm) AE-360-RE c 196±28 251±53 28 193±30 251±58 30
AE-15-RE
a, c 236±33 247±43 5 234±26 258±35 10
Flywheel ECC torque (Nm) AE-360-RE c 240±36 307±66 28 242±42 308±68 27
AE-15-RE
c 263±44 301±63 14 268±46 303±51 13
Norm. torque (Nm/cm2) AE-360-RE
c 2.77±0.37 3.10±0.52 12 2.81±0.36 3.36±0.69 19
AE-15-RE 3.12±0.40 3.23±0.47 4 3.08±0.37 3.36±0.51 9
Norm. CON torque (Nm/cm2) AE-360-RE
c 2.46±0.36 2.75±0.47 12 2.47±0.33 2.98±0.63 21
AE-15-RE
a 2.95±0.28 2.90±0.34 -2 2.87±0.26 3.08±0.39 7
Norm. ECC torque (Nm/cm2) AE-360-RE
c 3.00±0.39 3.36±0.55 12 3.09±0.43 3.66±0.80 18
AE-15-RE 3.29±0.55 3.56±0.66 8 3.29±0.54 3.64±0.71 11
Isometric peak torque (Nm) AE-360-RE c 287±53 312±86 9 276±49 307±73 11
AE-15-RE 323±84 305±52 -6 297±52 314±68 6
Isokinetic torque (Nm), 30 °/s AE-360-RE c 248±35 278±71 12 227±52 263±54 16
AE-15-RE 300±58 293±55 -2 291±46 296±56 2
Isokinetic torque (Nm), 60 °/s AE-360-RE c 220±38 241±62 10 201±44 230±54 14
AE-15-RE 265±57 254±46 -4 250±45 254±54 2
Isokinetic torque (Nm), 120 °/s AE-360-RE c 198±48 211±62 7 176±32 193±39 10
AE-15-RE 218±51 201±44 -8 204±35 206±49 2
Isokinetic torque (Nm), 180 °/s AE-360-RE 164±37 183±62 12 151±37 164±40 9
AE-15-RE 178±35 168±37 -6 173±29 173±41 0
Isokinetic torque (Nm), 210 °/s AE-360-RE c 142±30 167±58 18 132±28 148±35 12
AE-15-RE 164±39 148±28 -10 156±30 156±40 0
Isokinetic torque (Nm), 270 °/s AE-360-RE c 118±33 151±56 28 122±25 130±33 7
AE-15-RE 140±35 128±31 -9 140±26 141±37 1
Note: Values are mean ± SD. Significant effects (P < 0.05): a = interaction; b = leg; c = time. CON = concentric; ECC = eccentric; Norm. = normalised

37
Muscle hypertrophy and signal intensity
In Study II, QF volume showed a time x leg interaction (P < 0.05). The increase in
muscle volume averaged 14% after AE+RE and 8% after RE (Table 7). The signal
intensity of both QF and VL was similar across legs before training, and increased
after AE+RE but not RE (interaction: P < 0.05). In Study III, QF volume and CSA
increased after either intervention (Table 7). However, the increase was greater
(interaction: P < 0.05) after AE+RE (6%) than RE (3%). Signal intensity increased 7%
after AE+RE (P < 0.05), yet was unaltered by RE. The hypertrophy responses were
very consistent across subjects (Fig. 6). The increased volume of the four individual
QF muscles was greater after AE+RE than RE in both training studies.
Table 7. Selected MRI measures in study II (AE-360-RE) and study III (AE-15-RE)
AE+RE RE
PRE POST ∆% PRE POST ∆%
m. QF volume (cm3) AE-360-RE a, b, c 1147±249 1303±276 14 1111±262 1198±273 8
AE-15-RE a, c 1217±246 1286±247 6 1239±231 1273±237 3
m. VL (cm3) AE-360-RE a, c 361±80 421±95 17 360±97 387±102 8
AE-15-RE a, c 403±95 425±95 6 411±96 421±96 2
m. VI (cm3) AE-360-RE a, b, c 362±107 402±124 11 338±98 359±104 6
AE-15-RE a, c 376±77 389±79 3 390±67 395±71 1
m. VM (cm3) AE-360-RE a, c 294±66 329±69 12 282±75 300±76 6
AE-15-RE a, c 322±70 336±69 4 318±64 325±64 2
m. RF (cm3) AE-360-RE a, c 91±22 115±29 26 89±25 104±29 16
AE-15-RE a, c 117±26 135±28 15 120±33 131±34 9
m. QF CSA (cm3) AE-360-RE a, b, c 79±10 90±10 14 78±12 84±12 8
AE-15-RE a, c 81±13 85±13 6 82±13 84±13 3
m. QF SI (MGV) AE-360-RE a, c 52±7 58±8 12 52±7 52±9 0
AE-15-RE a 48±6 52±8 7 47±6 47±6 0
m. VL SI (MGV) AE-360-RE a, b, c 53±8 58±8 9 52±8 51±8 -2
AE-15-RE a 47±5 51±6 8 47±4 47±5 0
m. BF SI (MGV) AE-360-RE 40±7 41±6 2 41±10 40±10 -2
AE-15-RE 41±6 42±6 1 40±4 40±5 1
Note: Values are mean ± SD. Significant effects (P < 0.05): a = interaction; b = leg; c = time. QF = quadriceps femoris; VL = vastus lateralis; VI = vastus intermedius; VM = vastus medialis; RF = rectus femoris; CSA = cross-sectional area; SI = signal intensity; MGV = mean grey value

38
Figure 6. Relative changes in muscle size in study II (AE-360-RE) and study III (AE-15-RE).
* Different (P < 0.05) from RE.
Immunohistochemistry
In Study II, mean fibre CSA increased 17% following AE+RE (P < 0.05) compared
with a 9% increase (non-significant) after RE (Table 8). Type II fibre CSA increased
19% after AE+RE (P < 0.05) and 16% after RE (P = 0.05). The number of nuclei per
fibre did not change. Consequently, the average CSA covered by each nucleus
increased after AE+RE (P < 0.05). The number of capillaries per fibre was unaltered
by training, and hence the number of capillaries per CSA tended to decrease after
AE+RE (P = 0.07).
Table 8. Immunohistochemical measures in study II (AE-360-RE)
PRE AE+RE RE
Mean fiber CSA (μm2) 4601±1097 5361±781* 5033±767
Type I fibre CSA (μm2) 4055±911 4547±660 4259±932
Type II fibre CSA (μm2) 5046±1439 5995±1010* 5829±999
Type I fibres (%) 50±15 51±18 51±13
Type II fibres (%) 50±15 49±18 49±13
Capillaries per fibre 2.38±0.61 2.37±0.68 2.51±0.62
Capillaries per mm2 521±123 441±103 491±89
Nuclei per fibre 2.57±0.54 2.57±0.44 2.57±0.28
CSA (μm2) per nuclei 1794±265 2089±237* 1959±261
Note: Values are mean ± SD. * Different (P < 0.05) from PRE. CSA = cross-sectional area

39
Protein concentration
There were no differences (all P > 0.05) in protein concentrations across PRE vs.
AE+RE vs. RE (analysed in Study II only). Mixed protein concentration was 134±21
vs. 140±27 vs. 145±18 µg/mg wet muscle respectively. These values were 86±11 vs.
86±12 vs. 86±13 for the sarcoplasmic fraction and 60±15 vs. 66±18 vs. 60±17 for the
myofibrillar fraction.
Glycogen content
In Study I, glycogen decreased in response to exercise in both legs (P < 0.05; Fig. 7).
However, glycogen content was overall lower in AE+RE compared with RE (main
effect P < 0.05). In Study III, the leg that had completed AE showed 32% lower (P <
0.05) glycogen concentration than the rested leg. This effect was still evident 3 h
after acute RE. Both the AE-360-RE and the AE-15-RE paradigms resulted in
greater (P < 0.05) basal glycogen levels compared with RE (Fig. 7).
Figure 7. Left panel: glycogen concentrations before (PRE) and 3 h after (POST) acute
resistance exercise with (AE+RE) or without (RE) preceding aerobic exercise in study I/II (AE-360-RE) and study III (AE-15-RE). Right panel: basal glycogen levels after 5 weeks training of either regimen. Values are mean ± SD. Significant effects (P < 0.05): b = leg; c =
time. * Different (P < 0.05) from RE.
Enzyme activity
In Study II, CS activity increased 19% following AE+RE (P < 0.05), yet was
unchanged after RE. Values were 34, 41 and 35 mmol/kg/min for PRE, AE+RE and
RE respectively. PFK activity or LDH content showed no changes. In Study III, CS
activity increased 18% after AE+RE (P < 0.05), yet remained unchanged after RE.
Values were 45, 53 and 43 mmol/kg/min for PRE, AE+RE and RE.

40
Gene expression
Study I
There were time x leg interactions (P < 0.05) for both PGC-1α and VEGF expression
because mRNA levels were greater in AE+RE at PRE and POST1, compared with
RE (Fig. 8). Expression of MuRF-1 over time was similar in AE+RE and RE
(interaction P = 0.08). There was an interaction (P < 0.05) in atrogin-1 expression.
Levels were higher in AE+RE at PRE and POST1 compared with RE (P < 0.05).
There was also an interaction (P < 0.05) in myostatin expression. Levels were lower
in AE+RE at PRE and POST1 compared with RE (P < 0.05). Within the RE leg,
myostatin decreased (P < 0.05) ~60% from PRE to POST2 (Fig. 8).
Study II
Basal gene expression
There was no change in basal expression levels for any of the genes investigated.
Acute gene expression in trained compared with untrained muscle
In the untrained state, RE showed a 2-fold increase in PGC-1α expression from
PRE to POST (P < 0.05). This effect was offset in the trained state (Fig. 9). A
condition x time interaction was also found (P < 0.05), due to decreased PGC-1α
expression in AE+RE from untrained to trained muscle, with no change in RE.
VEGF expression increased after RE in the untrained but not trained state (Fig. 9).
There was a condition x leg interaction (P < 0.05) for MuRF-1 expression due to a
decrease in AE+RE with no change in RE (Fig. 10). In addition, MuRF-1 mRNA
content was higher in AE+RE than RE in the untrained condition (P < 0.05). The
opposite was true in the trained condition, i.e. expression levels were lower after
AE+RE than RE (P < 0.05). AE+RE showed greater (P < 0.05) atrogin-1 expression
than RE in the untrained condition (Fig. 10). In contrast, atrogin-1 expression was
greater after RE than AE+RE in the trained condition (P = 0.05). Myostatin showed
time x leg interaction (P < 0.05) in the trained state. Thus, myostatin levels
decreased in RE from PRE to POST, while AE+RE showed no change (Fig. 10).
Isoform-specific PGC-1α expression
There was a time x leg interaction (P < 0.05) for PGC-1α-ex1a. Thus, while the
expression decreased after AE+RE, it remained unchanged after RE (Fig. 11). There
were also interactions (P < 0.05) in PGC-1α-ex1b and non-trunc-PGC-1α expression
because values increased after RE, but not after AE+RE (Fig. 11). Trunc-PGC-1α
(untrained) showed no interaction. However, there was a main effect of time (P <
0.05) due to increased trunc-PGC-1α levels from PRE to POST for both AE+RE (1.4-
fold) and RE (2.2-fold).

41
Figure 8. Gene expression of PGC-1α,
VEGF, MuRF-1, atrogin-1 and myostatin before (PRE), 15 min after (POST1) and 3 h after (POST2) resistance exercise with (AE+RE) or without (RE) preceding aerobic exercise. Values are mean ± SD in arbitrary units (a.u.). Significant effects (P < 0.05): a = interaction; b = leg; c = time.

42
Figure 9. Gene expression of PGC-1α and VEGF before (PRE) and 3 h after (POST)
resistance exercise with (AE+RE) or without (RE) preceding aerobic exercise in the untrained and trained condition. Values are mean ± SD in arbitrary units (a.u.). Significant effects (P < 0.05): b = condition x leg interaction; d = leg; e = condition.

43
Figure 10. Gene expression of MuRF-1, atrogin-1 and myostatin before (PRE) and 3 h after
(POST) resistance exercise with (AE+RE) or without (RE) preceding aerobic exercise in the untrained and trained condition. Values are mean ± SD in arbitrary units (a.u.). Significant effects (P < 0.05): b = condition x leg interaction; d = leg; e = condition.

44
Study III
There were time x leg interactions for PGC-1α and VEGF expression (P < 0.05).
Thus, the increased expression from PRE to POST was greater after AE+RE than
RE (Fig. 12). MuRF-1 expression increased after AE+RE and was unchanged after
RE (interaction: P < 0.05). Atrogin-1 showed interaction (P < 0.05), as mRNA-levels
decreased after RE and tended to increase after AE+RE. Myostatin expression also
showed an interaction effect (P = 0.05) because the down-regulation was greater
after AE+RE than RE (Fig. 12).
Figure 11. Gene expression of PGC-1α
isoforms before (PRE) and 3 h after (POST) resistance exercise with (AE+RE) or without (RE) preceding aerobic exercise. Values are mean ± SD in arbitrary units (a.u.). Significant effects (P < 0.05): a = interaction; b = leg; c = time.
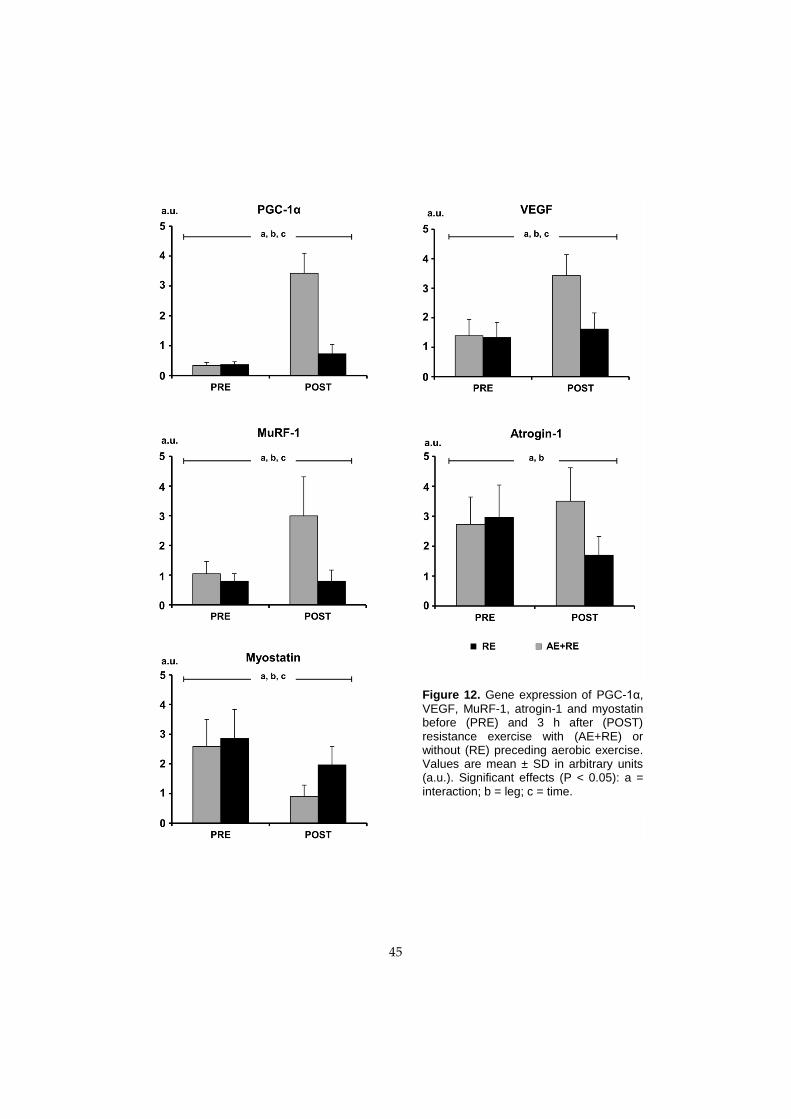
45
Figure 12. Gene expression of PGC-1α,
VEGF, MuRF-1, atrogin-1 and myostatin before (PRE) and 3 h after (POST) resistance exercise with (AE+RE) or without (RE) preceding aerobic exercise. Values are mean ± SD in arbitrary units (a.u.). Significant effects (P < 0.05): a = interaction; b = leg; c = time.

46
Protein phosphorylation
Study I
There was no time x leg interaction in mTOR phosphorylation (Fig. 13). However,
signalling was greater in AE+RE compared with RE (P < 0.05). Phosphorylation of
p70S6K was also greater in AE+RE compared with RE (P < 0.05). Phosphorylation
of rpS6 and eEF2 remained unchanged (data not shown).
Study II
There was a tendency towards a time x leg interaction (P = 0.08) for p70S6K in the
untrained state (Fig. 14). Thus, while both legs showed increased p70S6K
phosphorylation, the increase was slightly greater in AE+RE than RE (1.6 vs. 1.3-
fold). In the trained state, both AE+RE and RE showed increased p70S6K
phosphorylation. Overall p70S6K phosphorylation levels were greater in the
trained compared with the untrained state (Fig. 14, main effect P < 0.05).
Phosphorylation of mTOR, rpS6 and eEF2 was unchanged (data not shown).
Study III
AMPK phosphorylation showed a time x leg interaction (P < 0.05); values at PRE
were greater (1.5-fold, P < 0.05) in the leg that had performed AE, compared with
the rested (RE) leg (Fig. 15). Similarly, rpS6 showed interaction (P < 0.05) such that
phosphorylation was elevated (1.3-fold, P < 0.05) in AE+RE compared with RE at
PRE (Fig. 15). Phosphorylation of 4E-BP1 and p70S6K was unaltered (data not
shown).

47
Figure 13. Phosphorylation of mTOR (Ser2448) and p70S6K (Thr389) before (PRE), 15 min
after (POST1) and 3 h after (POST2) resistance exercise with (AE+RE) or without (RE) preceding aerobic exercise. Values are mean ± SD in arbitrary units (a.u.). Significant effects (P < 0.05): b = leg.
Figure 14. Phosphorylation of p70S6K (Thr389) before (PRE) and 3 h after (POST)
resistance exercise with (AE+RE) or without (RE) preceding aerobic exercise in the untrained and trained condition. Values are mean ± SD in arbitrary units (a.u.). Significant effects (P < 0.05): e = condition.

48
Figure 15. Phosphorylation of AMPKα (Thr172) and rpS6 (Ser235/236) before (PRE) and 3
h after (POST) resistance exercise with (AE+RE) or without (RE) preceding aerobic exercise. Values are mean ± SD in arbitrary units (a.u.). Significant effects (P < 0.05): a = interaction.
Relationships between acute responses and training outcomes
There were no significant correlations between changes in selected molecular
markers (p70S6K, myostatin and trunc-PGC-1α) after acute resistance exercise, and
training-induced adaptations (muscle volume, fibre size and peak torque; all R <
0.5 and all P > 0.05).

49
DISCUSSION
The interest in studying concurrent exercise arose from observations inferring that
aerobic exercise (AE) could compromise established skeletal muscle responses
prompted by resistance exercise (RE). It was hypothesised that acute AE would
interfere with molecular responses to subsequent RE, such that increases in muscle
size and strength to cumulative RE training would be compromised. As it turned
out, and at surprise, AE+RE produced greater muscle hypertrophy than RE. In
parallel, muscle anabolic environment was enhanced, and more so following
AE+RE than RE. Thus, if anything, muscle growth responses to subsequent RE
were potentiated rather than compromised by preceding AE.
A novel aspect of the study was that muscle molecular responses were examined
in both the untrained and trained state. In supporting the whole-muscle
adaptations demonstrated, molecular responses inferred more substantial tissue
remodelling after AE+RE than RE of untrained muscle. Interestingly, responses in
trained muscle were attenuated and more refined towards the specific exercise
stimulus applied. These findings suggest that whole-muscle adaptations ultimately
diverge in the direction predicted by the specific training stimulus, and further that
aerobic exercise boosts muscle hypertrophy during short-term training. As no
molecular marker correlated with training-induced changes in muscle size or
strength, the results of the current exhaustive experiments offer no support to the
idea that e.g. post-exercise gene expression or protein phosphorylation predict
chronic exercise outcome.
When 6 h recovery was employed between exercises, peak power had returned to
baseline and strength and power progressed at identical rates across AE+RE and
RE. Conversely, incomplete recovery prompted reduced training performance and
blunted concentric strength development compared with RE alone. Thus,
imperatively, allowing for normalisation of muscle function between exercise
bouts is crucial for optimal gains in strength and power.
Study design and the unilateral exercise model
The one-legged exercise model, targeting an isolated muscle group, allowed for
strictly controlled intra-subject comparisons. The aerobic stimulus offers an intense
and prolonged challenge at the muscle cell level. Oxygen uptake rises linearly with
increased external work, and at maximal work rate, metabolic rate of active
muscles increases more than 100-fold [10]. During the ~45 min exercise performed
in the current study, ~2,500 concentric muscle actions were executed at a work rate
of ≥ 70% Wmax. Thus, while this exercise modality does not resemble more familiar
and established whole-body endurance tasks, the aerobic stress at the muscle

50
cellular level is undoubtedly challenging. This is justified by the findings of
parallel increases in work capacity and oxidative enzyme activity reported here
and in past research, employing one-legged cycle ergometry [118, 119].
The flywheel RE, conducted in the current series of experiments, offers unlimited
resistance by means of coupled concentric-eccentric actions while providing brief
eccentric overload. As shown here and elsewhere [162, 195], short-term training
interventions using this approach result in robust muscle hypertrophy.
Collectively, the paradigm, which aims at examining quadriceps-specific muscle
adaptations to concurrent AE+RE, is believed to mimic conditions experienced in
real-life sports training.
To assess the effects of AE on responses to RE, total work performed was markedly
greater in the leg subjected to AE+RE. Yet, as both legs performed RE, it is unlikely
cross-education effects biased the results [68, 148, 154]. Exercise in the current
experiments was performed in the fed rather than the fasted state to ensure that
any potential suppression of anabolic signalling would not be evoked by lack of
nutrients [45].
Molecular responses to acute concurrent exercise
Enhanced translational capacity mediates exercise-induced increases in muscle
protein synthesis. While mTOR and p70S6K phosphorylation was greater after
AE+RE than RE (Study I), these differences were subtle and not always evident
(Study III). Thus, although RE may elicit increased protein synthesis
unaccompanied by detection of mTOR-signalling [59], augmented protein kinase
activity alone cannot explain the more substantial muscle hypertrophy noted after
5 weeks AE+RE compared with RE training.
Myostatin is a negative regulator of muscle hypertrophy [44] and both AE and RE
diminished myostatin expression in the current study. Previous studies are
commensurate with that contractile activity, rather than any specific mode of
exercise, stimulates down-regulation of myostatin [134, 139]. Hence, concerting the
robust increase in whole-muscle and fibre size after AE+RE, prolonged myostatin
suppression most likely favoured positive muscle protein turnover in the current
study.
The ubiquitin ligase proteins MuRF-1 and atrogin-1 take part in regulating muscle
protein turnover [26, 44]. Atrogin-1 expression either decreases [134, 139] or shows
no change [47, 214] in response to RE. AE induces increased atrogin-1 expression in
both trained [47] and moderately trained [134] subjects. MuRF-1 expression

51
increases following acute AE or RE [134, 214]. Yet, chronic training may attenuate
this increase [139]. Given that MuRF-1 and atrogin-1 appear instrumental in
governing load-induced muscle hypertrophy [54, 104], the up-regulation of these
genes presumably augmented muscle growth in response to the current AE+RE
paradigm.
Increased expression of PGC-1α [161] and VEGF [83], reflecting mitochondrial
biogenesis and angiogenesis respectively, occurs in response to AE. The increased
PGC-1α and VEGF mRNA after AE+RE is consistent with these findings. However,
and in contrast to results indicating that PGC-1α expression responds exclusively
to endurance-type exercise [12, 47], it also increased 3 h after RE. This marked
increase of PGC-1α in response to no more than 28 forceful muscle actions was a
secondary, yet intriguing, finding of Study I which spurred analysis of isoform-
specific PGC-1α expression (discussed later).
As the molecular response to acute exercise is influenced by genetic variability
[201], and cross-talk, redundancy and transiency of activation [44], the particular
time-point chosen to study the selected markers is critical. The 3 h post-RE time-
point accommodated changes in both protein phosphorylation and gene
expression. Thus, genes regulating protein turnover typically show responsiveness
to acute RE within this time frame [134], accompanied by elevated
phosphorylation of selected proteins [208].
In summary, the selected molecular targets represent key mediators of exercise-
induced muscle adaptations. Their response aids in explaining why AE+RE served
as a more potent stimulus for muscle hypertrophy than RE. More specifically, AE
elicited responses not very different from those evoked by RE. This would suggest
that the summative response of AE+RE was responsible for the greater
hypertrophic response noted with this exercise paradigm.
Muscle hypertrophy in response to chronic concurrent exercise
Perhaps the most striking finding of the current thesis was the most impressive
increase in muscle size following AE+RE. The increase in muscle size was very
consistent and the hierarchical response across individual QF muscles was similar
to what has been reported elsewhere employing this particular RE regimen [162,
195]. Moreover, signal intensity of the RE leg and the non-used BF was unaltered,
providing further evidence that reported differences across legs were specific to
QF muscles and the intervention imposed. Increases in whole-muscle and fibre
CSA occurred in parallel (Study II). The more robust effect shown after AE+RE
appeared to be ascribed to a more substantial type I fibre hypertrophy. Altogether

52
the results suggest that repetitive concentric low-force actions act synergistically
with high-force RE to govern increased skeletal muscle size at a rate greater than
shown with established highly effective RE training. While this contrasts with the
general view that AE prompts no or minute muscle hypertrophy [123], it is worth
noting that one-legged cycling performed 5 days/week for 5 weeks increased
muscle size by 7% in recreationally active men [153], and low-force actions,
performed with or without vascular occlusion, induced hypertrophy similar to
traditional high-force RE training [9, 98, 150, 160]. Evidently, low-force actions
repeated until contractile failure may represent a strategy to induce significant
hypertrophy [33, 122], albeit not necessarily as powerful as more traditional high-
loading regimens.
The exaggerated increase in size was accompanied by augmented signal intensity
of MRI scans after AE+RE but not RE. Typically, exercise-induced increases in
signal intensity are attributed to increased muscle water/hydrogen content, due to
very transient osmotic fluid shifts [146], or as a result of oedema from muscle
damage after e.g. eccentric exercise [72]. None of these explanations could account
for the increased signal intensity because MRI scans were obtained at least 48 h
after completing the final exercise session. At this time, both legs had performed
the eccentric component of RE, unaccompanied by muscle soreness. However, as
mitochondria may constitute 4–6% of muscle volume density [100] and proxy
markers examined (CS activity; endurance performance) showed substantial
increases after AE+RE, along with increased glycogen content, it is possible these
constituents impacted muscle composition and hence signal intensity.
Notwithstanding, resting samples obtained before and after training showed
unaltered protein concentrations, to suggest that the increased muscle size was
mainly due to contractile protein accretion.
It was hypothesised that the induction of antagonistic molecular signalling
pathways would compromise muscle hypertrophy to AE+RE [46, 91]. Animal and
in vitro studies suggest that AMPK signalling blocks mTOR activity [105], impairs
protein synthesis [28, 199], and provokes myofibrillar protein degradation [157]. In
contrast, the current data clearly show that hypertrophy was not compromised by
AE+RE. This may be because AMPK is activated momentarily in response to
exercise. Increased AMPK activity is typically evident ≤1 h post-exercise [36, 60],
returning to baseline shortly thereafter [60, 208], and cumulative exercise may even
offset this response [144]. Given that protein synthesis may be elevated 48–72 h
after acute RE [125], the very brief AMPK activation induced by AE appears to
evoke little, if any, impact on the net protein balance accumulated between
exercise sessions. It is therefore concluded that in humans, AMPK activation
induced by AE does not blunt hypertrophy in response to subsequent and
cumulative RE.

53
AE reduces glycogen stores and commencing exercise in the low-glycogen state
may alter metabolic and molecular responses compared with muscles displaying
normal or high glycogen levels [51, 92]. The current study showed that glycogen
depletion induced by AE was not accompanied by altered mTOR-signalling 3 h
post-RE. Similarly, translational signalling and protein synthetic responses to RE
were not compromised in glycogen-depleted skeletal muscle at onset of exercise
[37]. Thus, human muscle commencing RE at ~30% reduced glycogen stores (Study
III) clearly possesses undiminished ability to undergo hypertrophy.
Progression of in vivo muscle function
In Study II, day-by-day power and total work produced during each of the 12 RE
sessions were almost identical across legs. Accordingly, increases in in vivo muscle
strength and power as a result of training, were very similar across legs and hence
exercise modes. Thus, when 6 h recovery was allowed between sessions, AE did
not interfere with RE performance outcomes.
Conversely, when recovery was reduced to 15 min (Study III), AE impaired
subsequent RE performance throughout the training period. Improvements in
concentric strength after 5 weeks were greater with RE than with AE+RE. These
findings are consistent with the view that AE interferes with RE-induced
progression of muscle function [131], and perhaps most evident for explosive
strength and power [62, 77, 147, 165], and not necessarily paralleled by
compromised muscle hypertrophy [86, 107, 147]. For example, back-to-back AE+RE
impeded progression of strength, but not muscle size [179], and high- but not low-
intensity RE produced strength gains, whereas muscle size increased regardless of
intensity [98]. Thus, given that interference in strength development is not always
accompanied by reduced rate of muscle hypertrophy, it must be that neural factors
play a role in the interference effect. While acute AE results in transient
neuromuscular dysfunction [21, 120], the response to chronic AE has been less
researched [86]. Notwithstanding, the current results suggest that restoring muscle
function between exercise bouts is vital for attaining optimal gains in strength and
power. Therefore, athletes and individuals aiming at developing these qualities
should ensure sufficient recovery time between contrasting exercise modes.
Molecular responses in untrained and trained muscle
Clearly, chronic exercise training modifies skeletal muscle molecular responses to
acute exercise [208]. Therefore, physiological extrapolations from responses
brought about by acute exercise bouts could be misleading, if not erroneous. To

54
this end, molecular responses were assessed and compared in the untrained and
trained state (Paper III). Chronic training augmented the acute p70S6K response.
Similarly, rat muscle showed summated anabolic and attenuated catabolic
signalling following repeated bouts of RE [113]. Thus, cumulative training may
boost the acute p70S6K response, perhaps allowing for a more rapid translation
initiation after exercise. This would be consistent with the shorter duration of, yet
more pronounced initial increase in, muscle protein synthesis after acute RE,
evident in the trained state [191].
MuRF-1 and atrogin-1 showed greater expression after acute AE+RE than RE in the
untrained state. Given that both genes are involved in proteasome-dependent
protein breakdown, an event necessary for exercise-induced tissue remodelling
and muscle growth [54, 104, 128], it is likely the exacerbated response enabled
more marked muscle hypertrophy following AE+RE. Interestingly however,
responses were attenuated with chronic training and MuRF-1 was even lower in
AE+RE compared with RE in the trained state. As it relates to initiating muscle
hypertrophy, these novel results suggest that AE acts synergistically with RE only
during short-term training.
The endurance markers (PGC-1α and VEGF) responded to a novel RE bout in the
untrained, but not the trained state. Moreover, exercise-induced expression of
these genes was more short-lived in the trained condition, corroborating with the
acute attenuation of PGC-1α and VEGF typically seen with training [167, 176].
Hence, as global PGC-1α expression after acute RE does not necessarily lead to
enhanced muscle oxidative capacity or mitochondrial biogenesis after cumulative
training, conclusions based on PGC-1α following an acute exercise challenge,
regarding chronic effects, should be exercised with caution.
Isoform-specific expression of PGC-1α
In the process of work on this thesis, it was reported that a novel splice variant of
PGC-1α was preferentially induced by RE, and claimed to control muscle
hypertrophy in vivo [177]. Interestingly, expression of this truncated splice variant
termed PGC-1α4, was further augmented by concurrent AE training. Given that
alternative mRNA splicing influences the co-activation of transcription factors
regulating the physiological effect [218], it was proposed that isoform-specific
induction of PGC-1α would be the mechanistic link to the exaggerated muscle
hypertrophy noted after concurrent exercise.
The current results inferred that expression of truncated and non-truncated
isoforms increases after both AE and RE. Similarly, Ydfors et al. showed

55
comparable increases in trunc-PGC-1α after single bouts of either exercise mode
[215]. These acute data suggest that trunc-PGC-1α does not respond differently to
AE and RE respectively. With regard to chronic effects, no splice variant assessed
in the current study showed a change in the basal state after training. As changes
in basal levels of PGC-1α transcripts are typically not present >24 h post-exercise
[65, 121, 171], it is concluded that PGC-1α isoforms are regulated transiently in
response to acute exercise of any mode. Hence, the trumpeted role of PGC-1α4 as a
master regulator of exercise-induced hypertrophy [177] appears far-fetched.
Relationship between acute responses and training outcomes
If certain quantifiable acute events could explain the variance in training-induced
muscle adaptations, they could serve as early and valid markers for e.g. the
efficacy of various exercise programmes. Indeed, results have been posted to
suggest that molecular markers could reflect muscle adaptive responsiveness to
chronic RE training. Phosphorylation of p70S6K correlated with the subsequent
increase in muscle mass following 6 weeks electrical stimulation in rats [15], and 14
weeks RE training in men [192]. Further, RE-induced down-regulation of
myostatin correlated with increased 1RM strength and muscle size [174]. These are
not consistent findings, and other reports have questioned the usefulness of sole
molecular markers in explaining training outcomes [149, 150, 169].
In the current study, p70S6K phosphorylation explained no more than ≤20% of the
variance in muscle hypertrophy. At an individual level, this would have a most
insignificant predictive value. Further, and at odds with a previous report [174],
there was no correlation between changes in myostatin and whole-muscle or fibre
size. Discrepancies in study results could be explained by multiple factors inherent
in the study design, e.g. time of biopsy sampling, subjects’ physical conditioning
level and the particular exercise employed. Nevertheless, the results cast doubt on
the hypothesis that acute changes in molecular snapshot markers could predict
variability in muscle adaptations with any certainty. The heterogeneous response
to exercise and the complex regulation of resulting phenotypic adaptations
certainly limit the capability of single markers to explain muscle adaptability [4, 13,
201]. Thus, future studies should look beyond master regulators of specific muscle
adaptations and perhaps explore global maps of transcriptional regulation [115]
and miRNA expression [56].

56
Summary and conclusions
The main findings in this thesis were that:
Concurrent exercise elicited greater mTOR and p70S6K phosphorylation
compared with RE. In parallel, myostatin was suppressed for a longer time
after AE+RE. These differences indicated that translational capacity was
reinforced rather than compromised by AE+RE. Consequently, concurrent
exercise appears to enhance skeletal muscle anabolic environment more
than RE (Paper I).
When employing 6 h recovery between exercise modes, muscle strength
and power showed comparable improvements across legs, yet the increase
in muscle size was more evident following AE+RE. Thus, AE could offer a
synergistic hypertrophic stimulus to RE training without altering the
progress in muscle function resulting from RE (Paper II).
AE performed 6 h prior to RE augmented p70S6K signalling and MuRF-
1/atrogin-1 expression in untrained muscle compared with RE alone.
However these responses were blunted in the trained state, suggesting that
AE acts synergistically with RE only during short-term training, as it
relates to initiating muscle hypertrophy. Although the molecular
adaptations at large were aligned with global muscle changes shown after
5 weeks training, no single molecular marker correlated with training-
induced changes in muscle size, strength or power (Paper III).
Both the truncated and non-truncated splice variants of PGC-1α were
expressed after AE and RE, respectively. Hence, these transcripts respond
regardless of exercise mode. Furthermore, none of the splice variants were
up-regulated in the rested state after training. Acute and chronic gene
expression showed no correlation with muscle adaptations resulting from
training. Thus, it appears highly unlikely that truncated PGC-1α is a
principal coordinator of human muscle hypertrophy (Paper IV).
Activation of AMPK induced by AE did not compromise muscle
hypertrophy in response to subsequent RE. However, performance of
consecutive AE and RE bouts compromised concentric force development.
Thus, while muscle hypertrophy appears unaffected by recovery strategy,
restoring muscle function between exercise bouts is a prerequisite for
maximal gains in strength and power (Paper V).

57
Perspectives
The results of the current investigation suggest that cellular responses induced by
AE, generally held to be antagonistic to those elicited by RE, do not cause
interference in strength and muscle mass development after short-term concurrent
training. In fact, several cellular responses appear to be shared across exercise
modes, indicating that contractile activity rather than specificity of exercise is the
prime driver initiating early muscle-adaptive responses. However, in the trained
state, molecular responses were attenuated and more specific to the exercise mode
employed. Thus, with longer training periods (i.e. months to years), the stimulus
imposed by AE is likely insufficient to promote hypertrophy. Also, as the
molecular- and protein-synthetic response to acute exercise fades after chronic
training, disturbances from antagonistic molecular signals may play a larger role in
trained individuals possessing a smaller window to drive adaptive changes. This
scenario (Fig. 16) could in part explain why it seems impossible to achieve the
phenotype displayed by the extreme endurance athlete and the powerlifter at the
same time.
In numerous sports, strength and power are prerequisites for performance, yet
endurance is required as well. For those athletes, it appears skeletal muscle
complies with intense RE and AE training over several weeks, perhaps months. In
particular, this holds true if sufficient recovery is allowed between exercise modes
and the overall training frequency, engaging the same muscles, is modest. It
follows that individuals aiming at improving health, general fitness or body
composition should not be too concerned about any negative impact of AE on
strength and muscle mass. In fact, the combined training approach used in this
study could be prescribed if a rapid gain in muscle mass is the prime objective.
However, the serious athlete continuously needs to fine-tune key elements of
training and hence programme design, and refrain from excess training
stress/volume, to minimise the risk of incompatibility.
Given that concentric force was negatively impacted by aerobic training with no
adverse effect on muscle size, it must be that neural adaptations play a part in any
early interference effect. Future studies should address this issue in detail, along
with additional systematic research quantifying potential inhibitory or stimulatory
effects of AE on strength and power development resulting from RE training. Also,
novel paradigms designed to optimise adaptations to concurrent training should
be examined.

58
Figure 16. Hypothetical model describing adaptations to resistance (RE) training with or
without preceding aerobic exercise (AE). See text for details. I.R. denotes incomplete recovery.

59
ACKNOWLEDGEMENTS
The work carried out in this thesis was supported by grants from the Swedish National
Centre for Research in Sports (Centrum för idrottsforskning), the European Space
Agency (ESA), and the Swedish National Space Board (SNSB).
I would like to express my sincere gratitude to my main supervisor Per Tesch for
giving me the opportunity to study and learn from a world-renowned exercise
physiologist. Thank you for your guidance and encouraging support throughout my
studies. I also wish to thank my co-supervisor Ola Eiken for good advice and
constructive discussions.
A special thanks to my colleague, co-author and friend Rodrigo Fernandez-Gonzalo,
for your enormous help and support during these years. Your positive attitude was
immensely appreciated. Many thanks also to Thomas Gustafsson for welcoming me to
your lab, and for providing excellent support and technical knowledge.
Additionally, I would like to thank:
Lena Norrbrand and Anna Jansson, past members of the group. Thank you for your
enthusiastic support and positive attitude.
Sofie Åkerström, Paula Rodriguez Miguelez, Daniel Carlsson, Caroline Eriksson,
Marco Pozzo, Mikael Swarén, Glenn Björklund, Sven Asp, Fredrik Blomqvist,
Barbara Norman, Charlotte Schönbeck, Roberto Vargas-Paris, Hamid Pesaran, Maria
Pettersson, Per Stål and Anna-Karin Olofsson for skillful assistance in various aspects
of my thesis work, and Anki Englund, Maud Magnusson and Thomas Brännström for
administrative help.
Marie Alricsson, Todd Trappe and Eva Blomstrand, for constructive feedback during
seminars, and my co-authors Jessica Norrbom and Helene Fischer for great input to
my fourth paper.
All my colleagues at the Department of Health Sciences, especially Lina Johansson,
Kerry McGawley, Åsa Eklund, Louise Dovrén, Erik Andersson, Martina Höök, Ylva
Fjell, Marie Ohlsson, Maria Görlin, Malin Jonsson, Linda Näsström and Marko
Laaksonen, for the great atmosphere you created.
All current and past PhD students at the department, for being positive and supportive
at all times.
My colleagues at the Karolinska Institutet, Department of Physiology and
Pharmacology, and Department of Laboratory Medicine, especially Anna Strömberg,
Susanna Wallman-Appel, Maléne Lindholm, Eva-Karin Gidlund, Mia Ydfors, Mats
Lilja, Håkan Rundqvist, Eric Rullman, Karl Olsson and Seher Alam, for constructive
discussions and fun times both inside and outside the lab.
Finally, I extend my greatest appreciation to the subjects who took part in my studies.

60
REFERENCES
1. American College of Sports Medicine position stand. Progression models in resistance
training for healthy adults. Medicine and Science in Sports and Exercise 2009; 41:687-708.
2. Aagaard P, Andersen JL. Effects of strength training on endurance capacity in top-level
endurance athletes. Scandinavian Journal of Medicine & Science in Sports 2010; 20 Suppl
2:39-47.
3. Aagaard P, Andersen JL, Dyhre-Poulsen P, Leffers AM, Wagner A, Magnusson SP,
Halkjaer-Kristensen J, Simonsen EB. A mechanism for increased contractile strength of
human pennate muscle in response to strength training: changes in muscle architecture.
The Journal of Physiology 2001; 534:613-23.
4. Adams GR, Bamman MM. Characterization and regulation of mechanical loading-
induced compensatory muscle hypertrophy. Comprehensive Physiology 2012; 2:2829-70.
5. Adams GR, Hather BM, Baldwin KM, Dudley GA. Skeletal muscle myosin heavy chain
composition and resistance training. Journal of Applied Physiology 1993; 74:911-5.
6. Alkner BA, Tesch PA. Efficacy of a gravity-independent resistance exercise device as a
countermeasure to muscle atrophy during 29-day bed rest. Acta Physiologica
Scandinavica 2004; 181:345-57.
7. Allen DL, Roy RR, Edgerton VR. Myonuclear domains in muscle adaptation and
disease. Muscle & Nerve 1999; 22:1350-60.
8. Alway SE, MacDougall JD, Sale DG, Sutton JR, McComas AJ. Functional and structural
adaptations in skeletal muscle of trained athletes. Journal of Applied Physiology 1988;
64:1114-20.
9. Alway SE, Sale DG, MacDougall JD. Twitch contractile adaptations are not dependent
on the intensity of isometric exercise in the human triceps surae. European Journal of
Applied Physiology and Occupational Physiology 1990; 60:346-52.
10. Andersen P, Adams RP, Sjogaard G, Thorboe A, Saltin B. Dynamic knee extension as
model for study of isolated exercising muscle in humans. Journal of Applied Physiology
1985; 59:1647-53.
11. Andersen P, Henriksson J. Capillary supply of the quadriceps femoris muscle of man:
adaptive response to exercise. The Journal of Physiology 1977; 270:677-90.
12. Atherton PJ, Babraj J, Smith K, Singh J, Rennie MJ, Wackerhage H. Selective activation
of AMPK-PGC-1alpha or PKB-TSC2-mTOR signaling can explain specific adaptive
responses to endurance or resistance training-like electrical muscle stimulation. FASEB
Journal 2005; 19:786-8.
13. Atherton PJ, Smith K. Muscle protein synthesis in response to nutrition and exercise.
The Journal of Physiology 2012; 590:1049-57.
14. Baar K. Training for endurance and strength: lessons from cell signaling. Medicine and
Science in Sports and Exercise 2006; 38:1939-44.
15. Baar K, Esser K. Phosphorylation of p70(S6k) correlates with increased skeletal muscle
mass following resistance exercise. The American Journal of Physiology 1999; 276:C120-7.
16. Baar K, Wende AR, Jones TE, Marison M, Nolte LA, Chen M, Kelly DP, Holloszy JO.
Adaptations of skeletal muscle to exercise: rapid increase in the transcriptional
coactivator PGC-1. FASEB Journal 2002; 16:1879-86.

61
17. Bamman MM, Newcomer BR, Larson-Meyer DE, Weinsier RL, Hunter GR. Evaluation
of the strength-size relationship in vivo using various muscle size indices. Medicine and
Science in Sports and Exercise 2000; 32:1307-13.
18. Beattie K, Kenny IC, Lyons M, Carson BP. The effect of strength training on
performance in endurance athletes. Sports Medicine 2014; [Epub ahead of print].
19. Bell GJ, Petersen SR, Quinney HA, Wenger HA. Sequencing of endurance and high-
velocity strength training. Canadian Journal of Sport Sciences 1988; 13:214-9.
20. Bell GJ, Petersen SR, Wessel J, Bagnall K, Quinney HA. Adaptations to endurance and
low velocity resistance training performed in a sequence. Canadian Journal of Sport
Sciences 1991; 16:186-92.
21. Bentley DJ, Smith PA, Davie AJ, Zhou S. Muscle activation of the knee extensors
following high intensity endurance exercise in cyclists. European Journal of Applied
Physiology 2000; 81:297-302.
22. Berg HE, Tedner B, Tesch PA. Changes in lower limb muscle cross-sectional area and
tissue fluid volume after transition from standing to supine. Acta Physiologica
Scandinavica 1993; 148:379-85.
23. Berg HE, Tesch A. A gravity-independent ergometer to be used for resistance training
in space. Aviation, Space, and Environmental Medicine 1994; 65:752-6.
24. Bergstrom J. Muscle Electrolytes in Man. Scandinavian Journal of Clinical & Laboratory
Investigation 1962; 14:1-110.
25. Bodine SC. mTOR signaling and the molecular adaptation to resistance exercise.
Medicine and Science in Sports and Exercise 2006; 38:1950-7.
26. Bodine SC, Latres E, Baumhueter S, Lai VK, Nunez L, Clarke BA, Poueymirou WT,
Panaro FJ, Na E, Dharmarajan K, Pan ZQ, Valenzuela DM, DeChiara TM, Stitt TN,
Yancopoulos GD, Glass DJ. Identification of ubiquitin ligases required for skeletal
muscle atrophy. Science 2001; 294:1704-8.
27. Bodine SC, Stitt TN, Gonzalez M, Kline WO, Stover GL, Bauerlein R, Zlotchenko E,
Scrimgeour A, Lawrence JC, Glass DJ, Yancopoulos GD. Akt/mTOR pathway is a
crucial regulator of skeletal muscle hypertrophy and can prevent muscle atrophy in
vivo. Nature Cell Biology 2001; 3:1014-9.
28. Bolster DR, Crozier SJ, Kimball SR, Jefferson LS. AMP-activated protein kinase
suppresses protein synthesis in rat skeletal muscle through down-regulated
mammalian target of rapamycin (mTOR) signaling. The Journal of Biological Chemistry
2002; 277:23977-80.
29. Bolster DR, Kimball SR, Jefferson LS. Translational control mechanisms modulate
skeletal muscle gene expression during hypertrophy. Exercise and Sport Sciences Reviews
2003; 31:111-6.
30. Booth FW, Thomason DB. Molecular and cellular adaptation of muscle in response to
exercise: perspectives of various models. Physiological Reviews 1991; 71:541-85.
31. Borg GA. Psychophysical bases of perceived exertion. Medicine and Science in Sports and
Exercise 1982; 14:377-81.
32. Burd NA, Holwerda AM, Selby KC, West DW, Staples AW, Cain NE, Cashaback JG,
Potvin JR, Baker SK, Phillips SM. Resistance exercise volume affects myofibrillar
protein synthesis and anabolic signalling molecule phosphorylation in young men. The
Journal of Physiology 2010; 588:3119-30.

62
33. Burd NA, Mitchell CJ, Churchward-Venne TA, Phillips SM. Bigger weights may not
beget bigger muscles: evidence from acute muscle protein synthetic responses after
resistance exercise. Applied Physiology, Nutrition, and Metabolism 2012; 37:551-4.
34. Burd NA, West DW, Staples AW, Atherton PJ, Baker JM, Moore DR, Holwerda AM,
Parise G, Rennie MJ, Baker SK, Phillips SM. Low-load high volume resistance exercise
stimulates muscle protein synthesis more than high-load low volume resistance
exercise in young men. PLOS ONE 2010; 5:e12033
35. Cadore EL, Izquierdo M, Alberton CL, Pinto RS, Conceicao M, Cunha G, Radaelli R,
Bottaro M, Trindade GT, Kruel LF. Strength prior to endurance intra-session exercise
sequence optimizes neuromuscular and cardiovascular gains in elderly men.
Experimental Gerontology 2012; 47:164-9.
36. Camera DM, Edge J, Short MJ, Hawley JA, Coffey VG. Early time course of Akt
phosphorylation after endurance and resistance exercise. Medicine and Science in Sports
and Exercise 2010; 42:1843-52.
37. Camera DM, West DW, Burd NA, Phillips SM, Garnham AP, Hawley JA, Coffey VG.
Low muscle glycogen concentration does not suppress the anabolic response to
resistance exercise. Journal of Applied Physiology 2012; 113:206-14.
38. Carpinelli RN. Berger in retrospect: effect of varied weight training programmes on
strength. British Journal of Sports Medicine 2002; 36:319-24.
39. Carpinelli RN. The size principle and a critical analysis of the unsubstantiated heavier-
is-better recommendation for resistance training. Journal of Exercise Science & Fitness
2008; 6:67-86.
40. Carrithers JA, Carroll CC, Coker RH, Sullivan DH, Trappe TA. Concurrent exercise and
muscle protein synthesis: implications for exercise countermeasures in space. Aviation,
Space, and Environmental Medicine 2007; 78:457-62.
41. Chesley A, MacDougall JD, Tarnopolsky MA, Atkinson SA, Smith K. Changes in
human muscle protein synthesis after resistance exercise. Journal of Applied Physiology
1992; 73:1383-8.
42. Chtara M, Chaouachi A, Levin GT, Chaouachi M, Chamari K, Amri M, Laursen PB.
Effect of concurrent endurance and circuit resistance training sequence on muscular
strength and power development. Journal of Strength and Conditioning Research 2008;
22:1037-45.
43. Claassen H, Gerber C, Hoppeler H, Luthi JM, Vock P. Muscle filament spacing and
short-term heavy-resistance exercise in humans. The Journal of Physiology 1989; 409:491-
5.
44. Coffey VG, Hawley JA. The molecular bases of training adaptation. Sports Medicine
2007; 37:737-63.
45. Coffey VG, Moore DR, Burd NA, Rerecich T, Stellingwerff T, Garnham AP, Phillips SM,
Hawley JA. Nutrient provision increases signalling and protein synthesis in human
skeletal muscle after repeated sprints. European Journal of Applied Physiology 2011;
111:1473-83.
46. Coffey VG, Pilegaard H, Garnham AP, O'Brien BJ, Hawley JA. Consecutive bouts of
diverse contractile activity alter acute responses in human skeletal muscle. Journal of
Applied Physiology 2009; 106:1187-97.

63
47. Coffey VG, Shield A, Canny BJ, Carey KA, Cameron-Smith D, Hawley JA. Interaction of
contractile activity and training history on mRNA abundance in skeletal muscle from
trained athletes. American Journal of Physiology Endocrinology and Metabolism 2006;
290:E849-55.
48. Coffey VG, Zhong Z, Shield A, Canny BJ, Chibalin AV, Zierath JR, Hawley JA. Early
signaling responses to divergent exercise stimuli in skeletal muscle from well-trained
humans. FASEB Journal 2006; 20:190-2.
49. Collins MA, Snow TK. Are adaptations to combined endurance and strength training
affected by the sequence of training? Journal of Sports Sciences 1993; 11:485-91.
50. Craig BW, Lucas J, Pohlman R, Stelling H. The effects of running, weightlifting and a
combination of both on growth hormone release. Journal of Applied Sport Science Research
1991; 5:198-203.
51. Creer A, Gallagher P, Slivka D, Jemiolo B, Fink W, Trappe S. Influence of muscle
glycogen availability on ERK1/2 and Akt signaling after resistance exercise in human
skeletal muscle. Journal of Applied Physiology 2005; 99:950-6.
52. Crewther B, Keogh J, Cronin J, Cook C. Possible stimuli for strength and power
adaptation: acute hormonal responses. Sports Medicine 2006; 36:215-38.
53. Crossland H, Kazi AA, Lang CH, Timmons JA, Pierre P, Wilkinson DJ, Smith K,
Szewczyk NJ, Atherton PJ. Focal adhesion kinase is required for IGF-I-mediated growth
of skeletal muscle cells via a TSC2/mTOR/S6K1-associated pathway. American Journal of
Physiology Endocrinology and Metabolism 2013; 305:E183-93.
54. Cunha TF, Moreira JB, Paixao NA, Campos JC, Monteiro AW, Bacurau AV, Bueno CR,
Jr., Ferreira JC, Brum PC. Aerobic exercise training upregulates skeletal muscle calpain
and ubiquitin-proteasome systems in healthy mice. Journal of Applied Physiology 2012;
112:1839-46.
55. Curran-Everett D. Multiple comparisons: philosophies and illustrations. American
Journal of Physiology Regulatory, Integrative and Comparative Physiology 2000; 279:R1-8.
56. Davidsen PK, Gallagher IJ, Hartman JW, Tarnopolsky MA, Dela F, Helge JW, Timmons
JA, Phillips SM. High responders to resistance exercise training demonstrate differential
regulation of skeletal muscle microRNA expression. Journal of Applied Physiology 2011;
110:309-17.
57. Delorme TL, Schwab RS, Watkins AL. The response of the quadriceps femoris to
progressive-resistance exercises in poliomyelitic patients. The Journal of Bone and Joint
Surgery 1948; 30A:834-47.
58. Dolezal BA, Potteiger JA. Concurrent resistance and endurance training influence basal
metabolic rate in nondieting individuals. Journal of Applied Physiology 1998; 85:695-700.
59. Donges CE, Burd NA, Duffield R, Smith GC, West DW, Short MJ, Mackenzie R, Plank
LD, Shepherd PR, Phillips SM, Edge JA. Concurrent resistance and aerobic exercise
stimulates both myofibrillar and mitochondrial protein synthesis in sedentary middle-
aged men. Journal of Applied Physiology 2012; 112:1992-2001.
60. Dreyer HC, Fujita S, Cadenas JG, Chinkes DL, Volpi E, Rasmussen BB. Resistance
exercise increases AMPK activity and reduces 4E-BP1 phosphorylation and protein
synthesis in human skeletal muscle. The Journal of Physiology 2006; 576:613-24.
61. Drummond MJ, Fry CS, Glynn EL, Dreyer HC, Dhanani S, Timmerman KL, Volpi E,
Rasmussen BB. Rapamycin administration in humans blocks the contraction-induced
increase in skeletal muscle protein synthesis. The Journal of Physiology 2009; 587:1535-46.

64
62. Dudley GA, Djamil R. Incompatibility of endurance- and strength-training modes of
exercise. Journal of Applied Physiology 1985; 59:1446-51.
63. Dudley GA, Fleck SJ. Strength and endurance training. Are they mutually exclusive?
Sports Medicine 1987; 4:79-85.
64. Dudley GA, Tesch PA, Harris RT, Golden CL, Buchanan P. Influence of eccentric
actions on the metabolic cost of resistance exercise. Aviation, Space, and Environmental
Medicine 1991; 62:678-82.
65. Egan B, Zierath JR. Exercise metabolism and the molecular regulation of skeletal muscle
adaptation. Cell Metabolism 2013; 17:162-84.
66. Eisenberg B. Quantitative ultrastructure of mammalian skeletal muscle. In: Peachey L
(ed). Handbook of Physiology Section 10: Skeletal Muscle. Bethesda, Maryland, USA:
American Physiological Society, 1983:73-112.
67. Ekblom B. Effect of physical training on oxygen transport system in man. Acta
Physiologica Scandinavica (supplementum) 1968; 328:1-45.
68. Enoka RM. Neural adaptations with chronic physical activity. Journal of Biomechanics
1997; 30:447-55.
69. Essen-Gustavsson B, Tesch PA. Glycogen and triglyceride utilization in relation to
muscle metabolic characteristics in men performing heavy-resistance exercise. European
Journal of Applied Physiology and Occupational Physiology 1990; 61:5-10.
70. Fluck M, Carson JA, Gordon SE, Ziemiecki A, Booth FW. Focal adhesion proteins FAK
and paxillin increase in hypertrophied skeletal muscle. The American Journal of
Physiology 1999; 277:C152-62.
71. Fluck M, Hoppeler H. Molecular basis of skeletal muscle plasticity--from gene to form
and function. Reviews of Physiology, Biochemistry and Pharmacology 2003; 146:159-216.
72. Foley JM, Jayaraman RC, Prior BM, Pivarnik JM, Meyer RA. MR measurements of
muscle damage and adaptation after eccentric exercise. Journal of Applied Physiology
1999; 87:2311-8.
73. Folland JP, Williams AG. The adaptations to strength training: morphological and
neurological contributions to increased strength. Sports Medicine 2007; 37:145-68.
74. Friedmann-Bette B, Bauer T, Kinscherf R, Vorwald S, Klute K, Bischoff D, Muller H,
Weber MA, Metz J, Kauczor HU, Bartsch P, Billeter R. Effects of strength training with
eccentric overload on muscle adaptation in male athletes. European Journal of Applied
Physiology 2010; 108:821-36.
75. Gettman LR, Ward P, Hagan RD. A comparison of combined running and weight
training with circuit weight training. Medicine and Science in Sports and Exercise 1982;
14:229-34.
76. Glass DJ. Skeletal muscle hypertrophy and atrophy signaling pathways. The
International Journal of Biochemistry & Cell Biology 2005; 37:1974-84.
77. Glowacki SP, Martin SE, Maurer A, Baek W, Green JS, Crouse SF. Effects of resistance,
endurance, and concurrent exercise on training outcomes in men. Medicine and Science
in Sports and Exercise 2004; 36:2119-27.
78. Gollnick PD, Armstrong RB, Saltin B, Saubert CWT, Sembrowich WL, Shepherd RE.
Effect of training on enzyme activity and fiber composition of human skeletal muscle.
Journal of Applied Physiology 1973; 34:107-11.
79. Gollnick PD, King DW. Effect of exercise and training on mitochondria of rat skeletal
muscle. The American Journal of Physiology 1969; 216:1502-9.

65
80. Gordon SE, Fluck M, Booth FW. Selected Contribution: Skeletal muscle focal adhesion
kinase, paxillin, and serum response factor are loading dependent. Journal of Applied
Physiology 2001; 90:1174-83.
81. Gravelle BL, Blessing DL. Physiological adaptation in women concurrently training for
strength and endurance. Journal of Strength and Conditioning Research 2000; 14:5-13.
82. Gustafsson T. Vascular remodelling in human skeletal muscle. Biochemical Society
Transactions 2011; 39:1628-32.
83. Gustafsson T, Puntschart A, Kaijser L, Jansson E, Sundberg CJ. Exercise-induced
expression of angiogenesis-related transcription and growth factors in human skeletal
muscle. The American Journal of Physiology 1999; 276:H679-85.
84. Gustafsson T, Sundberg CJ. Expression of angiogenic growth factors in human skeletal
muscle in response to a singular bout of exercise. American Journal of Physiology Heart
and Circulatory Physiology 2000; 279:H3144-5.
85. Haddad F, Baldwin KM, Tesch PA. Pretranslational markers of contractile protein
expression in human skeletal muscle: effect of limb unloading plus resistance exercise.
Journal of Applied Physiology 2005; 98:46-52.
86. Hakkinen K, Alen M, Kraemer WJ, Gorostiaga E, Izquierdo M, Rusko H, Mikkola J,
Hakkinen A, Valkeinen H, Kaarakainen E, Romu S, Erola V, Ahtiainen J, Paavolainen L.
Neuromuscular adaptations during concurrent strength and endurance training versus
strength training. European Journal of Applied Physiology 2003; 89:42-52.
87. Hakkinen K, Komi PV. Changes in neuromuscular performance in voluntary and reflex
contraction during strength training in man. International Journal of Sports Medicine 1983;
4:282-8.
88. Hamilton DL, McKenzie MG, Baar K. Molecular mechanisms of muscle hypertrophy.
In: Magalhães J and Ascensão A (eds). Muscle Plasticity – Advances in Biochemical and
Physiological Research. Kerala, India: Research Signpost, 2009: 45-93.
89. Harber MP, Konopka AR, Jemiolo B, Trappe SW, Trappe TA, Reidy PT. Muscle protein
synthesis and gene expression during recovery from aerobic exercise in the fasted and
fed states. American Journal of Physiology Regulatory, Integrative and Comparative
Physiology 2010; 299:R1254-62.
90. Hawley JA. Adaptations of skeletal muscle to prolonged, intense endurance training.
Clinical and Experimental Pharmacology and Physiology 2002; 29:218-22.
91. Hawley JA. Molecular responses to strength and endurance training: are they
incompatible? Applied Physiology, Nutrition, and Metabolism 2009; 34:355-61.
92. Hawley JA, Burke LM, Phillips SM, Spriet LL. Nutritional modulation of training-
induced skeletal muscle adaptations. Journal of Applied Physiology 2011; 110:834-45.
93. Henneman E, Somjen G, Carpenter DO. Excitability and inhibitability of motoneurons
of different sizes. Journal of Neurophysiology 1965; 28:599-620.
94. Hickson RC. Interference of strength development by simultaneously training for
strength and endurance. European Journal of Applied Physiology and Occupational
Physiology 1980; 45:255-63.
95. Hitachi K, Tsuchida K. Role of microRNAs in skeletal muscle hypertrophy. Frontiers in
Physiology 2013; 4:408.
96. Holloszy JO. Adaptation of skeletal muscle to endurance exercise. Medicine and Science
in Sports 1975; 7:155-64.

66
97. Holloszy JO. Biochemical adaptations in muscle. Effects of exercise on mitochondrial
oxygen uptake and respiratory enzyme activity in skeletal muscle. The Journal of
Biological Chemistry 1967; 242:2278-82.
98. Holm L, Reitelseder S, Pedersen TG, Doessing S, Petersen SG, Flyvbjerg A, Andersen
JL, Aagaard P, Kjaer M. Changes in muscle size and MHC composition in response to
resistance exercise with heavy and light loading intensity. Journal of Applied Physiology
2008; 105:1454-61.
99. Hoppeler H. Exercise-induced ultrastructural changes in skeletal muscle. International
Journal of Sports Medicine 1986; 7:187-204.
100. Hoppeler H, Howald H, Conley K, Lindstedt SL, Claassen H, Vock P, Weibel ER.
Endurance training in humans: aerobic capacity and structure of skeletal muscle.
Journal of Applied Physiology 1985; 59:320-7.
101. Hornberger TA, Sukhija KB, Chien S. Regulation of mTOR by mechanically induced
signaling events in skeletal muscle. Cell Cycle 2006; 5:1391-6.
102. Howald H, Hoppeler H, Claassen H, Mathieu O, Straub R. Influences of endurance
training on the ultrastructural composition of the different muscle fiber types in
humans. Pflugers Archiv: European Journal of Physiology 1985; 403:369-76.
103. Hunter G, Demment R, Miller D. Development of strength and maximum oxygen
uptake during simultaneous training for strength and endurance. The Journal of Sports
Medicine and Physical Fitness 1987; 27:269-75.
104. Hwee DT, Baehr LM, Philp A, Baar K, Bodine SC. Maintenance of muscle mass and
load-induced growth in Muscle RING Finger 1 null mice with age. Aging Cell 2014;
13:92-101.
105. Inoki K, Zhu T, Guan KL. TSC2 mediates cellular energy response to control cell growth
and survival. Cell 2003; 115:577-90.
106. Irrcher I, Adhihetty PJ, Joseph AM, Ljubicic V, Hood DA. Regulation of mitochondrial
biogenesis in muscle by endurance exercise. Sports Medicine 2003; 33:783-93.
107. Izquierdo M, Hakkinen K, Ibanez J, Kraemer WJ, Gorostiaga EM. Effects of combined
resistance and cardiovascular training on strength, power, muscle cross-sectional area,
and endurance markers in middle-aged men. European Journal of Applied Physiology
2005; 94:70-5.
108. Jacobs I, Kaiser P, Tesch P. Muscle strength and fatigue after selective glycogen
depletion in human skeletal muscle fibers. European Journal of Applied Physiology and
Occupational Physiology 1981; 46:47-53.
109. Jones SW, Hill RJ, Krasney PA, O'Conner B, Peirce N, Greenhaff PL. Disuse atrophy
and exercise rehabilitation in humans profoundly affects the expression of genes
associated with the regulation of skeletal muscle mass. FASEB Journal 2004; 18:1025-7.
110. Kadi F, Eriksson A, Holmner S, Butler-Browne GS, Thornell LE. Cellular adaptation of
the trapezius muscle in strength-trained athletes. Histochemistry and Cell Biology 1999;
111:189-95.
111. Kadi F, Schjerling P, Andersen LL, Charifi N, Madsen JL, Christensen LR, Andersen JL.
The effects of heavy resistance training and detraining on satellite cells in human
skeletal muscles. The Journal of Physiology 2004; 558:1005-12.
112. Kadi F, Thornell LE. Concomitant increases in myonuclear and satellite cell content in
female trapezius muscle following strength training. Histochemistry and Cell Biology
2000; 113:99-103.

67
113. Karagounis LG, Yaspelkis BB, Reeder DW, Lancaster GI, Hawley JA, Coffey VG.
Contraction-induced changes in TNFalpha and Akt-mediated signalling are associated
with increased myofibrillar protein in rat skeletal muscle. European Journal of Applied
Physiology 2010; 109:839-48.
114. Katch VL, Katch FI, Moffatt R, Gittleson M. Muscular development and lean body
weight in body builders and weight lifters. Medicine and Science in Sports and Exercise
1980; 12:340-4.
115. Keller P, Vollaard NB, Gustafsson T, Gallagher IJ, Sundberg CJ, Rankinen T, Britton SL,
Bouchard C, Koch LG, Timmons JA. A transcriptional map of the impact of endurance
exercise training on skeletal muscle phenotype. Journal of Applied Physiology 2011;
110:46-59.
116. Kim PL, Staron RS, Phillips SM. Fasted-state skeletal muscle protein synthesis after
resistance exercise is altered with training. The Journal of Physiology 2005; 568:283-90.
117. Kirby TJ, McCarthy JJ. MicroRNAs in skeletal muscle biology and exercise adaptation.
Free Radical Biology & Medicine 2013; 64:95-105.
118. Klausen K, Andersen LB, Pelle I. Adaptive changes in work capacity, skeletal muscle
capillarization and enzyme levels during training and detraining. Acta Physiologica
Scandinavica 1981; 113:9-16.
119. Klausen K, Secher NH, Clausen JP, Hartling O, Trap-Jensen J. Central and regional
circulatory adaptations to one-leg training. Journal of Applied Physiology 1982; 52:976-83.
120. Komi PV, Viitasalo JT. Changes in motor unit activity and metabolism in human
skeletal muscle during and after repeated eccentric and concentric contractions. Acta
Physiologica Scandinavica 1977; 100:246-54.
121. Konopka AR, Douglass MD, Kaminsky LA, Jemiolo B, Trappe TA, Trappe S, Harber
MP. Molecular adaptations to aerobic exercise training in skeletal muscle of older
women. The Journals of Gerontology 2010; 65:1201-7.
122. Konopka AR, Harber MP. Skeletal muscle hypertrophy after aerobic exercise training.
Exercise and Sport Sciences Reviews 2014; [Epub ahead of print].
123. Kraemer WJ, Patton JF, Gordon SE, Harman EA, Deschenes MR, Reynolds K, Newton
RU, Triplett NT, Dziados JE. Compatibility of high-intensity strength and endurance
training on hormonal and skeletal muscle adaptations. Journal of Applied Physiology
1995; 78:976-89.
124. Kraemer WJ, Ratamess NA. Hormonal responses and adaptations to resistance exercise
and training. Sports Medicine 2005; 35:339-61.
125. Kumar V, Atherton P, Smith K, Rennie MJ. Human muscle protein synthesis and
breakdown during and after exercise. Journal of Applied Physiology 2009; 106:2026-39.
126. Lamon S, Wallace MA, Russell AP. The STARS signaling pathway: a key regulator of
skeletal muscle function. Pflugers Archiv: European Journal of Physiology 2014; [Epub
ahead of print].
127. Lee JD, Burd NA. No role of muscle satellite cells in hypertrophy: further evidence of a
mistaken identity? The Journal of Physiology 2012; 590:2837-8.
128. Leger B, Cartoni R, Praz M, Lamon S, Deriaz O, Crettenand A, Gobelet C, Rohmer P,
Konzelmann M, Luthi F, Russell AP. Akt signalling through GSK-3beta, mTOR and
Foxo1 is involved in human skeletal muscle hypertrophy and atrophy. The Journal of
Physiology 2006; 576:923-33.

68
129. Leveritt M, Abernethy PJ. Acute effects of high-intensity endurance exercise on
subsequent resistance activity. Journal of Strength and Conditioning Research 1999; 13:47-
51.
130. Leveritt M, Abernethy PJ, Barry B, Logan PA. Concurrent strength and endurance
training: the influence of dependent variable selection. Journal of Strength and
Conditioning Research 2003; 17:503-8.
131. Leveritt M, Abernethy PJ, Barry BK, Logan PA. Concurrent strength and endurance
training. A review. Sports Medicine 1999; 28:413-27.
132. Lin J, Handschin C, Spiegelman BM. Metabolic control through the PGC-1 family of
transcription coactivators. Cell Metabolism 2005; 1:361-70.
133. Livak KJ, Schmittgen TD. Analysis of relative gene expression data using real-time
quantitative PCR and the 2(-Delta Delta C(T)) method. Methods 2001; 25:402-8.
134. Louis E, Raue U, Yang Y, Jemiolo B, Trappe S. Time course of proteolytic, cytokine, and
myostatin gene expression after acute exercise in human skeletal muscle. Journal of
Applied Physiology 2007; 103:1744-51.
135. Lowry OH, Passonneau JV. A Flexible System of Enzymatic Analysis. New York, USA:
Academic Press, 1972.
136. Luthi JM, Howald H, Claassen H, Rosler K, Vock P, Hoppeler H. Structural changes in
skeletal muscle tissue with heavy-resistance exercise. International Journal of Sports
Medicine 1986; 7:123-7.
137. MacDougall JD. Hypertrophy and hyperplasia. In: Komi P (ed). Strength and Power in
Sport. Oxford, UK: Blackwell Science, 2003:252-64.
138. Mascher H, Andersson H, Nilsson PA, Ekblom B, Blomstrand E. Changes in signalling
pathways regulating protein synthesis in human muscle in the recovery period after
endurance exercise. Acta Physiologica 2007; 191:67-75.
139. Mascher H, Tannerstedt J, Brink-Elfegoun T, Ekblom B, Gustafsson T, Blomstrand E.
Repeated resistance exercise training induces different changes in mRNA expression of
MAFbx and MuRF-1 in human skeletal muscle. American Journal of Physiology
Endocrinology and Metabolism 2008; 294:E43-51.
140. Mayhew DL, Kim JS, Cross JM, Ferrando AA, Bamman MM. Translational signaling
responses preceding resistance training-mediated myofiber hypertrophy in young and
old humans. Journal of Applied Physiology 2009; 107:1655-62.
141. McCarthy JJ, Mula J, Miyazaki M, Erfani R, Garrison K, Farooqui AB, Srikuea R,
Lawson BA, Grimes B, Keller C, Van Zant G, Campbell KS, Esser KA, Dupont-
Versteegden EE, Peterson CA. Effective fiber hypertrophy in satellite cell-depleted
skeletal muscle. Development 2011; 138:3657-66.
142. McCarthy JP, Agre JC, Graf BK, Pozniak MA, Vailas AC. Compatibility of adaptive
responses with combining strength and endurance training. Medicine and Science in
Sports and Exercise 1995; 27:429-36.
143. McCarthy JP, Pozniak MA, Agre JC. Neuromuscular adaptations to concurrent strength
and endurance training. Medicine and Science in Sports and Exercise 2002; 34:511-9.
144. McConell GK, Lee-Young RS, Chen ZP, Stepto NK, Huynh NN, Stephens TJ, Canny BJ,
Kemp BE. Short-term exercise training in humans reduces AMPK signalling during
prolonged exercise independent of muscle glycogen. The Journal of Physiology 2005;
568:665-76.

69
145. McPherron AC, Lee SJ. Double muscling in cattle due to mutations in the myostatin
gene. Proceedings of the National Academy of Sciences of the United States of America 1997;
94:12457-61.
146. Meyer RA, Prior BM. Functional magnetic resonance imaging of muscle. Exercise and
Sport Sciences Reviews 2000; 28:89-92.
147. Mikkola J, Rusko H, Izquierdo M, Gorostiaga EM, Hakkinen K. Neuromuscular and
cardiovascular adaptations during concurrent strength and endurance training in
untrained men. International Journal of Sports Medicine 2012; 33:702-10.
148. Miller BF, Olesen JL, Hansen M, Dossing S, Crameri RM, Welling RJ, Langberg H,
Flyvbjerg A, Kjaer M, Babraj JA, Smith K, Rennie MJ. Coordinated collagen and muscle
protein synthesis in human patella tendon and quadriceps muscle after exercise. The
Journal of Physiology 2005; 567:1021-33.
149. Mitchell CJ, Churchward-Venne TA, Bellamy L, Parise G, Baker SK, Phillips SM.
Muscular and systemic correlates of resistance training-induced muscle hypertrophy.
PLOS ONE 2013; 8:e78636.
150. Mitchell CJ, Churchward-Venne TA, West DW, Burd NA, Breen L, Baker SK, Phillips
SM. Resistance exercise load does not determine training-mediated hypertrophic gains
in young men. Journal of Applied Physiology 2012; 113:71-7.
151. Miyazaki M, Esser KA. Cellular mechanisms regulating protein synthesis and skeletal
muscle hypertrophy in animals. Journal of Applied Physiology 2009; 106:1367-73.
152. Moritani T, deVries HA. Neural factors versus hypertrophy in the time course of
muscle strength gain. American Journal of Physical Medicine 1979; 58:115-30.
153. Mourtzakis M, Gonzalez-Alonso J, Graham TE, Saltin B. Hemodynamics and O2 uptake
during maximal knee extensor exercise in untrained and trained human quadriceps
muscle: effects of hyperoxia. Journal of Applied Physiology 2004; 97:1796-802.
154. Munn J, Herbert RD, Gandevia SC. Contralateral effects of unilateral resistance training:
a meta-analysis. Journal of Applied Physiology 2004; 96:1861-6.
155. Nader GA. Concurrent strength and endurance training: from molecules to man.
Medicine and Science in Sports and Exercise 2006; 38:1965-70.
156. Nader GA, Esser KA. Intracellular signaling specificity in skeletal muscle in response to
different modes of exercise. Journal of Applied Physiology 2001; 90:1936-42.
157. Nakashima K, Yakabe Y. AMPK activation stimulates myofibrillar protein degradation
and expression of atrophy-related ubiquitin ligases by increasing FOXO transcription
factors in C2C12 myotubes. Bioscience, Biotechnology and Biochemistry 2007; 71:1650-6.
158. Narici MV, Roi GS, Landoni L, Minetti AE, Cerretelli P. Changes in force, cross-
sectional area and neural activation during strength training and detraining of the
human quadriceps. European Journal of Applied Physiology and Occupational Physiology
1989; 59:310-9.
159. Nelson AG, Arnall DA, Loy SF, Silvester LJ, Conlee RK. Consequences of combining
strength and endurance training regimens. Physical Therapy 1990; 70:287-94.
160. Nielsen JL, Aagaard P, Bech RD, Nygaard T, Hvid LG, Wernbom M, Suetta C, Frandsen
U. Proliferation of myogenic stem cells in human skeletal muscle in response to low-
load resistance training with blood flow restriction. The Journal of Physiology 2012;
590:4351-61.
161. Norrbom J, Sundberg CJ, Ameln H, Kraus WE, Jansson E, Gustafsson T. PGC-1alpha
mRNA expression is influenced by metabolic perturbation in exercising human skeletal
muscle. Journal of Applied Physiology 2004; 96:189-94.

70
162. Norrbrand L, Fluckey JD, Pozzo M, Tesch PA. Resistance training using eccentric
overload induces early adaptations in skeletal muscle size. European Journal of Applied
Physiology 2008; 102:271-81.
163. Olfert IM, Howlett RA, Tang K, Dalton ND, Gu Y, Peterson KL, Wagner PD, Breen EC.
Muscle-specific VEGF deficiency greatly reduces exercise endurance in mice. The
Journal of Physiology 2009; 587:1755-67.
164. Olfert IM, Howlett RA, Wagner PD, Breen EC. Myocyte vascular endothelial growth
factor is required for exercise-induced skeletal muscle angiogenesis. American Journal of
Physiology Regulatory, Integrative and Comparative Physiology 2010; 299:R1059-67.
165. Oliveira Ade S, Caputo F, Goncalves M, Denadai BS. Heavy-intensity aerobic exercise
affects the isokinetic torque and functional but not conventional hamstrings:quadriceps
ratios. Journal of Electromyography and Kinesiology 2009; 19:1079-84.
166. Patten C, Meyer RA, Fleckenstein JL. T2 mapping of muscle. Seminars in Musculoskeletal
Radiology 2003; 7:297-305.
167. Perry CG, Lally J, Holloway GP, Heigenhauser GJ, Bonen A, Spriet LL. Repeated
transient mRNA bursts precede increases in transcriptional and mitochondrial proteins
during training in human skeletal muscle. The Journal of Physiology 2010; 588:4795-810.
168. Petrella JK, Kim JS, Mayhew DL, Cross JM, Bamman MM. Potent myofiber hypertrophy
during resistance training in humans is associated with satellite cell-mediated
myonuclear addition: a cluster analysis. Journal of Applied Physiology 2008; 104:1736-42.
169. Phillips BE, Williams JP, Gustafsson T, Bouchard C, Rankinen T, Knudsen S, Smith K,
Timmons JA, Atherton PJ. Molecular networks of human muscle adaptation to exercise
and age. PLOS Genetics 2013; 9:e1003389.
170. Phillips SM, Tipton KD, Aarsland A, Wolf SE, Wolfe RR. Mixed muscle protein
synthesis and breakdown after resistance exercise in humans. The American Journal of
Physiology 1997; 273:E99-107.
171. Pilegaard H, Saltin B, Neufer PD. Exercise induces transient transcriptional activation of
the PGC-1alpha gene in human skeletal muscle. The Journal of Physiology 2003; 546:851-
8.
172. Puigserver P, Spiegelman BM. Peroxisome proliferator-activated receptor-gamma
coactivator 1 alpha (PGC-1 alpha): transcriptional coactivator and metabolic regulator.
Endocrine Reviews 2003; 24:78-90.
173. Putman CT, Xu X, Gillies E, MacLean IM, Bell GJ. Effects of strength, endurance and
combined training on myosin heavy chain content and fibre-type distribution in
humans. European Journal of Applied Physiology 2004; 92:376-84.
174. Raue U, Trappe TA, Estrem ST, Qian HR, Helvering LM, Smith RC, Trappe S.
Transcriptome signature of resistance exercise adaptations: mixed muscle and fiber
type specific profiles in young and old adults. Journal of Applied Physiology 2012;
112:1625-36.
175. Reisz-Porszasz S, Bhasin S, Artaza JN, Shen R, Sinha-Hikim I, Hogue A, Fielder TJ,
Gonzalez-Cadavid NF. Lower skeletal muscle mass in male transgenic mice with
muscle-specific overexpression of myostatin. American Journal of Physiology
Endocrinology and Metabolism 2003; 285:E876-88.
176. Richardson RS, Wagner H, Mudaliar SR, Saucedo E, Henry R, Wagner PD. Exercise
adaptation attenuates VEGF gene expression in human skeletal muscle. American
Journal of Physiology Heart and Circulatory Physiology 2000; 279:H772-8.

71
177. Ruas JL, White JP, Rao RR, Kleiner S, Brannan KT, Harrison BC, Greene NP, Wu J,
Estall JL, Irving BA, Lanza IR, Rasbach KA, Okutsu M, Nair KS, Yan Z, Leinwand LA,
Spiegelman BM. A PGC-1alpha isoform induced by resistance training regulates
skeletal muscle hypertrophy. Cell 2012; 151:1319-31.
178. Sale DG. Neural adaptation to resistance training. Medicine and Science in Sports and
Exercise 1988; 20:S135-45.
179. Sale DG, Jacobs I, MacDougall JD, Garner S. Comparison of two regimens of concurrent
strength and endurance training. Medicine and Science in Sports and Exercise 1990; 22:348-
56.
180. Saltin B, Astrand PO. Maximal oxygen uptake in athletes. Journal of Applied Physiology
1967; 23:353-8.
181. Saltin B, Gollnick P. Skeletal muscle adaptability: significance for metabolism and
performance. In: Peachey L, ed. Handbook of Physiology Section 10: Skeletal Muscle.
Bethesda, Maryland, USA: American Physiological Society, 1983:555-632.
182. Santtila M, Kyrolainen H, Hakkinen K. Changes in maximal and explosive strength,
electromyography, and muscle thickness of lower and upper extremities induced by
combined strength and endurance training in soldiers. Journal of Strength and
Conditioning Research 2009; 23:1300-8.
183. Schantz P. Capillary supply in hypertrophied human skeletal muscle. Acta Physiologica
Scandinavica 1982; 114:635-7.
184. Schuelke M, Wagner KR, Stolz LE, Hubner C, Riebel T, Komen W, Braun T, Tobin JF,
Lee SJ. Myostatin mutation associated with gross muscle hypertrophy in a child. The
New England Journal of Medicine 2004; 350:2682-8.
185. Shaw BS, Shaw I, Brown GA. Comparison of resistance and concurrent resistance and
endurance training regimes in the development of strength. Journal of Strength and
Conditioning Research 2009; 23:2507-14.
186. Sheffield-Moore M, Yeckel CW, Volpi E, Wolf SE, Morio B, Chinkes DL, Paddon-Jones
D, Wolfe RR. Postexercise protein metabolism in older and younger men following
moderate-intensity aerobic exercise. American Journal of Physiology Endocrinology and
Metabolism 2004; 287:E513-22.
187. Spangenburg EE, Le Roith D, Ward CW, Bodine SC. A functional insulin-like growth
factor receptor is not necessary for load-induced skeletal muscle hypertrophy. The
Journal of Physiology 2008; 586:283-91.
188. Spivey NJ. The Ancient Olympics. Oxford, UK: Oxford University Press, 2004.
189. Staron RS, Malicky ES, Leonardi MJ, Falkel JE, Hagerman FC, Dudley GA. Muscle
hypertrophy and fast fiber type conversions in heavy resistance-trained women.
European Journal of Applied Physiology and Occupational Physiology 1990; 60:71-9.
190. Stepto NK, Coffey VG, Carey AL, Ponnampalam AP, Canny BJ, Powell D, Hawley JA.
Global gene expression in skeletal muscle from well-trained strength and endurance
athletes. Medicine and Science in Sports and Exercise 2009; 41:546-65.
191. Tang JE, Perco JG, Moore DR, Wilkinson SB, Phillips SM. Resistance training alters the
response of fed state mixed muscle protein synthesis in young men. American Journal of
Physiology Regulatory, Integrative and Comparative Physiology 2008; 294:R172-8.
192. Terzis G, Georgiadis G, Stratakos G, Vogiatzis I, Kavouras S, Manta P, Mascher H,
Blomstrand E. Resistance exercise-induced increase in muscle mass correlates with
p70S6 kinase phosphorylation in human subjects. European Journal of Applied Physiology
2008; 102:145-52.

72
193. Tesch PA. Skeletal muscle adaptations consequent to long-term heavy resistance
exercise. Medicine and Science in Sports and Exercise 1988; 20:S132-4.
194. Tesch PA, Colliander EB, Kaiser P. Muscle metabolism during intense, heavy-resistance
exercise. European Journal of Applied Physiology and Occupational Physiology 1986; 55:362-
6.
195. Tesch PA, Ekberg A, Lindquist DM, Trieschmann JT. Muscle hypertrophy following 5-
week resistance training using a non-gravity-dependent exercise system. Acta
Physiologica Scandinavica 2004; 180:89-98.
196. Tesch PA, Larsson L. Muscle hypertrophy in bodybuilders. European Journal of Applied
Physiology and Occupational Physiology 1982; 49:301-6.
197. Tesch PA, Thorsson A, Essen-Gustavsson B. Enzyme activities of FT and ST muscle
fibers in heavy-resistance trained athletes. Journal of Applied Physiology 1989; 67:83-7.
198. Tesch PA, Ploutz-Snyder LL, Yström L, Castro MJ, Dudley GA. Skeletal muscle
glycogen loss evoked by resistance exercise. Journal of Strength and Conditioning Research
1998; 12:67-73.
199. Thomson DM, Fick CA, Gordon SE. AMPK activation attenuates S6K1, 4E-BP1, and
eEF2 signaling responses to high-frequency electrically stimulated skeletal muscle
contractions. Journal of Applied Physiology 2008; 104:625-32.
200. Thorstensson. Muscle strength, fibre types and enzyme activities in man. Acta
Physiologica Scandinavica (supplementum) 1976; 443:1-45.
201. Timmons JA. Variability in training-induced skeletal muscle adaptation. Journal of
Applied Physiology 2011; 110:846-53.
202. Wang Q, McPherron AC. Myostatin inhibition induces muscle fibre hypertrophy prior
to satellite cell activation. The Journal of Physiology 2012; 590:2151-65.
203. Wang X, Devaiah SP, Zhang W, Welti R. Signaling functions of phosphatidic acid.
Progress in Lipid Research 2006; 45:250-78.
204. Welle S, Burgess K, Mehta S. Stimulation of skeletal muscle myofibrillar protein
synthesis, p70 S6 kinase phosphorylation, and ribosomal protein S6 phosphorylation by
inhibition of myostatin in mature mice. American Journal of Physiology Endocrinology and
Metabolism 2009; 296:E567-72.
205. West DW, Burd NA, Staples AW, Phillips SM. Human exercise-mediated skeletal
muscle hypertrophy is an intrinsic process. The International Journal of Biochemistry &
Cell Biology 2010; 42:1371-5.
206. West DW, Kujbida GW, Moore DR, Atherton P, Burd NA, Padzik JP, De Lisio M, Tang
JE, Parise G, Rennie MJ, Baker SK, Phillips SM. Resistance exercise-induced increases in
putative anabolic hormones do not enhance muscle protein synthesis or intracellular
signalling in young men. The Journal of Physiology 2009; 587:5239-47.
207. White TP, Esser KA. Satellite cell and growth factor involvement in skeletal muscle
growth. Medicine and Science in Sports and Exercise 1989; 21:S158-63.
208. Wilkinson SB, Phillips SM, Atherton PJ, Patel R, Yarasheski KE, Tarnopolsky MA,
Rennie MJ. Differential effects of resistance and endurance exercise in the fed state on
signalling molecule phosphorylation and protein synthesis in human muscle. The
Journal of Physiology 2008; 586:3701-17.
209. Wilkinson SB, Tarnopolsky MA, Grant EJ, Correia CE, Phillips SM. Hypertrophy with
unilateral resistance exercise occurs without increases in endogenous anabolic hormone
concentration. European Journal of Applied Physiology 2006; 98:546-55.

73
210. Wilson JM, Marin PJ, Rhea MR, Wilson SM, Loenneke JP, Anderson JC. Concurrent
training: a meta-analysis examining interference of aerobic and resistance exercises.
Journal of Strength and Conditioning Research 2012; 26:2293-307.
211. Wong TS, Booth FW. Protein metabolism in rat gastrocnemius muscle after stimulated
chronic concentric exercise. Journal of Applied Physiology 1990; 69:1709-17.
212. Yan Z, Okutsu M, Akhtar YN, Lira VA. Regulation of exercise-induced fiber type
transformation, mitochondrial biogenesis, and angiogenesis in skeletal muscle. Journal
of Applied Physiology 2011; 110:264-74.
213. Yang Y, Creer A, Jemiolo B, Trappe S. Time course of myogenic and metabolic gene
expression in response to acute exercise in human skeletal muscle. Journal of Applied
Physiology 2005; 98:1745-52.
214. Yang Y, Jemiolo B, Trappe S. Proteolytic mRNA expression in response to acute
resistance exercise in human single skeletal muscle fibers. Journal of Applied Physiology
2006; 101:1442-50.
215. Ydfors M, Fischer H, Mascher H, Blomstrand E, Norrbom J, Gustafsson T. The
truncated splice variants, NT-PGC-1a and PGC-1a4, increase with both endurance and
resistance exercise in human skeletal muscle. Physiological Reports 2013; 1:e00140.
216. You JS, Lincoln HC, Kim CR, Frey JW, Goodman CA, Zhong XP, Hornberger TA. The
role of diacylglycerol kinase zeta and phosphatidic acid in the mechanical activation of
mammalian target of rapamycin (mTOR) signaling and skeletal muscle hypertrophy.
The Journal of Biological Chemistry 2014; 289:1551-63.
217. Zanchi NE, Lancha AH, Jr. Mechanical stimuli of skeletal muscle: implications on
mTOR/p70s6k and protein synthesis. European Journal of Applied Physiology 2008;
102:253-63.
218. Zhang Y, Huypens P, Adamson AW, Chang JS, Henagan TM, Boudreau A, Lenard NR,
Burk D, Klein J, Perwitz N, Shin J, Fasshauer M, Kralli A, Gettys TW. Alternative
mRNA splicing produces a novel biologically active short isoform of PGC-1alpha. The
Journal of Biological Chemistry 2009; 284:32813-26.