the effects of a repeated readings … · the effects of a repeated readings instructional package...
TRANSCRIPT

THE EFFECTS OF A REPEATED READINGS INSTRUCTIONAL PACKAGE ON THE
FLUENCY AND COMPREHENSION OF ELEMENTARY STUDENTS WITH MILD
INTELLECTUAL DISABILITIES
by
Whitney D. Strickland
(Under the Direction of Richard T. Boon)
ABSTRACT
The purpose of this study was to examine the efficacy of repeated reading on the reading fluency
and comprehension of three elementary-age students with intellectual disabilities. A multiple
probe across participants design (Tawney & Gast, 1984) was utilized. During baseline, the
researcher recorded the correct words per minute, errors per minute, and percentage of
comprehension questions answered correctly during single readings of passages without error
correction. During the intervention phase, students read each passage three times while the
researcher delivered error correction. Correct words per minute, errors per minute, and
percentage of comprehension questions answered correctly were noted for the third and final
reading of the passage. Finally, a week after meeting the established criteria for mastery, the
students entered into the maintenance phase during which baseline procedures were replicated.
After the conclusion of the study, social validity was measured through student responses to
questions presented by the researcher. Results indicate that the intervention increased the oral
reading fluency of all three participants. There was not enough evidence to indicate a functional

relationship between the intervention and reading comprehension of elementary-age students
with intellectual disabilities. Limitations of the study, practical considerations for both special
and general education classroom teachers, and future research questions are discussed.
INDEX WORDS: Repeated Reading, Error Correction, Reading Fluency, Reading
Comprehension, Elementary-Age, Autism, Developmental Disabilities,
and Intellectual Disabilities

THE EFFECTS OF A REPEATED READINGS INSTRUCTIONAL PACKAGE ON THE
FLUENCY AND COMPREHENSION OF ELEMENTARY STUDENTS WITH MILD
INTELLECTUAL DISABILITIES
by
WHITNEY D. STRICKLAND
B.S.Ed., University of Georgia, 2000
M.Ed., University of Georgia, 2005
A Dissertation Submitted to the Graduate Faculty of the University of Georgia in Partial
Fulfillment of the Requirements for the Degree
DOCTOR OF PHILOSOPHY
ATHENS, GEORGIA
2011

© 2011
Whitney D. Strickland
All Rights Reserved
THE EFFECTS OF A REPEATED READINGS INSTRUCTIONAL PACKAGE ON THE
FLUENCY AND COMPREHENSION OF ELEMENTARY STUDENTS WITH MILD
INTELLECTUAL DISABILITIES
by
WHITNEY D. STRICKLAND
Major Professor: Richard T. Boon
Committee: Thomas Clees
Rebecca Lieberman
Electronic Version Approved:
Maureen Grasso
Dean of the Graduate School
The University of Georgia
December 2011

iv
DEDICATION
This is dedicated to Shane, Bryson, and Kathryn.

v
ACKNOWLEDGEMENTS
I would like to first and foremost thank my family. Shane, you are the most supportive,
patient, and loving husband and friend I could have asked for. Your strength and encouragement
carried me through this. Bryson, thank you for staying up late with me and keeping me
motivated. Kathryn, you are my inspiration. Mom and Morgan, thank you for keeping me sane,
constantly reminding me why I chose to pursue my Ph.D., and for your true understanding. Dad,
your pride in me is motivating. Jim and Mary, thank you for your unconditional love and for all
your hours of babysitting.
I would like to thank my students and their families for reminding me why I love
teaching. Last, I want to thank each of my professors and committee members; I have learned
valuable lessons from each and every one of you.

vi
TABLE OF CONTENTS
ACKNOWLEDGEMENTS .............................................................................................................v
LIST OF TABLES ....................................................................................................................... viii
LIST OF FIGURES ....................................................................................................................... ix
CHAPTER
1 INTRODUCTION ..........................................................................................................1
Rationale ..................................................................................................................8
Purpose .....................................................................................................................9
Research Questions ................................................................................................10
2 REVIEW OF THE LITERATURE .............................................................................11
Introduction ............................................................................................................11
Repeated Reading Strategies for Elementary Students with Learning
Disabilities .............................................................................................................13
Reading Fluency Strategies for Individuals with Developmental Disabilities ......59
Repeated Reading Strategies for Elementary Students with Intellectual
Disabilities .............................................................................................................79
3 METHODS ..................................................................................................................89
Experimental Design ..............................................................................................89
Participants .............................................................................................................92
Setting and Arrangements ......................................................................................97
vii
Materials ................................................................................................................98
Procedures ............................................................................................................102
4 RESULTS ..................................................................................................................114
Sessions ................................................................................................................114
Analysis of Research Results ...............................................................................115
Reliability .............................................................................................................125
Social Validity Survey .........................................................................................126
5 DISCUSSION, LIMITATIONS, AND IMPLICATIONS ........................................129
Discussion ............................................................................................................129
Results in Relation to Research ...........................................................................136
Limitations ...........................................................................................................137
Implications for Practice and Future Research ....................................................142
Summary ..............................................................................................................143
REFERENCES ............................................................................................................................145
APPENDICES
A Sample of Student Copy of Reading Passage .............................................................156
B Sample of Data Collector Copy of Reading Passage ..................................................157
C Sample of Reading Comprehension Questions ...........................................................158
D CWPM/EPM/Comprehension Recording Sheet ..........................................................159
E Procedural Checklist for Data Collector .......................................................................160
F Social Validity Survey ..................................................................................................163
G Parental Consent Form .................................................................................................164
H Minor Assent Form ......................................................................................................166

viii
LIST OF TABLES
Table 1: Review of Repeated Reading as the Only Intervention ...................................................44
Table 2: Review of Repeated Reading Compared to Other Interventions .....................................51
Table 3: Review of Repeated Reading as Part of a Package of Interventions ...............................56
Table 4: Review of Studies that Included Reading Fluency among Students with Developmental
Disabilities .....................................................................................................................................74
Table 5: Review of Studies that Included Repeated Reading among Students with Intellectual
Disabilities .....................................................................................................................................87
Table 6: Participant Demographic and Educational Information ..................................................92
Table 7: Psychometric Description of Participants ........................................................................93
Table 8: Participant Speech and Language Information ................................................................94
Table 9: Participant Prerequisite Skills ..........................................................................................96
Table 10: Number of Sessions Participants Spent in Each Condition .........................................115
Table 11: Mean Correct Words per Minute for Participants during Each Condition ..................118
Table 12: Mean Errors per Minute for Participants during Each Condition ................................120
Table 13: Mean Comprehension Scores for Participants during Each Condition .......................122
Table 14: Interobserver Reliability Results .................................................................................125

ix
LIST OF FIGURES
Figure 1: Correct Words per Minute and Errors per Minute for Baseline, Intervention, and
Maintenance Conditions ..............................................................................................................123
Figure 2: Comprehension for Baseline, Intervention, and Maintenance Conditions ...................124

1
CHAPTER 1
INTRODUCTION
There are five areas of literacy: oral language and vocabulary, phonological awareness,
phonics and word recognition, fluency, and comprehension. Each skill is vital to becoming a
successful reader. Boyle (2008) states that reading is a combination of skills that builds slowly
over time and suggests that early reading activities should be composed of a variety of integrated
activities that include phonological awareness, syllabication, print awareness, and early writing
skills. Comprehending information from text is the ultimate goal of literacy. True comprehension
is independently achieved only when the five areas of literacy are mastered.
It is vital to focus on the development of oral language and vocabulary before students
begin to learn how to read. “Oral language and vocabulary underlie all other stands of reading
instruction” (Allor, Mathes, Champlin, & Cheatham, 2009, p. 358). Students need to understand
the meaning of words before they are able to gain meaning, comprehend, or understand what is
being read. Students need opportunities to engage with the vocabulary to understand the concepts
presented (Browder, Gibbs, Ahlgrim-Delzell, Courtade, & Lee, 2009). Vocabulary acquisition
facilitates comprehension.
Phonological awareness and reading acquisition have a very important relationship in
emergent reading. Phonological awareness is defined as an individual’s awareness of the sound
structure of a spoken word (Gillon, 2004). It is an umbrella term that includes awareness of
phonemes as well as larger spoken units such as syllables, onsets, and rimes (Ehri & Nunes,
2002). Phonemic awareness is defined as the knowledge that words consist of separate sounds or

2
phonemes and the subsequent ability to manipulate these individual sound units (Kame’enui,
Carnine, Dixon, Simmons, & Coyne, 2002). The phoneme refers to the smallest unit in speech,
and phonemes are combined to make words. Tasks that require students to manipulate spoken
units larger than phonemes appear to be easier than tasks requiring manipulation of phonemes.
Thus, tasks requiring phonemic awareness are more difficult than overall phonological
awareness tasks. Yopp (1988) placed different phonological awareness dimensions on a
spectrum of easiest to hardest, respectively: rhyme, auditory discrimination, phoneme blending,
word-to-word matching, sound isolation, counting, phonemic segmentation, and deletion and
substitution. It should be noted that phonemic and phonological awareness tasks and activities
are mostly oral. Phonological awareness must be taught to students with differing abilities and
disabilities; it cannot be left to “develop in the absence of explicit instruction” (Smith, Simmons,
& Kame’enui, 1998, p. 108) or “inference by the learner during instruction” (Smith et al., 1998,
p. 131).
As students learn how to decode and identify sounds, phonemes, and sound units, they
begin to recognize combinations of these units as words. Students proceed from phonological
skills to syllabication to structural analysis skills (Boyle, 2008). O’Connor (2007) suggested first
teaching letter sounds followed by blending sounds, common letter and word patterns (such as
silent e words), common sight words, high-frequency words with irregular spellings, and finally,
multisyllabic words.
Fluency is often mastered toward the end of literacy acquisition. Fluency is a skill that
has many different definitions. For example, Rasinski (2003) defines fluency as “the ability of
readers to read quickly, effortlessly, and efficiently with good, meaningful expression” (p. 26).
LaBerge and Samuels (1974) describe fluency as the ability to translate letters to sounds to
3
words fluently and without effort. Valleley and Shriver (2003) simply define reading fluency as
“how fast and accurately a person reads a passage” (p. 56). No matter how one defines it, reading
fluency is essential. Fluent readers are able to read text without struggling to decode words. They
are able to recognize words and phrases automatically. According to the automaticity theory, a
fluent reader can decode text automatically, leaving attention free to comprehend what is being
read (Samuels, 1979). In other words, “fluent word recognition affords readers the opportunity to
focus on comprehension and information retrieval by minimizing the demands on them to attend
to decoding” (O’Shea & O’Shea, 1988, p. 26). Consequently, a lack of automaticity in decoding
among dysfluent readers “overloads the attentional system, leads to the use of small, meaningless
visual processing units such as the individual letter, places heavy demands on short-term
memory, and interferes with comprehension” (Samuels, 1987, p. 18). Struggling readers have
difficulties in the “ability to read sight words, decode words, and read phrases and sentences
automatically and rapidly” (Chard, Vaughn, & Tyler, 2002, p. 386). Therrien (2004) describes
fluency difficulties as a “bottleneck” that impedes the flow of thought and hampers
comprehension.
Comprehension refers to the construction of the meaning of spoken communication or of
text that involves an interaction between the reader and the message as the reader processes and
interprets a given message (Snow, 2002). It requires that the reader apply thinking processes to
gain meaning while listening or reading. Effective readers apply strategies to help them construct
meaning while they read. These strategies include activating background knowledge, asking
questions, making predictions, creating mental images, and recognizing when they are not able to
make sense out of a given message (Browder et al., 2009). Comprehension is the ultimate goal of
literacy and is essential for one to gain meaning from various types of text.

4
The relationship of the five areas of literacy is complex. You cannot teach one skill
without influencing or touching another skill. As students become stronger in one area, other
areas of literacy improve. Unfortunately, deficits in one area influence other areas and negatively
impact reading. Students with developmental disabilities usually display deficits in several, if not
all areas of literacy. Although it can be very challenging to teach students with developmental
disabilities how to read, federal legislation mandates that all children, including those with
disabilities, be taught to read in ways that are consistent with reading research. Therefore, special
education teachers must be knowledgeable about research-based interventions and techniques
that improve the literacy skills of students with various disabilities, including those with
developmental disabilities.
Traditionally, reading instruction for those with developmental disabilities emphasizes
decoding and sight word identification; this practice distances students from the general
curriculum. Recent literature, however, suggests that educators shift to a more holistic approach
to teaching reading to students with developmental disabilities. Comprehensive programs,
similar to those used with typical students, should be used to emphasize fluency, whole word
knowledge, and guided passage comprehension instruction in meaningful curriculum-based
materials (Freeze, 2006).
Allor, Mathes, Roberts, Cheatham, and Champlin (2010) conclude that “students with
intellectual disabilities, even those with IQs in the moderate range, learn basic reading skills
given consistent, explicit, and comprehensive reading instruction across an extended period of
time” (p. 445). Allor et al. (2010) also concluded that students with intellectual disabilities
experience needs that vary from those of typical students with learning disabilities in reading.
For example, they found that students in their longitudinal study required approximately three

5
years of intensive academic instruction to reach minimum levels for ending first grade. In other
words, students with intellectual disabilities require intensive practice across multiple years to
become successful readers (Allor et al., 2010).
Successful readers can read text fluently and with ease, comprehending the material that
is read. There are many strategies designed to improve the reading fluency of students with
differing needs and abilities. Some strategies are research-based while others lack empirical
evidence to prove their effectiveness. Although repeated reading is the most widely used and
researched intervention to increase reading fluency, other popular strategies include paired
reading, partner reading, choral reading, oral previewing, radio reading, phrase reading,
Neurological Impress Method, shared reading, Readers Theatre, the use of technology, and
independent reading. Specific methods can and should be adapted and modified to fit the
particular needs of individual learners. While one strategy may be the most beneficial for one
person, another type of strategy may be better for another. Choosing the most appropriate and
helpful strategy requires a great deal of thought, research, planning, open-mindedness,
knowledge, familiarity with the student, and trial and error.
Chard, Ketterlin-Geller, Baker, Doabler, & Apichatabutra (2009) challenge that repeated
reading is not supported by rigorous research as defined by the quality indicators used and,
therefore is not an evidence-based practice based on the quality indicators for students with
learning disabilities. In light of these findings, the authors do not suggest that educators
discontinue the use of repeated readings in the classroom. “Repeated reading is a logical
extension of multiple theoretical frameworks that suggest its use in supporting students who need
fluency development… Repeated reading practices should be continued” (Chard et al., 2009, p.

6
278). They do, however, suggest that when conducting research studies, researchers apply more
rigorous adherence to quality indicators and standards for evidence-based practices.
In light of the findings by Chard et al. (2009), the use of repeated reading as the sole
intervention has been found to be an effective strategy to increase reading fluency among
students with learning disabilities (Chafouleas, Martens, Dobson, Weinstein, & Gardner, 2004;
Nelson, Alber, & Gordy, 2004; O’Shea, Sindelar, & O’Shea, 1987; Rashotte & Torgensen, 1985;
Sindelar, Monda, & O’Shea, 1990; Therrien & Kubina, 2007; Weinstein & Cooke, 1992; Yurick,
Robinson, Cartledge, Lo, & Evans, 2006). Likewise, repeated reading has been found to be an
effective strategy to increase the reading fluency of students with developmental disabilities
(Devault & Joseph, 2004; Mefferd & Pettegrew, 1997; Musti-Rao, Hawkins, & Barkley, 2009;
Valleley & Shriver, 2003).
Repeated reading requires that a student orally read a passage a certain number of times
or until predetermined mastery criteria is met. The reading is timed, usually for 1 min. Then the
procedure is repeated with a new passage. Correct words per min and errors are recorded, and a
fluency rate is established. Passages can be repeated any number of times. O’Shea et al. (1987)
compared the effectiveness of reading passages one, three, and seven times and found that
students read and retold passages more accurately as the number of repetitions increased.
When implementing repeated reading activities, researchers and teachers can incorporate
scaffolding and differentiated instruction by varying mastery criteria, the times a passage is read,
the length of the passage, and the content that is in the passage. Repeated reading may also be
accompanied by other factors including peer support, error correction, performance feedback,
and student self-graphing of progress. While self-graphing is not a necessity, Samuels (1979)
7
stresses that it is an excellent motivating device because it provides visible proof of progress for
students. There are many strategies, variations, and activities that include repeated reading.
Dowhower (1994) gives educators and researchers some guidelines when choosing
passages for repeated reading. Passages are kept between 50-300 words and can be read by the
student with at least 85% accuracy. Mastery criterion (i.e. rate of speed) should be developed to
increase progress in fluency after repeated reading training. Other suggestions by Dowhower
(1994) include moving up to more difficult text if the student meets mastery criteria after the
second reading of a new passage; sending passages home with students so they can read to as
many people in as many different settings as possible; setting up listening centers in the
classroom; and giving students a reading spot where they can independently read, time their
readings with an hourglass, egg timer or stopwatch, and keep track of their own progress.
Alber-Morgan (2006) also provides specific suggestions for making repeated reading
interventions more effective. Repeated readings take little time and effort to implement and
should be utilized on a daily basis. Repeated readings should be used as a supplement to
structured reading programs that emphasize decoding and comprehension. Teachers should
provide materials at the readers’ appropriate reading and instructional levels. Systematic error
correction and performance feedback should be used to improve outcomes. Program
reinforcement procedures should be included in repeated reading instruction to increase the
likelihood of increased reading proficiency. Progress monitoring is necessary for teachers to
make appropriate decisions about the progression of instruction. Reading comprehension should
be assessed and incorporated into the repeated reading instruction to gauge the effectiveness of
improved reading fluency on the comprehension of reading material. Finally, repeated reading
instruction is the most effective when implemented in a one-on-one instructional setting.

8
Although one-on-one instruction is often impossible to employ in classroom settings, Alber-
Morgan (2006) suggests getting family members, paraprofessionals, and peers involved to assist
with reading fluency instruction.
Samuels (1979) emphasizes that for the purposes of building fluency, speed rather than
accuracy should be addressed. Why? There is a trade-off between accuracy and speed. If 100%
word recognition accuracy is required before the student can progress to a new passage, the
student becomes fearful of making a mistake, and the pace of reading automatically slows down
(Samuels, 1979). Although repeated reading is the most recognized approach for increasing
reading fluency and there have been successful results with this method, Nichols, Rupley, &
Rasinski (2009) feel that “continual reliance on repeated readings without appropriate guidance
and support can lead to diminished student engagement” (p. 1).
Rationale
Some readers naturally acquire reading skills in the midst of learning while other students
need explicit instruction for reading progress to be made. For some learners, progress is slow and
laborious. This is especially true for learners with disabilities. Learners with disabilities have
individual strengths, weaknesses, and needs. Therefore, they require individualized instruction.
Unfortunately, given staff, funding, and curricular limitations, individualized instruction is often
nearly impossible to implement. Students with different disabilities are often grouped together in
noncategorical instructional settings.
Caffrey and Fuchs (2007) conducted a literature review to determine the differences in
academic performance between students with learning disabilities and students with mild
intellectual disabilities (MID). Their findings seem to support the notion that students with
learning disabilities learn differently than students with MID. For example, both groups benefit
9
from constant time delay, interspersal of known items, direct instruction, and strategy instruction.
On the other hand, students with MID required more support, explicit hints, and coaching during
guided inquiry learning. Students with MID required more trials of interspersal of known items
to learn new responses (Caffrey & Fuchs, 2007). On inductive reasoning tasks, students with
learning disabilities often performed more like their normally achieving peers than students with
MID (Caffrey & Fuchs, 2007). In addition, students with learning disabilities generalized
information to new contexts more efficiently (Caffrey & Fuchs, 2007).
Why is this important? There are numerous studies about techniques to increase reading
fluency among students with learning disabilities. On the other hand, the number of empirically-
based research methods of increasing reading fluency among students with developmental
disabilities is severely lacking. The researcher had a very difficult time finding studies that
included both reading fluency as a dependent variable and participants with developmental
disabilities. As a result of the shortage of information about how to teach reading fluency to
students with developmental disabilities, special educators have been using reading instruction
techniques for students with developmental disabilities that were actually meant to be used with
students with different types of disabilities.
Purpose
Although there are many studies that demonstrate the effectiveness of repeated readings
to increase reading fluency among students without disabilities and with learning disabilities,
there are a limited number of studies that demonstrate the effectiveness of repeated readings
among students with intellectual disabilities. This gap in the research is significant in that
fluency is a vital reading skill and is necessary for the reader, regardless of his or her intelligence
quotient, to comprehend what is being read. The purpose of this study was to examine the

10
efficacy of using a combination of repeated readings and error correction on the reading fluency
and reading comprehension of students with intellectual disabilities at the elementary level.
Research Questions
This research study was intended to investigate:
1. Will the combined effects of repeated readings and error correction increase the
number of words read correctly per minute of elementary students with intellectual
disabilities?
2. Will the combined effects of repeated readings and error correction decrease the
number of reading errors per minute of elementary students with intellectual
disabilities?
3. Will the combined effects of repeated readings and error correction increase the
reading comprehension of elementary students with intellectual disabilities?
4. What are the students’ opinions of repeated readings combined with error correction?

11
CHAPTER 2
REVIEW OF THE LITERATURE
Introduction
This section provides an extensive review of the literature in three related topics. The first
topic involves repeated reading strategies to improve the reading fluency of students with
learning disabilities. The second topic involves instructional strategies to improve the reading
fluency of individuals with developmental disabilities. The third topic involves repeated reading
strategies to improve the reading fluency of students with developmental disabilities. Results and
limitations are discussed for each topic. Suggestions for instructional implications and future
research to replicate and extend current research findings are offered.
In our society, reading is a valued skill. Individuals are expected to have the ability to
read thoroughly, accurately, and quickly. In 2000, the National Reading Panel issued a report
describing the five reading skill areas considered to be important: phonemic awareness, phonics,
vocabulary instruction, text comprehension strategies, and reading fluency (National Institute of
Child Health and Human Development, 2000). Chard et al. (2002) concluded that “both rapid
reading of high-frequency words and rapid decoding as a means to enhance text understanding
appear critical for typical reading development” (p. 386). LaBerge and Samuels (1974) theorized
that automatic information processing – increasing automaticity in processing word units,
processing the units into words, and connecting the words to gain meaning from a passage – is
necessary when reading to gain understanding and meaning.

12
Unfortunately, not all individuals naturally possess the necessary skills for successful
reading. Reading is especially difficult for individuals with learning disabilities and
developmental disabilities. The most basic difficulties lie in the ability to decode single words.
For example, many students cannot decipher whether a vowel within a word should have a short
or long vowel sound. Fluency is often another problem. The core problem with fluency is the
“ability to read sight words, decode words, and read phrases and sentences automatically and
rapidly” (Chard et al., 2002, p. 386). Therrien (2004) describes fluency difficulties as a
“bottleneck” that impedes the flow of thought and hampers comprehension. In addition, students
with disabilities spend most of their reading time trying to decode words, thus taking away from
comprehension and gaining meaning from the text.
Repeated reading is an intervention that has been used to increase the reading fluency and
comprehension of students both with and without disabilities. “The basis for using repeated
reading is that students practice reading passages rather than isolated words, which improves
both word recognition and comprehension” (O’Shea & O’Shea, 1988). Repeated reading is a
fluency strategy “that consists of re-reading a short and meaningful passage until a satisfactory
level of fluency is reached” (Samuels, 1979, p. 404). Implementation in the classroom is
relatively easy and requires little preparation time by the teacher. In addition, repeated reading
can be utilized in a variety of settings: small-group instruction, peer reading, and learning centers
(O’Shea & O’Shea, 1988).
Recent research has revealed some promising and effective practices to improve the
reading skills, especially oral reading fluency and comprehension, of elementary students with
learning disabilities through repeated reading instruction. For example, recent research has
demonstrated the effectiveness of repeated reading as the only intervention (Nelson, Alber, &
13
Gordy, 2004), compared repeated reading to other interventions to illustrate effectiveness
(Therrien & Hughes, 2008), and included repeated reading as part of an intervention package to
increase reading skills (Therrien, Wickstrom, & Jones, 2006). There is also a small amount of
research that demonstrates the effectiveness of repeated reading strategies to increase reading
fluency among students with developmental disabilities (Devault & Joseph, 2004; Mefferd &
Pettegrew, 1997; Musti-Rao et al., 2009; Valleley & Shriver, 2003).
The purpose of this literature review is to examine the published, peer-reviewed literature
about: 1) the use of repeated reading interventions to increase the reading fluency of elementary
students with learning disabilities; 2) reading fluency strategies to increase the reading fluency of
students with developmental disabilities; and 3) repeated reading strategies to increase the
reading fluency of students with developmental disabilities. Such a research analysis can provide
both special and general educators an extensive review of: 1) the types of repeated reading
strategies conducted with students with learning disabilities, and 2) the types of reading fluency
and repeated reading strategies conducted with students with developmental disabilities. Through
such a review, researchers can gain greater insight into future efforts to replicate and extend
repeated reading research for students with disabilities, especially among those with
developmental disabilities.
Repeated Reading Strategies for Elementary Students with Learning Disabilities
Literature Search Procedures
The researcher conducted a literature review on the use of repeated reading procedures to
increase the reading fluency of elementary students with learning disabilities. The following
search procedures were used to retrieve relevant articles. First, a computer-assisted search of five
major databases was conducted including Academic Search Complete, ERIC, PsycARTICLES,

14
PsycINFO, and Education Research Complete from 1980 to 2009. The descriptors used in the
search procedure included repeated reading, disabilities, special education, learning disabilities,
and reading fluency. Second, a university employee with access to journals was contacted in
order to secure copies of articles not found online. The search procedures revealed 22 studies that
met the criteria for inclusion in this literature review.
Criteria for Inclusion
The four main criteria for inclusion in this literature review included: (a) peer-reviewed
studies between 1980 to 2009; (b) studies that included repeated reading strategies to increase
reading fluency; (c) individuals included in the study are explicitly classified as having a learning
disability; and (d) individuals in the study are in kindergarten through fifth grade. Studies with
participants in middle school were included only if elementary students were also participating in
the study. For the purposes of this review, studies were excluded when there wasn’t clear use of
repeated readings or when participants were described as low-achieving readers without specific
classifications of learning disabilities. Many of the studies used repeated reading strategies to
increase both reading fluency and reading comprehension; these were included as long as they
met the four main criteria.
Overall Study Characteristics
There were 22 studies that ranged in publication date from 1985-2009, and appeared in
the following peer-reviewed journals: Journal of Behavioral Education, Education and
Treatment of Children, Learning Disabilities Research, Reading Research Quarterly, Journal of
Educational Research, Reading Improvement, Learning Disability Quarterly, Journal of
Learning Disabilities, Journal of Special Education, Learning Disabilities Research & Practice,
Remedial and Special Education, Rural Special Education Quarterly, Exceptional Children,

15
Preventing School Failure, and Learning Disabilities: A Contemporary Journal. A total of 632
participants (range 1 to 119) who had a mean age, of those reported, of 10.09 (range 8.0 to
12.45) and a mean IQ of 94.04, of those reported, participated in these studies. The total number
of participants with learning disabilities in these studies was 312 (range 1 to 67). The median
total number of subjects per study was 18 (range 1 to 119), and the medial total number of
subjects with learning disabilities per study was 10 (range 1 to 67). Participants in the studies
were in grades 2 to 8 with a mean grade level of 4.0 and a median grade level of 3.75. The
majority of studies included in the review employed experimental designs. The interventions
included three major areas: a) repeated reading as the only intervention, b) repeated reading
compared to other interventions, and c) repeated reading as part of a package of interventions.
The final sample of studies included in this review consisted of nine studies with repeated
reading as the only intervention (Chafouleas, Martens, Dobson, Weinstein, & Gardner, 2004;
Musti-Rao, Hawkins, & Barkley, 2009; Nelson, Alber, & Gordy, 2004; O’Shea, Sindelar, &
O’Shea, 1987; Rashotte & Torgeson, 1985; Sindelar, Monda, & O’Shea, 1990; Therrien &
Kubina, 2007; Weinstein & Cooke, 1992; Yurick, Robinson, Cartledge, Lo, & Evans, 2006),
seven studies that compared the effectiveness of repeated reading to other interventions (Begeny,
Daly, & Valleley, 2006; Ellis & Graves, 1990; Mathes & Fuchs, 1993; O’Connor, White, &
Swanson, 2007; Therrien & Hughes, 2008; Vaughn, Chard, Bryant, Coleman, Tyler, Linan-
Thompson, & Kouzekanani, 2000; Welsch, 2007), and five studies that used repeated reading
strategies as part of a package of interventions to increase reading skills (Denton, Fletcher,
Anthony, & Francis, 2006; Manset-Williamson & Nelson, 2005; Tam, Heward, & Heng, 2006;
Therrien, Wickstrom, & Jones, 2006; Vadasy & Sanders, 2008).
16
Repeated Reading as the Only Intervention
Nine studies employed repeated reading as the only intervention to determine the effects
of repeated reading on reading skills. Chafouleas et al. (2004) compared the effects of different
methods of repeated readings on the oral reading fluency. Nelson et al. (2004) paired error
correction procedures with repeated reading to measure reading accuracy and fluency. O’Shea et
al. (1987) added attentional cues to repeated readings to measure reading fluency and
comprehension. Roshette and Torgesen (1985) assessed word overlap in repeated readings to
assess fluency and comprehension. Sindelar et al. (1990) compared the effects of repeated
reading on the fluency and recall of participants with and without learning disabilities. Therrien
and Kubina (2007) compared contextual text to noncontextual text in repeated readings to
measure correct words per minute and errors per minute. Weinstein and Cooke (1992) compared
different mastery criteria for repeated readings to measure reading fluency. Musti-Rao et al.
(2009) and Yurick et al. (2006) measured the effects of peer-mediated repeated readings on oral
reading fluency and comprehension.
Chafouleas et al. (2004) studied the impact of repeated readings (RR), repeated readings
with performance feedback (RR/FB), and repeated readings with performance feedback and
contingent reward (RR/FB/REW) on oral reading fluency in an alternating treatments design.
Three students in the second grade participated in the study, but only one, Molly, was diagnosed
with a learning disability and received special education services in a self-contained classroom.
For the purposes of this study, only Molly’s procedures and results will be discussed. The
dependent variables were correct words per minute (CWPM) and errors per minute (EPM). The
repeated readings (RR) component of each of the interventions required that the students read
each passage three times, and the CWPM and EPM were recorded for the last reading. During
17
performance feedback (FB), the researcher told the student how many words she read correctly
at the end of each session. During contingent reward (REW), the student picked a tangible item
before reading the passage and placed it on the table. She was told that if she read at least one
more word than she did during the previous session, she would receive the reward. Molly’s order
of conditions was RR/FB, RR/FB/REW, and RR. “For Molly, the RR/FB condition produced the
largest improvement followed by RR/FB/REW and finally, RR alone” (Chafouleas et al., 2004,
p. 74). She displayed a decreasing trend in EPM.
Nelson et al. (2004) investigated the effects of systematic error correction and systematic
error correction paired with repeated readings on the reading accuracy and fluency of elementary
students with disabilities. Four students in the second grade participated in the study; three
students had learning disabilities and one student was diagnosed with Attention
Deficit/Hyperactivity Disorder (ADHD). The students received special education services in a
resource room. A multiple-baseline across participants design was used to measure the
dependent variables – the number of words read correctly per minute (CWPM) and the number
of errors per minute (EPM). During baseline, the students read a passage for 5 min during which,
if they made a mistake, the teacher told them the correct word but did not make them repeat it.
When finished, the students read the same passage for 1 min while the teacher recorded CWPM
and EPM. In the systematic error correction condition, the students read a passage for 5 min. If
they made a mistake, the teacher said the correct word, the students repeated the word, then
repeated the sentence. After the five-min reading period, the teacher pointed to the words the
students read incorrectly; if the students read it incorrectly, the teacher said the correct word, and
the student repeated it. After systematic error correction, the students reread the passage for 1
min while the teacher recorded CWPM and EPM. In the error correction plus repeated readings

18
condition, the teacher followed the same procedures as the systematic error correction condition
with the following differences. Systematic error correction took place for 3 min following three
1-min timed rereadings of the passage from the beginning. In the error correction plus repeated
readings with previously read materials condition, procedures were the same as the error
correction plus repeated readings condition except that the reading passages were the ones used
during baseline. The teacher recorded the CWPM and EPM during the last timed reading. “When
repeated readings were implemented in conjunction with the error correction procedures,
evidence of a functional relationship was demonstrated for all four students in terms of their
reading accuracy and proficiency” (Nelson et al., 2004, p. 186).
O’Shea et al. (1987) investigated the effects of repeated readings and attentional cues on
the reading fluency and comprehension of 32 students with learning disabilities in grades 5-8. In
a 2 x 3 mixed design with one between factor and one within factor experimental design, the
dependent variables were reading rate and comprehension, and the independent variables were
attentional focus and the number of repeated readings. Students were randomly assigned to one
of two conditions; in one, the students were instructed to read quickly and accurately, and in the
other, the students were instructed to read for comprehension. Students in both conditions
participated in all levels of repeated reading by reading 1, 3, and 7 times. In the fluency
condition, students were given a fluency cue and then asked to orally read a passage. Then they
were instructed to read it again (if repeating the story 3 or 7 times). After the last reading, the
students were praised for reading quickly and accurately and given a sticker. Then they were
asked to tell what they remembered from the story. In the comprehension condition, students
were given an initial comprehension cue. When they were finished reading the last passage, the
students were asked to retell the story and then praised for remembering so much about the story

19
and given a sticker. Separate ANOVAs were calculated to obtain results. Students read more
fluently on seventh readings than on third readings, and they read more fluently on third readings
than on one reading. Students accurately retold more of the story with more readings versus
fewer readings. In addition, students cued to remember the stories recalled and comprehended
more of the stories than students who were cued to read fluently.
Rashotte and Torgesen (1985) assessed whether the degree of word overlap among
passages affects fluency and comprehension across different stories that are repeatedly read and
whether repeated reading is more effective than nonrepetitive reading. The researchers employed
a pretest posttest ABC design using 12 students with learning disabilities in second through fifth
grades. The students were assigned to dyads based on pretest reading speeds; each dyad had a
low and a high reader based on reading speed. Each dyad participated in the three conditions of
the study but in different orders. Conditions 1 and 2 were considered to be the repeated reading
conditions while Condition 3 was the nonrepetitive reading condition. In Condition 1, students
read one of seven passages four times each day. The passages in Condition 1 were designed with
minimal word overlap; there were about 20 common words among the passages. In Condition 2,
students read one of seven passages four times each day, but these passages were designed with a
high degree of word overlap (approximately 60 common words) among the passages. In
Condition 3, students read four different stories, and the stories were not repeatedly read. During
all conditions, comprehension questions were asked after the first reading, and the students were
provided with feedback about their reading speed and the number of errors they made after each
reading. Dependent variables were reading speed, defined as the number of words read per
minute; word accuracy, defined as the number of errors read; and comprehension. Results
indicated that reading speed is positively affected by repeated readings as long as there is a high

20
degree of word overlap among different stories. In contrast, results from this study illustrate there
is not a significant difference in errors read and comprehension between repeated readings and
nonrepetitive readings.
Sindelar et al. (1990) sought to examine and compare the effects of repeated readings on
the fluency and recall of readers with and without learning disabilities. Participants included 25
students with learning disabilities and 25 students considered “nondisabled” in grades three
through five. Those students reading more than 100 words per minute were considered mastery-
level readers, and those reading between 50 and 100 words per minute were considered
instructional-level readers. Students from the LD group were matched and compared with
students from the nondisabled group on fluency and comprehension based on performances on
two screening passages. Dependent variables were words read correctly per minute (WPM),
errors per minute (EPM), and the number of prepositions retold (NPR). The researchers used a 2
x 2 x 2 factorial design, with two between-group factors and one within-group factor. During the
intervention, students were asked to read two passages – one once and the other three times.
During the readings, the researchers recorded WPM and EPM but did not provide error
correction or performance feedback. After the students read the passages, the students were
asked to retell the passage to the best of their abilities. Predictably, WPM and recall increased
significantly from one to three readings among all students. Interestingly, as EPM decreased for
the students with LD from one to three readings, EPM slightly increased for the students without
disabilities. “One can reasonably conclude that the effects of repeated readings were comparable
for LD and nondisabled readers” (Sindelar et al., 1990, p. 224).
In a two by two design (type of training materials and order of training materials),
Therrien and Kubina (2007) investigated the importance of context and connected text in

21
repeated reading. 16 students in grades third through fifth reading below grade level participated
in the study; 2 of the participants were classified as having learning disabilities. Participants were
randomly assigned to begin in Condition 1 or Condition 2. On the first day of intervention, the
participants were given an easy passage to repeatedly read out loud until they reached a rate of
93 correct words per minute (CWPM) was reached. Next, students in Condition 1 were given an
experimental passage with words in context while the students in Condition 2 were given
randomized words out of context; they orally read the passage/words until they reached a rate of
93 CWPM or the passage/words were read six times. A transfer passage (with an average of 55%
of the same words as the experimental passage) was then given to the participants in Condition 1,
and they were asked to read the passage as quickly and accurately as possible. On the second day
of the intervention, the students switched conditions. Dependent measures were the number of
readings to criterion, number of errors in the first reading training passage, the CWPM in the
transfer passage, and the number of errors in the transfer passage. The results of this study
demonstrated “the superiority of reading connected text in a repeated reading intervention over
reading words out of context” and that “repeated reading improves word recognition during
practice” (Therrien & Kubina, 2007, p. 186).
Weinstein and Cooke (1992) compared the effects of two types of mastery criteria for
repeated reading on reading fluency. The study employed a multitreatment, single-subject
research design (ABACA) and included four students with learning disabilities in the second and
third grades. The dependent measure was the number of correct words per minute (CWPM). The
two interventions were repeated readings with a criterion of 90 CWPM and repeated readings
with criterion based on three successive fluency improvements. During both interventions,
students first listened to a taped reading of the passage at a rate of approximately 100 words per
22
minute and were then asked to orally read the passage by themselves. They were given two
opportunities to reread each day until the specified criterion was met. During the fixed-rate
intervention phase, students reread the passage until meeting a criterion of 90 CWPM. During
the improvements phase, students reread the passage until they achieved three successive
improvements on CWPM. During each session, the researcher plotted the CWPM on a graph and
immediately shared it with the student. Results indicated that “all students made gains in their
mean correct words per minute with the repeated reading technique, regardless of the type of
criterion” (Weinstein & Cooke, 1992, p. 26). Students averaged a mean gain of 24.8 CWPM with
a mean number of 8.2 rereadings in the fixed-rate phase and 20.0 CWPM with a mean number of
17.5 rereadings in the improvements phase.
Utilizing a multiple baseline across participants design, Musti-Rao (2009) measured the
effects of peer-mediated repeated readings on the oral reading fluency of fourth grade students
with and without disabilities. A total of 12 students (three with learning disabilities, one with an
eligibility of Other Health Impairment, one with an intellectual disability, and one with a severe
emotional disability) participated in the study. The dependent variable was the number of correct
words per minute (CWPM). During baseline, students independently and silently read books for
30 min after which the researcher administered a DIBELS oral reading fluency (DORF; Good &
Kaminski, 2002) passage. Prior to the paired repeated readings intervention, students were
provided training about the correction procedure and the role of reader and listener. During each
session, each student in the pair sat across from each other and placed their reading passage,
good tutor card, and correction card in front of them. The good tutor card was stamped by the
circulating teacher if appropriate tutoring behavior was observed. The students took two turns
reading the passage for 10 min. A correction procedure was used. After the repeated readings of
23
the passage, the students individually read the passage for 1 min and recorded their correct words
per minute in their reading logs. Tangible rewards were given if a student met his or her goal on
the third day of repeated readings. Overall results indicated an increase in oral reading rate from
baseline to intervention for all students. On the other hand, none of the students met their end-of-
year goals on the end of year DIBELS (Good & Kaminski, 2002) benchmark. Effect size
estimates indicated that the intervention had a moderate to large effect on students’ oral reading
fluency. Specifically, among the students with LD, mean CWPM scores during baseline were
42.7, 37.0, and 55.4 and increased to 64.6, 47.7, and 60.8, respectively, during intervention.
Through three experiments, Yurick et al. (2006) evaluated the effects of peer-mediated
repeated readings on students’ oral reading fluency and comprehension. Only experiments 1 and
3 will be discussed since they included students with learning disabilities. In both experiments, a
multiple baseline across participants design was used; only Students A6 and A8, fifth graders, in
experiment 1 and Student C1, nine years old, in experiment 3 will be discussed since they are the
only students identified as having a learning disability. Dependent variables were the total
number of words read in 1 min (WPM), reading accuracy, and the number of comprehension
questions answered correctly. In experiment 1, the first condition was sustained silent reading
(SSR) in which the students were given a passage to independently and silently read for 10 min.
After that, each student was taken into the hallway, asked to orally read the passage, and asked
five comprehension questions about the passage. The second condition was student training
where the students were trained in pairs as to how to correct their partner’s mistakes; data was
not collected during this condition. The third condition was paired repeated readings (RR). RR
included 10 min of partner reading with feedback and self-correction followed by a timed 1-min
individual reading of the same passage. After that, students self-graphed their score or chose to

24
re-do their reading (students were allowed one re-do if their score wasn’t higher than the
previous day’s score). Once criteria were mastered (180 WPM and 10 or fewer errors were
made), students were asked comprehension questions; if the students answered the questions
correctly, they moved into the next level passage for repeated reading. If the questions were not
answered correctly, they continued working on the passage until all the criteria were met. When
the students met the total criteria, they received a tangible reward. In SSR, Student A6 read 107
WPM with 95% accuracy and Student A8 read 81 WPM with 94% accuracy; in RR, Student A6
averaged 173 WPM with an average of 98% accuracy while Student A8 averaged 151 WPM
with an average of 97% accuracy. Based on the Woodcock-Johnson Test of Achievement-Revised
(Woodcock & Johnson, 1989) pretest and posttest, Student A6 made .4 and 1.1 gains in grade
equivalency scores on the Letter-Word Identification and Passage Comprehension subtests,
respectively; Student A8 made .0 and 1.0 gains in grade equivalency scores on the same subtests.
In experiment 3, the SSR and student training conditions were the same with the exception that
during SSR, the students were pulled out of class to read in a vacant classroom. The RR
condition was the same as that in experiment 1 with three exceptions – the students were in a
pull-out model, all the students began reading passages at the third-grade level, and the “students
were trained to follow a more explicit correction procedure when their partner made an error”
(Yurick et al., 2006, p. 493). An additional condition, generalization, was added in experiment 3
in which “three different generalization conditions were examined: covertly-timed, overtly-
timed, and overtly-timed and charted generalization” (Yurick et al., 2006, p. 493). From SSR to
generalization, Student C1 increased WPM from 32 to an average (across generalization
conditions) of 42 WPM while decreasing accuracy from 87% to 85%, respectively. Based on the
Woodcock-Johnson-III (Woodcock, McGrew, & Mather, 2001) pretest and posttest, Student C1

25
made .9, .7, .5, and 1.4 gains in grade equivalency scores on the Letter-Word Identification,
Reading Fluency, Passage Comprehension, and Word Attack subtests. Overall “results indicated
that peer-mediated repeated reading improved students’ oral reading rate, reading accuracy, and
comprehension” (Yurick et al., 2006, p. 469).
Repeated Reading Compared to Other Interventions
Seven studies compared the use of repeated reading to other interventions on reading
skills such as reading fluency and reading comprehension. Begeny et al. (2006) compared drill
phase error correction to repeated reading and their effects on oral reading fluency. Ellis and
Graves (1990) compared the effects of repeated reading, paraphrasing cognitive strategy
instruction, and the combination of the two interventions on reading comprehension. Mathes and
Fuchs (1993) compared peer-mediated repeated reading to peer-mediated sustained on fluency
and comprehension. O’Connor et al. (2007) compared repeated reading to continuous reading on
fluency and comprehension. Therrien and Hughes (2008) compared the effects of repeated
reading and question generation on fluency and comprehension. Vaughn et al. (2000) compared
partner reading (including repeated reading procedures) to collaborative strategic reading to
measure fluency, rate, and comprehension. Welsch (2007) compared repeated reading to five
other conditions – baseline instruction at the students’ grade level, baseline instruction below the
students’ grade level, listening passage preview, repeated reading with easier material, and
listening passage preview with easier material – on reading fluency and comprehension.
Begeny et al. (2006) compared phrase drill error correction with repeated readings and
their effects on oral reading fluency. The singular participant in this study was an eight-year-old
male in the third grade with a Speech-Language Impairment and a Learning Disability in Written
Expression. Repeated readings, phrase drill error correction, baseline, and a reward condition

26
were alternated in an alternating treatments design. A different passage was used for each
condition and session. The dependent variables were words correct per minute (WCPM) and
words incorrect per minute (WIPM). In the baseline sessions, the participant read a passage once
without feedback. During the repeated reading condition, the participant was asked to orally read
each passage three times; the WCPM and WIPM were recorded during the third reading. In the
phrase drill error correction phase, the participant read a passage once, practiced words read
incorrectly, and read the passage again. He practiced each incorrect word by reading a three to
five word phrase containing the word; he read each phrase three times before practicing the next
phrase. During this phase, the WCPM and WIPM were recorded during the second reading. In
the reward sessions, the participant received a preferred reward if, without practice, he read the
passage faster or more accurately than a previous passage of similar difficulty. Results indicated
that phrase drill error correction and repeated readings greatly improved the participant’s WCPM
and, when compared, are equally effective at improving reading fluency. In addition, though there
was a reduction in WIPM during both treatments, the greatest decrease in WIPM occurred during
the phrase drill error correction.
Utilizing a randomized comparison group design with 4 groups, Ellis and Graves (1990)
compared the effects of repeated readings to the effects of paraphrasing cognitive strategy
instruction. In addition, the researchers measured the effects of combining the two interventions.
32 students with learning disabilities in grades 5, 6, and 7 participated in this study. The
dependent variable was the identification of the main idea, a measure of reading comprehension.
The independent variables were repeated readings (RR) alone, paraphrasing strategy instruction
(PSI) alone, and the combination of the RR and PSI strategies (PSI+RR); each of three
experimental groups was assigned an independent variable while the fourth group was the

27
control group. In the beginning sessions of the control condition, students were provided with a
brief definition of the main idea, asked to read the story, and then asked to answer multiple-
choice questions about the main idea. In later control condition sessions, the students were asked
to read the story and answer the questions without first being told the main idea. In the RR
condition, students were given a brief definition of the main idea then asked to repeatedly read
the story within the given time to find the main idea. In the PSI condition, students were taught a
task-specific strategy for paraphrasing. The steps of the strategy were to read a paragraph, ask
themselves “What is the main idea of the paragraph?”, and put the main idea into their own
words. In the PSI+RR condition, students were taught the paraphrasing strategy. Then they were
told that if they were unsure of the main idea, they should repeatedly read the story in the allotted
time to find the main idea. Students who missed the main idea were asked to re-read until they
found the main idea. Results indicated that the paraphrasing strategy was more effective than the
repeated readings strategy. In addition, the combination of the two strategies was no more
effective than the paraphrasing strategy alone.
Mathes and Fuchs (1993) compared the effects of peer-mediated repeated reading and
peer-mediated sustained reading on the dependent variables of correct words read orally in 3min,
the average number of correct responses to 10 comprehension questions, and the number of maze
items replaced correctly on a 2-min maze activity. The dependent variables were measured on
pretests and posttests in a two-factor, multiple-treatment, pretest and posttest control group
design; the two factors were the type of peer-mediated instruction (repeated reading vs. sustained
reading) and the level of difficulty (instructional vs. independent). 67 students with learning
disabilities in reading in grades 4-6 participated in the study. Students were assigned to dyads;
pairs of students read near the same reading level. Dyads were assigned to one of the peer-
28
mediated instructional conditions or to a control group. Students in the control condition received
normal reading instruction from their teachers. In the sustained reading condition, the tutee read
orally from an assigned passage for 9min while the tutor monitored for errors. If the tutee read a
sentence correctly, he was awarded 2 points; if not, the tutor corrected the mistake. The objective
was to read as many sentences correctly as possible in the allotted time, thus allowing the tutee to
accrue as many points as possible. At the end of the 9min, the tutee and tutor switched roles with
a new passage. In the repeated reading condition, the tutee was assigned 3 passages. He read
each passage 3 times, 1 per minute. The tutee read a total of 9 min. The objective was to read
more of each passage with fewer mistakes. At the end of each reading, the tutor awarded points
and corrected mistakes in the same manner as in the sustained reading condition. After 9min, the
tutor and tutee switched roles with the tutee reading different passages. Results indicated that
students in the sustained reading condition performed better than students in the control
condition on fluency measures but not on comprehension measures. Students in the repeated
reading condition did not perform significantly better than students in either the control condition
or the sustained reading condition. Mathes and Fuchs stated that the findings are “not in keeping
with previous studies using this technique… however, our study was the first to examine its
efficacy within the context of peer tutoring, with students with LDs serving as tutors for other
student with LDs” (1993, p. 240).
Using a randomized comparison group study design, O’Connor et al. (2007) compared
the effects of repeated reading to continuous reading on the reading fluency and comprehension
of struggling readers in the second and fourth grades. 16 students with learning disabilities and
21 struggling readers without learning disabilities participated in this study. Students were put
into trios based on their fluency scores on the Gray Oral Reading Tests, Fourth Edition (GORT-

29
4; Wiederholt & Bryant, 2001) and then randomly assigned to one of three conditions – repeated
reading (RR), continuous reading (CR), or control. Among the 17 students with learning
disabilities, 6 were assigned to RR, 6 to CR, and 5 to the control group. In the RR condition,
students were provided with a book and asked to read each page three times for a total of 15min.
During CR, students were provided with the same book as those in RR but were asked to read for
15min without rereading pages (i.e. read the book straight through). The researchers did not
provide intervention for the students in the control group. Three reading measures – the Peabody
Picture Vocabulary Test-Third Edition (Dunn, Dunn, & Dunn, 1997), the Woodcock Reading
Mastery Tests-NU (Woodcock, 1998), and the GORT-4 (Wiederholt & Bryant, 2001) – were
administered as pretests, midway tests, and posttests to assess the dependent variables of reading
rate, word identification, and reading comprehension of sentences comprehension between
repeated reading versus continuous reading. Results indicated no significant differences between
repeated reading and continuous reading conditions. There were, however, significant
differences between students receiving intervention, either repeated reading or continuous
reading, and those in the control group.
Therrien and Hughes (2008) implemented a study to compare the effects of repeated
reading and question generation on students’ reading fluency and comprehension. 32 students in
fourth through sixth grades with learning disabilities in reading or who were at risk for reading
failure were randomly assigned to repeated reading or question generation conditions. A 2-level
(repeated reading or question generation) single-factor design was used to measure correct words
per minute (CWPM) and correct answers to factual and inferential comprehension questions.
During the repeated reading condition, students orally reread each passage until reading a
preestablished number of CWPM; regardless of criteria, each passage was read at least twice and
30
no more than four times. Error correction was provided during and at the end of each passage.
During the question generation condition, students were first presented with a cue card with story
structure questions. They read the questions and then orally read the passage once. Error
correction was provided during and at the end of each passage. Then the students were asked to
answer the questions orally. If the wrong answer or no answer was provided, a prompt was given
to look for the information in the passage. If the wrong answer was still provided, the tutor
pointed to the sentence where the answer could be found. In the event the wrong answer was
provided a third time, the tutor pointed out the correct answer. “The results of the study indicate
that (a) repeated reading improves students’ fluency on passages that are reread and (b) when
reading instructional-level material, repeated reading is more effective at improving factual
comprehension than question generation” (Therrien & Hughes, 2008, p. 1).
Vaughn et al. (2000) studied the effects of fluency and comprehension instruction on
reading rate, accuracy, and comprehension outcomes. 111 students participated in the study; 16
participants qualified for special education or were identified by the school system as having
dyslexia. The students were separated into two treatment groups where one group participated in
partner reading (PR) while the other group participated in collaborative strategic reading (CSR).
In the PR strategy, students were put into dyads with one student being a stronger reader than the
other. Partners took turns reading for three min during which Partner 1 modeled fluent reading.
Partner 2 then read the same passage while Partner 1 used word-correction procedures. Next,
both partners were timed for 1 min and individually self-charted their total words read. There
were seven students with reading disabilities in the PR treatment group. In the CSR strategy,
students worked in pairs and used four comprehension strategies throughout the sessions:
preview, click and clunk, get the gist, and wrap up. There were nine students with reading
31
disabilities in the CSR treatment group. The researchers used a pretest-posttest group comparison
design to test the PR and CSR interventions on the dependent variables – fluency (correct words
per minute) and comprehension as measured by the Test of Reading Fluency (Children’s
Educational Services, 1987) and the Gray Oral Reading Tests-3 (Gray, 1992). Results indicated
statistically significant effects for rate of reading and correct words per minute in both treatment
groups for all students, including those with reading disabilities. There were not statistically
significant effects for accuracy or comprehension in either treatment group.
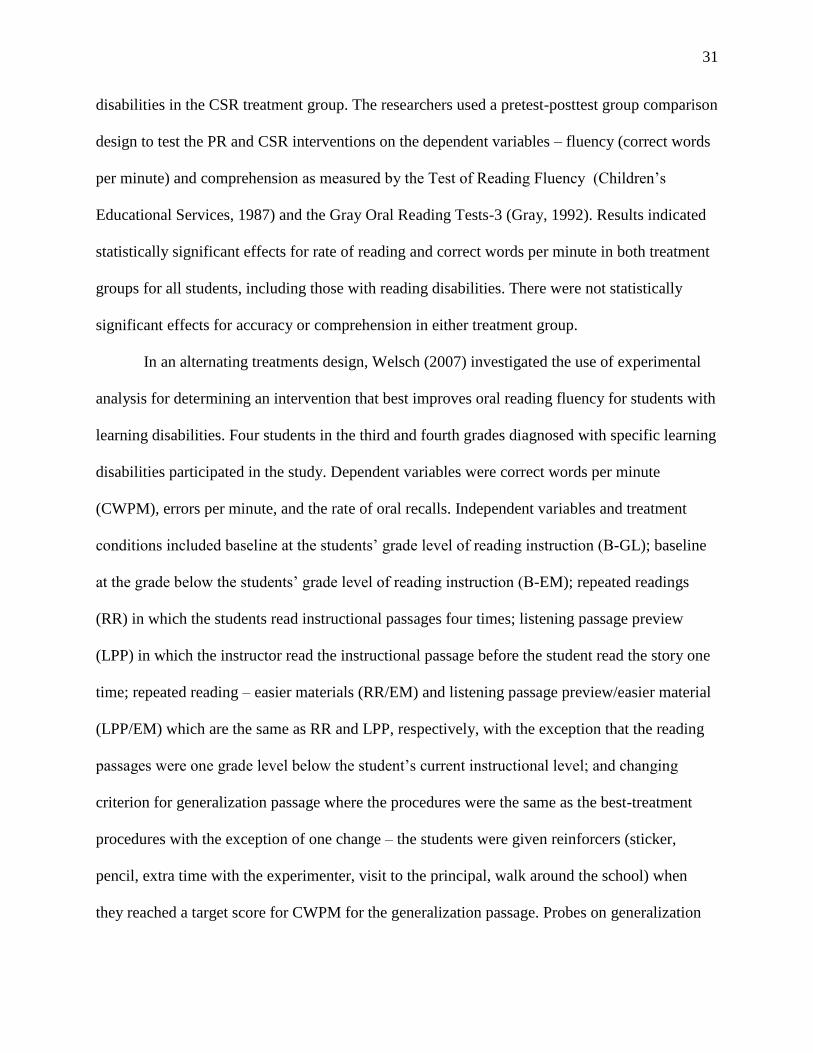
In an alternating treatments design, Welsch (2007) investigated the use of experimental
analysis for determining an intervention that best improves oral reading fluency for students with
learning disabilities. Four students in the third and fourth grades diagnosed with specific learning
disabilities participated in the study. Dependent variables were correct words per minute
(CWPM), errors per minute, and the rate of oral recalls. Independent variables and treatment
conditions included baseline at the students’ grade level of reading instruction (B-GL); baseline
at the grade below the students’ grade level of reading instruction (B-EM); repeated readings
(RR) in which the students read instructional passages four times; listening passage preview
(LPP) in which the instructor read the instructional passage before the student read the story one
time; repeated reading – easier materials (RR/EM) and listening passage preview/easier material
(LPP/EM) which are the same as RR and LPP, respectively, with the exception that the reading
passages were one grade level below the student’s current instructional level; and changing
criterion for generalization passage where the procedures were the same as the best-treatment
procedures with the exception of one change – the students were given reinforcers (sticker,
pencil, extra time with the experimenter, visit to the principal, walk around the school) when
they reached a target score for CWPM for the generalization passage. Probes on generalization

32
passages were conducted in each phase of the study. The best treatment for three of the
participants was the RR/EM condition while RR was the best treatment for the remaining
participant. During the students’ best treatment phases, CWPM and recalls per minute increased
while the rate of errors per minute steadily decreased.
Repeated Reading as Part of a Package of Interventions
Five studies employed repeated reading as part of a package of other interventions to
determine the effects on reading skills. Denton et al. (2006) used an intervention package with
Phono-Graphix (McGuiness & McGuiness, 1999) and Read Naturally (Ihnot, Mastoff, Gavin, &
Hendrickson, 2001). Manset-Williamson and Nelson (2005) compared guided reading
instructional procedures to explicit comprehension procedures (both employing passage
rereading) and their effects on reading fluency, decoding, and reading comprehension. Tam et al.
(2006) employed an intervention consisting of vocabulary instruction, error correction, and
fluency comprehension to examine the effects on oral reading rate and comprehension. Therrien
et al. (2006) employed a reread-adapt and answer-comprehend intervention to improve reading
fluency and comprehension. Vadasy and Sanders (2008) used the Quick Reads (Hiebert, 2003)
program to measure participants’ attention, reading fluency, decoding, vocabulary, and
comprehension skills.
Denton et al. (2006) evaluated the effects of an intervention package with decoding and
fluency skills elements on the reading performance of 27 students with reading difficulties and
reading disabilities. There were 5 participants in first grade, 11 in second grade, and 11 in third
grade. A multiple-baseline between groups and between interventions design was used, but for
analysis purposes, the authors focused on within-group pre- and posttest comparisons. The
independent variable consisted of a package employing the use of the Phono-Graphix

33
(McGuiness & McGuiness, 1999) and Read Naturally (Ihnot et al., 2001) programs while the
dependent variables were measured in four waves at 8-week intervals and included Woodcock-
Johnson III Tests of Achievement (WJ-III; Woodcock, McGrew, & Mather, 2001) Word Attack,
Word Identification, Spelling, and Passage Comprehension scores; Test of Word Reading
Efficiency (TOWRE; Torgesen, Wagner, & Rashotte, 1999) Sight Word Fluency in words per
minute and TOWRE (Torgesen et al., 1999) Phonemic Decoding Fluency in nonwords per
minute; and GORT-4 (Wiederholt & Bryant, 2001) Fluency and Comprehension raw scores.
Students in the two groups received identical interventions – the Phono-Graphix (McGuiness &
McGuiness, 1999) program for the first 8 weeks of intervention and the Read Naturally (Ihnot et
al., 2001) program for the second 8 weeks of intervention. The students received intervention
outside of their normal classrooms. The Phono-Graphix (McGuiness & McGuiness, 1999)
program was used as a decoding portion of the intervention. There are four stages in this
program. The first stage is basic and includes objectives such as understanding that letters
represent sounds, spoken words are made up of sounds, that reading is done from left to right,
and being able to segment and blend sounds in spoken words. In the fourth and most advanced
stage, students “learn to read and spell multisyllable words” and understand that words with
more than one syllable have an accented syllable and that “many multisyllable words contain a
weak vowel sound (schwa)” (Denton et al., 2006, p. 451). The Read Naturally (Ihnot et al.,
2001) program was used to increase the oral reading fluency of the participants. The main
components of this program are reading with a model, repeated reading of expository passages,
and goal-setting and progress monitoring. In the repeated reading portion of this intervention, the
student (a) independently read the passage for 1 min; (b) graphed the correct words per minute;
(c) orally read the passage along with an audio model (tape, CD, or computer) and practiced with

34
and without the supportive modeling until a predetermined fluency criteria is mastered; (d) orally
read the passage while being timed by the teacher; and (e) graphed the correct words per minute,
comparing the fluency rates of the first and last readings as well as comparing the rate with a
preestablished goal rate. To “pass” a reading, the student must have met the fluency goal rate,
made no more than three errors, and read with appropriate phrasing. If the student didn’t “pass”,
he had to practice the passage with or without the supportive modeling and complete another
final timed reading. Results indicated significant improvement in reading decoding, fluency, and
comprehension. Individual performances were variable, but 12 of the 27 participants illustrated a
significant positive response to the package of interventions.
Using a randomized comparison group design, Manset-Williamson and Nelson (2005)
compared two strategic reading interventions on the reading skills of elementary and middle
school students with reading disabilities. A component of the interventions was passage
rereading (i.e. repeated reading). 20 students with reading disabilities ranging in age from 9 to 14
years and in grades four through eight were randomly assigned to one of two treatment
conditions – guided reading instructional procedures (PDF/GR) or explicit comprehension
procedures (PDF/EC). Both treatment conditions followed the same format of a daily
curriculum-based measurement (CBM) probe, phonological awareness/analysis training,
instruction in decoding strategies, a comprehension component, and passage rereading. The
treatments differed with regard to the “explicitness with which reading comprehension strategies
were taught” (Manset-Williamson & Nelson, 2005, p. 65). In the PDF/GR procedure,
comprehension strategies were introduced and modeled by tutors working with the participants.
In the PDF/EC condition, direct instruction of comprehension strategies and self-regulation
strategies was provided. Dependent variables consisted of standard scores on four subtests

35
(Letter-Word Identification, Reading Fluency, Passage Comprehension, and Word Attack) of the
Woodcock-Johnson III Tests of Achievement, raw scores on informal measures of passage
comprehension designed for the study (oral retell quality, number of main ideas recalled, and
number of correct answers to multiple choice questions), and the number of correct words read
per minute on daily CBM probes. The results yield an overall increase in the participants’
reading decoding, fluency, and comprehension. “Gains in formal measures of word attack and
reading fluency after five weeks of intervention translated into grade-equivalent gains of
approximately half a school year. Analysis of the trends in the daily informal fluency probes
translated into a weekly gain of 1.28 correct words per minute” (Manset-Williamson & Nelson,
2005, p. 59).
In a multiple baseline across subjects design, Tam et al. (2006) evaluated the effects of a
reading instruction intervention on the oral reading rate and comprehension. The reading
intervention consisted of vocabulary instruction, error correction, and fluency building. Five
English-language learners in third through fifth grades participated in the study. Two of the
participants were identified as having a Learning Disability and were in the third grade, and one
participant was classified as having a developmental disability; for the purpose of this review,
only the participants with a Learning Disability will be discussed. The dependent variables were
words read correctly per minute, words read incorrectly per minute, measurement of reading rate,
and correct answers to comprehension questions. During baseline, each participant was asked to
read a passage three times and to answer comprehension questions about the passage. During the
story-telling phase, the researcher read a storybook to the participant for 15 min and asked literal
comprehension questions about the story; no feedback or response prompts were provided during
this phase. After the storybook, the same procedures were followed as those in baseline. The
36
story-telling phase was used to control for time effects since the participants received
intervention for approximately the same amount of time. In the next condition, called new
passage each session, the participants received a new reading passage each session. Each session
consisted of vocabulary instruction, initial untimed reading of the passage with error correction,
and three fluency-building reading trials. The next condition, called same passage to criterion,
was implemented the same as the new passage each session condition except that the participants
did not change reading passages each session. The participants read the same passage until a
predetermined criterion was met, at which a new reading passage was introduced. Results
indicated that both students with a Learning Disability demonstrated a marked increase in their
oral reading rates and comprehension during the new passage each session and same passage to
criterion conditions. One out of the two students made gains in reading rate.
Therrien et al. (2006) conducted a study to determine if a reread-adapt and answer-
comprehend (RAAC) intervention improved the reading fluency and comprehension of
elementary and middle school students with learning disabilities (n = 16) or who were at risk for
reading failure (n = 14). There were 13 students in the fourth grade, 10 in the fifth grade, 6 in the
seventh grade, and 1 in the eighth grade. In a two-level single factor pre/postexperimental
design, students were assigned through stratified random assignment to a treatment or a control
group. Students in the intervention group received the eight-step RAAC intervention; this
intervention combines repeated readings with question generation to improve reading
achievement. The eight steps of the intervention were: 1) the teacher asks the student read
quickly and accurately while paying attention to the story; 2) the student read a cue card with
generic story structure questions; 3) the student orally reread the passage until reading a
preestablished number of correct words per minute (CWPM); 4) the teacher gave corrective

37
feedback on errors; 5) the teacher prompted the student to answer the questions on the cue card
while providing scaffolded assistance; 6) the teacher asked comprehension questions about the
story; 7) steps 1 through 6 were repeated the following session until 8) the teacher adjusted the
reading material by raising or lowering the reading material by one grade level based on the
student’s performance on the previous sessions. The dependent variables were pretest and
posttest scores on the DIBELS Oral Reading Fluency (ORF) subtest and the Broad Reading scale
on the WJ-III as well as CWPM and the number of factual and inferential questions answered
correctly. The scores of students in the treatment group on the pretest/posttest measures included
an average increase of 13.0 CWPM on the DIBELS ORF subtest and an average increase of 6.2
in the standard scores as measured by the WJ-III Broad Reading subtests. After the intervention,
“students increased the instructional grade level of the passages read in the intervention an
average of 2.07 grade levels” and read “an average of 22.16 seconds faster on the last passage
readings than the first readings” (Therrien et al, 2006, p. 93). Additionally, students receiving the
intervention improved their ability to answer comprehension questions that were reread.
Implementing a randomized group pretest-posttest design, Vadasy and Sanders (2008)
determined the effectiveness of the Quick Reads (Hiebert, 2003) program used as a supplemental
fluency intervention for fourth and fifth graders with below-level reading skills. Fifth-grade
participants were assigned to dyads and randomly assigned to either the treatment group
(supplemental Quick Reads [Hiebert, 2003] tutoring) or the control group (classroom instruction
only without tutoring). Out of 54 participants in the treatment group, 10 received special
education services. 17 out of 65 participants in the control group received special education
services. During the Quick Reads (Hiebert, 2003) tutoring sessions, each passage was read three
times. In the first read, the tutor activated background knowledge, and the students first
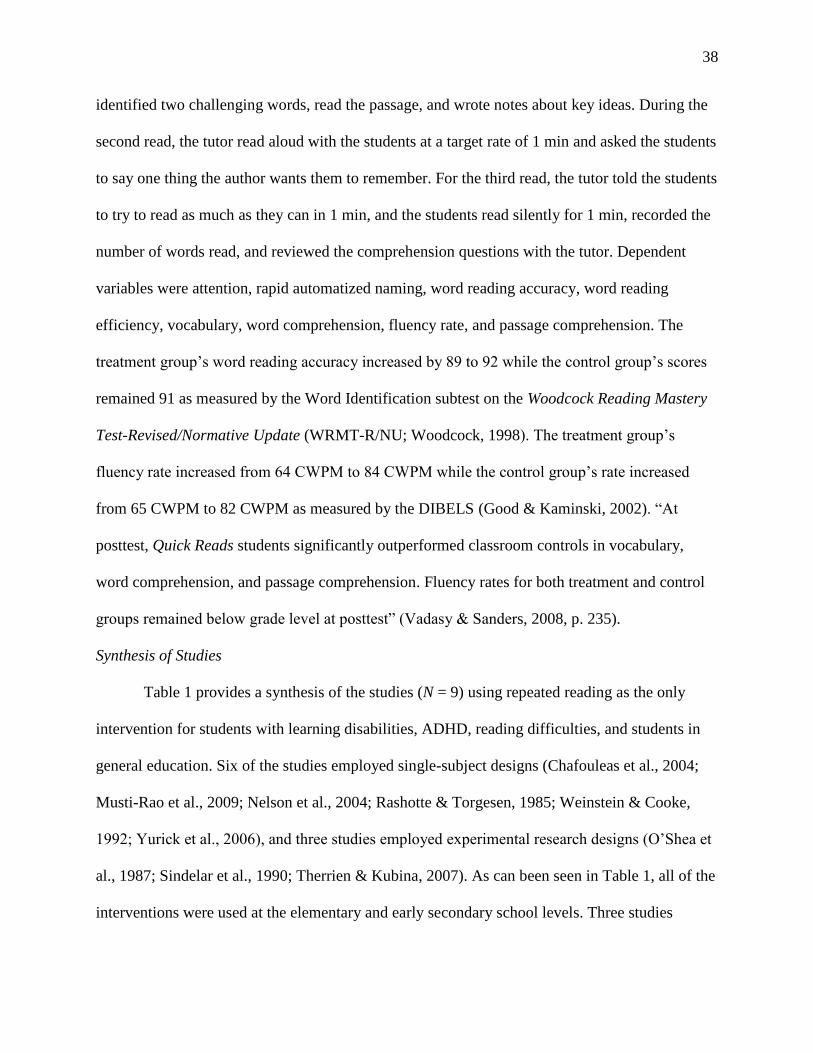
38
identified two challenging words, read the passage, and wrote notes about key ideas. During the
second read, the tutor read aloud with the students at a target rate of 1 min and asked the students
to say one thing the author wants them to remember. For the third read, the tutor told the students
to try to read as much as they can in 1 min, and the students read silently for 1 min, recorded the
number of words read, and reviewed the comprehension questions with the tutor. Dependent
variables were attention, rapid automatized naming, word reading accuracy, word reading
efficiency, vocabulary, word comprehension, fluency rate, and passage comprehension. The
treatment group’s word reading accuracy increased by 89 to 92 while the control group’s scores
remained 91 as measured by the Word Identification subtest on the Woodcock Reading Mastery
Test-Revised/Normative Update (WRMT-R/NU; Woodcock, 1998). The treatment group’s
fluency rate increased from 64 CWPM to 84 CWPM while the control group’s rate increased
from 65 CWPM to 82 CWPM as measured by the DIBELS (Good & Kaminski, 2002). “At
posttest, Quick Reads students significantly outperformed classroom controls in vocabulary,
word comprehension, and passage comprehension. Fluency rates for both treatment and control
groups remained below grade level at posttest” (Vadasy & Sanders, 2008, p. 235).
Synthesis of Studies
Table 1 provides a synthesis of the studies (N = 9) using repeated reading as the only
intervention for students with learning disabilities, ADHD, reading difficulties, and students in
general education. Six of the studies employed single-subject designs (Chafouleas et al., 2004;
Musti-Rao et al., 2009; Nelson et al., 2004; Rashotte & Torgesen, 1985; Weinstein & Cooke,
1992; Yurick et al., 2006), and three studies employed experimental research designs (O’Shea et
al., 1987; Sindelar et al., 1990; Therrien & Kubina, 2007). As can been seen in Table 1, all of the
interventions were used at the elementary and early secondary school levels. Three studies

39
required that students repeatedly read passages three times, one study required that students
repeatedly read passages four times, and one study required that students repeatedly read
passages three and seven times. In three studies, students were asked to repeatedly read passages
until meeting preestablished criterion. In five studies, students received corrective feedback after
reading passages. In addition, researchers in four studies assigned students to dyads to participate
in partner reading while repeatedly reading passages.
Table 2 provides a synthesis of the studies (N = 7) comparing the effects of repeated
reading to the effects of other reading interventions for students with learning disabilities,
reading difficulties, and students in general education. Most of the studies (N = 5) employed
experimental research designs (Ellis & Graves, 1990; Mathes & Fuchs, 1993; O’Connor et al.,
2007; Therrien & Hughes, 2008; Vaughn et al., 2000), while the remainder of the studies (N = 2)
employed single-subject designs (Begeny et al., 2006; Welsch, 2007). As can been seen in Table
2, all of the interventions were used at the elementary and early secondary school levels. Three
studies required that students read passages three times in the repeated reading conditions, one
study required that students repeatedly read passages four times, and one study required that
students repeatedly read until they found the main idea of the passages. One study asked students
to repeatedly read passages until meeting preestablished criterion. In three studies, students
received corrective feedback after reading passages. In addition, two studies assigned students to
dyads to participate in partner reading while repeatedly reading passages. One study assigned
students to trios.
Table 3 provides a synthesis of the studies (N = 5) utilizing repeated reading as part of an
intervention package to increase the reading skills of students with learning disabilities, other
health impairments, behavioral disorders, developmental disabilities, reading difficulties,

40
students in general education, and students who are English Language Learners. Three of the
studies employed experimental research designs (Manset-Williamson & Nelson, 2005; Therrien
et al., 2006; Vadasy & Sanders, 2008), and two of the studies employed single-subject research
designs (Denton et al., 2006; Tam et al., 2006). As can been seen in Table 3, all of the
interventions were used at the elementary and early secondary school levels. Two studies used
published and researched reading programs as the interventions. Denton et al. (2006) used
Phono-Graphix (McGuiness & McGuiness, 1999) and Read Naturally (Ihnot et al., 2001) and
Vadasy and Sanders (2008) used the Quick Reads (Hiebert, 2003) program. One study required
that students repeatedly read passages two times, two studies required that students repeatedly
read passages three times, and two studies required that students repeatedly read passages until
meeting preestablished criterion. In three studies, students received corrective feedback after
reading passages.
Limitations
There are several limitations of the studies included in this literature review. First, many
of the studies did not have a homogeneous group of students. Only eight studies exclusively used
students with learning disabilities. Many included both participants receiving special education
support and those considered as “struggling readers” but not receiving special education support.
One study (Denton et al., 2006) included students with learning disabilities, student with other
health impairments, students with behavioral disorders, and students without disabilities. Since
participants with different educational needs were often included in one study, it was often
difficult to differentiate between the results of the students with disabilities and those without.
Though difficult to find, the use of homogeneous populations in repeated reading studies would
be beneficial to educators wanting to replicate methods in their own classrooms.

41
Second, it was difficult to compare one study to another due to sample size and
participant characteristics differences. In addition, characteristics of the participants were not
always clarified. For example, 6 studies did not include participant ages, and 15 studies did not
provide information on participant IQs. Future research should include all participant
characteristics so that educators can determine which strategy may be useful for the particular
population they are working with.
Third, long-term measures of the effectiveness of reading fluency interventions were not
measured in any of the studies. It would be useful to know if students who benefited from the use
of repeated reading interventions maintained their increased reading skills over time. Future
research should include maintenance conditions to determine the long-term effectiveness of
repeated reading.
Fourth, only two studies investigated the use of repeated reading with passages
incorporating varying degrees of word overlap (Rashotte & Torgesen, 1985; Therrien & Kubina,
2007). The results of both studies indicated that reading contextual words increases reading
speed and word recognition more than reading noncontextual words. Additionally, reading speed
is positively affected by repeated reading as long as there is a high degree of word overlap
among different stories. There should be more research to determine the effectiveness of
contextual repeated reading with word overlap between passages.
Last, most studies did not employ the sole use of repeated readings to increase reading
skills. There were often other interventions used (i.e. partner reading, intervention packages,
tangible rewards, self-charting, corrective feedback, comprehension, decoding strategies) along
with repeated readings. Each study employed differing interventions. It was difficult to
determine which intervention was more effective. Future research should include replications

42
and studies employed similar independent variables to ascertain which repeated reading
interventions are most effective.
Conclusions
Overall, the results of the studies reviewed suggest that the use of repeated reading as the
sole intervention or as part of an intervention package can increase the oral reading fluency and
reading comprehension of elementary both students with and without learning disabilities. The
findings suggest several important issues that are worth discussion. Among studies utilizing
repeated reading methods as part of an intervention package, the results were unanimously
positive. All studies revealed that a holistic reading intervention, using repeated reading as a
component, results in increased reading skills.
Among studies utilizing repeated reading as the only intervention, the use of corrective
feedback and/or systematic error correction combined with repeated reading was more effective
than repeated reading alone (Chafouleas et al., 2004; Nelson et al., 2004). Second, the use of
peer-mediated reading (i.e. partner reading) combined with repeated reading was successful in
increasing students’ reading skills (Yurick et al., 2006). Third, students’ oral reading fluency and
comprehension skills increased the more times a passage was re-read (O’Shea et al., 1987;
Sindelar et al., 1990). Fourth, reading skills improved as the number of overlapping words
increased over passages (Rashotte & Torgesen, 1985) and as students repeatedly read passages
words in context compared to reading randomized words out of context (Therrien & Kubina,
2007).
Among studies comparing the use of repeated reading to other interventions, the results
were somewhat mixed. Therrien and Hughes (2008) found that repeated reading is more
effective than question generation at improving factual comprehension. In addition, Welsch

43
(2007) concluded that repeated reading with and without easier materials was more effective
than listening passage preview methods to improve oral reading fluency. Two studies found that
repeated reading was no more effective than phrase drill error correction (Begeny et al., 2006) or
continuous reading (O’Connor et al, 2007) in oral reading fluency and comprehension. Two
studies found that repeated reading was less effective than paraphrasing strategy instruction
(Ellis & Graves, 1990) and peer-mediated sustained reading (Mathes & Fuchs, 1993) in fluency
and comprehension.

44
Table 1: Repeated Reading as the Only Intervention
Citation Participants Intervention Procedures Results
Chafouleas,
Martens,
Dobson,
Weinstein, &
Gardner
(2004)
N = 3
n = 1 LD
n = 2
General Ed.
8 to 9 years
Grade 2
Instructional
packages used
were Repeated
Readings (RR),
Repeated
Readings with
Performace
Feedback
(RR/FB), and
Repeated
Readings with
Performance
Feedback and
Contingent
Reward
(RR/FB/REW).
Alternating
treatments design.
RR – students read
each passage 3 times.
RR/FB – students
were told how many
words they read
correctly.
RR/FB/REW –
students were told
they would receive a
chosen tangible
reward if they read at
least one more word
than the previous
session.
Student with LD
indicated RR/FB
produced the
largest
improvement in
correct words per
minute followed
by RR/FB/REW
followed by RR
alone. She
displayed a
decreasing trend in
errors per minute.
Musti-Rao,
Hawkins, &
Barkley
N = 12
n = 3 LD
n = 1 OHI
n = 1 CD
n = 1 SED
9.3 to 12.5
years
Grade 4
Peer-mediated
repeated readings
to measure
students’ oral
reading fluency
through correct
words per minute.
Multiple-baseline
across participants
design.
Baseline – students
asked to silently read
a book for 30 min.
Students then asked
to orally read
DIBELS* Oral
Reading Fluency
passage.
Paired Repeated
Readings (RR) – 10
min of partner
reading with
feedback and self-
correction followed
by 1 min individual
readings. If students
met criteria on third
day of RR, they
received a tangible
reward.
All students
illustrated
increases in
fluency rates.
Students able to
meet criteria on
practice passages,
but none met end-
of-year goals on
spring benchmark
assessments.
Nelson, Alber,
& Gordy
(2004)
N = 4
n = 3 LD
n = 1 ADHD
Systematic error
correction and
systematic error
Multiple-baseline
across participants
design.
Minimal increase
in correct words
per minute with a

45
8.2 to 9.6
years
Grade 2
correction
combined with
repeated reading.
Systematic error
correction condition –
students received
systematic feedback
for errors made
during oral reading.
Systematic error
correction combined
with repeated reading
condition – students
read passages three
times followed by
systematic feedback
for errors made
during oral readings.
Systematic error
correction combined
with repeated reading
of previously read
materials condition –
students read
passages used during
baseline.
decrease in errors
per minute when
the students
received
systematic error
correction alone.
When receiving
systematic error
correction
combined with
repeated reading,
all students
displayed an
increase in correct
words per minute
and a decrease in
errors per minute.
O’Shea,
Sindelar, &
O’Shea (1987)
N = 32
n = 32 LD
11.3 to 13.6
years
Grades 5-8
IQ = 73-120
Repeated reading
(1, 3, and 7 times)
combined with
either a fluency
component or a
comprehension
component.
2 (focus) x 3 (no. of
readings) factorial
design.
Fluency group –
students read
passages 1, 3, and 7
times. When finished
reading, they were
praised for reading
quickly and
accurately, given a
tangible reward, and
asked to tell what
they remembered
from the story.
Comprehension
group – students read
passages 1, 3, and 7
times. When finished
reading, the were
asked to tell what
they remember from
the story, praised for
Students read
more accurately
the more times
they repeated a
passage. Students
retold a story more
accurately the
more times they
repeated a
passage. Students
in the
comprehension
group recalled and
comprehended
more of the stories
than students in
the fluency group.

46
remembering so
much, and given a
tangible reward.
Rashotte &
Torgesen
(1985)
N = 12
n = 12 LD
8.6 to 12.0
years
Grades 2-5
2 repeated reading
conditions with
varying degrees
of word overlap
among passages.
1 nonrepetitive
reading condition
without word
overlap among
passages.
Pretest posttest ABC
design.
Students assigned to
dyads with a high and
a low reader.
Condition 1 –
students read 1 of 7
passages 4 times each
day. The passages
had minimal word
overlap (20 common
words among
passages).
Condition 2 –
students read 1 of 7
passages 4 times each
day. The passages
had high degree of
word overlap (60
common words
among passages).
Condition 3 –
students read 4
different stories.
Passages were not
repeatedly read.
In all conditions,
comprehension
questions were asked
after the first reading.
After each reading,
students were
provided with
feedback about
reading speed and
number of errors
made.
Reading speed is
positively affected
by repeated
readings as long as
there is high
degree of word
overlap among
different stories.
There are not
significant
differences in
errors read and
comprehension
between repeated
readings and
nonrepetitive
readings.
Sindelar,
Monda, &
O’Shea (1990)
N = 50
n = 25 LD
n = 25
General Ed.
Ages not
reported
Independent
variables were
classification (LD
or nondisabled),
level
(instructional or
2x2x2 factorial
design.
Treatment –
comparison.
Dyads were assigned
with 1 student with
Fluency and recall
significantly
increased from 1
to 3 readings for
all students. Errors
per minute for

47
Grades 3-5 mastery), and
number of
readings (1 or 3).
LD and 1 nondisabled
student.
Students were asked
to read 2 stories – one
once and the other 3
times. Students were
instructed to read the
story and remember
as much as possible.
At the end of the
reading(s) of each
story, students were
asked to retell the
story. Then they were
thanked and given a
tangible reward.
students with LD
decreased from 1
to 3 readings
while errors per
minute slightly
increased for
students without
disabilities.
Effects of repeated
readings were
comparable for
students with and
without LD.
Therrien &
Kubina (2007)
N = 16
n = 2 LD
n = 14
General Ed.
Ages not
reported
Grades 3-5
All students
participated in 2
repeated reading
conditions – 1
with passages
with words in
context and 1 with
randomized words
out of context.
2 (type of training
materials) x 2 (order
of training materials)
factorial design.
Condition 1 –
Students were given
an easy passage to
orally repeatedly read
until reaching 93
CWPM. Next,
students were given
an experimental
passage with words in
context to repeatedly
read until reaching 93
CWPM or until it was
read 6 times. Last,
students were given a
transfer passage (with
an average of 55%
overlapped words)
and asked to read it
once quickly and
accurately.
Condition 2 –
Students were given
randomized words
out of context to
orally repeatedly read
until reading 93
Reading
contextual words
increases reading
speed and word
recognition more
than reading
noncontextual
words.

48
CWPM or until they
were read 6 times.
On the second day,
the students switched
conditions.
Weinstein &
Cooke (1992)
N = 4
n = 4 LD
8.1 to 10.2
years
Grades 2, 3
Two types of
mastery criteria
for repeated
reading. One type
required students
to reread a
passage until
demonstrating 3
successive
improvements.
The second type
required students
to reread a
passage until 90
CWPM was
attained.
Multitreatment
(ABACA) design.
In both conditions,
students first listened
to a taped reading of
the passage at a rate
of 100 CWPM and
then asked to orally
read the passage by
themselves.
Fixed-rate condition
– students reread the
passage until meeting
criterion of 90
CWPM.
Improvements
condition – students
reread the passage
until achieving 3
successive
improvements on
CWPM.
Each session, the
research plotted the
CWPM on a graph
and shared it with the
student.
All students made
gains in their
mean CWPM,
regardless of the
type of criterion.
Fixed-rate
condition – mean
gain of 24.9
CWPM with a
mean number of
8.2 rereadings.
Improvements
condition – mean
gain of 20.0
CWPM with a
mean number of
17.5 rereadings.
Yurick,
Robinson,
Cartledge, Lo,
& Evans
(2006)
Experiment
1:
N = 8
n = 2 LD
n = 6
General Ed.
10.7 to 11.11
years
Grade 5
Experiment
2 not
discussed –
did not
include
Peer-mediated
repeated readings
to measure
students’ oral
reading fluency
and
comprehension.
Experiment 1:
Multiple-baseline
across participants
design.
Sustained Silent
Reading (SSR) –
students asked to
silently read a
passage for 10min.
Students then asked
to orally read passage
and were asked 5
comprehension
questions.
Overall, peer-
mediated repeated
reading increased
students’ reading
fluency and
comprehension.
Experiment 1:
In SSR, the
students with LD
averaged 94
CWPM with 95%
accuracy. In RR,
they averaged 162
SWPM with 98%

49
students with
LD.
Experiment
3:
N = 6
n = 1 LD
n = 5
General Ed.
9.9 to 10.11
years
Grade 4
Paired Repeated
Readings (RR) –
10min of partner
reading with
feedback and self-
correction followed
by 1min individual
readings. Students
either self-graphed
their score or chose to
reread. When criteria
(180 CWPM and 10
or less errors) were
mastered, students
were asked
comprehension
questions. If they
were correct, they
moved onto next
level passage; if not,
they continued on the
passage until criteria
were met. Once
criteria were met,
students received a
tangible reward.
Experiment 3:
Multiple-baseline
across participants
design.
Conditions were
similar, but an
additional condition
was added
(generalization).
Generalization – 3
different
generalization
conditions: covertly-
timed, overtly-timed,
and overtly-timed and
charted
accuracy. In
addition, they
made .2 and 1.1
gains in grade
equivalency scores
on the Letter-
Word
Identification and
Passage
Comprehension
subtests,
respectively, on
the WJ-R**.
Experiment 3:
The student with
LD increased 32
CWPM in SSR to
42 CWPM in SS
but decreased
accuracy from
87% to 85%. The
student made .9,
.7, .5, and 1.4
gains in grade
equivalency scores
on the Letter-
Word
Identification,
Reading Fluency,
Passage
Comprehension,
and Word Attach
subtests,
respectively, on
the WJ-III***.
Note. LD = Learning Disability; OHI = Other Health Impairment; CD = Cognitive Disability;
SED = Severe Emotional Disability; ADHD = Attention/Deficit Hyperactivity Disorder; IQ =
intelligence quotient; CWPM = correct words per minute.

50
*DIBELS = Dynamic Indicators of Basic Early Literacy Skills by R. H. Good & R. A. Kaminski.
Copyright 2002 by Institute for the Development of Educational Achievement, Eugene, OR.
**WJ-R = Woodcock-Johnson Tests of Achievement – Revised by R. W. Woodcock & B. B.
Johnson. Copyright 1989 by Riverside Publishing, Itasca, IL.
***WJ-III = Woodcock-Johnson III Tests of Achievement by R. W. Woodcock, K. S. McGrew,
& N. Mather. Copyright 2001 by Riverside Publishing, Itasca, IL.
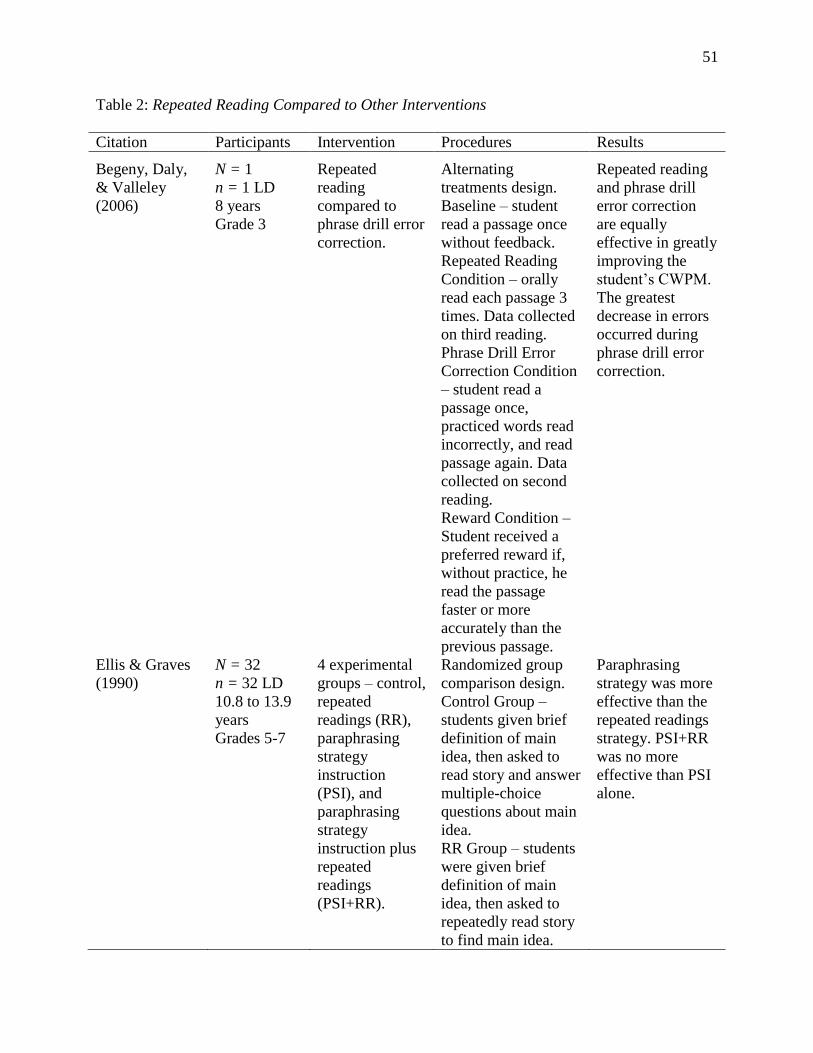
51
Table 2: Repeated Reading Compared to Other Interventions
Citation Participants Intervention Procedures Results
Begeny, Daly,
& Valleley
(2006)
N = 1
n = 1 LD
8 years
Grade 3
Repeated
reading
compared to
phrase drill error
correction.
Alternating
treatments design.
Baseline – student
read a passage once
without feedback.
Repeated Reading
Condition – orally
read each passage 3
times. Data collected
on third reading.
Phrase Drill Error
Correction Condition
– student read a
passage once,
practiced words read
incorrectly, and read
passage again. Data
collected on second
reading.
Reward Condition –
Student received a
preferred reward if,
without practice, he
read the passage
faster or more
accurately than the
previous passage.
Repeated reading
and phrase drill
error correction
are equally
effective in greatly
improving the
student’s CWPM.
The greatest
decrease in errors
occurred during
phrase drill error
correction.
Ellis & Graves
(1990)
N = 32
n = 32 LD
10.8 to 13.9
years
Grades 5-7
4 experimental
groups – control,
repeated
readings (RR),
paraphrasing
strategy
instruction
(PSI), and
paraphrasing
strategy
instruction plus
repeated
readings
(PSI+RR).
Randomized group
comparison design.
Control Group –
students given brief
definition of main
idea, then asked to
read story and answer
multiple-choice
questions about main
idea.
RR Group – students
were given brief
definition of main
idea, then asked to
repeatedly read story
to find main idea.
Paraphrasing
strategy was more
effective than the
repeated readings
strategy. PSI+RR
was no more
effective than PSI
alone.
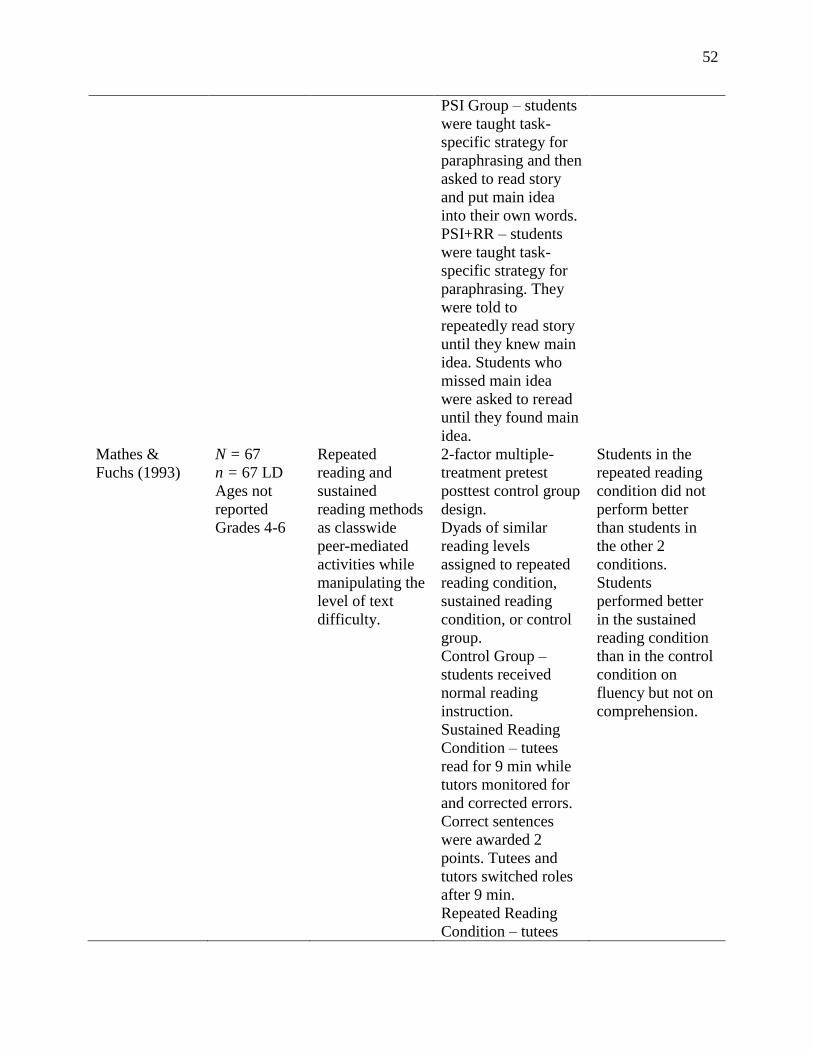
52
PSI Group – students
were taught task-
specific strategy for
paraphrasing and then
asked to read story
and put main idea
into their own words.
PSI+RR – students
were taught task-
specific strategy for
paraphrasing. They
were told to
repeatedly read story
until they knew main
idea. Students who
missed main idea
were asked to reread
until they found main
idea.
Mathes &
Fuchs (1993)
N = 67
n = 67 LD
Ages not
reported
Grades 4-6
Repeated
reading and
sustained
reading methods
as classwide
peer-mediated
activities while
manipulating the
level of text
difficulty.
2-factor multiple-
treatment pretest
posttest control group
design.
Dyads of similar
reading levels
assigned to repeated
reading condition,
sustained reading
condition, or control
group.
Control Group –
students received
normal reading
instruction.
Sustained Reading
Condition – tutees
read for 9 min while
tutors monitored for
and corrected errors.
Correct sentences
were awarded 2
points. Tutees and
tutors switched roles
after 9 min.
Repeated Reading
Condition – tutees
Students in the
repeated reading
condition did not
perform better
than students in
the other 2
conditions.
Students
performed better
in the sustained
reading condition
than in the control
condition on
fluency but not on
comprehension.
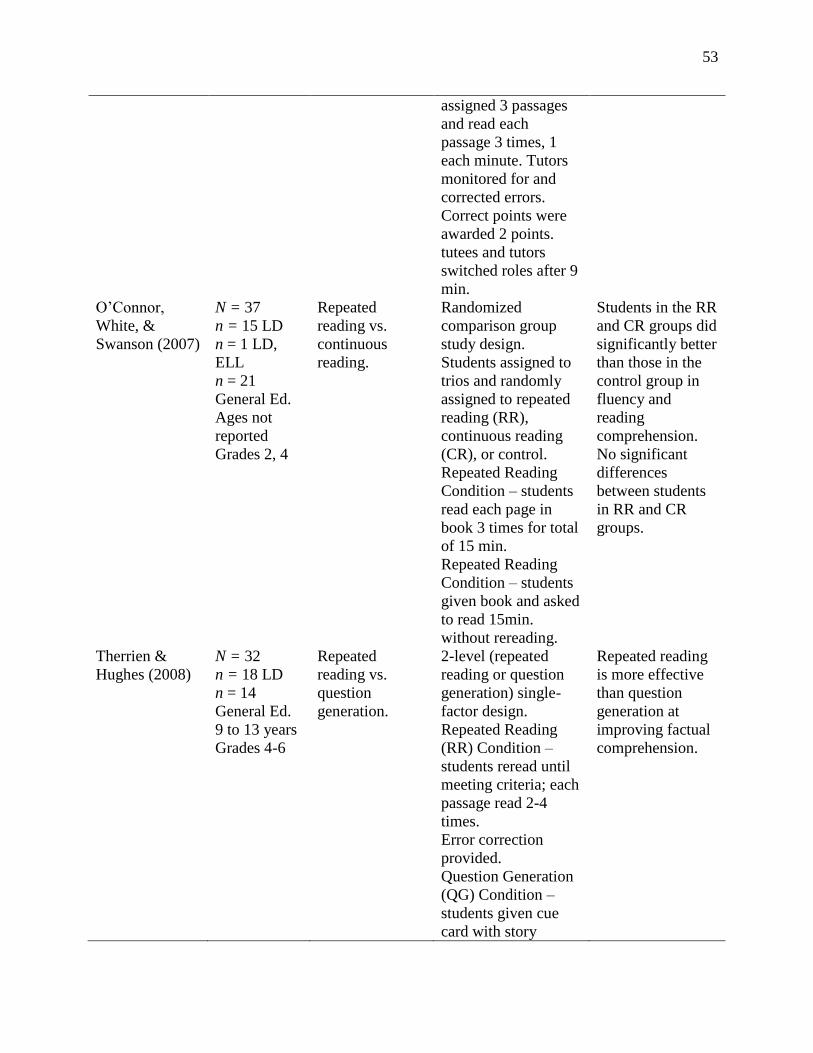
53
assigned 3 passages
and read each
passage 3 times, 1
each minute. Tutors
monitored for and
corrected errors.
Correct points were
awarded 2 points.
tutees and tutors
switched roles after 9
min.
O’Connor,
White, &
Swanson (2007)
N = 37
n = 15 LD
n = 1 LD,
ELL
n = 21
General Ed.
Ages not
reported
Grades 2, 4
Repeated
reading vs.
continuous
reading.
Randomized
comparison group
study design.
Students assigned to
trios and randomly
assigned to repeated
reading (RR),
continuous reading
(CR), or control.
Repeated Reading
Condition – students
read each page in
book 3 times for total
of 15 min.
Repeated Reading
Condition – students
given book and asked
to read 15min.
without rereading.
Students in the RR
and CR groups did
significantly better
than those in the
control group in
fluency and
reading
comprehension.
No significant
differences
between students
in RR and CR
groups.
Therrien &
Hughes (2008)
N = 32
n = 18 LD
n = 14
General Ed.
9 to 13 years
Grades 4-6
Repeated
reading vs.
question
generation.
2-level (repeated
reading or question
generation) single-
factor design.
Repeated Reading
(RR) Condition –
students reread until
meeting criteria; each
passage read 2-4
times.
Error correction
provided.
Question Generation
(QG) Condition –
students given cue
card with story
Repeated reading
is more effective
than question
generation at
improving factual
comprehension.
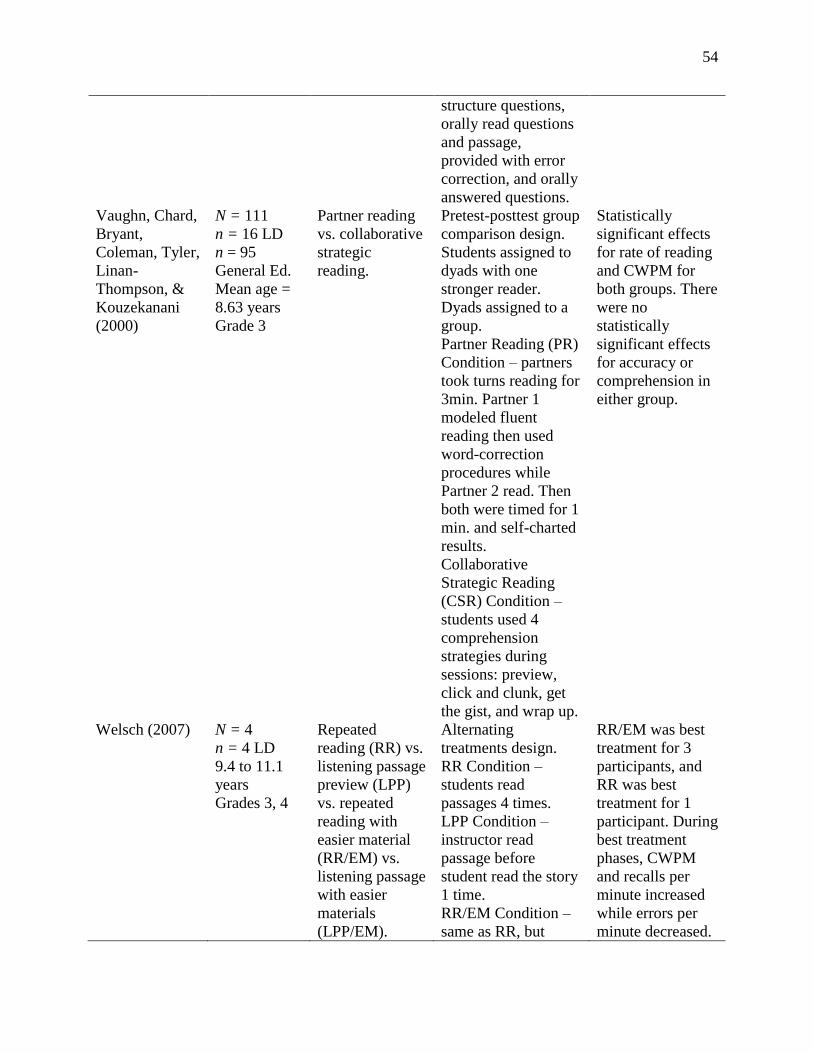
54
structure questions,
orally read questions
and passage,
provided with error
correction, and orally
answered questions.
Vaughn, Chard,
Bryant,
Coleman, Tyler,
Linan-
Thompson, &
Kouzekanani
(2000)
N = 111
n = 16 LD
n = 95
General Ed.
Mean age =
8.63 years
Grade 3
Partner reading
vs. collaborative
strategic
reading.
Pretest-posttest group
comparison design.
Students assigned to
dyads with one
stronger reader.
Dyads assigned to a
group.
Partner Reading (PR)
Condition – partners
took turns reading for
3min. Partner 1
modeled fluent
reading then used
word-correction
procedures while
Partner 2 read. Then
both were timed for 1
min. and self-charted
results.
Collaborative
Strategic Reading
(CSR) Condition –
students used 4
comprehension
strategies during
sessions: preview,
click and clunk, get
the gist, and wrap up.
Statistically
significant effects
for rate of reading
and CWPM for
both groups. There
were no
statistically
significant effects
for accuracy or
comprehension in
either group.
Welsch (2007) N = 4
n = 4 LD
9.4 to 11.1
years
Grades 3, 4
Repeated
reading (RR) vs.
listening passage
preview (LPP)
vs. repeated
reading with
easier material
(RR/EM) vs.
listening passage
with easier
materials
(LPP/EM).
Alternating
treatments design.
RR Condition –
students read
passages 4 times.
LPP Condition –
instructor read
passage before
student read the story
1 time.
RR/EM Condition –
same as RR, but
RR/EM was best
treatment for 3
participants, and
RR was best
treatment for 1
participant. During
best treatment
phases, CWPM
and recalls per
minute increased
while errors per
minute decreased.

55
passages were 1
grade level below
student’s current
instructional level.
LPP/EM – same as
LPP, but passages
were 1 grade level
below student’s
current instructional
level.
Note. LD = Learning Disability; CWPM = correct words per minute; ELL = English Language
Learners.
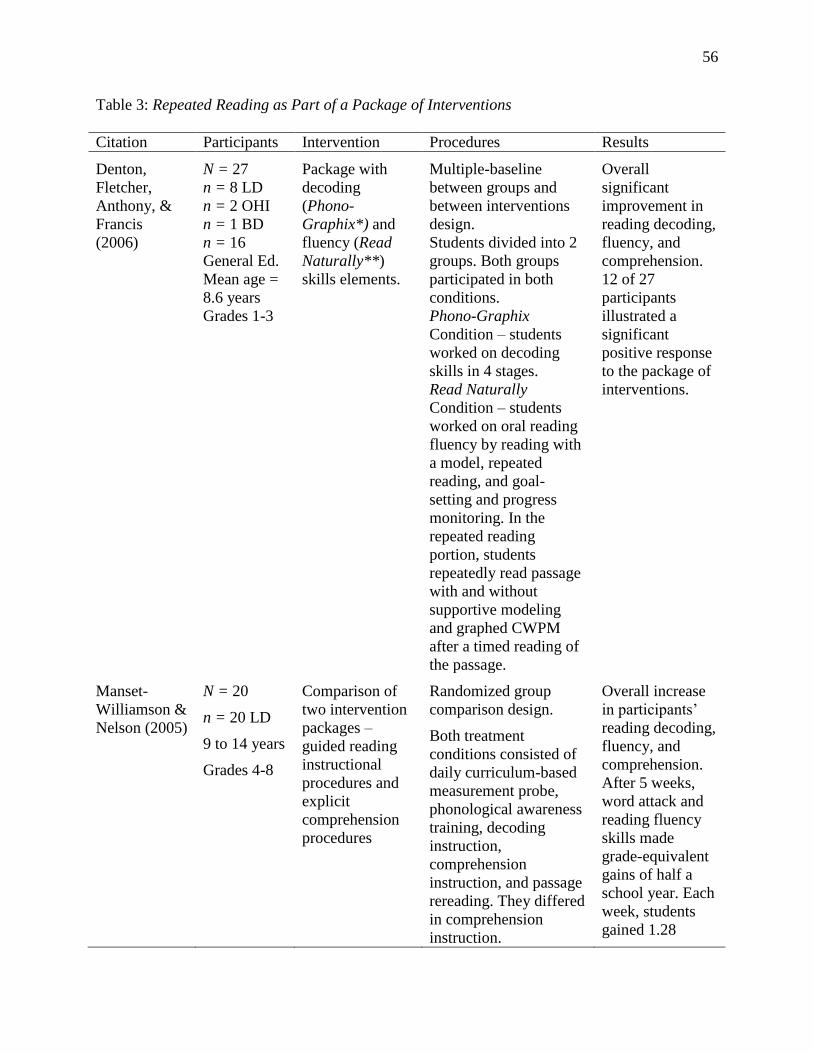
56
Table 3: Repeated Reading as Part of a Package of Interventions
Citation Participants Intervention Procedures Results
Denton,
Fletcher,
Anthony, &
Francis
(2006)
N = 27
n = 8 LD
n = 2 OHI
n = 1 BD
n = 16
General Ed.
Mean age =
8.6 years
Grades 1-3
Package with
decoding
(Phono-
Graphix*) and
fluency (Read
Naturally**)
skills elements.
Multiple-baseline
between groups and
between interventions
design.
Students divided into 2
groups. Both groups
participated in both
conditions.
Phono-Graphix
Condition – students
worked on decoding
skills in 4 stages.
Read Naturally
Condition – students
worked on oral reading
fluency by reading with
a model, repeated
reading, and goal-
setting and progress
monitoring. In the
repeated reading
portion, students
repeatedly read passage
with and without
supportive modeling
and graphed CWPM
after a timed reading of
the passage.
Overall
significant
improvement in
reading decoding,
fluency, and
comprehension.
12 of 27
participants
illustrated a
significant
positive response
to the package of
interventions.
Manset-
Williamson &
Nelson (2005)
N = 20
n = 20 LD
9 to 14 years
Grades 4-8
Comparison of
two intervention
packages –
guided reading
instructional
procedures and
explicit
comprehension
procedures
Randomized group
comparison design.
Both treatment
conditions consisted of
daily curriculum-based
measurement probe,
phonological awareness
training, decoding
instruction,
comprehension
instruction, and passage
rereading. They differed
in comprehension
instruction.
Overall increase
in participants’
reading decoding,
fluency, and
comprehension.
After 5 weeks,
word attack and
reading fluency
skills made
grade-equivalent
gains of half a
school year. Each
week, students
gained 1.28
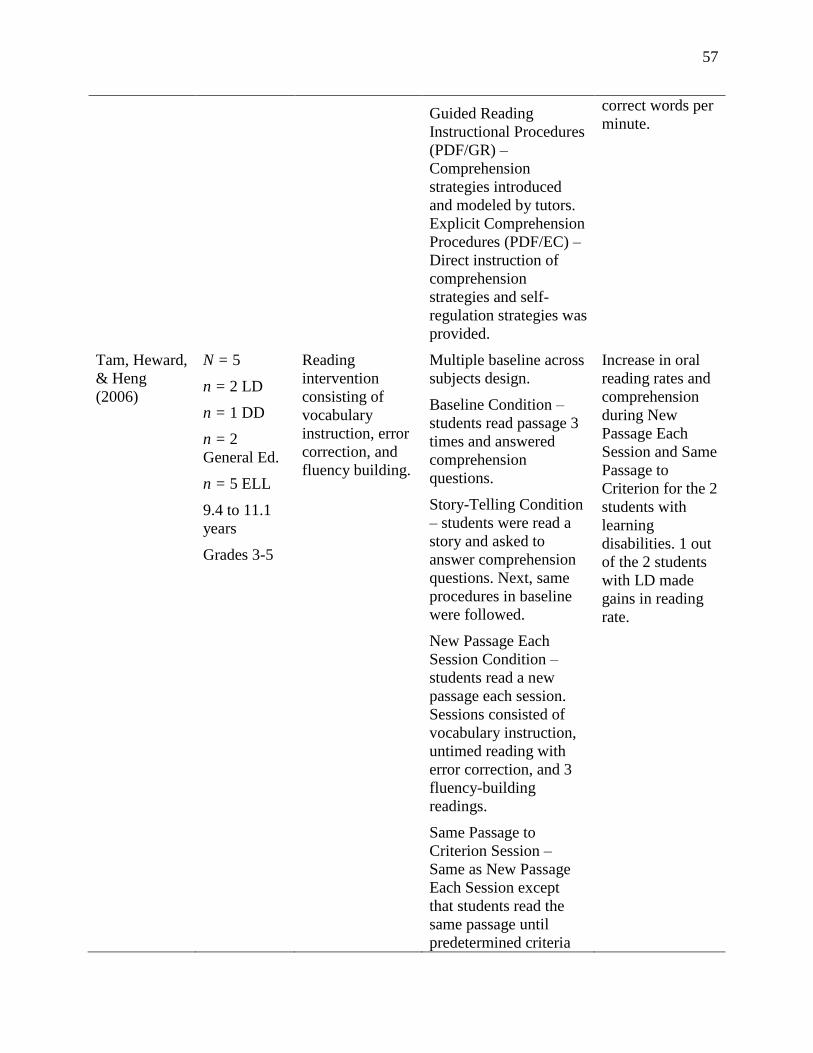
57
Guided Reading
Instructional Procedures
(PDF/GR) –
Comprehension
strategies introduced
and modeled by tutors.
Explicit Comprehension
Procedures (PDF/EC) –
Direct instruction of
comprehension
strategies and self-
regulation strategies was
provided.
correct words per
minute.
Tam, Heward,
& Heng
(2006)
N = 5
n = 2 LD
n = 1 DD
n = 2
General Ed.
n = 5 ELL
9.4 to 11.1
years
Grades 3-5
Reading
intervention
consisting of
vocabulary
instruction, error
correction, and
fluency building.
Multiple baseline across
subjects design.
Baseline Condition –
students read passage 3
times and answered
comprehension
questions.
Story-Telling Condition
– students were read a
story and asked to
answer comprehension
questions. Next, same
procedures in baseline
were followed.
New Passage Each
Session Condition –
students read a new
passage each session.
Sessions consisted of
vocabulary instruction,
untimed reading with
error correction, and 3
fluency-building
readings.
Same Passage to
Criterion Session –
Same as New Passage
Each Session except
that students read the
same passage until
predetermined criteria
Increase in oral
reading rates and
comprehension
during New
Passage Each
Session and Same
Passage to
Criterion for the 2
students with
learning
disabilities. 1 out
of the 2 students
with LD made
gains in reading
rate.

58
was met.
Therrien,
Wickstrom, &
Jones (2006)
N = 30
n = 16 LD
n = 14
General Ed.
Ages not
reported
Grades 4, 5,
7, 8
Reread-Adapt
and Answer-
Comprehend
(RAAC)
intervention.
2-level single factor
pre/postexperimental
design.
Students assigned to
treatment or control
group through stratified
random assignment.
Intervention Group –
students received the 8-
step RAAC
intervention. RAAC
combined repeated
readings with question
generation to improve
reading achievement.
Students
receiving RAAC
significantly
improved reading
speed and ability
to answer
comprehension
questions.
Students
receiving RAAC
made significant
gains in oral
reading fluency
compared to
those in control
group.
Vadasy &
Sanders
(2008)
N = 119
n = 27 LD
n = 92
General Ed.
Ages not
reported
Grades 4, 5
Quick Reads***
program used as
a supplemental
fluency
intervention.
Randomized group
pretest-posttest design.
Students assigned and
randomly assigned to
treatment or control
group.
Control Group –
students received
classroom instruction
only without tutoring.
Treatment Group –
students participated in
Quick Reads tutoring.
Each passage was read 3
times, each with a
different amount of
tutor support.
Students in the
treatment group
significantly
outperformed
students in the
control group in
vocabulary, word
comprehension,
and passage
comprehension.
Both groups
increased fluency
rates, but they
remained below
grade level.
Note. LD = Learning Disability; OHI = Other Health Impairment; BD = Behavior Disorder;
CWPM = correct words per minute; DD = Developmental Disability; ELL = English Language
Learners.
*Phono-Graphix by C. McGuiness & G. McGuiness. Copyright 1999 by Fireside, New York,
NY.
**Read Naturally by C. Ihnot, J. Mastoff, J. Gavin, & L. Hendrickson. Copyright 2001 by Read
Naturally, St. Paul, MN.
***Quick Reads by E. H. Hiebert. Copyright 2003 by Pearson Learning, Parsippany, NJ.

59
Reading Fluency Strategies for Individuals with Developmental Disabilities
Literature Search Procedures
The researcher conducted a literature review on developing and increasing reading
fluency among individuals with developmental disabilities. Two types of searches were
completed. In the first method, the researcher searched two separate databases for peer-reviewed
studies: ERIC and PsychINFO. The search of databases yielded six studies. In the second
method, the researcher conducted a hand search of the following peer-reviewed journals:
American Journal on Mental Retardation, Journal of Special Education, Remedial and Special
Education, Education and Training in Developmental Disabilities, and Journal of Autism and
Developmental Disorders. The same criteria for inclusion were followed with the exception of
the date of publication; the researcher only included journal articles from 1990 to present. This
search yielded an additional four studies. The search procedures revealed 11 studies that met the
criteria for inclusion in this literature review.
Criteria for Inclusion
The researcher searched for studies in the databases using the following guidelines. First,
participants had any level of intellectual disabilities (mild, moderate, severe, and profound).
Second, participants with co-morbid diagnoses were included, but developmental disabilities
were the primary diagnoses. Third, all ages were included. Fourth, there was not a limit on the
date of publication. Fifth, reading fluency was a dependent variable. Last, studies were carried
out with English language reading only.
Overall Study Characteristics
There were 11 studies (see Table 4) that ranged in publication date from 1989-2010, and
appeared in the following peer-reviewed journals: Remedial and Special Education, Education
60
and Training in Developmental Disabilities, Education and Treatment of Children, Preventing
School Failure, Psychology in the Schools, Reading Research and Instruction, and Journal of
Behavioral Education. A total of 610 participants (range 2 to 359) who had a mean age, of those
reported, of 12.14 (range 8.5 to 15.0) and a mean IQ of 58.4, of those reported, participated in
these studies. The total number of participants with developmental disabilities in these studies
was 152 (range 1 to 59). Participants in the studies were in grades 1 to 11 with a mean grade
level of 5.7. The majority of studies included in the review employed experimental designs.
A comprehensive reading program was the independent variable in four studies (Allor et
al., 2010; Bradford, Shippen, Alberto, Houchins, & Flores, 2006; Hurst & Jolivette, 2006; Idol,
2010), peer tutoring was used in two studies (Kamps, Locke, Delquadri, & Hall, 1989; Osborn,
Freeman, Burley, Wilson, Jones, & Rychener, 2007), repeated reading was the sole intervention
in three studies (Devault & Joseph, 2004; Mefferd & Pettegrew, 1997; Valleley & Shriver,
2003), and a combination of strategies was used in two studies (Cooke, 1993; Musti-Rao,
Hawkins, & Barkley, 2009).
Comprehensive Reading Programs
Four peer-reviewed studies investigated the effects of comprehensive reading programs
on the reading skills of students with developmental disabilities (Allor et al, 2010; Bradford,
Shippen, Alberto, Houchins, & Flores, 2006; Hurst & Jolivette, 2006; Idol, 2010). Bradford et al.
(2006) and Hurst and Jolivette (2006) used the SRA Corrective Reading Program (Englemann,
Carnine, & Johnson, 1999), Allor et al. (2010) used Early Interventions in Reading (Taylor,
Frye, Short, & Shearer, 1991), and Idol (2010) used the Reading Success (Baker, 2004) program.
Bradford et al. (2006) sought to determine the effectiveness of the Corrective Reading
Program on the reading skills of middle school students with moderate intellectual disabilities.

61
Specifically, two participants had moderate intellectual disabilities while one had a moderate
intellectual disability as a result of a traumatic brain injury. The students were ages 12, 14, and
15 and had IQ scores of 46, 49, and 55 respectively. The program was implemented 45-55 min
per session, three days a week. There were 65 sessions over a period of six months. The
researchers measured fluency performance through a combination of reading rate and accuracy.
All students completed Level A of the program. In addition, all students reached mastery on two
of four measures of reading fluency. The students failed to reach mastery on four of four
measures as a result of reading rate, not reading accuracy. Interestingly, the students exceeded
the reading rate goals on the two measures they mastered. The first student exceeded the 1 min
reading rate goal by 10 and 10 s, the second student exceeded the goal by 15 and 17 s, and the
third student exceeded the goal by 10 and 19 s. They also demonstrated maintenance of reading
fluency nine weeks after completion of the study. Specifically, their fluency increased from zero
correct words per min to 39, 15, and 46 correct words per min. Overall, the students’ reading
skills, including fluency, improved.
Hurst and Jolivette (2006) measured the effects of private versus public assessment of
oral readings, often repeatedly read, on the reading fluency of three middle school students with
mild disabilities. Two participants had mild intellectual disabilities while the third was classified
as having an Other Health Impairment. The two participants with MID were in grades seven and
eight, were ages 13 and 14, and had IQ scores of 70 and 65, respectively. Students received
instruction from the SRA Corrective Reading Program (Englemann, Carnine, & Johnson, 1999)
for 28 sessions. At the end of each lesson, the students participated in a timed reading probe. In
an alternating treatments design, the researchers alternated private versus public assessments of
the timed reading probes. In the private timed readings, the students, in random order, orally read

62
the passages to their teacher at a work table at the back of the classroom without other students in
close proximity. In the public timed readings, the students, in random order, orally read the
passages at a kidney-shaped table to their teacher and the other two students. The students’
overall reading fluency improved from the use of the SRA Corrective Reading
Program(Englemann, Carnine, & Johnson, 1999). On the other hand, overall reading fluency
performance during both conditions varied. There were no significant differences between
private and public assessments of oral reading fluency. In addition, all three students preferred
the public assessments as long as they didn’t have to read first.
Allor et al. (2010) employed a longitudinal study over two to three years to investigate
the effectiveness of the Early Interventions in Reading (Taylor, Frye, Short, & Shearer, 1991)
program on the reading progress of students with mild to moderate intellectual disabilities.
Participants were in grades one through four with a mean chronological age of 7.83. Their IQ
scores ranged from 40 to 69. Every participant was considered to be “verbal.” The participants
were randomly assigned to a treatment group (n = 34) or a control group (n = 25). Early
Interventions in Reading (Taylor, Frye, Short, & Shearer, 1991) is a comprehensive reading
intervention that integrates the concepts of print, phonological and phonemic awareness, oral
language, letter knowledge, word recognition, vocabulary, fluency, and comprehension.
Participants in the treatment group participated in Early Interventions in Reading (Taylor, Frye,
Short, & Shearer, 1991) for 40 to 50 min every day for a minimum of two years. Participants in
the control group received routine special education instruction provided by their own schools.
Results indicate that students in the treatment group made great progress on multiple
standardized measures of reading. Significant differences between the treatment and control
groups were found on the progress-monitored measures of phoneme segmentation, phonics, and

63
oral reading fluency. Specifically, after 105 weeks of instruction, the average student in the
treatment group scored 44.296 correct words per min on the DIBELS Oral Reading Fluency
(Good & Kaminski, 2002) measure compared to 26.668 correct words per min for the average
student in the control group. Allor et al. (2010) concluded that students with IQs between 40 and
69 responded positively to an intensive and comprehension reading program that included
multiple dimensions of reading development.
Over a span of 29 years and five projects, Idol (2010) implemented the Reading Success
(Baker, 2004) program, an individualized teacher-guided literacy program that teaches literacy
skills and emphasizes word recognition, reading speed, and reading comprehension, to 663
students at risk for school failure, transitioning from speaking Spanish to English, with learning
disabilities, mild intellectual disabilities (MID), or behavior challenges. Projects 1 and 2 included
students with MID, but the results from Project 2 (n = 1 with MID) were inconclusive.
Therefore, only Project 1 is discussed. There were 24 total students, 17 elementary and 7
secondary, with MID in Project 1 (N = 159). For 30 to 45 min each session, two to five times per
week, each student received steps 4 through 10 in the basic lesson. During this sequence, the
student read the passage to the instructor while the instructor applied the model-lead-test error
correction procedure for misread and unknown words. Next, the instructor took a timed sample
of oral reading followed by a series of oral comprehension questions. The instructor corrected
any comprehension and accuracy errors through positive oral discussion. The student then wrote
a summary of the lesson. Together, the instructor and student calculated and recorded the data
for oral reading accuracy, oral reading speed, and oral reading comprehension. Finally, the
instructor analyzed the data to determine if specialized interventions were needed. Students
received further individualized instruction for word recognition, rate, or comprehension based on

64
their individual needs. Findings indicate that elementary students with MID had a mean gain of
1.5 months of curricular progress per month of instruction. Secondary students with MID had a
mean gain of 2.4 months of curricular progress per month of instruction. As expected, students
with MID made improvements in their reading skills, but they averaged less than the overall
group mean across all subgroups and across elementary and secondary students.
Peer Tutoring
Two studies measured the effects of tutoring on the academic achievement of students
with developmental disabilities (Kamps et al., 1989; Osborn et al., 2007). Kamps et al. (1989)
measured the effects of peer tutoring on the academic skills of students with Autism. Osborn et
al. (2007) measured the effects of supplemental tutoring on the reading achievement of students
with cognitive disabilities, specific learning disabilities, and students receiving Title I services.
Kamps et al. (1989) used 5th
grade peer tutors to provide supplemental tutoring in the
areas of money skills, expressive language, and oral reading and comprehension skills. Two
students, ages 9 and 11, diagnosed with Autism and moderate intellectual disabilities (IQ = 50
for both students) engaged in 30 min tutoring sessions three times per week for six total weeks.
The first 20 min were allotted for specific academic tutoring, and the last 10 min were spent in
social play with their partners. During the oral reading/comprehension tasks, the students orally
read from readers on their grade level and responded to comprehension questions. 2-min oral
reading samples were taken following tutoring sessions. Correct words per min, incorrect words
per min, and correct number of comprehension responses were recorded. The study yielded
positive results from peer tutoring. Both students increased their reading rates (M = 19.6 and 30.2
at baseline to M = 34.2 and 39.7), decreased their errors per min (M = 3.7 and 1.9 at baseline to

65
M = 1.3 and 0.9), and increased their number of correct responses to factual comprehension
questions (1.9 and 1.3 at baseline to 3.8 and 3.5).
Osborn et al. (2007) utilized volunteer tutors (high school and college students, retirees,
professionals, parents, laborers, etc.) to provide one-on-one supplemental reading instruction to
students with cognitive disabilities, specific learning disabilities, and students receiving Title I
services. The intervention, named Project MORE, included guided reading instruction, spelling
and vocabulary instruction, and specific skill development. Thirty-one students with intellectual
disabilities (ID) participated in Project MORE while 22 students with ID remained in the
comparison group. Students with ID were in 2nd
grade, had chronological ages of 8-5 to 9-3, and
had IQ scores equal to or less than 70. A coordinator developed lesson plans, and the mentors
delivered individualized instruction 30 min per session three to four days each week. The first 10
min of each lesson consisted of guided reading using an appropriately leveled book or basal
reader. The next 10 min were spent on spelling and vocabulary activities including word
recognition (fluency and comprehension) and vocabulary development (meanings, structure, and
relationships). The final 10 min were used to focus on specific skill development such as word
analysis, vocabulary, comprehension, study skills, and writing. The researchers concluded that
students in the treatment group (M = 35 CWPM) statistically significantly (F-test statistic = 5.0,
p = .03) outperformed the control students (M = 29 CWPM) on the DIBELS Oral Reading
Fluency measure. In addition, the reading achievement gains for the students who received the
Project MORE intervention averaged more than one month gain for every month of intervention.
Repeated Reading
Three studies examined the effects of repeated reading on the reading skills of students
with reading difficulties (Devault & Joseph, 2004; Mefferd & Pettegrew, 1997; Valleley &
66
Shriver, 2003). Devault and Joseph (2004) combined repeated readings with the word boxes
phonics technique to measure fluency levels. Mefferd and Pettegrew (1997) employed assisted
reading with predictable trade books to measure reading fluency and comprehension, sight
vocabulary, and effective use of reading strategies. Valleley and Shriver (2003) examined the
effectiveness of repeated readings on fluency and comprehension.
Devault and Joseph (2004) included one high school student with MID (IQ = 57) in their
study to determine the effectiveness of a combination of repeated readings and the word boxes
phonics technique on the reading fluency of high school students with severe reading delays (N =
3). The students received individual administration of the intervention for 15 to 25 min daily,
five days per week. During each session, the students were presented with and asked to orally
read a curriculum-based reading passage probe written at a level beyond their independent
reading level. They were given one min to read while the instructor recorded all errors,
omissions, and words read correctly. Incorrect and omitted words were printed on index cards
and taught to the students using a word boxes technique. At the end of the session and after the
word boxes lesson, the students were given one min to re-read the passage while the instructor
recorded all errors, omissions, and words read correctly. A new passage was provided at every
session. The student with MID demonstrated a mean increase of 33 correct words per min from
initial to repeated reading across all passages. In addition, this intervention had high social
validity among all three students.
In a study conducted by Mefferd and Pettegrew (1997), assisted reading with predictable
trade books was implemented using a combination of teaching modeling of fluent reading,
repeated and choral reading of predictable text, and the use of multiple cues in written language.
Students with MID (n = 3) in grades four and five and ages 9 to 11 with IQs ranging from 63 to
67
72 participated in the study. Instruction lasted 20 to 30 min per session, five days a week, for five
months. The intervention consisted of a five-day plan. On Day 1, the teacher introduced and read
a book, pointing out story elements. Student responses and discussion were encouraged. After
the reading, students selected five words they didn’t know but wanted to learn. The teacher wrote
each word on an index card with a sentence, dictated from the student, on the back of the card.
The students filed the word cards in their personal “word banks.” On Day 2, the students first
shared their words. Then the teacher reread the book while the students followed along in their
own copies. The teacher required that the students track the words with their fingers as they read.
The teacher paused where the language was predictable and asked the students to supply the
words. Student responses and discussion were encouraged. A second reading was conducted as
necessary. Students chose five more words to add to their word banks. They were given a copy
of the book and their words cards to read at home. On Day 3, students shared their words. The
teacher and students then chorally read the story. Students were allowed to read a page
independently if they requested it. The teacher continued to provide feedback and assistance in
reading and identifying unknown words. Again, students were given a copy of the book and their
word cards to read at home. On Day 4, the teacher led a choral reading of the book, allowed
students to take turns reading independently, and called attention to and positively commented
on the readers’ use of effective reading strategies. The students were also encouraged to share
about the cues they used to help figure out unknown words. On Day 5, each student met one-on-
one with the teacher to read and discuss the book and review the words in their “word bank.”
During the conferences, the pair talked about the personal response and enjoyment of the story.
In addition, the teacher monitored student progress, positively reinforced the student’s cueing
system, and encouraged self-monitoring and self-correction behaviors. Extension activities

68
involving composing and writing followed the reading of each book. Results indicated that the
students made gains in reading fluency and comprehension, sight vocabulary, and effective use
of reading strategies. Specifically, one student more than doubled his fluency rate, another
student nearly doubled his fluency rate, and the third student showed a moderate increase in
fluency rate.
Valleley and Shriver (2003) measured fluency and comprehension as a result of repeated
readings. Instruction was provided 20 min per session, three times a week, for 10 total weeks.
Four students participated in the study, but only one, Greg, had a diagnosis of MID. Greg was 18
years old and in 11th
grade; an IQ score was not provided. During intervention, participants read
a 4th
grade passage repeatedly until they demonstrated three consecutive fluency improvements
of at least one additional correct word. Participants read a massage at least four times and no
more than 10 times. Error correction was provided only if the students did not orally provide a
word within three s. Every third passage, the participants were asked to read the entire 400-word
passage without being timed for the initial reading so that they could read for comprehension. All
other readings, including initial readings, were timed for one min. Reinforcement for
participation was provided in the form of earning points consistent with the reinforcement
program utilized by the residential treatment facility where the participants resided. Even though
he dropped out of the intervention after only three weeks of intervention, Greg demonstrated
improvements in his reading fluency from baseline to intervention. From baseline to
intervention, he increased 70 CWPM to 85 CWPM and increased errors from 2.80 to 3.08. There
were no major changes in correct comprehension skills from baseline to intervention (8.87 to 9.2
out of 10 questions).
69
Combination of Strategies
Two studies utilized a combination of strategies to determine the effects of interspersal of
known items (Cooke, 1993) and peer-assisted repeated readings (Musti-Rao et al., 2009) on
fluency gains. In Cooke’s (1993) study, two participants with MID in grades four and five, ages
10 and 11, and IQ scores of 55 and 59 spent 20 min each day in the intervention. Using an
alternating treatments design, the researcher compared 100% new words to a ratio of 30% new
words and 70% known words. The procedures involved a combination of peer tutoring,
interspersal of known items, and repeated readings of words in isolation and passages. Each
participant was paired with a peer tutor. The peer tutor would show nine flashcards to the tutee,
one at a time. If the tutee correctly identified the word, the tutor would place a check on the back
of the card. If the words was misread or not read within two s, the tutor said the word and asked
the tutee to read it. This continued until three checks were on the back of each word. Next, the
tutor went over unknown words (previously underlined by the teacher) in an assigned passage.
The tutee was then asked to read the passage during which errors were recorded by the tutee. At
the end of the reading, errors were reviewed. If no errors were made, a happy face was recorded.
The tutee read the passage until three happy faces were recorded. At that time, the tutee was
ready for the posttest. In the first condition, the above procedures took place with 100% new
words. In the second condition, the above procedures took place with 30% new words and 70%
known words. Maintenance tests were also given before beginning a new passage. Five
previously learned words were randomly selected and presented to the tutee by the tutor on flash
cards. Findings indicate that the participants increased their correct words per min on reading
passages in both conditions. There was high variability in both conditions. The two students had
mean gains of 46.2 CWPM and 29.9 CWPM in the 30/70% condition and mean gains of 39.4

70
CWPM and 37.1 CWPM in the 100% condition, respectively. More words met mastery criterion
each session in the 100% condition. Specifically, the two students mastered means of 4.05 words
per s (WPS) and 3.4 WPS in the 30/70% condition and means of 9.0 WPS and 6.6 WPS in the
100% condition, respectively. Maintenance of words was high in both conditions. Overall,
interspersal of known items was not more effective than all new items.
Utilizing a multiple baseline across participants design, Musti-Rao (2009) measured the
effects of peer-mediated repeated readings on the oral reading fluency of fourth grade students
with and without disabilities. A total of 12 students (three with learning disabilities, one with an
eligibility of Other Health Impairment, one with an intellectual disability, and one with a severe
emotional disability) participated in the study. The dependent variable was the number of correct
words per minute (CWPM). During baseline, students independently and silently read books for
30 min after which the researcher administered a DIBELS oral reading fluency (DORF; Good &
Kaminski, 2002) passage. Prior to the paired repeated readings intervention, students were
provided training about the correction procedure and the role of reader and listener. During each
session, each student in the pair sat across from each other and placed their reading passage,
good tutor card, and correction card in front of them. The good tutor card was stamped by the
circulating teacher if appropriate tutoring behavior was observed. The students took two turns
reading the passage for 10 min, however, the student with an intellectual disability did not
participate in reciprocal reading. A correction procedure was used. After the repeated readings of
the passage, the students individually read the passage for 1 min and recorded their correct words
per minute in their reading logs. Tangible rewards were given if a student met his or her goal on
the third day of repeated readings. Overall results indicated an increase in oral reading rate from
baseline to intervention for all students. On the other hand, none of the students met their end-of-

71
year goals on the end of year DIBELS benchmark (Good & Kaminski, 2002). Effect size
estimates indicated that the intervention had a moderate to large effect on students’ oral reading
fluency. Specifically, the student with an intellectual disability increased her mean CWPM
scores of 13.3 during baseline to 24.9 during intervention. Her DIBELS (Good & Kaminski,
2002) benchmark raw scores increased from 19 to 32. This participant started with passages on
the second grade level and, at the end of the study, read 110 CWPM on three passages at the
third-grade level.
Synthesis of Studies
Table 4 provides a synthesis of the studies (N = 11) using different instructional strategies
to increase the reading fluency of students with developmental disabilities. Five of the studies
employed experimental designs (Bradford et al., 2006; Devault & Joseph, 2004; Idol, 2010;
Kamps et al., 1989; Mefferd & Pettegrew, 1997), one study utilized a longitudinal experimental
study design (Allor et al., 2010), two studies employed an alternating treatments design (Cooke,
1993; Hurst & Jolivette, 2006), and two studies utilized group comparison designs (Osborn et al.,
2007; Valleley & Shriver, 2003). Seven studies included participants at the elementary level, two
studies included participants at the middle school level, and three studies included participants at
the high school level. A comprehensive reading program was the independent variable in four
studies, peer tutoring was used in three studies, repeated reading was the sole intervention in
three studies, and a combination of strategies was used in two studies.
Limitations
The number of empirically-based research methods of increasing reading fluency among
students with developmental disabilities is severely lacking. There is a shortage of studies that
include both reading fluency as a dependent variable and participants with developmental

72
disabilities. As a result of the shortage of information about how to teach reading fluency to
students with developmental disabilities, special educators have been using reading instruction
techniques for students with intellectual developmental disabilities that were actually meant to be
used with students with different types of disabilities.
There is a great need for reading research that includes students with developmental
disabilities and reading fluency as a dependent variable. Generally speaking, future reading
research should include individuals with developmental disabilities. Specifically, there is a need
for research among participants with different types of intellectual and developmental disabilities
(i.e. mild intellectual disabilities, moderate intellectual disabilities, Autism, etc.) as well as
different age groups (primary, secondary, and post-secondary). For example, techniques typically
found to be effective with elementary students showed promise for helping high school students
with severe reading delays (Devault & Joseph, 2004). Second, studies including a larger number
of participants would increase internal validity. Third, it would be beneficial if more
interventions were conducted over a substantial period of time (at least six months) with reading
samples and assessments taken at regular intervals. Fourth, more research should be conducted
among students with developmental disabilities while implementing and varying the fluency
strategies described earlier in this paper. Fifth, researchers should measure the relationship of
fluency and comprehension among students with developmental disabilities. Sixth, future
research should focus on comparing outcomes of different criterion for fluency.
Conclusions
Although studies examining the reading fluency of students with developmental
disabilities are minimal, the results are encouraging and support the belief that individuals with
developmental disabilities can benefit from reading instruction beyond basic functional sight

73
word instruction. Overall, comprehensive reading programs that include a combination of
literacy skills instruction not only improve reading fluency but reading skills in general (Allor et
al, 2010; Bradford et al., 2006; Hurst & Jolivette, 2006; Idol, 2010; Osborn et al., 2007).
Interventions employing peer tutoring significantly increase reading fluency among students with
developmental disabilities (Cooke, 1993; Kamps et al., 1989; Musti-Rao et al., 2009; Osborn et
al., 2007). As with other populations, repeated reading improves reading fluency among students
with developmental disabilities (Cooke, 1993; Devault & Joseph, 2004; Mefferd & Pettegrew,
1997; Musti-Rao et al., 2009; Osborn et al., 2007; Valleley & Shriver, 2003).

74
Table 4: Studies that Included Reading Fluency among Students with Developmental Disabilities
Study/total
sample
Instruction
type
Disability
label/n
CA/grade
IQ
Frequency/
duration of
instruction
Results
Allor et
al., 2010
(N = 59)
Early
Interventions
in Reading* –
comprehensive
reading
intervention
integrating
concepts of
print,
phonological
and phonemic
awareness, oral
language, letter
knowledge,
word
recognition,
vocabulary,
fluency, and
comprehension
MID,
MOID
Treatment
group (n =
34)
Control
group (n =
25)
Mean CA
= 7.83
Grades 1-
4
40-69 40-50
min/daily,
2-3 years
Treatment
group
increased
overall
reading
scores,
especially
phoneme
segmentation,
phonics, and
oral reading
fluency
Bradford
et al., 2006
(N = 3)
Corrective
Reading
Program** –
fluency
performance
measured
through
combination of
reading rate
and reading
accuracy
MOID (n
= 2)
TBI/MOI
D (n = 1)
CA = 12,
14, 15
46, 49,
55
45-55
min/session
, 3
days/week,
65 sessions
over 6
months
All students
completed
Level A of the
program; all
students
reached
mastery on
2/4 measures
of reading
fluency; lack
of all students
reaching
mastery due
to reading
rate, not
reading
accuracy;
strong
maintenance
of reading
fluency
Cooke, Peer tutoring, MID (n = CA = 10, 55, 59 20 Students
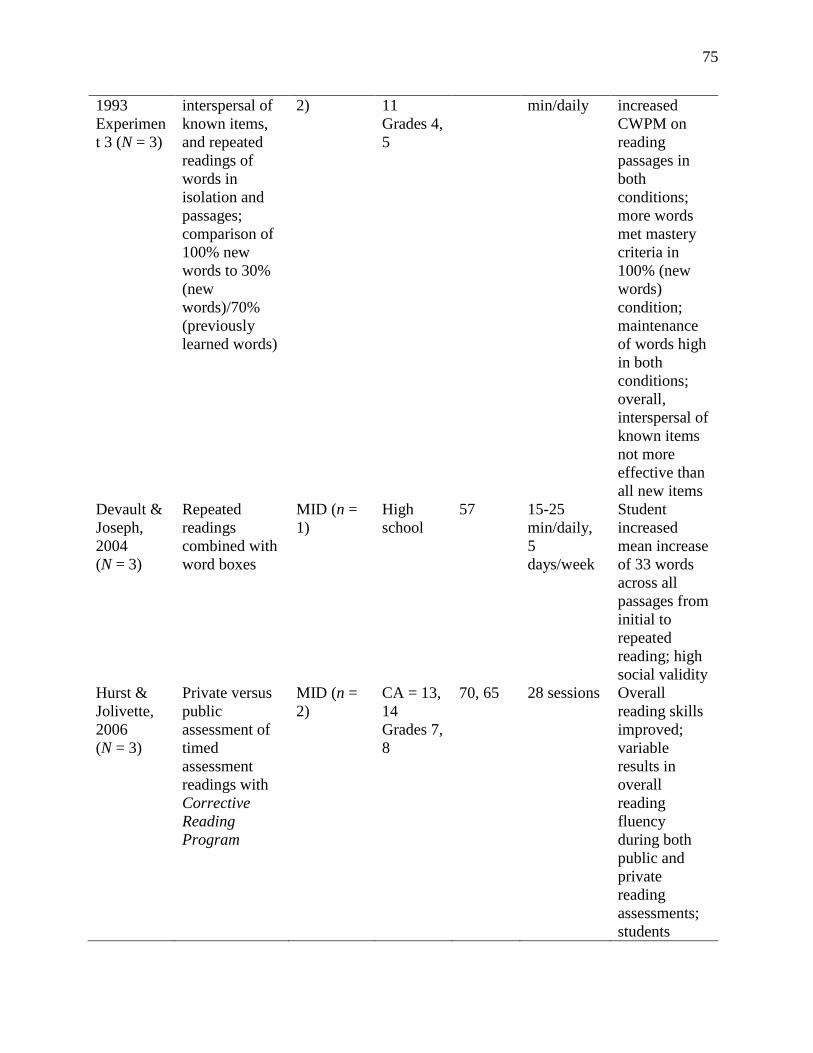
75
1993
Experimen
t 3 (N = 3)
interspersal of
known items,
and repeated
readings of
words in
isolation and
passages;
comparison of
100% new
words to 30%
(new
words)/70%
(previously
learned words)
2) 11
Grades 4,
5
min/daily increased
CWPM on
reading
passages in
both
conditions;
more words
met mastery
criteria in
100% (new
words)
condition;
maintenance
of words high
in both
conditions;
overall,
interspersal of
known items
not more
effective than
all new items
Devault &
Joseph,
2004
(N = 3)
Repeated
readings
combined with
word boxes
MID (n =
1)
High
school
57 15-25
min/daily,
5
days/week
Student
increased
mean increase
of 33 words
across all
passages from
initial to
repeated
reading; high
social validity
Hurst &
Jolivette,
2006
(N = 3)
Private versus
public
assessment of
timed
assessment
readings with
Corrective
Reading
Program
MID (n =
2)
CA = 13,
14
Grades 7,
8
70, 65 28 sessions Overall
reading skills
improved;
variable
results in
overall
reading
fluency
during both
public and
private
reading
assessments;
students
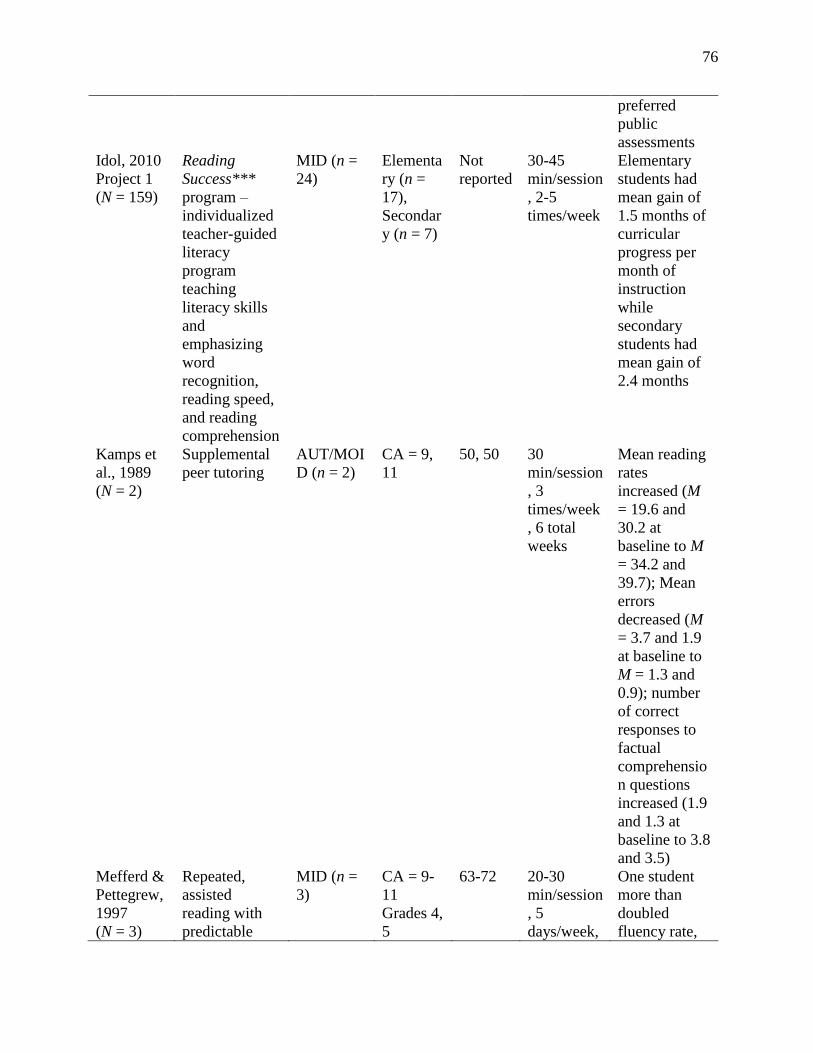
76
preferred
public
assessments
Idol, 2010
Project 1
(N = 159)
Reading
Success***
program –
individualized
teacher-guided
literacy
program
teaching
literacy skills
and
emphasizing
word
recognition,
reading speed,
and reading
comprehension
MID (n =
24)
Elementa
ry (n =
17),
Secondar
y (n = 7)
Not
reported
30-45
min/session
, 2-5
times/week
Elementary
students had
mean gain of
1.5 months of
curricular
progress per
month of
instruction
while
secondary
students had
mean gain of
2.4 months
Kamps et
al., 1989
(N = 2)
Supplemental
peer tutoring
AUT/MOI
D (n = 2)
CA = 9,
11
50, 50 30
min/session
, 3
times/week
, 6 total
weeks
Mean reading
rates
increased (M
= 19.6 and
30.2 at
baseline to M
= 34.2 and
39.7); Mean
errors
decreased (M
= 3.7 and 1.9
at baseline to
M = 1.3 and
0.9); number
of correct
responses to
factual
comprehensio
n questions
increased (1.9
and 1.3 at
baseline to 3.8
and 3.5)
Mefferd &
Pettegrew,
1997
(N = 3)
Repeated,
assisted
reading with
predictable
MID (n =
3)
CA = 9-
11
Grades 4,
5
63-72 20-30
min/session
, 5
days/week,
One student
more than
doubled
fluency rate,
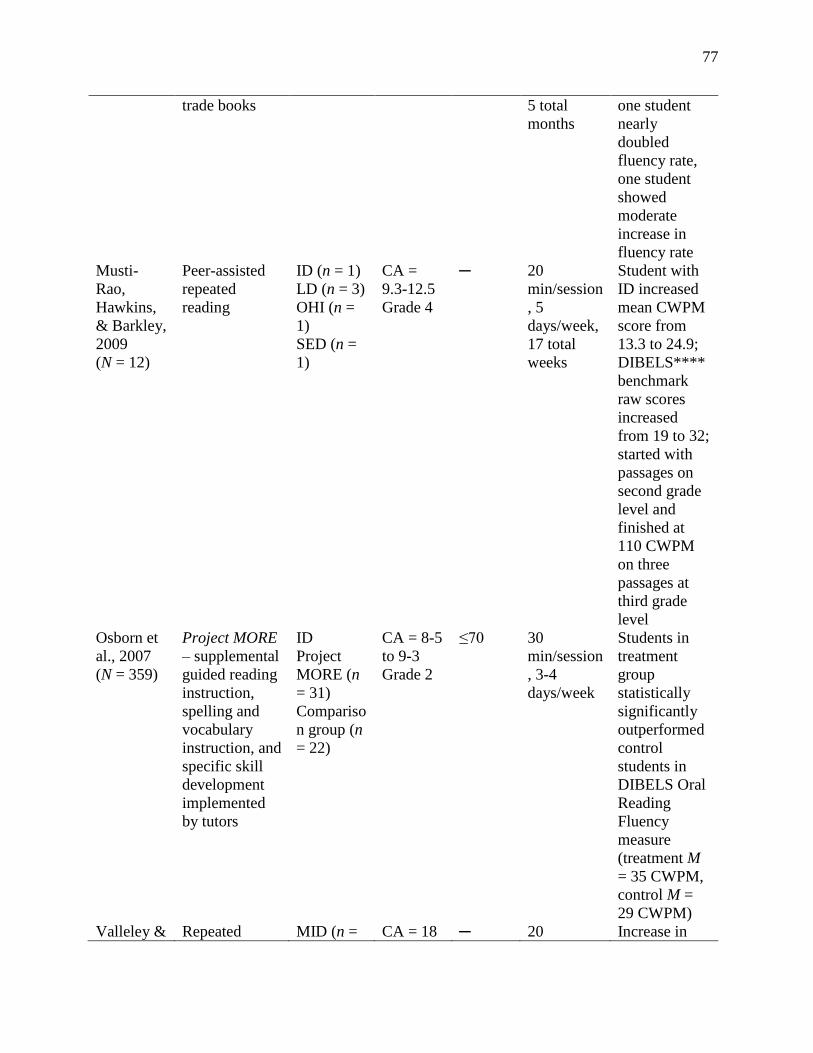
77
trade books 5 total
months
one student
nearly
doubled
fluency rate,
one student
showed
moderate
increase in
fluency rate
Musti-
Rao,
Hawkins,
& Barkley,
2009
(N = 12)
Peer-assisted
repeated
reading
ID (n = 1)
LD (n = 3)
OHI (n =
1)
SED (n =
1)
CA =
9.3-12.5
Grade 4
─ 20
min/session
, 5
days/week,
17 total
weeks
Student with
ID increased
mean CWPM
score from
13.3 to 24.9;
DIBELS****
benchmark
raw scores
increased
from 19 to 32;
started with
passages on
second grade
level and
finished at
110 CWPM
on three
passages at
third grade
level
Osborn et
al., 2007
(N = 359)
Project MORE
– supplemental
guided reading
instruction,
spelling and
vocabulary
instruction, and
specific skill
development
implemented
by tutors
ID
Project
MORE (n
= 31)
Compariso
n group (n
= 22)
CA = 8-5
to 9-3
Grade 2
≤70 30
min/session
, 3-4
days/week
Students in
treatment
group
statistically
significantly
outperformed
control
students in
DIBELS Oral
Reading
Fluency
measure
(treatment M
= 35 CWPM,
control M =
29 CWPM)
Valleley & Repeated MID (n = CA = 18 ─ 20 Increase in

78
Shriver,
2003
(N = 4)
readings with
error correction
only when
student did not
pronounce
word within 3s
1) Grade 11 min/session
, 3
times/week
, 10 total
weeks
reading
fluency from
baseline to
intervention
(70 CWPM to
85 CWPM);
increase in
errors from
baseline to
intervention
(2.80 errors to
3.08 errors);
no major
changes in
correct
comprehensio
n questions
from baseline
to
intervention
Note. CA = chronological age; IQ = intelligence quotient; MID = Mild Intellectual Disability;
MOID = Moderate Intellectual Disability; TBI = Traumatic Brain Injury; CWPM = correct
words per minute; AUT = Autism; “─” = information not reported; ID = Intellectual Disability;
LD = Learning Disability; OHI = Other Health Impairment; SED = Severe Emotional Disability.
Adapted from “Differences in Performance Between Students with Learning Disabilities and
Mild Mental Retardation: Implications for Categorical Instruction,” by E. Caffrey and D. Fuchs,
2007, p. 122. Copyright 2007 by The Division for Learning Disabilities of the Council for
Exceptional Children.
* Early Interventions in Reading by B. M. Taylor, B. J. Frye, R. Short, & B. Shearer. Copyright
1991 by University of Minnesota, Center for Urban and Regional Affairs and Office of the Vice
President of Academic Affairs, Minneapolis, MN.
** Corrective Reading Program by S. Englemann, L. Carnine, & G. Johnson. Copyright 1999 by
SRA/McGraw-Hill, Columbus, OH.
***Reading Success by K. Baker. Copyright 2004 by Hawker Brownlow Education, Moorabbin,
VIC.
*****DIBELS = Dynamic Indicators of Basic Early Literacy Skills by R. H. Good & R. A.
Kaminski. Copyright 2002 by Institute for the Development of Educational Achievement,
Eugene, OR.
79
Repeated Reading Strategies for Elementary Students with Intellectual Disabilities
Literature Search Procedures
The researcher conducted a literature review on the use of repeated reading methods to
increasing the reading fluency of individuals with intellectual disabilities. Two types of searches
were completed. In the first method, the researcher searched two separate databases for peer-
reviewed studies: ERIC and PsychINFO. In the second method, the researcher conducted a hand
search of the following peer-reviewed journals: American Journal on Mental Retardation,
Journal of Special Education, Remedial and Special Education, Education and Training in
Developmental Disabilities, and Journal of Autism and Developmental Disorders. The same
criteria for inclusion were followed with the exception of the date of publication; the researcher
only included journal articles from 1990 to present. The searches yielded four studies that met
the criteria for inclusion in this literature review.
Criteria for Inclusion
The researcher searched for studies in the databases using the following guidelines. First,
participants had any level of intellectual disabilities (mild, moderate, severe, and profound
intellectual disabilities). Second, participants with co-morbid diagnoses were included, but
intellectual disabilities were the primary diagnoses. Third, all ages were included. Fourth, there
was not a limit on the date of publication. Fifth, repeated reading was the only or main
independent variable. Last, studies were carried out with English language reading only.
Overall Study Characteristics
There were four studies (see Table 5) that ranged in publication date from 1997-2009,
and appeared in the following peer-reviewed journals: Preventing School Failure, Reading
Research and Instruction, and Journal of Behavioral Education. A total of 22 participants (range

80
3 to 12) who had a mean age, of those reported, of 13.5 (range 9.0 to 18.0) and a mean IQ of
62.3, of those reported, participated in these studies. The total number of participants with
intellectual disabilities in these studies was six (range 1 to 3). Participants in the studies were in
grades 4 to 11 with a mean grade level of 7.5. The studies included in the review employed
experimental designs.
In one study, the independent variable was a combination of repeated readings and word
boxes (Devault & Joseph, 2004). Repeated, assisted reading with predictable trade books was
utilized in another study (Mefferd & Pettegrew, 1997). In a third study, repeated readings were
paired with error correction (Valleley & Shriver, 2003). In a fourth study, the independent
variable was peer-assisted repeated readings (Musti-Rao, Hawkins, & Barkley, 2009).
Repeated Reading among Individuals with Intellectual Disabilities
Four studies examined the effects of repeated reading on the reading skills of students
with intellectual disabilities (Devault & Joseph, 2004; Mefferd & Pettegrew, 1997; Musti-Rao et
al., 2009; Valleley & Shriver, 2003). Devault and Joseph (2004) combined repeated readings
with the word boxes phonics technique to measure fluency levels. Mefferd and Pettegrew (1997)
employed assisted reading with predictable trade books to measure reading fluency and
comprehension, sight vocabulary, and effective use of reading strategies. Valleley and Shriver
(2003) examined the effectiveness of repeated readings on fluency and comprehension. Musti-
Rao et al., (2009) utilized peer-assisted repeated readings to measure reading fluency.
Devault and Joseph (2004) included one high school student with MID (IQ = 57) in their
study to determine the effectiveness of a combination of repeated readings and the word boxes
phonics technique on the reading fluency of high school students with severe reading delays (N =
3). The students received individual administration of the intervention for 15 to 25 min daily,
81
five days per week. During each session, the students were presented with and asked to orally
read a curriculum-based reading passage probe written at a level beyond their independent
reading level. They were given one min to read while the instructor recorded all errors,
omissions, and words read correctly. Incorrect and omitted words were printed on index cards
and taught to the students using a word boxes technique. At the end of the session and after the
word boxes lesson, the students were given one min to re-read the passage while the instructor
recorded all errors, omissions, and words read correctly. A new passage was provided at every
session. The student with MID demonstrated a mean increase of 33 correct words per min from
initial to repeated reading across all passages. In addition, this intervention had high social
validity among all three students.
In a study conducted by Mefferd and Pettegrew (1997), assisted reading with predictable
trade books was implemented using a combination of teaching modeling of fluent reading,
repeated and choral reading of predictable text, and the use of multiple cues in written language.
Students with MID (n = 3) in grades four and five and ages 9 to 11 with IQs ranging from 63 to
72 participated in the study. Instruction lasted 20 to 30 min per session, five days a week, for five
months. The intervention consisted of a five-day plan. On Day 1, the teacher introduced and read
a book, pointing out story elements. Student responses and discussion were encouraged. After
the reading, students selected five words they didn’t know but wanted to learn. The teacher wrote
each word on an index card with a sentence, dictated from the student, on the back of the card.
The students filed the word cards in their personal “word banks.” On Day 2, the students first
shared their words. Then the teacher reread the book while the students followed along in their
own copies. The teacher required that the students track the words with their fingers as they read.
The teacher paused where the language was predictable and asked the students to supply the

82
words. Student responses and discussion were encouraged. A second reading was conducted as
necessary. Students chose five more words to add to their word banks. They were given a copy
of the book and their words cards to read at home. On Day 3, students shared their words. The
teacher and students then chorally read the story. Students were allowed to read a page
independently if they requested it. The teacher continued to provide feedback and assistance in
reading and identifying unknown words. Again, students were given a copy of the book and their
word cards to read at home. On Day 4, the teacher led a choral reading of the book, allowed
students to take turns reading independently, and called attention to and positively commented
on the readers’ use of effective reading strategies. The students were also encouraged to share
about the cues they used to help figure out unknown words. On Day 5, each student met one-on-
one with the teacher to read and discuss the book and review the words in their “word bank.”
During the conferences, the pair talked about the personal response and enjoyment of the story.
In addition, the teacher monitored student progress, positively reinforced the student’s cueing
system, and encouraged self-monitoring and self-correction behaviors. Extension activities
involving composing and writing followed the reading of each book. Results indicated that the
students made gains in reading fluency and comprehension, sight vocabulary, and effective use
of reading strategies. Specifically, one student more than doubled his fluency rate, another
student nearly doubled his fluency rate, and the third student showed a moderate increase in
fluency rate.
Valleley and Shriver (2003) measured fluency and comprehension as a result of repeated
readings. Instruction was provided 20 min per session, three times a week, for 10 total weeks.
Four students participated in the study, but only one, Greg, had a diagnosis of MID. Greg was 18
years old and in 11th
grade; an IQ score was not provided. During intervention, participants read
83
a 4th
grade passage repeatedly until they demonstrated three consecutive fluency improvements
of at least one additional correct word. Participants read a passage at least four times and no
more than 10 times. Error correction was provided only if the students did not orally provide a
word within 3 s. Every third passage, the participants were asked to read the entire 400-word
passage without being timed for the initial reading so that they could read for comprehension. All
other readings, including initial readings, were timed for 1 min. Reinforcement for participation
was provided in the form of earning points consistent with the reinforcement program utilized by
the residential treatment facility where the participants resided. Even though he dropped out of
the intervention after only three weeks of intervention, Greg demonstrated improvements in his
reading fluency from baseline to intervention. From baseline to intervention, he increased 70
CWPM to 85 CWPM and increased errors from 2.80 to 3.08. There were no major changes in
correct comprehension skills from baseline to intervention (8.87 to 9.2 out of 10 questions).
Utilizing a multiple baseline across participants design, Musti-Rao et al. (2009) measured
the effects of peer-mediated repeated readings on the oral reading fluency of fourth grade
students with and without disabilities. A total of 12 students (three with learning disabilities, one
with an eligibility of Other Health Impairment, one with an intellectual disability, and one with a
severe emotional disability) participated in the study. The dependent variable was the number of
correct words per minute (CWPM). During baseline, students independently and silently read
books for 30 min after which the researcher administered a DIBELS oral reading fluency
(DORF; Good & Kaminski, 2002) passage. Prior to the paired repeated readings intervention,
students were provided training about the correction procedure and the role of reader and
listener. During each session, each student in the pair sat across from each other and placed their
reading passage, good tutor card, and correction card in front of them. The good tutor card was
84
stamped by the circulating teacher if appropriate tutoring behavior was observed. The students
took two turns reading the passage for 10 min, however, the student with an intellectual
disability did not participate in reciprocal reading. A correction procedure was used. After the
repeated readings of the passage, the students individually read the passage for 1 min and
recorded their correct words per minute in their reading logs. Tangible rewards were given if a
student met his or her goal on the third day of repeated readings. Overall results indicated an
increase in oral reading rate from baseline to intervention for all students. On the other hand,
none of the students met their end-of-year goals on the end of year DIBELS benchmark. “Effect
size estimates indicated that the intervention had a moderate to large effect on students’ oral
reading fluency” (Musti-Rao et al., 2009, p. 17). Specifically, the student with an intellectual
disability increased her mean CWPM scores of 13.3 during baseline to 24.9 during intervention.
Her DIBELS (Good & Kaminski, 2002) benchmark raw scores increased from 19 to 32. This
participant started with passages on the second grade level and, at the end of the study, read 110
CWPM on three passages at the third-grade level.
Synthesis of Studies
Table 5 provides a synthesis of the studies (N = 4) utilizing repeated reading interventions
with students with intellectual disabilities. One of the studies employed a single-subject design
(Musti-Rao et al., 2009), one study utilized a group comparison design (Valleley & Shriver,
2003), and two studies employed experimental research designs (Devault & Joseph, 2004;
Mefferd & Pettegrew, 1998). Two studies were conducted at the elementary level and two
studies were conducted among high school students. In one study, students were asked to
repeatedly read passages as many times as possible for 10 min. Another study required students
to read passages twice and practice incorrect words between the two readings. In another study,
85
there were an unlimited number of repeated readings over the course of one week. In one study,
students were asked to repeatedly read passages until meeting preestablished criterion. In three
studies, repeated readings were either peer-mediated or combined with word boxes or teacher
modeling. In another study, error correction was provided only when students did not pronounce
the correct word within 3 s.
Limitations
The amount of empirically-based research utilizing repeated reading among students with
intellectual disabilities is minimal. There is a shortage of studies that include repeated reading as
the independent variable, reading fluency as the dependent variable, and participants with
developmental disabilities. The lack of research-based information about how to utilize repeated
reading strategies to increase reading fluency among students with intellectual disabilities has
resulted in either ineffective applications of repeated reading instruction or the altogether
omission of effective repeated reading instruction in classrooms for individuals with
developmental disabilities. The small amount of research in this area makes it difficult for one to
discern what interventions were the most effective in studies with a combination of strategies.
For example, Musti-Rao et al. (2009) combined peer tutoring and repeated reading to determine
the effects on reading fluency. It is possible that peer tutoring was the heavier influence on the
participant’s reading fluency than repeated reading was.
In general, there needs to be future research incorporating repeated reading strategies that
includes individuals with intellectual disabilities. Specifically, there is a need for research among
participants with different types of intellectual disabilities (i.e. mild, moderate, etc.) as well as
different age groups (primary, secondary, and post-secondary). Second, studies including a larger
number of participants would increase internal validity. Third, it would be beneficial if more
86
interventions were conducted over a substantial period of time (at least six months) with reading
samples and assessments taken at regular intervals. Fourth, more research should be conducted
among students with developmental disabilities while implementing and varying the available
repeated reading strategies. Fifth, future research should compare repeated reading interventions
to other interventions to determine which strategy or combination of strategies is most effective
at increasing the reading fluency and comprehension of students with developmental disabilities.
Sixth, researchers should measure the relationship of fluency and comprehension among students
with developmental disabilities. Finally, future research should focus on comparing outcomes of
different criterion for fluency.
Conclusions
Although studies examining the reading fluency of students with intellectual disabilities
through implementation of repeated reading interventions are severely limited, the results are
encouraging. All studies reported above illustrated increases in reading fluency among students
with developmental disabilities. Repeated reading instruction alone improved the reading fluency
of one high school student with a mild intellectual disability (Valleley & Shriver, 2003).
Repeated reading combined with word boxes increased the reading fluency of another high
school student with a mild intellectual disability (Devault & Joseph, 2004). Repeated, assisted
reading with predictable trade books increased the fluency rates of elementary students with mild
intellectual disabilities (Mefferd & Pettegrew, 1997). Peer-assisted repeated reading increased
reading fluency rates of one student with an intellectual disability (Musti-Rao et al., 2009)

87
Table 5: Studies that Included Repeated Reading among Students with Intellectual Disabilities
Study/total
sample
Instruction
type
Disability
label/n
CA/grade
IQ
Frequency/
duration of
instruction
Results
Devault &
Joseph,
2004
(N = 3)
Repeated
readings
combined
with word
boxes
MID (n =
1)
High
school
57 15-25
min/daily, 5
days/week
Student increased
mean increase of
33 words across
all passages from
initial to repeated
reading; high
social validity
Mefferd &
Pettegrew,
1997
(N = 3)
Repeated,
assisted
reading
with
predictable
trade books
MID (n =
3)
CA = 9-11
Grades 4,
5
63-
72
20-30
min/session,
5
days/week,
5 total
months
One student more
than doubled
fluency rate, one
student nearly
doubled fluency
rate, one student
showed moderate
increase in
fluency rate
Musti-Rao,
Hawkins,
& Barkley,
2009
(N = 12)
Peer-
assisted
repeated
reading
ID (n = 1)
LD (n = 3)
OHI (n =
1)
SED (n =
1)
CA = 9.3-
12.5
Grade 4
─ 20
min/session,
5
days/week,
17 total
weeks
Student with ID
increased mean
CWPM score
from 13.3 to 24.9;
DIBELS*
benchmark raw
scores increased
from 19 to 32;
started with
passages on
second grade level
and finished at
110 CWPM on
three passages at
third grade level
Valleley &
Shriver,
2003
(N = 4)
Repeated
readings
with error
correction
only when
student did
not
pronounce
word
MID (n =
1)
CA = 18
Grade 11
─ 20
min/session,
3
times/week,
10 total
weeks
Increase in
reading fluency
from baseline to
intervention (70
CWPM to 85
CWPM); increase
in errors from
baseline to
intervention (2.80

88
within 3s errors to 3.08
errors); no major
changes in correct
comprehension
questions from
baseline to
intervention
Note. CA = chronological age; IQ = intelligence quotient; MID = Mild Intellectual Disability;
CWPM = correct words per minute; “─” = information not reported; ID = Intellectual Disability;
LD = Learning Disability; OHI = Other Health Impairment; SED = Severe Emotional Disability.
Adapted from “Differences in Performance Between Students with Learning Disabilities and
Mild Mental Retardation: Implications for Categorical Instruction,” by E. Caffrey and D. Fuchs,
2007, p. 122. Copyright 2007 by The Division for Learning Disabilities of the Council for
Exceptional Children.
*DIBELS = Dynamic Indicators of Basic Early Literacy Skills by R. H. Good & R. A. Kaminski.
Copyright 2002 by Institute for the Development of Educational Achievement, Eugene, OR.

89
CHAPTER 3
METHODS
This chapter delineates the methodology developed for this investigation.
Experimental Design
In a multiple probe design, after introducing the independent variable in the first tier,
there should be an immediate and abrupt change in the dependent variable while data in the
other tiers remain stable and unchanged (Gast, 2009). When stable criteria are met in the first
tier and baseline data is stable in the second tier, the independent variable is introduced to the
second tier, and so on. In this way, a functional relation can be established (Gast, 2009).
Experimental control of history threats to internal validity were demonstrated by
collecting pre-intervention data across three tiers (i.e. participants). Multiple tiers manage
maturation and history effects. In addition, the participants were functionally similar given their
age, IQ scores, and achievement measures. The researcher clearly defined criteria for moving
from baseline to intervention phases following stable baseline data. In this study, multiple probes
during baseline and continuous measures of data collection during intervention controlled for
maturation threats to internal validity.
In this research study, facilitative and inhibitive testing effects were controlled through
intermittent probes as opposed to prolonged baselines; students were less likely to get
accustomed to the reading passages or get tired or bored from reading short passages on a daily
basis. The threat of instrumentation was controlled by developing a measurement system prior to
the onset of the study. Proper interobserver agreement collection by two people also controlled

90
for instrumentation effects. Mortality and attrition threats and threats to external validity were
controlled through intersubject replication since there were three participants in the study.
The threat of multiple treatment interference was controlled by introducing only the
repeated reading intervention as a new method of instruction during reading instruction for the
entire length of the study. Since the researcher and classroom teacher were the same person,
adaptation threats were minimized since the students were not learning in a new setting or with a
new teacher.
Many researchers prefer to use a traditional group design for a variety of different
reasons. However, in traditional group design research methodology, individual responses are
often averaged to obtain results, obscuring significant information about individual participants
(McCormick, 1995). In turn, the effectiveness of an intervention is often judged by the mean
performance of all participants. Unfortunately, outliers can skew group data and misrepresent the
data being presented; students in special education often contribute to outlier scores. “Mean
results do not tell us much about the effects of the treatment on specific pupils who are not
represented by the mean” (McCormick, 1995, p. 4); students receiving special education services
do not represent the mean of the general population.
McCormick (1995) recommends using single-subject research when large numbers of
individuals in certain populations are not readily available. Unfortunately, the very nature of the
single-subject research design can make it difficult to find a comparable control group. It is also
hard to control for differences among individuals participating in a study. Due to the nature of
the participants’ disabilities in the researcher’s study, only a small number of participants met
criteria. For this reason and other reasons stated below, the researcher chose to employ single-
subject research methodology to answer her research questions.

91
Single-subject research methodology allows for repeated and frequent measurement of
responses throughout intervention. As a result, data is analyzed on an individual and
personalized basis (McCormick, 1995). In this way, researchers can make immediate changes as
needed. In addition, researchers can conclude that an intervention may work for one student but
not for another. “A basic tenet is that decisions about results are made by expressly delineating
what has occurred with each individual in the investigation” (McCormick, 1995, p. 1).
In single-subject research methodology and especially in multiple baseline designs,
participants may serve as their own controls. Therefore, target behaviors during baseline are
compared to those during intervention. Serving as one’s own control decreases many threats to
internal validity compared to other experimental designs. Finally, single-subject methodology is
popular among teacher researchers since it can be embedded in ongoing instruction (McCormick,
1995). The researcher was also a full-time classroom teacher, and this design fit easily into her
daily routine without altering or taking away from her students’ education.
The researcher utilized a multiple probe across participants design (Cooper, Heron, &
Heward, 1987; Horner & Baer, 1978; Tawney & Gast, 1984) to employ the intervention,
evaluate the data, and answer the research questions. The three phases of the study were baseline,
intervention, and maintenance. During the baseline and maintenance conditions, students read a
passage once without error correction. Baseline probes were conducted at least once each week
for each student, and at least three consecutive probes were conducted for each student prior to
the intervention condition. During the intervention condition, students repeatedly read a passage
three times while receiving error correction from the data collector. After reading the passage,
the students answered comprehension questions. Data analysis was conducted by comparing

92
correct words per minute, errors per minute, and percentage of correct answers to comprehension
questions during the baseline, intervention, and maintenance phases.
Participants
Three students with intellectual disabilities, ranging in age from 11 years 1 month to 12
years 1 month, participated in this study. The students attended a suburban elementary school
with approximately 700 students. Each student had received special education services upon
entering elementary school. Table 6 displays the demographic and educational information for
each student to supplement the descriptions below. Table 7 displays psychometric descriptions of
the participants. Table 8 displays speech and language information about the participants.
Table 6: Participant Demographic and Educational Information
Student
Gender
Age
Ethnicity
Grade
Eligibility
STAR*
Reading
Level
QRI**
Reading
Level
Tom Male 12 -1 Caucasian 5 MID, SLI 1.1 GE Primer
Chad Male 11 -1 Caucasian 5 MID, SLI 0.8 GE Pre-
Primer
Brian Male 11 -2 Caucasian 4 MID, SLI 1.6 GE 1
Note. MID = Mild Intellectual Disability; SLI = Speech and Language Impairment; GE = grade
equivalency; ORF = Oral Reading Fluency; CWPM = correct words per minute.
*STAR = Standardized Test for the Assessment of Reading by Renaissance Learning. Copyright
2009 by Renaissance Learning.
**QRI = Qualitative Reading Inventory (5th
Ed.) by L. Leslie & J. S. Caldwell. Copyright 2011
by Pearson, Boston, MA.

93
Table 7: Psychometric Description of Participants
Student Achievement measures Adaptive Behavior
Scales
Cognitive measures
Tom WJ-III*
Broad Reading: 2.0
GE; 57 SS
Letter-Word
Identification: 2.3 GE;
67 SS
Reading Fluency: 2.0
GE; 66 SS
Passage
Comprehension: 1.6
GE; 63 SS
VABS-II**
Parent Interview
Composite: 70
Teacher Form
Composite: 66
DAS-II***
GCA: 71
Verbal Reasoning: 71
Nonverbal Reasoning:
76
Spatial Reasoning: 76
Chad WJ-III*
Broad Reading: 1.3
GE; 42 SS
Letter-Word
Identification: 1.2 GE;
45 SS
Reading Fluency: 1.6
GE; 59 SS
Passage
Comprehension: 1.4
GE; 57 SS
VABS-II**
Composite: 35
Communication: 45
Daily Living: <20
Socialization: 51
WISC-IV****
Full Scale IQ: 59
Verbal
Comprehension
Index: 61
Perceptual Reasoning:
82
Working Memory: 52
Processing Speed: 70
Brian WJ-III*
Broad Reading: 2.2
GE; 71 SS
Letter-Word
Identification: 2.6 GE;
80 SS
Reading Fluency: 2.2
GE; 77 SS
Passage
Comprehension: 1.8
GE; 74 SS
ABAS-II*****
Conceptual: 59
Social: 70
Practical: 63
GCA: 61
DAS-II***
GCA: 63
Verbal Reasoning: 70
Nonverbal Reasoning:
69
Spatial Reasoning: 58
Note. GE = grade equivalency; SS = standard score; GCA = General Conceptual Ability; IQ =
intelligence quotient.
*WJ-III = Woodcock-Johnson III Tests of Achievement by R. W. Woodcock, K. S. McGrew, &
N. Mather. Copyright 2001 by Riverside Publishing, Itasca, IL.
**VABS-II = Vineland Adaptive Behavior Scales (2nd
ed.) by S. Sparrow, D. Cicchetti, & D.
Balla. Copyright 2005 by Pearson Assessment, Minneapolis, MN.
***DAS-II = Differential Ability Scale (2nd
ed.) by C. D. Elliott. Copyfight 2007 by The
Psychological Corporation, San Antonio, TX.

94
****WISC-IV = Wechsler Intelligence Scale for Children (4th
ed.) by D. Wechsler. Copyright
2003 by Harcourt Assessment, San Antonio, TX.
*****ABAS-II = Adaptive Behavior Assessment System (2nd
ed.) by P. L. Harrison & T.
Oakland. Copyright 2003 by Pearson Assessment, Minneapolis, MN.
Table 8: Participant Speech and Language Information
Student OWLS* Scores
Tom Listening Comprehension: 57 SS
Oral Expression: 57 SS
Oral Composite: 55 SS
Chad Listening Comprehension: 67 SS
Oral Expression: 63 SS
Oral Composite: 63 SS
Brian Listening Comprehension: 51 SS
Oral Expression: 62 SS
Oral Composite: 54 SS
Note. SS = standard score.
*OWLS = Oral and Written Language Scale by E. Carrow-Woolfolk. Copyright 1995 by Pro-
Ed, Austin, TX.
Tom
Tom had diagnoses of Autism, Attention Deficit Hyperactivity Disorder, Seizure
Disorder, and migraines. He took Depakote and Levetiracetam. He received speech and language
therapy services. Academically, he had relative strengths in mathematical calculation and
mathematical reasoning. He had academic weaknesses in reading decoding, reading
comprehension, reading fluency, listening comprehension, and written expression. He was easily
distracted, inattentive, and often complained of being sleepy. He often “stared off into space”;
his doctors felt that this was most likely the result of absence seizures. He had poor social skills
but got along well with his teachers and peers. He was extremely friendly and enjoyed verbal and
physical reinforcement.
Chad
Chad had diagnoses of Attention Deficit Hyperactivity Disorder, Mild Intellectual
Disability, and Tourette’s Syndrome. He took medication to specifically address his ADHD and
95
Tourette’s Syndrome. He became eligible to receive speech and language therapy services after
the conclusion of this study. Academically, Chad had strengths in reading comprehension and
listening comprehension. He had academic weaknesses in reading decoding, reading fluency,
written expression, mathematical calculation, and mathematical reasoning. Chad was outgoing,
friendly, and cooperative. He was easily distracted and had a habit of playing with pencils,
erasers, and books during routine classroom instruction.
Brian
Brian had a diagnosis of Goldenhar Syndrome, which is a congenital birth defect that
involves deformities of the face, manifesting in incomplete development of the ear, nose, soft
palate, lip, and jaw. He received speech and language therapy services. Ben’s average rate of
conversational speech was approximately 22 words per min. His average rate of conversational
speech was computed by dividing the number of words (n=132) he produced during a normal
conversation lasting 6 min. He had academic strengths in reading decoding. He had academic
weaknesses in reading fluency, reading comprehension, written expression, mathematical
calculation, mathematical reasoning, and oral expression. He enjoyed reading and was friendly
and cooperative. He was easily distracted and had habits of rocking, tapping his pencil, and
flipping pages of his book. When he was asked to perform certain academic tasks such as
reading or math, Brian would occasionally exhibit whole-body spasms that were stress-induced.
His spasms only occurred at the onset of the task and generally stopped once he began the task.
To individuals unaccustomed to speaking with Brian, speech intelligibility was often difficult to
understand as a result of facial malformations due to birth defects as well as low speaking
volume. On the other hand, the researcher had been his teacher for almost two years, and she was

96
familiar with his speech; the paraprofessional who was responsible for interobserver reliability
checks had worked with him for several years and was also familiar with his speech.
These particular students were selected to participate because they were in the
researcher’s self-contained class, and they demonstrated difficulties in reading performance,
especially reading fluency. In the past academic year, they had only minimally increased their
reading fluency. There were three additional self-contained students and eight resource students
in the researcher’s class, but they had disabilities and eligibilities other than intellectual
disabilities (i.e. Attention Deficit Hyperactivity Disorder, Learning Disabilities, Autism, and
Emotional and/or Behavioral Disorders). Even though the participants’ teacher had routinely
implemented instruction that included informal repeated reading and error correction, they did
not have experience with systematic repeated readings combined with error correction prior to
this study. All of the participants had less than 15 absences during the first part of the school
year; students who were absent more than 15 days would not have been chosen for the study to
control for mortality or attrition threats to internal validity. Based on teacher observation, each of
the participants met the criteria for necessary prerequisite skills identified by the researcher and
listed in Table 9.
Table 9: Participant Prerequisite Skills
Skill Criteria
1. Follow one-step oral direction with no more than three
prompts
Within 5 s
2. Maintain attention to a task with no more than three prompts 15 min
3. Comprehend information presented orally All information
4. Orally respond to teacher with no more than 1 prompt Within 5 s
5. Sit in a seat or stand at same place next to table 15 min
6. Track words while reading With or without finger
or with use of
bookmark

97
Parental permission to participate in this study was obtained through a Parental Consent
Form (see Appendix G). The researcher sent a form home with each student and verbally spoke
with each student’s parents to explain the intervention and to ask them if there were additional
questions that could be answered. Student permission to participate in this study was obtained
through a Minor Assent Form (see Appendix H). The researcher individually read the forms to
the students, explained the intervention, and asked them if they had any questions. Permission to
conduct the study was obtained from the Human Subjects Office through the University of
Georgia, the elementary school’s board of education, and the elementary school’s principal prior
to the beginning of the study.
Setting and Arrangements
The students participating in this study received academic instruction in a self-contained
and resource classroom for third, fourth, and fifth graders with mild disabilities. They
participated in lunch and specials (P.E., art, music, and computer) with students in the general
education setting. Two out of the three participants also received a half-hour of social studies and
science instruction in the general education setting with paraprofessional support. The remainder
of their instruction took place in the special education classroom. There were three other self-
contained students who were in the special education classroom all day. There were also eight
resource students who came into the classroom throughout the day for reading, language arts,
math, and social skills instruction. One special education teacher and one paraprofessional were
present in the classroom all day with the exception of science and social studies instruction. The
special education teacher, researcher, and primary data collector were the same person.
During baseline, intervention, and maintenance conditions, the researcher worked with
each participant individually. They sat at a kidney-shaped table at the front of the classroom with

98
the researcher sitting across from the participant. Non-participants either worked with the
paraprofessional or completed independent work while being supervised by the paraprofessional.
The classroom was approximately 36 ft by 22 ft. There were 15 student desks arranged
around the classroom, two teacher desks, a large kidney-shaped table in the front of the room,
and two large rectangular tables in the middle of the room. A dry-erase board and student
cubbies were along the wall at the front of the classroom; a bulletin board, the classroom library,
and 2 bookshelves were along the second side of the classroom; and two large windows with
bookshelves and cabinets between them were along the third side of the classroom. There were
three computers, a bookshelf, a sink, and a counter along the back wall.
Materials
Reading Passages
Prior to the beginning of the study, each student’s reading level was obtained using the
Qualitative Reading Inventory, 5th
ed. (QRI; Leslie & Caldwell, 2011). The QRI (Leslie &
Caldwell, 2011) is a reading inventory that assesses the oral and silent reading and listening
ability of students from the pre-primer through the high school levels. An educator can use
graded word lists to determine a student’s approximate independent, instructional, and frustration
levels for each grade level. Leslie and Caldwell (2011) developed the QRI word lists by choosing
words from the passages that represented the most common words. Common words are those
with the highest Standard Frequency Index (SFI) from the Word Frequency Book (Carroll,
Davies, & Richman, 1971). For each grade level (ranging from pre-primer through high school),
students reading 90-100% correct words are at the independent level, those reading 70-85%
correct words are at the instructional level, and those reading below 70% are at the frustration
level. The researcher used the same reading levels as measured by the QRI (Leslie & Caldwell,

99
2011) when pulling passages and accompanying comprehension questions from other informal
reading inventories.
Reading passages were obtained from seven different informal reading inventories: QRI
(Leslie & Caldwell, 2011); Analytical Reading Inventory, 8th
ed. (Woods & Moe, 2007);
Classroom Reading Inventory, 10th
ed. (Silvaroli & Wheelock, 2004); Basic Reading Inventory,
4th
ed. (Johns, 1988); Informal Reading Inventory, 7th
ed. (Roe & Burns, 2007); Developmental
Literacy Inventory (Temple, Crawford, & Gillet, 2009); and Bader Reading and Language
Inventory, 2nd
ed. (Bader & Wiesendanger, 1994).
Alternate form reliability of different reading passages on the QRI (Leslie & Caldwell,
2011) ranged from .75 to 1.00. Criterion-related validity scores for first grade level passages on
the QRI (Leslie & Caldwell, 2011) were .85 (p < .01); there were not enough children (in the pre-
primer or primer levels) reading expository text to reliably obtain a measure of criterion-related
validity scores.
Passages used in the Bader Reading and Language Inventory, 2nd
ed. (Bader &
Wiesendanger, 1983) were tested for reliability. Forty elementary students and 40 secondary and
adult students orally read the passages, yielding correlation coefficients of .80 and .83,
respectively. In addition, an unpublished study by Pearce (1981) examined the validity of the
graded passages as an instrument for determining reading level by comparing the graded
passages to assigned basal reader materials. Pearce (1981) found that 60% of the students were
given identical placement, 23% were placed one level higher in their basal readers than the
reading inventory passages had placed them in, 3% were two levels higher, and 13% were one
level lower. Bader and McIntyre (1986) compared assigned reading levels from the Bader
Reading and Language Inventory, 2nd
ed. (Bader & Wiesendanger, 1983) to estimated reading
100
levels by reading specialists and classroom teachers and published a criterion-related validity
score of .93.
Although the authors described the development of their reading inventories and included
information about readability formulas, specific reliability and validity information was not
provided in the Basic Reading Inventory, 4th
ed. (Johns, 1988), Classroom Reading Inventory,
10th
ed. (Silvaroli & Wheelock, 2004), Analytical Reading Inventory, 8th
ed. (Woods & Moe,
2007), Informal Reading Inventory, 7th
ed. (Roe & Burns, 2007), or Developmental Literacy
Inventory (Temple et al., 2009)
Tom read passages on the primer level. He scored 70% on the QRI’s (Leslie & Caldwell,
2011) first grade level word list. Since 70% was on the borderline between instructional and
frustration levels, the researcher chose to place him on primer level passages; he scored 95%
(independent level) on primer level passages. Collective primer passages from the seven reading
inventories ranged from 52 to 176 words in length. There was a range of four to ten
comprehension questions on the primer passages.
Chad read passages on the pre-primer level. He scored 76% (instructional level) on the
QRI’s (Leslie & Caldwell, 2011) pre-primer 1 word list. Collective pre-primer passages ranged
from 27 to 84 words in length. There was a range of five to eight comprehension questions on
the pre-primer passages.
Brian read passages on the first grade level. He scored 70% on the QRI’s (Leslie &
Caldwell, 2011) second grade level word list. Since 70% was on the borderline between
instructional and frustration levels, the researcher chose to place him on first grade level
passages; he scored 90% (independent level) on first grade level passages. Collective first grade

101
passages ranged from 41 to 266 words in length. There was a range of three to ten
comprehension questions on the level 1 passages.
To be included in the study, passages were either pre-primer, primer, or level 1; in
addition, they had to be accompanied by comprehension questions. Passages from the different
reading inventories were pooled and then presented in random order. A different passage was
presented for each session.
Before presenting the reading passages to the students, all passages were re-typed with
15-point Times New Roman font and double-spaced on white paper (8 ½ by 11 in.) with 1-inch
margins (see Appendix A for an example). To control for testing threats to internal validity, re-
typed passages did not include illustrations, even if illustrations accompanied passages in the
informal reading inventories.
The Data Collector copy (see Appendix B for an example) of the reading passage had
three copies of the story (to be used during the intervention condition) and also included basic
information including the student’s name, date, session number, phase of the study, data
collector’s name, and space for relevant or important comments.
Comprehension Questions
Pages with each passage’s comprehension questions (see Appendix C for an example)
were photocopied or re-typed verbatim and attached to the Data Collector Copy. The researcher
marked each student’s answers to the comprehension questions as correct or incorrect and made
notes as necessary. Then she calculated and recorded the percentage of correct responses.
Reinforcers
Frequent verbal praise and physical praise (e.g. high-fives) were given throughout the
study. During the baseline and maintenance phases, the data collector provided praise at the end

102
of the reading passage and after the student answered the comprehension questions (e.g., “Good
work today.”). During the error correction procedure in the intervention phase, praise was
provided if the participant correctly read a previously incorrect word. In addition, praise was also
provided after each of the three repeated readings and after the students answered the
comprehension questions.
A classroom token economy system, established prior to the study, was also used during
this intervention. In this token economy, students earned and lost “fuzzies” (pom-pom balls used
in arts and crafts projects) based on clearly defined behaviors. Fifty fuzzies were, in turn,
exchanged for preferred reinforcers such as free time, computer time, lunch in the classroom, one
homework pass, or the opportunity to pick a treat from the classroom treasure box. Throughout
and after every session in this study, students were given fuzzies to increase motivation,
cooperation, and preferred behavior.
Other Materials
Other materials that were used in the study included pencils, a stopwatch, a privacy
divider, bookmarks for students to use as place markers, an audio-tape recorder, audio tapes, the
CWPM/EPM/Comprehension Recording Sheet (see Appendix D), and the Procedural Checklist
for Data Collector (see Appendix E). In the event the data collector needed to review the oral
readings and for interobserver reliability checks, all sessions were audio recorded to facilitate
data collection and to control for instrumentation threats to internal validity.
Procedures
General Procedures
The study took place over a total of 42 sessions. There were at least three probes for each
student during the baseline condition. There was one maintenance probe each week for each

103
student following the intervention condition. To control for instrumentation threats to internal
validity, the sessions took place the same time each day for each student. The maximum length
of each session was 15 min. There was no more than one session per day for each participant
during all phases to control for testing threats (i.e. test fatigue) to internal validity. During the
intervention phase, there was one session every day for each participant. Due to all participants’
attention deficits and one participant’s body spasms related to performance-induced stress, the
researcher did not start timing passages until each student began reading the first word of the
passage.
While the researcher conducted readings with the individual participants, the special
education paraprofessional assigned to the classroom supervised and worked with the other
students in the classroom.
Prior to the study, the researcher decided on the following procedures for deciding the
order of students entering the intervention phase. The student with the most stable baseline probe
data in a non-therapeutic trend moved to the intervention phase first. If there was more than one
student with stable, non-therapeutic baseline probe data, the researcher would use her best
judgment based on overall classroom performance, attention, and behavior when choosing who
moves to the intervention phase first. The second and third students were chosen following the
same procedures.
Baseline, intervention, and maintenance were the three conditions in the study. During
baseline probes, multiple probes were staggered over sessions for the three participants before
the independent variable of repeated readings combined with error correction was introduced
during the intervention condition. Maintenance probes began one week after the intervention
phase ended.
104
Experimental Procedures
Baseline. The purpose of the baseline condition was to collect data on the students’
reading fluency prior to the introduction of the independent variable. During baseline, each
student individually met with the researcher at the kidney-shaped table in the classroom. The
student read one reading passage one time during each probe. There was at least one probe for
each student per week during baseline.
During each baseline session, the researcher presented a reading passage and asked the
student to read the passage out loud (e.g. “I want to listen to you read this story, and then I want
you to answer questions about it. Try to do your best.”). As the student read for 1 min, the data
collector recorded each word as correct or incorrect. The researcher coded the following three
types of errors – word read incorrectly, word omitted, and word not read within 3 s. After 1 min,
the researcher placed a mark (/) after the last word read and prompted the student to finish
reading the passage. The number of correct words per minute (CWPM) and errors per minute
(EPM) were recorded for the first minute only. When the student finished reading the passage,
the researcher provided verbal praise (e.g. “Great job reading!”) and gave him a fuzzy. Then she
asked the student to answer comprehension questions (e.g. “Now I’m going to ask you some
questions about what you just read.”). After the student verbally answered the questions, she
provided verbal praise (e.g. “Great job today! Thank you.”) and gave him a fuzzy. During the
baseline condition, the researcher followed the procedures on the Procedural Checklist for Data
Collector (see Appendix E).
Before each student entered the intervention phase, he was probed at least three
consecutive times until a stable pattern of responding could be established. Reviewed studies
were unclear in their criteria of moving from baseline to intervention phases. Therefore, the

105
researcher felt that a stable pattern of responding occurred when a student exhibited a non-
therapeutic trend in CWPM during baseline. The researcher also established criteria for
staggering the introduction of the intervention due to the possibility of variability in data and
trend and the potential of an increasing trend in data from testing effects; students did not move
from baseline to intervention until the student before them had established intervention criteria.
Intervention. The researcher implemented repeated readings supplemented by systematic
error correction during the intervention phase. Students began intervention after at least three
days of stable, non-therapeutic baseline data. The implementation of the intervention condition
closely followed the repeated readings procedures implemented in the study conducted by Alber-
Morgan et al. (2007).
Students with intellectual disabilities make slow and gradual academic gains. For this
reason, the researcher chose successive improvements as the criteria for mastery during
intervention. Weinstein and Cooke (1992) found that both methods of fixed-rate criterion and
successive improvements criterion were effective at producing gains in reading fluency. Even
though the participants in this study read a different passage each day, they were required to
demonstrate three consecutive sessions of improvement. More specifically, each participant was
required to read a minimum of one additional correct response (i.e. CWPM) for three
consecutive sessions. After each student met overall criteria for intervention, he entered the
maintenance phase, and the next student began the intervention phase.
Rashotte and Torgesen (1985) recommend that students reread a passage up to four times
per session. O’Shea et al. (1987) compared the effectiveness of rereading passages one, three,
and seven times and found that students read more fluently when passages were read seven
versus three times and three times versus one time. In each session during intervention, each

106
passage was read three times by the student. The researcher chose three repeated readings to give
the students a sufficient number of repeated readings while keeping the sessions at a length that
would keep their attention.
The researcher presented a reading passage and asked the student to read the passage out
loud (e.g. “I want to listen to you read this story. Try to do your best.”). The first reading of the
passage was untimed so that the student did not feel pressure to read quickly and could
concentrate on reading the words accurately. As the student read, the data collector recorded and
coded errors on the first copy of the passage (see Appendix B).
Each time the student made a reading error, the following error correction procedure was
used. The researcher pointed to and read the word correctly, prompting the student to repeat the
word, and provided verbal praise if the student was correct. After the student read the entire
reading passage (approximately 1-10 min), the researcher gave the student a fuzzy. Then she
reviewed each error by pointing to the word and saying, “What’s this word?” If the student read
the word correctly, the researcher delivered verbal praise (e.g. “Good.” or “Great!” or “Yes.”). If
the student read the word incorrectly or did not read it within 3 s, the researcher stated the word,
asked the student to repeat it, and delivered verbal praise. At the end of the error correction
procedure, the researcher gave the student a fuzzy.
After the first reading of the passage and error correction, the researcher told the student
he was going to be timed to see how many words he could read in 1 min. The researcher did not
correct errors during this time but recorded and coded errors. At this time, however, the
researcher told the student the correct word if 3 s went by without reading the word. After the
second reading, the researcher gave the student a fuzzy and delivered verbal praise. Next, the
researcher told the student he would read the passage a third time for 1 min. She followed the
107
same procedures as in the second reading. When the student finished reading the passage for the
third time, the researcher provided verbal praise (e.g. “Great job reading!”) and gave him a
fuzzy. Then she asked him to answer comprehension questions (e.g. “Now I’m going to ask you
some questions about what you just read.”). After the student verbally answered the questions,
she provided verbal praise (e.g. “Great job today! Thank you.”) and gave him a fuzzy. During the
intervention condition, the researcher followed the procedures on the Procedural Checklist for
Data Collector (see Appendix E).
Maintenance. Maintenance probes were conducted for each student once each week
following the conclusion of the intervention phase. Maintenance probes lasted the remainder of
the study. At least three maintenance probes were conducted for each student. The same
procedures that were utilized in the baseline phase were used in the maintenance phase (see
Appendix E).
Dependent Variables
Correct Words per Minute. A word was counted as correct if it was independently
pronounced within 3 s of the previous word read. A word was also counted as correct if the
student first pronounced it incorrectly but independently corrected it within 3 s (Alber-Morgan et
al., 2007). Correct words per minute were recorded for the first minute only of each reading. If a
student read a passage in less than 60 s, the researcher computed the correct words per minute by
using the following formula: ([total number of words read – number of words read incorrectly] /
reading time in seconds) x 60.
Errors per Minute. A word was counted as an error if it was stated incorrectly,
mispronounced, omitted, or not stated within 3 s of the previous word read. If a student hesitated
for more than 3 s, the researcher provided the word for the student so that he could continue

108
reading (Alber-Morgan et al., 2007). Errors per minute were recorded for the first minute only of
each reading. If a student read a passage in less than 60 s, the researcher did not alter the number
of errors read.
Reading Comprehension. After the students read each passage for the final time, the
researcher orally administered comprehension questions and recorded the students’ responses.
The comprehension questions along with correct responses were included in the reading
inventories; the researcher did not omit or add questions. The number of questions ranged from
three to ten questions. The comprehension questions consisted of both literal and inferential
questions. The researcher did not separate results by the types of comprehension questions;
instead, she pooled student responses to all comprehension questions to obtain an overall
comprehension score for each passage. Even though the researcher repeated the questions or re-
phrased the questions to ensure understanding, she did not prompt the students in any way during
the presentation of the comprehension questions. Responses were counted as correct if they
matched one of the possible responses listed in the reading inventories. All other responses
including unanswered or partially answered questions were scored as incorrect (Alber-Morgan et
al., 2007).
Reliability
Interobserver Agreement for CWPM, EPM, and Comprehension. The primary data
collector was the teacher researcher in the classroom. The researcher asked a paraprofessional
who was familiar with the participants to become the secondary data collector and provide
interobserver agreement. This paraprofessional was not the same paraprofessional who worked
with the students on a daily basis. On the other hand, she had been assigned to their classroom

109
the previous year. Therefore, she was familiar with the participants’ speech, reading, and
mannerisms.
Before the study began, the researcher trained the paraprofessional. During the training,
the paraprofessional was provided with a copy of the Procedural Checklist (see Appendix E) for
the baseline, intervention, and maintenance conditions of the study. The paraprofessional was
only responsible for steps 8, 9, 13, 16, and 17 during the baseline and maintenance conditions;
the researcher had highlighted these steps for the paraprofessional. For the intervention
condition, the researcher asked her to repeat those steps for the third reading and comprehension
questions only; she was not asked to record data for the first two readings. After the researcher
explained and modeled each step, the paraprofessional role-played the required steps and
received feedback from the researcher. The paraprofessional role-played until achieving 100%
accuracy in the required steps.
The researcher conducted all sessions, collected data for every session, and audio taped
all sessions. The secondary data collector did not conduct the sessions, nor did she attend the
sessions. Instead, she independently listened to the taped sessions. This provided her with the
same opportunity as the researcher; they were both able to review or rewind the tapes as needed
to get the most accurate data collection. To control for observer bias and observer drift
(instrumentation threats to internal validity), the researcher asked the paraprofessional to
explicitly follow the steps provided on the highlighted procedural checklist. The paraprofessional
independently recorded errors and comprehension data on her own Data Collector Copy (see
Appendix B).
Reliability probes were conducted once per week per student and at least once per
condition. A total of 34 out of 70 (49% of all sessions) reliability probes were randomly chosen
110
and conducted. Interobserver agreement (IOA) was assessed for fluency (CWPM and EPM) and
comprehension. The researcher’s Data Collector Copies were compared to the paraprofessional’s
marked copies to determine IOA. For fluency IOA, the researcher highlighted differences in the
errors marked by each data collector to mark them as disagreements. If one data collector marked
a word as an error but the other data collector counted it as correct, the researcher marked it as a
disagreement. If the data collectors marked the same word as an error but coded it as a different
type of error, the researcher counted it as an agreement and did not mark it. For comprehension
IOA, the researcher marked an answer as a disagreement if one data collector marked it as
correct but the other data collector marked it as incorrect.
The point-by-point agreement of calculating IOA was used to gather reliability data for
both fluency and comprehension. To calculate point-by-point agreement, the following formula
was used: (agreements / [agreements + disagreements]) x 100 (Alberto & Troutman, 2006;
Tawney & Gast, 1984). The researcher did not use gross agreement of calculating IOA because it
can easily mask problems in specific items and can portray an elevated percentage of IOA. The
gross method of calculating IOA would have been inappropriate for this study since there were
permanent products to use; the researcher could easily compare how each person scored each
word.
Procedural Fidelity. Procedural fidelity was assessed 9 times (13% of the total number of
sessions). It was assessed one time for each student per session during the baseline, intervention,
and maintenance phases. During these sessions, the secondary data collector (paraprofessional
not assigned to the classroom) used the Procedural Checklist for Data Collector (see Appendix
E) to assess the researcher’s adherence to the procedures in the correct order. She placed a check
next to each completed step of the procedure and an “x” next to each missed step of the

111
procedure. Procedural reliability was calculated by determining the mean percentage of steps
observable (Sheridan, Swanger-Gagne, Welch, Kwon, & Garbacz; 2009); more specifically, it
was calculated by dividing the number of steps followed correctly divided by the total number of
steps and multiplying by 100.
Social Validity
At the conclusion of the study, the researcher individually interviewed the participants to
determine their opinions of the repeated readings combined with error correction (see Appendix
F). They were asked the following six questions: 1) Do you think repeated readings affected your
reading skills; 2) What did you like about doing the repeated readings; 3) What did you NOT
like about doing repeated readings; 4) Did repeated readings help you remember the story; 5)
Did repeated readings help you to understand what happened in the story; and 6) Would you use
repeated readings in social studies, science, or when reading your A.R. books? The researcher
had to re-word some of the questions to help the students better understand what she was asking.
Data is reported through anecdotal reports in the data analysis section.
Data Analysis Procedures
Results from the study were reported and organized into graphs (see Figures 1 and 2).
The figures depict correct words per minute, errors per minute, and the percentage of
comprehension questions answered correctly. Data in the graphs were analyzed through visual
analysis. The mean and range of data in each condition were reported for additional data
analysis. Within condition analysis focused on factors such as level stability, absolute level
change, and trend factors such as trend direction, and trend stability. Level stability is determined
by finding the range of data point values in a series or set of data. Generally, if 80%-90% of the
data points in a condition fall within a 15% range of the mean level of all the data points in that

112
condition, researchers will consider the data stable (Tawney & Gast, 1984). The researcher of the
present study considered the level to be stable if 80% of the data points fell within a 20% range
of the mean level of all the data points. The mean level of a condition was calculated by adding
the values of all data points, dividing the sum by the number of data points, and drawing a mean
line parallel to the abscissa at that value (Tawney & Gast, 1984). Absolute level change within a
condition was computed by identifying the values of the first and last data points of a condition,
subtracting the smallest value from the largest value, and noting whether the change in level was
accelerating or decelerating (Tawney & Gast, 1984).
Trend refers to the overall direction of the data path. Trend direction refers to the
steepness of the data path over time and is referred to as accelerating/increasing,
decelerating/decreasing, or zero celeration/zero trend (Cooper, Heron, & Heward, 1987; Tawney
& Gast, 1984). Two methods of estimating the trend line are the freehand method and the split-
middle method. In the freehand method, one visually inspects the graphed data and draws a
straight line that bisects the data points (Cooper et al., 1987; Tawney & Gast, 1984). In the split-
middle method, described by White and Haring (1980) and illustrated by Tawney and Gast
(1984), one divides the data into two equal parts, finds the intersections of the mid-rate and mid-
date for each half, draws a line through the data which passes through both of the intersections,
and counts the number of data points which fall above and below the drawn line. If there is not a
balanced number of data points above and below the line, one should move the line up or down
until the data points are balanced. A trend could be considered stable if 80%-90% of the data
points in the condition fall within a 15% range of the trend line (Tawney & Gast, 1984). The
researcher of the present study considered the trend to be stable if 80% of the data points fell
within a 20% range of the mean of all the data points. Cooper et al. (1987) noted that trend lines
113
should be used and interpreted with care because they can obscure important trends and
variability in the data.
In this study, between conditions analysis focused on absolute level change, trend
differences, changes in data stability/variability, the percentage of overlapping data points, and
the participants’ overall performance across replications. Absolute level change between
adjacent conditions was computed by identifying the values of the last data point of the first
condition and the first data point in the second condition, subtracting the smallest value from the
largest value, and noting whether the change in level was accelerating or decelerating (Tawney
& Gast, 1984). When a large difference in the level occurs immediately following the
introduction of a new condition, the level change is considered “abrupt”, which can be an
indication of an effective intervention (Tawney & Gast, 1984). The percentage of overlap of data
point values was calculated by determining the range of data values in the first condition,
counting the number of data points in the second condition that fall within the range of values in
the first condition, and dividing the number of data points which fall within the range of the first
condition by the total number of data points in the second condition and multiplying this number
by 100 (Tawney & Gast, 1984). As a general rule, the lower the percentage of overlap, the more
effect the intervention has on the dependent variable(s). However, variability must be
considered. For example, unusual data points (outliers) and ceiling or floor level effects in the
data may cause a high percentage of overlap even though there is a direct relationship between
the independent and dependent variables.
114
CHAPTER 4
RESULTS
This study sought to examine the effects of repeated readings paired with error correction
on the reading fluency and comprehension skills of elementary-age students with intellectual
disabilities. The purpose of this chapter is to report the effects of the independent variable,
repeated readings with error correction, on the dependent variables of correct words per minute,
errors per minute, and the percentage of comprehension questions answered correctly. Raw data
and subsequent interpretation of the raw data are provided. In addition, study reliability
(interobserver agreement and procedural fidelity) and social validity results are reported.
Discussion of the results, limitations, and implications for practice and future research are
presented in the next chapter.
Sessions
Table 10 includes the number of sessions for each participant during each condition.
Participants remained in the intervention phase until they demonstrated three consecutive
sessions in which there were improvements of at least one additional correct word per minute.
The study was concluded after the researcher collected three maintenance probes for the last
participant. With the exception of a series of repeated baseline measures prior to intervention for
each participant, probe sessions were conducted on the same days for the participants throughout
the study. Spring Break occurred during the study, and the students did not attend school for a
period of one week. Spring Break occurred during the maintenance condition for all participants
and did not affect results gathered during the intervention condition.

115
Table 10: Number of Sessions Participants Spent in Each Condition
Student Baseline Intervention Maintenance Total Sessions
Tom 3 12 8 23
Chad 10 8 5 23
Brian 10 10 3 23
Analysis of Research Results
In a multiple baseline across subjects design, predictions based on one participant’s
behavior must be verified by the behavior of other participants, and replication of effect is
dependent on the behavior of other participants (Cooper et al., 1987). Visual analysis of the data
in this study reveals that there was a functional relationship between the intervention and the
reading fluency of all participants. Visual analysis of the data does not support that there was a
functional relationship between the intervention and the reading comprehension of the
participants. Figure 1 displays the correct words per minute and errors per minute for baseline,
intervention, and maintenance conditions across all three of the participants. Figure 2 illustrates
the percentage of comprehension questions answered correctly during all conditions for all
participants.
Correct Words per Minute
Tom. Trend direction during baseline was decelerating with an absolute change of -12
CWPM. There was low variability in the range of values; 100% of the data points fell within
20% of the median, indicating a stable trend and level during baseline. From the last session
during baseline to the first session during intervention, there was an immediate increase in the
CWPM read by Tom. The absolute level change between conditions was 29 CWPM. Trend

116
direction went from decelerating to zero celeration. In addition, there was 0% overlapping data
from baseline to intervention. Tom’s CWPM during intervention resulted in a flat trend as
evidenced by the split-middle and quarter intersect method of estimating trend; therefore, the
trend was neither accelerating or decelerating. There was an absolute change of 3 CWPM during
intervention. There was low variability in the range of values; 92% of the data points fell within
20% of the median, indicating a stable trend and level during intervention. From the last session
during intervention to the first session during maintenance, there was an immediate increase in
CWPM. In fact, the highest CWPM measured throughout the study occurred during the first
session in the maintenance condition. The absolute level change between conditions was 17
CWPM. The level increased slightly while level stability decreased from intervention to
maintenance. Trend direction went from zero celeration to decelerating. There was 75%
overlapping data from intervention to maintenance. There was an absolute change of -32 CWPM
within the maintenance condition. There was some variability in the range of values; 75% of the
data points fell within 20% of the median, illustrating an unstable trend during maintenance.
Chad. Trend direction during baseline was accelerating with an absolute change of -10
CWPM. There was high variability in the range of values; 50% of the data points fell within 20%
of the median, demonstrating an unstable trend and level during baseline. From the last session
during baseline to the first session during intervention, there was an increase in the CWPM with
an absolute level change of 20 CWPM. Trend direction remained accelerating between
conditions, but there was an immediate increase in the slope of the trend line during intervention.
Trend variability decreased from baseline to intervention, and there was 13% overlapping data.
There was an absolute change of 37 CWPM within the intervention condition. Although there
was some variability in the level and range of values (75% of the data points fell within 20% of
117
the median), there was an overall upward trend in the data during intervention. From the last
session during intervention to the first session during maintenance, there was an immediate
decrease in the CWPM with an absolute level change of -54 CWPM. Trend direction went from
accelerating to decelerating. There was 0% overlapping data from intervention to maintenance.
Level stability increased from 75% during intervention to 100% during maintenance. There was
low variability in the range of values; 100% of the data points fell within 20% of the median,
illustrating a stable trend during maintenance. There was an absolute change of 1 CWPM within
the maintenance condition.
Brian. Trend direction during baseline was decelerating with an absolute change of -5
CWPM. There was some variability in the range of values; 70% of the data points fell within
20% of the median, demonstrating somewhat of a stable trend and level during baseline. From
the last session during baseline to the first session during intervention, there was an immediate
increase in the number of correct words read with an absolute level change of 46 CWPM. Trend
direction went from decelerating to accelerating from baseline to intervention. In addition, there
was 0% overlapping data from baseline to intervention. There was an absolute change of 13
CWPM within the intervention condition. There was low variability in the range of values; 90%
of the data points fell within 20% of the median, illustrating a stable trend and level during
intervention. From the last session during intervention to the first session during maintenance,
there was an immediate decrease in CWPM with an absolute level change of -37 CWPM and
33% overlapping data. Even though there was a decrease in the level, the trend direction
remained accelerating from intervention to maintenance. There was an absolute change of 16
CWPM within the maintenance condition. There was some variability in the range of values;

118
66% of the data points fell within 20% of the median, illustrating an unstable trend and level
during maintenance.
Table 11: Mean Correct Words per Minute for Participants during Each Condition
Students Baseline Intervention Maintenance
Tom 35 (range 29-41) 50.5 (range 43-65) 52.4 (range 40-72)
Chad 22 (range 13-42) 54 (range 39-76) 26.2 (range 22-31)
Brian 47.7 (range 34-60) 81.1 (range 66-103) 61.7 (range 56-72)
Errors per Minute
Tom. Trend direction during baseline was accelerating with an absolute change of 2
EPM. There was variability in the range of values; 66% of the data points fell within 20% of the
median, demonstrating an unstable trend and level during baseline. From the last session during
baseline to the first session during intervention, there was an immediate decrease in the number
of errors read with an absolute level change of -8 EPM. Trend direction went from accelerating
to decelerating. Although there was an increase in trend and level variability from baseline to
intervention, there was only 8% overlapping data. There was an absolute change of 8 EPM
within the intervention condition. There was high variability in the range of values; 25% of the
data points fell within 20% of the median, demonstrating an unstable level and trend line. From
the last session during intervention to the first session during maintenance, the absolute level
change was -1 EPM. Trend direction went from decelerating to accelerating. There was 88%
overlapping data from intervention to maintenance. There was an absolute change of 1 EPM
during maintenance. There was an unstable level and trend line; 50% of the data points fell
within 20% of the median.

119
Chad. Trend direction during baseline was accelerating with an absolute change of 0
EPM. There was some variability in the range of values; 70% of the data points fell within 20%
of the median, demonstrating somewhat of an unstable trend and level during baseline. There
was an immediate decrease in EPM from baseline to intervention with an absolute level change
of -12 EPM. Trend direction went from accelerating to decelerating. There was 13% overlapping
data from baseline to intervention. Chad’s EPM during intervention resulted in a decelerating
direction with an absolute change of -3 EPM. There was variability in the range of values; 50%
of the data points fell within 20% of the median, illustrating an unstable level and trend during
intervention. From the last session during intervention to the first session during maintenance,
there was an immediate increase in the data with an absolute level change of 22 EPM. Trend
direction went from decelerating to accelerating with 0% overlapping data from intervention to
maintenance. There was an absolute change of 13 EPM during the maintenance condition. There
was variability in the range of values; 60% of the data points fell within 20% of the median,
illustrating an unstable level and trend during maintenance.
Brian. Since the number of errors Brian read was low across all conditions, Brian
demonstrated an overall floor effect in the number of errors he read per minute. Trend direction
during baseline was decelerating with an absolute change of -2 EPM. There was high variability
in the range of values; 40% of the data points fell within 20% of the median, illustrating an
unstable level and trend line. From baseline to intervention, the absolute level change was 0
EPM, illustrating that the intervention was not immediately effective for Brian in decreasing
EPM. On the other hand, trend direction went from accelerating to decelerating. There was 100%
overlapping data from baseline to intervention with no change in trend variability and level
stability. Brian’s EPM during intervention resulted in a decelerating trend with an absolute

120
change of -1 EPM. High variability resulted since 40% of the data points fell within 20% of the
median. From the last session during intervention to the first session during maintenance, the
absolute level change was 3 EPM. Trend direction remained decelerating from intervention to
maintenance. Trend variability increased slightly from intervention to maintenance, and level
stability decreased. There was 100% overlapping data from intervention to maintenance. There
was an absolute change of -1 EPM during intervention. 33% of the data points fell within 20% of
the median, resulting in an unstable trend and level.
Table 12: Mean Errors per Minute for Participants during Each Condition
Students Baseline Intervention Maintenance
Tom 7.7 (range 5-10) 2.6 (range 0-7) 5 (range 3-8)
Chad 13.1 (range 5-18) 2.1 (range 0-6) 17.8 (range 10-36)
Brian 1.9 (range 0-6) 0.7 (range 0-3) 1.7 (range 0-3)
Comprehension
Tom. Trend direction during baseline was decelerating with an absolute change of 33.
There was high variability in the range of values with an unstable trend and level; 33% of the
data points fell within 20% of the median. It should be noted that the second highest percentage
of comprehension questions answered correctly throughout the study by Tom occurred during
the first session in baseline. From the last session during baseline to the first session during
intervention, there was an increase in the data with an absolute level change of 16. Trend
direction remained decelerating from baseline to intervention with 67% overlapping data. Tom’s
comprehension during intervention was decelerating with an absolute change of -15. There was
an unstable level and trend with high variability in the range of values; 17% of the data points

121
fell within 20% of the median. From the last session during intervention to the first session
during maintenance, there was an increase in the data with an absolute level change of 15 and
50% overlapping data. There was an absolute change of 7 within the maintenance condition.
50% of the data points fell within 20% of the median, illustrating an unstable trend and level
with high variability during maintenance. Actually, two trend directions were observed during
maintenance; at first the trend was decelerating, and then it began to accelerate. Interestingly,
data illustrates that the highest percentage of correct answers to comprehension questions
occurred during maintenance.
Chad. Trend direction during baseline was decelerating with an absolute change of 38.
There was an unstable level and trend with high variability in the range of values; 40% of the
data points fell within 20% of the median. From baseline to intervention, the absolute level
change was 37 with 88% overlapping data. Even though the level increased, trend direction
continued to be decelerating from baseline to intervention. Chad’s comprehension during
intervention resulted in a slightly decelerating trend with an absolute change of -15. 75% of the
data points fell within 20% of the median, indicating some instability in the trend and level.
From intervention to maintenance, the absolute level change was -20 with 20% overlapping data.
Trend was more variable during maintenance than it was during intervention, and trend direction
went from decelerating to accelerating. Level stability decreased from 75% during intervention
to 60% during maintenance. There was an absolute change of 0 within the maintenance
condition. 60% of the data points fell within 20% of the median, illustrating variability with an
unstable trend during maintenance.
Brian. Trend direction during baseline was accelerating with an absolute change of 50.
There was variability in the range of values; 40% of the data points fell within 20% of the

122
median, demonstrating an unstable trend and level during baseline. There was a decrease in the
data from the last session during baseline to the first session during intervention with an absolute
level change of -17, but there was 70% overlapping data. Trend direction remained accelerating
from baseline to intervention. There was an increase in trend variability while level stability
decreased. Brian’s comprehension during intervention resulted in an accelerating trend with an
absolute change of 34. The level and trend during intervention had high variability due to the
range of values; 0% of the data points fell within 20% of the median. From intervention to
maintenance, there was an abrupt decrease in the data with an absolute level change of -67 and
100% overlapping data. Trend direction remained accelerating from intervention to maintenance.
Although there was variability in the range of values, level and trend stability increased from 0%
during intervention to 66% during maintenance. There was an absolute change of 50 during
maintenance.
Table 13: Mean Comprehension Scores for Participants during Each Condition
Students Baseline Intervention Maintenance
Tom 33.3 (range 17-50) 15.4 (range 0-33) 30 (range 0-60)
Chad 34.4 (range 0-80) 65.6 (range 50-100) 39.4 (range 17-60)
Brian 22.8 (range 0-50) 33.3 (range 0-83) 33.3 (range 0-50)
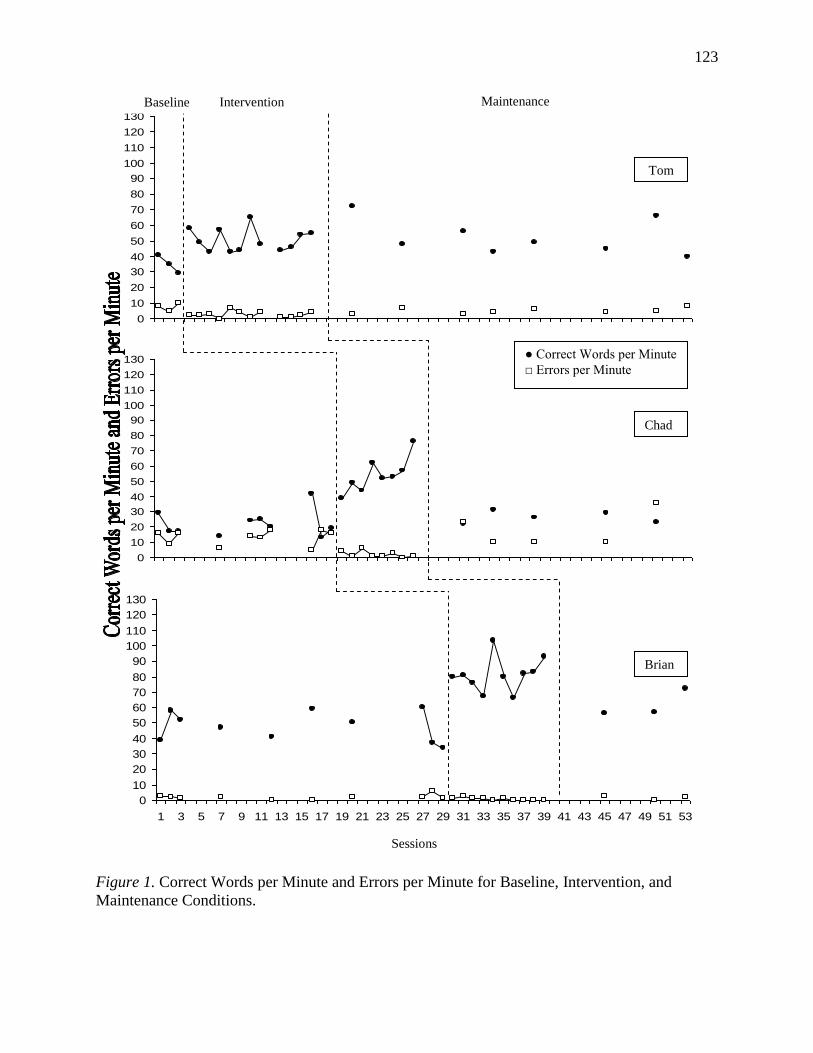
123
0
10
20
30
40
50
60
70
80
90
100
110
120
130
0
10
20
30
40
50
60
70
80
90
100
110
120
130
0
10
20
30
40
50
60
70
80
90
100
110
120
130
1 3 5 7 9 11 13 15 17 19 21 23 25 27 29 31 33 35 37 39 41 43 45 47 49 51 53
Figure 1. Correct Words per Minute and Errors per Minute for Baseline, Intervention, and
Maintenance Conditions.
Sessions
Maintenance Baseline Intervention
● Correct Words per Minute
□ Errors per Minute
Tom
Chad
Brian

124
0
10
20
30
40
50
60
70
80
90
100
0
10
20
30
40
50
60
70
80
90
100
0
10
20
30
40
50
60
70
80
90
100
1 3 5 7 9 11 13 15 17 19 21 23 25 27 29 31 33 35 37 39 41 43 45 47 49 51 53
Figure 2. Comprehension for Baseline, Intervention, and Maintenance Conditions.
Sessions
Brian
Chad
Tom
Baseline Intervention Maintenance

125
Reliability
Interobserver reliability data was gathered for 33 out of 69 total sessions (48%) for all
participants for both fluency and comprehension. The point-by-point agreement of calculating
interobserver agreement was used (Tawney & Gast, 1984). Reliability data was calculated for
Tom during 1 out of 3 baseline sessions, 4 out of 12 intervention sessions, and 6 out of 8
maintenance sessions with a total number of 11 out of 23 sessions (48%). For Chad, reliability
data was calculated for 4 out of 10 baseline sessions, 2 out of 8 intervention sessions, and 5 out
of 5 maintenance sessions with 11 out of 23 sessions (48%). Reliability data was calculated for
Brian during 6 out of 10 baseline sessions, 3 out of 10 intervention sessions, and 2 out of 3
maintenance sessions with a total number of 11 out of 23 (48%) sessions for Brian. Table 10
displays interobserver reliability for fluency and comprehension for each participant for each
condition as well as the overall mean interobserver reliability across all conditions for each
participant. The total mean interobserver reliability for the entire study was 94.1% (range 40%-
100%). In other words, the researcher and the secondary data collector (a paraprofessional
familiar with the students) agreed 94.1% of the time that the target behaviors of CWPM, EPM,
and correct answers to the comprehension questions occurred or did not occur.
Table 14: Interobserver Reliability Results
Student Fluency Comprehension
Tom Baseline = 94%
Intervention = 95.5% (range 92%-98%)
Maintenance = 95% (range 92%-100%)
Overall = 95% (range 92%-100%)
Baseline = 100%
Intervention = 100%
Maintenance = 95.5% (range 83%-
100%)
Overall = 97.6% (range 83%-100%)

126
Chad Baseline = 93.5% (range 89%-100%)
Intervention = 98.5% (range 97%-100%)
Maintenance = 84.6% (range 66%-97%)
Overall = 90.4% (range 66%-100%)
Baseline = 100%
Intervention = 100%
Maintenance = 77.4% (range 40%-
100%)
Overall = 89.7% (range 40%-100%)
Brian Baseline = 96.5% (range 91%-100%)
Intervention = 98.3% (range 95%-100%)
Maintenance = 94% (range 91%-97%)
Overall = 96.6% (range 91%-100%)
Baseline = 96.5% (range 89%-100%)
Intervention = 100%
Maintenance = 83.5% (range 67%-
100%)
Overall = 95.1% (range 67%-100%)
Procedural fidelity data was gathered for 9 out of 69 sessions (13%) for all participants
for both fluency and comprehension. It was assessed one time for each student per session during
the baseline, intervention, and maintenance conditions. Procedural fidelity was 100% for this
study. In other words, the researcher accurately and consistently followed the steps provided on
the Procedural Checklist for Data Collector (see Appendix E). 100% procedural fidelity
demonstrates that the procedures of this study were conducted as planned.
Social Validity Survey
According to Wolf (1978), there are three levels of social validity. First, the goals of the
study should be socially significant; the goals should be something that society wants. Second,
the procedures should demonstrate social appropriateness; stakeholders should consider the
procedures to be acceptable. Third, the participants should be satisfied with the results of their
performance; the effects should be socially important.

127
The researcher developed a questionnaire to gather social validity information from the
participants. The questionnaire consisted of six questions that the researcher orally administered
to the participants: 1) Do you think repeated readings affected your reading skills; 2) What did
you like about doing the repeated readings; 3) What did you NOT like about doing repeated
readings; 4) Did repeated readings help you remember the story; 5) Did repeated readings help
you to understand what happened in the story; and 6) Would you use repeated readings in social
studies, science, or when reading your A.R. books? She re-worded the questions in the event the
participant did not understand what she was asking. The researcher recorded verbatim what the
participants said in response to the questions.
Tom said he thinks that repeated readings affected his reading skills; he said repeated
reading made him feel happy. When asked what he liked about repeated readings, he said, “I
love it.” When asked if there was something he didn’t like about repeated readings, he said, “No,
not exactly.” He did not feel that repeated readings helped him remember the stories; however,
he did reply that he thought repeated readings helped him to understand what happened in the
stories. When asked if he would use repeated readings when reading his A.R. books, he said,
“sometimes, a couple, yeah.”
Chad said that he does not think that repeated readings affected his reading skills. When
asked what he liked and didn’t like about repeated readings, he replied, “I didn’t like nothing
about it. It wasn’t fun. I don’t like reading.” He did not feel that repeated readings helped him
remember the stories. On the other hand, he did say that repeated readings helped him to
understand what happened in the story. He also said that he would use repeated readings in social
studies, science, and when reading his A.R. book.
128
Brian said that repeated readings made him a better reader. He liked working on the
words, but he did not like having the privacy folder between himself and the researcher. He felt
that repeated readings helped him to both remember the story and understand what happened in
the story. When the researcher asked him if he would use repeated readings when reading his
A.R. books, he said yes.

129
CHAPTER 5
DISCUSSION, LIMITATIONS, AND IMPLICATIONS
The purpose of this study was to examine the efficacy of repeated reading and error
correction on the reading fluency and comprehension skills of elementary-age students with
intellectual disabilities. The intervention was developed to measure the number of correct words
per minute, errors per minute, and percentage of comprehension questions answered correctly
after repeatedly reading passages three times at students’ independent and/or instructional
reading levels. The overall results suggest that the intervention was effective in increasing the
participants’ correct words read per minute. The results do not suggest that the intervention was
effective in decreasing errors read per minute or increasing the participants’ reading
comprehension. Two out of the three participants responded positively to the intervention based
on results of the social validity survey. This chapter presents a discussion of the results from the
intervention and survey. This chapter also conveys the study limitations, implications for
practice in the classroom, and suggestions for future research.
Discussion
The present study was intended to investigate the effects of repeated readings combined
with error correction on the reading fluency and reading comprehension. Four questions were
addressed by this study: 1) Will the combined effects of repeated readings and error correction
increase the number of words read correctly per minute of elementary-age students with
intellectual disabilities; 2) Will the combined effects of repeated readings and error correction
decrease the number of reading errors per minute of elementary-age students with intellectual
130
disabilities; 3) Will the combined effects of repeated readings and error correction increase the
reading comprehension of elementary-age students with intellectual disabilities; and 4) What are
the students’ opinions of repeated readings combined with error correction?
In studies with the multiple baseline across participants design, a functional relationship
between the independent and dependent variables is dependent on two occurrences: (1) the
behaviors in baseline remain the same while behaviors interacting with the independent variable
change, and (2) each behavior changes when the independent variable is applied to it (Cooper et
al., 1987). In other words, one can be confident of a functional relationship when there is a
marked change in level and/or trend in the data once the independent variable is introduced, yet
data from those in the baseline condition remain constant. As the number of replications of the
effects of the treatment increases, confidence of a functional relationship increases. Without
replications of the effects of the treatment across the tiers, there is a low level of confidence that
a functional relationship between the independent and dependent variables exists.
Correct Words per Minute
The first question addresses the effects of the intervention on the number words read
correctly per minute. When baseline performance was stable, the intervention of repeated
readings combined with error correction was introduced to Tom. Baseline conditions were
maintained for Chad and Brian. When Tom demonstrated three successive improvements in
CWPM, the intervention was introduced to Chad. Baseline conditions were maintained for Brian,
and Tom entered the maintenance condition. When Chad demonstrated three successive
improvements in CWPM, the intervention was introduced to Brian. Maintenance conditions were
maintained for Tom, and Chad entered the maintenance condition. When Brian demonstrated
three successive improvements in CWPM, he entered the maintenance condition.

131
As illustrated in Figure 1, each student increased the number of words correctly per
minute from baseline to intervention. Tom went from a mean score of 35 CWPM during baseline
to a mean score of 50.5 CWPM during intervention with 0% overlapping data. His trend line
went from decelerating to zero celeration with an absolute level change of 29 CWPM. Though
stability was observed in both conditions, trend stability decreased slightly from baseline to
intervention. Chad went from a mean score of 22 CWPM during baseline to a mean score of 54
CWPM during intervention with 13% overlapping data. His trend line was accelerating in both
conditions, but the slope of the trend line during intervention was much steeper. Trend stability
increased from 50% to 75%. There was an absolute level change of 20 CWPM between
conditions. Brian went from a mean score of 47.7 CWPM during baseline to a mean score of
81.1 CWPM during intervention with 0% overlapping data. His trend line went from
decelerating to accelerating with an absolute level change of 46 CWPM. Trend stability
increased from 70% to 90%. Even though there was variability within the baseline condition for
Chad and Brian, Tom’s success with the intervention in increasing CWPM was replicated with
Chad and again with Brian. The researcher can conclude that there was a functional relationship
between the intervention and the number of words read correctly per minute.
In the maintenance condition, the intervention was withdrawn, and baseline procedures
were applied. If the participants’ fluency was truly influenced by the intervention of repeated
reading combined with error correction, one would expect results to diminish during
maintenance probes. From intervention to maintenance, Tom’s data demonstrated a slight
increase in the level change (absolute level change of 17 CWPM). On the other hand, Tom’s
trend went from zero celeration to decelerating with stability decreasing from 92% to 75%.
There was 75% overlap in the CWPM between conditions. During the first day of maintenance,
132
54 fewer CWPM were observed when compared to the last day of the intervention condition. In
the maintenance condition, Chad’s data demonstrated a stable, slightly decelerating trend
following a variable, accelerating trend during intervention. There was 0% overlap between
intervention and maintenance. Brian’s data demonstrated a decreased level change from
intervention to maintenance. Brian’s trend went from a stable, accelerating trend during
intervention to a variable, accelerating trend during maintenance. There was 33% overlap
between the two conditions.
Tom read more mean correct words per minute during maintenance than either baseline
or intervention. Chad and Brian had mean maintenance CWPM scores that were lower than those
during intervention, but they were higher than those during baseline. Overall, the researcher can
conclude that the withdrawal of the intervention caused an immediate contratherapeutic effect on
number of correct words per minute read by Chad and Brian. Tom’s CWPM did not immediately
decrease upon maintenance probes, but the data trend became unstable.
Interestingly, Brian’s overall fluency rate in oral reading is better than in oral
conversation. The researcher theorizes this is in part because Brian has deficits in executive
functioning that affect his rate of conversational speech. She also feels like Brian has a
combination of low self-esteem in conversation (as a result of his facial malformation and speech
impediment) and learned helplessness; both his family members and peers frequently answer and
speak for Brian.
Errors per Minute
The second question addresses the effects of the intervention on the number of errors read
per minute. As illustrated in Figure 1, Tom and Chad decreased the number of errors they read
per minute from baseline to intervention. Tom went from a mean score of 7.7 EPM during

133
baseline to 2.6 EPM during intervention with 8% overlapping data. His trend line went from
accelerating to decelerating with an absolute level change of -8 EPM. Variability in trend
increased from 66% to 25%. Chad went from a mean score of 13.1 EPM during baseline to a
mean score of 2.1 EPM during intervention with 13% overlapping data. His trend line changed
from accelerating to decelerating with an absolute level change of -12 EPM. Variability in trend
increased from 70% to 50%. Brian demonstrated a floor effect with a mean score of 1.9 EPM
during baseline to a mean score of 0.7 EPM during intervention with 100% overlapping data. His
trend line was accelerating to decelerating with an absolute level change of 0 EPM. Trend
variability (40%) remained the same from baseline to intervention for Brian.
The intervention may have been successful in decreasing the number of errors Tom and
Chad read per minute, but the researcher cannot be sure since the trend variability was high.
Brian demonstrated floor effects, so the researcher cannot conclude that the intervention caused
Brain’s EPM to decrease. Even though trend stability was not present, there was only one
replication demonstrating the possible decrease in EPM after the introduction of the intervention.
The researcher cannot conclude that there was a functional relationship between the intervention
and the number of errors read per minute.
From intervention to maintenance, all students demonstrated an increase in the level
change for EPM. Tom’s trend went from decelerating to accelerating with stability increasing
from 25% to 50%. There was 88% overlap in the EPM between conditions. In the maintenance
condition, Chad’s data demonstrated an unstable accelerating trend following a somewhat
variable, decelerating trend during intervention. There was 0% overlap between intervention and
maintenance. Brian’s trends were decelerating in both conditions, but trend variability increased
from intervention to maintenance. There was 100% overlap between the two conditions. As
134
mentioned previously, Brian demonstrated a floor effect in the number of errors per minute. Tom
and Brian had the lowest mean number of errors during intervention, followed by maintenance
and then baseline. Chad had the lowest mean number of errors during intervention, followed by
baseline and then maintenance. Overall, the researcher can conclude that the withdrawal of the
intervention caused a contratherapeutic effect on number of errors read per minute by Tom and
Chad.
It should be noted that during most maintenance probes, Chad no longer tried to sound
out words he did not know. Instead, he skipped words he didn’t know; this automatically
increased the number of errors he read per minute. This could have been the result of test fatigue,
multiple treatment interference (ex. being told to skip words he doesn’t know how to read during
a timed test), or decreased motivation to accurately read the words in the passages.
Comprehension
The third question addresses the effects of the intervention on the percentage of correct
responses to comprehension questions. An analysis of the information in Figure 2 demonstrates
that the intervention did not cause a significant change in comprehension among the participants.
Tom’s mean comprehension scores decreased from 33.3% during baseline to 15.4% during
intervention with 67% overlapping data. The trend line remained decelerating from baseline to
intervention with an absolute level change of 16%. Chad’s mean comprehension scores increased
from 34.4% during baseline to 65.6% during intervention, but there was 88% overlapping data
between conditions. His trend lines for baseline and intervention were both decelerating with an
absolute level change of 37%. Brian’s mean comprehension scores increased from 22.8% during
baseline to 33.3% during intervention, but he had 70% overlapping data between conditions. The

135
trend lines during baseline and intervention were both accelerating with an absolute level change
of -17%. Tom’s comprehension actually decreased from baseline to intervention.
With 88% overlapping data between baseline and intervention and trend instability in
both conditions, there is a lack of evidence to prove there is a functional relationship between the
intervention and Chad’s comprehension skills. With increasing variability from baseline to
intervention and 70% overlapping data, there is a lack of proof that the intervention was
successful in increasing Brian’s reading comprehension skills. In summary, there were not any
gains in percentage of correct responses to comprehension questions that could be attributed to
the intervention. Therefore, the researcher cannot conclude there was a functional relationship
between the intervention and the participants’ reading comprehension.
From intervention to maintenance, Tom’s data demonstrated an increase in the level
change (absolute level change of 16). There were two noticeable trend lines during the
maintenance conditions; the first trend line was decelerating, and the second trend line was
accelerating. Even so, trend and level stability increased from 17% to 50% from intervention to
maintenance with 50% overlap. In the maintenance condition, Chad’s data demonstrated a
variable, accelerating trend following a somewhat variable, decelerating trend during
intervention. There was 20% overlap between intervention and maintenance. Even though
Brian’s data resulted in an absolute level change of -67, the mean level line remained the same
from intervention to maintenance. Brian’s trends from intervention to maintenance remained
variable and accelerating. There was 100% overlap between the two conditions. Chad was the
only student whose comprehension seemed negatively affected by the withdrawal of the
intervention.

136
Social Validity
The fourth question addresses how the participants felt about the intervention. A survey
included six questions that the researcher individually orally read to each student and then
recorded their answers. Two of the students felt that repeated reading positively affected their
reading skills. Two of the students enjoyed the intervention while the third student claimed he
didn’t like anything about it because it wasn’t fun. When asked what they didn’t like about the
intervention, one student said he didn’t like the privacy folder; one student didn’t mention
anything that he didn’t like; and one student said he just didn’t like to read. One out of three
students felt that the intervention helped him to remember the story. All students felt that the
intervention helped them to understand what happened in the story. In addition, all students
indicated they would use repeated readings in the future when they read social studies, science,
and A.R. (library) books.
Results in Relation to Research
This study supplements and extends the literature regarding students with intellectual
disabilities and repeated reading as a strategy to increase reading fluency and comprehension.
The researcher could locate only four studies that included repeated reading among students with
intellectual disabilities (Devault & Joseph, 2004; Meffed & Pettegrew, 1997; Musti-Rao et al.,
2009; Valleley & Shriver, 2003). Only the studies conducted by Mefferd and Pettegrew (1997)
and Musti-Rao et al. (2009) included participants that were elementary-age; even then, there
were only a combined number of four participants in those studies with intellectual disabilities.
This study included three elementary students with intellectual disabilities.
Out of the four published studies, repeated reading (along with error correction) was the
sole intervention in only one study (Valleley & Shriver, 2003). To limit the risk of multiple

137
treatment interference, this study implemented repeated readings combined with error correction
only. Only one study explicitly measured reading comprehension in addition to oral reading
fluency as a result of the singular intervention of repeated reading (Valleley & Shriver, 2003).
The present study added to the existing research by measuring correct words per minute, errors
per minute, and the percentage of comprehension questions answered correctly during each
session. Overall, the results from this study confirmed that repeated readings with error
correction increases overall oral reading fluency but does not necessarily improve the reading
comprehension of elementary-age students with intellectual disabilities.
Limitations
As with any study design, there are naturally-occurring limitations within single-subject
methodology. Tawney and Gast (1984) outlined three major constraints of the multiple baseline
across subjects design. First, at least three participants with similar learning histories and
functioning levels should be identified. This can be problematic with students with intellectual
disabilities since it is hard to generalize with any population of students due to individual
differences, diagnoses, medications, co-morbid diagnoses, etc. Second, target behavior should be
monitored concurrently and continuously across each subject; this can be time-consuming,
impractical, and distracting (Tawney & Gast, 1984), especially if the researcher and classroom
teacher are the same person. Third, participants in prolonged baselines may exhibit extinction, a
data path resulting from a lack of reinforcement. There are also ethical concerns about delaying
interventions for individuals who could otherwise be receiving interventions that may increase
desired skills, behaviors, and overall functioning.
The multiple probe design is a variation of the multiple baseline design. Tawney and Gast
(1984) delineate two additional limitations that occur within multiple probe designs. First, if
138
there is variability across data series, the researcher should extend the measurement of the
dependent variable under baseline conditions. If the researcher does not extend data collection
until stability across level and/or trend is established, study results may be confounded due to
potential history, maturation, and/or adaptation threats to internal validity (Tawney & Gast,
1984). Second, by conducting intermittent probes as opposed to continuous data collection, it
may be difficult to immediately identify possible response generalization or multiple treatment
interference.
The present study had limitations that should be noted. Only three participants, the
minimum number of participants recommended by Tawney and Gast (1984), were included in
this study. In general, it is very difficult to find similar participants among this population due to
individual differences, diagnoses, medications, co-morbid diagnoses, and other factors. There
were a limited number of students in the researcher’s school that met criteria for inclusion in the
study. External validity is always a limitation in single-subject studies.
Even though the multiple-probe across participants study design inherently decreases the
severity of history threats to internal validity, history threats to internal validity were present in
this study. For example, Tom’s attention levels fluctuated greatly throughout the school day due
to absence seizures, medication to address his medical needs, and sensory needs. Chad’s parents
frequently misplaced his medication; thus, he was on and off his prescribed medication to
address attention deficits. Brian was sick several times throughout the study and did not feel well
during several sessions. In addition, Brian often displayed whole-body spasms at the onset of
stress-inducing activities such as reading or math. When this occurred, the researcher would not
start timing his oral reading until the whole-body spasms subsided; occasionally, though, he
would exhibit the spasms in the middle of a reading passage.

139
With the research taking place in a classroom, there were naturally-occurring
interruptions. Some examples of these took place during timed readings and included an
announcement from the office, a participant’s father coming into the classroom while he was
reading, and the researcher having to stop data collection in order to address the negative
behaviors of another student in the classroom. In these instances, the researcher either made note
of the interruption and continued the session or cancelled the session altogether, eliminating the
particular passage from the study.
There was an amount of variability in the data. Variability in data can indicate many
things, including multiple treatment interference. While some variability is expected, the
researcher feels the data variability in this study was a direct result of several things. First and
most significantly, the researcher had to pull passages from seven different informal reading
inventories. As a result, the passages were not uniform. In particular, the passage length, content,
type of comprehension questions, and number of comprehension questions varied considerably;
this added a testing threat to internal validity. Subject content directly influenced the
participants’ comprehension; if the participants appeared more interested in the story, their
comprehension scores logically increased.
Comprehension questions were either literal or inferential, but they were not always
labeled as such by the authors of the informal reading inventories used in the study. As a result,
the researcher measured and reported overall passage comprehension. She did not separate
comprehension scores by literal or inferential questions. Reporting overall comprehension scores
instead of specifying scores by the type of comprehension questions may have masked important
information and limited the results of the intervention on the participants’ comprehension.
140
The variability in data was also attributed to each participant’s attention levels and
medical needs. For example, during the course of the study, Tom’s doctors were monitoring him
for an increase in absence seizures; there were quite a few instances that he may have been
having absence seizures during the repeated readings sessions. Chad did not regularly take his
prescribed medication for ADHD; this also affected data stability. Third, student attitudes and
moods greatly influenced their performances on a daily basis. Tom is by nature a very emotional
person. During some sessions, he was tearful and upset; this negatively impacted his ability to
read fluently and comprehend what was being read. Students 2 and 3 often made negative
comments if they were reading one of the longer passages on their reading levels.
The researcher was unable to assess the generalization of reading fluency and
comprehension to other settings using the intervention combination of repeated readings and
error correction. She was also unable to assess the effects of the intervention on the fluency and
comprehension of other types of reading materials (e.g. subject content, pleasure reading).
Multiple treatment interference may have been present during this study with the tangible
reinforcers – the fuzzies. The researcher presented a fuzzy to each participant every time he read
a passage (timed and not timed) and after he answered comprehension questions. In other words,
participants earned 2 fuzzies during baseline sessions, 4 fuzzies during intervention sessions, and
2 fuzzies during maintenance sessions. Since participation in intervention sessions yielded more
tangible reinforcers, it is possible that the participants were more motivated to do well and try
harder during the intervention sessions than they were during baseline and maintenance sessions.
Another threat to internal validity that may have been present is maturation. Brian
remained in baseline for 29 sessions (n=10 probes). He demonstrated an upward trend in
comprehension during baseline. Even though high rates of interobserver reliability and

141
procedural fidelity data were reported, observer bias was an additional threat to internal validity
that may have been present.
A final limitation is one that often takes place in single subject studies – the teacher
serves as the lead researcher. Teacher research is a long-debated topic. Many opponents feel that
teacher researchers can potentially (intentionally or unintentionally) manipulate the participants
or the data. Critics also feel that teacher research methods are messy, unpredictable, and
complicated (Baumann, Shockley, & Allen, 1996). University researchers often condone teacher
research because it does not follow a “routinized, prescriptive paradigm” (Baumann et al., 1996,
p. 8) as does scientific inquiry or routine educational research.
On the other hand, Baumann et al. (1996) feel that teacher research is an “evolving
philosophical orientation toward practical theory” (p. 8). In fact, advocates of teacher research
claim that teacher researchers bridge the gap between formal research and real-life applications.
Talbott, Lloyd, and Tankersley (1994) feel that effective teacher research has greater external
validity than interventions delivered by study authors, who may produce research with large
effects and implications for practice that can be impossible for teachers to apply. In addition, the
teacher researcher perspective allows a teacher to live in a research experience in a manner an
outside researcher cannot (Cochran-Smith & Lytle, 1993), acting upon what is seen and learned
first-hand, evaluating the impact of one’s actions, and initiating new actions (Baumann et al.,
1996). The teacher researcher also has a unique perspective in that he or she is able to have a
daily, intimate relationship with the students as well as gain insight into behaviors that may be
otherwise unknown or overlooked by outside researchers.
The teacher researcher in this study sympathizes with some of Baumann’s reflections
after conducting his teacher research (Baumann et al., 1996). She felt like the research

142
experience was refreshing and provided insight into her students’ reading skills. She also enjoyed
the one-on-one reading time with the participants. On the other hand, she felt that this teacher
research study was time-consuming and added “a layer to an already hectic professional work
schedule” (Baumann et al., 1996, p. 19). She also believes that this study somewhat interfered
with her primary instructional responsibilities. For example, she used up to 30 min of
instructional time on days when she probed all three participants; this was time taken away from
routine instruction that affected the entire class.
Implications for Practice and Future Research
Results from this study lead to implications for practice and suggestions for future
research. The researcher makes the following recommendations based on the results of this study
and the results of other studies involving repeated reading research. Repeated reading should be
paired with error correction, performance feedback, and/or self-monitoring. Repeated reading
can and should be used as a supplement to an evidence-based reading program. Classroom
teachers should utilize different comprehension strategies (e.g. questioning, retelling,
paraphrasing, and cloze) with repeated readings for optimal comprehension. Since repeated
reading interventions are relatively easy to implement and add to daily classroom routines,
teachers should recruit and utilize parents, paraprofessionals, volunteers, or peer tutors to aid in
the implementation of repeated readings.
Compared to other populations, there is a gap in the research-base about how to increase
the reading fluency and comprehension of individuals with intellectual disabilities. Thus, there is
a need for additional research about different interventions to increase reading fluency and
comprehension among participants with intellectual disabilities. Broader generalizations and

143
increased external validity could be achieved if the findings of this study were replicated with
other elementary students with intellectual disabilities.
Researchers should compare the effects of different numbers of repeated readings on
reading fluency and comprehension among participants with intellectual disabilities; these
studies could replicate and extend the findings of studies conducted among participants with
learning disabilities (O’Shea et al., 1987; Sindelar et al., 1990). Researchers could also
implement and compare the effectiveness of different criteria for mastery (e.g. successive
improvements, fixed rate, and fixed number of repeated readings). Since technology is becoming
increasingly important in today’s classroom, future researchers should implement repeated
reading interventions utilizing technology (e.g. word processor, SMART Board, and ActivBoard)
to assess reading fluency and comprehension with this population.
Future research should also combine and compare repeated readings with varying
methods of error correction, performance feedback, and self-monitoring among those with
intellectual disabilities. Future research should also examine the effects of combining repeated
readings with other reading programs or methods. Another suggestion for future researchers is to
compare questioning after repeated readings to other ways of assessing reading comprehension.
Future research should compare the effects of repeated readings on literal comprehension to the
effects of repeated readings on inferential comprehension. Finally, future researchers could
ascertain the effectiveness, practicality, and efficiency of the repeated readings method for
classroom teachers and/or paraprofessionals working with students with intellectual disabilities.
Summary
This research study has expanded the research reporting the effects of repeated readings
on elementary-age students with intellectual disabilities. This study measured the effects of two
144
crucial skills for successful reading – the ability to accurately decode words in a timely manner
and the ability to gain understanding from what is read. Repeated reading is often naturally
incorporated into reading curricula, and students often naturally repeatedly read passages. Even
so, the importance of specifically implementing repeated readings in one’s classroom is
beneficial and will most likely have positive long-term effects on one’s reading habits. This can
be said for students of all ages, abilities, and disabilities. With that being said, much more
research documenting the short-term and long-term effects of repeated reading among different
disability subgroups is needed.

145
REFERENCES
Alber-Morgan, S. R. (2006). Ten ways to enhance the effectiveness of repeated readings. Journal
of Early and Intensive Behavior Intervention, 3, 273-279.
Alber-Morgan, S. R., Ramp, E. M., Anderson, L. L., & Martin, C. M. (2007). Effects of repeated
readings, error correction, and performance feedback on the fluency and comprehension
of middle school students with behavior problems. The Journal of Special Education,
41(1), 17-30.
Alberto, P. A., & Troutman, A. C. (2006). Applied Behavior Analysis for Teachers. Upper
Saddle River, NJ: Pearson.
Allor, J. H., Mathes, P. G., Champlin, T., & Cheatham, J. P. (2009). Research-based techniques
for teaching early reading skills to students with intellectual disabilities. Education and
Training in Developmental Disabilities, 44, 356-366.
Allor, J. H., Mathes, P. G., Roberts, J. K., Cheatham, J. P., & Champlin, T. M. (2010).
Comprehensive reading instruction for students with intellectual disabilities: Findings
from the first three years of a longitudinal study. Psychology in the Schools, 47, 445-
466.
Bader, L. A., & Wiesendanger, K. (1994). Bader Reading and Language Inventory (2nd
ed.).
New York: Merrill.
Baker, K. (2004). Reading Success: A reading intervention for students with ADHD. Moorabbin,
VIC: Hawker Brownlow Education.
Baumann, J. F., Shockley, B., & Allen, J. (1996). Methodology in teacher research: Three Cases.

146
National Reading Research Center, Perspectives in Reading Research, 10, 1-45.
Begeny, J. C., Daly, E. J., III, & Valleley, R. J. (2006). Improving oral reading fluency through
response opportunities: A comparison of phrase drill error correction with repeated
readings. Journal of Behavioral Education, 15, 229-235.
Boyle, J. R. (2008). Reading strategies for students with mild disabilities. Intervention in School
and Clinic, 44, 3-9.
Bradford, S., Shippen, M. E., Alberto, P., Houchins, D. E., & Flores, M. (2006). Using
systematic instruction to teach decoding skills to middle school students with moderate
intellectual disabilities. Education and Training in Developmental Disabilities, 41, 333-
343.
Caffrey, E., & Fuchs, D. (2007). Differences in performance between students with learning
disabilities and mild mental retardation: Implications for categorical instruction. Learning
Disabilities Research & Practice, 22, 119-128.
Carroll, J. B., Davies, P., & Richman, B. (1971). The word frequency book. New York:
American Heritage Publishing.
Carrow-Woolfolk, E. (1995). Oral and Written Language Scale. Austin, TX: Pro-Ed.
Chafouleas, S. M., Martens, B. K., Dobson, R. L., Weinstein, K. S., & Gardner, K. B. (2004).
Fluent reading as the improvement of stimulus control: Additive effects of performance-
based interventions to repeated reading on students’ reading and error rates. Journal of
Behavioral Education, 13(2), 67-81.
Chard, D. J., Ketterlin-Geller, L. R., Baker, S. K., Doabler, C., & Apichatabutra, C. (2009).
Repeated reading interventions for students with learning disabilities: Status of the
evidence. Exceptional Children, 75, 263-281.
147
Chard, D. J., Vaughn, S., & Tyler, B. (2002). A synthesis of research on effective interventions
for building reading fluency with elementary students with learning disabilities. Journal
of Learning Disabilities, 35(5), 386-406.
Children's Educational Services, I. (1987). Test of Reading Fluency. Minneapolis, MN: Author.
Cochran-Smith, M., & Lytle, S. L. (Eds.). (1993). Inside/outside: Teacher research and
knowledge. New York: Teachers College Press.
Cohen, J. (1988). Statistical power analysis for the behavioral sciences (2nd
ed.). Hillsdale, NJ:
Erlbaum.
Cooke, N. L. (1993). Effects of using a ration of new items to review items during drill and
practice: Three experiments. Education and Treatment of Children, 16, 213-234.
Cooper, J. O., Heron, T. E., & Heward, W. L. (1987). Applied Behavior Analysis. Upper Saddle
River, NJ: Merrill.
Deno, S. L., Fuchs, L. S., Maston, D., & Shin, J. (2001). Using curriculum-based measurement
to establish growth standards for students with learning disabilities. School Psychology
Review, 30, 507-524.
Denton, C. A., Fletcher, J. M., Anthony, J. L., & Francis, D. J. (2006). An evaluation of intensive
intervention for students with persistent reading difficulties. Journal of Learning
Disabilities, 39(5), 447-466.
Devault, R., & Joseph, L. M. (2004). Repeated readings combined with word boxes phonics
technique increases fluency levels of high school students with severe reading delays.
Preventing School Failure, 49, 22-27.
Dowhower, S. L. (1994). Repeated reading revisited: Research into practice. Reading and
Writing Quarterly, 10, 343-358.

148
Dunn, L. M., Dunn, L. M., & Dunn, D. M. (1997). The Peabody Picture Vocabulary Test-Third
Edition. Circle Pines, MN: American Guidance Services.
Ehri, L. C., & Nunes, S. R. (2002). The role of phonemic awareness in learning to read. In A. E.
Farstrup & S. J. Samuels (Eds.), What research has to say about reading instruction (pp.
110-139). Newark, DE: International Reading Association.
Elliott, C. D. (2007). Differential Ability Scales – Second edition (DAS-II). San Antonio, TX:
The Psychological Corporation.
Ellis, E. S., & Graves, A. W. (1990). Teaching rural students with learning disabilities: A
paraphrasing strategy to increase comprehension of main ideas. Rural Special Education
Quarterly, 10(2), 2-10.
Englemann, S., Carnine, L., & Johnson, G. (1999). SRA Corrective Reading. Columbus, OH:
SRA/McGraw-Hill.
Freeze, R. (2006). Precision reading: New hope for struggling readers. The Journal of the
International Association of Special Education, 7, 36-46.
Gast, D. L. (2009). Single subject research methodology in behavioral sciences. New York:
Routledge.
Gillon, G. T. (2004). Phonological awareness: From research to practice. New York: Guilford
Press.
Good, R. H., & Jefferson, G. (1998). Contemporary perspectives on Curriculum-Based
Measurement validity. In M. R. Shinn (Ed.), Advanced applications of Curriculum-Based
Measurement (pp. 61-88). New York: Guilford.
Good, R. H., & Kaminski, R. A. (Eds.) (2002). Dynamic Indicators of Basic Early Literacy Skills
(6th
ed.). Eugene, OR: Institute for the Development of Educational Achievement.

149
Available from http://dibels.uoregon.edu
Gray, W. (1992). Gray Oral Reading Tests (3rd
ed.). Austin, TX: PRO-ED.
Harrison, P. L., & Oakland, T. (2003). Adaptive Behavior Assessment System (2nd
ed.).
Minneapolis, MN: Pearson Assessment.
Hiebert, E. H. (2003). Quick Reads. Parsippany, NJ: Pearson Learning.
Horner, R. D., & Baer, D. M. (1978). Multiple-probe technique: A variation of the multiple
baseline. Journal of Applied Behavior Analysis 4(3), 189-196.
Hurst, M., & Jolivette, K. (2006). Effects of private versus public assessment on the reading
fluency of middle school students with mild disabilities. Education and Training in
Developmental Disabilities, 41, 185-196.
Idol, L. (2010). Reading success: Validation of a specialized literacy program (1978-2007).
Remedial and Special Education, 31, 97-115.
Ihnot, C., Mastoff, J., Gavin, J., & Hendrickson, L. (2001). Read Naturally. St. Paul, MN: Read
Naturally.
Johns, J. L. (1988). Basic Reading Inventory (4th
ed.). Dubuque, IA: Kendall/Hunt.
Joseph, L. M., & McCachran, M. (2003). Comparison of a word study phonics technique
between students with moderate to mild mental retardation and struggling readers without
disabilities. Education and Training in Developmental Disabilities, 38, 192-199.
Kame’enui, E. J., Carnine, D. W., Dixon, R. C., Simmons, D. C., & Coyne, M. D. (2002).
Effective teaching strategies that accommodate diverse learners (2nd ed.). Columbus,
OH: Merrill.
Kamps, D., Locke, P., Delquadri, J., & Hall, R. V. (1989). Increasing academic skills of students
with autism using fifth grade peers as tutors. Education and Treatment of Children, 12,
150
38-51.
LaBerge, D., & Samuels, S. (1974). Toward a theory of automatic information processing in
reading. Cognitive Psychology, 6, 293-323.
Leslie, L., & Caldwell, J. S. (2011). Qualitative Reading Inventory (5th
ed.). Boston: Pearson.
MacMillan/McGraw-Hill (2006). Treasures: Leveled Readers. New York: MacMillan/McGraw-
Hill.
Manset-Williamson, G., & Nelson, J. M. (2005). Balanced, strategic reading instruction for
upper-elementary and middle school students with reading disabilities: A comparative
study of two approaches. Learning Disability Quarterly, 28, 59-74.
Mathes, P. G., & Fuchs, L. S. (1993). Peer-mediated reading instruction in special education
resource rooms. Learning Disabilities Research & Practice, 8(4), 233-243.
McGuinness, C. McGuinness, G. (1999). Reading Reflex. New York, N.Y: Fireside.
Mefferd, P., & Pettegrew, B. S. (1997). Fostering literacy acquisition of students with
developmental disabilities: Assisted reading with predictable trade books. Reading
Research and Instruction, 36, 177-190.
Musti-Rao, S., Hawkins, R. O., & Barkley, E. A. (2009). Effects of repeated readings on the oral
reading fluency of urban fourth-grade students: Implications for practice. Preventing
School Failure, 54, 12-23.
National Institute of Child Health and Human Development. (2000). Report of the National
Reading Panel. Teaching children to read: an evidence-based assessment of the scientific
research literature on reading and its implications for reading instruction: Reports of the
subgroups (NIH Publication No. 00-4754). Washington, DC: U.S. Government Printing
Office.

151
Nelson, J. S., Alber, S. R., & Gordy, A. (2004). Effects of systematic error correction and
repeated readings on the reading accuracy and proficiency of second graders with
disabilities. Education and Treatment of Children, 27(3), 186-198.
McCormick, S. (1995). What is single-subject experimental research? In Newman, S. B. &
McCormick, S. (Eds.), Single-subject experimental research: Applications for literacy
(pp. 1-31). Newark, DE: International Reading Association.
Nichols, W. D., Rupley, W. H., & Rasinski, T. (2009). Fluency in learning to read for meaning:
Going beyond repeated readings. Literacy Research and Instruction, 48, 1-13.
O’Connor, R. E. (2007). Teaching word recognition: Effective strategies for students with
learning difficulties. New York: Guildford Press.
O’Connor, R. E., White, A., & Swanson, H. L. (2007). Repeated reading versus continuous
reading: Influences on reading fluency and comprehension. Exceptional Children, 74(1),
31-46.
O’Shea, L. J., & O’Shea, D. J. (1988). Using repeated reading. Teaching Exceptional Children,
20(2), 26-29.
O’Shea, L. J., Sindelar, P. T., & O’Shea, D. J. (1987). The effects of repeated readings and
attentional cues on the reading fluency and comprehension of learning disabled readers.
Learning Disabilities Research, 2(2), 103-109.
Osborn, J., Freeman, A., Burley, M., Wilson, R., Jones, E., & Rychener, S. (2007). Effect of
tutoring on reading achievement for students with cognitive disabilities, specific learning
disabilities, and students receiving Title I services. Education and Training in
Developmental Disabilities, 42, 467-474.
Pearce, D. L. (1981). Validity of Bader graded reading passages for determining instructional

152
level. Unpublished manuscript, Western Illinois University, Macomb, Illinois.
Rashotte, C. A., & Torgesen, J. K. (1985). Repeated reading and reading fluency in learning
disabled children. Reading Research Quarterly, 20(2), 180-188.
Rasinski, T. V. (2003). The fluent reader: Oral reading strategies for building word recognition,
fluency, and comprehension. New York: Scholastic Professional Books.
Renaissance Learning. (2009). STAR Reading. Wisconsin Rapids, WI: Renaissance Learning.
Roe, B. D., & Burns, P. C. (2007). Informal Reading Inventory (7th
ed.). Boston: Houghton
Mifflin.
Samuels, S. J. (1979). The method of repeated reading. The Reading Teacher, 32, 403-408.
Samuels, S. J. (1987). Information processing abilities and reading. Journal of Learning
Disabilities, 20, 18-22.
Sheridan, S. M., Swanger-Gagne, M., Welch, G. W., Kwon, K., & Garbacz, S. A. (2009).
Fidelity measurement in consultation: Psychometric issues and preliminary examination.
School Psychology Review, 38(4), 476-495.
Silvaroli, N. J., & Wheelock, W. H. (2004). Classroom Reading Inventory (10th
ed.). Boston:
McGraw-Hill.
Sindelar, P. T., Monda, L. E., & O’Shea, L. J. (1990). Effects of repeated readings on
instructional- and mastery-level readers. Journal of Educational Research, 83(4), 220-
226.
Smith S. B., Simmons, D. C., & Kame'enui, E. J. (1998). Phonological awareness: Instructional
and curricular basics and implications. In D. C. Simmons & E. J. Kame'enui (eds.), What
reading research tells us about children with diverse learning needs: Bases and basics.
Mahwah, NJ: Lawrence Erlbaum Associates.

153
Snow, C. (2002). Reading for understanding: Toward a research and development program in
reading comprehension. Santa Monica, CA: Rand.
Sparrow, S., Cicchetti, D., & Balla, D. (2005). Vineland Adaptive Behavior Scales (2nd
ed.).
Minneapolis, MN: Pearson Assessment.
Talbott, E., Lloyd, J. W., & Tankersley, M. (1994). Effects of reading comprehension
interventions for students with learning disabilities. Learning Disability Quarterly, 17(3),
223-232.
Tam, K. Y., Heward, W. L., & Heng, M. A. (2006). A reading instruction intervention program
for English-language learners who are struggling readers. The Journal of Special
Education, 40(2), 79-93.
Tawney, J. W., & Gast, D. L. (1984). Single-subject research in special education. Columbus,
OH: Merrill.
Taylor, B. M., Frye, B. J., Short, R., & Shearer, B. (1991). Early Intervention in Reading:
Preventing reading failure among low-achieving first grade students. Minneapolis, MN:
University of Minnesota, Center for Urban and Regional Affairs and Office of the Vice
President of Academic Affairs.
Temple, C., Crawford, A., & Gillet, J. W. (2009). Developmental Literacy Inventory. Boston:
Pearson.
Therrien, W. J. (2004). Fluency and comprehension gains as a result of repeated reading: A
meta-Analysis. Remedial and Special Education, 25(4), 252-261.
Therrien, W. J., & Hughes, C. (2008). Comparison of repeated reading and question generation
on students’ reading fluency and comprehension. Learning Disabilities: A Contemporary
Journal, 6(1), 1-16.
154
Therrien, W. J., & Kubina, R. M. (2007). The importance of context in repeated reading.
Reading Improvement, 44(4), 179-188.
Therrien, W. J., Wickstrom, K., & Jones, K. (2006). Effect of a combined repeated reading and
question generation intervention on reading achievement. Learning Disabilities Research
& Practice, 21(2), 89-97.
Tindal, G., Marston, D., & Deno, S. L. (1983). The reliability of direct and repeated
measurement (Research Rep. 109). Minneapolis, MN: University of Minnesota Institute
for Research on Learning Disabilities.
Torgesen, J. K., Wagner, R., & Rashotte, C. A. (1999). Test of word reading efficiency. Austin,
TX: PRO-ED.
Vadasy, P. F., & Sanders, E. A. (2008). Benefits of repeated reading intervention for low-
achieving fourth- and firth-grade students. Remedial and Special Education, 29(4), 235-
249.
Valleley, R. J., & Shriver, M. D. (2003). An examination of the effects of repeated readings with
secondary students. Journal of Behavioral Education, 12, 55-76.
Vaughn, S., Chard, D. J., Bryant, D. P., Coleman, M., Tyler, B., Linan-Thompson, S., &
Kouzekanani, K. (2000). Fluency and comprehension interventions for third-grade
students. Remedial and Special Education, 21(6), 325-335.
Wechsler, D. (2003). Wechsler Intelligence Scale for Children – 4th Edition. San Antonio, TX:
Harcourt Assessment.
Weinstein, G., & Cooke, N. L. (1992). The effects of two repeated reading interventions on
generalization of fluency. Learning Disability Quarterly, 15(1), 21-28.
Welsch, R. G. (2007). Using experimental analysis to determine interventions for reading

155
fluency and recalls of students with learning disabilities. Learning Disability Quarterly,
30, 115-129.
White, O. R., & Haring, N. G. (1980). Exceptional Teaching (2nd
ed.). Columbus, OH: Merrill.
Wiederholt, J., & Bryant, B. (2001). Gray Oral Reading Tests, Fourth Edition. Austin, TX:
PRO-ED.
Wolf, M. M. (1978). Social validity: The case for subjective measurement. Journal of Applied
Behavior Analysis, 11(2), 203-214.
Woodcock, R. (1998). The Woodcock Reading Mastery Test-Revised/Normative Update. Circle
Pines, MN: American Guidance Service.
Woodcock, R. W., & Johnson, B. B. (1989). Woodcock-Johnson Tests of Achievement – Revised.
Itasca, IL: Riverside Publishing.
Woodcock, R. W., McGrew, K. S., & Mather, N. (2001). Woodcock-Johnson III Tests of
Achievement. Itasca, IL: Riverside Publishing.
Woods, M. L., & Moe, A. J. (2007). Analytical Reading Inventory (8th
ed.). Upper Saddle River,
NJ: Pearson.
Yopp, H. (1988). The validity and reliability of phonemic awareness tests. Reading Research
Quarterly, 23, 159-177.
Yurick, A. L., Robinson, P. D., Cartledge, G., Lo, Y., & Evans, T. L. (2006). Using peer-
mediated repeated readings as a fluency-building activity for urban learners. Education
and Treatment of Children, 29(3), 269-506.

156
APPENDIX A
Sample of Student Copy of Reading Passage
Passage #5(1)*
Air is all around us. But we can’t see it. How do we know it is there?
There are many ways. We can see what air does. Moving air is called wind.
Wind moves plants. Wind moves dirt. Strong winds can move heavy things.
Strong winds can even move a house. We can weigh air. We can weigh two
balloons. The one with a lot of air weighs more. We can see what air does.
We can weigh air. Then we know it is there.
Note. *Passage #5(1) means the fifth passage chosen from Level 1; reading passage from the
QRI (Leslie & Caldwell, 2011).

157
APPENDIX B
Sample of Data Collector Copy of Reading Passage
Passage #5(1)*
Student Name ___________________________________ Date ________________________
Session # __________ Phase (circle one): Baseline Intervention Maintenance
Data Collector ____________________________________
Air is all around us. But we can’t see it. How do we know it is there? There are many ways. (21)
We can see what air does. Moving air is called wind. Wind moves plants. Wind moves dirt. (38)
Strong winds can move heavy things. Strong winds can even move a house. We can weigh (54)
air. We can weigh two balloons. The one with a lot of air weighs more. We can see what (73)
air does. We can weigh air. Then we know it is there. (85) CWPM _____
EPM _____
Comments ____________________________________________________________________
______________________________________________________________________________
______________________________________________________________________________
______________________________________________________________________________
______________________________________________________________________________
Note. *Passage #5(1) means the fifth passage chosen from Level 1; reading passage from the
QRI (Leslie & Caldwell, 2011).

158
APPENDIX C
Sample of Reading Comprehension Questions
Passage #5(1)*
1. How do we know air is there?
Explicit: we can see what air does; or air moves things (reader can answer things, dirt, plants, or
houses); or we can weigh air
2. How else do we know air is there?
Explicit: any other of the above answers
3. What does air move?
Explicit: plants or dirt or houses
4. What else does air move?
Explicit: any other of the above answers
5. How do we know that wind could move a car?
Implicit: it can move heavy things; or it can move a house
6. Why does a flat tire weigh less than a tire that is not flat?
Implicit: the flat tire does not have as much air
Percentage of Correct Responses: _______
Note. *Passage #5(1) means the fifth passage chosen from Level 1; reading passage from the
QRI (Leslie & Caldwell, 2011).

159
APPENDIX D
CWPM/EPM/Comprehension Recording Sheet
Student Name _____________________________________ Dates ___________-___________
Date
Session
#
Phase
(B, I,
or M)
Passage
#
CWPM
EPM
Comprehension -
% correct
B/M–____ or
I–#1___;#2___;#3___
B/M–____ or
I–#1___;#2___;#3___
B/M–____ or
I–#1___;#2___;#3___
B/M–____ or
I–#1___;#2___;#3___
B/M–____ or
I–#1___;#2___;#3___
B/M–____ or
I–#1___;#2___;#3___
B/M–____ or
I–#1___;#2___;#3___
B/M–____ or
I–#1___;#2___;#3___
B/M–____ or
I–#1___;#2___;#3___
B/M–____ or
I–#1___;#2___;#3___
B/M–____ or
I–#1___;#2___;#3___
B/M–____ or
I–#1___;#2___;#3___
B/M–____ or
I–#1___;#2___;#3___
B/M–____ or
I–#1___;#2___;#3___
B/M–____ or
I–#1___;#2___;#3___
B/M–____ or
I–#1___;#2___;#3___
B/M–____ or
I–#1___;#2___;#3___
B/M–____ or
I–#1___;#2___;#3___
B/M–____ or
I–#1___;#2___;#3___
B/M–____ or
I–#1___;#2___;#3___
B/M–____ or
I–#1___;#2___;#3___
B/M–____ or
I–#1___;#2___;#3___
B/M–____ or
I–#1___;#2___;#3___
B/M–____ or
I–#1___;#2___;#3___
Note. B = baseline; I = intervention; M = maintenance; CWPM = correct words per minute; EPM = errors per minute; B/M =
baseline or maintenance; #1 = first timed reading during intervention; #2 = second timed reading during intervention; #3 = third
timed reading during intervention.
Comments ____________________________________________________________________
______________________________________________________________________________
______________________________________________________________________________
______________________________________________________________________________
______________________________________________________________________________
______________________________________________________________________________
______________________________________________________________________________
______________________________________________________________________________
______________________________________________________________________________
______________________________________________________________________________
______________________________________________________________________________

160
APPENDIX E
Procedural Checklist for Data Collector
Procedural Checklist for Data Collector
Baseline and maintenance conditions Intervention condition
1. Gather the necessary materials.
a. Student Copy of reading
passage
b. Data Collector copy of reading
passage
c. stopwatch – set to 1-min
intervals
d. pencil
e. clipboard
f. privacy divider
g. audio tape recorder
2. Ask the student to join you at the
table.
3. Sit across the table from the student.
4. Say, “You will be reading a story
today. Please read as quickly as you
can without making mistakes.”
5. Present Student Copy to the student.
6. Place the privacy divider between
yourself and the student.
7. Tell the student to “begin” and start
the stopwatch.
8. Note errors on Data Collector copy
while student is reading.
a. word read incorrectly – mark
an “x” above the word
i. A word is considered
incorrect if it is
pronounced ANY
differently than the
correct pronunciation.
ii. A word is considered
incorrect if the student
replaces the word with
a different word that
1. Gather the necessary materials.
a. Student Copy of reading
passage
b. Data Collector copy of reading
passage
c. stopwatch – set to 1-min
intervals
d. pencil
e. clipboard
f. privacy divider
g. audio tape recorder
2. Ask the student to join you at the table.
3. Sit across the table from the student.
4. Say, “I want to listen to you read this
story. Try to do your best.”
5. Present Student Copy to the student.
6. Place the privacy divider between
yourself and the student.
7. Tell the student to begin reading and
allow the student to read the entire
passage.
8. Note errors during the first reading on
the first copy of the reading passage on
Data Collector copy.
a. word read incorrectly – mark an
“x” above the word
i. A word is considered
incorrect if it is
pronounced ANY
differently than the
correct pronunciation.
ii. A word is considered
incorrect if the student
replaces the word with a
different word that

161
makes sense. (ex.
saying “big” instead of
“large”)
iii. If the student reads a
word incorrectly and
does not correct
himself/herself, do not
comment on it.
iv. Count the word as
correct if the student
mispronounces the
word but corrects
himself/herself within
3s – place a check next
to the “x” above the
word
b. word omitted – draw one line
through word
c. word not read within 3 s –
circle the word
i. If the student does not
read the word within 3
s of completing the
previous word, tell the
student the word.
9. When 1 min is up, mark a slash (/)
after the last word read.
10. Allow the student to continue reading
the passage until the end.
11. When the student is finished, provide
verbal praise such as, “Thank you.
Good reading today.”
12. Give the student a tangible reinforcer.
13. Ask the student the comprehension
questions and note their answers. Do
not tell the student if he got the answer
right or wrong.
14. After the student answers the
comprehension questions, provide
verbal praise such as, “Good job
answering the questions.”
15. Give the student a tangible reinforcer.
16. Count the number of correct words per
minute and errors per minute and
record these on the Data Collector
copy.
makes sense. (ex. saying
“big” instead of “large”)
iii. If the student reads a
word incorrectly and
does not correct
himself/herself, do not
comment on it.
iv. Count the word as
correct if the student
mispronounces the word
but corrects
himself/herself within 3s
– place a check next to
the “x” above the word
b. word omitted – draw one line
through word
c. word not read within 3 s – circle
the word
i. If the student does not
read the word within 3 s
of completing the
previous word, tell the
student the word.
9. If the student makes a mistake during
the first reading, follow these steps:
a. Stop the student.
b. Point to and read the correct
word.
c. Prompt the student to repeat the
correct word.
d. Verbally praise the student if he
repeats the word correctly.
10. When the student has read the entire
passage, review each error by pointing
to the word and asking “What’s this
word?”
11. If the student reads the word correctly,
provide verbal praise such as “Good”,
“Great”, or “Yes.”
12. If the student reads the word
incorrectly or does not know the word,
state the word, ask the student to repeat
it, and deliver verbal praise.
13. Give the student a tangible reinforcer at
the end of the error correction
procedure.

162
17. Record the number and percentage of
correct explicit and implicit
comprehension questions on the Data
Collector copy.
18. Transfer the number of CWPM, EPM,
and % of explicit and implicit
comprehension questions to the
CWPM/EPM/Comprehension
Recording Sheet.
14. Tell the student he will now be timed
for 1 min to see how far he can read.
15. Place the privacy divider between
yourself and the student.
16. Tell the student to “begin” and start the
stopwatch.
17. Note errors on the second copy of the
reading passage on the Data Collector
copy while student is reading.
18. When 1 min is up, mark a slash (/) after
the last word read.
19. Do not allow the student to continue
reading the rest of the passage.
20. Give the student verbal praise and a
tangible reinforcer.
21. Replicate steps 14-20.
19. Ask the student the comprehension
questions and note their answers. Do
not tell the student if he got the answer
right or wrong.
20. After the student answers the
comprehension questions, provide
verbal praise such as, “Good job
answering the questions.”
21. Give the student a tangible reinforcer.
22. Count the number of CWPM and EPM
for each reading and record these on
the Data Collector copy.
23. Record the number and percentage of
correct explicit and implicit
comprehension questions on the Data
Collector copy.
22. Transfer the number of CWPM, EPM,
and % of correct explicit and implicit
comprehension questions to the
CWPM/EPM/Comprehension
Recording Sheet.

163
APPENDIX F
Social Validity Survey
Student Name _______________________________________ Date ___________________
Completed by __________________________________________________________________
Directions – Orally interview each student and write their responses in the spaces provided.
1. Do you think repeated readings affected your reading skills?
______________________________________________________________________________
2. What did you like about doing the repeated readings?
______________________________________________________________________________
3. What did you NOT like about doing repeated readings?
______________________________________________________________________________
4. Did repeated readings help you remember the story?
______________________________________________________________________________
5. Did repeated readings help you to understand what happened in the story?
______________________________________________________________________________
6. Would you use repeated readings in social studies, science, or when reading your A.R. books?
______________________________________________________________________________

164
APPENDIX G
Parental Consent Form
The University of Georgia Department of Communication Sciences and Special Education
537 Aderhold Hall
Athens, GA 30602
706-542-4561
Parental Permission Form
January 7, 2011
Dear _________________________________________________,
As part of my doctoral program at the University of Georgia, I will be conducting a
research study in my classroom and would like for your child to participate in the intervention.
This study will begin in January and end in March. The purpose of this intervention is to increase
the number of words read correctly, to decrease the number of errors read, and to increase the
reading comprehension by your child. I will be measuring the effects that a combination of
repeated readings with error correction has on your child’s reading fluency and comprehension.
This intervention will not interfere with other subjects or classes your child participates in.
You do not have to allow your child to be in this study if you do not want to. You have
the right to withdraw your child from the study at any time. Your child’s participation is
voluntary. Your child may refuse to participate or withdraw from the study at any time and for
any reason without loss of benefits to which your child is otherwise entitled. This would not
affect his grade, and there is no penalty for withdrawing or not participating. While your child
may improve his ability to read more fluently and efficiently as a result of this study, there is no
guaranteed benefit to participation in this research study. There are no foreseeable risks or
discomforts to your child during this study. If your child becomes uncomfortable from being
asked to read words that are too difficult, easier reading passages will be chosen. Benefits of
your child’s participation in this study include a possible increase in reading fluency and
comprehension as well as the advancement of educators’ knowledge and research base regarding
teaching strategies for students with disabilities.
Your child’s name and individually identifiable information will be kept confidential.
The information from this study will be discussed with Mrs. Strickland’s professors and
classmates at the University of Georgia and will also be used to write a dissertation for her
course of study at UGA. The study will be submitted for possible publication in a professional
journal, but this is not guaranteed. All individually identifiable data (names, school, school

165
district, school location) will be coded and kept confidential. Potential identifiers will be
removed from the data at the conclusion of the study.
During this study, I will be working with your child every day for two months. Each day,
I will give your child a short story to read and ask him to read this story three different times.
While your child is reading, I will count and record the number of words read correctly and
incorrectly. I will also ask him to answer comprehension questions about the story he reads. I
will correct the words your child reads incorrectly. I will work with your child during homeroom
or during reading. Each session will not last more than 15 minutes.
Upon your request, I will review your child’s performance with you when the study has
been completed. I will not share information about other students’ performances as this is
confidential information.
If you have any questions, please contact me at [email protected] or
770-784-2969. You may also contact my advisor and professor, Dr. Richard Boon, in The
University of Georgia’s Department of Communication Sciences and Special Education, at (706)
542-4561. Thank you.
Sincerely,
Mrs. Whitney Strickland
Please check one, sign, and date.
____ I do give my consent for _______________________________ (your child’s name) to
participate in this study.
____ I do not give my consent for _________________________________ (your child’s name)
to participate in this study.
Signature _______________________________________________ Date __________________
Please sign both copies, keep one and return one to Mrs. Whitney Strickland.
Additional questions or problems regarding your child’s rights as a research
participant should be addressed to The Chairperson, Institutional Review Board,
Human Subjects Office, University of Georgia, 612 Boyd Graduate Studies
Research Center, Athens, Georgia 30602-7411; Telephone (706) 542-3199; E-Mail
Address [email protected]

166
APPENDIX H
Minor Assent Form
The University of Georgia
Department of Communication Sciences and Special Education
537 Aderhold Hall
Athens, GA 30602
706-542-4561
Student Assent Form
January 7, 2011
Dear Student,
I would like to ask you to be in a project I’m doing for a class I’m in at school. By helping me
with this project, you will show teachers how they can help students like you learn how to read
better. In this project, you will be reading stories several times in a row with my help. By doing
this, I think you can become a faster and better reader.
We will be working on this project every day for two months. Each day, I will give you a short
story to read. You will read this story three times. I will help you fix the words you read wrong. I
will also ask you questions about the story. I will work with you during homeroom or during
reading. I will listen to you read, take notes, and help you. Sometimes Ms. McCrorey will listen
to you read and take notes.
This study won’t have anything to do with your grades. I will use what I learn to write a paper
for a class I am in at school. I will share what I learn with other teachers. I will not use your real
name. No one will know who you are. I want to learn something about the way you read so that I
can help other students that I will have. Finally, even though your reading may get better after
being in this study, there is a chance that your reading will not bet better.
I want you to know that you can stop being in my project any time you want. If you have any
questions, you can always ask me.
Sincerely,
Mrs. Strickland

167
I understand the project talked about above. My questions have been answered, and I want to be
a part of this project. I will get a copy of this paper.
_______________________________________________ _______________
Signature of Participant Date