the effects of a one-to-one laptop initiative on student ... · chapter one: introduction ... 10...
TRANSCRIPT

The Effects of a One-to-One Laptop Initiative on Student Achievement
Brian Van Batavia
B.A., Buena Vista University, 1995
M.A. Northwest Missouri State University 2008
Ed. S. University of Missouri Kansas City, 2012
Submitted to the Graduate Department and Faculty of the School of Education of
Baker University in partial fulfillment of the requirements for the degree of
Doctor of Education in Educational Leadership
_______________________________
Susan K. Rogers, Ph.D.
Major Advisor
________________________________
James Robins, Ed.D.
________________________________
Rebecca Kiefer Ed.D.
Date Defended: April 25, 2017
Copyright 2017 by Brian Van Batavia
ii
Abstract
The purpose of this study was to determine to what extent the one-to-one
initiative impacted student performance on the MAP ELA and mathematics assessments.
The participants included those students from a suburban Kansas City, Missouri school
district who were enrolled in fourth grade during the 2011-2012 school year and fifth
grade during the 2012-2013 school year. There were no statistically significant
differences in fifth grade student achievement on the MAP English Language Arts (ELA)
and mathematics assessments between students who participated in the one-to-one laptop
initiative and students who did not participate in the initiative. The difference in the fifth
grade student achievement on the MAP ELA and mathematics assessments between
students who participated in the one-to-one laptop initiative and students who did not
participate in the initiative was not affected by student race or socioeconomic status
(SES). However, the difference in fifth grade achievement on the MAP mathematics
assessment between students who participated in the one-to-one initiative and students
who did not participate in the initiative was affected by student gender. Female students
who participated tended to outperform female students who did not participate, while
male students who participated tended to perform poorly when compared to males who
did not participate.
A statistically significant difference in ELA growth, as measured by a difference
between the fourth and fifth grade scale scores on the MAP ELA assessment, was found
between fifth grade students who participated in the one-to-one laptop initiative and fifth
grade students who did not participate in the initiative. The differences were not affected
by student gender and SES; however, although not statistically significant, White

iii
students who participated in the one-to-one initiative tended to outperform White
students who did not participate. No differences were found between fourth and fifth
grade scale scores on the MAP mathematics assessment between fifth grade students who
participated in the one-to-one initiative and those that did not participate in the initiative.
The differences were not affected by student gender, race, and SES.
It was recommended that District X evaluate the effectiveness of this one-to-one
initiative, consider expanding internet access to their students outside of the school day,
and develop and implement strategies targeting the academic performance of lower-
performing students. Future studies could be conducted that include additional
quantitative measures of student achievement such as STAR, Acuity, and iReady and
survey results from teachers, parents, and students. In addition, a measure could be
included to evaluate the student acquisition of 21st century skills.
iv
Dedication
I would like to dedicate this dissertation to my wife, Angela. Your intelligence,
skill, thoughtfulness, and passion equip you to improve the lives of others far beyond my
abilities. God knows that the only thing that impedes you is me, your selfless giving to
our children, and the Common Variable Immune Deficiency that the Lord placed in your
path. While you consistently refused to help me with this degree, you persistently
believed that I could do it. You inspired me to continue when nothing else did; I am so
blessed.
I regret the moments I missed with children Kamryn, Marin, and Lou, my parents
Bert and Sandy Van Batavia, and the rest of my family and friends to complete this
degree. I love you all.

v
Acknowledgements
First, I would like to thank my Baker support, Dr. Susan Rogers and Dr. Peg
Waterman. Thank you for your persistence, responsiveness, availability, and guidance. I
am sure I would not have been able to complete this when I did without your partnership
in supporting me. I would like to also thank Dr. Jim Robins for serving as a part of the
committee and providing valuable feedback.
Additionally, I would like to thank Dr. Mike Kimbrell for going above and
beyond to aid me in the collection and preparation of data. You are a true leader by
example. Your willingness to meet, collaborate, and tutor me was paramount to the
completion of this degree. I would also like to thank Dr. Becky Kiefer, for inspiring me
to begin this degree. Your grace, dignity, and mentoring inspire me to be a better leader
each day.
I have worked with many colleagues who have helped me grow into a leader. I
would like to acknowledge the following colleagues from Park Hill: Dr. Dale
Longnecker, Dr. Jeanette Cowherd, and Dr. Jeff Klein. Also, thank you to Dr. Mark
Miles and Dr. Mark Frost, formerly of Park Hill. A special thank you to Dick Ballard,
retired teacher from the Boyden- Hull School District, for showing me the value of
teaching and learning.
Thank you to the CCF: Paul McCorkle, Kenny Rodrequez, and T. J. Winkleman.
I would have quit without you. You were with me every step of the way, each of you is
an excellent educator; I am proud to call you my friends.

vi
Table of Contents
Abstract ............................................................................................................................... ii
Dedication .......................................................................................................................... iv
Acknowledgements ..............................................................................................................v
Table of Contents ............................................................................................................... vi
List of Tables ..................................................................................................................... ix
Chapter One: Introduction ...................................................................................................1
Background ..............................................................................................................3
Statement of the Problem .........................................................................................7
Purpose of the Study ................................................................................................8
Significance of the Study .........................................................................................9
Delimitations ............................................................................................................9
Assumptions ...........................................................................................................10
Research Questions ................................................................................................10
Definition of Terms................................................................................................12
Organization of the Study ......................................................................................13
Chapter Two: Review of the Literature .............................................................................15
History of Digital Devices in the Classroom .........................................................16
Evolution of One-to-one Computers in Schools ...................................................21
Preparing Students for the Future through One-to-One .........................................28
Student Achievement in a One-to-one Setting.......................................................33
Evidence That Does Not Support Student Achievement in a One-to-One
Setting ........................................................................................................34

vii
Evidence That Does Support Student Achievement in a One-to-One
Setting ........................................................................................................37
Summary ................................................................................................................43
Chapter Three: Methods ....................................................................................................44
Research Design.....................................................................................................44
Selection of Participants ........................................................................................45
Measurement ..........................................................................................................45
Data Collection Procedures ....................................................................................51
Data Analysis and Hypothesis Testing ..................................................................51
Limitations .............................................................................................................62
Summary ................................................................................................................63
Chapter Four: Results ........................................................................................................64
Descriptive Statistics ..............................................................................................65
Hypothesis Testing.................................................................................................68
Summary ................................................................................................................89
Chapter Five: Interpretation and Recommendations .........................................................90
Study Summary ......................................................................................................90
Overview of the problem ...........................................................................90
Purpose statement and research questions .................................................91
Review of the methodology .......................................................................91
Major Findings ...........................................................................................91
Findings Related to the Literature..........................................................................93
Conclusions ............................................................................................................96

viii
Implications for action ...............................................................................97
Recommendations for future research .......................................................98
Concluding remarks .................................................................................100
References ........................................................................................................................102
Appendices .......................................................................................................................119
Appendix A. District X Proposal for Research Permission Form ...................................120
Appendix B. Baker University IRB Proposal for Research Permission Form .................122
Appendix C. IRB Renewal ..............................................................................................127

ix
List of Tables
Table 1. Percentage of District X Fourth and Fifth Grade Students Achieving a Score of
Proficient or Advanced on the MAP Mathematics and ELA ...............................5
Table 2. Scaled Scores for Fourth and Fifth Grade Mathematics and ELA as Designated
by DESE from 2009 to 2013...............................................................................48
Table 3. Accuracy and Consistency of Proficient and Advanced Scores for Fourth and
Fifth Grade Mathematics and ELA as Designated by DESE from 2009 to
2013.....................................................................................................................50
Table 4. Participants by Elementary School ......................................................................65
Table 5. Participant Gender ...............................................................................................66
Table 6. Participant Ethnicity ............................................................................................67
Table 7. Participant SES ....................................................................................................67
Table 8. Fifth Grade 1:1 Participants .................................................................................68
Table 9. Descriptive Statistics for the Results of the Test for H1 ......................................69
Table 10. Descriptive Statistics for the Results of the Test for H2 ....................................70
Table 11. Descriptive Statistics for the Results of the Test for H3 ....................................72
Table 12. Descriptive Statistics for the Results of the Test for H4 ....................................73
Table 13. Descriptive Statistics for the Results of the Test for H5 ....................................74
Table 14. Descriptive Statistics for the Results of the Test for H6 ....................................75
Table 15. Descriptive Statistics for the Results of the Test for H7 ....................................76
Table 16. Descriptive Statistics for the Results of the Test for H8 ....................................78
Table 17. Descriptive Statistics for the Results of the Test for H9 ....................................79
Table 18. Descriptive Statistics for the Results of the Test for H10 ..................................80

x
Table 19. Descriptive Statistics for the Results of the Test for H11 ..................................82
Table 20. Descriptive Statistics for the Results of the Test for H12 ..................................83
Table 21. Descriptive Statistics for the Results of the Test for H13 ..................................85
Table 22. Descriptive Statistics for the Results of the Test for H14 ..................................86
Table 23. Descriptive Statistics for the Results of the Test for H15 ..................................87
Table 24. Descriptive Statistics for the Results of the Test for H16 ..................................89

1
Chapter One
Introduction
During the first 15 years of the 21st century, public education witnessed the
growth of technology in classroom instruction. This growth has come at a great
monetary expense and with much debate. The implementation of technology is varied
throughout school districts. Some districts have purchased laptops while others have
purchased iPads or similar devices. Some, like Anchorage School District in Alaska
(2014), have moved to a model of instruction that includes all secondary students using
their own laptops, often called Bring Your Own Device (BYOD). Other districts have
implemented a one-to-one technology model where each student uses a laptop provided
by the school district. For example, the regional news outlet KMBC (2014) reported that
the Shawnee Mission School District in Shawnee, Kansas decided to purchase electronic
devices for all secondary students.
In 2001, the federal legislation, No Child Left Behind, generated a new era of
high-stakes accountability for public education. Schools were tasked by states to
demonstrate continuous improvement of their students’ academic progress. In addition to
classroom and student instruction, school districts have begun using technology to help
meet the demands for improvement from state agencies and new rigorous Common Core
Standards. For example, the Missouri Department of Elementary and Secondary
Education (DESE) has promoted continuous improvement by measuring school districts
through the fifth cycle of the Missouri School Improvement Process, which is referred to
as the MSIP-5 (DESE, 2014).

2
Academic achievement and growth is a measured indicator by DESE during the
MSIP 5 review process (DESE, 2014). Instructional technology methods could be used
to address this indicator as well. In fact, introducing technology as an instructional tool
was recognized as a productive teaching technique. The International Society for
Technology in Education (ISTE) (2014) indicated:
Technology, used effectively, can help all students meet and exceed the rigorous
learning goals embedded in the Common Core State Standards by providing
access to tools and resources that personalize instruction and creating rich,
engaging, and relevant learning environments. With the advent of the 2014–2015
Common Core Online Assessments, it is imperative that students’ learning takes
place in a robust digital learning environment in order for them to be successful
on these new higher-order thinking assessments. (para. 1-2)
As of 2014, forty-five states, including Missouri, had adopted the Common Core State
Standards (CCSS) (Bidwell, 2014). Blackburn (2013) explained that while the CCSS
established rigorous benchmarks, the impact on academic performance depends on how
well the standards are implemented. Blackburn (2013) further stated, “Authentic rigor
includes high expectations for students, increased support for students, and increased
demonstration of learning by students” (para. 2).
Research concerning computer-based instruction has produced conflicting results
regarding the impact on student achievement. Silvernail (2007) reported that “the
evidence indicates that implementation of Maine’s one-to-one ubiquitous laptop program
has had a positive impact on middle school students’ writing” (p. 9). The opposite has
also been reported. Fried (2008) found a “significant, negative relationship between in-

3
class laptop use and course grade” (para. 11). These mixed findings have led
administrators to question the expense of technology in classrooms. Investigations into
one-to-one initiatives are often focused on student achievement to aid in the justification
of the expense of such a program. Garner, Schweder, and Wissick (2004) reported that
technology tools and instructional strategies could empower students with diverse
learning needs to master content in mathematics, language arts, science, and social
studies.
Background
The setting for this study was District X, a suburban school district established in
1951 in western Missouri. District X served the following Kansas City Northland
metropolitan neighborhoods in the southern part of Platte County: “Parkville, Riverside,
Houston Lake, Weatherby Lake, Platte Woods, and Lake Waukomis” (District X, 2014,
p. 9). This public school district, with pre-kindergarten programs through grade 12,
reported an enrollment of 10,504 students for the 2013-2014 school year (District X,
2014, p. 21). During the 2013-2014 school year, the school district included 10
elementary schools, three middle schools, two high schools, a day treatment school, and
an early childhood center.
District X has experienced a noticeable change in the demographics of its students
between 2004 and 2014. The number of students qualifying for free and reduced
breakfast and lunch rates has increased from 18.4% in 2004-2005 to 29.2% in 2014-2015
(District X, 2015a, p. 37). District X students have also experienced a change in the
diversity of their population during this same time. Combined minority populations
increased from 17.1% in 2004-2005 to 30.1% of the student population in 2014-2015

4
(District X, 2015a, p. 34). These trends indicate that District X could potentially continue
to have an increase in the diversity of its students and the needs of those students.
Jackson and Davis (2000) reported that such evolutions leave teachers with the need to
address student diversity in the regular classroom, rather than through other arrangements
that have often replaced the teacher as needing to attend to the needs of students who
diverge from the norm. Kao and Tienda (2005) reported that demographic shifts towards
increased diversity and lower socioeconomic status often lead to decreased student
achievement and is therefore considered a liability to school officials. Thus, District X
may potentially plan to change how it meets the needs of its students.
The Missouri Assessment Program (MAP) test is administered to students each
year and is designed by the state of Missouri to assess progress toward mastery of the
Missouri Show-Me Standards (DESE, 2014). Scores are reported to the schools by the
state. Students, based on their MAP scores, are placed into the following categories:
below basic, basic, proficient, and advanced (DESE, 2014). District X has been
recognized for its academic achievement. The district's overall high achievement has led
to state honors of Accreditation with Distinction, the Distinction in Performance Award,
and North Central Accreditation, as well as a Gold Medal ranking from Expansion
Management Magazine (Kimbrel & Rizzo, 2013). An example of success is the high
academic performance of the fifth and sixth grade students on the state MAP test in the
areas of mathematics and English Language Arts (ELA). The 2008-2009 through 2013-
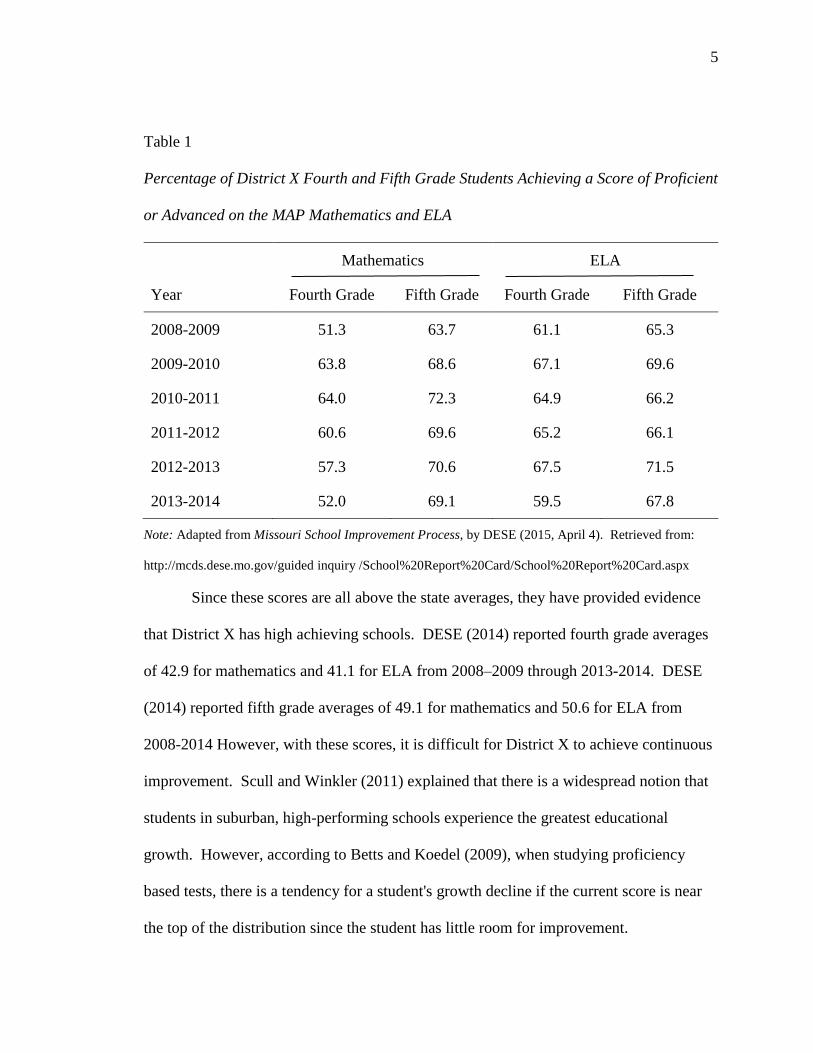
2014 results of the District X fourth and fifth grade student performance on the MAP are
shown in Table 1.
5
Table 1
Percentage of District X Fourth and Fifth Grade Students Achieving a Score of Proficient
or Advanced on the MAP Mathematics and ELA
Mathematics ELA
Year Fourth Grade Fifth Grade Fourth Grade Fifth Grade
2008-2009 51.3 63.7 61.1 65.3
2009-2010 63.8 68.6 67.1 69.6
2010-2011 64.0 72.3 64.9 66.2
2011-2012 60.6 69.6 65.2 66.1
2012-2013 57.3 70.6 67.5 71.5
2013-2014 52.0 69.1 59.5 67.8
Note: Adapted from Missouri School Improvement Process, by DESE (2015, April 4). Retrieved from:
http://mcds.dese.mo.gov/guided inquiry /School%20Report%20Card/School%20Report%20Card.aspx
Since these scores are all above the state averages, they have provided evidence
that District X has high achieving schools. DESE (2014) reported fourth grade averages
of 42.9 for mathematics and 41.1 for ELA from 2008–2009 through 2013-2014. DESE
(2014) reported fifth grade averages of 49.1 for mathematics and 50.6 for ELA from
2008-2014 However, with these scores, it is difficult for District X to achieve continuous
improvement. Scull and Winkler (2011) explained that there is a widespread notion that
students in suburban, high-performing schools experience the greatest educational
growth. However, according to Betts and Koedel (2009), when studying proficiency
based tests, there is a tendency for a student's growth decline if the current score is near
the top of the distribution since the student has little room for improvement.

6
One of the ways that District X has decided to work towards continued academic
improvement for its students has been through the implementation of the Future Learner
Project (FLiP). The purpose of FLiP has been to create more student-centered
classrooms and help “teachers act as facilitators and students take ownership of their
learning” (District X, 2014). District X was working to achieve this goal by introducing
students to computer-based instruction through a one -to-one environment using a flipped
classroom teaching method.
In the fall of 2012, District X implemented the one-to-one initiative in three
elementary schools. All fifth grade students who attended the pilot schools were issued
laptops for the duration of the 2012-2013 school year. Students used the laptops in class
and could take them home on a nightly basis. In the fall of 2013, all fifth grade students
in the District X were issued laptops as an extension of this program.
For years, school districts have made strategic efforts to increase the technology
skills of students. The one-to-one initiative was aligned with District X’s strategic goal:
“Increase the percentage of students proficient in 21st century skills” (District X, 2014, p.
4). Apple Computers (1990) reported that a one-to-one computer-based learning
environment has been utilized in classrooms in various degrees since 1985. District X
also implemented this program to address the academic needs of all students. Walsh
(2012) highlighted this issue when he wrote, “Human beings don’t naturally all learn the
same material at the same pace and in the same way. One-to-one technology allows
teachers to differentiate their content and their student assignments to meet the needs
of all students” (para. 6). District X worked toward meeting student needs through the
strategic implementation of the one-to-one initiative.

7
Statement of the Problem
A transition in the mode of instruction to a “flipped classroom” with a “one-to-
one” (each student with a networked electronic device) initiative triggered interest in the
effectiveness of these changes. Staff member’s delivery of instruction has changed with
student participation and collaboration playing a much greater role in the classroom. This
change in instruction was piloted in fifth grade middle school classrooms. Incubator
classrooms had a set of laptops dedicated for the students to use whenever they attended
that class or were with that teacher (Kimbrel & Rizzo, 2013). The district began this
process to improve student technology skills and academic achievement (Kimbrel &
Rizzo, 2013). Providing these resources to students required a significant dedication of
resources from the community. District X school board members proposed a levy
increase to the taxpayers because of the additional cost associated with the electronic
devices (District X, 2014, para. 11).
The research on one-to-one computer instruction has produced conflicting results.
Spektor-Levy and Granot-Gilat (2012) found “seventh-grade students in a 1:1
environment demonstrated a significant statistical difference in regards to academic
achievement over the students from their comparison group” (p. 91). Cottone (2013)
reported that “fourth, fifth, and sixth graders demonstrated a significant statistical
difference between a pre-1:1 laptop group and the post-1:1 laptop with positive results in
math but not for reading” (p. 19). District X did not know if the one-to-one initiative
would ultimately have a positive influence on student achievement on the MAP
mathematics and ELA assessments or if it would have unique effects on the
subpopulations of gender, race, or SES. Along with other institutions, District X was

8
attempting to measure the success of this program through educational outcomes.
However, as reported by Maninger and Holden (2009), “these educational outcomes are
difficult to quantify and even more challenging to relate directly to specific instructional
initiatives” (p. 9). It is important to know if placing students in District X’s one-to-one
initiative has had any impact on mathematics and ELA scores as assessed on the MAP.
Purpose of the Study
The first purpose of this study was to determine if there were differences in fifth
grade student achievement on the MAP ELA and mathematics assessments between
students who participated in the one-to-one laptop initiative and students who did not
participate in the initiative during the 2012-2013 school year. The second purpose was to
determine whether the differences in fifth grade student achievement on the MAP ELA
and mathematics assessments between students who participated in the one-to-one laptop
initiative during the 2012-2013 school year and students who did not participate in the
initiative were affected by one of the following variables: student gender, race, or SES.
The third purpose is to determine if there were a differences in ELA and mathematics
growth, as measured by a difference between the fourth (2011-2012) and fifth grade
(2012-2013) scale score on the MAP ELA and mathematics assessment, between fifth
grade students who participated in the one-to-one laptop initiative and fifth grade students
who did not participate in the initiative during the 2012-2013 school year. The final
purpose was to determine if there were a difference in ELA growth, as measured by a
difference between the fourth (2011-2012) and fifth grade (2012-2013) scale score on the
MAP ELA and mathematics assessment, between fifth grade students who participated in
the one-to-one laptop initiative and fifth grade students who did not participate in the
9
initiative during the 2012-2013 school year during the 2012-2013 school year were
affected by one of the following variables: student gender, race, or SES.
Significance of the Study
The results of this study could contribute to the body of research regarding
computer-based instruction and one-to-one instructional environments. “The main
purpose of integrating many digital technologies into the learning environment is
increasing the quality and success of education” (Ozerbas & Erdogan, 2016, p. 1).
District X has begun the implementation of a one-to-one program in grades 5-12 and is
considering expanding it in grades K-4 (Kimbrel & Rizzo, 2013). The results of this
study might provide useful information regarding the relationship of a one-to-one
environment and student achievement in the District X. For example, the District X
might explore the expansion of the one-to-one initiative to additional grade levels or the
expansion of electronic devices used for instruction in the future. District X needs to
have data that illustrates the effect of the use of laptops as an instructional tool; the results
of this study could provide information regarding this issue. Additionally, the results of
this study might help other districts make decisions on how to best use their resources to
improve student achievement.
Delimitations
Per Lunenburg and Irby (2008), “delimitations are self-imposed boundaries set by
the researcher on the purpose and scope of the study” (p. 134). This study included the
following delimitations:
1. The setting for this study was a suburban school district near Kansas City,
Missouri.
10
2. The sample included fourth graders during the 2011-2012 school year and
fifth graders during the 2012-2013 school year.
3. Student achievement was measured by using student scores on the MAP ELA
and mathematics assessments.
Assumptions
According to Lunenburg and Irby (2008), “assumptions are postulates, premises,
and propositions that are accepted as operational for purposes of the research” (p. 135).
This study included the following assumptions:
1. All teachers were highly qualified as determined by the Missouri Department
of Elementary and Secondary Education.
2. All teachers received the same professional development on instructional
practices as prescribed by District X.
3. All teachers designated as FLiP instructors delivered instruction in a one-to-
one environment.
4. Teachers administered the MAP assessments in a standardized manner.
5. State personnel scored the MAP assessments in a standardized manner.
6. Handling of the materials for the MAP assessments was performed in an
ethical and legal manner, following state guidelines.
7. Students put forth their best effort on all assessments.
Research Questions
Lunenburg and Irby (2008) called the research questions the “directional beam for
the study” (p. 126). The focus of the study was the relationship between MAP scores and

11
the one-to-one laptop initiative in District X. The following research questions (RQ)
were addressed in this study:
RQ1. To what extent is there a difference in fifth grade student achievement on
the MAP ELA assessment between students who participated in the one-to-one laptop
initiative and students who did not participate in the initiative during the 2012-2013
school year?
RQ2. To what extent is the difference in fifth grade student achievement on the
MAP ELA assessment between students who participated in the one-to-one laptop
initiative and students who did not participate in the initiative during the 2012-2013
school year affected by one of the following variables: student gender, race, or SES?
RQ3. To what extent is there a difference in fifth grade student achievement on
the MAP mathematics assessment between students who participated in the one-to-one
initiative and students who did not participate in the initiative during the 2012-2013
school year?
RQ4. To what extent is the difference in fifth grade student achievement on the
MAP mathematics assessment between students who participated in the one-to-one
laptop initiative and students who did not participate in the initiative during the 2012-
2013 school year affected by one of the following variables: student gender, race, or
SES?
RQ5. To what extent is there a difference in ELA growth, as measured by a
difference between the fourth (2011-2012) and fifth grade (2012-2013) scale score on the
MAP ELA assessment, between fifth grade students who participated in the one-to-one

12
laptop initiative and fifth grade students who did not participate in the initiative during
the 2012-2013 school year?
RQ6. To what extent is the difference in ELA growth, as measured by a
difference between the fourth (2011-2012) and fifth grade (2012-2013) scale score on the
MAP ELA assessment, between fifth grade students who participated in the one-to-one
laptop initiative and fifth grade students who did not participate in the initiative during
the 2012-2013 school year affected by one of the following variables: student gender,
race, or SES?
RQ7. To what extent is there a difference in mathematics growth, as measured by
a difference between the fourth (2011-2012) and fifth grade (2012-2013) scale score on
the MAP mathematics assessment, between fifth grade students who participated in the
one-to-one laptop initiative and fifth grade students who did not participate in the
initiative during the 2012-2013 school year?
RQ8. To what extent is the difference in mathematics growth, as measured by a
difference between the fourth (2011-2012) and fifth grade (2012-2013) scale score on the
MAP mathematics assessment, between fifth grade students who participated in the one-
to-one laptop initiative and fifth grade students who did not participate in the initiative
during the 2012-2013 school year affected by one of the following variables: student
gender, race, or SES?
Definition of Terms
Per Lunenburg and Irby (2008), key terms should be defined that are central to the
study and used throughout the dissertation. The following definitions are used in this
study:

13
English Language Arts (ELA) Missouri Assessment Program (MAP). The
MAP ELA assessments test students’ “progress toward mastery of the Missouri Show-
Me Standards regarding language arts” (DESE, 2014, p. 7).
Flipped instruction. Flipped instruction has multiple meanings; however, for the
purposes of this study it describes the students receiving their instruction at home,
normally with technology, and doing their work at school in some form. Enfield (2013)
explained that a flipped classroom “involves providing instructional resources for
students to use outside of class so that class time is freed up for other instructional
activities” (p. 14).
Mathematics Missouri Assessment Program (MAP). The MAP mathematics
assessment test students’ “progress toward mastery of the Missouri Show-Me Standards
regarding mathematics” (DESE, 2014, p. 7).
One-to-one initiative. One-to-one has multiple meanings; however, for the
purposes of this study, it describes a situation where each student in a specific
environment possesses an electronic device provided by the school for instruction.
Jackson (2004) described one-to-one as “putting a computer – a PC, laptop, handheld, or
tablet PC – into the hands of every student” (para.1).
Organization of the Study
This study is arranged in five chapters. Chapter one included the introduction,
background of the study, statement of the problem, the purpose of the study, the
significance of the study, delimitations, assumptions, research questions, definitions of
terms, and the organization of the study. Chapter two contains a review of the literature,
which includes a historical review of the utilization of digital devices in classrooms, the

14
evolution of one-to-one classroom initiatives, preparation of students for the future
through one-to-one, and the relationship between technology use and student
achievement. In chapter three the research design methodology used in this study, the
selection of participants, the measurement, data collection, data analysis and hypothesis
testing, and the limitations are described. Chapter four includes the results of the data
analysis. Presented in chapter five are a summary of the study, discussion of the findings
related to the literature, and the conclusions.

15
Chapter Two
Review of the Literature
The research on one-to-one computer instruction has produced conflicting results.
In 1960, Toffler (1970) purported “information overload was a psychological disorder in
which a person has difficulty understanding an issue and making decisions because they
have too much information” (p. 8). Toffler (1970) wrote, “When the individual is
plunged into a fast and irregularly changing situation, or a novelty-loaded context … his
predictive accuracy plummets. He can no longer make the reasonably correct
assessments on which rational behavior is dependent” (p. 25). The American
Psychological Association (2010) proposed that the vast number of visual images now
available, coupled with an increase of informational texts has even caused an increase in
the average I.Q. The Internet and the growth of the consumption of information have
created less utilitarian minds; people have become interested in hypotheticals, classifying
things together, and have “donned scientific spectacles” (Winerman, 2013, p. 28).
The increase in information and change in our general way of thinking has also
affected the educational system; in the past one hundred years, the school day and school
year have increased. Cuban and Tyack (1995) explained that in 1900, “the average
American school year consisted of 99 days, but only half of the school-age population
was enrolled” (p. 21). In 2000, enrollment in grades 9-12 was 94% of eligible students
(United States Department of Education, 2005). In addition to the increased length of the
school day, teachers have changed their method of lesson delivery, and learning for
students has become more collaborative. Barron and Darling-Hammond (2008)
conducted research on learning and found that new academic approaches, “including

16
implementing inquiry-based learning and technology help prepare students for life in the
21st century” (p. 22). In addition to these forms of technology implementation, some
districts have begun to promote teachers “flipping” their instruction. Enfield (2013)
described flipped instruction as a mode of instruction where students work on their
standards in class and receive direct instruction through a digital device outside of class.
One example of a resource for flipped instruction is an electronic device such as a laptop.
Chapter two includes a review of the literature. This review includes a historical
review of the utilization of digital devices in classrooms, the evolution of one-to-one
classroom initiatives, preparation of students for the future through one-to-one, and the
relationship between technology use and student achievement. These topics are reviewed
as they relate to the purpose of the study and the research questions stated in chapter one.
History of Digital Devices in the Classroom
Looking back into the history of digital devices in the classroom, Dunn (2011)
purported the “magic lantern” was probably the first regularly used device in the
classroom” (para. 6). The “magic lantern” projected images that were printed on glass
plates; educators then showed these images to students. “By the end of World War I,
these devices were common throughout urban school districts; the Chicago Public School
District had almost 8,000 “magic lanterns” in use” (Dunn, 2011, para. 6). Today, when
digital devices in the classroom are mentioned, many different devices may be included.
With the implementation of several statewide “and district-wide large-scale one-to-one
computing projects in the first few years of the 21st century and the rapid expansion in
the following years, there has been a considerable increase in the number of one-to-one”
computing evaluation and research studies (Lei, Conway, & Zhao, 2007). However,

17
research in this field has not been able to keep up with its rapid development and
expansion (Penuel, 2006).
The Apple I was the first computer used in a school setting. Hill (2014) reported
that it was built by Steve Wozniak, as a gift to computer club sponsor Liz Loop in 1976
(para. 11). The next major milestone for digital devices in education occurred in the
1980s and 1990s when desktop computers began to appear in classrooms throughout the
country. During this time, national teacher technology support groups were developed.
According to Thompson (2013), “this group collaboration and teamwork among teachers
led to the regular use of digital devices in classrooms” (p. 109). The United States
Federal Government supported the continued growth of this educational technology use
with published reports, beginning in 1995, which highlighted the “importance of a solid
technology-based educational foundation” (Thompson, 2013, p. 109). An extension of
this was shown by Attewell and Battle (1999) who reported that the growth of computer
use in the classrooms “raised concerns that students who did not have computers or
computer access at home may become disadvantaged” (p. 1). Concerns about computer
access were addressed and debated, but they did not prevent the spread of digital device
use in classrooms.
When they had the room and money “to buy a large number of computers, many
schools throughout the 1980s and early 1990s placed them in centrally” located places in
their buildings and repurposed the space (Means, Olson, & Ruskus, 1995). “Computer
use in labs has been found to be effective at least over the short term” (Kulik, 1994, p. 6),
but researchers have long lobbied and argued that for technology to make a powerful
difference in student learning, “students must be able to use computers more than once or

18
twice a week in a lab at school” (Kozma, 1991 p. 3). Limited access has been cited as a
“reason why teachers make limited use of technology with students” (Adelman & Taylor,
2002, p. 240). Teachers reported that when computers are in labs, “they use technology
less often for instruction because of the difficulty of scheduling time in the lab and
transporting students there” (Penuel, 2006 p. 7).
In 2000, Maine used unexpected funds to launch a statewide one-to-one program,
which started with over 17,000 seventh grade students in 243 schools around the state.
Silvernail and Lane (2004) reported on the early impact of the first 14 months of the
program. They did not include student achievement in this report; however, they did
indicate that the growing use of the laptops did have favorable outcomes such as:
Teachers and students alike report improvements in the quality of students’ work,
the students learn more, and that students increase their understanding of what
they are learning. Students of all types are more motivated to learn, and more
engaged in the learning process. And interaction about learning and content
between teachers and students, and students with other students has increased
substantially. (Silvernail & Lane, 2004, p. 31)
These types of outcomes helped promote the use of technology, one-to-one programs,
and other changes in education.
During the computer era, education has been re-conceptualized around the
“construction of knowledge through information processing, modeling, and interaction”
(Sharples, Taylor, & Vavoula, 2005, p. 87). Bergmann and Sams (2012) wrote that the
one-to-one initiative has not only changed the delivery of the material, “it has changed
the aesthetic look and feel of the classroom. One-to-one tablet implementation has called

19
for teachers to become facilitators, instead of lecturing in front of rows of students” (p.
11). Increased student collaboration with technology, in turn, has “led to physical
rearrangement of the classroom” (Bergmann & Sams, 2012, p. 12). Niemeyer (2013)
wrote that interviews at MIT revealed that faculty and students had a strong interest in
warmer, more intimate, and more attractive classroom spaces that promote healthy
student exchanges.
An unexpected outcome of the one-to-one initiative was the support that has been
provided to special education students. In the past, education was dominated by reading
directly from a textbook, which proved difficult for students with language deficiencies,
students with dyslexia, or students with hyperactivity disorders. However, assistive
technology (AT) made continually available with the one-to-one initiative, has provided
support in new ways. In Florida public schools, McKay (2005) found that students with
more subtle disabilities under IDEA or Section 504 of the Rehabilitation Act “could be
significantly helped through the use of AT solutions” (p. 22). In recent studies, students
with dyslexia were able to “analyze blurry images and read faster on hand-held devices”
(Johnson, 2014, p. 12).
Response to Intervention (RTI), is a way to provide all students with the highest
level of instruction as a means of improving achievement. Rose and Meyer (2002) found
that implementing daily technology, “which supports multiple means of knowledge
representation, engagement, and expression of understanding, could help achieve RTI
goals” (p. 3). The RTI Movement, which was conceptualized in the Individuals with
Disabilities Education Act of 2004 (IDEA), “provides more intensive and structured
interventions to ensure that students attain success both academically and behaviorally,

20
and the framework moves away from allowing students to continually fail before
intervention is implemented” (Basham, Israel, Graden, Poth, & Winston, 2010, p. 243).
Peterson and Wilson (2006) stated, “Students need opportunities to learn in
multiple ways, and teachers need to have a pedagogical repertoire that draws from myriad
learning theories” (p. 4). Also, researchers reported that in sixth grade classrooms with
one-to-one experience a “decrease in negative student behaviors and a decrease in
behavior” referrals (Harless & Harthun-Reed, 2005, p. 6). Researchers in five different
middle schools across Massachusetts found that when the one-to-one initiative is
implemented, “positive student benefits have been noted regardless of, which devices are
used” (Bebell & Kay, 2010, p. 13). They went on further to state that “students have
experienced increases in lesson engagement and overall achievement” (Bebell & Kay,
2010, p. 2).
One of the variables that contributes to one-to-one programs producing varying
results is the effectiveness of computer use at home. Community members are concerned
that many students go home with their computers, but they do not have internet access at
home to help support their learning putting them at a disadvantage to those students who
have internet access at home (Kerawalla & Crook, 2002). Schools struggle with
providing wireless service at home for students who are provided computers but do not
have network access. Children spend most of their time playing games that are not
typically found in classrooms (Kerawalla & Crook, 2002). Most students who do have
internet access at home use their computers for unsupervised recreational purposes and
need a parent or guardian to ensure a positive educational impact (Lauman, 2000).
21
Evolution of One-to-One Computers in Schools
Uninterrupted internet access is the precursor to one-to-one, and in recent years,
most school districts have made internet access as common as traditional classroom
supplies. Walderman (2014) stated, “the Internet has become ubiquitous in classrooms
across the nation; almost 100 percent of public schools had access in 2005, up from a
mere 35 percent in 1994” (para. 5). Teacher input and training are also vital aspects of
the one-to-one initiative. Costley (2014) reported in a study conducted in an Arizona
school district “Findings showed that students were engaged during the math lessons
using technology and students were able to discuss what they learned the following day”
(p. 5). DeNisco (2013), who has conducted research in school districts across the United
States reported that teachers have anxiety about technology because it is “something
different and in some cases, the implementation of technology means giving up control to
kids” (p. 1).
Russell, Bebell, and Higgins (2004) conducted a study comparing one-to-one
classrooms to classrooms where the devices were shared among students from a cart of
laptops. This study was conducted in Andover, Massachusetts from 2000 to 2003 in
fourth and fifth grade classrooms. Included in the study were 209 students in nine
different classrooms. There was no research conducted on the effect of the technology on
student achievement; however, they did report differences in the classrooms based on the
ratio of students to laptop computers. For example, they reported that:
The analyses provide evidence that when full versus shared access to laptops is
provided, technology use for a variety of academic purposes increases
significantly. In addition, student engagement increases, the amount of time
22
students spend writing increases, and classroom interactions between students and
teachers change. (Russell et al., 2004, p. 14)
The researchers included information on the differences in instructional practices from
the different classrooms. They reported that “teaching and learning activities differed
substantially in classrooms that are permanently equipped with technology at a 1:1 ratio”
(Russell et al., 2004, p. 14). Dunleavy and Heinecke (2007) supported this when they
reported that “laptop students experienced an increase in individualized learning, as the
laptops allowed teachers to differentiate instruction, individualize pacing, and provide
timely feedback” (p. 17).
The one-to-one initiative is another recent academic approach that has seen
implementation in schools across many industrial countries. Guss (2015) reported that a
teacher in Australia “implemented an early one-to-one initiative with secondary students
in 1989” (p. 1). Guss (2015) reported that in the class trial, computers were given to all
students for one school year; twenty-five years later, the school is a true one-to-one
example, with every student being issued a computer. “In United States classrooms
several one-to-one initiatives were launched in the late 1990s, led by Illinois,
Connecticut, Texas, New Mexico, and California” (Lambert, 2014, p. 4). The first
statewide one-to-one initiative was launched in Maine in 2001 and cost approximately
$120 million. Silvernail (2007) found that after six years into a statewide one-to-one
program, “the Maine Education Policy Research Institute found that more than 80% of
teachers thought that (one-to-one) laptops helped them diversify and individualize
curriculum and instruction” (p. 3).

23
Of all the steps in the 1:1 implementation process, parent and community
resistance can be tough to overcome. Loader reported “pushback from parents in those
early years was remembered” (as cited in Guss, 2015, p. 3). Although parent pushback
has become less of a problem for this initiative as years have passed, community
pushback has become another roadblock in its implementation. The failure of levies and
bonds that increase technology funding through the increased local tax payments has
impeded the development of one-to-one in districts throughout the United States. In New
Albany-Plain School District in Ohio in 2014, “voters defeated a levy that would have
brought wireless technology upgrades” (Bush & Zachariah, 2014, para. 2). In 2014,
District X voters defeated a levy that would have “funded a one-to-one initiative for
district secondary students “(District X, 2014, para. 8). Along with parent and
community pushback to the increased technology education, Heller (2014) argued that
there could well be an eternal juxtaposition between educational reformers and current
educators—this often stops research-based initiatives or changes that focus on
technology.
Public organizations such as public schools move slow, there are many people
involved, and it normally ends with a public vote. (Heller, 2014). Keough’s (2006)
research focused on the “proven educational methods that must accompany technology
integration for true success” (p. 2). The struggle in this process is to make decisions and
implementations with prudence while keeping up with technology and best practices
(Keough, 2005). Heller (2014) reinforced this reality in stating that “this is the hell of
regulatory blockades and referenda and open meetings to which crazy people come to
read bizarre complaints off crumpled notebook paper” (para. 11).
24
Since the early 2000s, educational testing has played an ever-increasing role, as
school districts and their individual schools have been evaluated on student performance
on standardized tests. According to Fullan and Levin (2009), “the majority of school
leaders throughout the United States contended that the one-to-one initiative enhances
student learning” (p. 56). O'Malley, Lewis, and Donehower (2013) conducted a meta-
analysis of iPads used as math learning tools with students on the autism spectrum. In
this study, the researchers reported that new technology that makes one-to-one access
possible “has enormous educational implications because it makes learning portable,
mobile, and accessible” (O’Malley et al., 2013, p. 3). School districts have adopted the
unlimited use of laptops expecting that acquiring full-time access to technology would
improve academic performance and raise standardized test scores (Lambert, 2014).
According to Tomlinson (2005), “differentiated instruction is based on the
premise that instruction should be adapted to the students' different learning styles,
interests, and ability levels” (p. 4). Tomlinson (2005) went on to summarize that
“teachers who use differentiated instruction are expected to show flexibility in the ways
they teach their students and organize their curriculum” (p. 4). Tomlinson (2005) later
found that “in a classroom where differentiated instruction is the foundation of
instructional decisions, teachers adapt their instructional activities and selection of
materials to each student's linguistic and cultural background, academic ability, interests,
and learning style” (p. 5).
Increased student interaction is a goal that many educators strive for through
technology; this is not the only way to personalize instruction. This technology can be
easily implemented in a one-to-one program. Garner et al., (2004) reported in a study

25
involving K-12 special education students that “technology tools such as speech
recognition, verbal feedback, and word prediction could make learning accessible,
allowing students and teachers more opportunities to communicate, conduct
investigations, and develop products” (p. 4).
For example, Bentley (2008) reported from a study sampling middle school
science students that “learning technology such as probes, modeling tools, and
visualization software can extend students learning” (p. 4). In an Ohio district, “teachers
used differentiated instruction in the classroom by prescribing technology-supported
cooperation, which enhanced student achievement” (Cobb, 2010, p. 5). In a study with
8th graders in Cleveland public schools, Cobb (2010) stated that “most important,
significant increases occurred in student achievement for students in the treatment group
who used Internet-based software that differentiated instruction based on student needs
and targeted learning outcomes” (p. 9).
Argueta, Huff, Tingen, and Corn (2011) reported on a meta-analysis from
research conducted in six states that included over 300 school districts and students
enrolled in kindergarten through twelfth grade. Their findings included suggestions for
successful one-to-one program implementations. They reported, “Effective leadership is
fundamental for the successful implementation and sustainability of the initiative, as are
thorough planning, initial and ongoing targeted professional development, buy-in from all
stakeholders, and a robust infrastructure” (Argueta et al., 2011, p. 15). These findings
suggest a dedication of resources from district funds that are in high demand.
The learning curve for school districts that implement the one-to-one initiative is
steep, as it is accompanied by many logistical issues that school officials must learn to

26
manage. Tusch (2012) wrote that a building principal indicated, “The biggest surprise
came when the insurance provider informed us that we had exceeded their allowable
threshold for repair costs, and our coverage was being dropped” (p. 42).
Some schools that have implemented one-to-one initiatives have taken learning
with technology a step further by “flipping” their classrooms. Smith (2012) stated that
since 2012, “30% more K-12 classrooms have adopted the flipped teaching approach,
although middle school and high school teachers are the most likely to use the flipped
classroom technique” (p. 2). Flipping instruction swaps homework time with direct
instruction, meaning students first watch instruction about a topic outside of school
before continuing learning in class (Smith, 2012). Flipping a classroom has been found
to help some schools reduce their failure rates and give teachers more time with students
(Schencker, 2014). Bergmann and Sams (2012) found that in biology classrooms
“because flipping the classroom results in a time shift of direct instruction, students
experience higher levels of achievements and are more engaged than in traditional
classroom settings” (p. 15). The flipped learning model is gaining the attention of
educators who recognize the need to improving student achievement and teacher
effectiveness by leveraging to promote creative learning (Meyer, 2013).
Bruner (1996) theorized that “student learning in technology-centered classrooms
was more likely the result of the constructivist approach to education that these classroom
teachers likely use” (p. 31). Meyer (2013) supported this in a collaborative report
between Project Tomorrow and The Flipped Learning Network, which included data
from 403,000 public schools. Meyer (2013) argued that “the one-to-one initiative, along
with accompanied flipped instruction, does not produce higher learning outcomes; rather,

27
active student engagement is the key to increased student achievement and learning”
(p.1).
The one-to-one initiative has been implemented in various ways. O’Malley et al.
(2013) reported on a one-to-one program in math “where students were only given iPads
with pre-loaded math apps” (p. 8). In general, the one-to-one initiative is executed in one
of two ways: the laptop model or the tablet model, such as a Chromebook or iPad. “In
2013, the Los Angeles Unified School District issued iPads to 2,100 students, but recalled
them the next year and gave schools the choice from among six different devices to
support their one-to-one initiative” (Murphy, 2013, para. 7). Guss (2015) reported that
“the youngest students were provided iPads, older elementary students were provided
notebook computers that were used at school only, and secondary students were provided
with laptops that could be used at school or home” (p. 2).
School districts have many options when considering how to implement a one-to-
one initiative. In addition to laptop and tablet options, desktop computers can be
converted to tablets with a digitizer pen where students can jot notes, draw diagrams, and
flip and erase using a pencil with “palm-rejection technology that prevents hands from
interfering with writing” (Camilleri, Malige, Fujimoto, & Rempel, 2013, p. 1858). Some
of these devices have an enhanced finger-touch sensitivity on multi-touch screens that
allows students to complete applications and forms quickly. One of the reasons it is
difficult to isolate specific success of an implementation plan is that the available
technology is consistently changing. Furthermore, “as educational technology continues
to evolve, our notion of concepts like 1:1 computing will undoubtedly also evolve”

28
(Bebell & O’Dwyer, 2010, p. 13). Researchers are interested in why some studies have
positive results from a one-to-one initiative and some studies do not (Sutton, 2015).
Professional development of the staff is often referenced and studied in literature
as an important aspect of a one-to-one initiative in schools. Bebell and O’Dwyer (2010)
in a meta-analysis of studies related to one-to-one initiatives in secondary public schools
found that “professional development is not only essential but that it should not also just
focus on new instructional skills; instead, it should address teacher beliefs about
instruction itself” (p. 12).
Professional development is a key in one-to-one rollouts. Almost 93% of teachers
in a statewide Maine study believe that technology has a positive effect on
students’ engagement, but 46% say they lack the training needed to use
technology effectively with students. (DeNisco, 2013, p. 1)
Supporting this finding, Sutton (2015) found that professional development, and more
importantly, how it is approached when implementing one-to-one, had the largest impact
on student learning.
Preparing Students for the Future through One-to-One
Preparing and educating students for future jobs is a daunting task that today’s
educators face. Along with this task, many educators disagree on exactly how students
should be taught. One-to-one initiatives have encouraged discussions related to how to
facilitate deep learning instead of encouraging memorization (Towler, 2014).
With this available technology in the classroom, it is easier for teachers to
understand that a sense of meaning is what separates memorization from learning.
Rockman (2007) found that students were more engaged and had better attendance when
29
attending a school with one-to-one laptops. Researchers reported that in addition to
gaining technology skills, one-to-one initiatives improve a student’s ability to effectively
research and share their learning (Harris 2010). Orlin (2013) stated, “When you
memorize a fact, it's arbitrary, interchangeable – it makes no difference to you whether
sine of π/2 is one, zero, or a million, but when you learn a fact, it could be no other way”
(p. 3).
Along with changes in teaching practices, the growth in technology has changed
the skills students need to be successful in the workforce. Sharples et al. (2005) found
while conducting research on adult learning that when successfully implemented and
executed, the one-to-one initiative could support these needed changes and skills. In
classrooms where mobile learning is readily accessible, “the control and management of
learning is distributed across learners, guides, teachers, technologies, and resources in the
world” (Sharples et al., 2005, p. 4). Researchers found that 21st-century skills have
changed the expectations for a school district to provide every student an education that
gets them ready for college and careers (Barron & Darling-Hammond, 2008). The
benefit of a one-to-one laptop environment is reinforced by researchers who report that
“standardized tests are not an ideal metric for evaluating student learning, as these tests
fail to assess the skills and competencies students learn during participation in one-to-one
student laptop programs” (Grimes & Warschauer, 2008, p. 14). Successful educators find
themselves teaching students for unknown careers in the future. For example, “the top 10
“in demand” jobs projected for 2010 did not exist in 2004” (United States Department of
Labor, 2010, p.11).

30
To be college and career ready, students must be proficient in mobile technologies
and be adept at using these technologies to do critical thinking, problem solving,
collaboration, and multimedia research and sharing. Researchers reported that Northern
Virginia seventh graders who were not involved in one-to-one initiatives or did not have
internet access at home might lack the skills they needed to be employable (Attewell &
Battle, 1999). Penuel (2006) found in a meta-analysis of the effects of one-to-one
computing iniatives that
To ensure students are ready for a post-secondary career or college classes, which
includes equitable access to quality learning tools and technologies that enable
students to learn in relevant, real world contexts, many schools are turning to one-
to-one computing initiatives as a solution. (p. 8)
Vockley (2007) reported that employers have begun to expect their applicants will come
to them with the technology skills they need in the workplace. With the one-to-one
initiative, students have access to unlimited technological resources and information
throughout the school day; educators must direct the usage of this technology so that
students will benefit and truly become college and career ready.
Once one-to-one has become a reality in the classroom, neither curriculum nor
pedagogy need to be completely revamped. According to Nagel (2013), “implementing
subtle, technology-based changes to homework resulted in improvements in student
performance on tests” (p. 1). Independent of the technology that is used in a one-to-one
classroom, teachers need to focus on giving quick responsive feedback on assignment
and students opportunities to practice researching and applying knowledge (Nagel, 2013)

31
Implementing technology into a classroom does not mean that technology
becomes a teacher. Battle (1999) found that “students gain less from home computers
since very little educational computing is going on inside the home” (p. 6). The lack of
effective support at home helps demonstrate the importance of effectively implementing
deeper thinking lessons incorporating technology into the classroom. Nagel (2013) also
reported that “because one-to-one initiatives often required teachers to use experimental
teaching approaches into their students’ daily activities” (p. 2), daily lessons may take on
a different approach and feel. Although this shift may make some teachers feel
uncomfortable, “these new approaches are generally more student-centered, and the
approaches allow students to take control of how they engage with a subject and
implement solutions” (Nagel, 2013, p. 2). Mastering the skills of engaging with a subject
and implementing solutions is an imperative skill for students, especially those who are
educationally disadvantaged or those from a low socio-economic background.
A handful of large-scale studies support the effects of technology implementation
in schools, specifically the implementation of the one-to-one initiative. For example, The
One-to-One Institute (2010), “a research initiative linked closely with the one-to-one
institute, which supports one-to-one laptop initiatives in K-12 schools, released a study
about successful implementation models of education technology in October 2010” (para.
2). The One-to-One Institute (2010) reported, “most of the schools that have integrated
laptops and other digital tools into learning are not maximizing those devices in ways that
best make use of their potential” (para. 4). The report goes on to outline the critical steps
needed to capitalize on that potential.

32
However, many researchers do agree that learning through digital devices is a key
component in a student’s success and productivity as an adult. In a paper presented to the
MLearn organization in the United Kingdom, Sharples et al. (2005) reported that there
was a strong need to rethink the future of one-to-one learning because as adults our
students will need to interact and learn from digital devices in their careers and personal
lives. The culture of the learning environment was revealed as technical in nature.
Harris (2010) reported in a study on student outcomes with laptops in California that
“outside of core curriculum learning, students also developed skills in technology usage,
data processing and representation, and higher order thinking” (p. 56).
However, not all researchers found evidence that one-to-one initiatives promoted
the development of college and career readiness. Staib (2011) conducted a study on
student outcomes with laptops in an elementary and middle school in New York. Staib
(2011) found that sixth grade students were not expected to learn in an environment that
was relevant to the real world. Staib (2011) also found that “students were not engaged
in the type of inquiry, collaboration, and public sharing that would be indicative of a Web
2.0 mode of instruction and student centered work” (p. 99).
Argueta et al. (2011) conducted a study analyzing major one-to-one initiatives in
in over 300 school districts in six different states including, Florida, North Carolina,
Michigan, Pennsylvania, Texas, and Virginia. The results of this study indicated findings
related to student outcomes including an increase in attendance, motivation, engagement,
and an overall decrease in discipline (Argueta et al., 2011). The results also supported
the use of technology in classrooms to help students prepare for the future. “Researchers
also report that laptops have facilitated the development of 21st-century skills, digital

33
literacy, creativity and innovation skills, critical thinking and problem-solving skills,
communication and collaboration, and self- directed learning) among students” (Argueta
et al., 2011, p. 15).
The findings of Argueta et al. (2011) have been supported by other researchers.
Staib (2011) reported that “sixth grade students in a one-to-one initiative were engaged in
activities that reflected 21st “century learning using laptops; however, they did not use the
laptops in a modern manner” (p. 100). The current Common Core State Standards
encourage college and career readiness through rigorous academic expectations for all
students (O’Malley et al., 2013). One of the barriers to the benefits of a one-to-one
initiative was reported by Bolkan (2014) who polled 620 K-12 U.S. educators was that
“53% of educators said enough of their students lack internet access at home that they do
not use technology as much as they’d like in the classroom” (p. 2). Accessibility to
network services is an obstacle to a student’s ability to access their curriculum through
digital devices.
Student Achievement in a One-to-One Setting
Since the early 2000s, educational testing has played an increased role measuring
learning in classrooms as school districts and their individual schools have been
evaluated on student performance on standardized tests. According to Fullan and Levin
(2009), most school leaders throughout the United States contended that the one-to-one
initiative enhanced student learning. However, a wealth of discussion regarding the value
and impact of one-to-one initiatives on student academic achievement exists. There is
much more to the success of a one-to-one initiative than simply providing the
infrastructure and a device to each student. (Lemke, Coughlin, & Reifsneider, 2009).

34
Included in this section is a discussion of student achievement in a one-to-one setting; it
is divided into two parts. The first part focuses on evidence that does not support student
achievement in a one-to-one setting. The second part focuses on evidence that does
support student achievement in a one to one setting.
Evidence that does not support student achievement in a one-to-one setting.
Academic achievement with technology has been researched for many years. Jacklin and
Maccoby (1974) concluded in a study of California public schools through Stanford
University that “there were gender differences in math ability that favored males” as
measured by teacher created tests (p. 13). Researchers have found a wide range of results
regarding mathematics achievement, ELA achievement, SES, race, gender, and one-to-
one initiatives. Some of the research has reported improved student achievement;
however, results are mixed and inconsistent.
Attewell and Battle (1999) collected data from the National Educational
Longitudinal Study (NELS) to determine whether eighth grade students with computer
use in the classrooms and at home improved their academic achievement on mathematics
and reading local assessments compared to students without computer access regardless
of gender, SES, or race. The researchers reported that the less financially stable a student
home environment was, the less impact a one-to-one initiative had on their academic
success (Attewell & Battle, 1999). Educators have raised concerns about the potential for
a one-to-one initiative to widen the achievement gap between social classes. Attewell
and Battle (1999) indicated in their study conducted with 18,000 eighth grade students
from Pennsylvania, “The concern is that students who live in conditions without the
35
means to pay for internet access will fall farther behind those students that can afford
internet access” (p. 1).
Similar student achievement results have been reported in other studies. Lewis
(2004) reported that sixth grade Florida students in a one-to-one initiative “did not make
significant academic achievement in reading or math on district level assessments when
compared to students that were not in a one-to-one initiative” (p. 2). In another study,
Dunleavy and Heinecke (2007) found that mid-Atlantic state middle school students in a
one-to-one initiative “demonstrated no significant program effects for math achievement”
on state standardized tests when compared to students that were not a part of the one-to-
one initiative (p. 1). Dunleavy and Heinecke (2007) reported in their study of 972 at-risk
middle school science and math students, that “there was a clear gender effect in science
between girls and boys in a one-to-one initiative with boys significantly outperforming
girls in academic achievement in science as measured by the state standardized test” (p.
9).
Some of the results of the one-to-one studies have shown mixed or minimal
results in academic improvement. In a comprehensive study of the effects of a one-to-
one initiative, researchers found that there was no significant impact on any student test
score from the implementation of a one-to-one program (O’Dwyer, Russell, Bebell, and
Seeley, 2008). This finding was based on student achievement in mathematics on the
Massachusetts Comprehensive Assessment System. They studied 986 students from 55
fourth grade classrooms in 25 schools across nine school districts in the state
Massachusetts. In California, Grimes and Warschauer (2008) found similar results when
they reported that “high school students in a one-to-one laptop environment experienced

36
minimal increase in math scores and decreased English/Language Arts scores on
California state assessments” (p. 308).
The research regarding effects of student gender on academic achievement has
been conflicting. Chiu, Chow & McBride-Chang (2007) found that sixth grade girls
outscored sixth grade males in reading achievement. A study focused on reading
achievement reaped different results. Wade (2010) found that California suburban high
schools’ students demonstrated no statically significant difference between girls and boys
in a one-to-one initiative when compared to the grade point average of students that were
not in a one-to-one initiative (p. 26). These two studies were, however, measuring
students at different grade levels and using different measurements for academic success.
Researchers have reported supporting results on the lack of student achievement
in ELA in a one-to-one environment. In a study that included more than 1,000 Virginian
elementary students, Bryan (2011) reported that no significant gains were made in
reading fluency by students in a one-to-one environment as measured by the Reading
Curriculum-Based Measurement. Walters (2012) reported that fourth and fifth grade
students “produced little to no difference in language arts achievement on the California
Standards Reading Test between students in a one-to-one laptop environment and
students not in a one-to-one laptop environment” (p. 140). Also, Walters (2012) found
that there was little to moderate effect on Hispanic ELL students from Southern
California on California Standards Reading Test in response to a one-to-one initiative.
Research has been conducted on the effect of one-to-one on student achievement
related to gender. Dennis (2014) reported in a meta-analysis including over 19,000 North
Carolina high schools that “students in one-to-one high schools did not benefit from one-

37
to-one laptop initiatives in Algebra I and English I courses” (p. 75). Dennis (2014) found
that the co-variables in this study of SES, gender, and ethnicity were not predictors of the
effect on these students being in a one-to-one initiative (p. 75).
Kulow (2014) found that “elementary students in a one-to-one initiative using
Chromebooks made gains on teacher created unit assessments that were equal to or not
significantly different from elementary students that were not in a one-to-one initiative”
(p. 108). Later, Clark (2015) reported that there was “no significant difference in
mathematical performance on teacher created unit tests” (p. 62) in 42 Texas Algebra high
school students before and after the implementation of a one-to-one program. These
findings could be used as evidence against implementing or expanding one-to-one
programs.
Evidence that does support student achievement in a one-to-one setting.
Many schools have implemented successful one-to-one programs. These examples are
strong statements related to the potential of digital devices in the classroom in the face of
mixed results. Many researchers have reported positive results on student achievement.
Attewell and Battle (1999) conducted research in elementary classrooms in New York
City that produced positive results on student achievement in schools with 94% or more
of the students qualifying for free or reduced lunch. This study on educational equity and
the impact of digital devices provided more information on the impact of one-to-one and
low SES students. The researchers found that “the higher a student’s SES the larger the
educational payoff was present from having been a part of a one-to-one initiative”
(Attewell & Battle, 1999, p. 6). Additionally, Owston and Wideman (2001), in a study
that was conducted with middle school students in California school districts, “found that

38
students in a one-to-one laptop environment scored higher and showed a greater amount
of improvement on the writing subtest of the California Test of Basic Skills than did non-
laptop students” (p. 439).
As mathematics teachers have been working to improve student learning,
incorporating powerful handheld 1:1 technologies with game-based learning applications
like the iPad might be used to “guide students to exploration, discovery, practice,
appreciation, and wonder,” which may lead to increased achievement (Goddard, 2002, p.
26). The use of laptops as a one-to-one device has been found to improve student
learning as measured by standardized tests in mathematics and writing and increase
student motivation as well as student collaboration (Mouza, 2008). Some of the research
conducted on the use of one-to-one as a learning environment has reported positive
student attitudes towards their learning. Russell et al., (2004) reported, “Students in the
1:1 classrooms viewed laptop computers as their primary writing tool” (p. 322). The
researchers also reported that students experienced “nearly universal use of technology
for writing” (p. 313).
Similar studies reported positive results specifically related to student
achievement. Gulek and Demirtas (2005) conducted a study in Harvest Park Middle
School in California. They compared 259 sixth, seventh, and eighth grade students in a
one-to-one environment to 834 students not in a one-to-one environment. Their results
“indicate that laptop enrollment has a significant effect on mathematics and language
scores (Gulek and Demirtas, 2005, p. 21). These results were based on student grade
point averages and performance on California standardized state assessments.
“Numerous academic studies have shown the significant positive correlation between

39
technology, student learning, and mathematics achievement” (Berk, 2010, p. 2). In a
Texas school district, high school students use of laptops for learning was the strongest
indicator of academic improvement on reading and mathematics test scores (Bebell &
O’Dwyer, 2010). Additional studies were conducted that reinforced these results.
Researchers have reported positive findings with low SES students. Harris (2010)
reported that “for the most part, the literature has failed to take into account the influence
of the material conditions of low SES students and the presence or lack of entry skills and
behaviors” (p. 64). Harris’s study, conducted in Chavez high school in Southern
California, was conducted to compare low SES students to high SES students in a one-to-
one laptop environment. Harris (2010) concluded that “laptops affected low SES
students in the areas of academic and non-academic learning to a higher degree than their
non-low SES peers” (p. 165). This study focused on the potential of one-to-one to
minimize the achievement gap between students divided by social class.
Some specific content areas appear to researchers as being more difficult for
teachers to implement technology than are other areas. Bebell and O’Dwyer (2010)
found in a study of one-to-one Texas classrooms that “technology was used somewhat
less frequently for math and science than for English language arts and social studies” (p.
8). Other content areas with strong web-based curricular ties, such as journalism or
Project Lead the Way (PLTW), promote the use of computers in the classrooms.
However, researchers have reported favorable results when this technology is pushed into
a classroom. Mills (2010) found in rural Minnesota high schools that “there was an
increase of student achievement by students participating in one-to-one laptop programs”

40
(p. 104). These findings were based on “high school student performance on state
comprehensive exams and cumulative grade point averages” (Mills, 2010, p. 102).
One-to-one initiatives have reported favorable results on standardized
assessments. Sixth through eighth grade students in 21 different schools participating in
the second year of a one-to-one program produced statistically significant gains on ELA
state assessment scores compared to those students that were not in one-to-one the
previous year on the same test (Shapley, Sheehan, Maloney, & Caranikas-Walker, 2010).
Argueta et al. (2011) conducted research spanning over six states and more than 300
school districts. They found “that using laptops in the writing process had a long-term
positive effect on students’ writing skills, helping them become better writers in general,
and not just helping them write better when they used the laptops” (Argueta et al., 2011,
p. 8). These researchers continued that “teachers and students in some implementing
states believe that the use of laptops positively impacts student achievement, but only
some analyses of test scores support this belief” (p. 8). This research related to student
ELA academic achievement was supported by research conducted in Taiwan. Huang,
Liang, & Chiu, (2013) found the 23 sixth grade Taiwanese students in their study who
used electronic devices in a one-to-one environment for reading “made a significant
improvement in their reading comprehension” as measured by standardized assessments
(p. 105).
Similar results were reported in studies conducted with students of varying grade
levels. Brummel, Greer, Jackson, and Pollet (2013) conducted a study in 53 New York
elementary schools measuring the effect of Computer Supported Collaborative Learning
(CSCL).) Statistically significant academic gains were found in these elementary

41
students using CSCL in mathematics as measured by CSCL assessments (Brummel et al.,
2013). The researcher reported that “girls outperformed boys in a one-to-one initiative
for mathematics” (Brummel et al., p. 101). Gender differences were also demonstrated in
Cottone’s (2013) study where fourth, fifth, and sixth grade girls “outperformed boy’s
academic achievement in math and reading in a one-to-one initiative” (p. 2). In addition,
the researcher found that lower SES students in fourth, fifth, and sixth, grade classes in a
one-to-one initiate produced academic gains in math and reading when compared to high
SES students in the same one-to-one initiative” (Cottone, 2013, p. 2). These findings are
encouraging for educators looking for ways to help students in low SES situations.
Cottone (2013) found that in general, these Mooresville North Carolina fourth, fifth, and
sixth grade students in the one-to-one study made significant gains in math but not in
reading academic achievement when measured by state assessments. Additionally,
Cottone (2013) reported that Black fourth, fifth, and sixth grade students in a one-to-one
initiative made significant academic gains in math and reading.
Some researchers have reported on the benefit of increased web access through
student achievement in one-to-one programs. O'Malley et al. (2013) reported new
technology makes one-to-one access possible and “has enormous educational
implications because it makes learning portable, mobile, and accessible” (p. 3).
Furthermore, Lebo (2014) found in a student survey of 330 Iowa high schools, that “the
implementation of a one-to-one laptop initiative had a positive impact on high school
student’s commitment to learning” (p. 70). According to Casey (2014), the effect of
computer usage in classrooms on the academic achievement of non-White students has
had a narrow margin of difference. With the implementation of one-to-one iPads, the

42
Charleston County School District reported gains in reading among fifth and eighth grade
Hispanic students and those who speak English as a second language. The researcher
also found significant math gains among Black, Hispanic, and English Language
Learners (ELL). These results are encouraging to school districts with large populations
of minority and ELL students.
Lambert (2014) conducted a statewide study on middle school mathematics
students’ results in South Carolina. To improve student success on standardized test
scores, school districts have adopted the unlimited access to laptops for students
(Lambert, 2014). Later, in 2015, a meta-analysis was conducted that included 40 studies
worldwide investigating the effects of a computer-based environment on students’
learning outcomes. The results showed that there was a positive effect on student
achievement in mathematics, while there was not a significant effect on other areas such
as social science, language, and science (Van der Kleij, Feskens, & Eggen, 2015).
One-to-one programs with iPads are reporting similar results to those with laptop
computers. In a study with fourth grade students, Zhang, Trussell, Gallegos, and Asam
(2015) reported results that showed statistically significant improvement for students in a
one-to-one environment that used math applications on their iPads as measured by
classroom teacher pre- and post-tests. Moreover, these researchers reported that “of the
800 students, 90% were Hispanic, students in a one-to-one environment achieved
significant academic gains” on teacher-generated assessments (p. 2).
Some international studies produce the same favorable results. Warschauer and
Zheng (2016) conducted a meta-analysis of 96 studies worldwide. Warschauer and
Zheng (2016) found students’ test scores in science, writing, mathematics, and English

43
language arts improved significantly. Ozerbas and Erdogan (2016) reported from a study
conducted with 58 seventh grade students in Ankara, Turkey “the academic success level
of the students in the experimental group, who learn mathematics in a digital classroom,
is higher than the academic success of students in the control group, who learn in the
classroom without any digital technologies” (p. 208). The researchers continued, “it can
be interpreted that using digital classrooms is a significant factor in increasing students’
academic success” (Erdogan & Ozerbas p. 208). These results are favorable for schools
hoping to expand one-to-one programs for their students.
Summary
This review of the literature included the history of digital devices in the
classrooms, the evolution of one-to-one computer classroom environments, preparing
students for the future through one-to-one computers, and student achievement with one-
to-one initiatives. The results of the research were mixed. As schools and communities
evaluate their inclusion of digital devices in the classroom, it will be important for
educators to monitor closely the effect these devices have on the academic achievement
of the students. Chapter three includes the research design, selection of the participants,
data collection procedures, data analysis and hypothesis testing, and the limitations of the
study.

44
Chapter Three
Methods
The purpose of this study was to determine whether District X students who
participated in a one-to-one laptop initiative during the 2011- 2013 school years achieved
at higher levels on the MAP ELA and mathematics assessment than did students who did
not participate in the one-to-one initiative and whether student gender, race, or SES
affected those differences. An additional purpose was to determine whether there was a
difference in MAP ELA and mathematics growth from fourth grade to fifth grade
between fifth grade students who participated in the one-to-one laptop initiative and fifth
grade students who did not participate in this initiative and whether those differences
were affected by student gender, race, or SES. Included in this chapter are the research
design and the procedures used to address the research questions. The selection of
participants, measurement, data collection procedures, data analyses and hypothesis
testing, and limitations of this study are presented as well.
Research Design
This quantitative study utilized a quasi-experimental design. This design was
chosen because, in this study, the researcher investigated the effectiveness of a one-to-
one initiative when comparing groups with and without the one-to-one learning
environment using archival data. The dependent variables were the MAP ELA and
mathematics assessment scores for fourth grade students during the 2011-2012 school
year and fifth grade students during the 2012-2013 school year. The independent
variables were participation in the one-to-one program, student gender, student SES, and
student race.

45
Selection of Participants
The population under examination was fourth and fifth grade students attending
District X. The sample included those students who were enrolled in fourth grade during
the 2011-2012 school year and fifth grade during the 2012-2013 school year. The sample
included students who enrolled in regular education classes in mathematics and ELA for
the established grades and had demographic information available for the study.
This study used a non-random purposive sampling procedure, which is defined by
Lunenburg and Irby (2008) as a sample selection process utilized by the researcher based
on “knowledge of the experience of the group to be sampled” (p. 175). The students
must have registered a fifth grade MAP score in District X during the 2012-2013 school
year to be included in the sample data that was used to address RQ1-RQ8. The students
must also have registered a fourth grade MAP score in District X during the 2011-2012
school year to be included in the sample data that was used to address RQ5-RQ8.
Measurement
The instruments used in this study were the MAP ELA and mathematics
assessments. Per DESE (2014), both the ELA and mathematics assessments consist of 52
questions (p. 4). The MAP assessment provides useful information regarding academic
achievement and progress. The District X aligns its curriculum with the state standards,
and the MAP assesses these standards.
As described in the Spring 2009 Guide to Interpreting Results, published by
DESE (2009b), the ELA portion of the MAP is administered to all students in third
through tenth grades during the spring of each school year. Three types of questions
appear on the test: selected-response, constructed-response, and performance events
46
(DESE, 2009b). Selected-response items provide three to five possible responses for
student selection. Constructed-response items require students to compose their own
response to an open-ended question. Within the English language arts portion of the test,
a writing performance event, or essay, is also administered (DESE, 2009b). All students
must respond to a process-oriented writing prompt to demonstrate proficiency in writing
(DESE, 2009b).
As indicated in the 2009 MAP technical report, the English language arts
assessment includes three styles of questions: selected-response, constructed-response,
and performance event. Selected-response items, also known as multiple choice, each
included a question along with three to five response options. Constructed-response
items require the students to provide an appropriate response with work to support the
solution. DESE (2007) reported that performance events require students to use higher
level thinking to solve problems that are more difficult and often allow more than one
approach to solving the problem.
The use of the MAP offers a non-intrusive benefit to students and staff as it is
administered annually and is an ingrained part of the assessment process in the District X.
District officials already use MAP data as the basis for measuring staff and administrative
effectiveness. Academic services make instructional decisions based on MAP scores and
MAP performance indicators such as Acuity scores (DESE, 2007).
The state of Missouri provides clear descriptions of the student MAP scores. Per
the Guide to Interpreting Results (Missouri DESE, 2009b), the resulting achievement
indicator, a single scale score, represents the number of correct responses earned by a
student. These scale scores are placed in a continuum from third to tenth grade, which

47
provides a longitudinal perspective regarding a student’s academic growth during this
period. Because of this, scale scores within an academic discipline may be compared
from one grade to the next and analyzed. Student performance on the MAP test is
reported as one of the following achievement levels: below basic, basic, proficient, or
advanced. The “levels describe a pathway to proficiency. Each achievement level
represents standards of performance for each assessed content area” (DESE, 2007 p. 4).
In addition to the achievement level, a student’s achievement is also reported as a scale
score indicating a student’s total performance in the specific content area.
DESE released a report of what is covered on each test in partnership with
McGraw-Hill. The mathematics exams are described as “students in Missouri public
schools will acquire a solid foundation that includes knowledge of number and
operations, algebraic relationships, geometric and spatial relationships, measurement, and
data and probability” (DESE, 2009b, p. 2). The ELA exams are described as “students in
Missouri public schools will acquire a solid foundation that includes knowledge of and
proficiency in” speaking and writing Standard English, reading comprehension, formal
and informal writing, evaluation and interpretation, and a broad understanding of
language and culture (DESE, 2009b p. 2).
Seven variables are identified in the research questions: fifth grade MAP
mathematics scores (RQ1, RQ2), fifth grade MAP ELA scores (RQ3, RQ4), fourth and
fifth grade MAP mathematics scores (RQ5, RQ6), fourth and fifth grade MAP ELA
scores (RQ7, RQ8), gender (RQ2, RQ4, RQ6, RQ8), race (RQ2, RQ4, RQ6, RQ8), and
SES (RQ2, RQ4, RQ6, RQ8). The following paragraphs address the measurement of
each variable.
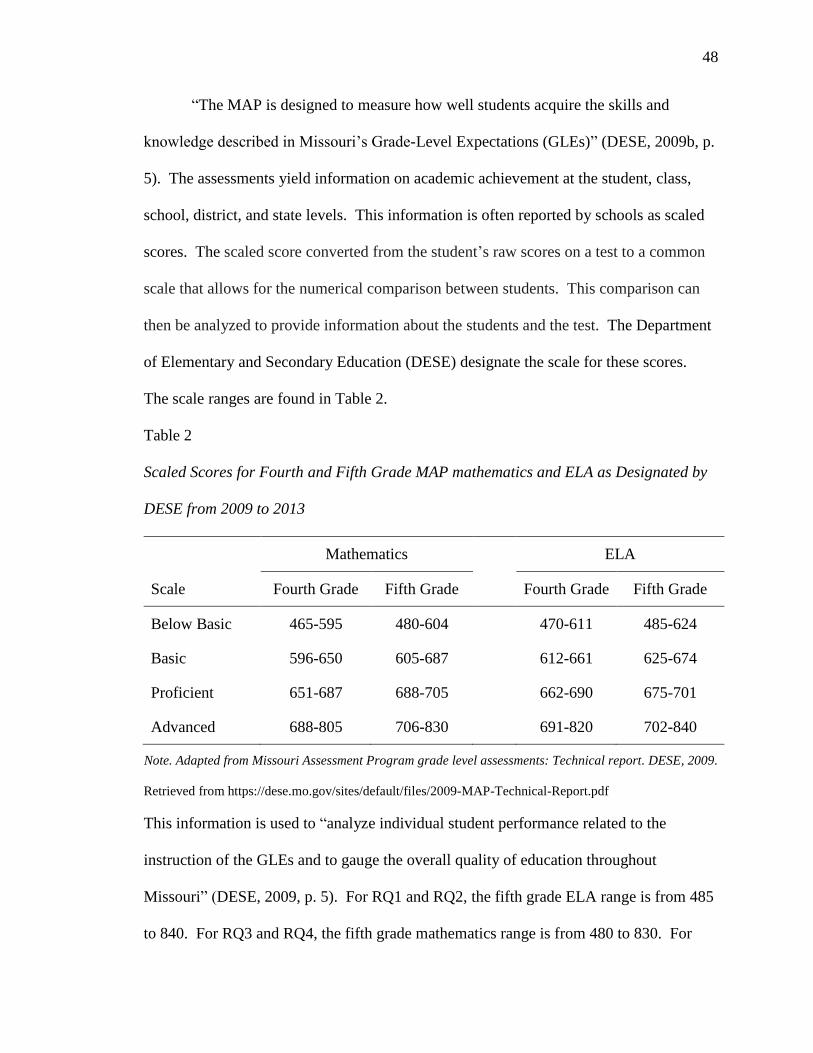
48
“The MAP is designed to measure how well students acquire the skills and
knowledge described in Missouri’s Grade-Level Expectations (GLEs)” (DESE, 2009b, p.
5). The assessments yield information on academic achievement at the student, class,
school, district, and state levels. This information is often reported by schools as scaled
scores. The scaled score converted from the student’s raw scores on a test to a common
scale that allows for the numerical comparison between students. This comparison can
then be analyzed to provide information about the students and the test. The Department
of Elementary and Secondary Education (DESE) designate the scale for these scores.
The scale ranges are found in Table 2.
Table 2
Scaled Scores for Fourth and Fifth Grade MAP mathematics and ELA as Designated by
DESE from 2009 to 2013
Mathematics ELA
Scale Fourth Grade Fifth Grade Fourth Grade Fifth Grade
Below Basic 465-595 480-604 470-611 485-624
Basic 596-650 605-687 612-661 625-674
Proficient 651-687 688-705 662-690 675-701
Advanced 688-805 706-830 691-820 702-840
Note. Adapted from Missouri Assessment Program grade level assessments: Technical report. DESE, 2009.
Retrieved from https://dese.mo.gov/sites/default/files/2009-MAP-Technical-Report.pdf
This information is used to “analyze individual student performance related to the
instruction of the GLEs and to gauge the overall quality of education throughout
Missouri” (DESE, 2009, p. 5). For RQ1 and RQ2, the fifth grade ELA range is from 485
to 840. For RQ3 and RQ4, the fifth grade mathematics range is from 480 to 830. For

49
RQ5 and RQ6 the possible growth in ELA was from 465 to 830. For RQ7 and RQ8, the
possible growth in mathematics is between 470 and 840. Thus, it is an appropriate and
effective measurement for the purpose outlined in this study.
Validity and reliability are important components of a good assessment
instrument. Roberts (2010) defined validity as “the degree to which the instrument truly
measures what it purports to measure” and reliability as “the degree to which the
instrument consistently measures something from one time to another” (p. 151). Roberts
(2010) further defined reliability as “the degree to which the instrument consistently
measures something from one time to another” (p. 151). In 2009, DESE published a
technical report regarding the validity and reliability of MAP test scores. Regarding
validity, DESE reported, “validity is an overarching component of the MAP testing
program” (DESE, 2009a, p. 4). The purpose of an assessment is crucial to understand
whether a test score is being utilized properly. DESE conducts internal evaluations of
their assessments to improve the quality of the assessments. No test provides a perfect
assessment of a student’s ability; thus, all tests have a known standard error of
measurement (SEM), which “reports the amount of variability that can be expected in a
student’s test score due to the inherent imprecision of the test” (DESE, 2009b). The
process of validating assessment results is ongoing. DESE continues to conduct validity
studies on MAP assessments and confirm meaning into results by adhering to industry
standards during test-development stages (DESE 2009b).
Reliability of the MAP scores was evaluated using Cronbach’s alpha coefficients
by DESE. “The closer the coefficient is to 1, the more consistent are the scores” (DESE,
2009a, p. 136). In 2009, DESE and CTB/McGraw-Hill published a technical report
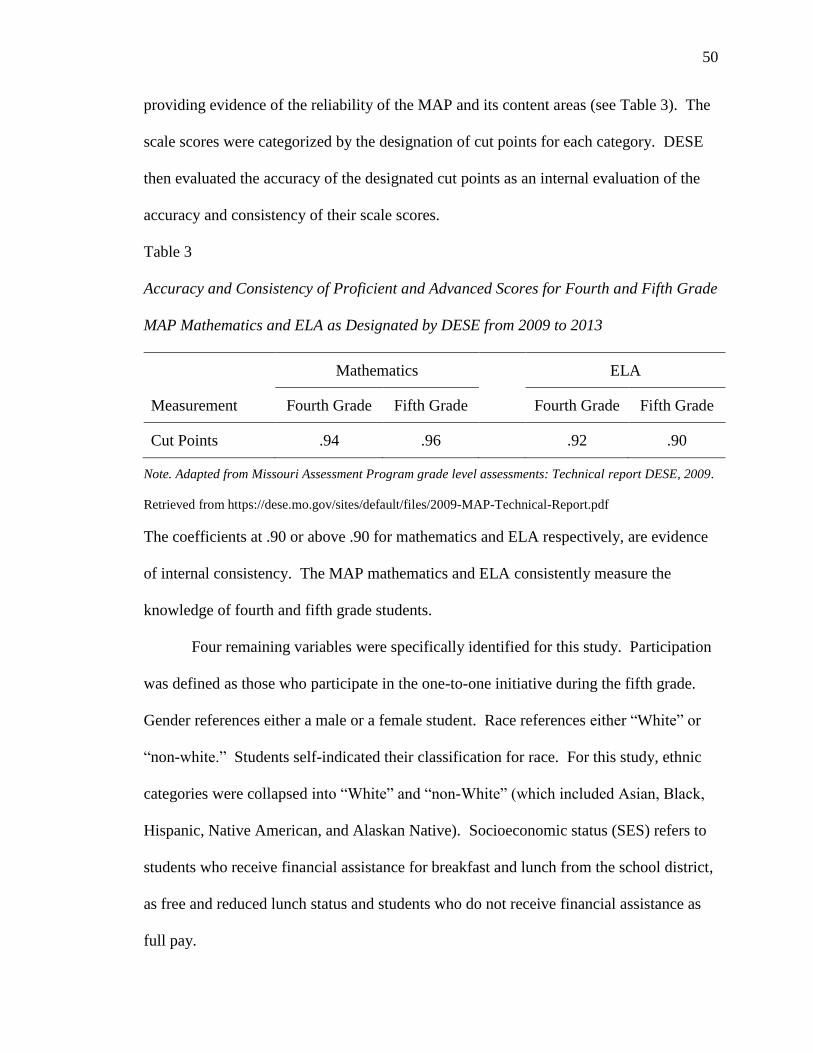
50
providing evidence of the reliability of the MAP and its content areas (see Table 3). The
scale scores were categorized by the designation of cut points for each category. DESE
then evaluated the accuracy of the designated cut points as an internal evaluation of the
accuracy and consistency of their scale scores.
Table 3
Accuracy and Consistency of Proficient and Advanced Scores for Fourth and Fifth Grade
MAP Mathematics and ELA as Designated by DESE from 2009 to 2013
Mathematics ELA
Measurement Fourth Grade Fifth Grade Fourth Grade Fifth Grade
Cut Points .94 .96 .92 .90
Note. Adapted from Missouri Assessment Program grade level assessments: Technical report DESE, 2009.
Retrieved from https://dese.mo.gov/sites/default/files/2009-MAP-Technical-Report.pdf
The coefficients at .90 or above .90 for mathematics and ELA respectively, are evidence
of internal consistency. The MAP mathematics and ELA consistently measure the
knowledge of fourth and fifth grade students.
Four remaining variables were specifically identified for this study. Participation
was defined as those who participate in the one-to-one initiative during the fifth grade.
Gender references either a male or a female student. Race references either “White” or
“non-white.” Students self-indicated their classification for race. For this study, ethnic
categories were collapsed into “White” and “non-White” (which included Asian, Black,
Hispanic, Native American, and Alaskan Native). Socioeconomic status (SES) refers to
students who receive financial assistance for breakfast and lunch from the school district,
as free and reduced lunch status and students who do not receive financial assistance as
full pay.
51
Data Collection Procedures
Before the data was collected, the designated forms to request permission to
conduct research in District X were completed. This request was granted by the Director
of Research, Evaluation, and Assessment (REA) on April 15, 2014 (see Appendix A).
Once approved on July 1, 2015, clear guidelines regarding data sets and coding process
were discussed with the district’s Director of REA. A similar request was submitted to
the Baker University Institutional Review Board seeking approval from the university to
conduct this study (see Appendix B). A renewal request was made to the Baker
University Institutional Review Board was submitted and approved on October 27, 2016
(see Appendix C). The Director of REA harvested historical data sets from 2011-2012
and 2012-2013. The researcher then contacted each fourth and fifth grade school
principal in District X to make them aware of this study via email, and an offer to share
the results of the study with building principals was made. Then, the researcher offered
to share the findings of the study with principals of District X. Random student numbers
were generated and attached to data by a computer technologist. All data were merged
into a Microsoft Excel workbook by a district computer technologist. This information
included student gender, race, SES, MAP ELA scale scores, and MAP mathematics
scores from each of the assessments from 2011-2012 and 2012-2013. Once the data were
merged, it was imported into IBM SPSS® Statistics Faculty Pack 24 for Windows for
analysis.
Data Analysis and Hypothesis Testing
Eight research questions were posed. These questions were selected to determine
to what extent there was a difference between student achievement on the MAP and one-

52
to-one computer implementation. The research questions provide the basis for the data
analysis. The hypotheses, listed after each relevant research question, were tested for
statistically significant differences.
RQ1. To what extent is there a difference in fifth grade student achievement on
the MAP ELA assessment between students who participated in the one-to-one laptop
initiative and students who did not participate in the initiative during the 2012-2013
school year?
H1. There is a statistically significant difference in fifth grade student
achievement on the MAP ELA assessment between students who participated in the one-
to-one laptop initiative and students who did not participate in the initiative during the
2012-2013 school year.
The first two-factor analysis of variance (ANOVA) was conducted to test H1 and
H2. The two categorical variables used to group the dependent variable, fifth grade
student achievement on the MAP ELA assessment, were students’ participation in the
one-to-one laptop initiative during the 2012-2013 school year and student gender. The
two-factor ANOVA can be used to test three hypotheses including a main effect for
students’ participation in the one-to-one laptop initiative, a main effect for student
gender, and a two-way interaction effect (student participation in the one-to-one laptop
initiative x student gender). The main effect for student participation in the one-to-one
laptop initiative was used to test H1. The level of significance was set at .05.
RQ2. To what extent is the difference in fifth grade student achievement on the
MAP ELA assessment between students who participated in the one-to-one laptop

53
initiative and students who did not participate in the initiative during the 2012-2013
school year affected by one if the following variables: student gender, race, or SES?
H2. The difference in fifth grade student achievement on the MAP ELA
assessment between students who participated in the one-to-one laptop initiative and
students who did not participate in the initiative during the 2012-2013 school year is
affected by student gender.
The interaction effect (student participation in the one-to-one laptop initiative x
student gender) from the first ANOVA was used to test H2. The level of significance
was set at .05.
H3. The difference in fifth grade student achievement on the MAP ELA
assessment between students who did participate in the one-to-one laptop initiative
during the 2012-2013 school year and students who did not participate in the initiative is
affected by student race.
A second two-factor ANOVA was conducted to test H3. The two categorical
variables used to group the dependent variable, fifth grade student achievement on the
MAP ELA assessment, were students’ participation in the one-to-one laptop initiative
during the 2012-2013 school year and student race. The two-factor ANOVA can be used
to test three hypotheses including a main effect for students’ participation in the one-to-
one laptop initiative, a main effect for student race, and a two-way interaction effect. The
interaction effect (student participation in the one-to-one laptop initiative x student race)
was used to test H3. The level of significance was set at .05.
H4. The difference in fifth grade student achievement on the MAP ELA
assessment between students who did participate in the one-to-one laptop initiative and

54
students who did not participate in the initiative is affected by student SES during the
2012-2013 school year.
A third two-factor ANOVA was conducted to test H4. The two categorical
variables used to group the dependent variable name variable, fifth grade student
achievement on the MAP ELA assessment, were students’ participation in the one-to-one
laptop initiative during the 2012-2013 school year and student SES. The two-factor
ANOVA can be used to test three hypotheses including a main effect for students’
participation in the one-to-one laptop initiative, a main effect for student SES, and a two-
way interaction effect. The interaction effect (student participation in the one-to-one
laptop initiative x student SES) was used to test H4. The level of significance was set at
.05.
RQ3. To what extent is there a difference in fifth grade student achievement on
the MAP mathematics assessment between students who participated in the one-to-one
initiative and students who did not participate in the initiative during the 2012-2013
school year?
H5. There is a statistically significant difference in fifth grade student
achievement on the MAP mathematics assessment between students who participated in
the one-to-one laptop initiative and students who did not participate in the initiative
during the 2012-2013 school year.
A fourth two-factor ANOVA was conducted to test H5 and H6. The two
categorical variables used to group the dependent variable, fifth grade student
achievement on the MAP mathematics assessment, were students’ participation in the
one-to-one laptop initiative during the 2012-2013 school year and student gender. The

55
two-factor ANOVA can be used to test three hypotheses including a main effect for
students’ participation in the one-to-one laptop initiative, a main effect for student
gender, and a two-way interaction effect (student participation in the one-to-one laptop
initiative x student gender). The main effect for student participation in the one-to-one
laptop initiative was used to test H5. The level of significance was set at .05.
RQ4. To what extent is the difference in fifth grade student achievement on the
MAP mathematics assessment between students who participated in the one-to-one
laptop initiative and students who did not participate in the initiative during the 2012-
2013 school year affected by one if the following variables: student gender, race, or
SES?
H6. The difference in fifth grade student achievement on the MAP mathematics
assessment between students who did participate in the one-to-one laptop initiative
during the 2012-2013 school year and students who did not participate in the initiative is
affected by student gender.
The interaction effect (student participation in the one-to-one laptop initiative x
student gender) from the fourth ANOVA was used to test H6. The level of significance
was set at .05.
H7. The difference in fifth grade student achievement on the MAP mathematics
assessment between students who did participate in the one-to-one laptop initiative
during the 2012-2013 school year and students who did not participate in the initiative is
affected by student race.
A fifth two-factor ANOVA was conducted to test H7. The two categorical
variables used to group the dependent variable, fifth grade student achievement on the

56
MAP mathematics assessment, were students’ participation in the one-to-one laptop
initiative during the 2012-2013 school year and student race. The two-factor ANOVA
can be used to test three hypotheses including a main effect for students’ participation in
the one-to-one laptop initiative, a main effect for student race, and a two-way interaction
effect. The interaction effect (student participation in the one-to-one laptop initiative x
student race) was used to test H7. The level of significance was set at .05.
H8. The statistically significant difference in fifth grade student achievement on
the MAP mathematics assessment between students who did participate the one-to-one
laptop initiative and students who did not participate in the initiative during the 2012-
2013 school year is affected by student SES.
A sixth two-factor ANOVA was conducted to test H8. The two categorical
variables used to group the dependent variable, fifth grade student achievement on the
MAP mathematics assessment, were students’ participation in the one-to-one laptop
initiative during the 2012-2013 school year and student SES. The two-factor ANOVA
can be used to test three hypotheses including a main effect for students’ participation in
the one-to-one laptop initiative, a main effect for student SES, and a two-way interaction
effect. The interaction effect (student participation in the one-to-one laptop initiative x
student SES) was used to test H8. The level of significance was set at .05.
RQ5. To what extent is there a difference in ELA growth, as measured by a
difference between the fourth (2011-2012) and fifth grade (2012-2013) scale score on the
MAP ELA assessment, between fifth grade students who participated in the one-to-one
laptop initiative and fifth grade students who did not participate in the initiative during
the 2012-2013 school year?
57
H9. There is a difference in ELA growth, as measured by a difference between
the fourth (2011-2012) and fifth grade (2012-2013) scale score on the MAP ELA
assessment, between fifth grade students who participated in the one-to-one laptop
initiative and fifth grade students who did not participate in the initiative during the 2012-
2013 school year.
A seventh two-factor ANOVA was conducted to test H9 and H10. The two
categorical variables used to group the dependent variable, ELA growth, as measured by
a difference between the fourth (2011-2012) and fifth grade (2012-2013) scale score on
the MAP ELA assessment, were students’ participation in the one-to-one laptop initiative
during the 2012-2013 school year and student gender. The two-factor ANOVA can be
used to test three hypotheses including a main effect for students’ participation in the
one-to-one laptop initiative, a main effect for student gender, and a two-way interaction
effect (student participation in the one-to-one laptop initiative x student gender).
The main effect for student participation in the one-to-one laptop initiative was used to
test H9. The level of significance was set at .05.
RQ6. To what extent is the difference in ELA growth, as measured by a
difference between the fourth (2011-2012) and fifth grade (2012-2013) scale score on the
MAP ELA assessment, between fifth grade students who participated in the one-to-one
laptop initiative and fifth grade students who did not participate in the initiative during
the 2012-2013 school year affected by one if the following variables: student gender,
race, or SES?
H10. The difference in ELA growth, as measured by a difference between the
fourth (2011-2012) and fifth grade (2012-2013) scale score on the MAP ELA assessment,

58
between fifth grade students who participated in the one-to-one laptop initiative and fifth
grade students who did not participate in the initiative during the 2012-2013 school year
is affected by student gender.
The interaction effect (student participation in the one-to-one laptop initiative x
student gender) from the seventh ANOVA was used to test H10. The level of
significance was set at .05.
H11. The difference in ELA growth, as measured by a difference between the
fourth (2011-2012) and fifth grade (2012-2013) scale score on the MAP ELA assessment,
between fifth grade students who participated in the one-to-one laptop initiative and fifth
grade students who did not participate in the initiative during the 2012-2013 school year
is affected by student race.
An eighth two-factor ANOVA was conducted to test H11. The two categorical
variables used to group the dependent variable, ELA growth, as measured by a difference
between the fourth (2011-2012) and fifth grade (2012-2013) scale score on the MAP
ELA assessment, were students’ participation in the one-to-one laptop initiative during
the 2012-2013 school year and student race. The two-factor ANOVA can be used to test
three hypotheses including a main effect for students’ participation in the one-to-one
laptop initiative, a main effect for student race, and a two-way interaction effect. The
interaction effect (student participation in the one-to-one laptop initiative x student race)
was used to test H11. The level of significance was set at .05.
H12. The difference in ELA growth, as measured by a difference between the
fourth (2011-2012) and fifth grade (2012-2013) scale score on the MAP ELA assessment,
between fifth grade students who participated in the one-to-one laptop initiative and fifth

59
grade students who did not participate in the initiative during the 2012-2013 school year
is affected by student SES.
A ninth two-factor ANOVA was conducted to test H12. The two categorical
variables used to group the dependent variable, ELA growth, as measured by a difference
between the fourth (2011-2012) and fifth grade (2012-2013) scale score on the MAP
ELA assessment, were students’ participation in the one-to-one laptop initiative during
the 2012-2013 school year and student SES. The two-factor ANOVA can be used to test
three hypotheses including a main effect for students’ participation in the one-to-one
laptop initiative, a main effect for student SES, and a two-way interaction effect. The
interaction effect (student participation in the one-to-one laptop initiative x student SES)
was used to test H12. The level of significance was set at .05.
RQ7. To what extent is there a difference in mathematics growth, as measured by
a difference between the fourth (2011-2012) and fifth grade (2012-2013) scale score on
the MAP mathematics assessment, between fifth grade students who participated in the
one-to-one laptop initiative and fifth grade students who did not participate in the
initiative during the 2012-2013 school year?
H13. There is a difference in mathematics growth, as measured by a difference
between the fourth (2011-2012) and fifth grade (2012-2013) scale score on the MAP
Mathematics assessment, between fifth grade students who participated in the one-to-one
laptop initiative and fifth grade students who did not participate in the initiative during
the 2012-2013 school year.
A tenth two-factor ANOVA was conducted to test H13 and H14. The two
categorical variables used to group the dependent variable, mathematics growth, as

60
measured by a difference between the fourth (2011-2012) and fifth grade (2012-2013)
scale score on the MAP mathematics assessment, were students’ participation in the one-
to-one laptop initiative during the 2012-2013 school year and student gender. The two-
factor ANOVA can be used to test three hypotheses including a main effect for students’
participation in the one-to-one laptop initiative, a main effect for student gender status,
and a two-way interaction effect student (participation in the one-to-one laptop initiative
x student gender). The main effect for student participation in the one-to-one laptop
initiative was used to test H13. The level of significance was set at .05.
RQ8. To what extent is the difference in mathematics growth, as measured by a
difference between the fourth (2011-2012) and fifth grade (2012-2013) scale score on the
MAP mathematics assessment, between fifth grade students who participated in the one-
to-one laptop initiative and fifth grade students who did not participate in the initiative
during the 2012-2013 school year affected by of the following variables: student gender,
race, or SES?
H14. The difference in mathematics growth, as measured by a difference between
the fourth (2011-2012) and fifth grade (2012-2013) scale score on the MAP mathematics
assessment, between fifth grade students who participated in the one-to-one laptop
initiative and fifth grade students who did not participate in the initiative during the 2012-
2013 school year is affected by student gender.
The interaction effect (student participation in the one-to-one laptop initiative x
student gender) from the tenth ANOVA was used to test H14. The level of significance
was set at .05.

61
H15. The difference in mathematics growth, as measured by a difference between
the fourth (2011-2012) and fifth grade (2012-2013) scale score on the MAP mathematics
assessment, between fifth grade students who participated in the one-to-one laptop
initiative and fifth grade students who did not participate in the initiative during the 2012-
2013 school year is affected by student race.
An eleventh two-factor ANOVA was conducted to test H15. The two categorical
variables used to group the dependent variable, mathematics growth, as measured by a
difference between the fourth (2011-2012) and fifth grade (2012-2013) scale score on the
MAP mathematics assessment, were students’ participation in the one-to-one laptop
initiative during the 2012-2013 school year and student race. The two-factor ANOVA
can be used to test three hypotheses including a main effect for students’ participation in
the one-to-one laptop initiative, a main effect for student race, and a two-way interaction
effect. The interaction effect (student participation in the one-to-one laptop initiative x
student race) from the eleventh ANOVA was used to test H15. The level of significance
was set at .05.
H16. The difference in mathematics growth, as measured by a difference between
the fourth (2011-2012) and fifth grade (2012-2013) scale score on the MAP mathematics
assessment, between fifth grade students who participated in the one-to-one laptop
initiative and fifth grade students who did not participate in the initiative during the 2012-
2013 school year is affected by student SES.
A twelfth two-factor ANOVA) was conducted to test H16. The two categorical
variables used to group the dependent variable, mathematics growth, as measured by a
difference between the fourth (2011-2012) and fifth grade (2012-2013) scale score on the

62
MAP mathematics assessment, were students’ participation in the one-to-one laptop
initiative during the 2012-2013 school year and student SES. The two-factor ANOVA
can be used to test three hypotheses including a main effect for students’ participation in
the one-to-one laptop initiative, a main effect for student SES, and a two-way interaction
effect student participation in the one-to-one laptop initiative x student SES. The
interaction effect (student participation in the one-to-one laptop initiative x student SES)
from the twelfth ANOVA was used to test H16. The level of significance was set at .05.
Limitations
Limitations are “particular features of [the] study that [the researcher] know may
negatively affect the results or [the researcher’s] ability to generalize” (Roberts, 2010, p.
162). This researcher identified the following limitations to the current study:
1. Technology is changing rapidly. To generalize the effect of technology far
beyond the time examined in this study is speculative.
2. Student and teacher exposure to technology as a learning tool is changing
quickly. As technology usage in classrooms becomes more common over
time, it is assumed that the use of technology would become more effective
and less disruptive. As technology use becomes an expectation instead of a
change, the pedagogical practices of teachers may have a different influence
on student learning.
3. The deployment of a one-to-one initiative may look different in another
school district. The device, infrastructure, professional development, teacher
ability, and the district leadership might influence the effectiveness of a device

63
of this nature. Other communities with nearly similar demographics and
resources might have different outcomes if this study were to be replicated.
Summary
The methodology used in this study was described in this chapter. This study was
a quantitative, quasi-experimental study that used archival data from a student
achievement on the MAP in one school district to determine the extent to which a one-to-
one initiative influenced MAP ELA and mathematics scores. Provided in chapter four
are the results of the statistical analysis, which determines if there is a significant
difference in the variables identified and student academic achievement. Chapter four
includes the descriptive statistics and the result of the hypothesis testing.

64
Chapter Four
Results
The first purpose of this study was to determine if there were differences in fifth
grade student achievement on the MAP ELA and mathematics assessments between
students who participated in the one-to-one laptop initiative and students who did not
participate in the initiative during the 2012-2013 school year. The second purpose was to
determine whether the differences in fifth grade student achievement on the MAP ELA
and mathematics assessments between students who participated in the one-to-one laptop
initiative and students who did not participate in the initiative were affected by one of the
following variables: student gender, race, or SES during the 2012-2013 school year. The
third purpose was to determine if there were differences in MAP ELA and mathematics
growth, as measured by a difference between the fourth (2011-2012) and fifth grade
(2012-2013) scale score on the MAP ELA and mathematics assessment, between fifth
grade students who participated in the one-to-one laptop initiative and fifth grade students
who did not participate in the initiative during the 2012-2013 school year. The final
purpose was to determine if there were differences in MAP EL and mathematics growth,
as measured by a difference between the fourth (2011-2012) and fifth grade (2012-2013)
scale score on the MAP ELA and mathematics assessment, between fifth grade students
who participated in the one-to-one laptop initiative and fifth grade students who did not
participate in the initiative during the 2012-2013 school year were affected by one of the
following variables: student gender, race, or SES. The eight research questions that
guided the current study are addressed through the results of the data analysis provided in

65
this chapter. Chapter four begins with descriptive statistics, followed by the results of the
hypotheses testing.
Descriptive Statistics
The descriptive statistics in this section provide details of the variables in the
research questions from this study. Participants by elementary school, participant gender,
participant ethnicity, participant SES, and fifth grade one-to-one participants are found in
Tables 4-8. Table 4 includes the number of students in each elementary school and the
percent of the total participation each school represents. These students are the cohort
that became the fifth graders in this study. School G has a low number of participants
because it is an alternative school.
Table 4
Participants by Elementary School
School N %
School A 69 9.8
School B 82 11.7
School C 63 9.0
School D 62 8.8
School E 103 14.7
School F 80 11.4
School G 5 0.7
School H 65 9.3
School I 84 12.0
School J 89 12.7
Total 702 100.0

66
The statistics related to the gender of the participants in the study appear in Table
5. Approximately half of the participants were male, and half of the participants were
female. The data is the expected representation of gender in a public school.
Table 5
Participant Gender
Gender N %
Female 346 49.3
Male 356 50.7
Total 702 100.0
The statistics related to the ethnicity of the participants in the study appear it
Table 6. Participants in the study were referred to as being White or non-White.
Collectively, 27.4 percent of the participants were non-White. White participants
comprised 72.9% of the sample.

67
Table 6
Participant Ethnicity
Ethnicity N %
Native American 2 0.3
Asian 22 3.1
Pacific Islander 6 0.9
African American 73 10.4
Hispanic 60 8.5
White 510 72.6
Multi-Racial 29 4.1
Total 702 100.0
The statistics related to the SES of the participants in the study appear in Table 7.
Over 75% of the participants paid full price for their lunches. The remaining 24.4% of
the participants received either free or reduced-priced lunches at school.
Table 7
Participant SES
SES N %
Full Pay 531 75.6
Free/Reduced Lunch 171 24.4
Total 702 100.0

68
The statistics related to the participation in the one-to-one laptop initiative in fifth
grade are in Table 8. Of the 702 participants, 66.2% did not participate in the one-to-one
laptop initiative in the fifth grade, and 33.8% did participate in the initiative.
Table 8
Fifth Grade One-to-One Participants
Participation N %
Non-participant 465 66.2
Participant 237 33.8
Total 702 100.0
Hypothesis Testing
Eight research questions were posed. The research questions provide the basis for
the data analysis. The hypotheses, listed after each relevant research question, were
tested for statistically significant differences. The analysis and the results of the
hypothesis tests are listed after each hypothesis.
RQ1. To what extent is there a difference in fifth grade student achievement on
the MAP ELA assessment between students who participated in the one-to-one laptop
initiative and students who did not participate in the initiative during the 2012-2013
school year?
H1. There is a statistically significant difference in fifth grade student
achievement on the MAP ELA assessment between students who participated in the one-
to-one laptop initiative and students who did not participate in the initiative during the
2012-2013 school year.

69
The first two-factor ANOVA was conducted to test H1 and H2. The two
categorical variables used to group the dependent variable, fifth grade student
achievement on the MAP ELA assessment, were students’ participation in the one-to-one
laptop initiative during the 2012-2013 school year and student gender. The two-factor
ANOVA can be used to test three hypotheses including a main effect for students’
participation in the one-to-one laptop initiative, a main effect for student gender, and a
two-way interaction effect (student participation in the one-to-one laptop initiative x
student gender). The main effect for student participation in the one-to-one laptop
initiative was used to test H1. The level of significance was set at .05. The results of the
analysis indicated there was not a statistically significant difference between the two
means, F = .782, df = 1, 698, p = .377. See Table 9 for the means and standard deviations
for this analysis. No follow-up post hoc was warranted. The hypothesis of a statistically
significant difference in fifth grade student achievement on the MAP ELA assessment
between students who participated in the one-to-one laptop initiative and students who
did not participate in the initiative during the 2012-2013 school year was not supported.
Table 9
Descriptive Statistics for the Results of the Test for H1
Variable M SD N
Did not Participate 691.41 34.23 465
Participated 688.89 34.63 237
RQ2. To what extent is the difference in fifth grade student achievement on the
MAP ELA assessment between students who participated in the one-to-one laptop

70
initiative and students who did not participate in the initiative during the 2012-2013
school year affected by one if the following variables: student gender, race, or SES?
H2. The difference in fifth grade student achievement on the MAP ELA
assessment between students who participated in the one-to-one laptop initiative and
students who did not participate in the initiative during the 2012-2013 school year is
affected by student gender.
The interaction effect (student participation in the one-to-one laptop initiative x
student gender) from the first ANOVA was used to test H2. The level of significance
was set at .05. The results of the analysis indicated there was not a statistically
significant difference between at least two of the means, F = 2.302, df = 1, 698, p = .130.
See Table 10 for the means and standard deviations for this analysis. No follow-up post
hoc was warranted. The hypothesis that the difference in fifth grade student achievement
on the MAP ELA assessment between students who participated in the one-to-one laptop
initiative and students who did not participate in the initiative during the 2012-2013
school year was affected by student gender was not supported.
Table 10
Descriptive Statistics for the Results of the Test for H2
Variable M SD N
Did not participate Female 693.92 33.31 230
Male 688.95 35.00 235
Participated Female 695.65 33.23 116
Male 682.40 34.84 121

71
H3. The difference in fifth grade student achievement on the MAP ELA
assessment between students who did participate in the one-to-one laptop initiative and
students who did not participate in the initiative during the 2012-2013 school year is
affected by student race.
A second two-factor ANOVA was conducted to test H3. The two categorical
variables used to group the dependent variable, fifth grade student achievement on the
MAP ELA assessment, were students’ participation in the one-to-one laptop initiative
during the 2012-2013 school year and student race. The two-factor ANOVA can be used
to test three hypotheses including a main effect for students’ participation in the one-to-
one laptop initiative, a main effect for student race, and a two-way interaction effect. The
interaction effect (student participation in the one-to-one laptop initiative x student race)
was used to test H3. The level of significance was set at .05. The results of the analysis
indicated there was not a statistically significant difference between at least two of the
means, F = .550, df = 1, 696, p = .455. See Table 11 for the means and standard
deviations for this analysis. No follow-up post hoc was warranted. The hypothesis that
the difference in fifth grade student achievement on the MAP ELA assessment between
students who did participate in the one-to-one laptop initiative and students who did not
participate in the initiative during the 2012-2013 school year is affected by student race
was not supported.

72
Table 11
Descriptive Statistics for the Results of the Test for H3
Variable M SD N
Did not participate Non-White 680.66 37.32 99
White 694.50 32.66 365
Participated Non-White 677.66 33.36 91
White 695.88 33.77 145
H4. The difference in fifth grade student achievement on the MAP ELA
assessment between students who did participate in the one-to-one laptop initiative and
students who did not participate in the initiative during the 2012-2013 school year is
affected by student SES.
A third two-factor ANOVA was conducted to test H4. The two categorical
variables used to group the dependent variable name variable, fifth grade student
achievement on the MAP ELA assessment, were students’ participation in the one-to-one
laptop initiative during the 2012-2013 school year and student SES. The two-factor
ANOVA can be used to test three hypotheses including a main effect for students’
participation in the one-to-one laptop initiative, a main effect for student SES, and a two-
way interaction effect. The interaction effect (student participation in the one-to-one
laptop initiative x student SES) was used to test H4. The level of significance was set at
.05. The results of the analysis indicated there was not a statistically significant
difference between at least two of the means, F = 1.023, df = 1, 698, p = .312. See Table
12 for the means and standard deviations for this analysis. No follow-up post hoc was
warranted. The hypothesis that the difference in fifth grade student achievement on the
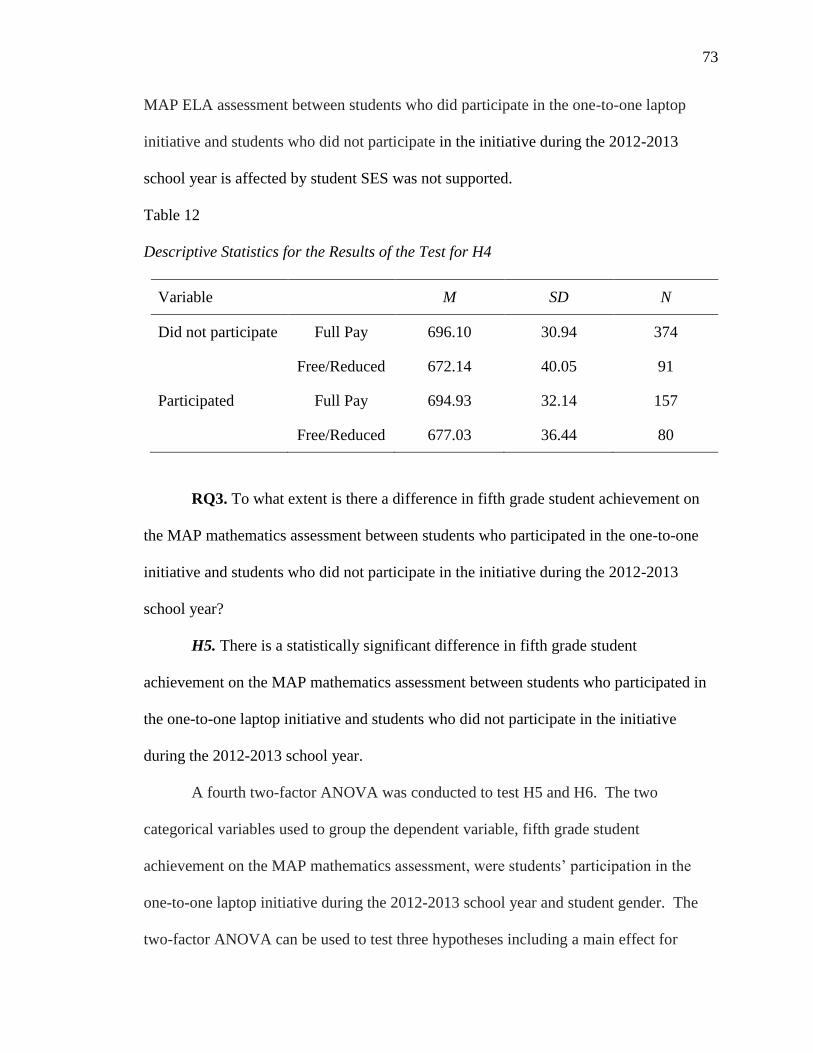
73
MAP ELA assessment between students who did participate in the one-to-one laptop
initiative and students who did not participate in the initiative during the 2012-2013
school year is affected by student SES was not supported.
Table 12
Descriptive Statistics for the Results of the Test for H4
Variable M SD N
Did not participate Full Pay 696.10 30.94 374
Free/Reduced 672.14 40.05 91
Participated Full Pay 694.93 32.14 157
Free/Reduced 677.03 36.44 80
RQ3. To what extent is there a difference in fifth grade student achievement on
the MAP mathematics assessment between students who participated in the one-to-one
initiative and students who did not participate in the initiative during the 2012-2013
school year?
H5. There is a statistically significant difference in fifth grade student
achievement on the MAP mathematics assessment between students who participated in
the one-to-one laptop initiative and students who did not participate in the initiative
during the 2012-2013 school year.
A fourth two-factor ANOVA was conducted to test H5 and H6. The two
categorical variables used to group the dependent variable, fifth grade student
achievement on the MAP mathematics assessment, were students’ participation in the
one-to-one laptop initiative during the 2012-2013 school year and student gender. The
two-factor ANOVA can be used to test three hypotheses including a main effect for

74
students’ participation in the one-to-one laptop initiative, a main effect for student
gender, and a two-way interaction effect. The main effect for student participation in the
one-to-one laptop initiative was used to test H5. The level of significance was set at .05.
The results of the analysis indicated there was not a statistically significant difference
between the two means, F = .040, df = 1, 698, p = .841. See Table 13 for the means and
standard deviations for this analysis. No follow-up post hoc was warranted. The
hypothesis that there is a statistically significant difference in fifth grade student
achievement on the MAP mathematics assessment between students who participated in
the one-to-one laptop initiative and students who did not participate in the initiative
during the 2012-2013 school year was not supported.
Table 13
Descriptive Statistics for the Results of the Test for H5
Variable M SD N
Did not participate 692.10 46.36 465
Participated 691.27 44.01 237
RQ4. To what extent is the difference in fifth grade student achievement on the
MAP mathematics assessment between students who participated in the one-to-one
laptop initiative and students who did not participate in the initiative during the 2012-
2013 school year affected by one if the following variables: student gender, race, or SES?
H6. The difference in fifth grade student achievement on the MAP mathematics
assessment between students who did participate in the one-to-one laptop initiative and
students who did not participate in the initiative is affected by student gender during the
2012-2013 school year.

75
The interaction effect (student participation in the one-to-one laptop initiative x
student gender) from the fourth ANOVA was used to test H6. The level of significance
was set at .05. The results of the analysis indicated a marginally significant difference
between at least two of the means, F = 3.137, df = 1, 698, p = .077. See Table 14 for the
means and standard deviations for this analysis. No follow-up post hoc was warranted.
Although the finding was not statistically significant, the hypothesis that the difference in
fifth grade student achievement on the MAP mathematics assessment between students
who did participate in the one-to-one laptop initiative and students who did not
participate in the initiative during the 2012-2013 school year is affected by student
gender was supported. Female students who participated tended to outperform female
students who did not participate, while male students who participated tended to perform
poorly when compared to males who did not participate.
Table 14
Descriptive Statistics for the Results of the Test for H6
Variable M SD N
Did not participate Female 688.55 46.08 230
Male 695.58 46.47 235
Participated Female 694.26 39.73 694.26
Male 688.41 47.74 688.41
H7. The difference in fifth grade student achievement on the MAP mathematics
assessment between students who did participate in the one-to-one laptop initiative and
students who did not participate in the initiative during the 2012-2013 school year is
affected by student race.

76
A fifth two-factor ANOVA was conducted to test H7. The two categorical
variables used to group the dependent variable, fifth grade student achievement on the
MAP mathematics assessment, were students’ participation in the one-to-one laptop
initiative during the 2012-2013 school year and student race. The two-factor ANOVA
can be used to test three hypotheses including a main effect for students’ participation in
the one-to-one laptop initiative, a main effect for student race, and a two-way interaction
effect. The interaction effect (student participation in the one-to-one laptop initiative x
student race) was used to test H7. The level of significance was set at .05. The results of
the analysis indicated there was not a statistically significant difference between at least
two of the means, F = .000, df = 1, 696, p = .987. See Table 15 for the means and
standard deviations for this analysis. No follow-up post hoc was warranted. The
hypothesis that the difference in fifth grade student achievement on the MAP
mathematics assessment between students who did participate in the one-to-one laptop
initiative and students who did not participate in the initiative during the 2012-2013
school year is affected by student race was not supported.
Table 15
Descriptive Statistics for the Results of the Test for H7
Variable M SD N
Did not participate Non-White 674.51 48.28 99
White 697.20 44.30 365
Participated Non-White 677.33 43.93 91
White 699.90 42.04 145

77
H8. The statistically significant difference in fifth grade student achievement on
the MAP mathematics assessment between students who did participate in the one-to-one
laptop initiative and students who did not participate in the initiative during the 2012-
2013 school year is affected by student SES.
A sixth two-factor ANOVA was conducted to test H8. The two categorical
variables used to group the dependent variable, fifth grade student achievement on the
MAP mathematics assessment, were students’ participation in the one-to-one laptop
initiative during the 2012-2013 school year and student SES. The two-factor ANOVA
can be used to test three hypotheses including a main effect for students’ participation in
the one-to-one laptop initiative, a main effect for student SES, and (a two-way interaction
effect. student participation in the one-to-one laptop initiative x student SES). The
interaction effect (student participation in the one-to-one laptop initiative x student SES)
was used to test H8. The level of significance was set at .05. The results of the analysis
indicated there was not a statistically significant difference between at least two of the
means, F = .418, df = 1, 698, p = .518. See Table 16 for the means and standard
deviations for this analysis. No follow-up post hoc was warranted. The hypothesis that
the difference in fifth grade student achievement on the MAP mathematics assessment
between students who did participate the one-to-one laptop initiative and students who
did not participate in the initiative during the 2012-2013 school year is affected by
student SES was not supported.

78
Table 16
Descriptive Statistics for the Results of the Test for H8
Variable M SD N
Did not participate Full Pay 698.18 45.63 374
Free/Reduced 667.13 40.83 91
Participated Full Pay 700.03 40.33 157
Free/Reduced 674.10 46.08 80
RQ5. To what extent is there a difference in ELA growth, as measured by a
difference between the fourth (2011-2012) and fifth grade (2012-2013) scale score on the
MAP ELA assessment, between fifth grade students who participated in the one-to-one
laptop initiative and fifth grade students who did not participate in the initiative during
the 2012-2013 school year?
H9. There is a difference in ELA growth, as measured by a difference between
the fourth (2011-2012) and fifth grade (2012-2013) scale score on the MAP ELA
assessment, between fifth grade students who participated in the one-to-one laptop
initiative and fifth grade students who did not participate in the initiative during the 2012-
2013 school year.
A seventh two-factor ANOVA was conducted to test H9 and H10. The two
categorical variables used to group the dependent variable, ELA growth, as measured by
a difference between the fourth (2011-2012) and fifth grade (2012-2013) scale score on
the MAP ELA assessment, were students’ participation in the one-to-one laptop initiative
during the 2012-2013 school year and student gender. The two-factor ANOVA can be
used to test three hypotheses including a main effect for students’ participation in the

79
one-to-one laptop initiative, a main effect for student gender, and a two-way interaction
effect (student participation in the one-to-one laptop initiative x student gender).
The main effect for student participation in the one-to-one laptop initiative was used to
test H9. The level of significance was set at .05. The results of the analysis indicated a
statistically significant difference between the two means, F = .4.162, df = 1, 698, p =
.042. See Table 17 for the means and standard deviations for this analysis. The mean
growth for students who participated (M = 19.24) was significantly higher than the mean
for students who did not participate (15.20). The hypothesis of a statistically significant
difference in ELA growth, as measured by a difference between the fourth (2011-2012)
and fifth grade (2012-2013) scale score on the MAP ELA assessment, between fifth
grade students who participated in the one-to-one laptop initiative and fifth grade students
who did not participate in the initiative during the 2012-2013 school year was supported.
Table 17
Descriptive Statistics for the Results of the Test for H9
Variable M SD N
Did not Participate 15.20 24.74 465
Participated 19.24 24.44 237
RQ6. To what extent is the difference in ELA growth, as measured by a
difference between the fourth (2011-2012) and fifth grade (2012-2013) scale score on the
MAP ELA assessment, between fifth grade students who participated in the one-to-one
laptop initiative and fifth grade students who did not participate in the initiative during
the 2012-2013 school year affected by one if the following variables: student gender,
race, or SES?

80
H10. The difference in ELA growth, as measured by a difference between the
fourth (2011-2012) and fifth grade (2012-2013) scale score on the ELA MAP ELA
assessment, between fifth grade students who participated in the one-to-one laptop
initiative and fifth grade students who did not participate in the initiative during the 2012-
2013 school year is affected by student gender.
The interaction effect (student participation in the one-to-one laptop initiative x
student gender) from the seventh ANOVA was used to test H10. The level of
significance was set at .05. The results of the analysis indicated there was not a
statistically significant difference between at least two of the means, F = .296, df = 1,
699, p = .586. See Table 18 for the means and standard deviations for this analysis. No
follow-up post hoc was warranted. The hypothesis that the difference in ELA growth, as
measured by a difference between the fourth (2011-2012) and fifth grade (2012-2013)
scale score on the MAP ELA assessment, between fifth grade students who participated
in the one-to-one laptop initiative and fifth grade students who did not participate in the
initiative during the 2012-2013 school year is affected by student gender was not
supported.
Table 18
Descriptive Statistics for the Results of the Test for H10
Variable M SD N
Did not participate Female 14.62 24.54 230
Male 15.77 24.96 235
Participated Female 17.56 25.71 116
Male 20.85 23.15 121

81
H11. The difference in ELA growth, as measured by a difference between the
fourth (2011-2012) and fifth grade (2012-2013) scale score on the MAP ELA assessment,
between fifth grade students who participated in the one-to-one laptop initiative and fifth
grade students who did not participate in the initiative during the 2012-2013 school year
is affected by student race.
An eighth two-factor ANOVA was conducted to test H11. The two categorical
variables used to group the dependent variable, ELA growth, as measured by a difference
between the fourth (2011-2012) and fifth grade (2012-2013) scale score on the MAP
ELA assessment, were students’ participation in the one-to-one laptop initiative during
the 2012-2013 school year and student race. The two-factor ANOVA can be used to test
three hypotheses including a main effect for students’ participation in the one-to-one
laptop initiative, a main effect for student race, and a two-way interaction effect (student
participation in the one-to-one laptop initiative x student race). The interaction effect
(student participation in the one-to-one laptop initiative x student race) was used to test
H11. The level of significance was set at .05. The results of the analysis indicated a
marginally significant difference between at least two of the means, F = 2.643, df = 1,
696, p = .104. See Table 19 for the means and standard deviations for this analysis. No
follow-up post hoc was warranted. Although the finding is not statistically significant,
the hypothesis that the difference in ELA growth, as measured by a difference between
the fourth (2011-2012) and fifth grade (2012-2013) scale score on the MAP ELA
assessment, between fifth grade students who participated in the one-to-one laptop
initiative and fifth grade students who did not participate in the initiative during the 2012-

82
2013 school year is affected by student race was supported. White students who
participated tended to outperform White students who did not participate.
Table 19
Descriptive Statistics for the Results of the Test for H11
Variable M SD N
Did not participate Non-White 18.57 23.77 99
White 14.26 24.97 365
Participated Non-White 17.63 21.28 91
White 20.34 26.30 145
H12. The difference in ELA growth, as measured by a difference between the
fourth (2011-2012) and fifth grade (2012-2013) scale score on the MAP ELA assessment,
between fifth grade students who participated in the one-to-one laptop initiative and fifth
grade students who did not participate in the initiative during the 2012-2013 school year
is affected by student SES.
A ninth two-factor ANOVA was conducted to test H2. The two categorical
variables used to group the dependent variable, ELA growth, as measured by a difference
between the fourth (2011-2012) and fifth grade (2012-2013) scale score on the MAP
ELA assessment, were students’ participation in the one-to-one laptop initiative during
the 2012-2013 school year and student SES. The two-factor ANOVA can be used to test
three hypotheses including a main effect for students’ participation in the one-to-one
laptop initiative, a main effect for student SES, and a two-way interaction effect (student
participation in the one-to-one laptop initiative x student SES). The interaction effect
(student participation in the one-to-one laptop initiative x student SES) was used to test

83
H12. The level of significance was set at .05. The results of the analysis indicated there
was not a statistically significant difference between the two means, F = .026, df = 1, 698,
p = .871. See Table 20 for the means and standard deviations for this analysis. No
follow-up post hoc was warranted. The hypothesis that the difference in ELA growth, as
measured by a difference between the fourth (2011-2012) and fifth grade (2012-2013)
scale score on the MAP ELA assessment, between fifth grade students who participated
in the one-to-one laptop initiative and fifth grade students who did not participate in the
initiative during the 2012-2013 school year is affected by student SES was not supported.
Table 20
Descriptive Statistics for the Results of the Test for H12
Variable M SD N
Did not participate Full Pay 15.39 24.42 374
Free/Reduced 14.42 26.13 91
Participated Full Pay 19.32 24.00 157
Free/Reduced 19.08 25.44 80
RQ7. To what extent is there a difference in mathematics growth, as measured by
a difference between the fourth (2011-2012) and fifth grade (2012-2013) scale score on
the MAP mathematics assessment, between fifth grade students who participated in the
one-to-one laptop initiative and fifth grade students who did not participate in the
initiative during the 2012-2013 school year?
H13. There is a difference in mathematics growth, as measured by a difference
between the fourth (2011-2012) and fifth grade (2012-2013) scale score on the MAP
mathematics assessment, between fifth grade students who participated in the one-to-one

84
laptop initiative and fifth grade students who did not participate in the initiative during
the 2012-2013 school year.
A tenth two-factor ANOVA was conducted to test H13 and H14. The two
categorical variables used to group the dependent variable, mathematics growth, as
measured by a difference between the fourth (2011-2012) and fifth grade (2012-2013)
scale score on the MAP mathematics assessment, were students’ participation in the one-
to-one laptop initiative during the 2012-2013 school year and student gender. A
tenth two-factor ANOVA was conducted to test H13 and H14. The two categorical
variables used to group the dependent variable, mathematics growth, as measured by a
difference between the fourth (2011-2012) and fifth grade (2012-2013) scale score on the
MAP mathematics assessment, were students’ participation in the one-to-one laptop
initiative during the 2012-2013 school year and student gender. The two-factor ANOVA
can be used to test three hypotheses including a main effect for students’ participation in
the one-to-one laptop initiative, a main effect for student gender status, and a two-way
interaction effect student (participation in the one-to-one laptop initiative x student
gender status). The main effect for student participation in the one-to-one laptop initiative
was used to test H13. The level of significance was set at .05. The results of the analysis
indicated there was not a statistically significant difference between the means, F =
2.509, df = 1, 698, p = .114. See Table 21 for the means and standard deviations for this
analysis. No follow-up post hoc was warranted. The hypothesis that there is a difference
in mathematics growth, as measured by a difference between the fourth (2011-2012) and
fifth grade (2012-2013) scale score on the MAP mathematics assessment, between fifth
grade students who participated in the one-to-one laptop initiative and fifth grade students

85
who did not participate in the initiative during the 2012-2013 school year was not
supported.
Table 21
Descriptive Statistics for the Results of the Test for H13
Variable M SD N
Did not participate 33.94 28.99 465
Participated 30.27 30.36 237
RQ8. To what extent is the difference in mathematics growth, as measured by a
difference between the fourth (2011-2012) and fifth grade (2012-2013) scale score on the
MAP mathematics assessment, between fifth grade students who participated in the one-
to-one laptop initiative and fifth grade students who did not participate in the initiative
during the 2012-2013 school year affected by one of the following variables: student
gender, race, or SES?
H14. The difference in mathematics growth, as measured by a difference between
the fourth (2011-2012) and fifth grade (2012-2013) scale score on the MAP mathematics
assessment, between fifth grade students who participated in the one-to-one laptop
initiative and fifth grade students who did not participate in the initiative during the 2012-
2013 school year is affected by student gender.
The interaction effect (student participation in the one-to-one laptop initiative x
student gender) from the tenth ANOVA was used to test H14. The level of significance
was set at .05. The results of the analysis indicated there was not a statistically
significant difference between at least two of the means, F = .272, df = 1, 698, p = .602.
See Table 22 for the means and standard deviations for this analysis. No follow-up post

86
hoc was warranted. The hypothesis that the difference in mathematics growth, as
measured by a difference between the fourth (2011-2012) and fifth grade (2012-2013)
scale score on the MAP mathematics assessment, between fifth grade students who
participated in the one-to-one laptop initiative and fifth grade students who did not
participate in the initiative during the 2012-2013 school year is affected by student
gender was not supported.
Table 22
Descriptive Statistics for the Results of the Test for H14
Variable M SD N
Did not participate Female 32.33 27.08 230
Male 35.53 30.73 235
Participated Female 27.38 29.57 116
Male 33.03 30.96 121
H15. The difference in mathematics growth, as measured by a difference between
the fourth (2011-2012) and fifth grade (2012-2013) scale score on the mathematics MAP
assessment, between fifth grade students who participated in the one-to-one laptop
initiative and fifth grade students who did not participate in the initiative during the 2012-
2013 school year is affected by student race.
An eleventh two-factor ANOVA was conducted to test H15. The two categorical
variables used to group the dependent variable, mathematics growth, as measured by a
difference between the fourth (2011-2012) and fifth grade (2012-2013) scale score on the
MAP mathematics assessment, were students’ participation in the one-to-one laptop
initiative during the 2012-2013 school year and student race. The two-factor ANOVA
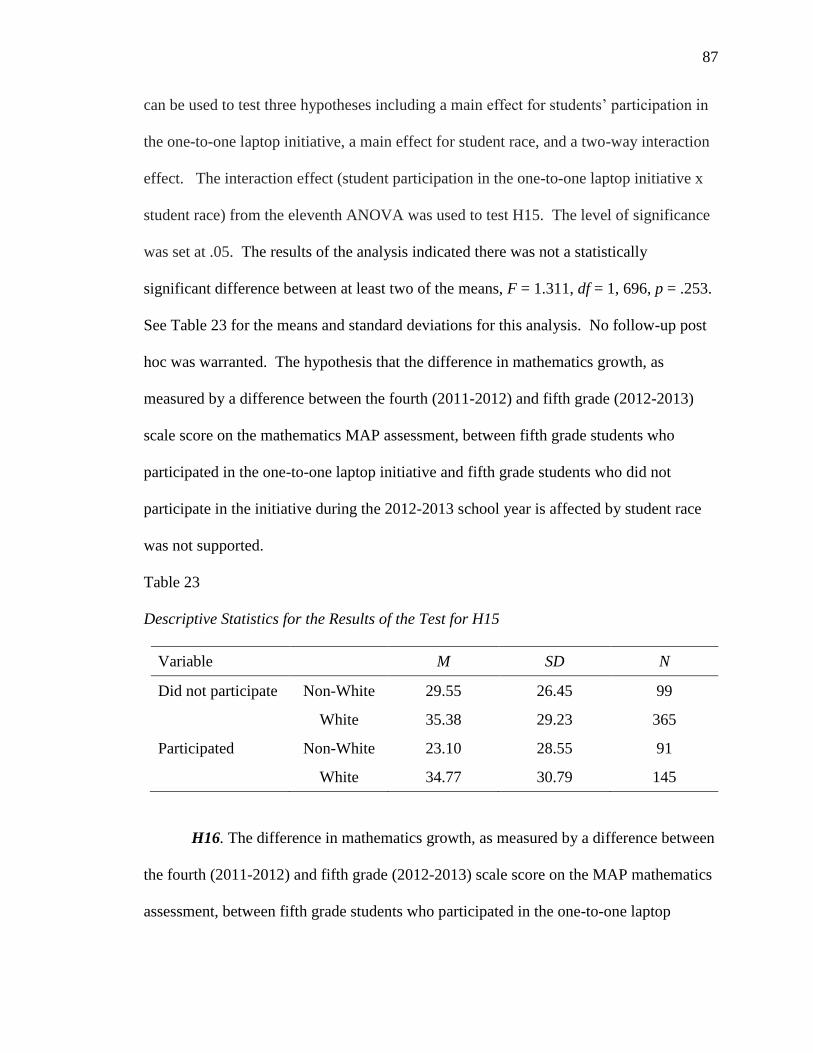
87
can be used to test three hypotheses including a main effect for students’ participation in
the one-to-one laptop initiative, a main effect for student race, and a two-way interaction
effect. The interaction effect (student participation in the one-to-one laptop initiative x
student race) from the eleventh ANOVA was used to test H15. The level of significance
was set at .05. The results of the analysis indicated there was not a statistically
significant difference between at least two of the means, F = 1.311, df = 1, 696, p = .253.
See Table 23 for the means and standard deviations for this analysis. No follow-up post
hoc was warranted. The hypothesis that the difference in mathematics growth, as
measured by a difference between the fourth (2011-2012) and fifth grade (2012-2013)
scale score on the mathematics MAP assessment, between fifth grade students who
participated in the one-to-one laptop initiative and fifth grade students who did not
participate in the initiative during the 2012-2013 school year is affected by student race
was not supported.
Table 23
Descriptive Statistics for the Results of the Test for H15
Variable M SD N
Did not participate Non-White 29.55 26.45 99
White 35.38 29.23 365
Participated Non-White 23.10 28.55 91
White 34.77 30.79 145
H16. The difference in mathematics growth, as measured by a difference between
the fourth (2011-2012) and fifth grade (2012-2013) scale score on the MAP mathematics
assessment, between fifth grade students who participated in the one-to-one laptop

88
initiative and fifth grade students who did not participate in the initiative during the 2012-
2013 school year is affected by student SES.
A twelfth two-factor ANOVA was conducted to test H16. The two categorical
variables used to group the dependent variable, mathematics growth, as measured by a
difference between the fourth (2011-2012) and fifth grade (2012-2013) scale score on the
MAP mathematics assessment, were students’ participation in the one-to-one laptop
initiative during the 2012-2013 school year and student SES. The two-factor ANOVA
can be used to test three hypotheses including a main effect for students’ participation in
the one-to-one laptop initiative, a main effect for student SES, and a two-way interaction
effect student participation in the one-to-one laptop initiative x student SES. The
interaction effect (student participation in the one-to-one laptop initiative x student SES)
from the twelfth ANOVA was used to test H16. The level of significance was set at .05.
The level of significance was set at .05. The results of the analysis indicated there was
not a statistically significant difference between at least two of the means, F = .498, df =
1, 698, p = .480. See Table 24 for the means and standard deviations for this analysis.
No follow-up post hoc was warranted. The hypothesis that the difference in mathematics
growth, as measured by a difference between the fourth (2011-2012) and fifth grade
(2012-2013) scale score on the MAP mathematics assessment, between fifth grade
students who participated in the one-to-one laptop initiative and fifth grade students who
did not participate in the initiative during the 2012-2013 school year is affected by
student SES was not supported.

89
Table 24
Descriptive Statistics for the Results of the Test for H16
Variable M SD N
Did not participate Full Pay 35.76 30.06 374
Free/Reduced 26.46 22.78 91
Participated Full Pay 32.15 32.30 157
Free/Reduced 26.58 25.92 80
Summary
Chapter four included the descriptive statistics and a summary of the statistical
testing and analysis results. The chapter addressed the eight research questions and the
statistical testing of the sixteen hypotheses from this study. Chapter five includes a
summary of the study, an overview of the problem and purpose statement, review of
methodology, major findings, findings related to literature, conclusions, implications for
action, and recommendations for future research.

90
Chapter Five
Interpretation and Recommendations
Chapter five concludes this study by including the overview of the problem, the
purpose of statement and research questions, the methodology, the major findings of this
research, and a summary of the study. A discussion of the findings related to the
literature follows. Chapter five also contains implications for action and
recommendations for future research, which will lead to suggestions for extensions of the
study. This chapter ends with the concluding remarks.
Study Summary
Many school districts have expanded the use of technology in classrooms across
the United States. Accountability through standardized testing became a trend in 2001
when No Child Left Behind (NCLB) was passed into law. The topic of this study was the
effect of one-to-one initiatives on fifth grade student performance on standardized
assessments. In this section, the overview of the problem, the purpose statement, and
researched questions, a review of the methodology, and the major findings are included.
Overview of the problem. Many school districts are attempting to measure the
success of one-to-one initiatives by analyzing the results of student achievement on state
assessments. Schools want to know if placing students in a one-to-one initiative supports
the efforts to improve scores on standardized tests such as the MAP. District X did not
know whether the one-to-one initiative would influence student performance on the MAP
ELA and mathematics assessments. Additionally, District X did not know whether
student gender, race, and SES affected any differences in student performance.
91
Purpose statement and research questions. The first purpose of this study was
to determine if there were differences in fifth grade student achievement on the MAP
ELA and mathematics assessments between students who participated in the one-to-one
laptop initiative and students who did not participate in the initiative during the 2012-
2013 school year and whether those differences were affected by one of the following
variables: student gender, race, or SES. The other purpose was to determine if there was
a difference in ELA growth, as measured by a difference between the fourth (2011-2012)
and fifth grade (2012-2013) scale score on the MAP ELA and mathematics assessment,
between fifth grade students who participated in the one-to-one laptop initiative and fifth
grade students who did not participate in the initiative during the 2012-2013 school year
and whether those differences were affected by one of the following variables: student
gender, race, or SES. To address these purposes, eight research questions were posed.
Review of the methodology. This quantitative study utilized a quasi-
experimental design. The dependent variables were the MAP ELA and mathematics
assessment scores for fourth grade students during the 2011-2012 school year and fifth
grade students during the 2012-2013 school year. The independent variables were the
participation in the one-to-one program, student gender, race, and SES. There were 702
participants in the study. Twelve two-factor ANOVAs were conducted to examine the
statistical significance of the 16 hypotheses concerning the effect the one-to-one initiative
had on the ELA and mathematics MAP the scores and growth.
Major findings. The results of the data analysis were derived from analyses that
addressed eight research questions. The results from RQ1, RQ2, and RQ3 yielded no
statistically significant findings. There was minimal difference in the student

92
achievement between fifth graders who participated in the one-to-one initiative and those
who did not participate in the one-to-one initiative on the MAP ELA assessment. The
results from RQ4 indicated that, although the finding was not statistically significant,
fifth grade student achievement on the MAP mathematic assessment between students
who did participate in the one-to-one laptop initiative and students who did not
participate in the initiative during the 2012-2013 school year was affected by student
gender. Female students who participated in the one-to-one initiative tended to
outperform female students who did not participate in the initiative on the MAP
mathematics assessment. However, the MAP mathematics assessment showed that male
students who participated in the one-to-one initiative did not perform as well as males
who did not participate in the one-to-one initiative.
The results related to RQ5 indicated significant differences in student
performance on the MAP ELA. There was a difference in ELA growth, as measured by a
difference between the fourth (2011-2012) and fifth grade (2012-2013) scale score on the
MAP ELAassessment, between fifth grade students who participated in the one-to-one
laptop initiative, and fifth grade students who did not participate in the initiative during
the 2012-2013 school year. Fifth grade students who did not partcipate in one-to-one
were outperformed by fifth grade students who did participate.
Although the finding related to RQ6 was not statistically significant, the
difference between the fourth (2011-2012) and fifth grade (2012-2013) scale scores on
the MAP ELA assessment, between fifth grade students who participated in the one-to-
one laptop initiative and fifth grade students who did not participate in the initiative
during the 2012-2013 school year was affected by student race. White students who

93
participated tended to outperform White students who did not participate. The results
related to RQ7 and RQ8 yielded no statistically significant difference in student growth
on the MAP mathematics assessment between students who participated in the one-to-
one initiative and those who did not.
Findings Related to the Literature
The researcher conducted a review of literature related to the impact of one-to-one
initiatives on student academic performance. In addition, the researcher conducted a
review of the literature on the impact one-to-one initiatives has had on student
performance based on gender, the differences based on SES, and the differences based on
race. This study found that there were some areas which demonstrated academic success
in the one-to-one initiative and some areas that did not. The results of this study support
and are in contrast to the literature.
The research related to academic achievement and student SES conflict with the
findings of this study. Attewell & Battle (1999) found that the poorer a student was, the
greater the potential being a part of a one-to-one initiative had to improve their academic
success. In a later study, Harris (2010) reported that learning with laptops had a greater
education impact on students with low SES than students who were not low SES. The
results of this study indicated that there was not a significant difference in academic
performance between those students with low SES in the one-to-one initiative and those
students with low SES that were not in the one-to-one initiative.
Conflicting research can be found regarding the impact of a one-to-one initiative
on student academic performance and race. Walters (2012) reported that there was little
to moderate effect on Hispanic students on a state reading test in response to being in a

94
one-to-one initiative. In contrast to this report, Casey (2014) reported that Hispanic
students in a one-to-one initiative had gains in reading compared to non-Hispanic
students. In the current study, White students who participated in the one-to-one
initiative tended to outperform White students who did not participate. However, non-
White students who participated in the one-to-one initiative did not outperform non-
White students who did not participate.
The research related to the gender differences in a one-to-one initiative showed
conflicting results. Chiu et al. (2007) found that sixth grade girls outperformed sixth
grade boys in ELA scores. Conversely, Brummel et al., (2013) reported that girls
outperformed boys in mathematics when placed in a one-to-one initiative. Similar
studies have not had the same results. Dennis (2014) reported that student academic
achievement in mathematics did not benefit from being in a one-to-one initiative, and the
co-variable of gender was not an indicator of academic performance of any significance.
However, Brummel et al. (2013) studied sixth grade students, and Dennis’ study was
conducted with high school students. In the current study, female fifth grade students
who participated in the one-to-one initiative tended to outperform female students who
did not participate, while male students who participated tended to perform poorly when
compared to males who did not participate as measured by their mathematics scores on
the MAP. Results may suggest that the device may not be the determining factor on
achievement as it relates to gender.
Owston and Wideman (2001) reported that students in a one-to-one laptop
environment outscored and showed more growth than students without a laptop when
measuring ELA. Mouza (2008) reported that laptops improved student learning as

95
measured by standardized tests in mathematics and ELA. In addition to this finding,
Shapley et al. (2010) found that middle school students in a one-to-one initiative
produced higher scores on an ELA state exam than students not in the one-to-one
initiative. Chiu et al. (2013) found that students who used electronic devices in a one-to-
one program made significant growth in their reading comprehension. In this current
study, students who were in the one-to-one initiative experienced more growth on the
MAP ELA than those students who did not participate in the one-to-one initiative. This
finding is in contrast to Bryan (2011) and Walters (2012) whose studies indicated there
was little to no difference in academic achievement in ELA for students participating in a
one-to-one initiative.
Researchers have reported conflicting results on student achievement in
mathematics in one-to-one initiatives. Van der Kleij et al. (2015) reported that there was
a positive effect on student achievement in mathematics in their study of students in a
one-to-one learning environment. Likewise, Ozerbas and Erdogan (2016) reported that
students in a digital learning environment have more academic success in mathematics
than those students without the devices. However, the current study found that there was
not a difference in mathematics growth, as measured by a difference between the fourth
(2011-2012) and fifth grade (2012-2013) scale score on the Mathematics MAP
assessment, between fifth grade students who participated in the one-to-one laptop
initiative and fifth grade students who did not participate in the initiative during the 2012-
2013 school year. This finding supports Dunleavy and Heinecke (2007) who found that
students in a one-to-one initiative demonstrated no significant improvement in student
96
mathematic achievement when comparing students that were and were not a part of the
one-to-one initiative.
This study found conflicting results, as students who participated in the initiative
did demonstrate an overall improvement in ELA but not in mathematics. This study
found that there was not a significant impact on the differences between the groups with
and without the device. However, there was a significant impact on the growth
demonstrated by students with the device in ELA and not a significant impact on the
growth demonstrated by students in mathematics. Researchers have reported that student
performance in ELA and mathematics mirrored each other rather than contrasting with
each other. Lewis (2004) reported that students in a one-to-one initiative did not make
significant academic achievement in mathematics or ELA when compared to students
that were not in a one-to-one initiative. Supporting this finding, O’Dwyer et al. (2008),
found that there was no significant impact on any academic performance when one-to-
one programs were initiated. Additionally, Kulow (2014) found that student academic
performance in a one-to-one initiative was not significantly different from students that
were not in a one-to-one initiative. In contrast to this study, some have reported a
positive effect on student academic performance in both ELA and mathematics. Gulek
and Demirtas (2005), Bebell and O’Dwyer (2010), Mills (2010), and Warschauer and
Zheng (2016) all reported in their respective studies that students in a one-to-one
initiative demonstrated academic success in both ELA and mathematics.
Conclusions
This section provides conclusions drawn from the current study on the impact of a
one-to-one initiative on student performance on the MAP ELA and mathematics and the

97
effect of gender, race, and SES on the differences. Data from the current study is
significant to school leaders, as the findings could be used to improve or create support in
a one-to-one initiative. This section includes implications for action, recommendations
for future research, and concluding remarks to complete the study.
Implications for action. In this era of high-stakes testing in public schools, it is
important to evaluate how school districts are using their resources and the results the
resources have on student test scores. The results of this study indicated that fifth grade
students who participated in one-to-one initiative demonstrated more growth than fifth
grade students who did not participate in one-to-one on the ELA portion of the MAP
assessment, but the same was not true for mathematics. A specific area of action may be
to evaluate how mathematics instruction is supported and what resources are used to
deliver the content. Also, District X may want to break down the individual results by
teacher and study to determine if individual pedagogical teacher practices may have
influenced student achievement. District X may also want to review how other school
districts have achieved improvement in student mathematics performance in a one-to-one
setting and incorporate some of their processes and practices.
The results of the study indicated that White students who participated tended to
outperform White students who did not participate, but the same was not true for non-
White students. Another area for action may include investigations into the performance
of White students in comparison to non-White students. The formation of focus groups
consisting of non-White students and their families may be beneficial. These focus
groups could discuss academic data and form a plan for supporting the success of non-
White students. District X may want to provide professional development to their staff

98
that targets best practices in improving the academic performance of subgroups such as
non-White students.
Another result of this study was that there was not a significant difference in
academic performance between those students with low SES in the one-to-one initiative
and those students with low SES that were not in the one-to-one initiative. District X
may want to share the results of this study with their staff and evaluate why this one-to-
one initiative did not produce better academic gains for these students. District leaders
may want to devise a strategy that ensures the implementation of effective instructional
practices in one-to-one classrooms, specifically strategies that target low SES students.
District X may also want to analyze their students access to technology at home,
particularly with students with low SES. The flipped instruction mode of content
delivery includes the expectation that students will access their devices away from
school. District X may want to be creative with expanded student access to the web
outside of school by incorporating web access on their school buses, as other school
districts have done (Reeves, 2003). District X may want to focus on informing families
of effective learning practices that can be implemented at home with their student’s
devices. District X may also reach out to other public and private institutions to support
digital learning for students beyond school hours.
Recommendations for future research. The purpose of this study was to
determine to what extent the one-to-initiative impacted student performance on the MAP
ELA and mathematics. This study was limited to one sample of students in one school
district. Changing variables such as demographics or sampling size could strengthen a
study’s findings.

99
The first recommendation would be to add a qualitative research component to the
replication of the current study. By gathering feedback and insight from teachers,
students, and parents, a better understanding of improving the effectiveness of the one-to-
one initiative could be obtained. In addition, Grimes & Warschauer, (2008) reported that
only looking at student achievement data may not be the best way to evaluate the success
of a one-to-one initiative because it does not measure the acquisition of skills that
students acquire while learning with the device. District X may want to begin monitoring
the 21st Century skills of the students in the one-to-one initiative. Qualitative measures
could also ensure the validity of the quantitative results.
A second recommendation would be to add additional quantitative measures
regarding student academic achievement to a replication of this study. The results of
another standardized assessment could be analyzed, such as Acuity or STAR. Additional
assessments could provide more insight into the academic progress of the students and
add to the validity of the existing quantitative results.
A third recommendation would be to study the teacher training received during a
one-to-one initiative. The professional development of the teachers may have an impact
on the results of the student performance. Studying how the students were instructed to
use the devices and the engagement of the students while they were using the devices
may reveal an opportunity to increase the effectiveness of the device as a learning tool.
A fourth recommendation would be to extend the study throughout the students’
career in a one-to-one initiative. The effectiveness of a one-to-one program may change
throughout the development of the students’ career within a school district. A study of

100
this nature could also include quantitative data such as ACT scores, graduation rate, and
college and career readiness.
A fifth recommendation would be to replicate the study in an urban or rural
setting. The current suburban setting may have an influence on the results of the study.
A different setting would add to the knowledge of the topic and provide insight into the
results.
A sixth recommendation would be to compare the results of the study to the
results from other school’s districts with different or similar demographics. It would be
valuable to study what demographics may serve as indicators of success or failure. A
study comparing District X to other districts within the state of Missouri may also be
useful.
Concluding remarks. This study is a part of the body of work researching how
instructional technology impacts student learning. The results of this study are consistent
with some of the results of similar studies devoted to examining the impact of a one-to-
one initiative on the academic success of students. Most of the research questions did not
yield a statistically significant relationship between the one-to-one initiative and student
scores on a standardized assessment such as the MAP. As children are prepared for their
futures in public schools, many are being provided with and using technology with the
expectation that the devices they use will enhance their learning. Public education may
be experiencing a situation where the advances in technology are surpassing our ability to
effectively implement it, train our teachers to be effective with it, and prepare our
students to use it as members of the workforce. The Bureau of Labor Statistics reported
that by 2020 there would be a million more job openings than trained workers to fill the

101
positions (Sims, 2014). More studies such as this one should be conducted to add to our
knowledge and ability to create informed strategies to narrow the gap between
achievement levels of subgroups. A one-to-one initiative can have a positive impact on
student learning (Silvernail, 2007). Students deserve a relevant, updated education that
helps them learn 21st Century skills so that education catches up to the expectations of
being career ready (Sims, 2014).

102
References
Adelman, H. S., & Taylor, L. (2002). School counselors and school reform: New
directions. Professional School Counseling, 5(4), 235-249.
American Psychological Association. (2010). Testing and assessment. Retrieved from
http://www.apa.org/science/programs/testing/index.aspx
Anchorage School District. (2014). What is BYOD?. Retrieved from
http://www.asdk12.org/informationtechnology/projects/byod/
Apple Computers. (1990). Apple computers of tomorrow research. Retrieved from
http://www.apple.com/euro/pdfs/acotlibrary/ rpt9.pdf
Argueta, R., Huff, D. J., Tingen, J., & Corn, J. O. (2011). Laptop initiatives: Summary of
research across six states. Friday Institute White Paper Series Number Four,
North Carolina State University. Retrieved from https://www.fi.ncsu.edu/wp-
content/uploads/2013/05/laptop-initiatives-summary-of-research-across-seven-
states.pdf
Attewell, P., & Battle, J. (1999). Home computers and school performance. The
Information Society, 15(1), 1-10. Retrieved from https://www.learntechlib.org
/p/89398
Barron, B., & Darling-Hammond, L. (2008). Teaching for meaningful learning: A review
of research on inquiry-based and cooperative learning. Powerful learning: What
we know about teaching for understanding, Edutopia,11-70. Retrieved from
http://www.edutopia.org/pdfs/edutopia-teaching-for-meaningful-learning.pdf

103
Basham, J. D., Israel, M., Graden, J., Poth, R., & Winston, M. (2010). A comprehensive
approach to RTI: Embedding universal design for learning and technology.
Learning Disability Quarterly, 33(4), 243-255.
Battle, P. A. J. (1999). Home computers and school performance. The Information
Society, 15(1), 1-10.
Bebell, D., & Kay, R. (2010). One to one computing: A summary of the quantitative
results from the Berkshire wireless learning initiative. The Journal of Technology,
Learning and Assessment, 9(2), 5-59. Retrieved from http://napoleon.bc.edu/ojs/in
dex.php/jtla/article/view/1607/1462
Bebell, D., & O'Dwyer, L. M. (2010) Educational outcomes and research from 1:1
computing settings. Journal of Technology, Learning, and Assessment 9(1).
Retrieved from http://files.eric.ed.gov/fulltext/EJ873675.pdf
Bentley, J. M. (2008). Teaching middle school science lessons using inquiry-based
methods. Education and Human Development Master's Theses. Paper 246.
Retrieved from http://digitalcommons.brockport.edu/cgi/viewcontent.
cgi?article=1251&context=ehd_theses
Bergmann, J., & Sams, A. (2012). Flip your classroom: Reach every student in every
class every day. Alexandria, Va.: ASCD
Berk, R. A. (2010). How do you leverage the latest technologies, including Web 2.0
tools, in your class- room? International Journal of Technology in Teaching and
Learning, 6(1), 1-13. Retrieved from http://www.ronberk.com/articles/2010_leve
rage.pdf

104
Betts, J., & Koedel, C. (2009). Value-added to what? How a ceiling in the testing
instrument influences value-added estimation (Report No. 14778). Cambridge,
England: National Bureau of Economic Research.
Bidwell, A. (2014). The history of common core state standards. US News & World
Report. Retrieved from: https://www.usnews.com/news/special-
reports/articles/2014/02/27/the-history-of-common-core-state-standards
Blackburn, B. (2013, March 30). Rigor and the Common Core State Standards: Just the
beginning! Retrieved from Southeast Education Network website:
http://www.seenmagaizine.us/articlaes/article-detail/articeid/2871/rigor-and-the-
common-core-state-standars.aspx
Bolkan, J. (2014, April 21) Research: Most teachers use technology, few see
improvements in achievement. Retrieved from http://thejournal.com/articles/
2014/04/21/research-most-teachers-use-technology-few-see-improvements-in-
achievement.aspx
Brummel, B. J., Greer, D. D., Jackson, A. T., & Pollet, C. L (2013). An evaluation of
interactive tabletops in elementary mathematics education. Educational
Technology Research and Development, 61(2), 311-332.
Bush, B., & Zachariah, H. (2014, November 5). School levy roundup: New Albany
staring at layoffs, cuts after issue fails. Retrieved from: http://www.dispatch. com/
content/stories/public/2014/11/election-news.html
105
Bruner, J. S. (1996). The culture of education. Boston, MA: Harvard University Press.
Bryan, A. (2011). Elementary reading fluency and comprehension: do laptops make a
difference? (Doctoral dissertation). Retrieved from ProQuest Dissertations and
Theses database. (UMI No. 3475631)
Casey, M. (2014). Use of iPads in Charleston County shows mixed results. Retrieved
from http://www.postandcourier.com/article/20140209/ pc16/140209537/use-of-
ipads-in-charleston-county-schools-show-mixed-mostly-positive-results/
Camilleri, M. J., Malige, A., Fujimoto, J., & Rempel, D. M. (2013). Touch displays: The
effects of palm rejection technology on productivity, comfort, biomechanics and
positioning. Ergonomics, 56(12), 1850-1862.
Clark, K. R. (2015). The Effects of the flipped model of instruction on student
engagement and performance in the secondary mathematics Classroom. Journal
of Educators Online, 12(1), 91-115. Retrieved from http://files.eric.ed.gov/
fulltext/EJ1051042.pdf
Chiu, M. M., Chow, B. W. Y., & McBride-Chang, C. (2007). Universals and specifics in
learning strategies: Explaining adolescent mathematics, science, and reading
achievement across 34 countries. Learning and Individual Differences, 17(4),
344-365. Retrieved from ERIC database. (EJ782932)
Costley, K. C. (2014). The positive effects of technology on teaching and student learning
(Report). Retrieved from ERIC database (ED554557)
Cobb, A. (2010). To differentiate or not to differentiate? Using Internet-based technology
in the classroom. Quarterly Review of Distance Education, 11(1), 37-45.
Retrieved from ERIC database. (EJ889345)

106
Cottone, M. A. (2013). Linking laptops to learning: Analysis of a 1:1 environment with
intermediate learners (Doctoral dissertation). Retrieved from ProQuest
Dissertations and Theses database. (UMI No. 3560610)
Cuban, L., & Tyack, D. (1995). Tinkering toward utopia: A century of public school
reform. Cambridge, MA: Harvard University Press.
DeNisco, A. (2013). Preparing for online teaching: web-based assessment and
communication skills in K12. District Administration, 49(5), 38-41. Retrieved
from https://www.districtadministration.com/article/preparing-online-teaching
Dennis, Q. (2014). The impact of the one to one laptop initiative on high school students'
academic performance in Algebra I and English I--a meta-analytic approach
(Doctoral dissertation). Retrieved from ProQuest Dissertations and Theses
database. (UMI No. 3583490)
District X. (2015a). District information, comprehensive school improvement plan.
Retrieved from http://www.District X.k12.mo.us
District X. (2015b). District information, demographic profile. Retrieved from
http://www.District X.k12.mo.us
District X. (2014). District information, future learner project. Retrieved from
http://www.District X.k12.mo.us
Dunleavy, M., & Heinecke, W. F. (2007). The impact of 1:1 laptop use on middle school
math and science standardized test scores. Computers in the Schools, 24(3-4), 7-
22.
Dunn, J. (2011). The evolution of classroom technology. Retrieved http://nepc.colorado.
edu/blog/jeff-dunn-evolution-classroom-technology

107
Enfield, J. (2013). Looking at the impact of the flipped classroom model of instruction on
undergraduate multimedia students at CSUN. Techtrends: Linking Research &
Practice to Improve Learning, 57(6), 14-27. doi:10.1007/s11528-013-0698-1
Fried, C. B. (2008). In-class laptop use and its effects on student learning. Computers &
Education, 50(3), 906–914.
Fullan, M., & Levin, B. (2009). The fundamentals of whole-system reform. Education
Week, 28(35), 30-31.
Garner, E. J., Schweder, W., & Wissick, C.A. (2004). Technology applications to support
diverse learners. Retrieved from http://www.ed.sc.edu/caw/site
Goddard, M. (2002). What do we do with these computers? Reflections on technology in
the classroom. Journal of Research on Technology in Education, 35(1), 19-26.
Grimes, D., & Warschauer, M. (2008). Learning with laptops: A multi-method case
study. Journal of Educational Computing Research, 38(3), 305-332.
Gulek, J. C. & Demirtas, H. (2005). Learning with technology: The impact of laptop use
on student achievement. Journal of Technology, Learning, and Assessment, 3(2)
1-39.
Guss, L., (2015). 1:1–25 years on! Reflections by Leon Guss, Methodist Ladies College.
Retrieved from http://www.aalf.org/articles/view.php?ArticleID=217
Harris, M. J. (2010). Impactful student learning outcomes of one-to-one student laptop
programs in low socioeconomic schools (Doctoral dissertation, San Francisco
State University). Retrieved from https://www.st-andrews.org/
Customized/uploads/Parents/Leaflet/Dec_15/MJH_Dissertation.pdf

108
Harless, S., & Harthun-Reed, A. (2005). Laptop initiative creates equal educational
opportunities. The Journal (Technological Horizons in Education), 32(8), S6.
Heller, N. (2014) California Screaming. The New Yorker. 7(7), Retrieved from http://
www. newyorker.com/magazine/2014/07/07/california-screaming
Hill, A. (2014). Classroom tech: A history of hype and disappointment. Retrieved from
http://www.marketplace.org/topics/education/learning-curve/classroom-tech-
history-hype-and-disappointment
Huang, Y. M., Liang, T. H., & Chiu, C. H. (2013). Gender Differences in the Reading of
E-books: Investigating Children's Attitudes, Reading Behaviors and
Outcomes. Educational Technology & Society, 16(4), 97-110.
International Society for Technology in Education. (2014). ISTE position statement on
the Common Core State Standards. Retrieved from
https://www.iste.org/standards/common-core
Jackson, L. (2004, September 1). One-to-one computing: Lesson learned, pitfalls to
avoid. Retrieved from Education World: http://www.educationworld.com/
atech/tech/tech197.shtml
Jackson, A., & Davis, G. (2000). Turning points 2000: Educating adolescents in the 21st
century. A report of the Carnegie Corporation. New York, NY: Teachers College
Press. Jacklin, C. N., & Maccoby, E. E. (1974). The psychology of sex differences
(Vol. 1). Redwood City, Ca: Stanford University Press.

109
Johnson, K. W. (2014). Parental perceptions of the influence of digital media and
technology on children's reading habits at home. All Graduate Theses and
Dissertations. Paper 2186. Retrieved from http://digitalcommons.usu.edu/cgi/
viewcontent.cgi?article=3164&context=etd
Kao, G., & Tienda, M. (2005). Optimism and achievement: The educational performance
of immigrant youth. The new immigration: An interdisciplinary reader, 331-343.
Kerawalla, L., & Crook, C. (2002). Children's computer use at home and at school:
Context and continuity. British Educational Research Journal, 28(6), 751-771.
Retrieved from http://dx.doi.org/10.1080/0141192022000019044
Keough, M. (2005). 7 reasons why mlearning doesn’t work. Archer College. University
of South Australia. Retrieved from http://iamlearn.org/mlearnarchive/mlearn
2005/CD/papers/McMillan-Keough.pdf
Kimbrel, M., & Rizzo, S. (2013). 2012-2013 Future Learner Project (FLiP) update and
evaluation. Kansas City, MO: District X.
KMBC. (2014). Shawnee Mission to provide laptops, iPads to district students. Retrieved
from http://www.kmbc.com/news/kansas-city/shawnee-mission-to-provide-
laptops-ipads-to-district-students/-/11664182/24159814/-/1qmt04z/-
/index.html#ixzz345fZxBQ1
Kozma, R. B. (1991). Learning with media. Review of Educational Research, 61(2), 179-
211.

110
Kulow, C. A. (2014). The impact of using Chromebook technology on student
engagement and student achievement of elementary students. (Doctoral
dissertation). Retrieved from ProQuest Dissertations and Theses database. (UMI
No. 3637331)
Kulik, J. A. (1994). Meta-analytic studies of findings on computer-based instruction.
Technology Assessment in Education and Training, 1, 9-34.
Lambert, E. E. W. (2014). Effect of a laptop initiative on middle school mathematics
achievement. (Doctoral dissertation). Retrieved from ProQuest Dissertations and
Theses database. (UMI No. 3621892)
Lauman, D. (2000). Student home computer use: A review of the literature. Journal of
Research on Computing in Education, 33(2), 196. Retrieved from
http://dx.doi.org/10.1080/08886504.2000.10782309
Lebo, A. E. (2014). The impact of 1:1 laptop utilization on student commitment to
learning in Iowa's public high schools. (Doctoral dissertation). Retrieved from
ProQuest Dissertations and Theses database. (UMI No. 3685694)
Lei, J., Conway, P. & Zhao, Y. (2007). The digital pencil: One-to-one computing for
children. New York: Lawrence Erlbaum Associates.
Lewis, S. K. (2004). The relationship of full-time laptop computer access to student
achievement and student attitudes in the middle school. (Doctoral dissertation).
Retrieved from ProQuest Dissertations and Theses database. (UMI No. 3129418)
111
Lemke, C., Coughlin, E., & Reifsneider, D. (2009). Technology in schools: What the
research says: An update. Teacher Librarian. 48-49(88). Retrieved from
http://search.proquest.com/docview/224872489/fulltextPDF /FDB31
7E614234C91PQ/1?accountid=4732Lunenburg, F. C., & Irby, B. J. (2008).
Writing a successful thesis or dissertation: Tips and strategies for students in the
social and behavioral sciences. Thousand Oaks, CA: Corwin Press.
Maninger, R. M., & Holden, M. (2009). Put the textbooks away: Preparation and support
or a middle school one-to-one laptop initiative. American Secondary
Education, 38(1), 5-33.
McKay, E. (2005, October). Human-computer interaction closes the digital divide: a
multicultural, intergenerational ICT case study. Retrieved from http://crpit.co
m/confpapers/CRPITV46McKay.pdf
Means, B., Olson, K., & Ruskus, J. A. (1995). Technology's role in education reform:
Technical research report. SRI International. Washington D.C.
Meyer, L. (2013). Report: Interest in flipped classrooms surpasses other digital learning
trends. The Journal. Retrieved from http://thejournal.com /articles
/2014/03/21/report-interest-in-flipped-classrooms-surpasses-other-digital-
learning-trends.aspx
Mills, C. E. (2010). Laptop education: Impact on learning and achievement. (Doctoral
dissertation). Retrieved from ProQuest Dissertations and Thesis database. (UMI
No. 347632)

112
Missouri Department of Elementary and Secondary Education. (2007). Missouri
Assessment Program: (Report No 2007). Jefferson City, MO: Author. Retrieved
from https://dese.mo.gov/sites/default/files/Final-MAP-Tech-Report.pdf
Missouri Department of Elementary and Secondary Education. (2009a) Missouri
Assessment Program grade level assessments: Technical report 2009. Jefferson
City, MO: Author. Retrieved from https://dese.mo.gov/sites/default/files/2009-
MAP-Technical-Report.pdf
Missouri Department of Elementary and Secondary Education. (2009b). Missouri
Assessment Program guide to interpreting results. Jefferson City, MO: Author.
Retrieved from https://dese.mo.gov/sites/default/files/2009-MAP-Technical-
Report.pdf
Missouri Department of Elementary and Secondary Education. (2014, March 19).
Missouri school improvement process (website), dese.mo.gov. Retrieved from:
https://dese.mo.gov/sites/default/files/MSIP-5-comprehensive-guide.pdf
Missouri Department of Elementary and Secondary Education. (2015, April 4). Missouri
school improvement process (website). Retrieved from DESE:
http://mcds.dese.mo.gov/guidedinquiry/School%20Report%20Card/School%20R
eport%20Card.aspx
Mouza, C. (2008). Learning with laptops: Implementation and outcomes in an urban,
under-privileged school. Journal of Research on Technology in Education, 40(4),
447-472.

113
Murphy, A. (2013). Putting teachers at the center of education. Retrieved from
http://www.slate.com/articles/technology/future_tense/2014/07/mit_blossoms_ed
ucational_tech_needs_nothing_but_a_tv_and_vcr.html
Nagel, D. (2013). 6 technology challenges facing education. The Journal. Retrieved from
https://thejournal.com/articles/2013/06/04/6-technology-challenges-facing-
education.aspx.
Niemeyer, D. C. (2003). Hard facts on smart classroom design: Ideas, guidelines, and
layouts. Landham, MD: Bowman & Littlefield.
O’Dwyer, L., Russell, M., Bebell, D., & Seeley, K. (2008). Examining the Relationship
between Students’ Mathematics Test Scores and Computer Use at Home and at
School. Journal of Technology, Learning, and Assessment, 6(5). Retrieved from
http://www.jtla.org.
O'Malley, P., Lewis, M. E. B., & Donehower, C. (2013). Using tablet computers as
instructional tools to increase task completion by students with autism. Retrieved
from http://eric.ed.gov/?id=ED541157
One-to-One Institute (2010). The technology factor. Retrieved from https://www.k12blu
eprint.com/sites/default/files/Project-RED-Technolgy-Factor.pdf
Orlin, B. (2013, September 9). When memorization gets in the way of learning. The
Atlantic. Retrieved from http://www.theatlantic.com/education/archive/2013
/09/when- memorization-gets-in-the-way-of-learning/279425/
Owston, R., & Wideman, H. (2001). Computer access and student achievement in the
early school years. Journal of Computer Assisted Learning, 17(4), 433-444.
114
Ozerbas, M., & Erdogan, B. (2016). The Effect of the Digital Classroom on Academic
Success and Online Technologies Self-Efficacy. Educational Technology &
Society, 19(4), 203–212.
Penuel, W. R. (2006). Implementation and effects of one-to-one computing initiatives: A
research synthesis. Journal of Research on Technology in Education, 38(3), 329-
348.
Peterson, P. L., & Wilson, S. M. (2006). Theories of learning and teaching: What do they
mean for educators?. Washington, DC: National Education Association.Reeves,
C. (2003). Implementing the No Child Left Behind Act: Implications for rural
schools and districts. Retrieved from http://c3ta.org/kb_files/NCLB_Rural
PolicyBrief.pdf
Roberts, C. M. (2010). The dissertation journey: A practical and comprehensive guide to
planning, writing, and defending your dissertation [Kindle DX version].
Retrieved from http://www.amazon.com/The-Dissertation-Journey-Practical-
Comprehensive/dp/1412977983
Rockman, S. (2007). It's my laptop. Threshold, 4(4), 21-25.
Rose, D. H., & Meyer, A. (2002). Teaching every student in the digital age: Universal
design for learning. Alexandria, VA: Association for Supervision and Curriculum
Development.
Russell, M., Bebell, D., & Higgins, J. (2004). Laptop learning: A comparison of teaching
and learning in upper elementary classrooms equipped with shared carts of
laptops and permanent 1:1 laptops. Journal of Educational Computing Research,
30(4), 313-330.
115
Schencker, L. (2014, August 26). Flipping Utah Schools: Lessons at home, homework in
class. The Salt Lake Tribune. Retrieved from http://www.sltrib.com/
sltrib/news/58298169-78/students-class-watch-teacher.html.csp
Scull, J., & Winkler, A. M. (2011). Shifting Trends in Special Education. Thomas B.
Fordham Institute. Retrieved from http://www.edexcellencemedia.net/public
ations/2011/20110525ShiftingTrendsinSpecialEducation/ShiftingTrendsinSpecial
Education.pdf
Shapley, K. S., Sheehan, D., Maloney, C., & Caranikas-Walker, F. (2010). Evaluating the
implementation fidelity of technology immersion and its relationship with student
achievement. The Journal of Technology, Learning and Assessment, 9(4). 6-68.
Sharples, M., Taylor, J., & Vavoula, G. (2005). Towards a theory of mobile learning.
Proceedings of mLearn 2005, 1(1), 1-9. Retrieved from
http://s3.amazonaws.com/academia.edu.documents/4272836/towards_a_theory_o
f_mobile_learning.pdf?AWSAccessKeyId=AKIAJ56TQJRTWSMTNPEA&Expi
res=1483466561&Signature=f19iFjdO%2FTfoboOVtMuGCyDAP80%3D&respo
nse-contentdisposition=inline%3B%20filename%3
DTowards_a_theory_of_mobile_learning.pdf
Silvernail, D. (2007). The impact of the Maine Learning Technology Initiative on
teachers, students, and learning. Retrieved from
http://usm.maine.edu/cepare/mlti.html.
116
Silvernail, D. & Lane, D. (2004). The impact of Maine’s one-to-one laptop program on
middle school teachers and students. Retrieved from Maine Education Policy
Research Institute, University of Southern Maine website: http://www.usm.m
aine.edu/sites/default/files/Center%20for%20Education%20Policy%2C%20Appli
e d%20Research%2C%20and%20Evaluation/MLTI_Report1.pdf
Sims, Z (2014). Education needs to change as fast as technology. Forbes. Retrieved from
https://www.forbes.com/sites/techonomy/2014/05/23/education-needs-to-change-
as-fast-as-technology/#725bef881ed2Smith, D. F. (2012, June 12) How flipped
classrooms are growing and changing. Retrieved from
http://www.edtechmagazine.com/k12/article/2014/06/how-flipped-classrooms-
are-growing-and-changing
Spektor-Levy, O., & Granot-Gilat, Y. (2012). The Impact of learning with laptops in 1:1
classes on the development of learning skills and information literacy among
middle school students. Interdisciplinary Journal of E-Learning & Learning
Objects, 8(1), 83-96
Staib, M. (2011). An examination of 21st century tools in student work in a grade 6
classroom. (Doctoral dissertation). Retrieved from ProQuest Dissertations and
Theses database. (UMI No. 3477342)
Sutton, N. (2015, March 26). What the research says about 1:1. Edutopia [Blog post].
Retrieved from http://www. edutopia.org/discussion/what-research-says-about-11
Thompson, A. D. (2013). Technology in teacher education: Major milestones in our
history. Journal of Digital Learning in Teacher Education 29(4), 109.

117
Tomlinson, S. (2005). Education in a post welfare society. Buckingham. PA, McGraw-
Hill International.Toffler, A. (1970). Future shock. New York, NY, Bantam
Towler, L. (2014). Deeper learning: Moving students beyond memorization. Retrieved
from http://neatoday.org/2014/11/25/deeper-learning-moving-students-beyond-
memorization-2/
Tusch, E. G. (2012). Expect surprises with 1-to-1 laptops. Education Digest, 78(3), 41-
45. Retrieved from http://essentialconditionswiki.pbworks.com/w/file/fetch/615
08608/82981851.pdf
United States Department of Education. (2005, December 14). High school facts at a
glance. Retrieved from http://www.ed.gov/print/about/offices/list /ovae/pi/hs
/hsfacts.html
United States Department of Labor. (2010, December 16). Current Employment Statistics
Database. Retrieved from https://www.bls.gov/bls/news-release/empsit.htm
Van der Kleij, F. M., Feskens, R. C., & Eggen, T. J. (2015). Effects of feedback in a
computer-based learning environment on students’ learning outcomes: A meta-
analysis. Review of Educational Research, 85(4), 475-511. Retrieved from
https://www.researchgate.net/profile/Theo_Eggen/publication/272923307_Effects
_of_Feedback_in_a_Computer-Based_Learning_Environment_on_Students'_
Learning_Outcomes_A_Meta-Analysis/links/5592911e08ae5af2b0eb335f.pdf
Vockley, M. (2007). Maximizing the impact: The pivotal role of technology in a 21st
century education system. Retrieved from http://files.eric.ed.gov/fulltext/ED
519463.pdf

118
Wade, M. (2010). Laptops and the gender gap: An investigation of a high school core
curriculum program (Doctoral Dissertation). Retrieved from ProQuest
Dissertations and Theses database. (UMI No. 3397129)
Walderman, B. (2014, October 14). Technology is not the answer, a student’s
perspective. Retrieved from website http://www.edweek.org/ew/articles/
2014/10/15/08walderman.h34.html
Walsh, K. (2012, April 18). Why every student should be in a 1:1 classroom. Retrieved
from Emerging Education Technology Website: http://www.emergingedtech.com
/2012/04/ why-every-student-should-be-in-a-11-classroom
Walters, J. L. (2012). English language learners' reading self-efficacy and achievement
using 1: 1 mobile learning devices. (Doctoral dissertation). Retrieved from
ProQuest Dissertations and Theses database. (UMI No. 3503627).
Warschauer, M., & Zheng, B. (2016) Why schools should provide one laptop per child.
Retrieved from https://theconversation.com/why-schools-should-provide-one-
laptop-per-child-58696
Winerman, L. (2013). Breaking free from addiction. Monitor on Psychology: A
publication of the American Psychological Association, 44(6), 30-34.
Zhang, M., Trussell, R. P., Gallegos, B., & Asam, R. R. (2015). Using math apps for
improving student learning: an exploratory study in an inclusive fourth grade
classroom. Techtrends, 59(2), 32-39.

119
Appendices

120
Appendix A: District X Proposal for Research Permission Form

121
Park Hill School District
April 15, 2014
Dear Mr. Van Batavia:
Per Park Hill School District Board Policy, external agencies or individuals desiring
to conduct research studies involving either students or staff members during the
school day must submit a written prospectus to the Superintendent, or designee, for
approval prior to initiation of the study. To be approved, all such research proposals
must demonstrate that the projected findings will have value to either the District
as a whole or to a unit within the District, and not be unduly disruptive or time
consuming to the normal educational process.
The Park Hill School District recognizes the importance of research as a means of
improving the instructional program for the District’s students and also recognizes
the need to monitor and control the amount of time and energy expended by both
staff and students on research projects.
I have had the opportunity to review the prospectus for the research project entitled
The Effect of Flipped Classroom Instruction on Student Achievement as well
as speak to the principal at the school regarding the project. It is my pleasure to
approve the project The Effect of Flipped Classroom Instruction on Student
Achievement and the use of relevant Park Hill School District data, classrooms and
students within the project. I find the project to have value to the district, support
the goals of the district, and not be unduly disruptive or time consuming to the
educational process.
Please contact me if you have any questions.
Cordially,
Mike Kimbrel, Ph.D.
Director of Research, Evaluation, & Assessment
Park Hill School District

122
Appendix B: Baker University IRB Proposal for Research Permission Form

123

124
Summary
In a sentence or two, please describe the background and purpose of the research.
The setting for this study was District X, a suburban school district serving the
following Kansas City Northland metropolitan neighborhoods in the southern part of
Platte County: Parkville, Riverside, Houston Lake, Weatherby Lake, Platte Woods, and
Lake Waukomis. This public school district, with pre-kindergarten programs through
grade 12, reported an enrollment of 10,504 students for the 2013-2014 school year.
The first purpose of this study is to determine if there are differences in 5th grade
student achievement on the MAP English Language Arts (ELA) and mathematics
assessments between students who participated in the one-to-one laptop initiative and
students who did not participate in the initiative during the 2012-2013 school years. The
second purpose is to determine whether the differences in 5th grade student achievement
on the MAP ELA and mathematics assessments between students who participated in the
one-to-one laptop initiative and students who did not participate in the initiative are
affected by one if the following variables: student gender, race, or SES during the 2012-
2013 school year. The third purpose is to determine if there are differences in 6th grade
student achievement on the MAP ELA and mathematics assessments among students
who participated in the one-to-one laptop initiative during 2012-2013 and 2013-2014,
students who participated in the one-to-one laptop initiative during 2012-2013 and who
did not participate in the initiative during 2013-2014, students who did not participate in
the one-to-one laptop initiative during 2012-2013 and did participated in the one-to-one
laptop initiative during 2013-2014, and students who did not participate in the one-to-one
laptop initiative during 2012-2013 and 2013-2014. The final purpose of the study is to
determine whether the differences in 6th grade student achievement on the MAP ELA
and mathematics assessments among students who participated in the one-to-one laptop
initiative during 2012-2013 and 2013-2014, students who participated in the one-to-one
laptop initiative during 2012-2013 and who did not participate in the initiative during
2013-2014, students who did not participate in the one-to-one laptop initiative during
2012-2013 and did participated in the one-to-one laptop initiative during 2013-2014, and
students who did not participate in the one-to-one laptop initiative during 2012-2013 and
2013-2014 are affected by one if the following variables: student gender, race, or SES.
Briefly describe each condition or manipulation to be included within the study.
Some students have participated in the 1-1 initiative and some students have not
participated in the 1-1 initiative.
What measures or observations will be taken in the study? If any questionnaire or
other instruments are used, provide a brief description and attach a copy.
Will the subjects encounter the risk of psychological, social, physical, or legal risk?
If so, please describe the nature of the risk and any measures designed to mitigate
that risk.
125
No, subjects will not encounter psychological, social, physical, or legal risk. All data
used in this study will be archival data.
Will any stress to subjects be involved? If so, please describe.
There will be no stress to the subjects involved, as the data is archival.
Will the subjects be deceived or misled in any way? If so, include an outline or
script of the debriefing.
No, the subjects will not be deceived or misled in any way.
Will there be a request for information which subjects might consider to be personal
or sensitive? If so, please include a description.
There will be no request for information which subjects consider personal or sensitive.
Will the subjects be presented with materials which might be considered to be
offensive, threatening, or degrading? If so, please describe.
Subjects will not be presented with materials which might be considered to offensive,
threatening, or degrading.
Approximately how much time will be demanded of each subject?
The subjects will not be asked to complete any extra time because the MAP is a part of
Districts X’s assessment program and the data is archival.
Who will be the subjects in this study? How will they be solicited or contacted?
Provide an outline or script of the information which will be provided to subjects
prior to their volunteering to participate. Include a copy of any written solicitation
as well as an outline of any oral solicitation.
The population under examination is 5th and 6th grade students attending District X. The
sample includes those students who were enrolled in 5th grade during the 2012-2013
school year and 6th grade during the 2013-2014 school year. The sample includes
students who were enrolled in either the regular education classes of mathematics and
ELA for the established grades and has demographic information available for the study.
However, all data is archival and no one will be solicited.
What steps will be taken to insure that each subject’s participation is voluntary?
What if any inducements will be offered to the subjects for their participation?
There is no need to solicit participation. Only archival data will be used for this study.
126
How will you insure that the subjects give their consent prior to participating? Will
a written consent form be used? If so, include the form. If not, explain why not.
No consent is required because only archival data will be used for this study.
Will any aspect of the data be made a part of any permanent record that can be
identified with the subject? If so, please explain the necessity.
No data will be made part of any permanent record than can be identified with the
subject.
Will the fact that a subject did or did not participate in a specific experiment or
study be made part of any permanent record available to a supervisor, teacher or
employer? If so, explain.
The fact that a subject did or did not participate in the study will not be made part of any
permanent record available to a supervisor, teacher, or employer.
What steps will be taken to insure the confidentiality of the data? Where will it be
stored? How long will it be stored? What will be done with it after the study is
completed?
All data will be provided by the District X and no identifiable information will be
requested. The information will be stored in password protected technology. The
information will be kept only until the researcher completes the degree process. The data
will be destroyed at the completion of the candidate’s doctoral degree.
If there are any risks involved in the study, are there any offsetting benefits that
might accrue to either the subjects or society?
There are no risks involved in this study.
Will any data from files or archival data be used? If so, please describe.
Archival data will be collected for scale scores during the 2012 – 2015 school years for
5th and 6th grade students on the ELA MAP and on the math MAP in the District X. This
archival data will include the student gender, student SES, and student race.

127
Appendix C: IRB Renewal

128
Baker University Institutional Review Board
October 27, 2016 Dear Brian Van Batavia and Dr. Rogers:
The Baker University IRB has reviewed your research project renewal application and approved this project under Expedited Status Review. As described, the project complies with all the requirements and policies established by the University for protection of human subjects in research. Unless renewed, approval lapses one year after approval date.
Please be aware of the following:
1. Any significant change in the research protocol as described should be
reviewed by this Committee prior to altering the project. 2. Notify the IRB about any new investigators not named in original
application. 3. When signed consent documents are required, the primary investigator
must retain the signed consent documents of the research activity. 4. If this is a funded project, keep a copy of this approval letter with your
proposal/grant file. 5. If the results of the research are used to prepare papers for publication or
oral presentation at professional conferences, manuscripts or abstracts are requested for IRB as part of the project record.
Please inform this Committee or myself when this project is terminated or completed. As noted above, you must also provide IRB with an annual status report and receive approval for maintaining your status. If you have any questions, please contact me at [email protected] or 785.594.7881.
Sincerely,
Erin Morris PhD Chair, Baker University IRB Baker University IRB Committee Joe Watson, PhD Nate Poell MA Susan Rogers PhD Scott Crenshaw