the effectiveness of underride guards for heavy trailers
TRANSCRIPT

DOT HS 811 375 October 2010
The Effectiveness of Underride Guards for Heavy Trailers

DISCLAIMER
This publication is distributed by the U.S. Department of Transportation, National Highway Traffic Safety Administration, in the interest of information exchange. The opinions, findings, and conclusions expressed in this publication are those of the authors and not necessarily those of the Department of Transportation or the National Highway Traffic Safety Administration. The United States Government assumes no liability for its contents or use thereof. If trade names, manufacturers’ names, or specific products are mentioned, it is because they are considered essential to the object of the publication and should not be construed as an endorsement. The United States Government does not endorse products or manufacturers.

i
Technical Report Documentation Page 1. Report No.
DOT HS 811 375
2. Government Accession No. 3. Recipient’s Catalog No.
4. Title and Subtitle
The Effectiveness of Underride Guards for Heavy Trailers 5. Report Date
6. Performing Organization Code
7. Author(s)
Kirk Allen, Ph.D. 8. Performing Organization Report No.
9. Performing Organization Name and Address
Evaluation Division; National Center for Statistics and Analysis National Highway Traffic Safety Administration Washington, DC 20590
10. Work Unit No.
(TRAIS)
11. Contract or Grant No.
12. Sponsoring Agency Name and Address
National Highway Traffic Safety Administration 1200 New Jersey Avenue SE. Washington, DC 20590
13. Type of Report and Period Covered
NHTSA Technical Report 14. Sponsoring Agency Code
15. Supplementary Notes
16. Abstract
Federal Motor Vehicle Safety Standards (FMVSS) Nos. 223 and 224 require underride guards meeting a strength test on trailers with a GVWR of 10,000 pounds or greater manufactured on or after January 24, 1998. FMVSS No. 224 defines the size requirements for the guards, while FMVSS No. 223 describes strength testing and energy absorption requirements for DOT-compliant guards. This report is a statistical analysis of crash data aimed at determining the effectiveness of FMVSS-compliant underride guards at preventing fatalities and serious injuries in crashes where a passenger vehicle impacts the rear of a tractor-trailer. The primary findings are the following:
Data from Florida and North Carolina showed decreases in fatalities and serious injuries to passenger vehicle occupants when rear-ending a tractor-trailer subsequent to the implementation of FMVSS 223 and 224. However, the observed decreases are not statistically significant at the 0.05 level, possibly due to the small sample sizes of the data.
Using supplemental data collection from North Carolina, it is shown that passenger vehicle passenger compartment intrusion is more apt to occur when the corner of the trailer is impacted, rather than the center of the trailer. This result is statistically significant at the 0.01 level.
It is not possible to establish a nationwide downward trend in fatalities when a passenger vehicle rear-ends a tractor-trailer – neither in terms of total number of fatalities, percentage of fatalities in rear impacts relative to other passenger vehicle fatalities involved in tractor-trailer accidents, nor number of fatal crashes per 1,000 total crashes. The Fatality Analysis Reporting System does not list the model year of the trailer.
17. Key Words
NHTSA; NCSA; FARS; State Data System; underride; heavy vehicles; tractors; trailers
18. Distribution Statement
Document is available to the public from the National Technical Information Service www.ntis.gov
19. Security Classif. (Of this report)
Unclassified
20. Security Classif. (Of this page)
Unclassified
21. No. of Pages
41
22. Price
Form DOT F 1700.7 (8-72) Reproduction of completed page authorized

ii
Executive Summary This report is a statistical analysis of several crash databases to determine the effectiveness of underride guards at preventing fatalities and injuries in crashes where a passenger vehicle impacts the rear of a tractor-trailer. NHTSA mandates that all trailers with GVWR of 10,000 pounds or greater manufactured on or after January 26, 1998, be equipped with an underride guard. The dimensional requirements are specified in FMVSS No. 224 (Rear Impact Protection), while the strength testing and energy absorption requirements are outlined in FMVSS No. 223 (Rear Impact Guard). The Truck Trailer Manufacturers Association (TTMA) issued a voluntary Recommended Practice RP 92-94, Rear Impact Guard and Protection in April 1994, including the dimensional requirements of the subsequent NHTSA standard (FMVSS 224) but lacking the energy absorption requirement (FMVSS 223). From 1952, to 1998, trailers and semi-trailers were Federally regulated by Federal Motor Carrier Safety Regulations that mandated rear impact guards, but allowed substantially smaller guards than the NHTSA standard and the TTMA recommended practice. These standards also allowed the guards to be set further from the rear of the trailer and imposed no strength tests on the guards. Several data sources were analyzed to determine the effectiveness of FMVSS-compliant underride guards, relative to the guards in use prior to model year 1994, in terms of preventing fatalities and serious injuries. Using the Fatality Analysis Reporting System (FARS), it was not possible to determine a reduction in passenger vehicle fatalities. The model year of the trailer is not recorded in FARS, thus no precise analysis can be performed in terms of the type of underride guard on the trailer. The total number of passenger vehicle fatalities when rear-ending a tractor-trailer has not decreased over the years in terms of total number of fatalities, percentage of fatalities in rear-end impacts relative to other passenger vehicle fatalities involved in tractor-trailer accidents, or in number of fatal crashes per 1,000 total crashes. Two data sources contain the model year of the trailer – data from Florida in NHTSA’s State Data System and data from North Carolina in a special data collection project coordinated through the State Highway Patrol. There are reductions of passenger vehicle fatalities and serious injuries in rear-end collisions with trailers subsequent to the implementation of FMVSS 223 and 224, relative to pre-standard trailers, and relative to other collisions between passenger vehicles and tractor-trailers. The results from Florida are based on more crashes from a greater number of calendar years than the results from North Carolina. In Florida, there is an observed 27 percent reduction in fatalities for trailers that should be equipped with FMVSS-compliant underride guards and a 7 percent reduction in fatalities or serious injuries; however, neither reduction is statistically significant at the 0.05 level. External factors were considered but did not appreciably change the effectiveness calculation – these included roadway classification, passenger car versus LTV, restraint use in the passenger vehicle, and age of the tractor portion

iii
(power unit) of the tractor-trailer. The results from North Carolina are numerically higher than the results from Florida, but also not statistically significant at the 0.05 level – an observed 83 percent reduction in fatalities (marginally significant at the 0.10 level) and a 57 percent reduction in fatalities or serious injuries. These results are more uncertain because there is much less data than in Florida, thus extraneous factors are not accounted for. Taken together, the results from Florida and North Carolina are consistent with expectations at the time of publication of the Final Rule that FMVSS-compliant guards would be responsible for a reduction in fatalities and, to a lesser extent, serious injuries to passenger vehicle occupants. But they are not unequivocal evidence that the guards are effective and the FARS analysis shows that there remains room for improvement. In North Carolina, supplementary information was collected about the angle of impact and the extent of passenger vehicle compartment intrusion. It is clear that impacts into the rear corners of the trailer are more prone to passenger compartment intrusion compared to impacts into the center rear portion of the trailer, regardless of the type of underride guard. For FMVSS-compliant guards, the proportion of crashes with intrusion when a passenger vehicle impacts the rear center of a trailer is significantly lower than for crashes in which a passenger vehicle impacts the rear corner of a trailer. The result is statistically significant at a 0.01 level.

iv
Table of Contents List of Abbreviations .........................................................................................v
Background on underride guards .......................................................................1
Fatal crashes in the United States ......................................................................3
Analysis of fatal and nonfatal crashes in two States ........................................16
Florida – State Data System .......................................................................16 North Carolina – Special data collection ...................................................24
North Carolina – Supplementary data elements ........................................26
Consideration of intermediate model years 1994-1997 .............................30
v
List of Abbreviations ABS Antilock brake system
CY Calendar Year
DF Degrees of Freedom
FARS Fatality Analysis Reporting System, a census of fatal crashes in the United States since 1975
FMCSA Federal Motor Carrier Safety Administration
FMVSS Federal Motor Vehicle Safety Standard
GVWR Gross vehicle weight rating, specified by the manufacturer, equals the vehicle’s curb weight plus maximum recommended loading
IIHS Insurance Institute for Highway Safety
LTCCS Large Truck Crash Causation Study
LTV Light Trucks and Vans, includes pickup trucks, SUVs, minivans, and full-size vans
MY Model year
NHTSA National Highway Traffic Safety Administration
PCI Passenger compartment intrusion
SAS Statistical analysis software produced by SAS Institute, Inc.
URG Underride Guard
USDOT United States Department of Transportation
VIN Vehicle Identification Number

1
Background on underride guards
Federal Motor Vehicle Safety Standards (FMVSS) Nos. 223 and 224 require underride guards meeting a strength test on trailers with a GVWR of 10,000 pounds or greater manufactured on or after January 24, 1998. FMVSS No. 224 defines the size requirements for the guards (Figure 1), while FMVSS No. 223 describes strength testing and energy absorption requirements for DOT-compliant guards.1 The final rule, published in 1996,2 considers collisions involving passenger vehicles with trucks, trailers, and semitrailers to be an important safety issue, citing 11,551 rear-end collisions that resulted in approximately 423 passenger vehicle occupant fatalities and 5,030 non-fatal injuries.
Figure 1: Configuration requirements for underride guard (FMVSS 224)
The dimensional requirements of the underride guard are the following (Figure 1): – Maximum height above ground: 560 mm. (22 inches) – Maximum distance from side extremities: 100 mm. (4 inches)
1 Code of Federal Regulations, Title 49, Parts 571.223 and 571.224 2 Federal Register, Vol. 61, No. 16, page 2004

2
– Maximum offset from rear plane of trailer: 305 mm. (12 inches) The energy absorption and strength test requirements are defined at the locations in Figure 2:
– The guard shall resist a force of 50,000 N at points P1 and P2 without deflecting more than 125mm.
– The guard shall resist a force of 100,000 N at point P3 without deflecting more than 125mm.
– The guard shall absorb an energy of 5,560 J within the first 125mm of deflection at each P3 location.
Figure 2: Strength test and energy absorption test locations (FMVSS 223)
These standards replaced a part of the Federal Motor Carrier Safety Regulations (effective January 1, 1952, to January 25, 1998) that required rear-impact guards but of substantially smaller size and lacking a strength test. In accordance with the Truck Trailer Manufacturers Association’s recommended practice (April 1994), some vehicle manufacturers voluntarily installed rear impact guards before 1998. These rear impact guards meet the size requirements of FMVSS No. 224 but it is unknown if they were tested or if they would have met the strength requirements of FMVSS No. 223.
The FMVSS compliant URG is contrasted with the old FHWA style guard in Figure 3. This diagram was provided with a special data collection project in North Carolina, the results of which are discussed later in the report.

3
Figure 3: Comparison of old FHWA guard and FMVSS-compliant guard (North Carolina special data collection project)
In 1992 and 1993, NHTSA's Vehicle Research & Test Center conducted crash tests of trailers with a guard mounted at 560 mm ground-clearance and attached flush with the trailer. Seven tests were conducted with subcompact cars with low hood profiles (Corsica, Saturn) and masses between 1135 and 1590 kg (2,500 and 3,200 pounds). The tests were conducted at 48 km/h (29 mph). Four of the seven tests resulted in no passenger compartment intrusion when the guard was mounted flush with the rear of the trailer. Two of the seven resulted in PCI due to failure of the guard attachments. One case had PCI by the hood, but the extent was minimal such that the crash test dummy was not contacted. A Canadian study published in 20003 found that an FMVSS 223/224-compliant guard provided good protection of the passenger compartment for an LTV (Windstar mini-van) at 48 km/h (29 mph). This guard was unable to prevent passenger compartment intrusion in a small passenger car (Honda Civic at 56 km/h or 34 mph) or for an average-sized passenger car (Chevrolet Cavalier at 48 km/h or 29mph). A guard with a lower clearance (480 mm instead of 560 mm, refer to Figure 1) allowed successful engagement with both passenger cars at 48 km/h (29 mph) but again failed to prevent compartment intrusion in the Cavalier at 65 km/h (39 mph). Fatal crashes in the United States The Fatality Analysis Reporting System is a national census of motor vehicle crashes that result in a fatality to a motor vehicle occupant or a nonmotorist. Crashes involving heavy vehicles, including tractor-trailers, are recorded in FARS, but the model year of the trailer is not provided. FARS can therefore only be used to examine a trend in fatal accidents for each calendar year. As the older trailers with no underride guard or with the older FHWA type are retired or become less used with age, the percentage of the on-road vehicle fleet
3 Boucher, D., & Davis, D. (2000) Trailer Underride Protection – A Canadian Perspective. SAE Technical Paper Series, paper 2000-01-3522.

4
with the FMVSS-compliant underride guard should increase over time. Thus, if the new URG is effective at reducing fatalities, there should be a decrease in fatal crashes where the rear of the trailer is impacted by a passenger vehicle. The effectiveness of the new URG might be evidenced by a reduction of fatalities in rear-end crashes relative to other types of fatal crashes. Many unknown factors influence the number of crashes per calendar year, such as economic activity and improvements in passenger vehicle front-end safety. However, the many other factors that affect trends in the distributions of crashes involving passenger vehicles and tractor-trailers could mask the effect, if any, of the new URG. The crashes of interest are the following:
– there are exactly two vehicles – VE_FORMS = 2 in the ACCIDENT datafile
– one vehicle is a tractor towing exactly one trailer – BODY_TYP = 66 (calendar year 1991 to 2008) – BODY_TYP = 74 (calendar year 1985 to 1990) – TOW_VEH = 1
– the other vehicle is a passenger car or LTV – the categories are too numerous to list but can be found in FARS Analytic
Reference Guide4 – the initial point of impact (IMPACT1) is used to identify crashes where a
passenger vehicle impacts with its front (IMPACT1 = 11, 12, or 1) into the rear of a tractor-trailer (IMPACT1 = 5, 6, or 7)
– the contrasting group of crashes are those where a passenger vehicle impacts with its front (as above, IMPACT1 = 11, 12, or 1) into some other portion of a tractor-trailer (IMPACT1 = 1, 2, 3, 4, 8, 9, 10, 11, or 12, i.e., all clock points other than 5, 6, and 7)
An important consideration in tractor-trailer impacts is the ambient light condition. According to FMVSS 108, all tractor-trailers manufactured after December 1, 1993 must be equipped with reflective tape. Further, all tractor-trailers, regardless of manufacture date, must have been retrofitted with reflective tape by June 1, 2001. Reflective tape has been shown to be highly effective at reducing side and rear impacts into trailers in dark conditions, especially more severe crashes including those with a fatality5. Even if the model year of the trailer were known, it would not be possible to state definitively if it had reflective tape for crashes occurring before June 1, 2001. To account for this in the analysis, crashes are separated according to whether the ambient lighting was daylight (LGT_COND = 1) or not daylight (LGT_COND = 2, 3, 4, or 5).
Crashes that occurred during daylight are the primary condition under which trends will be analyzed. Table 1 shows the number of crashes for three situations:
4 FARS Analytic Reference Guide1975 to 2008, page V-7. (2009). DOT HS 811 137. Washington, DC: National Highway Traffic Safety Administration. 5 Morgan, C. (2001). The Effectiveness of Retroreflective Tape on Heavy Trailers, DOT HS 809 222. Washington, DC: National Highway Traffic Safety Administration.

5
(A) passenger vehicle impacts with its front into the rear of a tractor-trailer (B) passenger vehicle impacts with its front into some other area of a tractor-trailer (C) other impacts between a passenger vehicle and a tractor-trailer
Table 1: Number of fatal crashes between a tractor-trailer and a passenger vehicle
DAYLIGHT NOT DAYLIGHT ALL
CY(A) (B) (C)
(A) ÷ (B+C)
(A) (B) (C)(A) ÷ (B+C)
(A) (B)(A) ÷
(C)(B+C)
1985 74 422 465 0.083 206 361 205 0.364 280 783 670 0.1931986 82 381 423 0.102 192 336 187 0.367 274 717 610 0.2061987 88 349 408 0.116 192 364 201 0.340 280 713 609 0.2121988 86 421 413 0.103 226 340 220 0.404 312 761 633 0.2241989 106 361 400 0.139 199 366 192 0.357 305 727 592 0.2311990 99 341 373 0.139 199 323 192 0.386 298 664 565 0.2421991 79 337 345 0.116 157 284 184 0.335 236 621 529 0.2051992 92 311 355 0.138 164 322 169 0.334 256 633 524 0.2211993 99 356 349 0.140 187 305 167 0.396 286 661 516 0.2431994 107 404 378 0.137 169 321 185 0.334 276 725 563 0.2141995 99 392 379 0.128 187 293 189 0.388 286 685 568 0.2281996 126 436 396 0.151 156 347 184 0.294 282 783 580 0.2071997 117 474 434 0.129 185 346 222 0.326 302 820 656 0.2051998 129 430 433 0.149 154 375 191 0.272 283 805 624 0.1981999 142 430 463 0.159 136 353 211 0.241 278 783 674 0.1912000 122 446 423 0.140 166 338 196 0.311 288 784 619 0.2052001 127 472 395 0.146 118 297 179 0.248 245 769 574 0.1822002 123 432 429 0.143 138 310 194 0.274 261 742 623 0.1912003 131 410 386 0.165 151 291 222 0.294 282 701 608 0.2152004 159 438 418 0.186 145 269 220 0.297 304 707 638 0.2262005 142 429 402 0.171 152 289 190 0.317 294 718 592 0.2242006 132 370 386 0.175 145 284 186 0.309 277 654 572 0.2262007 136 412 345 0.180 119 246 184 0.277 255 658 529 0.2152008 96 314 330 0.149 120 227 157 0.313 216 541 487 0.210 The situation (A) is where the presence of the underride guard should show effectiveness. The situations (B) and (C) are where the presence of the underride guard should be irrelevant. The ratio of (A) over (B+C) is referred to as the odds (Figure 4). The odds should decrease, subject to controlling for ambient light condition. In daylight, there should be a decrease in rear-impacting fatalities compared to other fatalities. Clearly, this is not the case – the odds increases from around 0.10 in the earliest years to nearly 0.20 in the latest years. In the non-daylight condition, however, what is assumed to be the effect of conspicuity tape is confirmed – the number of crashes in each column decreases, to an extent that the odds remains approximately constant. The effect of conspicuity tape is not explicitly in Table 1 because the (B) column includes both frontal and side impacts. With some re-arrangement (not shown), the (B) crashes can be divided to crudely estimate the effect of conspicuity tape – [ (A) + (B side) ] ÷ [ (B front) + (C) ]. For the earliest calendar years, 1985 to 1989, when very few trailers would have had conspicuity tape or an underride guard, there were 1,598 impacts into the
6
rear or side of a tractor-trailer in non-daylight and 2,189 impacts into the front of a tractor-trailer or other crashes between a passenger vehicle and tractor-trailer in non-daylight (1,598 ÷ 2,189 = 0.730). For the most recent calendar years 2004 to 2008, when all trailers should have had conspicuity tape and many newer trailers with an FMVSS-compliant underride guard would have been in use, there were 1,173 front or side impacts, compared to 1,760 front impacts and other crashes. The ratio is 0.666, and it is 9 percent lower than that from 1985 to 1989. The analysis of conspicuity tape reported a reduction of 29 percent of collisions into the side or rear of trailers, using more rigorous methodology.5 A potentially confounding factor is the type of passenger vehicle – i.e., a passenger car or an LTV. Passenger cars, since they are typically lower to the ground, could be more apt to experience under-ride, regardless of the portion of the tractor-trailer impacted. Since the proportion of the vehicle fleet that is passenger car versus LTV varies by calendar year, this factor could undermine what is shown in Figure 4. Table 2 shows the portion of Table 1 where the passenger vehicle is a passenger car. For both daylight and not daylight, the trends in the ratio (A) ÷ (B+C) are comparable to those for all passenger vehicles.

7
Table 2: Number of fatal crashes between a tractor-trailer and a passenger car
DAYLIGHT NOT DAYLIGHT
CY(A) (B) (C)
(A) ÷ (B+C)
(A) (B) (C)(A) ÷ (B+C)
1985 47 316 368 0.069 155 264 166 0.3601986 54 299 333 0.085 142 259 154 0.3441987 70 265 315 0.121 147 255 159 0.3551988 59 323 328 0.091 170 249 167 0.4091989 64 235 307 0.118 135 270 149 0.3221990 69 236 289 0.131 127 221 142 0.3501991 52 220 249 0.111 102 192 131 0.3161992 62 220 268 0.127 112 214 125 0.3301993 63 247 257 0.125 125 198 110 0.4061994 66 273 264 0.123 109 203 136 0.3221995 55 255 268 0.105 133 184 136 0.4161996 75 274 278 0.136 94 229 127 0.2641997 65 285 296 0.112 121 220 150 0.3271998 76 266 288 0.137 91 214 126 0.2681999 84 263 324 0.143 83 195 139 0.2492000 70 261 282 0.129 95 200 132 0.2862001 63 280 251 0.119 73 179 106 0.2562002 66 245 276 0.127 83 171 124 0.2812003 61 233 241 0.129 84 167 143 0.2712004 83 248 263 0.162 83 148 130 0.2992005 68 244 231 0.143 83 151 112 0.3162006 64 190 240 0.149 82 156 102 0.3182007 67 216 204 0.160 68 125 112 0.2872008 45 166 189 0.127 66 116 93 0.316
Table 3 shows the crashes from Table 1 where the passenger vehicle is a light truck or van. Again, the trends in the target ratio (A) ÷ (B+C) are similar to those for passenger cars. Thus, it does not appear that the classification of passenger car versus LTV is under-mining the trend in Table 1.

8
Table 3: Number of fatal crashes between a tractor-trailer and a LTV
DAYLIGHT NOT DAYLIGHT
CY(A) (B) (C)
(A) ÷ (B+C)
(A) (B) (C)(A) ÷ (B+C)
1985 27 106 97 0.133 51 97 39 0.3751986 28 82 90 0.163 50 77 33 0.4551987 18 84 93 0.102 45 109 42 0.2981988 27 98 85 0.148 56 91 53 0.3891989 42 126 93 0.192 64 96 43 0.4601990 30 105 84 0.159 72 102 50 0.4741991 27 117 96 0.127 55 92 53 0.3791992 30 91 87 0.169 52 108 44 0.3421993 36 109 92 0.179 62 107 57 0.3781994 41 131 114 0.167 60 118 49 0.3591995 44 137 111 0.177 54 109 53 0.3331996 51 162 118 0.182 62 118 57 0.3541997 52 189 138 0.159 64 126 72 0.3231998 53 164 145 0.172 63 161 65 0.2791999 58 167 139 0.190 53 158 72 0.2302000 52 185 141 0.160 71 138 64 0.3512001 64 192 144 0.190 45 118 73 0.2362002 57 187 153 0.168 55 139 70 0.2632003 70 177 145 0.217 67 124 79 0.3302004 76 190 155 0.220 62 121 90 0.2942005 74 185 171 0.208 69 138 78 0.3192006 68 180 146 0.209 63 128 84 0.2972007 69 196 141 0.205 51 121 72 0.2642008 51 148 141 0.176 54 111 64 0.309
Table 2 and Table 3 are depicted graphically in Figure 4. The points are the annual values of the odds – from the column (A) ÷ (B+C). The trend line is a simple linear regression on the odds for each calendar year.

9
Figure 4: Odds of rear-end fatal crashes to other fatal crashes, by ambient lighting condition
0.0
0.1
0.2
0.3
0.4
0.5
1984 1986 1988 1990 1992 1994 1996 1998 2000 2002 2004 2006 2008
LTV day LTV dark Car day Car dark CalendarYear
Odds
Several observations can be made:
– The difference between daylight and darkness becomes less important in more recent calendar years.
– The difference between daylight and darkness is more exaggerated for cars than for LTVs.
– During daylight, when the effectiveness of the underride guard is not confounded by the presence of conspicuity tape, the trend is not in the expected direction. That is, the ratio of fatal crashes into the rear of a tractor-trailer should decrease relative to fatal crashes into other portions of a tractor-trailer.
The results presented in Table 1, Table 2, and Table 3, which are summarized in Figure 4, fail to reveal that the underride guard is effective at preventing fatal crashes where a passenger vehicle impacts the rear of a tractor-trailer. The lighting condition is crucial, to control for the presence of conspicuity tape on the trailer. The following figures are analogous to Figure 4 for several other potentially confounding conditions. The data for these figures are restricted to daylight crashes.
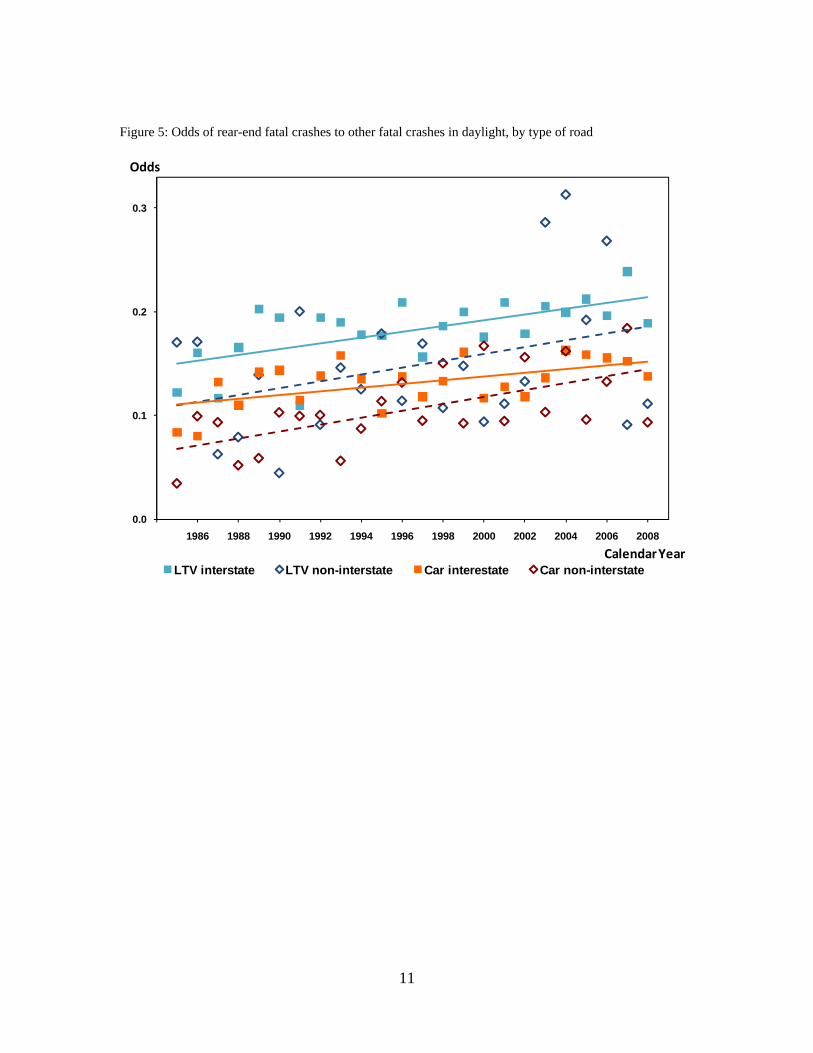
– Type of road: interstate versus non-interstate (Figure 5). The type of road can represent differences in both the prevailing road speeds and the type of surrounding traffic.
10
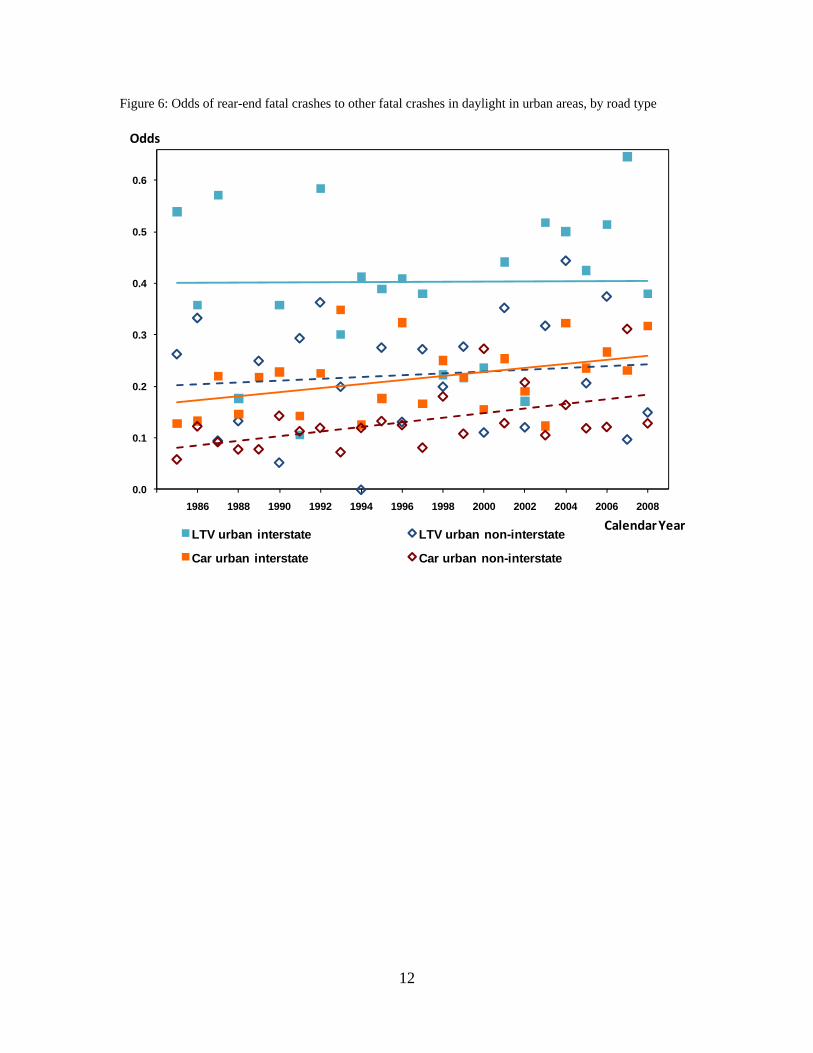
– Type of locality: urban interstate versus urban non-interstate (Figure 6). Nearly all rural crashes occur on interstates, and these crashes on rural interstates are the largest contributor to the total number of crashes. Crashes in urban areas more commonly occur on interstates but to a lesser degree than in rural localities.
– Presence of tractor anti-lock brakes (ABS): tractor MY 96- versus tractor MY 98+ (Figure 7). FMVSS No. 121, Air Brake Systems, mandates antilock braking systems on virtually all new air-braked vehicles with a GVWR of 10,000 pounds or greater. ABS is required on tractors manufactured on or after March 1, 1997 and air-braked semi-trailers and single-unit trucks manufactured on or after March 1, 1998. This means that some tractors manufactured with the model year 1997 may not have ABS and some with model years 1996 and earlier might have voluntary ABS installations. The ABS might be a secondary effect that could alter the types of crashes tractor-trailers are involved in.
– Age of tractor at the time of the crash: tractor age ≤ 5 versus tractor age ≥ 6 (Figure 8). The model year as used above to investigate ABS equipment is similar to tractor age, but the full range of data cannot be used to estimate a trend because there was no ABS requirement for tractors prior to calendar year 1997. Using age explicitly, all calendar years can be compared. If viewed in tandem with ABS, there are several combinations, such as old tractors without ABS versus new tractors without ABS or old tractors without ABS versus new tractors with ABS.
11
Figure 5: Odds of rear-end fatal crashes to other fatal crashes in daylight, by type of road
0.0
0.1
0.2
0.3
1984 1986 1988 1990 1992 1994 1996 1998 2000 2002 2004 2006 2008
LTV interstate LTV non-interstate Car interestate Car non-interstateCalendarYear
Odds
12
Figure 6: Odds of rear-end fatal crashes to other fatal crashes in daylight in urban areas, by road type
0.0
0.1
0.2
0.3
0.4
0.5
0.6
1984 1986 1988 1990 1992 1994 1996 1998 2000 2002 2004 2006 2008
LTV urban interstate LTV urban non-interstate
Car urban interstate Car urban non-interstate
CalendarYear
Odds

13
Figure 7: Odds of rear-end fatal crashes to other fatal crashes in daylight, by tractor model year
0.0
0.1
0.2
1984 1986 1988 1990 1992 1994 1996 1998 2000 2002 2004 2006 2008
LTV vs. tractor MY98+ LTV vs. tractor MY96-
Car vs. tractor MY98+ Car vs. tractor MY96-
CalendarYear
Odds

14
These figures display generally the same basic trend as the overall daylight crashes in Figure 4. That is, tractor-trailers are more apt to be struck in the rear compared to being involved in some other accident, in two-vehicle crashes with a fatality in a passenger vehicle. (The only downward trend line is for cars versus tractors with ABS in Figure 7, but there are very few of these in the calendar years up to 2001.) The analysis of year-to-year trends in overall fatalities does not indicate a significant reduction in rear-impact fatalities over time, relative to other types of fatal collisions between passenger vehicles and tractor-trailers. Because FARS does not provide the model year of the trailer, this is the only possible analysis with FARS data exclusively. The data from FARS can be supplemented with those from NHTSA’s General Estimates System (GES), a nationally-representative probability sample of all crashes. FARS and GES contain variable definitions that are similar enough for comparison back to calendar year 1991. Table 4 shows the number of crashes from these two sources, restricted to daylight crashes (for FARS, these are the same as in the daylight part of Table 1). At right, the rate of fatalities per 1,000 crashes is the measure of interest.
Figure 8: Odds of rear-end fatal crashes to other fatal crashes in daylight, by age of tractor
0.0
0.1
0.2
0.3
1984 1986 1988 1990 1992 1994 1996 1998 2000 2002 2004 2006 2008
LTV vs. tractor age LE 5 LTV vs. tractor GE 6
Car vs. tractor age LE 5 Car vs. tractor age GE 6
CalendarYear
Odds

15
Table 4: Number of fatalities compared to total number of crashes, exactly one passenger vehicle and exactly one tractor-trailer
CY Fatalities All crashes Fatalities per (FARS) (GES) 1000 crashes Rear Other Rear Other Rear Other 1991 79 682 11,232 10,433 7.0 65.4 1992 92 666 9,714 11,199 9.5 59.5 1993 99 705 9,857 11,180 10.0 63.1 1994 107 782 13,674 12,569 7.8 62.2 1995 99 771 7,810 11,139 12.7 69.2 1996 126 832 12,513 13,681 10.1 60.8 1997 117 908 13,953 13,008 8.4 69.8 1998 129 863 10,364 11,869 12.4 72.7 1999 142 893 14,835 15,157 9.6 58.9 2000 122 869 10,988 14,295 11.1 60.8 2001 127 867 10,133 15,417 12.5 56.2 2002 123 861 9,114 11,850 13.5 72.7 2003 131 796 9,155 11,270 14.3 70.6 2004 159 856 12,252 12,396 13.0 69.1 2005 142 831 12,517 17,827 11.3 46.6 2006 132 756 8,780 11,905 15.0 63.5 2007 136 757 11,364 12,540 12.0 60.4 2008 96 644 9,599 11,272 10.0 57.1
In Figure 9, the fatality rate is compared for passenger vehicles impacting the rear of a tractor trailer versus other impacts between a passenger vehicle and tractor trailer. The two are mapped to different axes because the magnitudes vary greatly (Rear on the left-hand scale, Other on the right-hand scale). The fatality rate in rear impacts increases slightly over the time frame 1991 to 2008, from around 9 fatalities per 1,000 crashes to 14 fatalities per 1,000 crashes. By comparison, the fatality rate in other impacts between a tractor trailer and passenger vehicle is relatively constant or slightly decreasing, with a rate just above 60 fatalities per 1,000 crashes.

16
Figure 9: Fatalities per 1,000 crashes for rear impacts (left axis) compared to other impacts (right axis)
0
20
40
60
80
0
5
10
15
20
1990 1992 1994 1996 1998 2000 2002 2004 2006 2008
Rear of trailer impacted (left axis) Other area impacted (right axis)
Calendar Year
Fatalities per 1000 total crashes
The analysis shows that the number of fatal crashes in which a passenger vehicle rear-impacts a tractor-trailer continues to be high. Analysis of fatal and nonfatal crashes in two States Florida – State Data System Data from Florida are available through NHTSA's State Data System. Data from calendar years 1989 to 2006 are available. Florida is the only State that records information about the trailer unit relevant to this analysis – the type of trailer, its model year, and its VIN. Other States in NHTSA’s SDS record the presence of a trailer or the number of trailers towed by a tractor. Tractor-trailer combinations are identified by the type of vehicle (VEH_TYPE) and type of trailer (TRL_TYPE). The special vehicle code (SPEC_VEH) is included to exclude peculiarities such as boat trailers being hauled by a heavy truck. The variable definitions are as follows:

17
VEH_TYPE 05 Heavy truck 06 Truck-tractor SPEC_VEH 03 Commercial cargo TRL_TYPE 01 Single semi-trailer (1993 and later) 26 Trailer (1989 to 1992)
Passenger vehicles are likewise identified by the vehicle type element, listed below. The value listed as “04 Medium truck (4 rear tires)” should generally be composed of larger passenger pickups, based on reviewing the VIN. The number of vehicles is small enough that it cannot have a large influence (around 4% of all passenger vehicles in this analysis for calendar years 2002 and later have VEH_TYPE = “04”). A review of reporting inconsistencies in Florida was conducted by The University of Michigan’s TransportationResearch Institute.6
VEH_TYPE 01 Car 02 Passenger van 03 Recreational (2001 and earlier) 03 Pickup/light truck (2 rear tires) (2002 and later) 04 Truck—light pickup (2001 and earlier) 04 Medium truck (4 rear tires) (2002 and later)
As noted in the FARS analysis, ambient light condition is a pivotal factor that must be accounted for. There are a small number of crashes (< 1%) where the lighting condition iundefined, and these are considered to be daylight if the time of the crash is between 8:00am and 8:00pm.
LIGHT 01 Daylight 02 Dusk 03 Dawn 04 Darkness – street lights present 05 Darkness – no street lights
The impact zones identify the rear, front, and side portions of the vehicle. Additionally, the trailer can be identified. In order for a crash to be considered into the rear of a trailer, the vehicle event is also used.
IMPACT 6, 7, 8, 9, 10 Rear portions of vehicle 1, 2, 3, 13, 14 Front portions of vehicle 4, 5, 11, 12 Side portions of the vehicle IMPACT 21 Trailer (2002 and later) 22 Trailer (2001 and earlier)
and EVENT 1 Rear-end
The trailer model year (TRL_YR) is used to identify the type of underride guard. There are three eras:
s
6 Blower, D., & Matteson, A. (2004). Evaluation of Florida Crash Data Reported to MCMIS Crash File, Report No. UMTRI-2004-41. Washington, DC: Federal Motor Carrier Safety Administration.

18
TRL_YR 1980 to 1993 Smaller guard – narrower and set further inwards 1994 to 1997 Voluntary installation of larger guards based on TTMA recommendation 1998 and newer NHTSA mandated guard (Figure 1)
The injury status INJ of the driver in the passenger vehicle defines the severity of the crash. There are five levels, shown below. The equivalent KABCN scale is given in parenthesis for reference7.
INJ 1 (N) None 2 (C) Possible injury 3 (B) Non-incapacitating injury 4 (A) Incapacitating injury
5 (K) Fatal injury Table 5 shows the number of crashes where a passenger vehicle impacts a tractor-trailer. These crashes include crashes under all ambient light conditions. Later, when performing the effectiveness calculations (Table 6 and Table 7), the crashes that happened before 2002 will be restricted to daylight. "Rear impacts" are defined in terms of the impact zone and include cases where the impact zone is the trailer if the event is a rear-end collision. "Other impacts" are either into the front or side based on the impact zone or into the trailer if the event is not a rear-end collision. The injury status in the passenger vehicle is listed according to the KABCN scale. Table 5: Number of rear impacts and other impacts between a passenger vehicle and tractor-trailer, by injury outcome for driver of passenger vehicle
Rear impacts Other impacts
Trailer MY N C B A K N C B A KCY 1993 to 2001 1980 to 1993 300 112 178 113 53 600 193 261 164 83
1994 to 1997 124 50 67 50 10 306 75 103 70 251998 & new er 62 27 33 18 2 194 42 66 35 16
CY 2002 to 2005 Trailer MY N C B A K N C B A K1980 to 1993 269 63 62 42 15 1494 311 246 112 481994 to 1997 267 49 74 42 13 1507 292 196 111 271998 & new er 483 89 125 68 13 2831 510 360 192 63
CY 2006 & 2007 Trailer MY N C B A K N C B A K1980 to 1993 49 30 15 12 2 187 85 65 31 111994 to 1997 53 26 18 14 5 245 124 85 42 111998 & new er 160 61 70 30 9 671 359 246 104 25
The composition of the data varies in terms of the number of relevant crashes that can be identified and the distribution of injury severity. Figure 10 shows the number of crashes included in Table 5, grouped by calendar year. Figure 11 converts these counts to a percentage basis for each calendar year. There are four distinct regions in the graphics:
7 This scale is also referred to as KABCO. The value O is sometimes called “Other” or “Property Damage Only,” depending on the data source. The term U (“Uninjured”) is encountered as well.

19
– 1989 to 1992 – These years are excluded from the analysis because there are only the oldest model year trailers (MY 1980 to 1993), thus allowing no comparison to the trailers with FMVSS-compliant underride guards. There is also less certainty in the identification of typical tractor-trailers because the trailer type variable (TRL_TYPE) lists only one value “trailer” as opposed to “single semi-trailer”.
– 1993 to 2001 – Figure 11 shows a year-to-year increase in the percentage of non-injury crashes. These property-damage-only crashes may become more common in later calendar years because the reporting criterion is fixed at $500. Most simply, this could be due to inflation in the economy as a whole. It may also reflect advances in vehicle technology, such as modifications to the headlamp housings, which are more expensive to repair on newer vehicles.
– 2002 to 2005 – The basic format of the data changed from 2001 to 2002. It appears there was better recording of the trailer model year or VIN, allowing a greater number of vehicles to be identified for this study. The proportion of non-injury crashes is also higher.
– 2006 and 2007 – The proportion of non-injury crashes is comparable to the earlier 1993 to 2001 range. The number of identifiable crashes falls to about half of that from 2002 to 2005, though still much higher than the number from 2001 and earlier.
Figure 10: Number of crashes between a tractor-trailer and passenger vehicle, by calendar year and injury outcome
0
500
1000
1500
2000
2500
3000
3500
1989
1990
1991
1992
1993
1994
1995
1996
1997
1998
1999
2000
2001
2002
2003
2004
2005
2006
2007
N
C
B
A
K
Crashes per Calendar Year

20
Figure 11: Relative number of crashes between a tractor-trailer and passenger vehicle, by calendar year and injury outcome
0%
10%
20%
30%
40%
50%
60%
70%
80%
90%
100%1989
1990
1991
1992
1993
1994
1995
1996
1997
1998
1999
2000
2001
2002
2003
2004
2005
2006
2007
N
C
B
A
K
Distribution of crashes per CalendarYear
Categorical data modeling accounts for the differing proportion of crashes across the calendar year groups and arrives at an overall estimate of the effectiveness of the underride guard. The method is a generalization of a 2×2 table, allowing the incorporation of multiple categories in more than two dimensions. Similar to logistic regression, categorical data modeling estimates the effect of each value of the independent variable, and of combinations of independent variables (interaction terms), upon the dependent variable (fatal or nonfatal). The proc catmod procedure of SAS is used to perform these calculations. Table 6 shows the overall model results from the catmod procedure. The Likelihood Ratio has a non-significant chi-square (p-value > 0.05). In this test, the null hypothesis is that the model is an accurate fit to the observed data. Therefore, since the null hypothesis is not rejected, the model matches the observed data within an acceptable margin of error.

21
The three main effects are the following: – Cohort – refers to the three calendar year ranges (1993 to 2001; 2002 to 2005;
2006 and 2007) and models the extent to which the odds ratio of fatalities to non-fatalities in reported crashes has varied over the years.
– Target – refers to the region of the tractor-trailer impacted by the passenger vehicle (Rear versus Other) and models the extent to which fatality risk is higher (or lower) in rear impacts than in other impacts.
– Urg – refers to the underride guard on the trailer, based on model year (1980 to 1993 = None or Old FHWA type; 1998 and newer = FMVSS 223 and 224 compliant guard) and models the extent to which fatality risk is higher (or lower) in vehicles with the newer trailer. This term is a measure of the change in overall fatality rates for both rear impacts and other impacts. (The intermediate model years 1994-1997 are not included in the analysis because of uncertainty about the extent of voluntary compliance.)
The two-way interactions can be interpreted as follows:
– Target * Urg – this is the term that estimates the effect of the underride guard at reducing rear impact fatalities relative to fatalities in other impacts
– Cohort * Target – accounts for variation in the “other impacts” crashes (which is used as a control group for the “rear impacts” crashes)
– Cohort * Urg – accounts for the extent that the difference in overall fatality rates varies across the cohorts for the two URG categories
The three-way interaction Cohort * Target * Urg was excluded from the analysis. Its inclusion would imply that the effectiveness of the underride guard varies across the cohorts. The observed data (Table 5) and model-predicted number of crashes are shown in Table 7. The values marked OR(1) and OR(2) are the odds ratios for each adjacent 2×2 table. The calculation OR(1) ÷ OR(2) is the estimate of the effectiveness. The model controls for the differences in number of exposure crashes (rear impacts) relative to a control group of other impacts. Although the counts are very similar between the observed and predicted tables, the slight adjustments invoked by the model arrive at a constant
Table 6: CATMOD summary, fatality crashes
TERM DF CHI‐SQ p‐value
Intercept 1 1511.75 < 0.0001
Cohort 2 5.94 0.051
Target 1 0.09 0.770
Cohort*Target 2 2.88 0.236
Urg 1 3.18 0.075
Target*Urg 1 0.88 0.347
Cohort*Urg 2 1.00 0.607
Likelihood Ratio 2 3.92 0.141

22
effectiveness for the three cohorts. The final estimate of the effectiveness is 27.1 percent. However, this value is not statistically significant because the Target * Urg interaction has a chi-square of 0.88 (p-value > 0.10 in Table 6). Table 7: Observed and Predicted crash frequencies, fatality crashes versus all others
Observed Predicted
CY 1993 to 2001 Rear Impacts
1980 to 1993
K ABCN
16 423
K ABCN
14 425
1998 & newer 1 100 3 98
Other Impacts
1980 to 1993 35 869
0.264
37 867
0.751 OR(1)
1998 & newer 12 240 10 242
CY 2002 to 2005 Rear Impacts
1980 to 1993
K
15
ABCN
436
1.241
0.213
K
15
ABCN
436
1.031 OR(2)
0.729 OR(1) ÷ OR(2)
(Effectiveness)
1998 & newer 13 765 13 765
Other Impacts
1980 to 1993 48 2163
0.494
48 2163
0.524 OR(1)
1998 & newer 63 3893 63 3893
CY 2006 & 2007 Rear Impacts
1980 to 1993
K
2
ABCN
106
0.729
0.677
K
4
ABCN
104
0.718 OR(2)
0.729 OR(1) ÷ OR(2)
(Effectiveness)
1998 & newer 9 321 7 323
Other Impacts
1980 to 1993 11 368
1.486
9 370
0.581 OR(1)
1998 & newer 25 1380 27 1378
0.606
2.452
0.797 OR(2)
0.729 OR(1) ÷ OR(2)
(Effectiveness) The next analysis aims to find a reduction in serious injuries and fatalities (injury types K and A). The model is a good fit for the data (Likelihood ratio = 0.27). The final estimate of the effectiveness at reducing fatalities and serious injuries is 6.5 percent. Again, this estimate is not statistically significant because the chi-square for the Target * Urg term is 0.16 (p-value > 0.10).

23
Table 8: CATMOD summary, fatality and serious injury crashes
TERM DF CHI‐SQ p‐value
Intercept 1 1961.51 < 0.0001
Cohort 2 22.45 < 0.0001
Target 1 12.82 < 0.01
Cohort*Target 2 7.83 0.020
Urg 1 2.16 0.142
Target*Urg 1 0.16 0.685
Cohort*Urg 2 0.44 0.801
Likelihood Ratio 2 0.27 0.874 Table 9: Observed and Predicted crash frequencies, fatality and serious injury crashes versus all others
Observed Predicted
CY 1993 to 2001 Rear Impacts
1980 to 1993
KA
64
BCN
375
KA
63
BCN
376
1998 & newer 13 88 14 87
Other Impacts
1980 to 1993 121 783
0.866
122 782
0.920 OR(1)
1998 & newer 34 218 33 219
CY 2002 to 2005 Rear Impacts
1980 to 1993
KA
57
BCN
394
1.009
0.858
KA
56
BCN
395
0.984 OR(2)
0.935 OR(1) ÷ OR(2)
(Effectiveness)
1998 & newer 81 697 82 696
Other Impacts
1980 to 1993 160 2051
0.803
161 2050
0.820 OR(1)
1998 & newer 255 3701 254 3702
CY 2006 & 2007 Rear Impacts
1980 to 1993
KA
14
BCN
94
0.883
0.910
KA
15
BCN
93
0.877 OR(2)
0.935 OR(1) ÷ OR(2)
(Effectiveness)
1998 & newer 39 291 38 292
Other Impacts
1980 to 1993 42 337
0.900
41 338
0.791 OR(1)
1998 & newer 129 1276 130 1275
0.811
1.109
0.846 OR(2)
0.935 OR(1) ÷ OR(2)
(Effectiveness) Similar to the presentation in the analysis of fatal crashes (Figure 5 - Figure 8), several other possibly influential variables were introduced into the categorical data model – type of roadway, whether the passenger vehicle was a car or an LTV, whether the passenger

24
vehicle driver was restrained, and the ABS equipment of the tractor based on the model year. Initially, a model was fit with all three-way interactions. The three-way interactions with the lowest chi-square values were removed from the model until only those with a statistically-significant contribution remained. The process was then repeated on the two-way interactions8. In the end, there was no appreciable change in the model fit nor the predicted frequencies (Table 9). Therefore, none of these other external variables are presented in the final estimate of URG effectiveness. North Carolina – Special data collection The basic analysis for Florida is repeated using a special data collection project from North Carolina. From 2005 to 2007, the State Highway Patrol filed a supplementary crash report for crashes involving a heavy truck, in addition to the State’s standard crash report. The additional information includes characteristics of the trailer that are relevant to the current analysis but do not appear on the standard form. Table 10 shows the number of crashes involving one passenger vehicle and one tractor-trailer, according to whether the passenger vehicle impacted the rear of the tractor-trailer or some other portion. Table 10: Number of passenger vehicle crashes into the rear versus other portions of a tractor-trailer, according to injury status and model year of the trailer
Rear impacts
Trailer MY N C B A K
1980 to 1993 47 16 8 3 3
1994 to 1997 57 10 11 1 2
1998 & new er 144 27 26 3 2
Other impacts
Trailer MY N C B A K
1980 to 1993 291 72 35 19 6
1994 to 1997 310 90 30 8 12
1998 & new er 904 222 94 28 26
The data in Table 10 were subjected to a categorical data analysis. Because there is no calendar year cohort to control for, the model is simpler but the interpretation is different. The two-way interaction (Target * Urg) is excluded so that the Likelihood Ratio can be estimated. This term becomes the item of interest because it accounts for model variance that would belong to the two-way interaction. In the Florida analysis (Table 6 and Table 8), the Likelihood Ratio doubled in the role of the three-way interaction. The catmod analysis for fatality crashes is shown in Table 11. The key term, the likelihood ratio, is marginally significant (chi-square = 3.02, p-value < 0.10). The
8 This procedure is referred to as backward-elimination.

25
reduction in fatal crashes in rear impacts, relative to the reduction in fatalities in other impacts is quite high – the three-way Odds Ratio of 0.170 corresponds to a reduction of 83 percent (Table 12). The failure to yield a strongly significant result is due to the low number of fatalities in the dataset. Table 11: CATMOD summary, fatality crashes
TERM DF CHI‐SQ p‐value
Intercept 1 234.15 < 0.0001
Target 1 0.01 0.917
Urg 1 0.02 0.892
Likelihood Ratio 1 3.02 0.082 Table 12: Observed crash frequencies, fatality crashes versus all others
North Carolina Rear Impacts
1980 to 1993
K
3
ABCN
74
1998 & newer 2 200
Other Impacts
1980 to 1993 6 417
0.247 OR(1)
1998 & newer 26 1248
1.448
0.170
OR(2)
OR(1) ÷ OR(2) The catmod summary for the reduction in fatality and serious injury crashes is shown in Table 13. The odds ratio of 0.426 represents a reduction of 57 percent in fatalities and serious injuries. Again, the result is not statistically significant (Likelihood Ratio = 1.63, p-value > 0.10). Table 13: CATMOD summary, fatality and serious injury crashes
TERM DF CHI‐SQ p‐value
Intercept 1 322.85 < 0.0001
Target 1 0.33 0.569
Urg 1 4.16 0.042
Likelihood Ratio 1 1.63 0.202

26
Table 14: Observed crash frequencies, fatality and serious injury crashes versus all others
North Carolina Rear Impacts
1980 to 1993
KA
6
BCN
71
1998 & newer 5 197
Other Impacts
1980 to 1993 25 398
0.300 OR(1)
1998 & newer 54 1220
0.705
0.426
OR(2)
OR(1) ÷ OR(2) The above analysis is a replication as nearly as possible of the analysis from the Florida State Data System. Table 15 shows the results from Florida and North Carolina together. The reductions in K and KA for North Carolina may be spuriously high with such a small number of crashes. Table 15: Summary of injury crash severity from Florida and North Carolina
Injury severity K
Reduction in FL 27%
Reduction in NC 83%
KA 7% 57% North Carolina – Supplementary data elements Supplementary information was collected in the North Carolina special study beyond the State's standard police report – when the heavy vehicle was rear-impacted by a passenger vehicle, the following additional information was recorded:
- type of rear impact guard – no guard, old FHWA guard (60" wide), or new NHTSA / TTMA guard (94" to 102" wide)
- extent of passenger compartment intrusion in the passenger vehicle – none (rear impact guard successfully prevented an underride), underride without windshield damage, underride with windshield and/or A-pillar damage, underride with damage beyond windshield and into the roof
- orientation of striking vehicle – seven combinations of position (left, center, or right of the heavy vehicle) and angle (passenger vehicle approached from the left, from straight behind, or from the right)
Figure 3 (on page 3) is the portion of the special data collection form for recording the type of underride guard. Both graphic and textual descriptions were provided. The width of the underride guard is the primary identifying characteristic, and the presence of conspicuity tape is mentioned as a secondary characteristic that can distinguish between the two types of guards. The newer guards are also lower to the ground and set nearer to the rear of the trailer – these are important characteristics as well, but the forms were not designed to show all possible views.

27
First, the type of underride guard is presented, relative to the model years used previously. The accuracy is questionable because 45 of the MY 1998 and newer are said to have the older guard and 17 are said to have no guard or the old guard – 8 of these 17 are recorded as being either the van or flatbed type of trailer, which should be equipped with FMVSS compliant guards. These numbers may be a data collection inconsistency. But, if the MY 1998 & newer cohort includes a large proportion of special-use trailers that are exempt from the underride guard standard (e.g., wheels-back trailers), then this simple analysis by model year cohort could underestimate the effectiveness of the guards. Table 16: Type of underride guard from special form based on model year of tractor
No guard Old guard New guard MY 1980 to 1993 10 44 25 MY 1994 to 1997 7 32 41 MY 1998 & newer 17 45 150
There are several reasons why these data are difficult to collect:
– The vehicle may have suffered damage to the underride guard during the crash. – The vehicle may have suffered damage to the underride guard during some earlier
incident (e.g., backing into a loading dock) and had not been repaired prior to the crash for which data is available.
– The ambient conditions were such that the highway patrol officer was unable to complete the form accurately (e.g., heavy traffic, poor lighting).
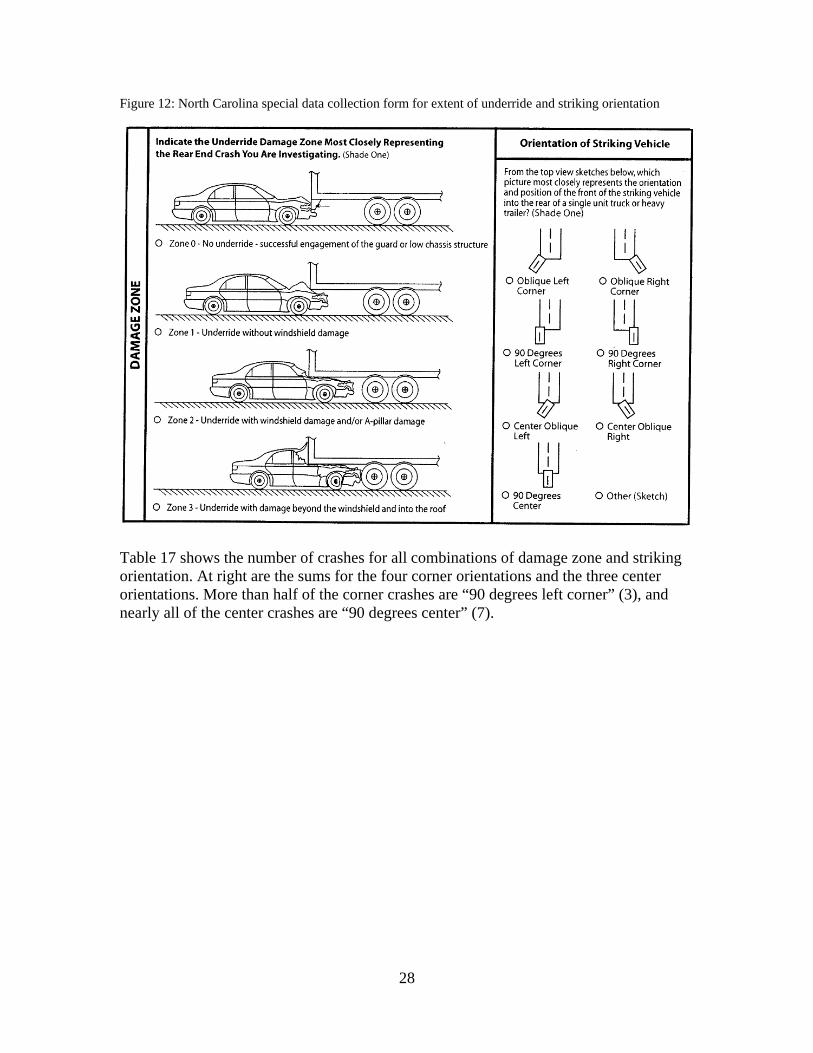
Figure 12 is the portion of the special data collection form designed to capture the extent of underride and the orientation of the striking angle of the passenger vehicle.
28
Figure 12: North Carolina special data collection form for extent of underride and striking orientation
Table 17 shows the number of crashes for all combinations of damage zone and striking orientation. At right are the sums for the four corner orientations and the three center orientations. More than half of the corner crashes are “90 degrees left corner” (3), and nearly all of the center crashes are “90 degrees center” (7).

29
Table 17: Extent of underride and striking orientation, all possible combinations
Trailer MY 1980‐1993 (1) (2) (3) (4) (5) (6) (7) (1) to (4) (5) to (7)
Corner Center
No underride 1 0 5 4 0 1 31 10
Zone1 = minor 0 0 3 1 1 0 10 4
Zone2 = more severe 0 0 2 1 0 0 4 3
Zone3 = major 0 0 1 1 0 0 0 2
19 47
Trailer MY 1994‐1997 (1) (2) (3) (4) (5) (6) (7) (1) to (4) (5) to (7)
Corner Center
No underride 1 1 12 5 1 3 23 19
Zone1 = minor 0 2 1 1 0 0 12 4
Zone2 = more severe 0 0 1 1 0 0 3 2
Zone3 = major 0 0 3 1 0 0 0 4
29 42
Trailer MY 1998 & newer (1) (2) (3) (4) (5) (6) (7) (1) to (4) (5) to (7)
Corner Center
No underride 6 2 20 9 0 0 75 37
Zone1 = minor 2 1 10 3 2 1 30 16
Zone2 = more severe 0 1 7 0 0 1 5 8
Zone3 = major 1 1 3 0 0 0 1 5
66 115
32
11
4
0
27
12
3
0
75
33
6
1
(1) Oblique left corner (2) Oblique right corner (3) 90 degrees left corner (4) 90 degrees right corner (5) Center oblique left (6) Center oblique right (7) 90 degrees center
Passenger compartment intrusion is more prevalent in corner impacts than in center impacts for any type of underride guard. For trailers with FMVSS-compliant guards that were impacted in the corner, there were 13 cases of severe or major intrusion, out of 66 total crashes where this information was recorded (13 of 66 = 19.7%). By comparison, there were seven center impacts with severe or major intrusion, out of 115 total crashes where this information was recorded (7 of 115 = 6.1%). The difference in the two proportions can be tested according to a binomial test. The statistical test is highly significant (p-value < 0.01), meaning that the result is not likely to be a chance occurrence owing to a small amount of data. It can be said that the center portion of the underride guard resists passenger compartment intrusion better than do the edge portions of the underride guard. FMVSS 223 requires a greater amount of force to be resisted near the center of the guard (locations P3 in Figure 2), compared to the edges (locations P1 in Figure 2).
30
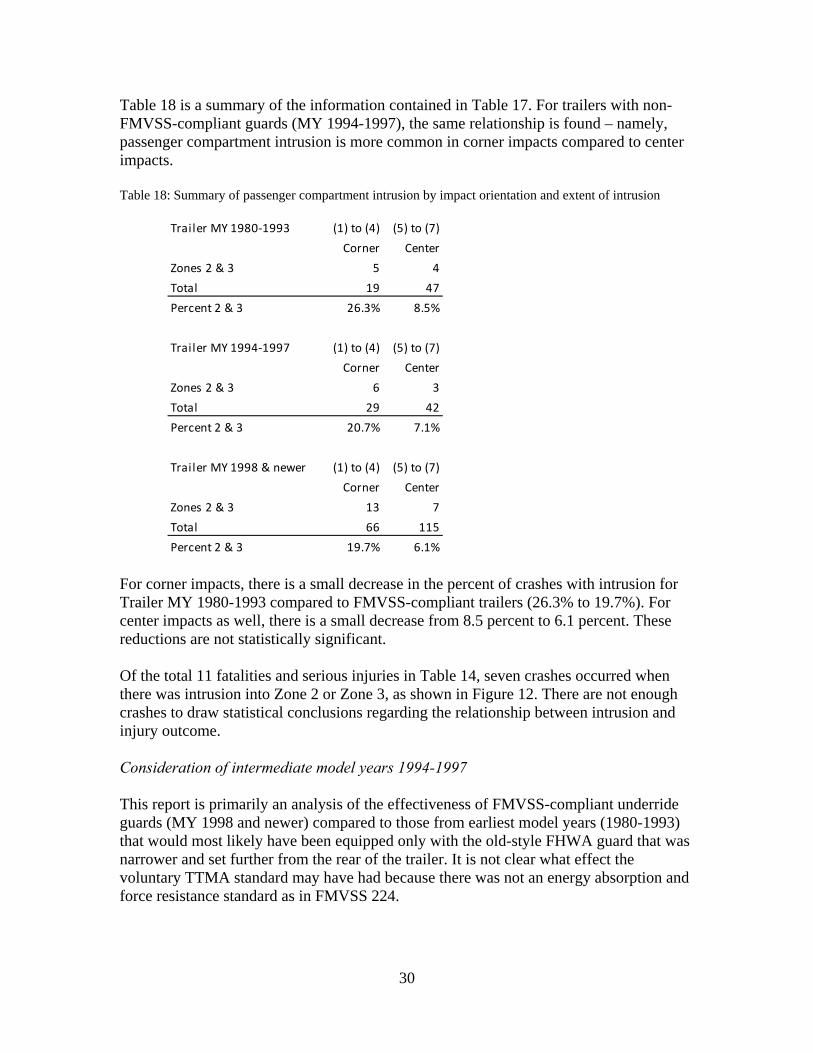
Table 18 is a summary of the information contained in Table 17. For trailers with non-FMVSS-compliant guards (MY 1994-1997), the same relationship is found – namely, passenger compartment intrusion is more common in corner impacts compared to center impacts. Table 18: Summary of passenger compartment intrusion by impact orientation and extent of intrusion
Trailer MY 1980‐1993 (1) to (4)
Corner
(5) to (7)
Center
Zones 2 & 3
Total 19 47
Percent 2 & 3 26.3% 8.5%
Trailer MY 1994‐1997 (1) to (4)
Corner
(5) to (7)
Center
Zones 2 & 3
Total 29 42
Percent 2 & 3 20.7% 7.1%
Trailer MY 1998 & newer (1) to (4)
Corner
(5) to (7)
Center
Zones 2 & 3
Total 66 115
Percent 2 & 3 19.7% 6.1%
5 4
6 3
13 7
For corner impacts, there is a small decrease in the percent of crashes with intrusion for Trailer MY 1980-1993 compared to FMVSS-compliant trailers (26.3% to 19.7%). For center impacts as well, there is a small decrease from 8.5 percent to 6.1 percent. These reductions are not statistically significant. Of the total 11 fatalities and serious injuries in Table 14, seven crashes occurred when there was intrusion into Zone 2 or Zone 3, as shown in Figure 12. There are not enough crashes to draw statistical conclusions regarding the relationship between intrusion and injury outcome. Consideration of intermediate model years 1994-1997 This report is primarily an analysis of the effectiveness of FMVSS-compliant underride guards (MY 1998 and newer) compared to those from earliest model years (1980-1993) that would most likely have been equipped only with the old-style FHWA guard that was narrower and set further from the rear of the trailer. It is not clear what effect the voluntary TTMA standard may have had because there was not an energy absorption and force resistance standard as in FMVSS 224.

31
Table 19 shows the observed crash frequencies from the three calendar year cohorts in Florida, along with those from the special study in North Carolina. The format is similar to that of Table 7. For all three calendar year cohorts in Florida, there is a relative increase in fatalities for the model years 1994 to 1997 compared to 1980 to 1993 – the three ratios are 1.545, 1.514, and 3.218. In North Carolina, the opposite is true – the ratio OR(1) ÷ OR(2) of 0.328 represents a 67 percent reduction in fatalities. Table 20 presents these same calculations for the reduction in fatalities and serious injuries (KA). Again, the three calendar year cohorts in Florida show a relative increase – the ratios of interest are 1.525, 1.099, and 1.404. In North Carolina, there is a reduction of 38 percent, based on the ratio presented of 0.615. No conclusion can be drawn from these numbers because they differ in direction – relative increases in Florida, as opposed to relative reductions in North Carolina.

32
Table 19: Observed crash frequencies, fatality crashes versus all others, MY 1980 to 1993 versus MY 1994 to 1997
Observed
Florida
CY 1993 to 2001 Rear Impacts K ABCN
1980 to 1993 16 423
1994 to 1997 5 174
0.760 OR(1)
Other Impacts
1980 to 1993 35 869
1994 to 1997 8 404
0.492 OR(2)
1.545 OR(1) ÷ OR(2)
CY 2002 to 2005 Rear Impacts K ABCN
1980 to 1993 15 436
1994 to 1997 13 432
0.875 OR(1)
Other Impacts
1980 to 1993 48 2163
1994 to 1997 27 2106
0.578 OR(2)
1.514 OR(1) ÷ OR(2)
CY 2006 & 2007 Rear Impacts K ABCN
1980 to 1993 2 106
1994 to 1997 5 111
2.387 OR(1)
Other Impacts
1980 to 1993 11 368
1994 to 1997 11 496
0.742 OR(2)
3.218 OR(1) ÷ OR(2)
North Carolina Rear Impacts K ABCN
1980 to 1993 3 74
1994 to 1997 2 79
0.624 OR(1)
Other Impacts
1980 to 1993 6 417
1994 to 1997 12 438
1.904 OR(2)
0.328 OR(1) ÷ OR(2)

33
Table 20: Observed crash frequencies, fatality and serious injury crashes versus all others, MY 1980 to 1993 versus MY 1994 to 1997
Observed
Florida
CY 1993 to 2001 Rear Impacts KA BCN
1980 to 1993 64 375
1994 to 1997 30 149
1.180 OR(1)
Other Impacts KA BCN
1980 to 1993 121 783
1994 to 1997 44 368
0.774 OR(2)
1.525 OR(1) ÷ OR(2)
CY 2002 to 2005 Rear Impacts KA BCN
1980 to 1993 57 394
1994 to 1997 55 390
0.975 OR(1)
Other Impacts KA BCN
1980 to 1993 160 2051
1994 to 1997 138 1995
0.887 OR(2)
1.099 OR(1) ÷ OR(2)
CY 2006 & 2007 Rear Impacts KA BCN
1980 to 1993 14 94
1994 to 1997 19 97
1.315 OR(1)
Other Impacts
1980 to 1993 42 337
1994 to 1997 53 454
0.937 OR(2)
1.404 OR(1) ÷ OR(2)
North Carolina Rear Impacts KA BCN
1980 to 1993 6 71
1994 to 1997 3 78
0.455 OR(1)
Other Impacts
1980 to 1993 25 398
1994 to 1997 20 430
0.740 OR(2)
0.615 OR(1) ÷ OR(2)

DOT HS 811 375October 2010