the effectiveness of revenue generation in the...
TRANSCRIPT

International Journal of Academic Research in Business and Social Sciences November 2013, Vol. 3, No. 11
ISSN: 2222-6990
469 www.hrmars.com/journals
The Effectiveness of Revenue Generation in the Evaluation System of the Tax Burden on Personal
Income: Application of Stochastic Frontier Analysis Considers the Dynamics of Regional Data
Victor Vladimirovich Gluschenko Dr (Economic), Professor, V. N. Karazin National University of Kharkov, Ukraine
61002, 1 Myronosytskaya Str., Kharkov E-mail: [email protected]
Vyacheslav Victorovich Lyashenko The chief of the laboratory, Kharkov National University of RadioElectronics, Ukraine
61166, 14 Lenina Str., Kharkov E-mail: [email protected]
Valentyna Valerivna Somova PhD student, V. N. Karazin National University of Kharkov, Ukraine
61002, 1 Myronosytskaya Str., Kharkov E-mail: [email protected]
DOI: 10.6007/IJARBSS/v3-i11/358 URL: http://dx.doi.org/10.6007/IJARBSS/v3-i11/358
Abstract. Taxes play an important role in development of separate territories of the country. At the same time the size of taxes collected depends on the size of income received. Taking into consideration this fact this paper describes income of the population as a component of system analyses of household income taxation burden. In particular the assessment of efficiency of incomes received by the population for each region taking separately in line. In order to consider the efficiency of incomes received by the population the method of stochastic frontier analyses in dynamics is used. The functional parameters of the frontier model of population’s income generation efficiency broken down by the time aspects are estimated. The answers about interrelation between changes in taxable income tax burden and changes in the corresponding estimates of population’s income generation efficiency broken down by their regional aspects are given. The proposal about the need for the growth in average salary from the point of view of population’s income generation and consequently from the point of view of the growth of efficiency in corresponding taxes fiscal performance are given. Keywords: efficiency, taxes, population’s income, employed population, stochastic frontier analysis.

International Journal of Academic Research in Business and Social Sciences November 2013, Vol. 3, No. 11
ISSN: 2222-6990
470 www.hrmars.com/journals
JEL classifications: C15 - Statistical Simulation Methods: General; C5 - Econometric Modeling; H2 - Taxation, Subsidies, and Revenue Introduction Taxes are one of the key economic categories that enables purposeful monitoring and extensive consideration of the development of economic relations which exist both between the state and its separate members such as business and citizens and between separate members of the state. In particular the development of such economic relations can be represented by state’s capacity for tax burden redistribution. Herewith it is worth mentioning that population’s income taxes hold a special place among other taxes which is proved by many authors (Schultz, 1998; Bird & Zolt, 2004, 2005; Lee & Gordon, 2005). The focus on the tax on population’s income is determined by the following: on the one hand the income tax is a dominant one in the structure of fiscal revenues of local budgets and consequently it largely determines both the structure of local budget resources and economic development of given regions which is described in the work by Phillips & Goss (1995), on the other hand the tax on population’s income is a interrelated with generation of population’s income which directly impacts state social policy concerning different territories and strata of population which is reviewed in the works by such authors as Caminada & Goudswaard (2001), Moffitt (2003). At the same time the size of taxes raised from population’s income as noted by Andrews (1972), is largely dependent on the very size of earned income which in its turn can be associated with the level of economic development of certain territory where people obtain certain income. That is to say that the efficiency of tax burden on population’s income is largely determined by the efficiency of existing system of population income generation as well as by the tools involved in redistribution of incomes obtained by people. At the same time the current regional differences in population income generation can influence the corresponding estimates of efficiency. Thus the analysis of tax burden on population’s income is a complex task. The main direction of such research can be analysis of efficiency of population income generation as of one of components in the system of individual income tax burden estimation. Herewith it makes sense to associate such analysis with the administrative-territorial division of the country which reflects the corresponding development of given territories. Methodology and data analysis Taking into consideration the importance of considering administrative-territorial division of the country for analyzing efficiency of population’s income generation in the system of analysis of individual income tax burden it is reasonable to apply the method of stochastic frontier analysis (Gluschenko, Lyashenko & Somova, 2013; Sinelnikov-Murylev, Idrisov & Kadochnikov, 2012). The nature of the method as seen by different authors (Farrell, 1957; Aigner, Lovell, & Schmidt, 1977; Battese & Coelli, 1992) is in the following: in defining the frontiers of efficiency by methods of statistic analysis;
International Journal of Academic Research in Business and Social Sciences November 2013, Vol. 3, No. 11
ISSN: 2222-6990
471 www.hrmars.com/journals
positioning the economic process or object under consideration relatively the obtained efficiency frontiers; defining the efficiency of process or object under consideration as a function which describes the reachability of obtained efficiency frontier. For efficiency frontier formalization the most frequently used model is the following one (Aigner, Lovell & Schmidt, 1977):
),x(fy , (1)
uv , (2) where y is a vector of the results of object or process under consideration, x is a vector of
resources used for obtaining certain results of the process or object under consideration, f is a function of efficiency frontiers of the process or object under consideration, is a vector of
parameters of function f , is a composite random member of the model, v is a vector of random fluctuations of the model, u is a vector which describes technical inefficiency of the activity of object or process under consideration. Then efficiency of the activity of object or process under consideration and more precisely their
technical efficiency iTE , where i , l,1i , l is the overall number of objects or processes under
research can be calculated as follows (Jondrow, Knox Lovell, Materov & Schmidt, 1982): )|u(M
iiieTE
, (3)
where )|u(M ii
is a conditional mathematical expectation iu with estimated values i
, which
are composite random members of the model under consideration following formulas 1–2. In this case the abovementioned efficiency iTE is the efficiency of population’s income
generation broken down by separate regions of the country. Direct calculation of such efficiency can be performed with the help of FRONTIER 4.1 (Coelli, 1996) software which is available on the web-site of СЕРА: http://www.uq.edu.au/economics/cepa/frontier.php. Calculation of different efficiency estimates in particular for analyzing population’s income generation broken down by different regions of the country on the basis of abovementioned formulas is primarily performed for the data which describe the processes under consideration statically - as of given date of the period under consideration. Nevertheless for researching complex economic relations which include the issues of revealing the system of individual income tax burden estimation it is important to consider the processes of economic dynamics (Kuzemin & Lyashenko, 2008). We will take into consideration this fact for analyzing the model of efficiency frontiers in population income generation broken down by separate regions of the country. The specific nature of our consideration is in analyzing the data for a period of time but not for a certain date. Herewith such representation of data under consideration is also applied by FRONTIER 4.1 software for calculating the efficiency estimates under consideration (Coelli, 1996). Data for Research The statistic data for researching efficiency of income generation in the system of individual income tax burden estimation with the help of stochastic frontiers analysis are the data for Ukraine. This choice is based on the deep understanding of the agenda of issue under consideration as well as on the fact that Ukraine being a country with developing economy is

International Journal of Academic Research in Business and Social Sciences November 2013, Vol. 3, No. 11
ISSN: 2222-6990
472 www.hrmars.com/journals
facing major economic challenges as compared to other developing economies of Europe as it is put by the Bank for International Settlement. For researching efficiency of income generation in the system of individual income tax burden estimation with the help of stochastic frontiers analysis the authors analyse three time periods: the data for year 2009, data for year 2010 and data for year 2011. These data allow us to discuss the efficiency of population’s income generation in the post-crisis period of economic development. In each of these separate periods the authors study the quarterly dynamics of data under consideration. Thus the research of economic processes dynamics for determining the efficiency of population’s income generation implies consideration of annual dynamics of the parameters under consideration in their quarterly representation. Herewith this consideration concerns 27 administrative and territorial units of Ukraine. The relative data were retrieved from the official web-site of the State Statistical Service of Ukraine at http://ukrstat.gov.ua. The model of population’s income generation efficiency frontier With the aim of estimating the efficiency of population’s income generation in the system of assessing the individual income tax burden with the help of stochastic frontiers analysis we will use the model offered by (Gluschenko, Lyashenko & Somova, 2013) as the basis for building the models of corresponding efficiency frontier. At the same time the dependent variable of the model of population income generation efficiency frontier broken down by the regions will not be all the incomes of population but taxable ones only. This choice is explained by the main aim of this research which implies consideration of corresponding efficiencies in the system of assessment of tax burden on individual income. Corresponding to the legal and regulatory framework of Ukraine the taxable population’s incomes include all the income but welfare payments. The independent variables of the model of population income generation efficiency frontier broken down by the regions include the number of employed population in a given region, the average salary typical for this region which corresponds to the key issues of analyzing tax potential of the region (Gluschenko, Lyashenko & Somova, 2013; Sinelnikov-Murylev, Idrisov & Kadochnikov, 2012). Then the linearized model of model of population income generation efficiency frontier broken down by the regions is as follows:
ititit2it10it uv)VN(Ln)ZN(Ln)DN(Ln , (4)
itDN is the vector describing the taxable value of the part of population’s income broken down
by separate regions )27,1i(i for separate periods )4,1t(t in each of the periods of time
under consideration, mln UAH;
itVN is the vector which defines the number of employed population broken down by certain
regions )27,1i(i for separate periods )4,1t(t in each of the periods of time under
consideration, thous. people;
itZN is the vector which determines the average salary broken down by separate regions
)27,1i(i for separate periods )4,1t(t in each of the periods of time under consideration, UAH.
Consequently, each of the abovementioned variables contains 108 elements, which reflect

International Journal of Academic Research in Business and Social Sciences November 2013, Vol. 3, No. 11
ISSN: 2222-6990
473 www.hrmars.com/journals
quarterly dynamics of their changing broken down by the regions in each period of time under consideration separately. Herewith the random components of formalization of frontier model in correspondence to
formula 4 are distributed as follows: ),0(N 2 , ),0(Nu 2
u (Jondrow, Knox Lovell, Materov &
Schmidt, 1982). Thus the output data iof model under formula 4 in the form of a random member of corresponding efficiency frontier the frontiers of efficiency are the basis for analyzing the estimates of efficiency of income obtained by population in correspondence with formula 3. Introductory remarks on changes in tax burden broken down by separate regions and general statistic characteristics of data under consideration Before analyzing efficiency of population’s income generation broken down by region as a component of the system of individual income tax burden analysis it should be noted that on the whole the tax burden can be analysed as a relation of the size of taxes paid to the size of taxes obtained (Entin, 2004). Taking into consideration the fact that in the model of population’s income efficiency frontier we will analyse only taxable incomes then the tax burden will be calculated based on the volumes of taxable incomes earned by population . Table 1 as calculated on the basis of State Statistical Service of Ukraine web-site data represents the dynamics of changes in population’s taxable income tax burden broken down by separate regions of Ukraine (the first column of the Table) over different periods of time in quarterly evaluation (other columns of the Table).
Таble 1: The size of tax burden on taxable incomes obtained by the population of Ukraine (%)
Year 2009 Year 2010 Year 2011
Regions 1 2 3 4 1 2 3 4 1 2 3 4
1 8,96 8,99 7,12 4,8 8,08 7,84 7,25 8,68 8,03 8,26 6,86 4,64
2 8,16 8,13 5,21 18,43
7,47 6,91 5,45 6,42 7,6 7,96 5,27 6,32
3 8,09 7,17 5,38 5,91 7,22 6,53 5,3 7,84 7,18 6,68 5,03 7,2
4 9,27 8,88 8,32 0,49 8,04 7,88 8,25 7,04 8,16 8,49 8,12 7,75
5 8,87 9,53 8,46 2,95 8 8,58 8,04 7,55 7,99 9,32 8,05 7,79
6 8,44 7,93 6,14 9,09 7,69 7,26 5,69 7,13 7,44 7,4 5,68 9,41
7 8,17 7,11 5,85 10,45
7,52 6,74 5,44 7,96 7,11 6,93 5,29 6,52
8 8,57 8,52 7,61 9,41 7,64 7,34 7,13 7,11 7,83 8,11 7,14 6,97
9 7,87 7,53 5,96 0,8 7,08 6,33 5,47 6,45 7,09 6,82 5,24 6,38

International Journal of Academic Research in Business and Social Sciences November 2013, Vol. 3, No. 11
ISSN: 2222-6990
474 www.hrmars.com/journals
10 9,02 9,59 7,48 10,91
8,28 8,67 7,87 7,4 8,07 9,82 7,67 8,08
11 9,01 8,46 6,02 15,78
7,93 7,73 6,48 7,11 8,04 8,54 6,25 7,84
12 9,45 9,32 8,06 9,54 8,47 7,88 7,37 8,16 8,53 8,35 7,33 7,96
13 8,39 8,3 6,79 3,69 7,51 7,11 6,65 6,52 7,74 7,66 6,55 7,02
14 8,85 8,29 6,94 6,87 8,01 7,51 6,68 6,78 7,88 7,36 6,59 7,35
15 8,97 8,79 7,94 6,55 8,11 7,79 7,6 7,48 8,12 8,72 7,27 6,22
16 9,75 9,35 7,23 3,74 8,74 8,23 7,17 7,86 8,83 8,84 7,25 9,03
17 8,02 7,72 6,12 8,01 7,59 7,42 6,08 8,04 7,64 6,98 5,95 9,25
18 8,22 7,37 5,85 3,73 7,48 6,68 6,03 7,17 7,61 7,54 5,86 7,13
19 8,74 6,64 5,14 18,48
7,93 6,16 5,21 6,44 8,07 6,87 5,29 8,42
20 8,35 8,95 7,03 0,35 7,64 7,45 6,52 6,57 7,77 8,32 6,53 6,35
21 9,25 7,3 5,2 10,71
8,21 6,29 4,97 7,34 8,18 6,56 4,6 6,91
22 8 8,02 5,36 11,39
7,27 7,12 5,42 6,59 7,3 7,71 5,27 5,85
23 8,09 8,36 6,76 7,33 7,07 7,4 7,1 7,38 7,18 7,9 6,92 9,09
24 8,93 7,91 5,74 17,21
7,34 7,04 5,41 5,99 7,46 7,51 5,56 6,68
25 8,46 7,93 5,47 9,55 7,66 6,8 5,09 6,82 7,78 7,67 5,08 4,68
26 10,87
13,22
12,36
23,02
9,32 10,28
10,21
9,61 9,44 9,26 9,83 8,11
27 12,71
9,43 11,17
33,66
10,81
8,02 9,57 14,23
11,11
8,62 9,08 8,33
The data of Table 1 show that for the majority of regions under consideration the dynamics of changes in tax burden for population’s taxable income tend to decrease both over each of the periods under consideration (in a certain year) and as of the end of such periods. At the same time one can speak about absence of a certain tendency in the dynamics of changes in tax

International Journal of Academic Research in Business and Social Sciences November 2013, Vol. 3, No. 11
ISSN: 2222-6990
475 www.hrmars.com/journals
burden for taxable incomes eared buy population. That’s why the concrete question in the assessment of population’s income generation efficiency can be the question of interrelation between the changes in tax burden for taxable incomes and changes of the corresponding estimates of population’s income generation efficiency broken down by regions. As it has been mentioned for analyzing the estimates of population’s income generation efficiency it is reasonable to use the model described in formula 4. In this model we use a number of variables whose statistical values are given below. Table 2, as calculated on the basis of State Statistical Service of Ukraine web-site data represents some statistic characteristics (the first column) of the data under consideration for building the frontiers of efficiency of population’s income generation represented in different periods of time, for every year separately with the consideration of quarters and for all the regions of Ukraine on the whole (other columns of the Table reflect statistic descriptions of the ranges of data under consideration).
Table 2: Statistic descriptions of the data under considerations represented in different periods of time for all the regions of Ukraine on the whole
Year 2009 Year 2010 Year 2011
Taxabl
e incom
e
Average salary
Employed
population
Taxable
income
Average salary
Employed population
Taxable
income
Average salary
Employed populatio
n
Average 4904,76 1653,44 747,57 6271,53 1922,05 749,71 7292,94 2254,72 750,98
Standard deviation
4221,73 335,56 407,05 5606,83 354,86 405,83 6418,41 433,16 406,98
Min 779,0 1258,0 179,8 1008,0 1439,0 181,2 1143,0 1670,0 179,2
Max 21216,0 3161,0 1983,8 30644,0 3431,0 1983,7 35128,0 4012,0 2000,5
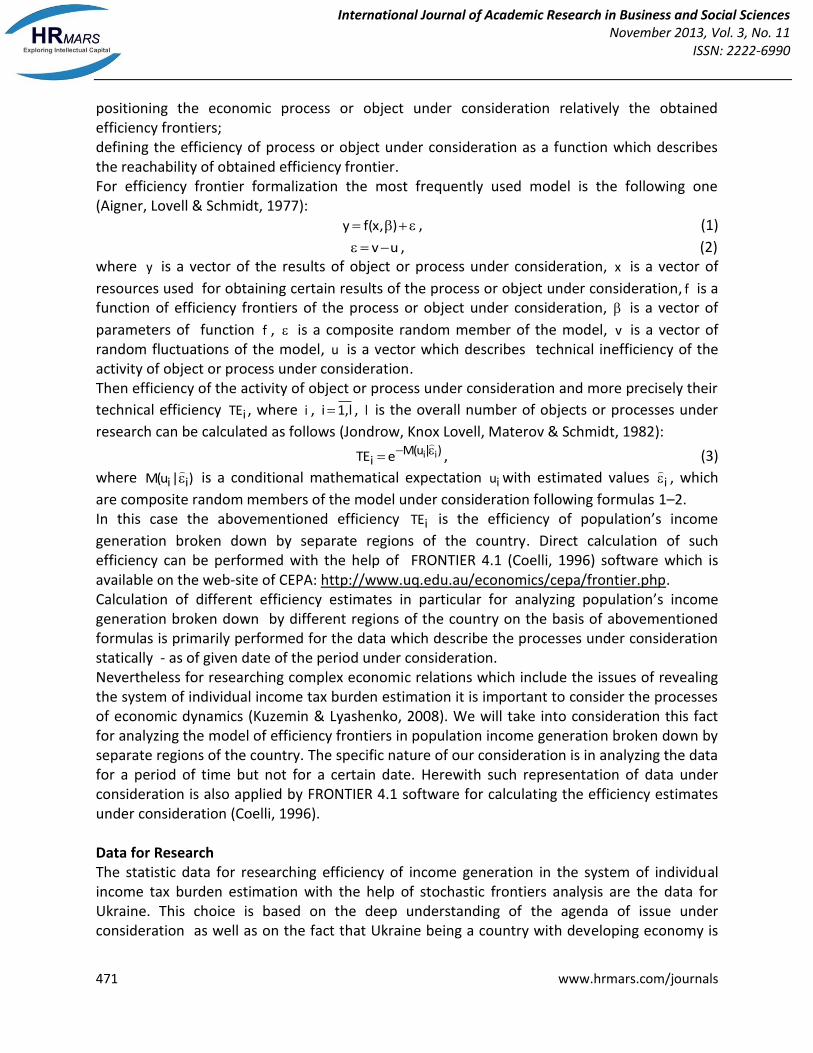
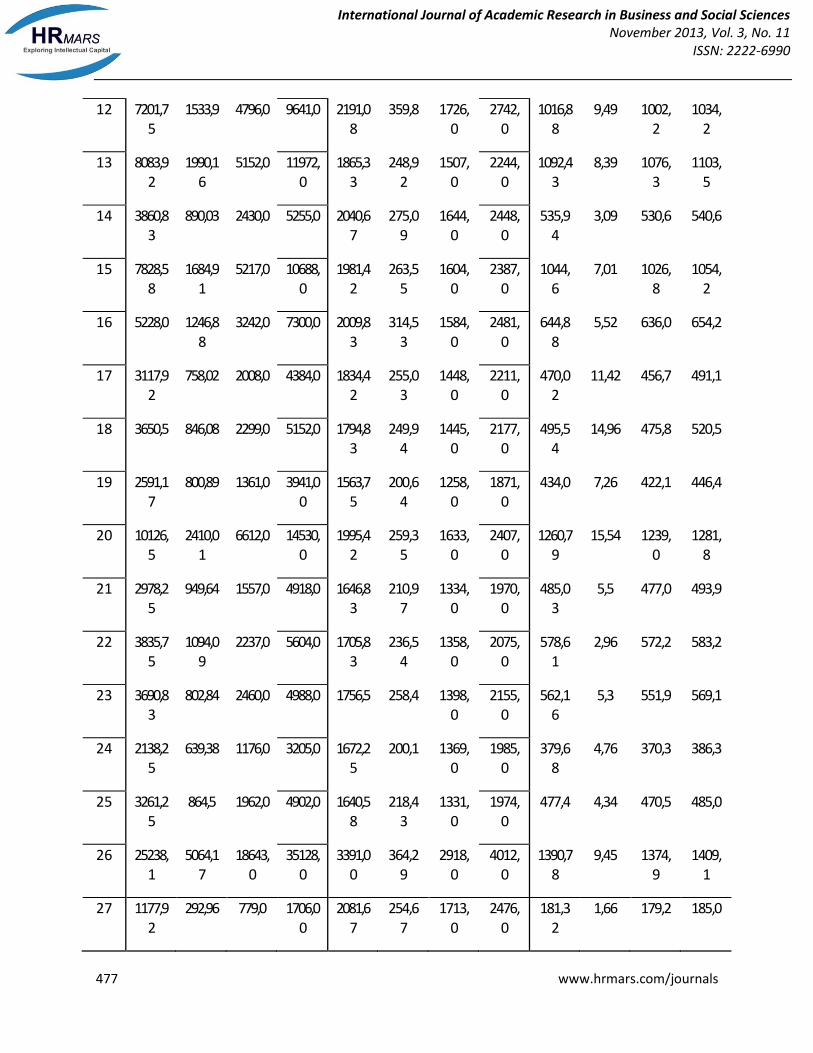
Alongside this Table 3 as calculated on the basis of State Statistical Service of Ukraine web-site data represents statistic descriptions of the data under consideration broken down by the dynamics of the whole researched period from 2009 till 2011 broken down by every region under consideration. The first column reflects ordinal numbers of the regions under considerations while the other columns show statistic descriptions for each of researched parameters of the model with the aim of determining the efficiency frontier in line with formula 4. Table 2 and Table 3 prove that statistic descriptions of variables fro determining population’s income generation efficiency frontier on grounds of the model on formula 4 are significantly

International Journal of Academic Research in Business and Social Sciences November 2013, Vol. 3, No. 11
ISSN: 2222-6990
476 www.hrmars.com/journals
different. Thus we can think about possibility of using the method of analysis for building the corresponding efficiency frontier and particularly for determining the parameters of such a frontier on grounds of its model described above.
Table 3: Statistic descriptions of researched data from the point of view of their dynamics broken down by separate regions of Ukraine
Regions
Taxable income Average salary Employed population
aver
age
stan
dard
de
viat
ion
min
max
aver
age
stan
dard
de
viat
ion
min
max
aver
age
stan
dard
de
viat
ion
min
max
1 5620,83
1248,81
3651,0 8103,0 1894,33
259,58
1503,0
2295,0
906,84
6,08 898,8 920,5
2 4927,58
1554,5 2794,0 7383,0 1693,17
244,32
1336,0
2074,0
695,46
3,99 687,5 702,6
3 2679,75
712,91 1631,0 4153,0 1618,33
240,60
1288,0
1994,0
434,44
5,42 425,8 443,8
4 14075,5
3139,64
9264,00
19932,0
2273,92
360,08
1772,0
2790,0
1543,65
8,99 1528,1
1555,7
5 18249,7
4091,48
12521,0
26436,0
2464,58
406,33
1938,0
3063,0
1977,95
13,11 1958,1
2000,5
6 3637,42
939,71 2122,0 5192,00
1694,58
254,06
1320,0
2071,0
557,86
3,3 553,5 564,0
7 2855,83
667,04 1788,00
4178,00
1730,83
225,29
1381,0
2069,0
528,48
4,63 521,2 535,5
8 7223,58
1670,11
4750,0 10536,0
2116,67
319,66
1697,0
2607,0
826,08
5,87 816,5 835,9
9 3627,33
897,03 2300,0 5302,00
1845,92
248,05
1501,0
2213,0
531,08
5,1 521,0 538,5
10 6482,33
1676,36
4123,0 9667,0 2237,33
329,08
1813,0
2761,0
749,56
7,26 737,6 757,9
11 2833,58
776,63 1654,0 4115,0 1730,83
247,58
1362,0
2114,0
432,98
2,70 429,3 438,9
International Journal of Academic Research in Business and Social Sciences November 2013, Vol. 3, No. 11
ISSN: 2222-6990
477 www.hrmars.com/journals
12 7201,75
1533,9 4796,0 9641,0 2191,08
359,8 1726,0
2742,0
1016,88
9,49 1002,2
1034,2
13 8083,92
1990,16
5152,0 11972,0
1865,33
248,92
1507,0
2244,0
1092,43
8,39 1076,3
1103,5
14 3860,83
890,03 2430,0 5255,0 2040,67
275,09
1644,0
2448,0
535,94
3,09 530,6 540,6
15 7828,58
1684,91
5217,0 10688,0
1981,42
263,55
1604,0
2387,0
1044,6
7,01 1026,8
1054,2
16 5228,0 1246,88
3242,0 7300,0 2009,83
314,53
1584,0
2481,0
644,88
5,52 636,0 654,2
17 3117,92
758,02 2008,0 4384,0 1834,42
255,03
1448,0
2211,0
470,02
11,42 456,7 491,1
18 3650,5 846,08 2299,0 5152,0 1794,83
249,94
1445,0
2177,0
495,54
14,96 475,8 520,5
19 2591,17
800,89 1361,0 3941,00
1563,75
200,64
1258,0
1871,0
434,0 7,26 422,1 446,4
20 10126,5
2410,01
6612,0 14530,0
1995,42
259,35
1633,0
2407,0
1260,79
15,54 1239,0
1281,8
21 2978,25
949,64 1557,0 4918,0 1646,83
210,97
1334,0
1970,0
485,03
5,5 477,0 493,9
22 3835,75
1094,09
2237,0 5604,0 1705,83
236,54
1358,0
2075,0
578,61
2,96 572,2 583,2
23 3690,83
802,84 2460,0 4988,0 1756,5 258,4 1398,0
2155,0
562,16
5,3 551,9 569,1
24 2138,25
639,38 1176,0 3205,0 1672,25
200,1 1369,0
1985,0
379,68
4,76 370,3 386,3
25 3261,25
864,5 1962,0 4902,0 1640,58
218,43
1331,0
1974,0
477,4 4,34 470,5 485,0
26 25238,1
5064,17
18643,0
35128,0
3391,00
364,29
2918,0
4012,0
1390,78
9,45 1374,9
1409,1
27 1177,92
292,96 779,0 1706,00
2081,67
254,67
1713,0
2476,0
181,32
1,66 179,2 185,0

International Journal of Academic Research in Business and Social Sciences November 2013, Vol. 3, No. 11
ISSN: 2222-6990
478 www.hrmars.com/journals
The results of calculating values of population’s income efficiency Thus on grounds of variables chosen for building populations’ income generation efficiency frontier via FRONTIER 4.1 software it was possible to calculate the values of population’s income generation efficiency broken down by separate regions of Ukraine for different time periods chosen for this research. Table 4 shows the parameters and statistic values for the model under formula 4 for the efficiency frontier under consideration following the results of their application to real-life data on Ukraine in 2009, 2010 and 2011 correspondingly. The calculations were done at the level of significance of 0,05. The first column of Table 4 gives the parameters of the model of corresponding efficiency frontier with the help of formula 4 4. Other columns show values of efficiency frontier efficiency model parameters and their statistic values broken down by separate time periods. Table 4 shows that our model of population’s income generation efficiency frontier in line with formula 4 is valid. In particular this is proved by the value of t-ratio and the value of standard-error. At the same time the logic of the data given in Table 4 means that the influence of the size of average salary on the size of income obtained by the population of separate regions is insignificant even though the statistic value of such influence is significant. In particular this fact is the basis for conclusion on the need for growth of average salary from the point of view of population’s income generation and consequently form the point of view of the efficiency of corresponding fiscal performance.
Table 4: The parameters and statistic values of the model under formula 4 of researched efficiency frontier following the results of their application to real-life data on Ukraine
Parameter
Periods under consideration
Year 2009 Year 2010 Year 2011
Estimation of
parameter
standard-error
t-ratio
Estimation of
parameter
standard-error
t-ratio
Estimation of
parameter
standard-error
t-ratio
0 0,209E+0
2 0,142E+0
1 0,147E+0
2 0,175E+0
2 0,383E+0
1 0,458E+0
1 0,170E+0
2 0,143E+0
1 0,119E+0
2
1 -0,479E-
08 0,934E-
09
-0,513E+0
1
-0,821E-08
0.886E-09
-0,926E+0
1
-0,101E-07
0,893E-09
-0,113E+0
2
2 0,169E+0
1 0,400E+0
0 0,424E+0
1 0,176E+0
1 0,342E+0
0 0,513E+0
1 0,175E+0
1 0,244E+0
0 0,715E+0
1

International Journal of Academic Research in Business and Social Sciences November 2013, Vol. 3, No. 11
ISSN: 2222-6990
479 www.hrmars.com/journals
2 0,245E+0
1 0,729E+0
0 0,336E+0
1 0,201E+0
1 0.599E+0
0 0.335E+0
1 0,127E+0
1 0,425E+0
0 0,299E+0
1
0,978E+00
0,777E-02
0,126E+03
0,962E+00
0,129E-01
0,741E+02
0,939E+00
0,242E-01
0,388E+02
2u
22 , 2
2u
.
Table 5 shows the results of estimation of population’s income efficiency broken down by separate regions of Ukraine. It also shows the corresponding ordinal numbers of deparate regions of Ukraine and assessment of efficiency broken down by year for every region. Table 5: The results of estimation of population’s income efficiency broken down by separate regions
Regions Year 2009 Year 2010 Year 2011 Regions Year 2009 Year 2010 Year 2011
1 0,36 0,34 0,43 15 0,42 0,50 0,72
2 0,24 0,32 0,37 16 0,31 0,36 0,47
3 0,15 0,14 0,24 17 0,15 0,21 0,29
4 0,82 0,89 0,94 18 0,18 0,25 0,32
5 0,93 0,94 0,87 19 0,15 0,17 0,23
6 0,17 0,24 0,34 20 0,48 0,68 0,68
7 0,15 0,18 0,26 21 0,16 0,16 0,22
8 0,41 0,43 0,65 22 0,22 0,24 0,35
9 0,16 0,24 0,31 23 0,20 0,25 0,34
10 0,37 0,43 0,59 24 0,12 0,14 0,20
11 0,16 0,14 0,26 25 0,15 0,22 0,29
12 0,38 0,47 0,54 26 0,90 0,72 0,86
13 0,43 0,49 0,73 27 0,06 0,08 0,11
14 0,21 0,23 0,35 mean
efficiency 0,31 0,35 0,44

International Journal of Academic Research in Business and Social Sciences November 2013, Vol. 3, No. 11
ISSN: 2222-6990
480 www.hrmars.com/journals
First of all the data of Table 5 show that population’s income efficiency estimates broken down by separate regions are significantly different from each other. One can say that there are regions for which population’s income efficiency estimates are high – more than 80%, but there are regions for which population’s income efficiency estimates are less than 20%. When we compare these data with the data of Table 3 we can see that the highest population’s income efficiency estimates correspond to the highest average salary values. Thus the conclusion on the need for growth of average salary from the point of view of population’s income generation made on the grounds of analysis of Table 4 data is also proved by the results of analysis of population’s income generation efficiency estimates given in Table 5. Table 5 also shows that the average population’s income efficiency estimates broken down by separate regions over the period of time under consideration is growing. In particular the comparison of data from Table 5 and Table 2 proves that the growth of average population’s income efficiency estimates broken down by separate regions is backed by the growth of average salary. The comparison of Table 1 and Table 5 shows that decrease of tax burden on in population’s taxable income is backed by the general growth of average estimate of population’s income generation efficiency. Though it should be noted that in different regions we can find other tendencies associated with the size of tax burden on taxable income of the corresponding estimates of efficiency of income under consideration generation. At the same time we should say that changes in the values of efficiency estimates of population’s income generation are generally related to the changes in the obtained calculations of tax burden values. Moreover one can say that the decrease in values of population’s income generation efficiency is correlated to the growth of at least with stability of tax burden values. Conclusions Thus the accomplished research gives us possibility to say that it is reasonable to use the method of analysis by stochastic frontiers with the consideration of dynamics of researched data for estimating the efficiency of population’s income as of a constituent in the system of individual income tax burden analysis. In particular the use of stochastic frontiers analysis made it possible not only to review the dynamics of changes in population’s income generation efficiency broken down by separate regions but also to make a conclusion about the need for the growth in average salary from the point of view of population’s income generation and consequently from the point of view of the growth of efficiency in corresponding taxes fiscal performance. The article also answers the question about interrelation between changes in taxable income tax burden and changes in the corresponding estimates of population’s income generation efficiency broken down by their regional aspects. In particular the results of this issue research can be taken into consideration for choosing the tools of regulating tax burden on population’s income in case of changes in the values of population’s income generation efficiency based on the functioning performance of the separate regions of the country. References Aigner, D., Lovell, C. A. L., & Schmidt, P. (1977). Formulation and estimation of stochastic frontier production function models. Journal of econometrics, 6(1), 21-37.

International Journal of Academic Research in Business and Social Sciences November 2013, Vol. 3, No. 11
ISSN: 2222-6990
481 www.hrmars.com/journals
Andrews, W. D. (1972). Personal deductions in an ideal income tax. Harvard Law Review, 86(2), 309-385. Battese, G. E., & Coelli, T. J. (1992). Frontier production functions, technical efficiency and panel data: with application to paddy farmers in India. Journal of productivity analysis, 3(1-2), 153-169. Bird, R. M., & Zolt, E. M. (2004). Redistribution via taxation: the limited role of the personal income tax in developing countries. UCLA Law Review, 52, 1627-1686. Bird, R. M., & Zolt, E. M. (2005). The limited role of the personal income tax in developing countries. Journal of Asian Economics, 16(6), 928-946. Caminada, K., & Goudswaard, K. (2001). International trends in income inequality and social policy. International Tax and Public Finance, 8(4), 395-415. Coelli, T. J. (1996). A guide to FRONTIER version 4.1: A computer program for stochastic frontier production and cost function estimation. CEPA working paper, 96(7). Entin, S. J. (2004). Tax incidence, tax burden, and tax shifting: Who really pays the tax. Center for Data Analysis Report, 4, 12-26. Farrell, M. J. (1957). The measurement of productive efficiency. Journal of the Royal Statistical Society. Series A (General), 120(3), 253-290. Gluschenko, V. V., Lyashenko, V. V. & Somova V. V. (2013). Analysis of the Population Income Tax Burden, Using the Method of Stoсhastic Limits. European Researcher, 40 (2-1), 286-292. Jondrow, J., Knox Lovell, C. A., Materov, I. S., & Schmidt, P. (1982). On the estimation of technical inefficiency in the stochastic frontier production function model. Journal of econometrics, 19(2), 233-238. Kuzemin, A., & Lyashenko, V. (2008). Analysis of Spatial-temporal Dynamics in the System of Economic Security of Different Subjects of Economic Management. Information Technologies and Knowledge, 2(3), 234-238. Lee, Y., & Gordon, R. H. (2005). Tax structure and economic growth. Journal of public economics, 89(5), 1027-1043. Moffitt, R. A. (2003). The negative income tax and the evolution of US welfare policy. National Bureau of Economic Research working paper, (w9751). Phillips, J. M., & Goss, E. P. (1995). The effect of state and local taxes on economic development: A meta-analysis. Southern Economic Journal, 62(2), 320-333. Schultz, T. P. (1998). Inequality in the Distribution of Personal Income in the World: How it is Changing and Why. Journal of Population Economics, 11(3), 307-344. Sinelnikov-Murylev, S., Idrisov, G., & Kadochnikov, P. (2012). Corporate Income Tax: Analysis of 2001 Reform and Modelling of Tax Potential of the Regions. IEP Research Papers, (153).