the effectiveness of health screening · austria is a particularly useful case to study the...
TRANSCRIPT

HEALTH ECONOMICSHealth Econ. 24: 913–935 (2015)Published online 18 July 2014 in Wiley Online Library (wileyonlinelibrary.com). DOI: 10.1002/hec.3072
THE EFFECTIVENESS OF HEALTH SCREENING
FRANZ HACKLa,�, MARTIN HALLAa,b, MICHAEL HUMMERa and GERALD J. PRUCKNERa
aDepartment of Economics, University of Linz, Linz, AustriabIZA, Bonn, Germany
SUMMARY
Using a matched insurant–general practitioner panel data set, we estimate the effect of a general health-screening programon individuals’ health status and health-care cost. To account for selection into treatment, we use regional variation in theintensity of exposure to supply-determined screening recommendations as an instrumental variable. We find that screeningparticipation increases inpatient and outpatient health-care costs up to 2 years after treatment substantially. In the mediumrun, we find cost savings in the outpatient sector, whereas in the long run, no statistically significant effects of screening oneither health-care cost component can be discerned. In sum, screening participation increases health-care cost. Given thatwe do not find any statistically significant effect of screening participation on insurants’ health status (at any point in time),we do not recommend a general health-screening program. However, given that we find some evidence for cost-savingpotential for the sub-sample of younger insurants, we suggest more targeted screening programs. Copyright © 2014 JohnWiley & Sons, Ltd.
Received 20 November 2012; Revised 31 March 2014; Accepted 06 May 2014
JEL classification: I10; I18
KEY WORDS: health screening; health-care cost; sick leave; mortality
1. INTRODUCTION
Health screening was a rapidly growing and widely accepted practice in health care during the 20th century.1
Proponents of screening programs stress that in addition to the potential of early disease detection (secondaryprevention), they also provide the opportunity for screening participants to change unhealthy lifestyles throughthe so-called lifestyle counseling (primary prevention). Consequently, participants’ long-term health outcomesare expected to improve, and future health-care costs should decrease. However, more recently, screeningprograms have faced heavy criticism. Opponents emphasize a list of contra-arguments. They argue that inmany cases, the effectiveness of screening is limited and that screening costs will exceed associated savings.Screening may produce false positive outcomes that result in overtreatment. This may increase not onlyshort-term but also long-term health-care costs. Moreover, several screening procedures may themselves entailpotential harm (e.g., due to radiation exposure) or considerable discomfort for patients (e.g., as in the case ofa colonoscopy). According to the latter arguments, different health organizations have recently revised theirscreening guidelines.
�Correspondence to: Department of Economics, University of Linz, Altenberger Str. 69, 4020 Linz, Austria. E-mail: [email protected]
1Screening might be defined as the active search for a disease (or a pre-disease condition) in patients who are presumed and presumethemselves to be healthy (Holland and Stewart, 2005). In such a setting, screening is, in general, not able to reduce the likelihood ofa certain disease; however, it may reduce its negative consequences. Therefore, screening is usually considered as a form of secondaryprevention. In cases where screening programs incorporate aspects of health counseling, it also constitutes primary prevention.
Copyright © 2014 John Wiley & Sons, Ltd.

914 F. HACKL ET AL.
Typically, these screening guidelines are based on two strands of medical and epidemiological litera-ture. One branch analyzes the selection process of patients into the screening programs. Summing up thisextensive body of literature, one can put forward that screening participants are positively selected on socioe-conomic characteristics. Moreover, there is evidence that especially healthy people as well as those witha family history of particular illnesses participate.2 The other strand of literature deals with the effective-ness of screening programs. Typically, randomized control trials are used to evaluate the effectiveness ofscreening programs.3
On the basis of this medical and epidemiological evidence, screening guidelines and their changes over timeleave the overall impression that as compared with previous periods, contra-arguments have been given a higherpriority more recently.4
In this paper, we evaluate an Austrian mass screening program launched in 1974. Every Austrian adult isinvited to undergo an annual health screening offered by his or her general practitioner (GP), the financial costsof which are fully covered by statutory health insurance. The screening process comprises a general healthexamination and some age-specific and sex-specific components. Laboratory tests and the determination ofbehavioral risk factors (based on the insurants’ medical history) should help to detect cardiovascular diseases.In addition to this form of secondary prevention, participation is expected to motivate insurants to engage inprimary prevention.
Our analysis is based on a matched patient–GP panel data set comprising all private sector employ-ees and their dependents from the state of Upper Austria covering the period from 1998 to 2007. Thisdata set allowed us to estimate the effect of screening participation on a number of health outcomes suchas outpatient health-care costs, the incidence of hospitalization and sick leave, and mortality. In order tosolve the problem of self-selection into treatment, we took advantage of the fact that GPs have an incen-tive to ‘sell’ the screening exams to their patients. In particular, we suggest an instrumental variable (IV)estimation strategy that utilized exogenous variation in screening participation due to supply-determinedscreening recommendations. To quantify each insurant’s exposure to supply-determined screening recom-mendations, we used the number of prescribed screenings per insurant by all GPs located in the insurant’szip code area. As we will argue in detail in the succeeding text, after controlling for insurant and GPfixed effects, this variable should affect insurants’ subsequent health outcomes only through the screeningparticipation.
For the average insurant, we observed an increase in outpatient health expenditures (by 27% in the year ofscreening participation and by 39% in the following year) and of inpatient health-care costs (by about 40%).In the medium run, outpatient expenditures decreased by 20% in the third year after treatment, and by 40% inthe fourth and fifth years. We neither found long-run effects on health-care cost nor observed any effects on thehealth status variables, days of sick leave, and mortality. In summary, we did not observe overall cost savingsor any positive effects on health for the average insurant. These patterns are quite robust across different sub-samples of the population. However, given that the short-run increase in health expenditures is comparably low
2Jepson et al. (2000) provided an extensive survey on determinants of screening participation. Compare also Aas (2009), Blom et al.(2008), Fukuda et al. (2007), Lange (2011), Meissner et al. (2007), Sabates and Feinstein (2006), Selvin and Brett (2003), Sambamoorthiand McAlpine (2003), Whynes et al. (2007), or Park and Kang (2008) for more recent studies.
3Actual recommendations of the US Preventive Services Task Force are, for instance, based on Andriole et al. (2009) and Schröder et al.(2009) for prostate cancer screenings, Nyström et al. (2002) and Tabár et al. (1999) for breast cancer screening, or Hardcastle et al. (1996)and Mandel et al. (1993) for colorectal cancer screening. Raffle and Gray (2007) presented state-of-the-art studies for randomized controltrials (e.g., UK Collaborative Trial of Ovarian Cancer Screening) and other more disputed methods in the clinical realm that have beenused to bring evidence of the impact of screening programs (e.g., so-called case control studies or long-term trend analysis).
4For instance, the US Preventive Services Task Force has released new guidelines for breast cancer screening by 2009 (USPSTF, 2009).Whereas previous recommendations for screening mammography were for screening every 1 to 2 years after the age of 40 years, the newrecommendations call for participation only after the age of 50 years. Or the American Cancer Society takes a clear position discouragingmass population screening and encouraging doctors to inform their patients about screening uncertainties and to involve them more in thedecision-making process (Smith et al., 2008).
Copyright © 2014 John Wiley & Sons, Ltd. Health Econ. 24: 913–935 (2015)DOI: 10.1002/hec

THE EFFECTIVENESS OF HEALTH SCREENING 915
for younger insurants (around 60 years of age or younger), we found some evidence for overall cost-savingpotentials for this group.
This paper extends the existing literature on the effectiveness of screening as follows. (i) While theliterature on cost effectiveness of mass screenings takes into account direct costs of screening examinations,little information on indirect follow-up treatment costs is available. Screening participation might manifestitself in cost savings through early detection of diseases or, in turn, in an increase in costs triggered bysubsequent medical treatment that would not have occurred otherwise. We observed the medical history of apatient in the records of the regional sickness fund over a period of 10 years. Therefore, we provide a morecomprehensive analysis of potential financial consequences of screening participation. (ii) Compared withexisting literature, for all participants and non-participants, we observed the universe of health-service uti-lization that allowed us to study a broad variety of outcome variables (e.g., expenses for medical attendanceand drugs, hospitalization, sick leave, and mortality). This enabled a more comprehensive evaluation of healthscreening. (iii) The administrative panel data provided in the register of the regional sickness fund cover 73%of the population in the state of Upper Austria and made an evaluation of screening participation in generalmedical practice possible. (iv) Finally, the Austrian Bismarckian-type health-care system represents a goodexample for countries with universal health care where anyone is eligible to participate in a health-screeningexamination once a year. Consequently, we did not expect sample selection based on financial constraints ofthe patients.
The remainder of the paper is organized as follows. In Section 2, we start with a brief description of theinstitutional setting. Section 3 presents the data and descriptive statistics. Thereafter, we explain our estimationstrategy and discuss the identifying assumptions of our empirical strategy in Section 4. Section 5 reports themain empirical results and presents several analyses of important sub-samples to check the robustness of theresults. Section 6 provides a robustness analysis for the plausibility of our identification strategy, and Section 7concludes the paper.
2. INSTITUTIONAL SETTING
Austria is a particularly useful case to study the effectiveness of screening participation. It represents aBismarckian-type (social) health insurance system and offers a nationwide health-screening program. Everyresident is covered by mandatory health insurance. Depending on occupation and place of residence, individ-uals are insured with one of 25 regional sickness funds.5 Most sickness funds cover all costs associated withsickness and maternity, and some of them charge a small deductible or copayment.6 In all funds, a visit to a GPfor a referral to a medical specialist is recommended; however, there is no obligation to do so, and more andmore specialists are consulted directly by the patients.
Every insurant (18 years of age or older) is invited to undergo a voluntary health screening once a year.This screening examination is conducted by a GP and is fully covered by mandatory health insurancewithout any extra payment by patients. The screening examination includes a general health check and severalage-specific and sex-specific diagnostic services. The general health examination consists of laboratory teststo monitor blood sugar, uric acid, triglycerides, cholesterol, gamma-glutamyl transferase, and measurementof body mass index. On the basis of a short anamneses questionnaire, the insurant’s own and family medi-cal history, frequency of physical activity, alcohol consumption, and cigarette smoking are determined. Thisinformation is the basis for the GP to identify behavioral risk factors and to motivate the patient to engage inprimary prevention (life-style counseling). Concerning alcohol abuse and smoking, assistance is provided inreducing alcohol intake and smoking cessation. Obese patients have nutritional counseling. The program pri-marily aims to prevent or detect cardiovascular disease at an early pre-symptomatic stage in order to reduce
5Because of historical reasons, the division is not only regional but also occupational.6The Upper Austrian Sickness Fund (whose data we use in the succeeding text) does not charge deductibles or copayments.
Copyright © 2014 John Wiley & Sons, Ltd. Health Econ. 24: 913–935 (2015)DOI: 10.1002/hec

916 F. HACKL ET AL.
Figure 1. Screening participation rate in Austria by sex, 1990–2010
future health-care costs and improve insurants’ quality of life. Depending on age and sex, several additionalexaminations may be recommended by the examining GP.7
As Figure 1 shows, annual screening participation has steadily increased since the 1990s.8 While only about6% of all male insurants and 7% of all female insurants participated in the year 1990, the participation rateincreased to 13% and 14%, respectively, in 2010. To put these numbers into perspective, it must be notedthat very few insurants participate in the screening every year. For instance, in the state of Upper Austria, themajority (about 60%) of attendees only participated once or twice over a 10-year period. About 6% showed upevery second year, and less than 1% attended every year.
The direct costs of the health-screening program are substantial. For instance, in 2010, the sickness fundsspent more than 65 million Euros on screenings of about 850,000 insurants; this is equivalent to 0.27% ofthe total health-care cost (or 0.024% of the gross domestic product). This figure only includes the cost for thegeneral health examination and accounts for neither the additional age-specific and sex-specific componentsnor further referrals to medical specialists. In general, participation rates are higher for older insurants (see firstline in Table I).
3. DATA
Our empirical analysis is based on all private sector employees and their dependents residing in the state ofUpper Austria.9 We used the database of the Upper Austrian Sickness Fund to compile a matched insurant–GP panel data set for all insurants who were born before 1965. Our data set covers the period from 1998to 2007.10 In order to assign a GP to each insurant, we used the patients’ GP consultation record. For each
7In detail, the program comprises the following: 40 years or older: counseling and education concerning breast cancer, recommendationof a supplementary mammography; 50 years and older: counseling and education concerning colorectal cancer, performing a fecal occultblood test, recommendation of a supplementary colonoscopy; 65 years and older: special examinations of hearing and vision.
8Women are more likely to participate in screenings; this is also confirmed by a regression analysis using the micro-level data to beexplained in the next section. Detailed estimation output is available upon request.
9Upper Austria is one of the nine states in Austria and comprises about one sixth of the Austrian population and work force. From thetotal population (about 1,400,000), we observed 1,180,000 insured private sector employees with their dependents. Out of this group,we focused on 541,351 persons born in 1964 or earlier. From this sample, 266,170 persons (49.17%) had at least participated once in ascreening program. The remaining 275,181 (50.83%) never joined the screening program.
10Therefore, at the beginning of our observation period, the included insurants were 34 years of age or older. For younger people, healthexpenditures are mainly driven by accidents or genetically disposed diseases. Both aspects are not covered by the screening program.
Copyright © 2014 John Wiley & Sons, Ltd. Health Econ. 24: 913–935 (2015)DOI: 10.1002/hec

THE EFFECTIVENESS OF HEALTH SCREENING 917
Table I. Mean and standard deviation of screening participation and health outcomes (by age group)
Age groups (years)
Overall 34–43 44–53 54–63 64–73 74C
Participation ratea 14.26 11.19 13.84 17.43 17.51 10.89Outpatient expenditures 636.00 305.52 463.22 666.69 855.74 1097.31
(1059.12) (728.22) (970.92) (1108.85) (1166.86) (1156.46)Medical attendance 298.68 186.56 259.26 320.34 365.75 412.20
(364.00) (239.89) (324.20) (376.75) (416.03) (429.24)Medical drugs 337.31 118.96 203.95 346.35 489.99 685.11
(915.28) (651.67) (866.31) (977.47) (1006.23) (966.08)Days of hospitalization 3.36 1.32 1.98 2.92 4.50 7.91
(10.86) (6.60) (8.37) (9.94) (12.42) (16.09)Days of sick leave 13.48 11.15 13.90 17.91 3.29 3.89
(26.35) (21.70) (26.69) (33.47) (16.17) (20.06)Mortality 0.12 0.01 0.04 0.09 0.21 0.53
Number of individuals 586,915 172,465 123,199 106,343 77,917 61,427
This table provides the annual mean and the standard deviation (in brackets) for the health outcomes under consideration based on anunbalanced panel data set covering the period from 1998 to 2007. The first column gives the numbers for all insurants (34 years of age orolder). Columns 3 to 7 give the figures by age group. Monetary values are adjusted for inflation and expressed in 2007 Euros. Insurantscontribute up to 10 observations and may be represented in up to two age groups. This does not apply to the outcome mortality, whichgives the relative share of insurants of each age group that had passed away by the end of 2009.aIn 2007.
year, we determined the GP who was most frequented by the insurant.11 On average, an insurant had 8.8 GPconsultations per year (the median is equal to 5.0), provided by 1.2 different GPs. During years in which aninsurant had no GP consultation (about 18.6% of all observations), we assigned the GP from the preceding(or if not available, from the succeeding) year(s). The nature of the matched insurant–GP panel data impliesthat we had to exclude all insurants (7.7%) from our analysis who had never consulted a GP in Upper Austriaduring their insurance spell(s).12
Obviously, our panel is not balanced. Individuals dropped out of our sample if they were no longer insuredwith the Upper Austrian Sickness Fund, if they moved outside Upper Austria, or if they passed away. Equiv-alently, individuals born before 1965 entered into our panel if they joined the Upper Austrian Sickness Fundand resided in Upper Austria after 1998. Still, the vast majority of insurants (82.4%) in our sample could beobserved in each year.
Our data set includes information on all covered health services (including screening participation) that hadbeen provided to an insurant by his or her GP or any other resident medical specialist. That means that weobserved each single doctor visit and each drug that had been prescribed, and with the exact date of serviceutilization. The data set also provides information on the incidence of hospitalization and sick leave. In orderto obtain exact information on the place of residence (zip code area), labor market status, and mortality, welinked our data to the Austrian Social Security Database and the database from the Austrian Federal Ministryof Finance.
To evaluate the effectiveness of health screening, we considered the following outcomes in our estimationanalysis in the succeeding text: outpatient health-care expenditures including cost for medical attendance andmedical drugs, days of hospitalization, days of sick leave, and mortality.13 As Table I shows, the average
11If an insurant had consulted two (or more) GPs equally often in a given year, we picked the most recently consulted one.12Because these insurants had comparably shorter insurance spells, they accounted for only 4.4% of the observations.13The cost of screening participation has been deducted from outpatient health-care expenditures. Days of hospitalization were used as a
proxy for inpatient health-care expenditure. The analysis of sick leave was restricted to the sample of insurants with employment spells.Moreover, sick leave was only measured precisely for sickness absences that lasted longer than 3 days. It is not mandatory for employeesor firms to notify the Upper Austrian Sickness Fund of sickness absences lasting less than 3 days.
Copyright © 2014 John Wiley & Sons, Ltd. Health Econ. 24: 913–935 (2015)DOI: 10.1002/hec

918 F. HACKL ET AL.
insurant generated 636.00 Euros of outpatient health expenditures per year, spent 3.36 days in the hospital, andwas on sick leave (conditional on employment) for 13.48 days. As expected, in each category, the mean and thestandard deviation increased with age.14 By the end of 2007, about 1% from the youngest age group and 53%of the oldest age group passed away.
4. ESTIMATION STRATEGY
To estimate the effect of screening on subsequent health outcomes, we started with the equation
yit D ˛r � si;t�r C ˇ � xit C �i C J.i;t/ C ıt C �it (1)
where yit denotes the health outcome of insurant i in period t . The binary variable(s) si;t�r capture whetherindividual i participated in a health screening in period t � r with r � f0; 1; 2; 3; 4; 5; 6; 7; 8g. As covariates,we included time-varying characteristics of the insurants (denoted by xit ), insurants fixed effects .�i /, GP fixedeffects . J.i;t//, and time fixed effects .ıt /. The identification of GP fixed effects is guaranteed by insurantsseeing different GPs over time. The parameters of primary interest are ˛r , indicating the effect of screening ryears ago.
An obvious issue is the endogeneity of screening participation. Self-selection into treatment has to beexpected. In other words, a correlation between si;t�r and the error term �it is highly likely. A priori, it is hardto assess the sign of the selection bias. It is reasonable to believe that health-conscious individuals are morelikely to participate. In that case, ordinary least squares (OLS) would overestimate the effect of health screen-ing. At the same time, it would be rational for individuals from high-risk groups to undergo a check-up on aregular basis. If the latter effect dominates, OLS would underestimate the effect of screening.15
Selection that is based on insurants’ observed characteristics or unobserved time-invariant heterogeneity iscontrolled for by the inclusion of the vector of time-varying individual characteristics and the insurants’ fixedeffects. However, if screening participation is correlated with time-varying unobservables that affect healthoutcomes, no control strategy succeeds in identifying the causal effect of screening. To account for the lattersituation, we suggest an IV approach. This allows a consistent estimation of the causal effect of screeningwithout asymptotic bias from unobserved time-varying heterogeneity.
4.1. Supply-determined screening demand
The idea of our IV strategy was to utilize exogenous variation in screening participation due to supply-determined demand. In other words, we took advantage of the fact that patients not only do self-select intoscreening but also are examined simply because of their GP’s recommendation. In fact, there are good reasonsto believe that this market is mainly driven by the supply side. To motivate this approach, we discuss in a firststep why GPs in Austria should have a strong incentive to recommend screening, and we provide evidencethat patients responded to this recommendation. These are two necessary conditions for the suitability of ourIV strategy.
Do GPs have an incentive to recommend screening? GPs may consider screening a sensible method ofsecondary prevention and advocate it to their patients in order to improve their future well-being. This typeof supply-determined health demand is fully altruistic and solely guided by the Hippocratic Oath. Moreover,GPs may also act in their own interest, as they recommend screening that is driven by their profit-maximizing
14Note that this does not apply to sick leave for the two highest age groups. Because average effective retirement age in the year 2007 was57.9 for male and 58.9 for female (source: OECD Database), the remaining insurants in the sample are positively selected.
15There is extensive medical and epidemiological literature available that confirms this positive selection into screening (see the Introductionand footnote 2).
Copyright © 2014 John Wiley & Sons, Ltd. Health Econ. 24: 913–935 (2015)DOI: 10.1002/hec

THE EFFECTIVENESS OF HEALTH SCREENING 919
Table II. General practitioners’ fees for different types of services
Type of service Fee Percent
First and second consultations in a quarter 17.98 46.74Consultation from third visit in a quarter onwards 2.33 6.09Therapeutic counsel 10.86 3.45Sonography 2.54 0.80Home visit 22.35 8.04: : :Cardiopulmonary resuscitation at the location of the accident 82.53 0.01: : :Screening 75.00 6.88
This table provides fees paid by the Upper Austrian Sickness Fund for different typesof services by GPs and the respective percentage of GP’s total income.
behavior (McGuire, 2000). In a static setting, GPs have a clear financial incentive to sell screenings.16 Supply-determined recommendations may be particularly strong in the case of screening, because this service can besold to any patient, healthy or unhealthy, with a low probability of medical liability because of overtreatment.To put it bluntly, screening is the only service by which a GP can officially earn income with perfectly healthypeople. At least in Austria, screening also seems to be a comparably lucrative business. Table II providesfrequencies and fees paid from the Upper Austrian Sickness Fund to the GPs for different health-care services.It can be seen that the reimbursement for general consultation, including extra payments from the third visitof a patient in a quarter, makes up to 53% of the GPs total income.17 Screening accounts for almost 7% of thetotal amount of fees. Although we do not have detailed information on the doctors’ time spent for the differentservice categories, Table II also indicates that a GP can earn relatively good money by providing screeningexaminations. The screening fee is more than four times higher than that for the first treatment in a quarter, andalmost as high as the reimbursement for a cardiopulmonary resuscitation—one of the most expensive healthservices in the Austrian primary health-care market. We conclude from this that GPs have a clear incentive torecommend screening to their patients whether because of altruistic or non-altruistic reasons.18
Do patients respond to GPs’ screening recommendations? The conjecture that screening participation ishighly driven by GPs’ recommendations is confirmed in the literature. For instance, Cole et al. (2002) analyzedthe effectiveness of three different letter designs for colorectal cancer screening invitations. The first letter wasdispatched from a central screening service, the second included a reference to the patient’s GP, and the thirdwas also signed by the GP. It turns out that the participation rate was lowest among patients who received thefirst letter (32%) and highest among the third group (41%). This and similar evidence19 suggest that patientsrespond to GPs’ screening recommendations.
We observe a high exposure rate of patients to the GPs’ recommendations as we measure 8.8 GPconsultations per year for patients in our data set. The high number of GP consultations is related to the organi-zation of the Austrian health-care system: (i) patients do not pay deductibles, so they have an incentive to visittheir GP for almost any medical need; (ii) employed patients need confirmation from a doctor for a sick leaveof three or more days; and (iii) patients obtain their vaccinations from the GP, and a prescription is requiredfor almost any type of medical drugs, including contraceptives, antibiotics, or any mild cream to treat simplerashes. Consequently, the vast majority of insurants see their family doctor regularly, and sample selection intothe doctor’s office is not expected.
16In a dynamic setting, it could be optimal for GPs to undersupply preventive care measures in order to reap higher profits from curativecare measures in the future (Kenkel, 2000).
17A GP can have contracts with several health insurance funds. The funds are very similar in their fee structure, and the funds’ GP feesgenerate most of a GP’s income.
18In fact, a recent survey among 2000 insurants support this supposition. About 80% of survey respondents agree with that state-ment that ‘my GP provides me with information about screening’, and about 66 confirm that GPs also motivate them to participate.(http://www.hauptverband.at/mediaDB/849547_Presseunterlage_gesamt_GfK-20120112.pdf; accessed: October 30, 2012.)
19See, for instance, Meissner et al. (2007), Richardson et al. (1994), Bowman et al. (1995), Cole et al. (2002), Cowen et al. (1996).
Copyright © 2014 John Wiley & Sons, Ltd. Health Econ. 24: 913–935 (2015)DOI: 10.1002/hec

920 F. HACKL ET AL.
In line with this evidence, we found in our data that GP fixed effects alone explain about 8% of the variationin individual screening participation. Patient fixed effects, however, account for only 0.04% of the variation inscreening participation. This suggests that screening participation is predominantly driven by GPs and only toa small extent by patients themselves.
4.2. Quantifying supply-determined screening recommendations
Ideally, we would like a random sample of GPs recommending screening to a random sample of all theirpatients, and we could observe this and their subsequent health outcomes in our data.20 Because this typeof field experiment is not feasible, we suggest using a proxy for the intensity of exposure to GP screeningrecommendations. In particular, we argue that the number of prescribed screenings by GPs located in a given zipcode area provides (within a panel data regression framework) a good proxy for exposure to supply-determinedrecommendations.
We wanted to capture the simple idea that insurants are more exposed to supply-determined screeningrecommendations if the consulted GPs are more likely (for whatever reason) to advocate this service to theirpatients. If we were willing to assume that insurants had been randomly assigned to GPs, we could simplyuse GP fixed effects as an IV for screening participation.21 In order to relax this assumption, and to allowfor a setting where insurants may actively select a particular GP within their local neighborhood, we suggestmeasuring the exposure to supply-determined screening recommendations not on a GP level but on zip codelevel.22 Another advantage to this procedure is that we were able to include GP fixed effects in our regres-sion analysis that captured all unmeasured time-invariant GP characteristics. In particular, we calculated ourIV (denoted by S´.i/;t�r/ for each zip code area ´ and year t as the sum of all screenings prescribed by all GPslocated in a given zip code area (consumed by any insurant minus the screening of individual i) divided by allinsurants residing in this zip code area minus one.
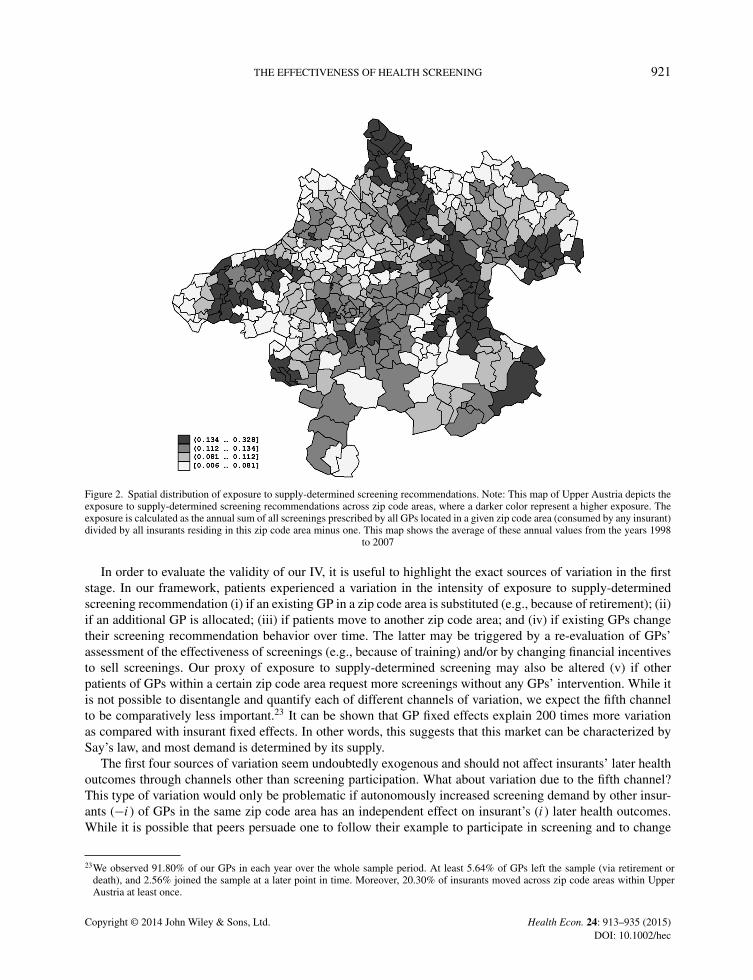
The spatial distribution of our IV averaged over annual values from 1998 to 2007 is depicted in Figure 2. Onecan see that the exposure to supply-determined screening recommendations varies quite substantially acrosszip code areas. GPs in different zip code areas and/or at different points in time vary in selling this service withrespect to both their assessment of the effectiveness of screening and their financial incentives.
4.3. IV estimation
Our suggested IV strategy translates into the following first-stage estimation:
si;t�r D � � S´.i/;t�r C ˇ � xit C �i C J.i;t/ C ıt C �it (2)
We will see in the succeeding text that this proxy for the intensity of exposure to supply-side-driven screen-ing S´.i/;t�r in the residential zip code area ´ is highly correlated with the individual screening participationand that the parameter � enters as a highly statistically significant determinant. The inclusion of GP fixedeffects �i allows for the direct influence of GPs on patients’ health outcomes that are potentially correlatedwith the extent of GPs advising screening. For instance, GPs who like to recommend screening may also tendto prescribe more (or more expensive) medical drugs.
20This would allow us to use the randomly assigned screening recommendation as an IV for actual screening participation. Given that areasonably large fraction of patients follow their GPs’ advice (i.e., there is a strong first stage), we could estimate the causal effect (inparticular, a local average treatment effect) of screening participation on subsequent health outcomes for those patients who comply withtheir GP’s recommendation.
21In fact, the spatial distribution of GPs possessing a contract with the Upper Austrian Sickness Fund is likely close to random. Becausesuch a contract is highly attractive, GPs queue for it, and have a strong financial incentive to accept available offers, even if this is fromoutside their initial place of residence.
22This resembles the typical situation in Austria, where insurants have a GP in their local neighborhood (about 72.7% of insurants have aGP within their zip code), whom they consult to obtain basic medical care or sick leave slips for their employer.
Copyright © 2014 John Wiley & Sons, Ltd. Health Econ. 24: 913–935 (2015)DOI: 10.1002/hec
THE EFFECTIVENESS OF HEALTH SCREENING 921
Figure 2. Spatial distribution of exposure to supply-determined screening recommendations. Note: This map of Upper Austria depicts theexposure to supply-determined screening recommendations across zip code areas, where a darker color represent a higher exposure. Theexposure is calculated as the annual sum of all screenings prescribed by all GPs located in a given zip code area (consumed by any insurant)divided by all insurants residing in this zip code area minus one. This map shows the average of these annual values from the years 1998
to 2007
In order to evaluate the validity of our IV, it is useful to highlight the exact sources of variation in the firststage. In our framework, patients experienced a variation in the intensity of exposure to supply-determinedscreening recommendation (i) if an existing GP in a zip code area is substituted (e.g., because of retirement); (ii)if an additional GP is allocated; (iii) if patients move to another zip code area; and (iv) if existing GPs changetheir screening recommendation behavior over time. The latter may be triggered by a re-evaluation of GPs’assessment of the effectiveness of screenings (e.g., because of training) and/or by changing financial incentivesto sell screenings. Our proxy of exposure to supply-determined screening may also be altered (v) if otherpatients of GPs within a certain zip code area request more screenings without any GPs’ intervention. While itis not possible to disentangle and quantify each of different channels of variation, we expect the fifth channelto be comparatively less important.23 It can be shown that GP fixed effects explain 200 times more variationas compared with insurant fixed effects. In other words, this suggests that this market can be characterized bySay’s law, and most demand is determined by its supply.
The first four sources of variation seem undoubtedly exogenous and should not affect insurants’ later healthoutcomes through channels other than screening participation. What about variation due to the fifth channel?This type of variation would only be problematic if autonomously increased screening demand by other insur-ants (�i) of GPs in the same zip code area has an independent effect on insurant’s (i) later health outcomes.While it is possible that peers persuade one to follow their example to participate in screening and to change
23We observed 91.80% of our GPs in each year over the whole sample period. At least 5.64% of GPs left the sample (via retirement ordeath), and 2.56% joined the sample at a later point in time. Moreover, 20.30% of insurants moved across zip code areas within UpperAustria at least once.
Copyright © 2014 John Wiley & Sons, Ltd. Health Econ. 24: 913–935 (2015)DOI: 10.1002/hec
922 F. HACKL ET AL.
others’ health behavior, we summarize in Section 6 results from a falsification test that provides suggestiveevidence against peer effects in the screening decision. We further show the robustness of our results to theinclusion of additional covariates measured at the zip code area level, such as different proxies for a generaltendency toward preventative care measures, as well as other health-demand related variables. Given the highrobustness of our results, we regard a correlation between our IV and the error term in the second stage ashighly unlikely.
Under the validity of our IV approach, we can then identify a local average treatment effect (LATE). Thismeans that we estimated the causal effect of screening participation on later health outcomes for insurants whoparticipated in health screenings because of their high exposure to supply-determined screening recommenda-tions. In other words, we can think of the compliers as those patients who had check-ups because of their GP’srecommendation and not because of their own request.
To evaluate whether this LATE is a parameter of interest, it is useful to consider two related questions. First,is the LATE parameter useful to policy makers? Second, how credible is the extrapolation from the LATE to dif-ferent average effects? If policy makers want to decide whether to abolish the screening program in its currentform entirely (i.e., at the extensive margin), they clearly would like to know the average treatment effect on thetreated (ATT). However, if policy makers instead consider an intervention that affects the screening incidenceat the intensive margin, then the LATE might be quite informative, as it applies to marginal screening partici-pants. In fact, if policy makers consider such an intervention—for instance, by creating more awareness of theimportance of screening or increasing the screening fee—our LATE is the accurate parameter for evaluating thispolicy. Whether the estimated LATE is similar to the ATT (or the average treatment effect) is harder to assess,as one would have to compare the compliers and the always-takers (Imbens, 2010). On the one hand, one mayspeculate that patients following a GP’s advice (i.e., our compliers) are not a very peculiar group. On the otherhand, one cannot rule out that the return rates for screenings are different for always-takers and compliers. Forinstance, it seems plausible to assume that always-takers are (compared with compliers) more health consciouspeople who pursue, in general, a healthier lifestyle. As a result, the return from screening participation mightbe higher for a complier. In this case, the LATE would be higher compared with the ATT/average treatmenteffect, and our critical assessment of the screening program in the conclusions would be quite conservative.
5. EMPIRICAL RESULTS
This section presents our estimation results. We begin by providing first-stage results. Subsequently, we discussthe estimated effects of screening participation on our main measures of health-care cost (outpatient expendi-tures including costs for medical attendance and medical drugs and incidence of hospitalization) and healthstatus (incidence of sick leave24 and mortality). It turns out to be useful to distinguish here between short-run,medium-run, and long-run effects of screening participation. Moreover, we present disaggregated estimationresults for medical attendance (where we distinguish between different medical specialists) and for differentcategories of medical drugs to provide further insights.
Table III summarizes the first-stage results for the different lags in our IV estimations. Given that the out-come days of sick leave apply only to employed insurants, we used two different samples, the full sampleand the sub-sample of insurants with employment spells. In both samples, we found a highly statisticallysignificant effect of our IV (i.e., the proxy for the exposure to supply-side screening recommendations) onthe likelihood of screening participation. The estimated coefficients of the instrument range between 0.51and 0.73 for the full sample and between 0.43 and 0.48 for the restricted sample. This means that anincrease in the instrument (screening rate per zip code area) by one standard deviation (0.057) increased an
24We included the number of sick leave days as a proxy for morbidity. The Austrian sick leave statistics have demonstrated that muscu-loskeletal disorder is the most important reason for job absence due to illness, followed by respiratory diseases (especially in the coldseason), and mental health problems such as depression and burn-out syndrome. The successful treatment of these and similar ailmentsof mild to moderate severity (e.g., migraines and gastroesophageal reflux) would definitely reduce the number of sick leave days.
Copyright © 2014 John Wiley & Sons, Ltd. Health Econ. 24: 913–935 (2015)DOI: 10.1002/hec

THE EFFECTIVENESS OF HEALTH SCREENING 923
Tabl
eII
I.Fi
rst-
stag
ere
sults
Lag
r0
12
34
56
78
Tota
lsam
ple
Coe
ffici
ento
fIV
0.51
0.59
0.63
0.67
0.71
0.69
0.68
0.68
0.73
Cra
gg-D
onal
dW
aldF
-sta
tistic
2620
.42
2707
.12
2340
.62
1936
.88
1523
.34
902.
454
4.76
263.
7491
.78
Num
ber
ofob
serv
atio
ns4,
758,
720
4,19
5,36
63,
661,
284
3,14
8,47
32,
651,
756
2,17
1,14
51,
704,
049
1,25
1,10
782
4,99
9N
umbe
rof
indi
vidu
als
586,
915
531,
339
519,
172
505,
611
489,
836
477,
398
463,
878
435,
740
422,
173
Ave
rage
no.o
fob
serv
atio
npe
rin
divi
dual
8.11
7.9
7.05
6.23
5.41
4.55
3.67
2.87
1.95
Sub-
sam
ple
ofin
sura
nts
wit
hem
ploy
men
tspe
lls
Coe
ffici
ento
fIV
0.43
0.48
0.51
0.52
0.54
0.53
0.52
0.52
0.48
Cra
gg-D
onal
dW
aldF
-sta
tistic
824.
8481
5.67
673.
9252
8.08
403.
6124
9.64
143.
5269
.06
17.1
4N
umbe
rof
obse
rvat
ions
2,09
3,14
41,
838,
268
1,59
4,08
71,
362,
607
1,14
0,44
792
8,46
672
5,20
853
1,01
334
6,36
2N
umbe
rof
indi
vidu
als
291,
833
278,
165
263,
682
250,
873
238,
248
226,
665
214,
237
200,
868
187,
002
Ave
rage
no.o
fob
serv
atio
npe
rin
divi
dual
7.17
6.61
6.05
5.43
4.79
4.1
3.39
2.64
1.85
The
depe
nden
tvar
iabl
eis
abi
nary
vari
able
equa
lto
one
ifth
ein
sura
ntpa
rtic
ipat
edin
the
gene
ralh
ealth
scre
enin
gin
the
quar
tert�r
.In
addi
tion
toth
ein
stru
men
talv
aria
ble
(IV
),ea
ches
timat
ion
cont
rols
also
for
the
insu
rant
’sag
eas
wel
las
insu
rant
s’an
dG
Ps’
fixed
effe
cts.
The
IVis
apr
oxy
for
the
expo
sure
tosu
pply
-sid
esc
reen
ing
reco
mm
enda
tions
and
isde
fined
asth
esu
mof
alls
cree
ning
spr
escr
ibed
byal
lGPs
loca
ted
ina
give
nzi
pco
dear
eaco
nsum
edby
any
insu
rant
,min
usth
epo
tent
ials
cree
ning
ofin
divi
duali,
divi
ded
byal
lins
uran
tsre
sidi
ngin
this
zip
code
area
min
uson
e.
Copyright © 2014 John Wiley & Sons, Ltd. Health Econ. 24: 913–935 (2015)DOI: 10.1002/hec

924 F. HACKL ET AL.
Table IV. Effect of screening participation (r years ago) on different health outcomes
Outpatient expenditures Medical attendance Medical drugs Days of hospitalization Days of sick leave
Lag r OLS IV OLS IV OLS IV OLS IV OLS IV
0 53.78��� 278.68��� 70.65��� 67.32��� �16.87��� 211.36��� �0.93��� 1.43�� 0.12�� �1.27(1.08) (63.71) (0.52) (22.01) (0.90) (56.98) (0.01) (0.69) (0.06) (2.58)
1 �2.39�� 195.39��� 1.10�� 41.31�� �20.75 154.08��� 0.07��� 1.47�� 0.75��� 0.69(1.20) (62.54) (0.56) (21.09) (25.60) (56.39) (0.02) (0.68) (0.06) (2.60)
2 2.46� 38.47 3.96��� �28.86 �1.51 67.32 0.09��� 1.06 0.23��� 1.88(1.31) (64.11) (0.61) (0.18) (1.12) (57.85) (0.02) (0.70) (0.07) (2.79)
3 �1.95 �144.56�� �0.14 �33.20 �1.81 �111.36� 0.09��� 1.06 0.18�� �0.31(1.52) (67.99) (0.70) (23.96) (1.30) (61.05) (0.02) (0.74) (0.08) (3.13)
4 �2.05 �292.84��� �2.01�� �78.14��� �0.04 �214.70��� 0.04� �1.10 �0.05 �3.77(1.72) (76.99) (0.78) (27.24) (1.48) (69.31) (0.02) (0.84) (0.09) (3.72)
5 2.35 �289.44��� 0.13 �114.90��� 2.22 �174.54� �0.01 0.15 �0.09 �1.91(2.01) (101.21) (0.92) (35.30) (1.72) (92.20) (0.03) (1.07) (0.10) (4.83)
6 1.56 �162.52 �1.24 �97.51�� 2.80 �65.01 �0.03 0.81 �0.15 5.50(2.57) (115.23) (1.14) (44.98) (2.24) (102.47) (0.03) (1.36) (0.13) (6.53)
7 �3.87 �207.96 �0.31 �93.16 �3.56 �114.80 �0.03 1.07 0.01 5.18(3.14) (136.52) (1.49) (62.36) (2.67) (117.01) (0.04) (1.83) (0.17) (8.92)
8 �2.80 �297.53 �0.37 �130.61 �2.43 �166.92 �0.02 0.17 0.18 �22.75(5.12) (219.48) (2.50) (105.62) (4.32) (188.79) (0.07) (2.97) (0.27) (16.98)
Mean 726.14 343.04 383.10 3.59 13.32
This table summarizes estimation results on the effect of screening participation (r years ago) on five different health outcomes on the basisof two methods of estimation: ordinary least squares (OLS) and two-stage least squares (IV). Each entry reflects a separate estimation.The outcome variables outpatient expenditures and the two sub-components expenditures for medical attendance and medical drugs aremeasured in 2007 Euros. The outcome variables hospitalization and sick leave are measured in days per year. In the IV estimations,screening participation is instrumented by a proxy for the exposure to supply-side screening recommendations that varies over zip codeareas and time (Figure 2). A summary of the first-stage results is provided in Table III. Standard errors are robust to clustering at theindividual level and to heteroskedasticity of unknown form. Each estimation controls also for insurant fixed effects, GP fixed effects, yearfixed effects, and the insurant’s age.�Indicates statistical significance at the 10% level.��Indicates statistical significance at the 5% level.���Indicates statistical significance at the 1% level.
insurant’s propensity to participate in a health screening by 2.85 percentage points if we assume a first-stagecoefficient of 0.5. The F -statistic on the excluded instrument is very high for each lag, indicating that we canreject the hypothesis of a weak instrument (Stock and Yogo, 2005).
The second-stage results of our IV estimations for our main outcome variables are summarized in Table IV,along with the respective OLS estimates for comparison. The coefficients give the estimated effect of screeningon the respective outcome variable r years after treatment. Conditional on individual patient and GP fixedeffects, the IV strategy exploits only variation in the screening participation, which is triggered by the IV. Theinclusion of GP fixed effects implies only variation from observations where patients change their GP matters.Each entry in Table IV represents a separate estimation for the respective lag, which uses a different mass ofexogenous variation (that is not confounded by patients’ screening history).25
The IV and the OLS estimates are, in many cases qualitatively and in most cases quantitatively, very differentfrom each other. This suggests that selection into screening is an important issue that must be taken into accountin an evaluation. In other words, the OLS estimates seem to be heavily biased and should not be interpretedcausally. The findings suggest that in particular, healthy or health-conscious people participate in screening.Healthy screeners cause a moderate increase in expenses for doctor visits, spend less on medical drugs, andspend fewer days in the hospital; moreover, the increasing number of sickness days may indicate that they donot go to work if they are sick.
25We also estimated a specification including the complete set of lagged screening participation simultaneously. However, because of theinclusion of eight lags, this specification can be applied only to a reduced sample of observations covering the years 2006 and 2007. Thissample accounts only for 16% of the initial estimation sample. Therefore, it is not surprising that we do not obtain a sufficiently strongfirst stage for this substantially reduced sample.
Copyright © 2014 John Wiley & Sons, Ltd. Health Econ. 24: 913–935 (2015)DOI: 10.1002/hec

THE EFFECTIVENESS OF HEALTH SCREENING 925
Short-run effects: On the basis of the IV estimation, we found a highly statistically significant increasein short-term outpatient expenditures up to 2 years after the screening participation: plus 279 Euros in theyear of treatment and plus 195 Euros in the year thereafter. This is equivalent to an increase of 38% and27%, respectively. The sharp increase in outpatient expenditures is predominantly due to a rise in expenses formedical drugs, and to a smaller extent due to cost increases of medical attendance. Expenses for medical drugsrose by 211 and 154 Euros, while expenses for medical attendance increased only by 67 and 41 Euros.26 Inthe short run, screening participation also substantially increased the incidence of hospitalization. We found anincrease of one and a half days in the hospital (or about plus 40%) in the year of the treatment and in the yearthereafter. At the same time, we did not find any statistically significant impact of screening participation onthe incidence of sick leave.
These results suggest that screening leads to further inpatient and outpatient medical treatments followingthe screening exam. The more disaggregated results (summarized in Tables V and VI) help to explain themechanism behind this short-run health-care cost increase. The estimation results for particular groups of med-ical drugs in Table V show that drug expenditures for the cardiovascular system and for the nervous systemincreased significantly in the short run. On average, drug expenditures for antidepressants and other drugs forthe nervous system doubled in the first three periods after screening participation. The increase of expenses formedication for the cardiovascular system meets expectations given the fact that one of the primary purposesof the Austrian screening program is the detection and prevention of cardiovascular diseases. It is important tonote, however, that the cost-increasing effect on cardiovascular drugs is mainly driven by medication treatinghigh cholesterol. If we exclude these medical drugs from the superordinate cardiovascular group, the previoussignificantly positive effect vanishes. We presume that the GPs prescribe anti-cholesterol drugs if the bloodtests reveal cholesterol values beyond pre-determined thresholds. The rise of medications for neural and mentaldiseases is surprising, however, because these illnesses are not even mentioned in the objectives of the screen-ing program. This result provides support for the conclusion that patients mention their mental unease in thecourse of a comprehensive anamnesis and, as a subsequent consequence, the GPs prescribe antipsychotics ona large scale. Further cost-increasing effects of screening participation can be found for genito-urinary andmusculo-skeletal drugs and for drugs that cannot be attributed to ATC codes (‘Missing’). The disaggregatedfindings for medical attendance in Table VI show a strong short-term increase in expenditures for diagnos-tic medical services. Both the expenditures for medical attendance by radiologists and for laboratory servicesincrease substantially up to 4 years after treatment. There is every reason to believe that GPs, who carry out thegeneral health screening, subsequently refer patients to specialists for further and/or more detailed diagnosticservices. Notably, the positive effect on medical attendance cost (in particular, for radiologists and laboratoryservices) is highest in the year of the screening, and decreases thereafter.
The decomposition also reveals a decrease of expenditures for urologists, gynecologists, and dermatologistsin the short run. Because the visits at these medical specialists often have a preventive character (e.g.,screening for prostate, breast, or skin cancer), these consultations can be expected to represent substitutesto the general screening program conducted by the GPs. The negative impacts of screening participation onthese expenses are not in contradiction to this argument in the least. There is another striking and surprisingresult. The continuous and quantitatively highly relevant decrease of expenditures for physiotherapy over theperiod 0 to 5 years after screening is remarkable because these medical services typically have a rehabilitationcharacter without a direct connection to screening. We presume some kind of substitutional relationshipbetween screening and physiotherapy; however, we lack a convincing medical explanation for this result. Whilethe expenses for the residual category ‘other services’ decreased in the short run, we found an increase in costsfor pulmonologist visits.
Medium-run effects: In the medium run, outpatient expenditures decreased because of screening participa-tion (Table IV). The decline in outpatient expenditures 3, 4, and 5 years after treatment was 145, 293, and 289Euros, respectively. This is equivalent to a decrease of 20% and 40%, respectively. As in the short run, the
26Direct costs for the screening programs of the examining GP are not included in our measures for outpatient expenditures.
Copyright © 2014 John Wiley & Sons, Ltd. Health Econ. 24: 913–935 (2015)DOI: 10.1002/hec
926 F. HACKL ET AL.
Table V. Effect of screening participation (r years ago) on expenditures for medical drugs by category
Cardio Cancer Nervous Metabolism Blood Dermatological Genito-urinaryLag (ATC C) (ATC L) (ATC N) (ATC A) (ATC B) (ATC D) (ATC G)
0 32.57�� �22.78 76.33��� 8.16 �0.20 1.38 18.46���
(13.73) (31.50) (18.17) (7.98) (15.25) (1.35) (3.09)1 26.96� �6.34 66.96��� 9.27 �7.16 �0.08 12.13���
(14.97) (30.91) (16.93) (7.41) (16.42) (1.28) (2.90)2 24.045 3.49 55.12��� 9.27 �28.36 �1.66 3.94
(16.91) (32.90) (16.63) (7.46) (17.35) (1.32) (3.01)3 4.214 �17.83 27.03 �11.83 �39.64� �3.89��� 14.14
(17.93) (35.48) (16.68) (7.80) (21.81) (1.40) (16.09)4 �11.489 �50.07 33.94 �26.60��� �35.73 �3.47�� �10.74���
(18.71) (41.57) (21.64) (8.55) (23.84) (1.52) (3.36)5 �36.07� �12.49 27.13 �32.41��� �39.21 �1.17 �12.18���
(20.11) (56.31) (35.27) (10.15) (35.31) (1.87) (3.99)6 �24.371 �35.65 46.95 �27.19�� �7.75 3.01 �6.69
(22.90) (60.20) (49.46) (10.94) (30.68) (2.52) (4.35)7 �46.064 �49.08 2.11 �18.38 �15.41 �0.45 0.31
(30.14) (78.85) (28.49) (13.51) (31.21) (2.68) (5.09)8 �71.82* 32.71 �7.27 �20.54 �9.19 5.27 �8.20
(42.14) (131.46) (39.01) (19.87) (44.53) (3.28) (7.48)
Mean 90.58 40.41 64.90 51.46 17.26 3.32 10.61
Hormonal Anti-infectives Musculo-skeletal Antiparasitic Respiratory Sensory Various Missinga
Lag (ATC H) (ATC J) (ATC M) (ATC P) (ATC R) (ATC S) (ATC V)
0 18.73 10.22 35.86��� 0.21 11.415� �2.93 1.62 117.08���
(13.17) (16.02) (5.92) (0.40) (0.05) (1.83) (1.76) (35.21)1 18.84 6.80 21.99��� 0.14 2.59 �2.60 1.01 57.23
(14.64) (14.42) (5.52) (0.35) (0.65) (1.66) (1.86) (34.98)2 15.11 12.22 �1.83 0.09 �6.54 �1.73 1.75 �24.59
(18.13) (13.36) (5.92) (0.18) (0.25) (1.65) (1.88) (34.64)3 10.16 0.21 �30.62 �0.27 �11.833�� �2.27 2.61 �112.94���
(18.15) (14.11) (6.52) (0.30) (0.04) (1.77) (3.11) (36.67)4 5.05 �26.37 �36.88 �0.52 �6.16 �1.78 0.51 �160.48���
(14.90) (17.81) (7.01) (0.43) (0.36) (1.89) (3.38) (39.54)5 �3.50 �35.36� �28.51��� �0.27 8.14 �1.19 6.21 �118.94���
(9.91) (21.18) (8.10) (0.44) (0.28) (2.21) (7.58) (52.01)6 �7.46 19.01 �24.70��� 1.38�� 7.24 �1.57 �1.46 �24.75
(11.42) (24.42) (9.35) (0.58) (0.41) (2.43) (2.77) (51.99)7 �2.85 �2.41 �4.74 0.58 7.44 3.29 �5.20 �3.39
(13.87) (29.57) (11.34) (0.55) (0.48) (2.79) (3.80) (59.31)8 �12.71 �89.48� �22.30 0.83 11.66 �0.23 �1.60 �100.00
(19.13) (54.05) (14.81) (0.91) (0.39) (3.57) (8.54) (94.69)
Mean 5.72 16.33 21.57 0.12 16.69 3.69 0.38 135.74
This table summarizes estimation results on the effect of screening participation (r years ago) on expenditures for medical drugs of selectedcategories (measured in 2007 Euros) on the basisof two-stage least squares (IV) estimation. Each entry reflects a separate estimation. Inthe IV estimations, screening participation is instrumented by a proxy for the exposure to supply-side screening recommendations thatvaries over zip code areas and time (Figure 2). A summary of the first-stage results is provided in Table III. Standard errors are robust toclustering at the individual level and to heteroskedasticity of unknown form. Each estimation controls also for insurant fixed effects, GPfixed effects, year fixed effects, and the insurant’s age.ATC, Anatomical Therapeutic Chemical Classification System.aFor drugs in the ‘missing’ category, ATC codes are not available.�Indicates statistical significance at the 10% level.��Indicates statistical significance at the 5% level.���Indicates statistical significance at the 1% level.
effect of screening on outpatient expenditures can be predominantly attributed to an effect via the consumptionof medical drugs and, to a smaller extent, due to changing medical attendance. We did not find any statisticallysignificant effect on incidence of hospitalization.
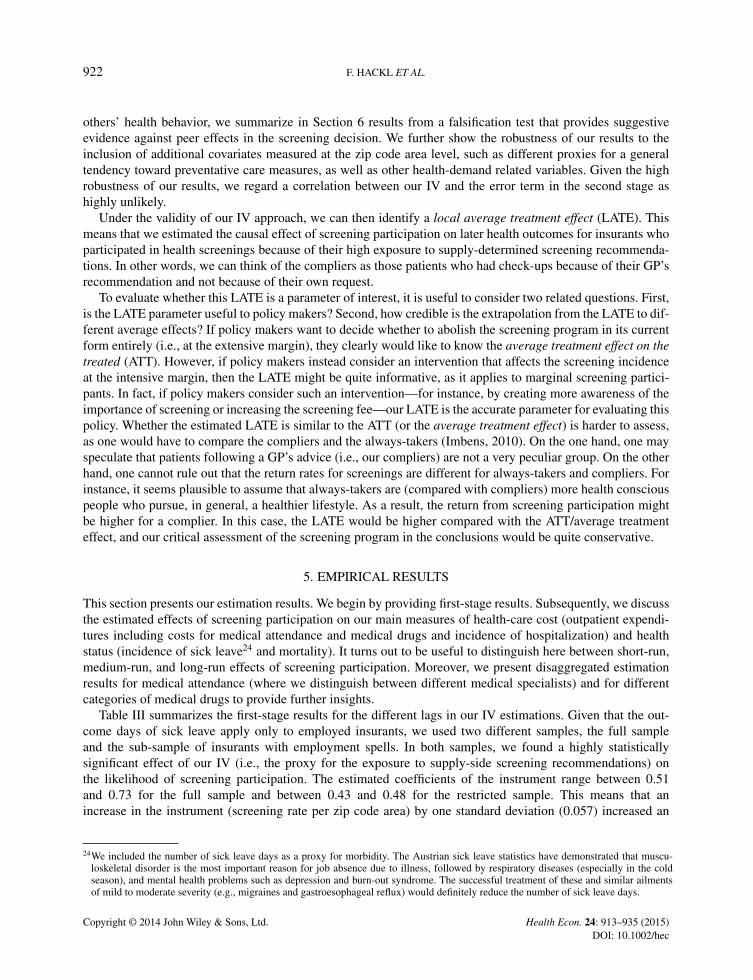
The medium-run decrease in expenditures for medical drugs can be partly explained by the group ofpharmaceuticals for the alimentary tract and metabolism (Table V). There is weaker evidence for a reducedconsumption of medical drugs targeting the cardiovascular system. The decomposition of drug expenditures
Copyright © 2014 John Wiley & Sons, Ltd. Health Econ. 24: 913–935 (2015)DOI: 10.1002/hec
THE EFFECTIVENESS OF HEALTH SCREENING 927
Table VI. Effect of screening participation (r years ago) on expenditures for medical attendance by field
Lag GP Radiologist Laboratory Internist Urologist Gynecologist Dermatologist
0 1.03 61.51��� 21.68��� 0.50 �4.61��� �12.32��� �0.439(8.72) (2.97) (1.56) (3.00) (1.04) (2.43) (1.65)
1 �3.89 57.18��� 22.80��� 0.31 �5.40��� �11.66��� �4.36���
(8.36) (3.00) (1.54) (2.83) (0.97) (2.27) (1.60)2 �4.70 35.12��� 18.88��� �5.92�� �5.06��� �10.30��� �7.73���
(8.31) (3.30) (1.57) (3.00) (0.97) (2.31) (1.70)3 �20.38�� 31.90��� 14.26��� �4.70 �2.92��� �7.63 �7.89���
(8.53) (3.69) (1.64) (3.14) (1.03) (2.41) (1.73)4 �43.63��� 8.03� 4.17�� �8.15�� 0.12 �4.15 �5.37���
(9.29) (4.34) (1.83) (3.53) (1.17) (2.58) (2.01)5 �19.00� �12.42�� �8.97��� �11.80� 2.42 �2.64 �2.718
(11.37) (5.54) (2.47) (4.58) (1.54) (3.50) (2.61)6 �33.84�� 26.15��� �2.87 �10.30� �1.46 2.85 �1.159
(13.86) (7.75) (3.16) (5.82) (1.87) (4.13) (3.26)7 �11.06 15.23 0.27 11.71 �4.04� 8.07 12.77���
(17.19) (11.30) (4.39) (8.28) (2.41) (5.72) (4.33)8 �3.25 30.97 �4.87 �4.08 1.38 1.02 3.220
(26.46) (19.56) (6.99) (13.37) (3.88) (9.59) (6.63)
Mean 122.93 26.09 11.54 16.18 4.14 19.54 6.75
Lag Pulmonologist Neurologist ENT Orthopedist Oculist Physiotheraphy Other
0 7.92��� 5.68�� �0.15 4.32 �1.89 �20.78��� �16.93(1.44) (2.90) (1.39) (3.05) (1.50) (5.20) (18.32)
1 4.98��� 5.27� 0.64 3.43 �2.03 �24.82��� �35.34��
(1.41) (2.79) (1.36) (3.06) (1.45) (5.36) (17.64)2 2.31 1.022 �3.10�� �1.16 2.70� �19.28��� �72.62���
(1.48) (2.82) (1.43) (3.22) (1.52) (5.67) (18.15)3 1.29 0.291 0.89 3.55 3.22� �27.61��� �54.49���
(1.58) (3.15) (1.49) (3.42) (1.66) (6.10) (20.46)4 �0.99 �3.755 1.93 3.94 �0.09 �29.55��� �38.63�
(1.76) (3.54) (1.68) (3.52) (1.87) (6.92) (23.46)5 1.50 �13.78��� 5.88��� 2.68 �2.51 �14.34� �62.61��
(2.31) (4.71) (2.15) (4.81) (2.42) (8.62) (30.82)6 0.18 �8.282 2.31 2.17 �3.75 �10.64 �76.72�
(2.94) (6.44) (2.79) (5.95) (3.09) (10.48) (39.30)7 0.72 �17.36� 10.78��� �2.23 �7.47� �16.25 �109.53��
(3.97) (8.94) (3.84) (8.02) (4.50) (13.07) (55.14)8 12.50� 9.201 �2.60 �18.14 �27.10��� �16.15 �149.05
(6.46) (14.42) (6.41) (12.68) (7.11) (19.78) (94.89)
Mean 5.19 6.19 5.96 10.04 14.54 8.10 166.33
This table summarizes estimation results on the effect of screening participation (r years ago) on expenditures for medicalattendance of selected specialists (measured in 2007 Euros) on the basis of two-stage least squares (IV) estimation. Each entry reflects aseparate estimation. In the IV estimations, screening participation is instrumented by a proxy for the exposure to supply-side screeningrecommendations that varies over zip code areas and time (Figure 2). A summary of the first-stage results is provided in Table III. Standarderrors are robust to clustering at the individual level and to heteroskedasticity of unknown form. Each estimation controls also for insurantfixed effects, GP fixed effects, year fixed effects, and the insurant’s age.�Indicates statistical significance at the 10% level.��Indicates statistical significance at the 5% level.���Indicates statistical significance at the 1% level.
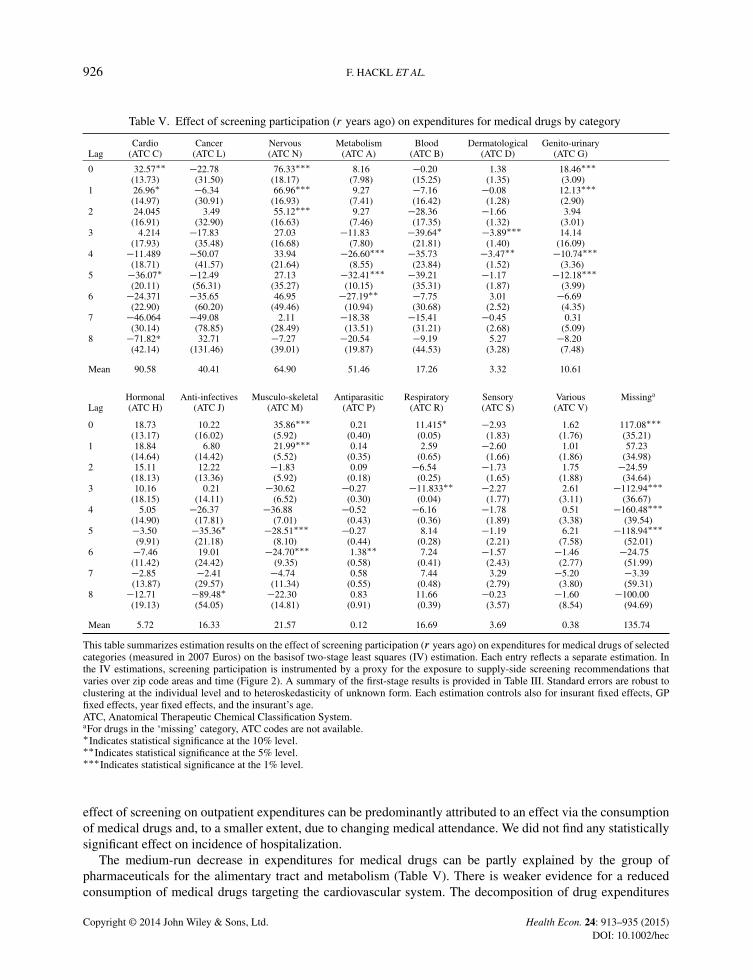
further shows that the expenses for pharmaceuticals for blood and blood-forming organs, for the genito-urinarysystem including sex hormones, for the musculo-skeletal system, for the respiratory system, dermatologicals,and anti-infectives, and for the residual category are reduced in response to screening participation in the timespan of 3 to 6 years after treatment.
The medium-run cost-decreasing effects for medical attendance are mainly driven by visits at GPs andinternists (Table VI). Depending on the year, we found cost reductions between 17% and 35% for GPs and
Copyright © 2014 John Wiley & Sons, Ltd. Health Econ. 24: 913–935 (2015)DOI: 10.1002/hec

928 F. HACKL ET AL.
between 50% and 73% for internists. Comparable cost can be observed for visits at all other specialists (seecategory ‘other’), with a decline of expenditures in an order of magnitude between 23% and 66% 2 to 7 yearsafter treatment. Only the special medical fields radiology and laboratory diagnostics showed increasing serviceutilization even in the medium run; however, the quantitative effects were much smaller as compared in theshort run. This result might be an indication of regular checkups after a medical problem has been found in thescreening examination.27
Long-term effects: In the long run (i.e., 6 years or more after treatment), we did not find any statisticallysignificant effects of screening on outpatient expenditures or on the incidence of hospitalization (Table IV).However, the point estimates for outpatient expenditures were quite big in absolute terms. For the disaggregatedexpenditure components (summarized in Tables V and VI), we saw sporadic statistically significant negativecoefficients. Here, one has to keep in mind that we had far less observations available to estimate these long-run coefficients. This increases the standard errors substantially, which may increase the likelihood of a typeII error. In sum, however, we interpret the estimation results as evidence for a fading out of the effect ofscreening over time. This interpretation is also substantiated by the results of our last outcome of consideration,namely, mortality.
Heterogenous effects for sub-populations: In order to explore whether screening participation has differenteffects across sub-populations, we re-ran our analysis for important sub-samples along the dimensions, sex,age, and employment. In each case, we had a strong first stage and very comparable patterns in the secondstage. That means, for each sub-population, we observed an increase in short-run cost, a decrease in medium-run cost, no significant effects on long-run cost, and no impact on the incidence of sick leave. However, the sizeof the estimated coefficients (and also their statistical significance) varied across sub-populations. The mostimportant distinction to make is between the effects for younger versus older insurants. Table VII summarizesthese results where we distinguished between younger insurants (born 1943 or later) and older insurants (bornbefore 1943). For younger insurants, the increase in short-run cost was less pronounced; in particular, we didnot find a significant increase in the incidence of hospitalization. It seems that younger patients had less (orless complicated) follow-up medical treatments after a general health screening. However, the cost savings inthe medium were are also less pronounced for the younger cohorts.
Mortality: The primary objective of screening is to maintain or improve insurants’ health. Therefore, welooked at the ultimate health outcome given by mortality. Because humans die at a certain point in time, wecould not use a panel estimation with insurant fixed effects and had to adapt our estimation strategy accordingly.The dependent variable in this analysis now becomes a binary indicator for whether the insurant was still alive inthe year 2009.28 Given that mortality crucially depends on age, we ran separate regressions for three birth cohortgroups (born before 1933, between 1934 and 1943, and between 1944 and 1953). Following Angrist (2001), weestimated a linear probability model of mortality for each birth cohort group in which we used all insurants whowere permanently insured between 1998 and 2003. As the variable of primary interest, we included the numberof screenings carried out in this time span, which varied between zero and six. As before, we used our proxyfor the exposure to supply-side screening recommendations to instrument for actual screening participation.In contrast to the panel data framework earlier, we used the average exposure over a treatment period definedas 1998 to 2003. The F -statistics on the excluded instrument (from the first stage) support again the strengthof our instrument, as can be seen in the lower panel of Table VIII. As further control variables, we includedinformation on the insurant’s age, sex, nationality, education, GP in the year 1998, and the exemption of theprescription charge, which served as a proxy for income.
27In addition, we split the sample into an older cohort (birth year 1942 and later) and a younger cohort (birth year 1943 and earlier). Forthe older cohort, we observed higher short-run expenditures and higher medium-run savings. Qualitatively, however, we did not find asystematic difference between these two subsamples. A similar procedure was applied for a split sample of women and men. In this case,we observed stronger effects for men.
28The year 2009 is the latest year for which mortality data are available.
Copyright © 2014 John Wiley & Sons, Ltd. Health Econ. 24: 913–935 (2015)DOI: 10.1002/hec

THE EFFECTIVENESS OF HEALTH SCREENING 929
Table VII. Effect of screening participation (r years ago) on different health outcomes (younger and older subsamples)
Outpatient expenditures Medical attendance Medical drugs Days of hospitalization Days of sick leave
Younger Older Younger Older Younger Older Younger Older Younger
0 137.51 446.58��� 37.60 105.10��� 99.90 341.48��� 1.25 1.89 �1.33(86.39) (94.39) (27.32) (36.73) (79.07) (81.05) (0.81) (1.23) (2.61)
1 82.92 321.90��� 8.04 82.77�� 74.88 239.12��� 0.91 2.34�� 0.89(87.24) (88.73) (27.17) (33.29) (80.14) (77.47) (0.83) (1.14) (2.63)
2 16.18 63.97 �57.78�� 19.00 73.96 44.97 0.46 1.82 2.04(89.10) (90.89) (28.77) (32.82) (81.36) (80.46) (0.85) (1.16) (2.82)
3 �75.71 �220.90�� �52.63 �1.76 �23.08 �219.13��� 0.39 1.98 �0.2(95.37) (95.12) (32.88) (34.86) (86.29) (84.25) (0.91) (1.21) (3.17)
4 �270.83�� �318.43��� �74.03�� �84.15�� �196.79�� �234.27�� �0.76 �1.48 �3.83(107.65) (107.15) (37.58) (39.34) (97.17) (95.68) (1.02) (1.39) (3.75)
5 �170.06 �406.90��� �78.26 �158.45��� �91.80 �248.45� 1.31 �1.37 �2.08(141.53) (141.09) (50.60) (47.79) (128.99) (128.28) (1.36) (1.68) (4.88)
6 �73.98 �230.60 �83.85 �106.75� 9.87 �123.84 1.34 �0.03 5.42(152.60) (174.36) (64.37) (61.26) (133.44) (157.95) (1.77) (2.10) (6.59)
7 �223.65 �165.79 �49.62 �153.25� �174.03 �12.53 0.51 1.89 4.77(186.90) (195.97) (85.86) (88.40) (162.09) (165.03) (2.24) (3.02) (8.98)
8 �261.07 �320.60 �183.50 �72.94 �77.57 �247.66 �3.72 4.87 �22.27(332.63) (275.15) (153.71) (143.75) (289.47) (230.42) (3.84) (4.68) (17.12)
464.80 901.79 254.45 367.35 210.34 534.44 1.98 5.50 13.82
This table summarizes estimation results on the effect of screening participation (r years ago) on five different health outcomes on thebasis of two-stage least squares (IV) estimation. Each entry reflects a separate estimation. The outcome variables outpatient expendituresand the two sub-components expenditures for medical attendance and medical drugs are measured in 2007 Euros. The outcome variables,hospitalization, and sick leave are measured in days per year. In the IV estimations, screening participation is instrumented by a proxy forthe exposure to supply-side screening recommendations that varies over zip code areas and time (Figure 2). A summary of the first-stageresults is provided in Table III. Standard errors are robust to clustering at the individual level and to heteroskedasticity of unknown form.Each estimation controls also for insurant fixed effects, GP fixed effects, year fixed effects, and the insurant’s age. Note that incidence ofsick leave is not available for the older sub-sample.�Indicates statistical significance at the 10% level.��Indicates statistical significance at the 5% level.���Indicates statistical significance at the 1% level.
Table VIII. Mortality estimation
Birth cohorts
1944–1953 1934–1943 1933 or before
OLS IV OLS IV OLS IV
Coefficient of screening 0.01��� �0.03 0.02��� �0.02 0.04��� �0.07(0.00) (0.03) (0.00) (0.04) (0.00) (0.12)
First-stage regression
Coefficient of instrument 1.05��� 1.01��� 1.12���
Cragg-Donald Wald F -statistic 44.36 26.32 34.46Observations 99,008 99,008 85,723 85,723 92,745 92,745
Estimation method: linear probability model. Data structure: cross section. Standard errors are robust but not clustered. Other controls:doctor, age, and zip code area dummies; dummies for foreign nationality, academic degree, sex, and exemption of prescription charge.��� Indicates statistical significance at the 1% level.
The upper panel of Table VIII summarizes the estimation results of the second stage and reportscorresponding OLS estimates for comparison. Interestingly, the OLS estimates suggest a life-prolonging effectof screening. Depending on the birth cohort group, an additional screening participation is associated withan increased likelihood of being alive in 2009 between one and four percentage points. In contrast, the IVestimates do not show any statistically significant effect of screening on mortality. These results suggest
Copyright © 2014 John Wiley & Sons, Ltd. Health Econ. 24: 913–935 (2015)DOI: 10.1002/hec

930 F. HACKL ET AL.
that healthy insurants self-select themselves into treatment, while screening itself exerts no significant effecton mortality. 29
Interpretation of results: We found a clear increase in short-run health-care costs (inpatient and outpatient)that is followed by medium-run decreases in the outpatient sector. In the long run, we did not find any statis-tically significant cost effects. In order to evaluate the overall cost-effectiveness of the screening program, wehad to add all the point estimates for the lags 0 to 8 (as presented in Table IV). This gives an aggregate effectof about 957 Euros for outpatient health-care costs and of about 6 days in inpatient care. For the screening par-ticipation to be cost-neutral, a day in the hospital must cost less than 132 Euros. While we cannot monetizethe cost of a hospital day caused by screening, we know that a day in the hospital costs on average between700 and 800 Euros. This means that according to our estimates, screening participation clearly increases healthcosts. The same qualitative result arises if we consider only statistically significant point estimates; in this case,the threshold for cost-neutrality is even lower (hospital cost per day of 61 Euros). In any case, it is comfortingto know that it has no impact on the overall evaluation of the cost-effectiveness of screening whether we con-sider the face value of insignificant coefficients, or we assume them to be zero. In addition to the cost increase,we do not find any statistically significant effects on our health indicators (the number of sick leave days andmortality). The only sub-population, for which the cost savings in the medium run could overcompensate theincrease in short-run costs, is the one of younger insurants. Here, the threshold for cost-neutrality is 452 Eurosof hospital costs per day, if we consider all coefficients.30 Several explanations exist for our empirical pattern:
(i) Doctors’ strong risk aversion may lead to substantial overtreatment (especially of older patients). Thiscould explain the short-run increase in expenditures without improvement of patients’ health. However,this reason cannot explain the decreasing mid-term effects on expenditures.
(ii) Alternatively, the immediate increase in outpatient health expenditures may be supply induced or at leastsupply determined. Health screening offers doctors the opportunity to further increase the amount of care.If we assume that more detailed diagnostic services do not harm generally healthy patients, the observedincrease of this cost category may reflect a good possibility for resident doctors to raise their income.Furthermore, GPs prescribe additional drugs, in particular for the treatment of high cholesterol, mentalillness, and medications for the genito-urinary and musculo-skeletal systems. Whether the lion’s shareof this increase is medically justified, or if many of these prescriptions are supply determined, cannotbe clearly answered by our data. Whereas the supply-determined argument can at least partly explainour empirical pattern, there are also counter arguments. According to column 1 in Table VI, GPs do notincrease their own income by screening-induced medical treatment in the immediate and the subsequentyear. Generally, we do not observe a remarkable increase of short-run therapeutic services by medicalspecialists (‘other’) in the year of screening. Moreover, supply-side effects alone cannot explain thedecrease of mid-term expenditures either.
(iii) Patients’ behavior may explain the screening-driven patterns in health expenditures. Suppose a personhas joined the screening program in the recent past and no medical troubles have been found. After thescreening, the patient is confronted with health problems that are not necessarily serious. Given thatthe good health of the same person has been attested through screening in the recent past, the patientmay forego medical consultation in this case. Consequently, individuals’ expenditures for drugs andmedical attendance may decrease in a certain period after screening. We call this phenomenon the ‘reas-surance effect’ of screening participation. The relevance of this effect may be indicated by our resultthat the services of GPs and internists decrease significantly in the medium run. These two categories of
29Given that 42%, 24%, and 10.5% of individuals in our sample are older than 54, 64, and 74 years, respectively, the 10-year mortality (fromcardiovascular disease) is indeed relevant. However, we concede that mortality benefits do not necessarily materialize within 10 years ofscreening.
30Because we did not find any significant coefficient for hospital days for this sub-population (Table VII), we cannot compute a cost-neutrality threshold of hospital costs. However, screening participation would reduce outpatient expenditures by 195 Euros for youngerinsurants.
Copyright © 2014 John Wiley & Sons, Ltd. Health Econ. 24: 913–935 (2015)DOI: 10.1002/hec
THE EFFECTIVENESS OF HEALTH SCREENING 931
resident doctors are typically the first place of contact for health problems in the Austrian health system.A reduction of precisely these ‘gatekeeping’ services suggests that the confirmation of good health inrecent health checks may reduce a patient’s frequency of doctor visits in the near future.
(iv) The pattern of short-term increases and medium-term decreases in health expenditures may also displaythe intended screening effects. Even if one has to accept an increase in short-term cost (i.e., diseases aredetected and treated at an early stage), the expenses in the medium run would decrease if more expensivetreatments at a later stage of a disease can be prevented. Similarly, a change in lifestyle induced by thescreening examination could explain our empirical results. A sustainable change in lifestyle accompaniedby preventive health investments such as smoking cessation, less alcohol consumption, a more healthydiet, and more intensive sports activities would improve health and, consequently, can be expected todecrease health expenditures. In either case, we would expect improvements in the health status of treatedindividuals. If we interpret the number of sick leave days (a proxy for morbidity), mortality, and hospital-ization as acceptable indicators for individual health, the hypothesis that significant health improvementsare due to screening participation cannot be supported in the empirical analysis. The short-run impact ofscreening on hospitalization is even positive, and the effect on absenteeism remains insignificant for allperiods. Hence, we do not observe the expected changes in health-status variables.31
Therefore, the screening program may be successful insofar as it triggers minor health improvements ofpatients that we cannot measure by our health status variables.
6. ROBUSTNESS ANALYSIS
The plausibility of our IV can be questioned on the basis of two related grounds. (i) The positive correlationbetween the individual propensity to participate in health screening and the average screening rate in a givenzip code area might be the result of peer effects and not be driven by the supply side as our identificationstrategy presumes. If this is true, and if equivalent peer effects are also present in our second stage relationships,then the identifying assumption of our IV strategy is not fulfilled. (ii) Sorting of insurants into certain zip codeareas might invalidate our IV strategy if this is correlated with unobserved confounding factors. In particular,one might question whether a general health awareness or tendency toward preventive health-care activities atthe zip code area level explains the utilization of screening examinations and whether this also matters in oursecond stage relationships.
Peer effects: Even if there is no direct test for the existence of peer effects in the screening decision, weoffer a falsification test providing suggestive evidence against peer effects. This test uses the following logic:The existence of peer effects would imply that the correlation in screening behavior is higher among membersof a peer group (intraclass correlation) compared with the correlation between members and non-members.Consequently, average screening rates should vary considerably across different peer groups. In contrast, theproposition put forward by our IV strategy would predict similar average screening rates across different peergroups within a zip code area, as they are all exposed to the same supply side. Put differently, this would implya high correlation between screening rates of different peer groups within a zip code area.
To implement this test, we define potential peer groups (i.e., individuals who are likely to meet and mutu-ally influence each other’s beliefs and behavior) along the dimensions religion (Catholic versus non-Catholic),ethnicity (Austrian versus non-Austrian citizens), educational attainment (academic degree versus no aca-demic degree), income (first quartile versus third quartile), industry of employer (production worker versusnon-production worker), and wage earners versus self-employed. We assume here that people with the samereligious denominations and ethnicity, with similar educational attainment, within the same income range, or
31Obviously, our health status variables are crude; the 10-year mortality indicator may not reflect all mortality benefits of screening, andthe number of sick leave days does eventually not cover the whole range of morbidity. The latter is in particular true for unemployed andretired people.
Copyright © 2014 John Wiley & Sons, Ltd. Health Econ. 24: 913–935 (2015)DOI: 10.1002/hec

932 F. HACKL ET AL.
those employed in the same industry are more likely to meet and mutually influence each other’s beliefs andbehavior regarding screening, compared with people from different groups defined by these criteria.32 It turnsout that the correlation coefficients between the average screening rates of the different peer groups are highlysignificant and lie in a range between 0.73 (religion) and 0.93 (ethnicity). That means, we find no empiri-cal support for peer effects and interpret the results of this falsification test as evidence for the importance ofsupply-side screening recommendations. The empirical test supports the validity of our IV strategy.
Potential sorting and other confounders: As a further falsification test, we check the sensitivity of our resultsto the inclusion of a list of additional covariates measured at the zip code area level. In the first step, wetest whether our results are confounded by insurants’ general health awareness or tendency toward preventivehealth-care activities on a local level. For this purpose, we use the average participation rates in commonpreventative health checkups (other than screening) as proxy variables for general health consciousness acrosszip code areas. In particular, we measure the regional density for participation in digital mammography, pre-natal and post-natal mother–child health-care examinations, and dermatological preventive care examinations(especially for birthmarks). If inclusion of participation rates of these preventive measures in the regressionschanges our screening coefficients substantially, we have evidence that our results are confounded by a generalattitude toward preventive health-care measures on a regional level. On the other hand, stable coefficients wouldsupport the plausibility of our IV strategy.
It turns out that our estimation results are very robust to the inclusion of these additional covariates. Whilesome of the point estimates of the screening coefficient change slightly in the extended specifications, we havea large overlap between the 95% confidence intervals from the estimated coefficients of the original modeland the extended model. This indicates that our IV estimation presented earlier is not confounded by a generaltendency toward preventive health-care activities (or specific health awareness) on a local level.33 Hence, ourtesting strategy failed to invalidate the plausibility of our IV strategy.
In the final step, we also ran a specification where we controlled for several insurant characteristics (shareof female, share of foreign insurants, share of 65 years and older, labor market status distribution) and GPcharacteristics (share of female, average age, university), also measured at the zip code area level. Again,we did not observe considerable changes in the estimated screening coefficients (compared with the baselinespecification) if we concurrently controlled for these potential health-related confounders. Detailed estimationoutput for all robustness checks is found in the Web Appendix available on the corresponding author’s website(http://www.econ.jku.at/papers/2012/wp1201_web-appendix.pdf).
7. CONCLUSIONS
On the basis of comprehensive administrative data that included the history of patients’ health serviceutilization recorded by a mandatory regional sickness fund over a 10-year period, we estimated the effects ofa general health-screening program in Austria on individuals’ subsequent health-care costs and several healthindicators. The broad variety of outcome variables (expenses for medical attendance and drugs, hospitalization,sick leave, and mortality) allowed a comprehensive evaluation. The empirical identification is based on a panelIV estimation that exploited exogenous variation in local exposure to supply-side screening recommendations.While it is in the nature of the IV method that we cannot test the validity of the identifying assumption, we pre-sented a series of falsification tests that provide supportive evidence against the importance of several potentialconfounding factors, such as peer effects or regional variation in general health awareness.
We found that screening participation of an average insurant substantially increased health-care costs up to2 years after treatment. Inpatient and outpatient medical care increased temporarily up to 40%. This short-run
32This seems a plausible assumption—it is, for instance, well documented that there is strong positive assortative mating along thesedimensions in Austria (see, for instance, Frimmel et al., 2013).
33Our results are even robust to the inclusion of the average number of non-screening GP visits at the zip code area level as a proxy for thelocal tendency of doctor-going.
Copyright © 2014 John Wiley & Sons, Ltd. Health Econ. 24: 913–935 (2015)DOI: 10.1002/hec
THE EFFECTIVENESS OF HEALTH SCREENING 933
increase in health-care cost was not compensated by the medium-run cost savings in the outpatient sector. Inthe long run (8 years after treatment or longer), no statistically significant effects of screening participation oneither health-care cost component can be discerned. At no point in time did we find a statistically significantimpact of screening participation on health status variables.
A more disaggregated analysis of cost components enabled a quite clear interpretation of the short-runrise in health-care costs. The general screening examination led to substantial increases in intake of medicaldrugs and further medical examinations. In contrast, the medium-run decline in outpatient health-care costsmay have at least two different sources. The empirical evidence is consistent with successful secondary and/orprimary prevention, as well as with a demand-side driven ‘reassurance effect’. The first explanation would bean argument in favor of screening. The second explanation would suggest that screening mainly affects thetiming of health-care costs and has only a small impact on insurants’ health status.
Given that we did not find any significant effects of screening on our measures of health status, we con-sider the reassurance effect as the more likely explanation for the decrease in medium-run health-care costs.This interpretation is also supported by the fact that the decline in medium-run health-care costs comes fromthe outpatient and not the inpatient sector, where the former is more amenable to demand-driven consump-tion. However, we have to acknowledge that our health status measurements are crude and do not necessarilycover the whole range of potential health effects. In particular, long-term mortality and several components ofmorbidity may remain undisclosed.
In summary, our results tend to show that screening increases health-care costs on average but does notimprove health. This empirical evidence is in line with the most recent screening literature that, in contrast toearlier studies, is more skeptical about the overall cost effectiveness of health screening. To Austrian healthpolicy makers, we would recommend to revise the program in its current form. In particular, we suggest tofocus on younger insurants (about 60 years of age or younger), because we found comparably small short-runcost increases for this group that can be overcompensated by cost-savings in the medium run.
The following proposals for improvement should be considered in implementing (general) health-screeningprograms: (i) Given the increase of short-run outpatient expenditures, the efficiency of a program can beimproved by a reduction of false positive diagnoses and subsequent overtreatment. A more precise programdifferentiation according to patients’ age and gender-specific risk factors would allow more target-based med-ical examinations. Moreover, on the basis of these specific risk factors, binding diagnostic guidelines couldbe established. (ii) A well-designed program should focus on health-promoting achievements. In light ofrecent epidemiological developments (e.g., obesity ), more effective lifestyle-counseling measures could bediscussed.34 Screening guidelines that include realistic and achievable lifestyle objectives, in combination withfinancial incentives for patients, should be stipulated. (iii) Finally, programs should be flexible and react to thedivergence between the original intentions of the program and its real-life practice. This implies, of course,a constant and careful evaluation. Targeted guidelines for further medical treatment are necessary, especiallywith regard to diseases that are given a high priority in the program’s objectives. For instance, disorders of theheart and circulatory system are at the core of the Austrian general health-screening program. However, withthe exception of cholesterol drugs, we hardly find significant changes in the utilization of cardio and circulatorymedicines after the screening examination. However, the highly statistically significant increase in the prescrip-tion of antidepressants and other drugs is a clear example of a highly relevant health issue in practice. Giventhat the program does not even mention this area in its guidelines, it should be extended to react to this need.
ACKNOWLEDGEMENTS
For the helpful discussion and comments, we would like to thank Eddy Bekkers, Johann K. Brunner,Rudolf Winter-Ebmer, the participants of the Annual Conference 2010 of the European Society of Population
34For literature on obesity, see for instance Baum and Ruhm (2009), Bhattacharya and Bundorf (2009), Bhattacharya and Sood (2011).
Copyright © 2014 John Wiley & Sons, Ltd. Health Econ. 24: 913–935 (2015)DOI: 10.1002/hec

934 F. HACKL ET AL.
Economics in Essen, of the Annual Meeting of the Austrian Public Health Society in Linz, of the Workshopof the National Research Network ‘The Austrian Center for Labor Economics and the Analysis of the WelfareState’ in Salzburg, of the Spring Meeting of Young Economists 2011 in Groningen, of the research seminarsat the Universities of Salzburg and Innsbruck, and of the Labor Economics Workshop of the Universities ofPadova and Linz in Brixen. The authors would also like to thank two anonymous reviewers and the editor fortheir helpful comments. The usual disclaimer applies. Moreover, we thank the following institutions for provid-ing us with data: Main Association of Austrian Social Security Institutions, Upper Austrian Sickness Fund, andthe Austrian Federal Ministry of Finance. This paper was partly written during Martin Halla’s visiting schol-arship at the Center for Labor Economics at the University of California at Berkeley. He would like to expresshis appreciation for the stimulating academic environment at the center and the hospitality he received. Thisresearch was funded by the Austrian Science Fund (FWF): National Research Network S103, The AustrianCenter for Labor Economics and the Analysis of the Welfare State.
REFERENCES
Aas E. 2009. Pecuniary compensation increases participation in screening for colorectal cancer. Health Economics 18(3):337–354.
Andriole G, Crawford E, Grubb R, Buys S, Chia D, Church T, Team PLCO Project. 2009. Mortality results from arandomized prostate-cancer screening trial. The New England Journal of Medicine 360: 1310–1319.
Angrist J. 2001. Estimation of limited dependent variable models with dummy endogenous regressors: simple strategies forempirical practice. Journal of Business and Economic Statistics 19(1): 2–15.
Baum C, Ruhm C. 2009. Age, socioeconomic status and obesity growth. Journal of Health Economics 28(3):635–648.
Bhattacharya J, Bundorf M. 2009. The incidence of the healthcare costs of obesity. Journal of Health Economics 28(3):649–658.
Bhattacharya J, Sood N. 2011. Who pays for obesity? Journal of Economic Perspectives 25(1): 139–157.Blom J, Yin L, Lidén A, Dolk A, Jeppsson B, Påhlman L, Holmberg L, O N. 2008. Toward understanding nonparticipation
in sigmoidoscopy screening for colorectal cancer. International Journal of Cancer 122: 1618–1623.Bowman J, Sanson-Fisher R, Boyle C, Pope S, Redman S. 1995. A randomised controlled trial of strategies to prompt
attendance for a pap smear. Journal of Medical Screening 2(4): 211–218.Cole S, Young G, Byrne D, Guy J, Morcom J. 2002. Participation in screening for colorectal cancer based on a faecal
occult blood test is improved by endorsement by the primary care practitioner. Journal of Medical Screening 9(4):147–152.
Cowen M, Kattan M, Miles B. 1996. A national survey of attitudes regarding participation. Cancer 78(9): 1952–1957.Frimmel W, Halla M, Winter-Ebmer R. 2013. Assortative mating and divorce: evidence from Austrian register data. Journal
of the Royal Statistical Society: Series A (Statistics in Society) 176(4): 907–929.Fukuda Y, Nakamura K, Takano T, Nakao H, Imai H. 2007. Socioeconomic status and cancer screening in Japanese
males: large inequality in middle-aged and urban residents. Environmental Health and Preventive Medicine 12:90–96.
Hardcastle J, Chamberlain J, Robinson M, Moss S, Amar S, Balfour T. 1996. Randomised controlled trial of faecal-occult-blood screening for colorectal cancer. The Lancet 348: 1472–1477.
Holland W, Stewart S. 2005. Screening in Disease Prevention. Radcliffe Publishing: London.Imbens GW. 2010. Better LATE than nothing: some comments on Deaton (2009) and Heckman and Urzua (2009). Journal
of Economic Literature 48(2): 399–423.Jepson R, Clegg A, Forbes C, Lewis R, Sowden A, Kleijnen J. 2000. The determinants of screening uptake and interventions
for increasing uptake: a systematic review. Health Technology Assessment 4(4): 1–133.Kenkel D. 2000. Prevention, In Handbook of Health Economics, Culyer AJ, Newhouse JP (eds). Elsevier: Amsterdam;
1675–1862.Lange F. 2011. The role of education in complex health decisions: evidence from cancer screening. Journal of Health
Economics 30(1): 43–54.Mandel J, Bond J, Church T, Snover D, Bradley G, Schuman L. 1993. Reducing mortality from colorectal cancer by
screening for fecal occult blood - Minnesota Colon Cancer Control Study. The New England Journal of Medicine 328:1365–1371.
McGuire T. 2000. Physician Agency, In Handbook of Health Economics, Culyer AJ, Newhouse JP (eds). Elsevier:Amsterdam; 461–536.
Copyright © 2014 John Wiley & Sons, Ltd. Health Econ. 24: 913–935 (2015)DOI: 10.1002/hec

THE EFFECTIVENESS OF HEALTH SCREENING 935
Meissner H, Breen N, Taubman M, Vernon S, Graubard B. 2007. Which women aren’t getting mammograms and why?Cancer Causes Control 18: 61–70.
Nyström L, Andersson I, Bjurstam N, Frisell J, Nordenskjöld B, Rutqvist L. 2002. Long-term effects of mammographyscreening: updated overview of the Swedish randomised trials. The Lancet 359: 909–919.
Park C, Kang C. 2008. Does education induce healthy lifestyle? Journal of Health Economics 7: 1516–1531.Raffle A, Gray M. 2007. Screening: Evidence and Practice. Oxford University Press: Oxford.Richardson A, Williams S, Elwood M, Bahr M, Medlicott T. 1994. Participation in breast cancer screening: randomised
controlled trials of doctors’ letters and of telephone reminders. Australian Journal of Public Health 18(3): 290–292.Sabates R, Feinstein L. 2006. The role of education in the uptake of preventative health care: the case of cervical screening
in Britain. Social Science & Medicine 62: 2998–3010.Sambamoorthi U, McAlpine D. 2003. Racial, ethnic, socioeconomic, and access disparities in the use of preventive services
among women. Preventive Medicine 37: 475–484.Schröder F, Hugosson J, Roobol M, Tammela T, Ciatto S, Nelen V. 2009. Screening and prostate-cancer mortality in a
randomized European study. The New England Journal of Medicine 360: 1320–1328.Selvin E, Brett K. 2003. Breast and cervical cancer screening: sociodemographic predictors among white, black, and
hispanic women - research and practice. American Journal of Public Health 93(4): 618–623.Smith R, Cokkinides V, Brawley O. 2008. Cancer screening in the United States - a review of current American Cancer
Society guidelines and cancer screening issues. A Cancer Journal for Clinicians 58: 161–179.Stock J, Yogo M. 2005. Testing for weak instruments in linear IV regression, In Identification and Inference from
Econometric Models - Essays in Honor of Thomas Rothenberg, Andrews D, Stock J (eds). Cambridge University Press:Cambridge; 80–108.
Tabár L, Duffy SW, Vitak B, Chen HH, Prevost TC. 1999. The natural history of breast carcinoma. Cancer 86: 449–462.U.S. Preventive Services Task Force. 2009. Screening for breast cancer: U.S. preventive services task force recommendation
statement. Annals of Internal Medicine 151(10): 716–726.Whynes D, Philips Z, Avis M. 2007. Why do women participate in the English cervical cancer screening programme?
Journal of Health Economics 26: 306–325.
SUPPORTING INFORMATION
Additional supporting information may be found in the online version of this article at the publisher’s web site.
Copyright © 2014 John Wiley & Sons, Ltd. Health Econ. 24: 913–935 (2015)DOI: 10.1002/hec