the effectiveness of groundwater pumping as a restoration
TRANSCRIPT
f :,e;vrcP, U.S. 81.
ORFJLEM-11866
THE EFFECTIVENESS OF GROUNDWATER PUMPING
AS A RESTORATION TECHNOLOGY
C. B. Doty C. C. Travis
Date Published - May 1991
Prepared by the Risk Analysis Section
Health and Safety Research Division Oak Ridge National Laboratory* Oak Ridge, Tennessee 37931
* Managed by Martin Marietta Energy Systems, Inc for the U. S. Department of Energy under Contract No. DE-AC05-840R21400

TABLE OF CONTENTS
LISTOFTABLES . . . . . . . . . . . . . . . . . . . . . . . . . . . . . . . . . . . . . . . . . . . . . . . . . . . . . . v
LISTOFFIGURES . . . . . . . . . . . . . . . . . . . . . . . . . . . . . . . . . . . . . . . . . . . . . . . . . . . . . vi
LIST OF BOXES . . . . . . . . . . . . . . . . . . . . . . . . . . . . . . . . . . . . . . . . . . . . . . . . . . . . . . . vii
EXECUTIVE SUMMARY . . . . . . . . . . . . . . . . . . . . . . . . . . . . . . . . . . . . . . . . . . . . . . . . viii
1.0 INTRODUCTION . . . . . . . . . . . . . . . . . . . . . . . . . . . . . . . . . . . . . . . . . . . . . . . . . . . 1
1.1 Aquifer Restoration and the Decision Process . . . . . . . . . . . . . . . . . . . . . . . . . . . . . 1
1.2 Purpose . . . . . . . . . . . . . . . . . . . . . . . . . . . . . . . . . . . . . . . . . . . . . . . . . . . . . . . . 3
1.3 Approach . . . . . . . . . . . . . . . . . . . . . . . . . . . . . . . . . . . . . . . . . . . . . . . . . . . . . . 3
2.0 PUMP AND TREAT SYSTEMS . . . . . . . . . . . . . . . . . . . . . . . . . . . . . . . . . . . . . . . . . 5
3.0 INDICATORS OF PUMP AND TREAT EFFECTIVENESS ..................... 18
3.1 Reduction of Concentrations Over Time . . . . . . . . . . . . . . . . . . . . . . . . . . . . . . . . . 18
3.1.1 Leveling Patterns . . . . . . . . . . . . . . . . . . . . . . . . . . . . . . . . . . . . . . . . . . . . . 24
3.2 Capture and Containment of Contarninant Plume .......................... 27
3.3 Reduction of Contaminant Mass . . . . . . . . . . . . . . . . . . . . . . . . . . . . . . . . . . . . . . 28
3.3.1 Comparison of Mass Estimates to Mass Extracted . . . . . . . . . . . . . . . . . . . . . . 29
3.3.2 Mass Reduction vs . Concentration Reduction ......................... 29
3.3.3 Mass Extraction Rates . . . . . . . . . . . . . . . . . . . . . . . . . . . . . . . . . . . . . . . . . 30
3.4 Meeting Cleanup Goals . . . . . . . . . . . . . . . . . . . . . . . . . . . . . . . . . . . . . . . . . . . . . 32
4.0 PRIMARY FACTORS INFLUENCING EFFECTIVENESS ...................... 33
4.1 Continued Sources of Contamination . . . . . . . . . . . . . . . . . . . . . . . . . . . . . . . . . . . 35
4.2 Contaminant Sorption and Desorption .................................. 35
4.3 Non-aqueous Phase Liquids . . . . . . . . . . . . . . . . . . . . . . . . . . . . . . . . . . . . . . . . . . 36
4.4 Low Permeability Zones . . . . . . . . . . . . . . . . . . . . . . . . . . . . . . . . . . . . . . . . . . . . 38
4.5 FracturedRock . . . . . . . . . . . . . . . . . . . . . . . . . . . . . . . . . . . . . . . . . . . . . . . . . . 38
iii
5.0 PREDICTING REMEDIAL TIME FRAMES . . . . . . . . . . . . . . . . . . . . . . . . . . . . . . . . 39
Groundwater Modeling at the Sites Reviewed . . . . . . . . . . . . . . . . . . . . . . . . . . . . . 39
5.2 Recent Modeling Studies . . . . . . . . . . . . . . . . . . . . . . . . . . . . . . . . . . . . . . . . . . . . 40
5.1
6.0 EFFECTS OF PUMPING AND TREATING . . . . . . . . . . . . . . . . . . . . . . . . . . . . . . . . 41
7.0 CONCLUSIONS., . . . . . . . . . . . . . . . . . . . . . . . . . . . . . . . . . . . . . . . . . . . . . . . . . . 42
8.0 REFERENCES . . . . . . . . . . . . . . . . . . . . . . . . . . . . . . . . . . . . . . . . . . . . . . . . . . . . . 45
APPENDIX A Summary of Pump and Treat Effectiveness . . . . . . . . . . . . . . . . . . . . . . . . A-1
APPENDIX B Abstracts for Performance Records Reviewed . . . . . . . . . . . . . . . . . . . . . . B-1
iv
TABLES
1 . Leveling of VOC Concentrations . . . . . . . . . . . . . . . . . . . . . . . . . . . . . . . . . . . . . . . . . 19
2 . Inventory of Contaminants in Groundwater . . . . . . . . . . . . . . . . . . . . . . . . . . . . . . . . . 30
3 . Mass Extraction Rates and Initial Concentrations at Selected Sites . . . . . . . . . . . . . . . . . 31
4 . Known Factors Contributing to the Ineffectiveness of Pumping Groundwater at the Sites Reviewed . . . . . . . . . . . . . . . . . . . . . . . . . . . . . . . . . . . . . . . 34
V
FIGURES
1 . Leveling of VOC Concentrations. Savannah River Plant . . . . . . . . . . . . . . . . . . . . . . . . . 21
VOC Influent Concentrations. Arrow Street Area. Wurtsmith AEB . . . . . . . . . . . . . . . . . 22 2 .
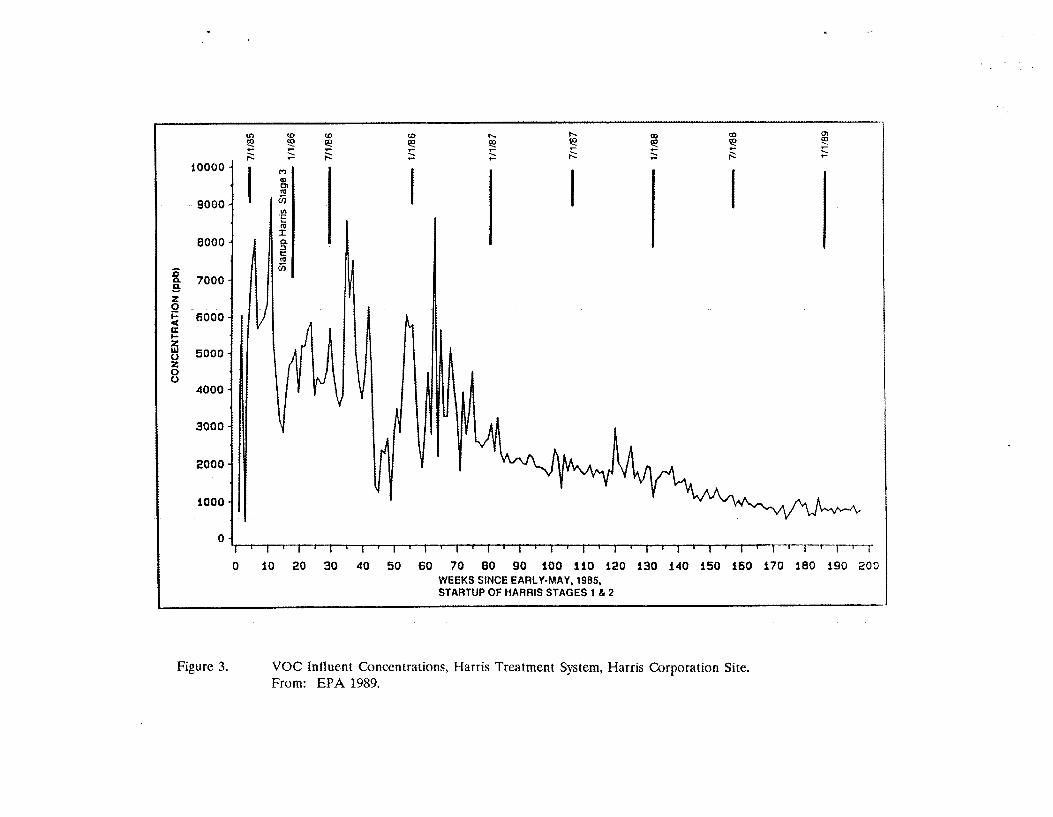
3 . VOC Influent Concentrations. Harris Treatment System. Harris Corporation Site . . . . . . . . . . . . . . . . . . . . . . . . . . . . . . . . . . . . . . . . . . . . . . . . . . . . . . . . . . . . . 23
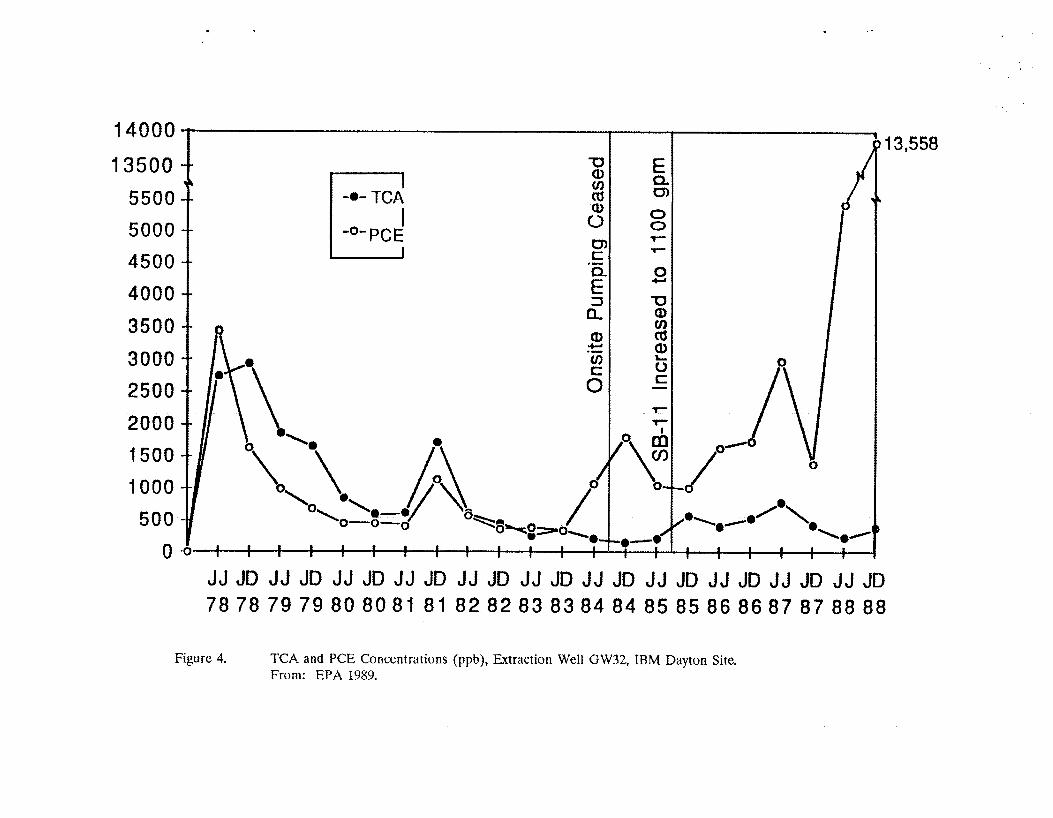
4 . TCA and PCE Concentrations. Extraction Well GW32. IBM Dayton Site . . . . . . . . . . . . 25
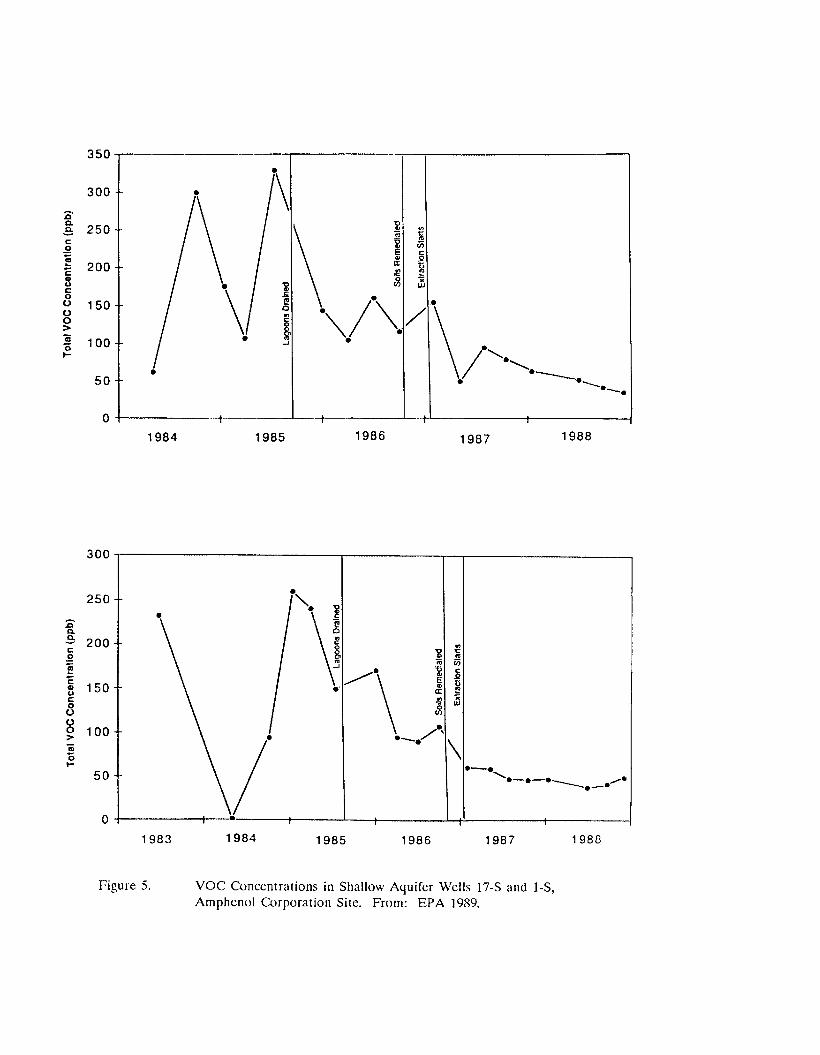
5 . VOC Concentrations in Shallow Aquifer Wells 17-S and 1.S. Amphenol Corporation Site . . . . . . . . . . . . . . . . . . . . . . . . . . . . . . . . . . . . . . . . . . . . . . . . . . . . 26
vi
BOXES
1 . Performance Records Reviewed . . . . . . . . . . . . . . . . . . . . . . . . . . . . . . . . . . . . . . . . . . 5
2 . Status of Sites with Goals Above Health-Based Levels .......................... 32
3 . Status of Sites with Drinking Water Standards as Cleanup Goals . . . . . . . . . . . . . . . . . . . 33
4 .
5 .
Remedial Time Frames at Sites Reviewed ................................... 39
VOC Mass. Savannah River Site .......................................... 42
vii
EXECUTIVE SUMMARY
An in-depth analysis of the effectiveness of pumping groundwater for aquifer restoration was
conducted based on: (1) performance records for 16 sites where pumping with the objective of
aquifer restoration has been implemented for periods of 2 to 12 years, and (2) recent theoretical
and modeling studies. The reduction of aquifer concentrations is the primary indicator of
effectiveness of groundwater extraction. However, other indicators of effectiveness such as plume
containment, mass reduction, and achievement of specific cleanup goals are also components of the
evaluation.
At the sites reviewed, the pump and treat systems appear to be effective for containing the
contaminant plume, and for reducing the mass of contamination in the aquifer. However,
groundwater extraction systems are not effective for aquifer restoration. Data indicate that pumping
can achieve concentration reductions of 90% to 99% prior to leveling at sites with high initial
concentrations (greater than 1,OOO ppb). However, concentrations at these sites remain significantly
above health-based levels, and significant masses of contamination remain in the aquifers. At sites
with initial concentrations less than 1,OOO ppb, concentration reductions of 90% or less are achievcd
prior to leveling. Once leveling occurs, further significant reduction cannot be accomplished within
a reasonable time frame. Even though concentrations may level at relatively low concentrations,
when pumps are turned off, the concentrations tend to rise again.
The evidence to date suggests that the primary contributors to the ineffectiveness of pumping
for aquifer restoration are phenomena resulting from physical and chemical processes that affect the
behavior of contaminants in the subsurface environment, Recent studies show that soils long-
contaminated with halogenated organic compounds are resistant to desorption, and the rate of
contaminant desorption is controlled by diffusion of contaminants from within soil particles. Non-
aqueous phase liquids (NAF'Ls) that either float on top of the water table or sink to the bottom
of the aquifer Cannot be effectively mobilized by pumping because they are immiscible in water.
... vlll
Most aquifers are heterogeneous and have low permeability zones where contaminants become
immobilized. Pumping causes preferential flow of groundwater in zones of high permeability,
resulting in the trapping of even highly soluble contaminants in low permeability zones. The mass
of immobilized contaminants in the subsurface is generally significantly greater than the mass
dissolved in the groundwater, and the extraction of all the immobile contaminants is not technically
feasible at the present time.
Groundwater modeling had been conducted at two-thirds of the sites reviewed. The models
used over-simplified generic assumptions and did not account for the tailing effect observed at the
sites. Remedial time frames of 2 years to 30 years were predicted at the sites reviewed. However,
recent modeling studies suggest that pumping and treating will not restore aquifers to drinking
water standards within these time frames. Pump and treat time frames of 100 years may be needed
to lower concentrations by a factor of 100, assuming the ideal conditions of a homogeneous aquifer.
For water-insoluble constituents such as jet fuel, thousands of years may be needed to remove the
contaminants.
Based on our review of performance records and recent theoretical studies, the following can
be concluded regarding the use of groundwater pumping for aquifer restoration:
0 Pumping is effective for contaminant mass reduction, plume containment, and extraction of groundwater for point-of-use treatment. attaining these objectives should be encouraged.
Its use for
0 Groundwater pumping is ineffective for restoring aquifers to health-based levels. This reality needs to be explicitly recognized by regulators.
0 The primary contributors to the ineffectiveness of pumping in meeting cleanup goals are the time-dependent decrease in the rate of desorption of contaminants from contaminated soils and the existence of immobile contaminants either in the non-aqueous phase or trapped in zones of low permeability.
D Remedial time frames of 2 years to 30 years were predicted at the sites reviewed. Regulators currently maintain that 20 to 40 years may be needed to reach health-based cleanup goals. However, recent modeling studies estimate pump and treat time frames of 100 to 1,OOO years.

1.0 INTRODUCTION
During the past decade, the U. S. has passed legislation to address the remediation of inactive
hazardous waste sites. The original emphasis of the Comprehensive Environmental Response,
Compensation, and Liability Act of 1980 (CERCLA) was on short-term remedies. However, with
the passing of the Superfund Amendments and Reauthorization Act of 19% (SARA), thc
philosophy of the program shifted toward long-term solutions to addressing contamination. The new
program required that remedial alternatives be "protective of public health and the environment"
and "significantly and permanently" reduce the toxicity, mobility, or volume of contaminants. The
shift toward seeking permanent solutions occurred, however, before proven technologies were
available for permanent remediation of sites.
Although post-SARA remedial action decisions reflect an increase in the selection of treatment
remedies, most of these decisions have been made based on weak rationales regarding the
effectiveness of the remedies selected. Treatment remedies may, in theorry, provide permanent risk
reduction; however, the selection of a treatment approach does not necessarily ensure the
effectiveness and permanence of a remedy. Now that performance records are becoming available
for remedial actions involving treatment technologies, a need exists for more research to evaluate
the effectiveness of this approach. One such treatment approach is pumping and treating
groundwater with the remedial objective of restoring contaminated aquifers.
1.1 Aquifer Restoration and the Decision Process
CERCLA remedial action decisions addressing groundwater contamination through fiscal year
1985 primarily consisted of containment of the contaminant plume or provision of an interim
drinking water supply. Only 14% of the decisions addressed aquifer restoration (Haiges and b o x
1987). The average cleanup time predicted in these decisions was one to five years, although the
cleanup times were subject to extension because toxicological data were lacking for many of the
priority pollutants and cleanup standards were often not available. The feasibility of aquifer
1
restoration using groundwater pumping and treating was assumed based on limited theoretical,
laboratory, and field studies.
However, the number of decisions selecting aquifer restoration as a remedial objective
increased during fiscal year 1986, and approximately 68% of remedial action decisions addressing
groundwater contamination during fiscal year 1987 involved aquifer restoration (Doty and Travis
1989). Quantitative cleanup goals were established for all of these sites based on applicable or
relevant and appropriate requirements (ARARS) or health-based goals derived from site-specific risk
assessments. This trend reflects both the change in program philosophy and the progress made in
the field of risk assessment. Although more quantitative toxicological data were available, thus
facilitating the establishment of health-based cleanup goals for ground water, the effectiveness of
the pump and treat approach to achieving aquifer restoration to these levels was no more certain
than in earlier decisions.
In the 1987 decisions, rationales for predicting the effectiveness of pumping and treating to
The restore aquifers to the cleanup levels established in the RODS were not well-supported.
effectiveness of pumping groundwater to restore aquifers was questionable at these sites for one or
more of the following reasons:
1. Effectiveness and permanence of the source remedy selected was uncertain.
2, Extent of groundwater contamination had not been confirmed, and additional studies were needed.
3. Contributing sources of contamination had not been determined or fully characterized.
4. Further studies were needed to determine applicability of technology to site conditions.
5. Hydrogeological uncertainties were associated with pumping and treating.
Since the passage of SARA, hundreds of decisions have been made to restore aquifers using
the pump and treat method. Although decision-makers have acknowledged that pumping and
treating groundwater is a time-consuming and often unpredictable proms, this method has
2
essentially been the only available option for aquifer restoration in some eases. More recent studies
and field experience (EPA 1989) indicate, however, that aquifer restoration is not as feasible as was
previously predicted in remedial action decisions.
1.2 Purpose
The purpose of this project is to provide an in-depth analysis of the effectiveness of pumping
groundwater for aquifer restoration based on recent performance records and theoretical studies.
Although laboratory, field, and modeling studies have been conducted regarding the feasibility of
aquifer restoration using the pump and treat approach, little performance data have been available
until recently. In 1989, the Environmental Protection Agency (EPA) conducted a study of 19 sites
where pump and treat operations had bsen implemented for up to six years. The present study
differs from the EPA study in two ways. First, we analyze performance records at sites where the
pump and treat system was designed specifically for restoration of the aquifers to drinking water
standards o r to a specified negotiated cleanup goal. Unlike the EPA study, we include no sites
where remediation was designed exclusively for containment or wellhead treatment. Second, we
update and expand upon EPA's performance record data base.
1.3 Approach
The effectiveness of groundwater pumping and treating as a remedial alternative for aquifer
restoration was evaluated by reviewing: (1) performance records for 16 sites where pumping and
treating has been implemented for more than one year, and (2) recent theoretical and field studies.
Sites selected for evaluation consist of both Superfund and non-Superfund sites where the pump
and treat system was designed for restoration. Site descriptions and results for the pump and treat
operations reviewed are presented in Appendices A and B. Pertinent literature, performance
records, and support documents were reviewed. Existing databases were used, and interviews with
3
regional EPA personnel and/or contractors were conducted to identify sites for evaluation and to
obtain necessary data.
The effectiveness of groundwater pumping is typically evaluated in one or more of the
following ways: (1) reduction in aquifer concentrations over time; (2) containment of the
contaminant plume; (3) reduction of contaminant mass in aquifer; (4) comparison of contaminant
mass removed to estimated mass of contaminants lost to the environment; and (5) comparison of
aquifer concentrations to specific cleanup goals established.
Because proven technologies are available for treating most hazardous constituents in water to
meet drinking water standards once the contaminated water is pumped from the subsurface, the
focus of the present evaluation is on the effectiveness of pumping as a method for removing
contarninants from the subsurface. The ability of pumping to reduce aquifer concentrations is the
primary indicator of effectiveness in the present evaluation. However, the following factors are also
components of the analysis: (1) the effectiveness of the system in containing the migration of
aquifer contaminants; (2) the effectiveness of the system in reducing contaminant mass over time;
(3) the success or failure of modeling in predicting the effectiveness and time frame associated with
the approach; (4) the feasibility of attaining established cleanup goals; and (5) factors which
influence effectiveness.
The present evaluation of groundwater extraction remedies was limited by the following factors:
(1) the small number of sites where pumping has been ongoing for more than one year; (2) the
extent of the site investigation on which the remedial design is based; and (3) the protocol used to
measure and report the effectiveness of the remedy. Most pump and treat operations have not
operated more than two or three years. However, for most systems, patterns in aquifer
concentration reduction are evident after a year or two, and these patterns can be considered in
light of recent research to predict future pump and treat performance at the sites.
Inconsistencies existed with respect to the availability of data and the ways in which
Initial concentrations were frequently available for all the remediation results were reported.
4
primary contaminants, while resulting aquifer concentrations were often reported only in terms of
average VOC air stripper influent concentrations. These average concentrations may not be
representative of maximum concentrations present in some wells a t the sites.
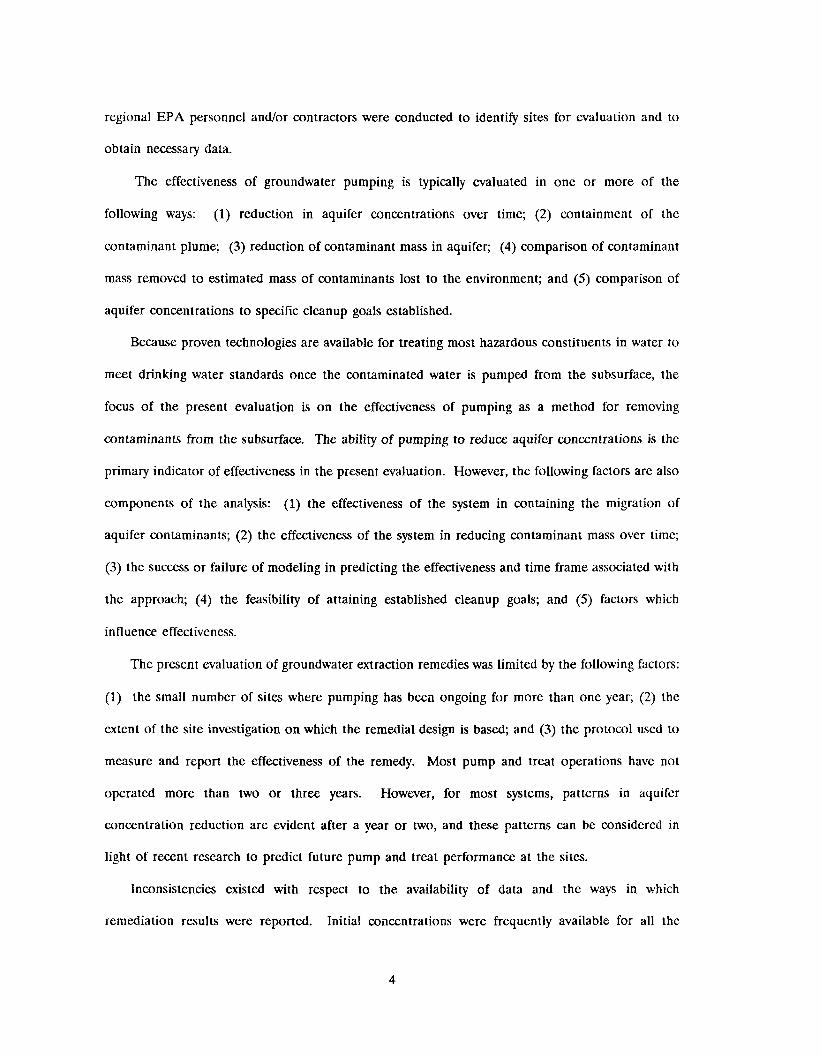
2.0 PUMP AND TREAT SYSTEMS
The sites reviewed and the length of operation to date for the sites are listed in Box 1.
Performance records were not available for the entire duration of the operation for some sites.
The performance records reviewed range from 2 to 12 years and are limited to those reported in
the documents listed in Appendix B. A brief review of the site performance records follows.
Additional site descriptions and results for the pump and treat operations
in Appendices A and B.
reviewed are presented
5
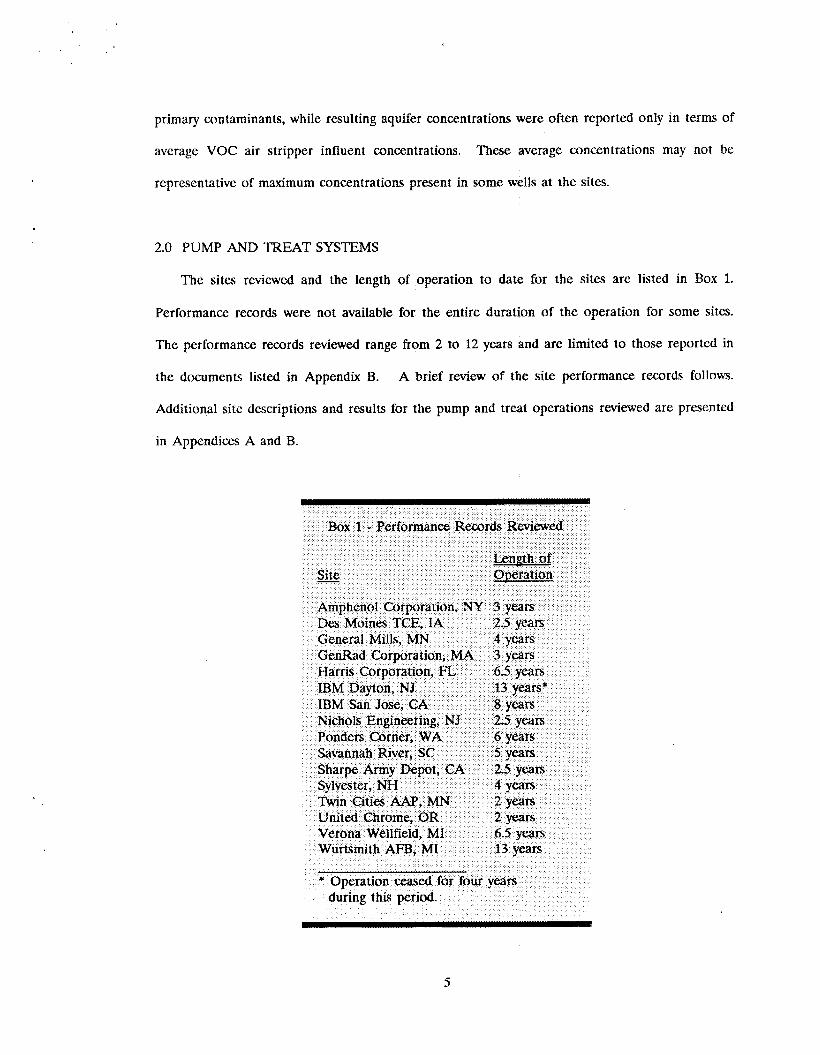
Amphenol Corporation, NY
LOCATION: Sidney, NY
TYPE OF SITE:
CONTAMINANTS: TCE, Chloroform
GEOLOGY:
Electrical connector manufacturing facility (non-NPL)
A 100 to 200 foot thick layer of alluvial materials is underlain by glaciofluvial sands and gravels.
The Amphenol Corporation pump and treat operation is a small system consisting of only two
extraction wells. Before the removal of the contaminated soil at the site, initial maximum VOC
concentrations were 230 ppb. However, when the pump and treat operation began in 1987,
maximum concentrations had declined to 250 ppb, One shallow aquifer extraction well and one
deep aquifer extraction well are in operation with a total pumping rate of 200 gpm. Seventeen
monitoring wells were initially installed, but some have been discontinued. The system has operated
for 3 years. Concentrations began to level off at 50 ppb in 1988.
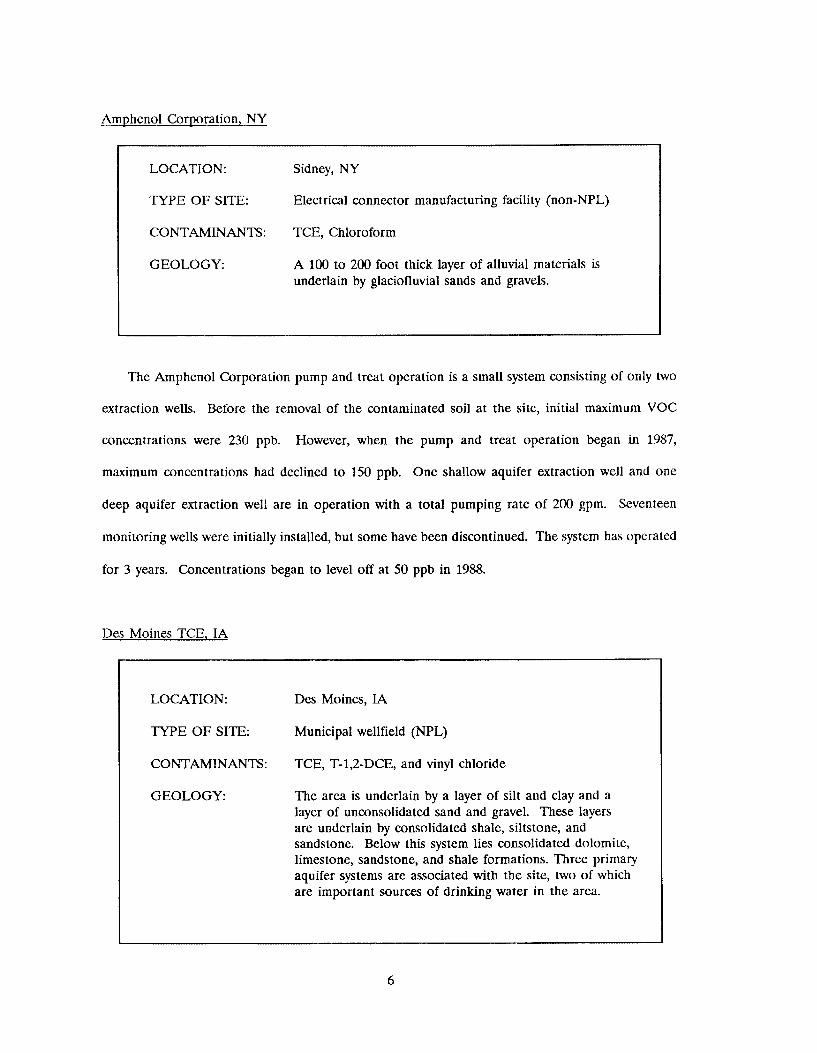
Des Moines TCE, IA
LOCATION: Des Moines, IA
TYPE OF SITE: Municipal wellfield (NPL)
CONTAMINANTS: TCE, T-12-DCE, and vinyl chloride
GEOLOGY: The area is underlain by a layer of silt and clay and a layer of unconsolidated sand and gravel. These layers are underlain by consolidated shale, siltstone, and
, sandstone. Below this system lies consolidated dolomite, limestone, sandstone, and shale formations. Three primary aquifer systems arc associated with the site, two of which are important sources of drinking water in the area.
6
An estimated 200 gallons of contarninants were reportedly lost to the soils and groundwater at
the Des Moines TCE site. The groundwater is contaminated with TCE, with initial TCE
concentrations of approximately 8,500 ppb. Seven recovery wells were initially installed with a total
pumping rate of 1,300 gpm. Six of these wells are still in operation at a pumping rate of 1,OOO
gpm. Pumping for 2.5 years has resulted in the extraction of more than 1,500 gallons of
contaminants. However, concentrations have leveled off at bemeen 500 ppb and 1,OOO ppb. An
additional source of contamination is being investigated.
General Mills, MN
LOCATION: Minneapolis, MN
TYPE OF SITE:
CONTAMINANTS: TCE, TCA, PCE
GEOLOGY:
Food research laboratory (non-NPL)
Thirty to fifty feet of unconsolidated alluvial and glacial deposits are underlain by a sequence of fractured sandstone, shale, dolomite, and limestone.
TCE is the primary groundwater contaminant with initial maximum concentrations of 1,300 ppb
in the shallow aquifer and lower (Carimona) aquifer concentrations of 2,300 ppb. Five shallow
aquifer extraction wells and one extraction well in the Carimona aquifer are in operation. Pumping
at 300 gprn in the shallow aquifer and 50 gpm in the Carimona aquifer has resulted in substantial
reduction of TCE concentrations. However, aquifer concentrations remain above target levels and
remain as high as 460 ppb in one area.
7
Genrad CorDoration. MA
LOCATION: Bolton, MA
TYPE OF SITE:
CONTAMINANTS: TCE
GEOLOGY:
Scientific and medical equipment mfg.
Unconsolidated glacial deposits overlie metamorphic rocks. In low-lying areas, organic sediments overlie sands and gravels. Depth to groundwater is generally only five feet.
Although two plumes, the eastern plume and the northern plume, are present at the site, only
the eastern plume is addressed by the present system. Initial VOC concentrations were 1,OOO ppb
and TCE concentrations were 270 ppb. Two extraction wells have been in operation for three years
in the eastern plume area at a pumping rate of 30 gpm. Sixteen monitoring wells are also in
operation. TCE concentrations began to level in 1988 at approximately 100 ppb.
Harris Corporation, FL
I LOCATION: Palm Bay, FL
TYPE OF SITE:
CONTAMINANTS:
Manufacturing facility (NPL)
TCE, TCEA, vinyl chloride, methylene chloride, chlorobenzene, xylene, and ethylbenzene
The upper sand aquifer, which is an unconfined aquifer, is used locally as a water source. Below the upper aquifer is a 22-foot thick sandy clay layer that acts as a leaky aquitard, retarding groundwater flow between the upper aquifer and the 30-foot thick unconsolidated lower sand aquifer. Underlying the lower sand aquifer is the Hawthorne formation, a clay confining layer up to 200 feet thick. The fifth layer is the Floridan aquifer, a 1,000-foot thick sequence of limestone and dolomite.
GEOLOGY:
I
8
Groundwater at the site is contaminated with VOCs at a maximum initial concentration of
10,000 ppb. The pump and treat system has been operating for 6.5 years. The current system
consists of 11 extraction wells, four of which are deep aquifer barrier wells. The remaining wells
recover groundwater from both the shallow and deep aquifers. The pumping rate has remained
constant since startup at 300 gpm.
Although the average treatment system influent VOC concentrations have declined and leveled
at approximately 500 ppb, concentrations remain above 1,OOO ppb in one shallow extraction well,
two deep aquifer extraction wells, and one deep aquifer monitoring well. In one of the temporary
onsite shallow monitoring wells installed in 1387, VOC concentrations fluctuated between 1 and
30,000 ppb during 1988 and 1989 and remained at 14,000 ppb during 1989. This contamination has
been attributed almost exclusively to xylene and ethyl benzene, as opposed to TCE, DCEA, and
vinyl chloride in the extraction wells (Harris Corporation 1990).
IBM Davton, NJ
LOCATION: South Brunswick, NJ
TYPE OF SITE:
CONTAMINANTS: l,l,l-TCA and PCE
Electronics manufacturing facility (non-NPL)
GEOLOGY The shallow unconfined aquifer is comprised of the two upper geologic units which consist primarily of clay, silt, and gravel. These units are underlain by a thin discontinuous clay layer. The lower semi-confined aquifer consists of a sand and gravel unit underlain by relatively impermeable shale.
I
The site was contaminated with approximately 400 gallons of VOCs, primarily l,l,l-
trichloroethane (TCA) and tetrachloroethylene (PCE), with maximum ground water concentrations
ranging from 9,590 ppb for TCA to 6,132 ppb for PCE. The initial system installed in 1978
consisted of 13 shallow aquifer extraction wells, one deep aquifer extraction well, one offsite
9
production well, and 100 monitoring wells. The average pumping rate was 300 gpm with a
maximum pumping rate at the offsite well of 500-600 gpm. Pumping between 1978 and 1984
lowered VOC concentrations to below 100 ppb. However, subsequent to shutdown of the operation
in 1984, PCE concentrations rose to 13,558 ppb in 1988. Pumping was resumed in 1989, but the
remedial objective was changed from restoration to containment.
IBM San Jose, CA
LOCATION: San Jose, CA
TYPE OF SITE: Electronics manufacturing facility (Non-NPL)
CONTAMINANTS: Freon 113, TCA, l,l-DCE, and TCE
GEOLOGY: The valley floor is underlain by a sequence of alternating sand and gravel layers separated by silt and clay layers. Bedrock in the area consists of consolidated sandstones, shales, cherts, serpentinite, and ultrabasic rocks. Contamination is distributed throughout five aquifers at the site.
The IBM San Jose site is contaminated with freon, TCA, l,l-DCE, and TCE. Although the
site involves relatively low-level contamination, the distribution of contaminants throughout several
geologic layers is complex, and contaminants have migrated more than two miles offsite. Initial
maximum concentrations of TCE, the primary contaminant of concern, were 100 ppb in the B
aquifer, where an action level was set at 50 ppb. Although more than 8,OOO lbs. of contaminants
have been extracted, and B aquifer concentrations have declined to 50 ppb, contamination leaking
from the A aquifer acts as a continued source of contamination. Pumping has caused dewatering
of the shallow aquifer, and therefore, pumping in the A aquifer has been reduced to a minimum.
Pumping continues in areas with concentrations of less than 50 ppb, but no change in
concentrations has been observed.
10
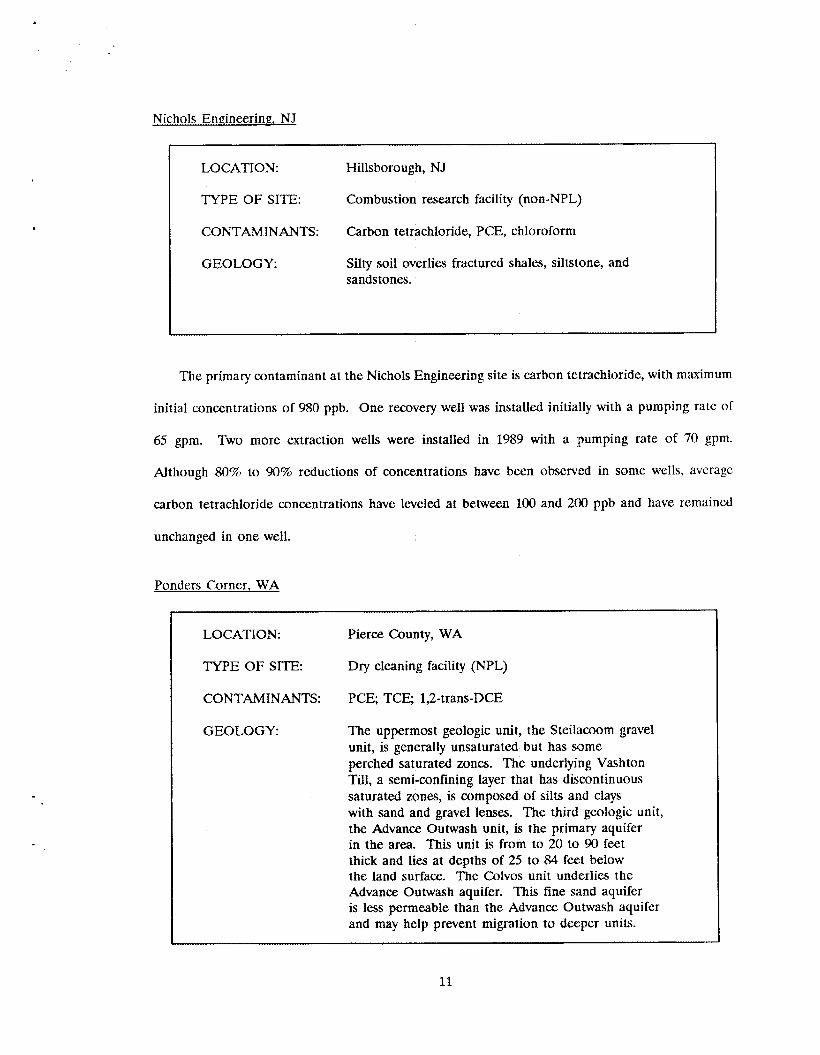
Nichols Engineering, NJ
LOCATION: Hillsborough, NJ
TYPE OF SITE:
CONTAMINANTS: Carbon tetrachloride, PCE, chloroform
GEOLOGY.
Combustion research facility (non-NPL)
Silty soil overlies fractured shales, siltstone, and sands tones.
The primary contaminant at the Nichols Engineering site is carbon tetrachloride, with maximum
initial concentrations of 980 ppb. One recovery well was installed initially with a pumping rate of
65 gpm. Two more extraction wells were installed in 1989 with a pumping rate of 70 gpm.
Although 80% to 90% reductions of concentrations have been observed in some wells, averagc
carbon tetrachloride concentrations have leveled at between 100 and 200 ppb and have remained
unchanged in one well.
Ponders Corner. WA
LOCATION: Pierce County, WA
W E OF SITE: Dry cleaning facility (NPL)
CONTAMINANTS: PCE; TCE; 1,2-trans-DCE
GEOLOGY: The uppermost geologic unit, the Steilacoom gravel unit, is generally unsaturated but has some perched saturated zones. The underiying Vashton Till, a semi-confining layer that has discontinuous saturated zones, is composed of silts and clays with sand and gravel lenses. The third geologic unit, the Advance Outwash unit, is the primary aquifer in the area. This unit is from to 20 to 90 feet thick and lies a t depths of 25 to 84 feet below the land surface. The Colvos unit undcrlies the Advance Outwash aquifer. This fine Sand aquifer is less permeable than the Advance Outwash aquifer and may help prevent migration to deeper units.
11
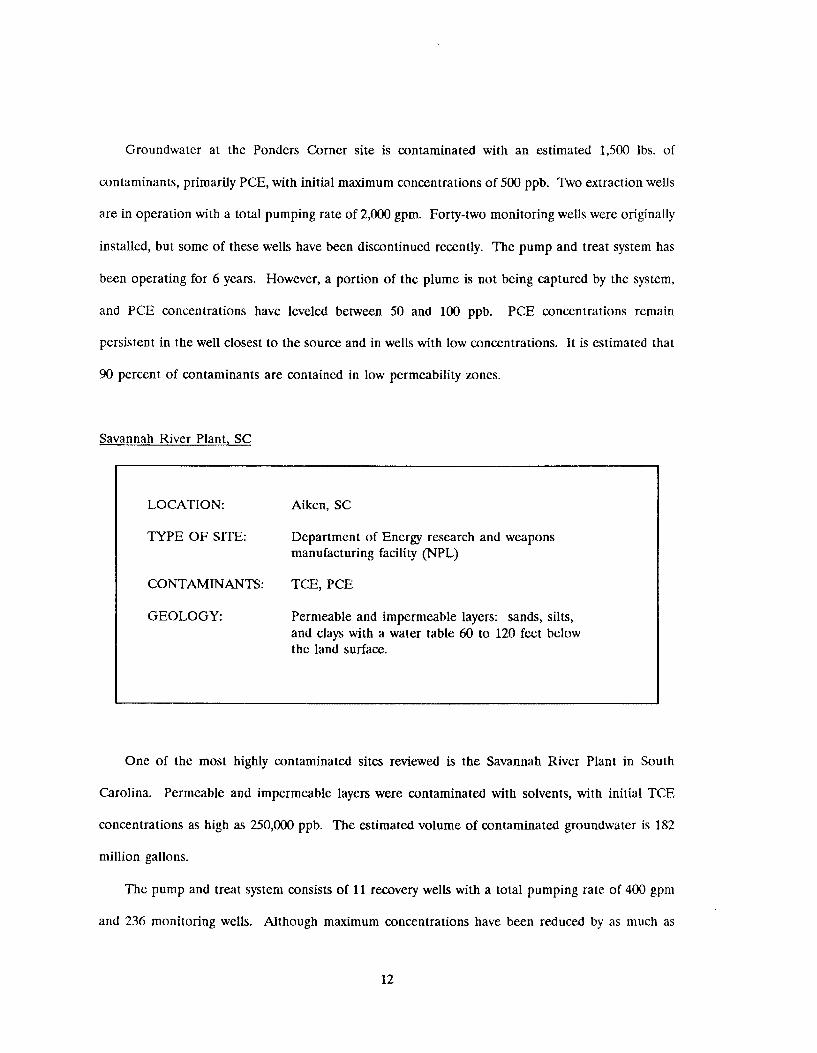
Groundwater at the Ponders Corner site is contaminated with an estimated 1,500 lbs. of
contaminants, primarily PCE, with initial maximum concentrations of 500 ppb. Two extraction wells
are in operation with a total pumping rate of 2,000 gpm. Forty-two monitoring wells were originally
installed, but some of these wells have been discontinued recently. The pump and treat system has
been operating for 6 years. However, a portion of the plume is not being captured by the system,
and PCE concentrations have leveled between 50 and 100 ppb. PCE concentrations remain
persistent in the well closest to the source and in wells with low concentrations. It is estimated that
90 percent of contaminants are contained in low permeability zones.
Savannah River Plant, SC
LOCATION: Aiken, SC
TYPE OF SITE: Department of Energy research and weapons manufacturing facility (NPL)
CONTAMINANTS: TCE, PCE
GEOLOGY: Permeable and impermeable layers: sands, silts, and clays with a water table 60 to 120 fcet below the land surface.
One of the most highly contaminated sites reviewed is the Savannah River Plant in South
Carolina. Permeable and impermeable layers were contaminated with solvents, with initial TCE
concentrations as high as 250,OOO ppb. The estimated volume of contaminated groundwater is 182
million gallons.
The pump and treat system consists of 11 recovery wells with a total pumping rate of 400 gpm
and 236 monitoring wells. Although maximum concentrations have been reduced by as much as
12
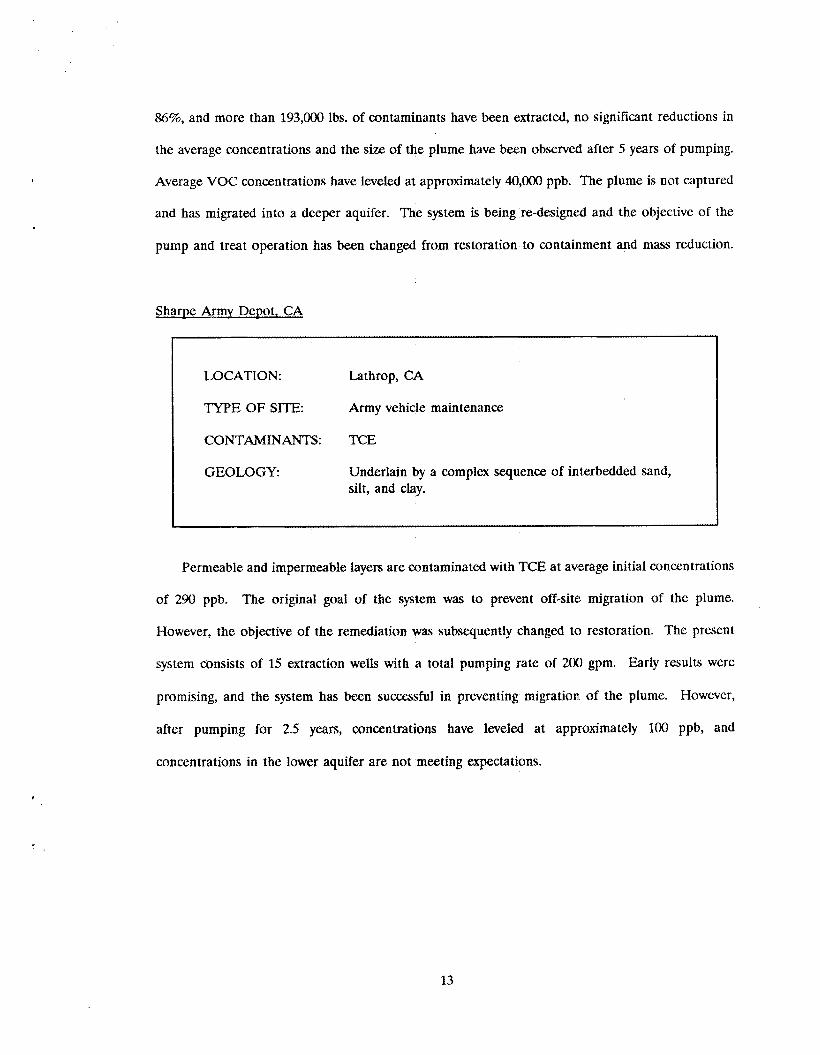
86%, and more than 193,000 lbs. of contaminants have been extracted, no significant reductions in
the average concentrations and the size of the plume have been observed after 5 years of pumping.
Average VOC concentrations have leveled at approximately 40,000 ppb. The plume is not captured
and has migrated into a deeper aquifer. The system is being re-designed and the objective of the
pump and treat operation has been changed from restoration to containment and mass reduction.
Sharpe Armv Depot. CA
LOCATION : Lathrop, CA
TYPE OF SITE:
CONTAMINANTS: TCE
GEOLOGY
Army vehicle maintenance
Underlain by a complex sequence of interbedded sand, silt, and clay.
Permeable and impermeable layers are contaminated with TCE at average initial concentrations
of 290 ppb. The original goal of the system was to prevent off-site migration of the plume.
However, the objective of the remediation was subsequently changed to restoration. The present
system consists of 15 extraction wells with a total pumping rate of 200 gpm. Early results were
promising, and the system has been successful in preventing migration of the plume. However,
after pumping for 2.5 years, concentrations have leveled at approximately 100 ppb, and
concentrations in the lower aquifer are not meeting expectations.
13
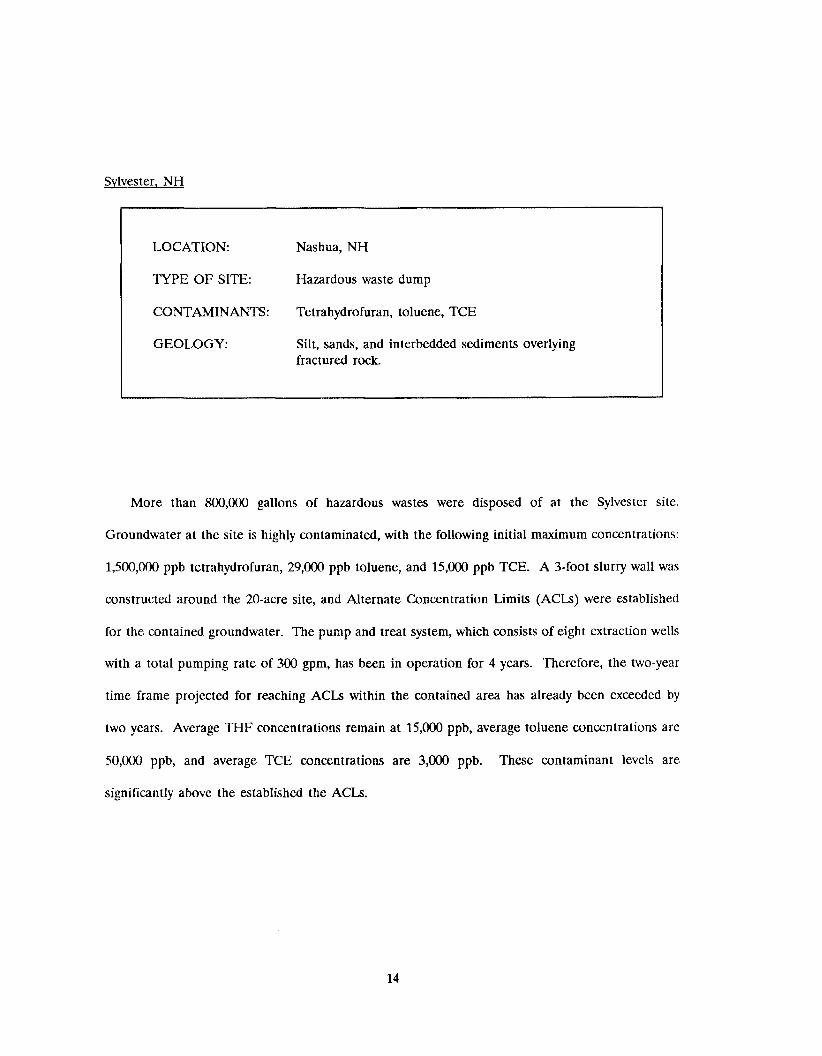
Svlvester, NH
LOCATION: Nashua, NH
TYPE OF SITE:
CONTAMINANTS: Tetrahydrofuran, toluene, TCE
GEOLOGY:
Hazardous waste dump
Silt, sands, and interbedded sediments overlying fractured rock.
More than 800,000 gallons of hazardous wastes were disposed of at the Sylvester site.
Groundwater at the site is highly contaminated, with the following initial maximum concentrations:
1,500,000 ppb tetrahydrofuran, 29,000 ppb toluene, and 15,000 ppb TCE. A 3-foot slurry wall was
constructed around the 20-acre site, and Alternate Concentration Limits (ACLs) were established
for the contained groundwater. The pump and treat system, which consists of eight extraction wells
with a total pumping rate of 300 gpm, has been in operation for 4 years. Therefore, the two-year
time frame projected for reaching ACIs within the contained area has already been exceeded by
two years. Average THF concentrations remain at 15,000 ppb, average toluene concentrations are
50,000 ppb, and average TCE concentrations are 3,000 ppb. These contaminant levels are
significantly above the established the ACLs.
14
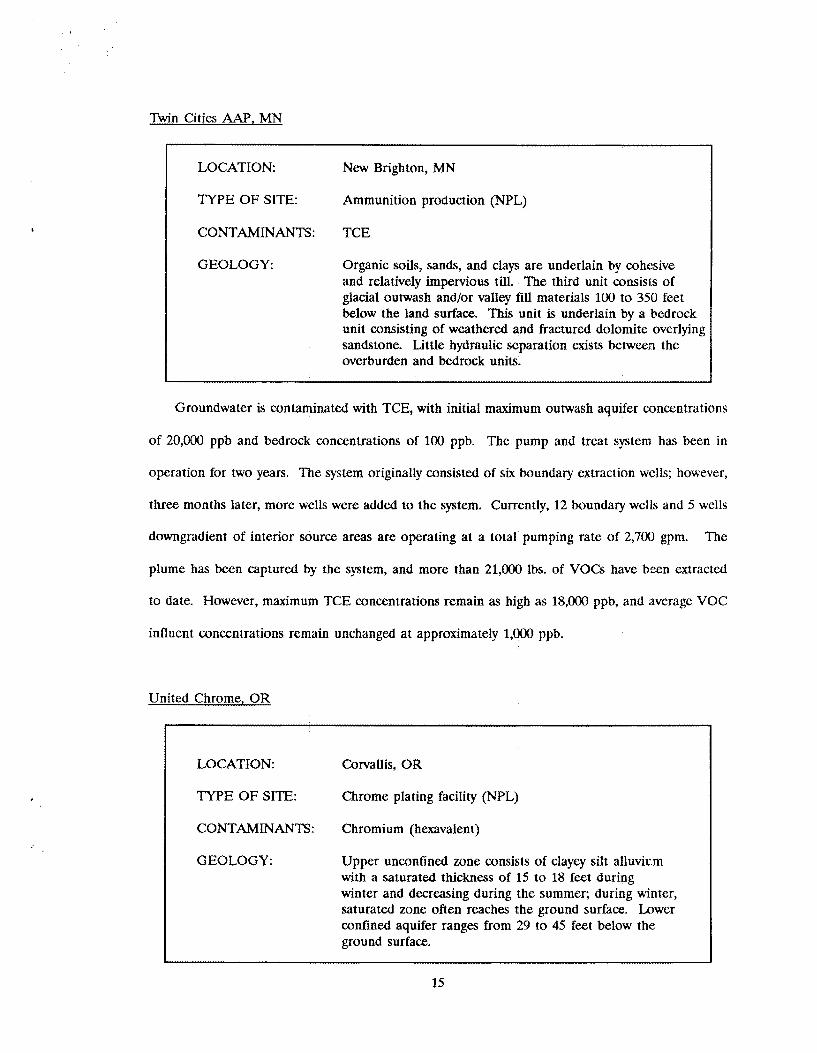
Twin Cities A A P , MN
I
Groundwater is contaminated with TCE, with initial maximum outwash aquifer concentrations
of 20,000 ppb and bedrock concentrations of 100 ppb. The pump and treat system has been in
operation for two years. The system originally consisted of six boundary extraction wells; however,
three months later, more wells were added to the system. Currently, 12 boundary wells and 5 wells
downgradient of interior source a r m are operating at a total pumping rate of 2,700 gpm. The
plume has been captured by the system, and more than 21,000 lbs. of VOCs have been extracted
to date. However, maximum TCE concentrations remain as high as 18,OOO ppb, and average VOC
influent concentrations remain unchanged at approximately 1,OOO ppb.
United Chrome. OR
LOCATION: New Brighton, MN
TYPE OF SITE: Ammunition production (NPL)
CONTAMINANTS: TCE
GEOLOGY: Organic soils, sands, and clays are underlain by cohesive and relatively impervious till. The third unit consists of glacial outwash and/or valley fill materials 100 to 350 leet below the land surface. This unit is underlain by a bedrock unit consisting of weathered and fractured dolomite overlying sandstone. Little hydraulic separation exists between the overburden and bedrock units.
LOCATION: Cowallis, OR
TYPE OF SITE:
CONTAMINANTS: Chromium (hexavalent)
Chrome plating facility (NPL)
GEOLOGY: Upper unconfined zone consists of clayey silt alluvium with a saturated thickness of 15 to 18 feet during winter and decreasing during the summer; during winter, saturated zone often reaches the ground surface. Lower confined aquifer ranges from 29 to 45 feet below the ground surface.
15
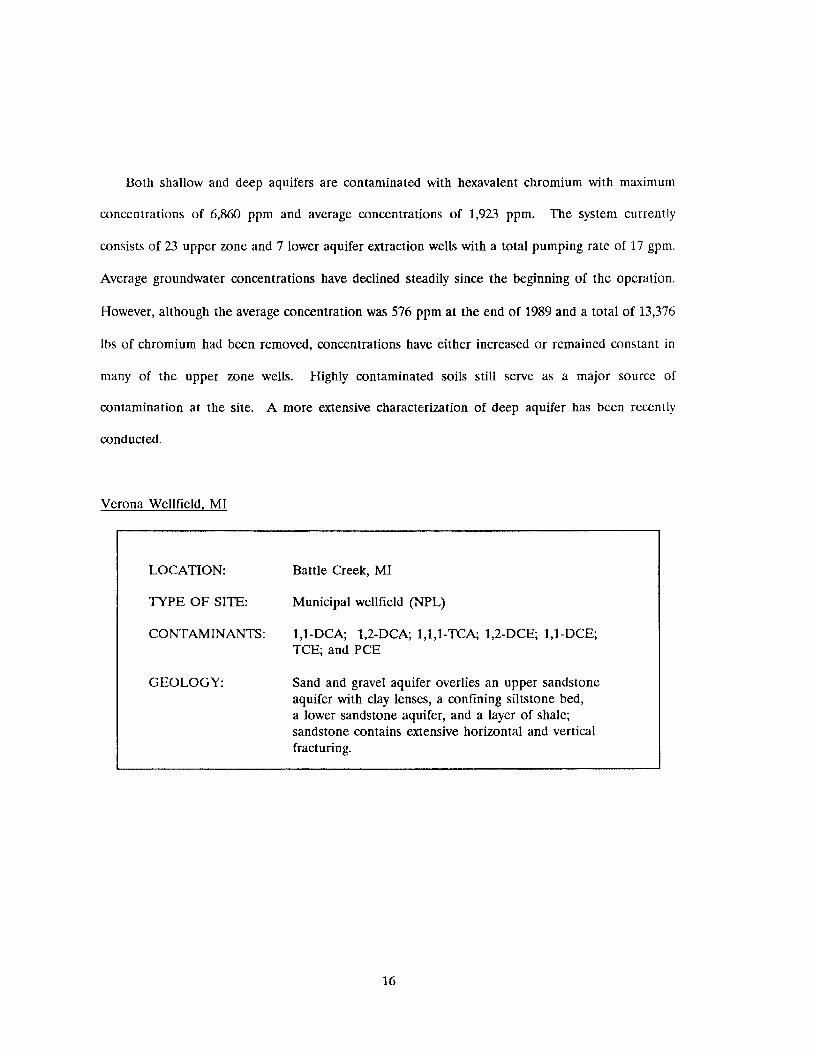
Both shallow and deep aquifers are contaminated with hexavalent chromium with maximum
concentrations of 6,860 ppm and average concentrations of 1,923 ppm. The system currently
consists of 23 upper zone and 7 lower aquifer extraction wells with a total pumping rate of 17 gpm.
Average groundwater concentrations have declined steadily since the beginning of the operation.
However, although the average concentration was 576 ppm at the end of 1989 and a total of 13,376
Ibs of chromium had been removed, concentrations have either increased or remained constant in
many of the upper zone wells. Highly contaminated soils still serve as a major source of
contamination at the site. A more extensive characterization of deep aquifer has been recently
conducted.
Verona Wellfield, MI
LOCATION: Battle Creek, MI
TYPE OF SITE: Municipal wellfield (NPL)
CONTAMINANTS: l,l-DCA, 1,2-DC& l,l,l-TCA, 1,2-DCE; 1,l-DCE; T C E and PCE
GEOLOGY: Sand and gravel aquifer overlies an upper sandstone aquifer with clay lenses, a confining siltstone bed, a lower sandstone aquifer, and a layer of shale; sandstone contains extensive horizontal and vertical fracturing.
16
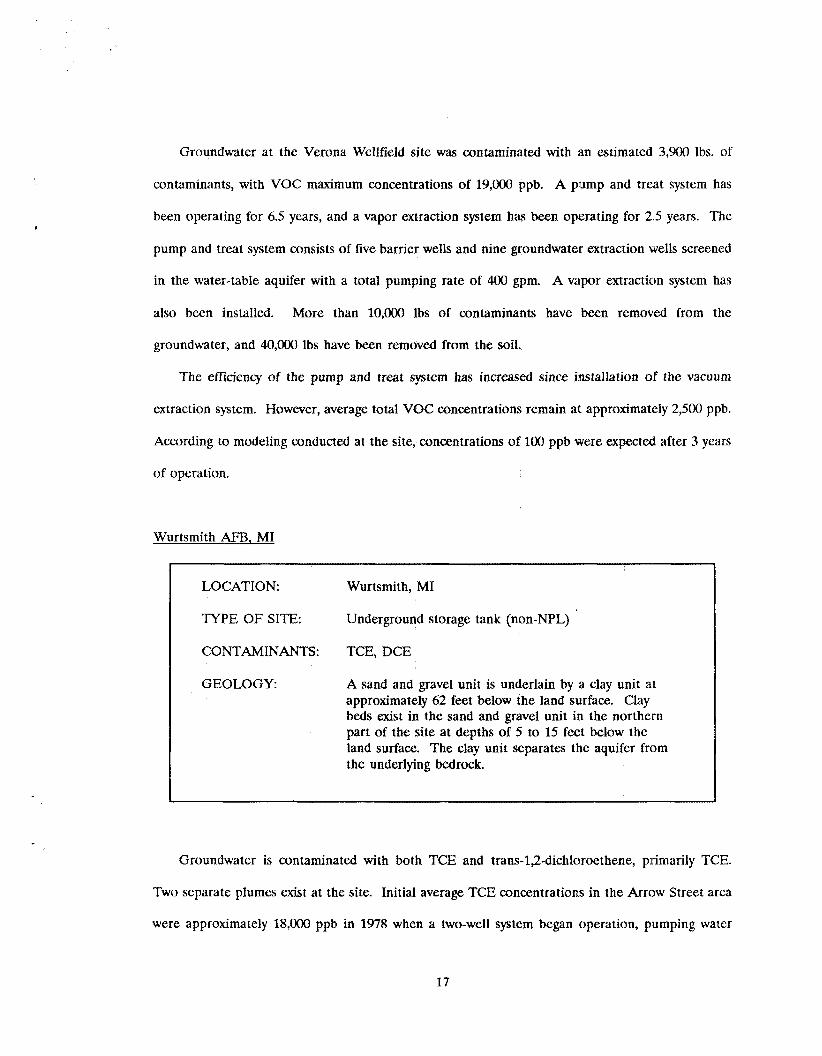
Groundwater at the Verona Wellfield site was contaminated with an estimated 3,900 lbs. of
contaminants, with VOC maximum concentrations of 19,000 ppb. A pump and treat system has
been operating for 6.5 years, and a vapor extraction system has been operating €or 2.5 years. The
pump and treat system consists of five barrier wells and nine groundwater extraction wells screened
in the water-table aquifer with a total pumping rate of 400 gpm. A vapor extraction system has
also been installed. More than 10,OOO lbs of contaminants have been removed from the
groundwater, and 40,OOO Ibs have been removed from the soil.
The efficiency of the pump and treat system has increased since installation of the vacuum
extraction system. However, average total VOC concentrations remain at approximately 2,500 ppb.
According to modeling conducted at the site, concentrations of 100 ppb were expected after 3 years
of operation.
Wurtsmith AFB, MI
LOCATION: Wurtsmith, MI
TYPE OF SITE: Underground storage tank (non-NPL)
CONTAMINANTS: TCE, DCE
GEOLOGY: A sand and gravel unit is underlain by a clay unit at approximately 62 feet below the land surface. Clay beds exist in the sand and gravel unit in the northern part of the site at depths of 5 to 15 feet below the land surface. The clay unit separates the aquifer from the underlying bedrock.
Groundwater is contaminated with both TCE and trans-1,2-dichloroethene, primarily TCE.
Two separate plumes exist a t the site. Initial average TCE concentrations in the Arrow Street area
were approximately 18,000 ppb in 1978 when a two-well system began operation, pumping water
17
into an aeration reservoir. In 1982, the Arrow Street Purge Well System was installed with a
pumping rate of 1200 gpm. Concentrations in this area have been reduced to approximately 70 ppb
over a period of 12 years. The Mission Street system, a separate system installed in 1988, consists
of five extraction wells at a pumping rate of 220 gpm. Concentrations in this area have been
reduced from 800 ppb to between 500 and 700 ppb after two years of pumping.
3.0 INDICATORS OF PUMP AND TREAT EFFECTIVENESS
3.1 Reduction of Aquifer Concentrations Over Time
The reduction of aquifer concentrations over time is the primary indicator of the effectiveness
of a pump and treat system in restoring an aquifer to a specified cleanup level. The ideal scenario
would be a steady decrease in contaminant concentrations until the target level is attained.
However, performance records have suggested that although concentrations may drop initially, this
decline is followed by a leveling of concentrations with little or no further decrease in
coilcentrations (EPA 1989).
For the purpose of characterizing concentration leveling patterns, we examined the relationship
between initial concentration and leveling concentration for sites where concentrations have
declined sharply and remained constant for periods of six months to several years (Table 1). These
sites have performance records of 2 to 12 years and initial concentrations ranging from 5 ppb to
250,000 ppb. The analysis is based on the comparison of both maximum and average initial
concentrations to the average concentrations at which leveling occurred. This approach may
overestimate the reduction of maximum concentrations but provides a reasonable basis for
comparison to average concentration reductions.
18
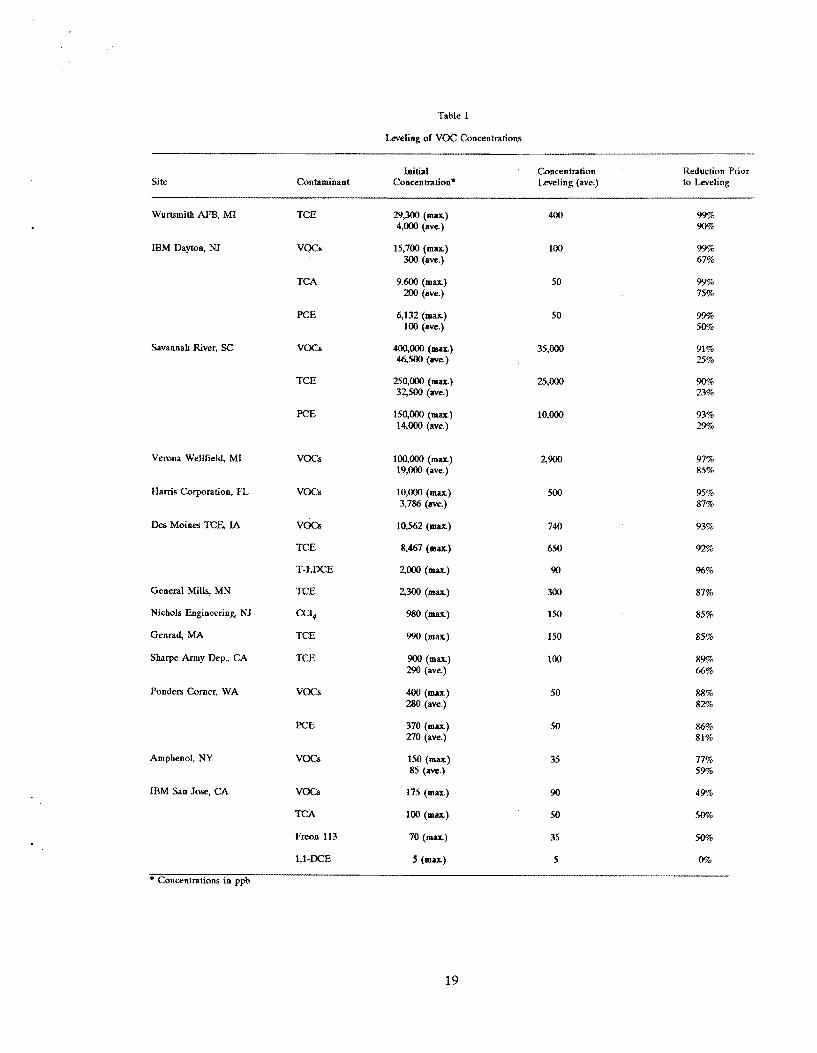
Table 1
Leveling of VOC Concentrations
Site Initial
Contaminant Coacentration' Concentration Reduction Prior Leveling (ave.) lo Leveling
Wurtsmith AFB, MI TCE
IBM Dayton, NJ VOCS
TCA
29300 (mag) 4,000 (ave.)
15,700 (mag) 300 (ave.)
9,600 (max) 200 (aye.)
Savannah River, SC
PCE
VOCS
TCE
PCE
Verona Wellfield, MI V O G
H a m s Corporation, FL V O G
Des Moines TCE IA VOCS
TCE
T-1,DCE
General Mills, MN TCE
Nichols IEsgineering, NJ CCI,
Genrad, MA TCE
Slwrpe Army Dep., CA TCE
Ponders Corner, WA VOCS
PCE
Amphenol, NY
IBM San Jose, CA
VOCS
VOCS
TCA
Freon 113
1,l-DCE
* Concenmtions in ppb
6,132 (ma) 100 (aye.)
400 99% 90%
100
50
50
3 0 , m (-) 3 2 9 0 (ave.)
1 5 0 , m (max) 14,000 (ave.)
100,OOo (mar) 19,000 (eve.)
10,000 (-) 3,786 (ave.)
25.m
1o.ooo
500
900 (ma) 290 (ave)
400 (mix) 280 (ave.)
370 (mar) 270 (ave.)
150 ( m a ) 85 (aw.)
100
50
50
35
99% 67%
99% 75%
99% 50%
91% 25%
90% 23%
93% 29%
97% 85%
95% 87%
93%
92%
%%
87%
85%
85%
89% 66%
88% 8-235
86% 81%
77% 5%
49%
50%
50%
0%
19
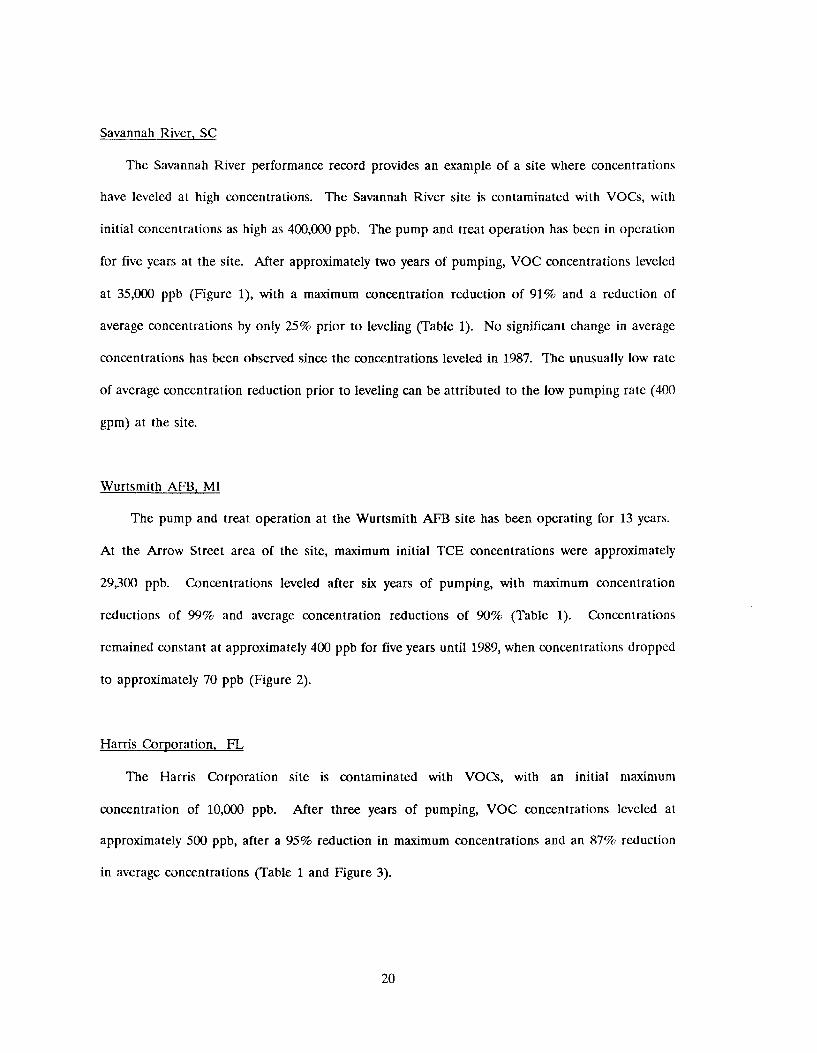
Savannah River, SC
The Savannah River performance record provides an example of a site where concentrations
have leveled at high concentrations. The Savannah River site is contaminated with VOCs, with
initial concentrations as high as 400,000 ppb. The pump and treat operation has been in operation
for five years at the site. After approximately two years of pumping, VOC concentrations leveled
at 35,000 ppb (Figure l) , with a maximum concentration reduction of 91% and a reduction of
average concentrations by only 25% prior to leveling (Table 1). No significant change in average
concentrations has been observed since the concentrations leveled in 1987. The unusually low rate
of average concentration reduction prior to leveling can be attributed to the low pumping rate (400
gpm) at the site.
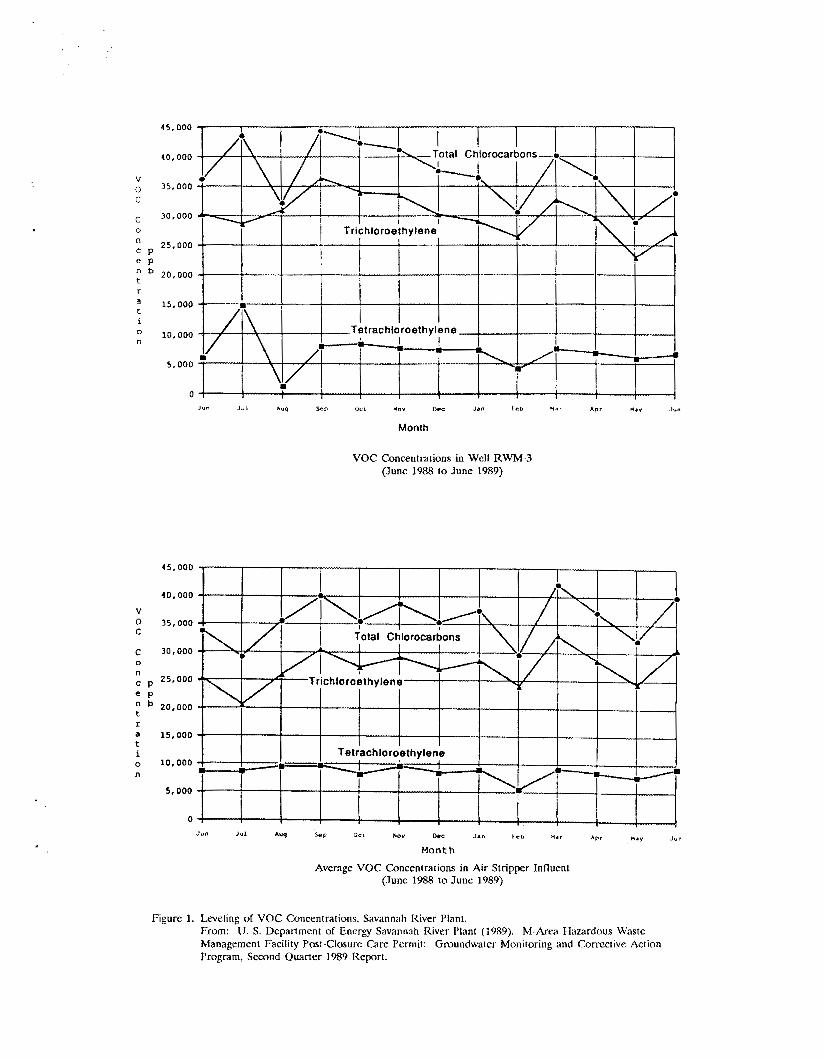
Wurtsmith AFB. MI
The pump and treat operation at the Wurtsmith AFB site has been operating for 13 years.
At the Arrow Street area of the site, maximum initial TCE concentrations were approximately
29,300 ppb. Concentrations leveled after six years of pumping, with maximum concentration
reductions of 99% and average concentration reductions of 90% (Table 1). Concentrations
remained constant at approximately 400 ppb for five years until 1989, when concentrations droppcd
to approximately 70 ppb (Figure 2).
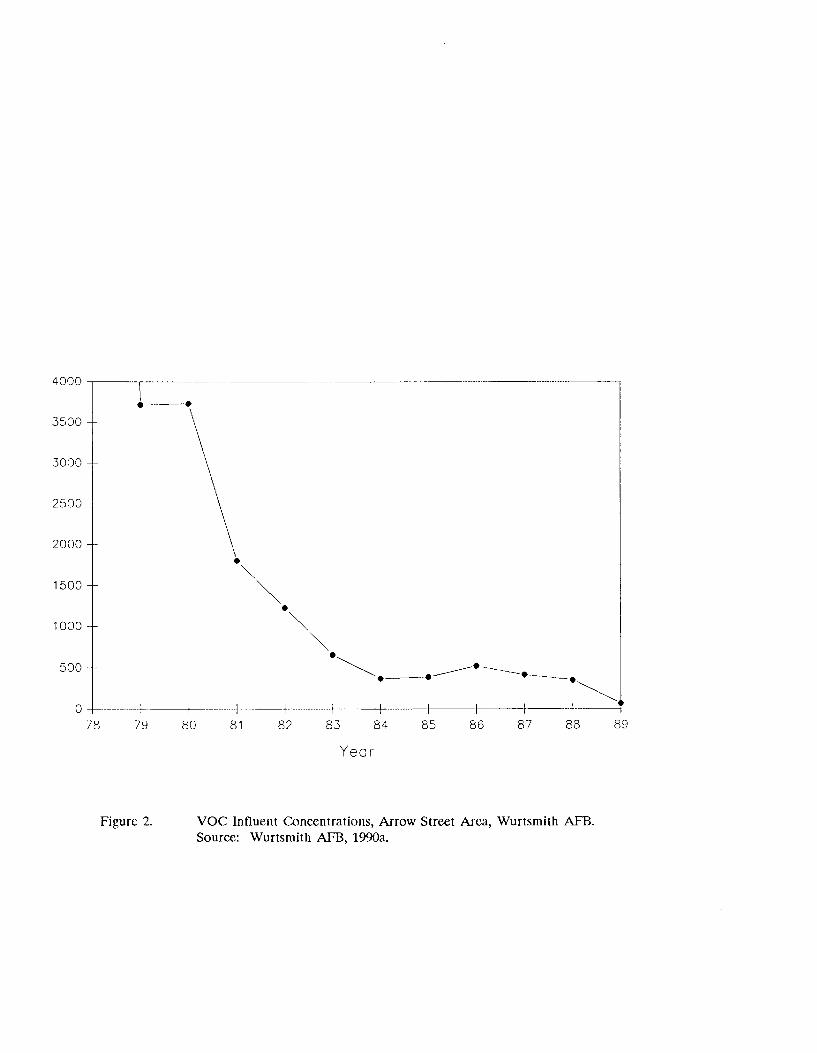
Harris Corporation, FL
The Harris Corporation site is contaminated with VOCF, with an initial maximum
concentration of 10,OOO ppb. After three years of pumping, VOC concentrations leveled at
approximately 500 ppb, after a 95% reduction in maximum concentrations and an 87% reduction
in average concentrations (Table 1 and Figure 3).
20
45.000
10.000
v
C 0 35,000
30.000
0
25,000 C P e p
20,000
f
a 15,000
i
10,000
5 . 0 0 0
0
V O C Concent ra t ions in Well R W M J (June 1988 t o J u n e 1989)
V 0 C
C
n C P
n b t r a t i 0
n
0
e p
45.000
40,000
35,000 +
25,000 4. r
20.000 -.
10,000 .-=----/ 5.000 --
0 1 i
Juri J u l A w S.P OcL Now Dac Jan teb M A , hPr J~~
Month
A v e n g e V O C Concentrations in A r Stnpper Influent ( June 1988 t o J u n e 1989)
F igure 1. Leveling o l V O C Concent ra t ions , Savannah River Plani. From: [J. S. Depar tment of Energy Savannah River Plant (1989). M-Area Hazardous Waste Managemen t Facility Pos t -Closure C a r e Permit: Groundwdter Moni tor ing and Correcl ive Action Pmgnrn, Second Q u a r t e r 1989 Report.
78 79 80 81 82 83 84 85 86 87 88 89
Year
Figure 2. VOC Influent Concentrations, Arrow Street Area, Wurtsmith AFB. Source: Wurtsmith AFB, 1990a.
681111
c
9p/Lll -
9WLIL
981Lll
SB
lllL - fi
1-
1-
1-
*
.,
.,
-/
-a
.
a.
,.
,
J-0
00
00
00
00
00
0
00
00
00
00
00
0
00
~
rn
OD
X~
X8
~F
Js
:
m
c3 c. .&
2
IBM Dayton. NJ
Initial maximum VOC concentrations at the IBM Dayton site concentrations were 15,700 ppb.
Concentrations decreased to approximately 500 ppb after four years of pumping, increased slightly,
and then leveled at approximately 100 ppb for several years prior to the discontinuation of the
operations. Leveling of maximum concentrations took place after a reduction of 99% (Table 1).
However, an average concentration reduction of only 67% was observed. When the pumps were
turned on again two years later, PCE concentrations rose to over 13,000 ppb (Figure 4).
Amphenol, NY
The Amphenol site is a small site with initial VOC concentrations of 150 ppb. Although the
contaminated soil was removed prior to the installation of the pump and treat system,
concentrations leveled at approximately 35 ppb after one year of pumping (Figure 5). An average
concentration reduction of 59% was attained prior to concentration leveling (Table 1).
3.1.1 Leveling Patterns
Leveling has taken place at 13 of the sites reviewed. Two of the sites involving organic
constituents did not have available performance records that were complete enough for an analysis
of concentration leveling. The performance record for the United Chrome site indicates a steady
decline in concentrations since the beginning of the operation. However, chromium concentrations
were 576 ppm at the end of 1989.
The concentration at which leveling occured and the point in the performance record that i t
occured varied, depending on site-specific factors such as the system design, the characteristics of
the chemicals present, and the site conditions. However, several trends in concentration leveling
were observed. Although a 99% reduction of maximum concentrations was attained prior to
24
88 88 L8 L8 98 98 S8 ar rr ar rr ar rr ar
_.
Si8P8P8&8&8282818 C808086L6L8L8L rr ar rr ur rr ar rr ar rr ur rr ar rr or rr
t
0 00s 000 c 00s c 0002 oosz OOOE OOS& OOOP 00SP 000s 00%
i OOSE c 1
OOOP 1
350
300 - a n 250 6 0 I
c
2 200 C
C 0
0
s 0 150
P 5 100 : -
50
0 1984 1985 1986 1987 1988
300
250
B n 9 200 c 0 - - 2 8 150 c C
C
6 0
100 m c 0 +
50
0
1983 1984 1985 1986 1987 1988
Figure 5. VOC Concentrations in Shallow Aquifer Wells 17-S and 1-S, Amphenol Corporation Site. From: EPA 1989.
leveling at some sites, the greatest reduction of average concentrations at a site was 90%. The
following patterns in concentration leveling were observed:
0 At all sites with maximum initial concentrations greater than 10,OOO ppb, the concentrations leveled after maximum concentration reductions O S 90% to 99%.
D Reduction of average concentrations ranged from 23% to 90% at sites with maximum concentrations greater than 10,OOO ppb.
0 At sites with initial maximum concentrations of 1,OOO ppb to 10,OOO ppb, leveling occurred after maximum concentration reductions of 85% to 99%. Reductions of average concentrations at these sites ranged from 50% to 87%.
D At sites with initial maximum concentrations between 109 ppb and 1,OOO ppb, reductions in maximum concentrations range from 49% to 89%. Reductions of average concentrations ranged from 59% to 82%.
0 At sites with initial maximum concentrations of 100 ppb, concentrations IeveIed after 0% to 50% reductions in concentrations.
Leveling patterns in the performance records reviewed illustrate the ineffectiveness of
groundwater extraction in reducing average concentrations more than 90%. Even though leveling
may take place at or near the cleanup goal (see Section 3.4), significant masses of contamination
remain in the aquifer, and when pumps are turned off, concentrations rise again. Once
concentrations level at a site, further significant reduction in concentrations is unlikely and cannot
be accomplished within a reasonable time frame.
3.2 Capture and Containment of Contaminant Plume
An essential objective of pump and treat operations implemented for aquifer restoration is
capture and containment of the contaminant plume. At the sites reviewed, analysis indicates that
pumping can effectively contain the contaminant plume at most sites. At 75% of the sites reviewed,
the performance record indicated that the plume is being effectively contained.
27
The Savannah River site is the only site reviewed with evidence of significant contaminant
migration since the beginning of the operation. At this site, the plume is not contained, and
contamination has migrated to lower aquifers. Although more than 168,OOO lbs of contaminants
have been extracted, the pumping rate of 400 gpm has proven to be inadequate for capturing the
plume. Migration may also be attributable to the puncturing of the confining layer between the A
and R aquifers and subsequent mobilization of perched NAPLs to deeper aquifers. The system has
been recently re-designed with the objectives of containment and mass reduction.
At the Ponders Corner, IBM San Jose, and Harris Corporation sites, small portions of the
plumes are not captured. At the IBM San Jose site, a small portion of the onsite plume does not
appear to be captured, but is thought to be captured by the offsite wells. Likewise, at the Harris
Corporation the portion of the plume not captured by the onsite system is captured by the wellhead
treatment system on the adjoining property. A low-level portion of the plume is not captured at
the Ponders Corner site.
The performance records reviewed indicate that adequate hydraulic plume containment is
feasible using pump and treat systems at most sites. However, problems be may associated with
pumping at the high rates needed for plume containment in some cases. Pumping at a rate high
enough to contain a plume may result in aquifer dewatering and the recovery of larger amounts of
mildly contaminated water to be treated.
3.3 Reduction of Contaminant Mass
Initial estimates of the contaminant mass present in the groundwater and cumulative measures
of the mass extracted are often part of site performance records. These data can be useful for some
purposes. However, the performance records reviewed indicate that these data are of limited use
in determining the overall effectiveness of pumping in meeting cleanup objectives.
28
3.3.1 ComDarison of Mass Estimates to Mass Extracted
Few of the sites reviewed documented both an initial estimate of the mass or volume of
contaminants present in the groundwater and a summary of the mass of chemicals extracted to date
(Table 2). Of the four sites for which such information is available, the initial inventory of
contaminants was grossly underestimated. At the Verona Wellfeld site, more than twice the
originally estimated mass of contaminants has been extracted to date. At the Des Moines TCE site,
concentrations have leveled after extraction of more than seven times the volume of contamination
estimated to be present in both soil and groundwater.
At the Savannah River site, the original estimate has already been exceeded by more than a
factor of three, and concentrations have leveled after less than half the revised inventory of
contaminants have been extracted. This site is the only site reviewed where estimates of
contaminant mass were updated after the initial estimate was made. However, a mass inventory
analysis conducted in 1988 indicates that the revised estimate of 460,ooO Ibs is also inaccurate.
Although air stripper mass-balance calculations showed that 138,OOO lbs had been removed, the
inventory indicated that 441,OOO lbs were still present in the groundwater. Therefore, the latest
estimate indicates an original contaminant mass of 580,000 lbs.
3.3.2 Mass Reduction a. Concentration Reduction
Considerable reductions in the contaminant mass were being attained during the early stages
of the operation at the sites reviewed (Table 2). However, reductions in contaminant mass are not
indicators of reductions in aquifer concentrations. Although more than 193,000 lbs of VOCs have
been extracted at the Savannah River site, average concentrations have leveled after reduction of
25%. At the Twin Cities AAP site, average concentrations remain unchanged after the extraction
of more than 19,510 pounds of VOeS (Tables 2 and 3). At the IBM San Jose site, 84 lbs of 1,l-
DCE have been extracted with no reduction in groundwater concentrations.
29
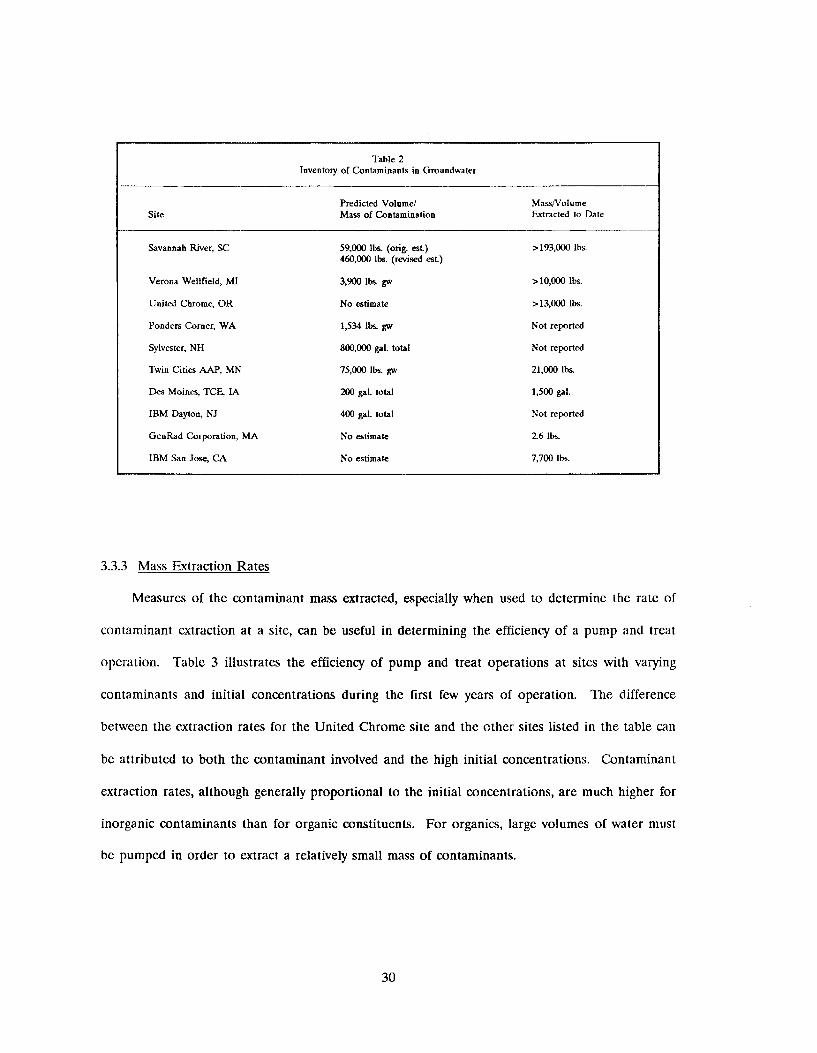
Table 2 Inventoty of Contaminants in Groundwater
MassNolume Predicted Volume/ Site M a s of Contamination Extracted to Date
Savannah River, SC 59,000 I b s (on& est.) >193,000 Ik. 460,000 lbs. (revised est)
Verona Wellfield, MI 3,900 lbs. gw >10,000 Ik.
United Chrome, OR No estimate >13,OOO lbs.
Ponders Comer, WA 1,534 Ibs. gw Not reported
Sylvester, NH 800,000 gal. total Not reported
Twin Cities AAP, MN 75,000 Ibs. gw 21,000 lbs
Des Moines, TCE, LA 200 gal. total 1,500 gal.
IBM Dayton, NJ 400 gal. total Not reported
GenRad Corporation, MA No estimate 2 6 lbs.
IBM San Jose, CA No estimate 7,700 Ik.
3.3.3 Mass Extraction Rates
Measures of the contaminant mass extracted, especially when used to determine the rate of
contaminant extraction at a site, can be useful in determining the efficiency of a pump and treat
operation. Table 3 illustrates the efficiency of pump and treat operations at sites with varying
contaminants and initial concentrations during the first few years of operation. The difference
between the extraction rates for the United Chrome site and the other sites listed in the table can
be attributed to both the contaminant involved and the high initial concentrations. Contaminant
extraction rates, although generally proportional to the initial concentrations, are much higher for
inorganic contaminants than for organic constituents. For organics, large volumes of water must
be pumped in order to extract a relatively small mass of contaminants.
30
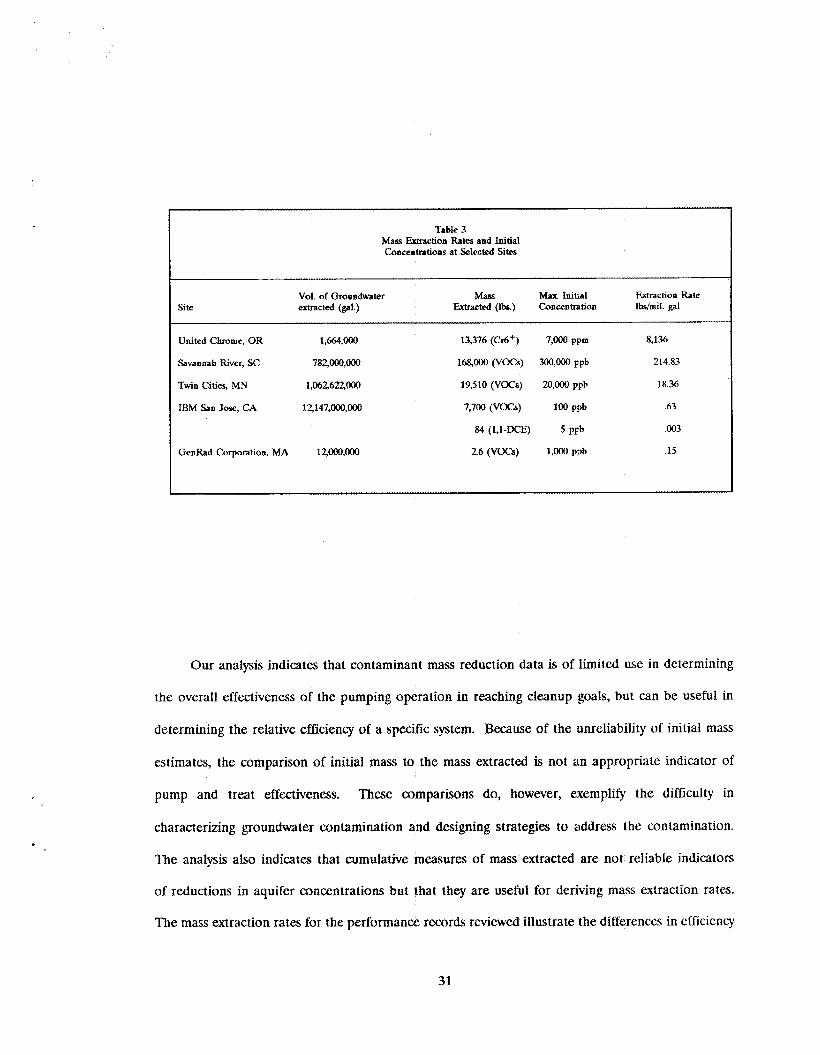
Table 3 Mass EEtrrction Rates and Initial Concentratians at Selected Sites
Site Vol. of Groundwater extracted (gal.)
M a Mar Initial Extraction Rate Ibdrnil. gal Extracted ( lb) Concentration
United Chrome, OR 1,664,000
Savannah River, SC 7Q000@0
Twin Cities, MN 1,W622000
IBM San Jose, CA 12,147,000,000
GenRad Corporation, MA lZOOO,000
13,376 (Cd+) 7,000 ppm
w o o 0 (VW) 3w000 PPb
19,510 (VOCs) 20,000 ppb
7,7W (vocs) 100 ppb
84 (1,l-WE) 5 ppb
26 (VOCS) Loo0 ppb
8,136
214.83
18.36
-63
,003
.15
Our analysis indicates that contaminant mass reduction data is of limited use in determining
the overall effectiveness of the pumping operation in reaching cleanup goals, but can be useful in
determining the relative efficiency of a specific system. Because of the unreliability of initial mass
estimates, the comparison of initial mass to the mass extracted is not an appropriate indicator of
pump and treat effectiveness. These comparisons do, however, exemplify the: difficulty in
characterizing groundwater contamination and designing strategies to address the contamination.
The analysis also indicates that cumulative measures of mass extracted are not reliable indicators
of reductions in aquifer concentrations but that they are useful for deriving mass extraction rates.
The mass extraction rates for the performance records reviewed illustrate the differences in efficiency
31
among systems and the difficulty of extracting
organic constituents at low concentrations.
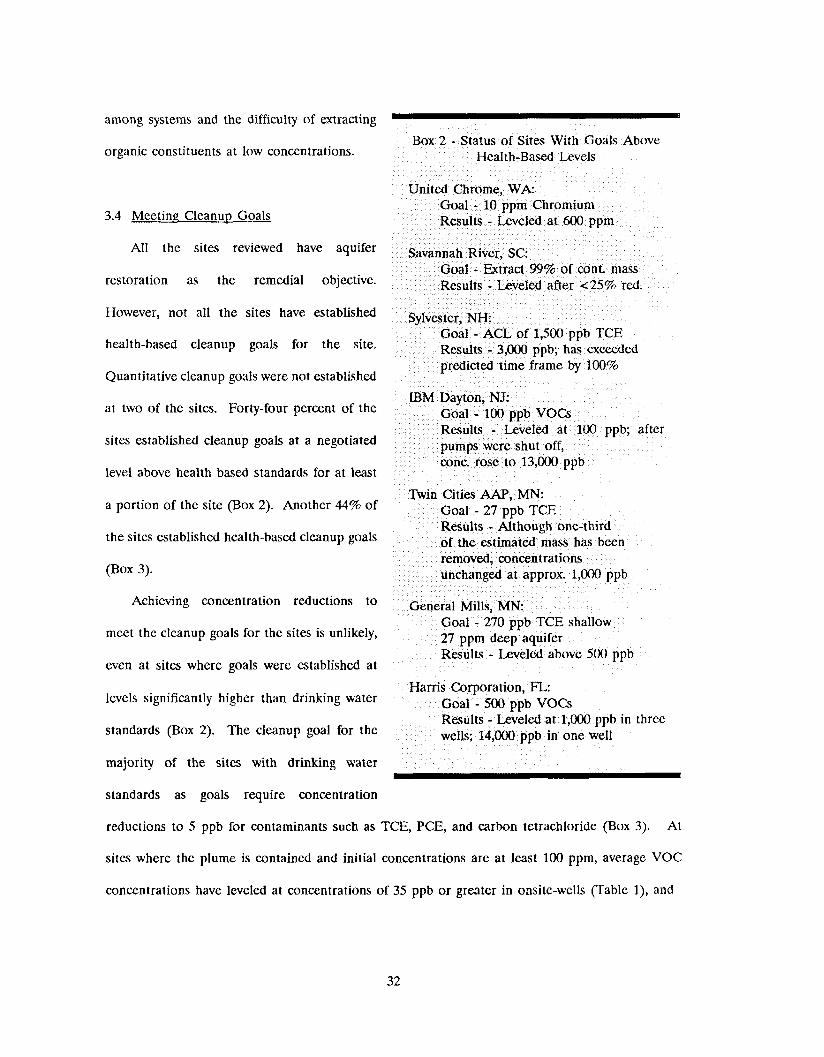
3.4 Meeting Cleanup Goals
All the sites reviewed have aquifer
restoration as the remedial objective.
However, not all the sites have established
health-based cleanup goals for the site.
Quantitative cleanup goals were not established
at two of the sites. Forty-four percent of the
sites established cleanup goals at a negotiated
level above health based standards for at least
a portion of the site (Box 2). Another 44% of
the sites established health-based cleanup goals
(Box 3).
Achieving concentration reductions to
meet the cleanup goals for the sites is unlikely,
even at sites where goals were established at
levels significantly higher than drinking water
standards (Box 2). The cleanup goal for the
majority of the sites with drinking water
standards as goals require concentration
r
led at 1,000 ppb in three
reductions to 5 ppb for contaminants such as TCE, PCE, and carbon tetrachloride (Box 3). At
sites where the plume is contained and initial concentrations are at least 100 ppm, average VOC
concentrations have leveled at concentrations of 35 ppb or greater in onsite-wells (Table l), and
32
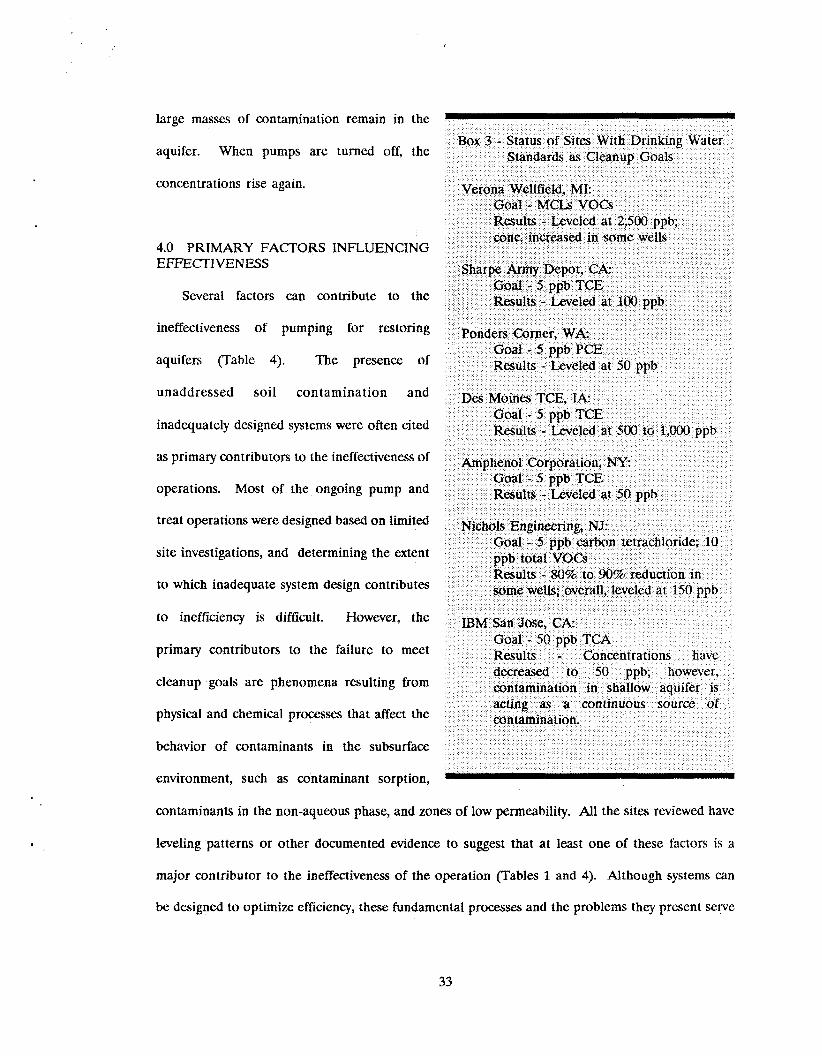
large masses of contamination remain in the
aquifer. When pumps are turned off, the
concentrations rise again.
4.0 PRIMARY FACTORS INFLUENCING EFFECTIVENESS
Several factors can contribute to the
ineffmiveness of pumping for restoring
aquifers (Table 4). The presence of
unaddressed soil contamination and
inadequately designed systems were often cited
as primary contributors to the ineffectiveness of
operations. Most of the ongoing pump and
treat operations were designed based on limited
site investigations, and determining the extent
to which inadequate system design contributes
to inefficiency is difficult. However, the
primary contributors to the failure to meet
cleanup goals are phenomena resulting from
physical and chemical processes that affect the
behavior of contaminants in the subsurface
environment, such as contaminant sorption,
contaminants in the non-aqueous phase, and zones of low permeability. All the sites reviewed have
leveling patterns or other documented evidence to suggest that a t least one of these factors is a
major contributor to the ineffectiveness of the operation (Tables 1 and 4). Although systems can
be designed to optimize efficiency, these fundamental processes and the problems they present serve
33
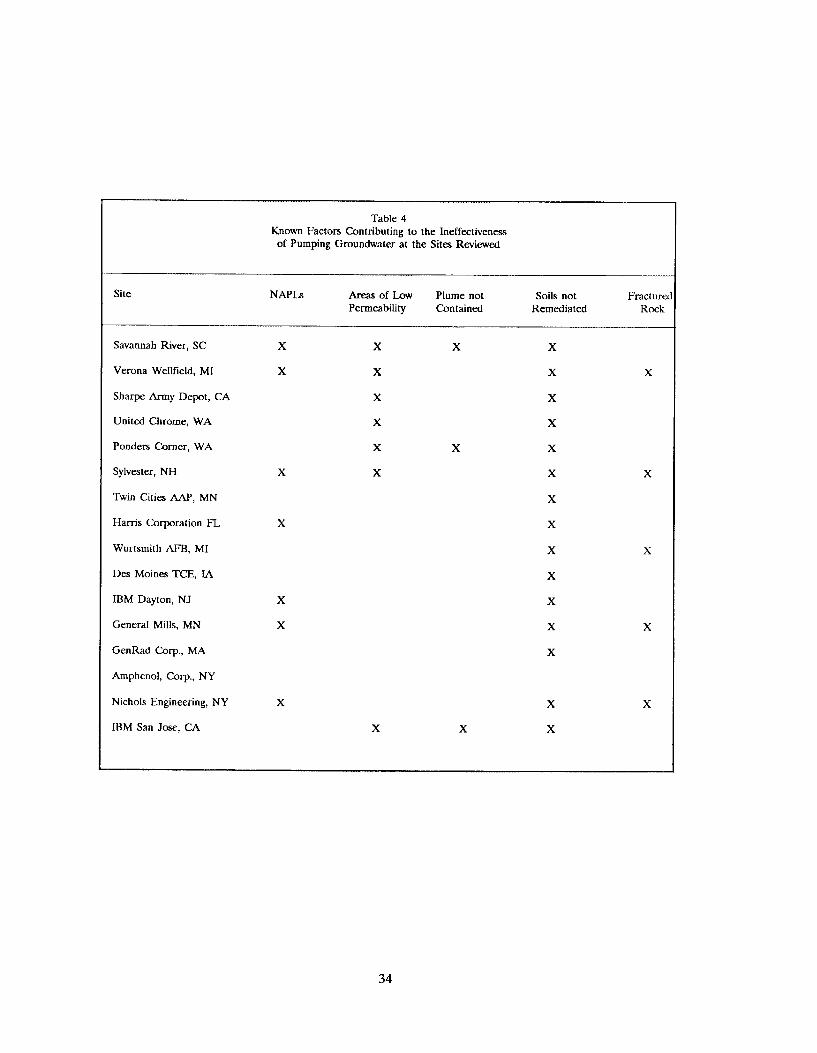
Table 4 Known Factors Contributing to the Ineffectiveness
of Pumping Groundwater at the Sites Reviewed
Site NAPLs Areas of Low Plume not Soils not Fracturec Permeability Contained Remediated Rock
Savannah River, SC X X X X
Verona Wellfield, MI X X X X
Sharpe Army Depot, CA
United Chrome, WA
Ponders Corner, WA
Sylvester, NH
Twin Cities AAP, MN
H a m s Corporation FL
Wurtsmitli r lFB, MI
Des Moines TCE, IA
IBM Dayton, NJ
General Mills, MN
GenRad Corp., MA
Amphenol, Corp., NY
Nichols Engineering, N Y
IRM San Jose, CA
X
X
X
X
X
X
X
X
X X X
34
to greatly increase the remedial time frame and may not be overcome by additional site
characterization and design modifications.
4.1 Continued Sources of Contamination
A major contributor to the ineffectiveness of pump and treat operations reviewed is the
presence of a continued source of groundwater contamination. These sources consist of
contaminated soils (the primary source), and immobilized contaminants in the vadose zone and
subsurface (secondary sources). The remediation of surface or subsurface soils had been completed
at only one of the sites reviewed (Table 4). Soils at the Amphenol Corporation had been excavated
prior to startup of the pump and treat operation (Figure 5). Although soils had been excavated at
the IBM San Jose site, significant vadose zone contamination was still suspected. Source
remediation is underway at most of the sites reviewed but has not been completed.
Although completion of soil remediation is likely to increase the effficiency of the systems, at
all the sites reviewed, contaminants sorbed to aquifer material, trapped in low permeability zones,
or pooled in the non-aqueous phase serve as a continued secondary source of contamination.
Because eliminating these secondary sources of contamination is technically infeasible at the present
time, this factor will continue to be the primary contributor to the ineffectiveness of pump and treat
systems, even after soil remediation is complete.
4.2 Contaminant Sorption and Desorution
Contaminants in groundwater partition between the water and organic matter in soils. Organic
contaminants tend to preferentially sorb to the aquifer material, causing a reduction of the mobility
of the contaminants relative to the flow of the groundwater. As groundwater is pumped, the
chemicals are held back (retarded) by their adherence to the soil particles. The mass of
contaminant sorbed to the aquifer material is generally significantly greater than the mass in
solution. Thus, the aquifer materials act as a continuing source of contamination to groundwater.
35
Retardation is typically expressed in terms of a retardation factor, derived by dividing the average
velocity of the groundwater by the average velocity of the contaminant (Mackay 1989). For example,
TCE has been shown to have a retardation factors ranging from 1 to 40, depending on the
composition of the aquifer material (McCarty 1989).
Sorption and retardation studies have shown, however, that retardation factors for organic
solutes have a tendency to increase over time (Roberts et al. 1986), that soil long-contaminated with
halogenated organic compounds is resistant to desorption (Pavlostathis and Jaglal 1991), and that
the tailing of organic solutes is controlled by diffusion limitations (Goltz and Roberts 1986, Wu and
Gschwend 1986; Pignatello 1990a,b). These studies suggest that contaminant desorption rates
decrease over time and are limited by molecular diffusion from remote areas in the soil matrix. This
results in concentration leveling and decreased contaminant extraction rates over time.
Although groundwater concentrations drop initially, large masses of contaminants may remain
in the aquifer materials, and many pore volumes of water must be brought into contact with the
soil particles in order to extract the contaminants. This process results in the recovery of very large
volumes of mildly contaminated water (Table 3). The number of pore volumes of water that must
be removed during a pump and treat operation depends on the sorptive tendencies of the
contaminant, the volume of contamination in the non-aqueous phase, and groundwater flow
velocities. However, the kinetic limitations of desorption result in lengthy and inefficient pumping
operations. At the IBM San Jose site, combined pumping rates of 2,000 gpm at two boundary wells
have pumped more than 5 billion gallons of groundwater over a four-year period. However, less
than 800 lbs. of contaminants were extracted (EPA 1989).
4.3 Non-aqueous Phase Liquids
Many of the organic chemicals found at hazardous waste sites are immiscible in water and are
likely to be present in a non-aqueous phase. They are, however, slightly soluble in water, and
partitioning of components from the non-aqueous phase may result in the development of a
36
dissolved plume in addition to the immiscible phase that acts as a continuous source of
contamination. Contaminants such as chlorinated solvents, creosotes, and PCB oils are denser than
water and sink to the bottom of the aquifer, leaving behind ganglia of residual contamination and
becoming trapped in pore spaces by capillary action. Contaminants such as benzene, xylene, and
toluene are lighter than water and float on top of the water table. The mass of contamination in
the non-aqueous phase may be considerably greater than in the dissolved phase (Mackay and Cherry
1989).
Aquifer restoration within a reasonable time frame is infeasible at sites involving NAPLs. At
best, even if eventual restoration were conceivable, predicting how long pumping and treating will
take to restore an aquifer is not possible (MacKay and Cherry 1989). Although some success has
been achieved in removing a portion of floating NAPL layers, little success has been achieved in
locating dense NA.PLs (DNAPLs), much less extracting them. When large pools of DNAPLs are
present at the bottom of an aquifer, meeting drinking water standards is unachievable at any cost
(Freeze and Cherry 1989).
Removing trapped NAPLs fiom the subsurface is infeasible because NAPLs Cannot be mobilized
under typical aquifer conditions. NAPL mobilization is controlled by mass transfer limitations in
liquid phase dissolution (Hunt and Sitar 1988). The following calculation illustrates the time frame
associated with DNAPL dissolution. For a site wilh only 1 m3 of sandy soil contaminated with TCE
at 30 urn3, assuming groundwater flow through the soils at a rate of 0.03 m/d, hydraulic conductivity
of lo3 cmh, a hydraulic gradient of 1%, porosity of 30%, and dissolution of DNAPLs into the
groundwater to 10% of their solubiiity, approximately 122 years would be needed for dissolution of
DNAPLs into the groundwater @PA 1990). "lis scenario is far more favorable than for the site
conditions and the volume of DNAPLs that are likely to be present at the average hazardous waste
site.
Forty-four percent of the sites reviewed involved either documented NAPLs or evidence
suggesting the existence of NAPIS (Table 4). However, because of the constituents involved, the
37
mass of contaminants, and the fact that contaminants have migrated into the deeper aquifers at the
sites, the likelihood of pooled DNAPLs is great at all of the remaining sites involving chlorinated
solvents as the primary contaminants.
4.4 Low Permeabilitv Zones
The rate at which contaminants can be extracted using pump and treat is affected by advection,
the process by which moving groundwater transports dissolved solutes (Fetter 1988). In
heterogeneous systems where layers of varying permeabilities exist, pumping causes preferential flow
in areas of high permeability. The more layered the geologic system, the longer the tailing effect
(EPA 1990). The contaminants that remain in low permeability zones are removed very slowly by
molecular diffusion. Even highly soluble contaminants may become trapped in the finer pore
structure (Hall 1988). At the sites reviewed, at least 35% of the sites involved significant portions
of the contaminant mass in such areas of low permeability (Table 4). As much as 90% of the
contaminant mass is estimated to be present in zones of low permeability at the Ponders Corner
site.
4.5 Fractured Rock
One third of the sites reviewed involved fractured bedrock (Table 4). At such sites, dissolved
contaminants may enter the rock matrix by diffusion and be stored there by adsorption, greatly
decreasing the likelihood that the contaminants can be removed (Mackay and Cherry 1989). When
NAPLs enter fractured rock aquifers, they flow deep into the fractures, and little or no water can
penetrate and flush these areas, further complicating the mobilization of NAPLs.
38
5.0 PREDICTING REMEDIAL TIME FRAMES
5.1 Groundwater Modeling at the Sites Reviewed
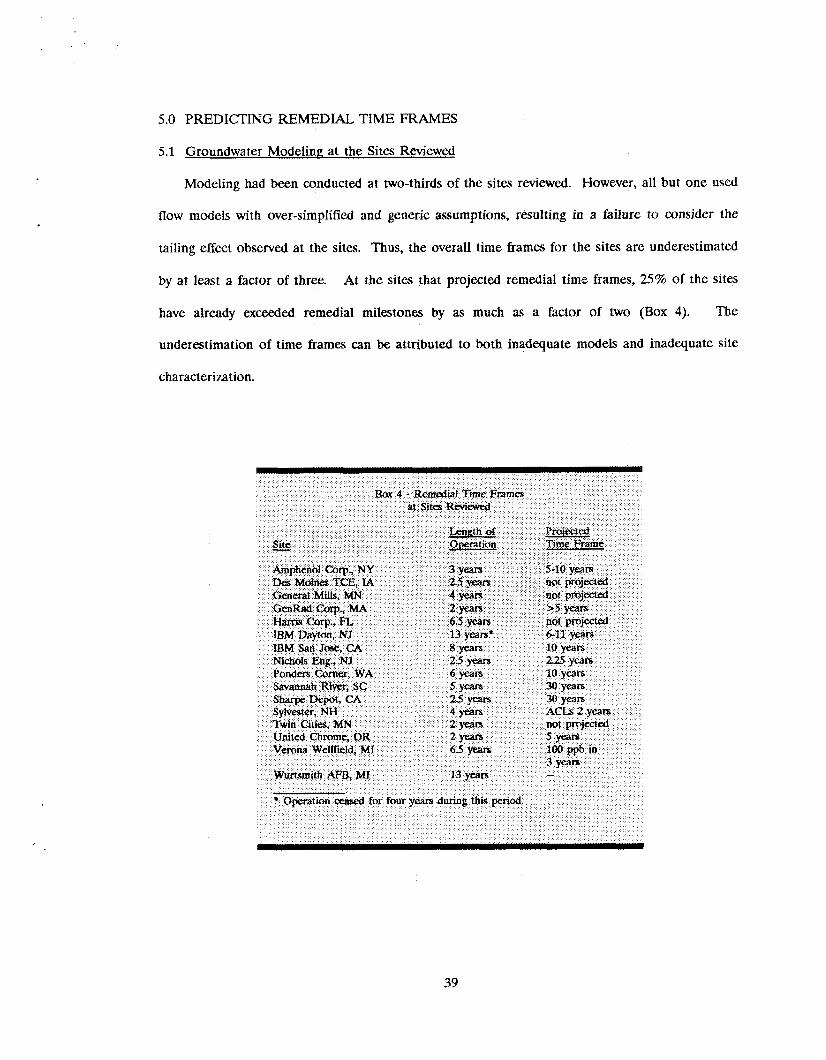
Modeling had been conducted at two-thirds of the sites reviewed. However, all but one used
flow models with over-simplified and generic assumptions, resulting in a failure to consider the
tailing effect observed at the sites. Thus, the overall time frames for the sites are underestimated
by at least a factor of three. At the sites that projected remedial time frames, 25% of the sites
have already exceeded remedial milestones by as much as a factor of two (Box 4). The
underestimation of time frames can be attributed to both inadequate models and inadequate site
characterization.
39
At present, numerous factors which affect the transport of contaminants in the subsurface and
the remedial time frame are not accounted for in groundwater models (Keely 1989; McCarthy and
Zachara 1989; Mercer and Skipp 1990; van der Heijde et al. 1989). Such models typically:
0 Consider only adsorption and advection
Use generic retardation factors
0 Do not consider dispersion, diffusion, or degradation
Do not consider influences in vertical flow caused by partially penetrating wells
Do not consider non-aqueous phase liquids
0
0
0 Assume homogeneity
0 Assume that aquifer is confined
Assume uniform thickness
Assume a steady-state flow field
0
D Do not consider colloidal transport of contaminants
0 Are usually based on inaccurate mass inventories and inadequate site
characteriation.
Estimates of contaminant retardation are essential to predicting the length of time required
to clean up an aquifer. At best, for a plume containing only dissolved and sorbed contaminants in
a uniform homogeneous aquifer, the volume that has to be removed will equal the contaminated
volume times the retardation factor, not considering hydrodynamic dispersion. However, retardation
factors vary from site to site for the same chemicals and appear to increase over time. Although
sorption was considered in the remedial design for at least two thirds of the sites reviewed, the
retardation factors used in the analyses were generic and did not a m u n t for intra-particle diffusion.
To date, no methods have been developed that would allow site-specific estimates of contaminant
retardation over time, and predictions of cleanup time frames based on generic retardation factors
are unreliable. The lack of a reliable method for estimating contaminant retardation over time is
the primary factor contributing to the gross underestimation of remedial time frames in the sites
reviewed.
5.2 Recent Modelinp Studies
Recent modeling studies suggest that pumping and treating will not restore aquifers to drinking
water standards within a reasonable time frame. Pump and treat time frames of 100 years may be
needed in order to lower concentrations by a factor of 100, assuming a homogeneous aquifer
(Mackay and Cherry 1989, McCarty 1989). For water-insoluble constituents such as jet fuel,
assuming a 10-acre area with a 55-foot thick aquifer, 10% residual saturation, a pumping rate of
100 gpm, a soil: water partition coefficient of 0.75, oil water partition coefficients of 3,000 and
11,OOO for toluene and o-xylene respectively, and one year to exchange the fluid one time, thousands
of years would be needed to remove the contaminants (Hall 1988).
6.0 EFFECTS OF PUMPING AND TREATING
Several phenomena associated with pumping and treating can complicate the cleanup effort
or cause ecological damage. The following effects of pumping and treating have been observed:
0 A large volume of uncontaminated water, many times the volume of contaminated water, must be used to flush the aquifer.
0 Dewatering resulting from pumping can cause serious land subsidence and other ecological damage.
0 When perched NMLs exist, drilling can puncture the bed causing the pool
When the water table is lowered fiom a position above perched NAPLs,
to drain to a lower aquifer (Mackay and Cherry 1989).
0
the NAPLs can become remobilized and drain to a deeper aquifer (Mackay and Cherry 1939).
Pumping causes changes in the flow and distribution of groundwater that can be ecologically
damaging. The potential effects of dewatering are land subsidence and the loss of habitats for some
41
local species, Pumping at the IBM San Jose site has resulted in the dewatering of the A aquifer.
A ground-water balance estimate for the Santa Teresa Basin showed that 6,900 to 29,900 acre-feet
of overdraft occurred in 1985 (EPA 1989).
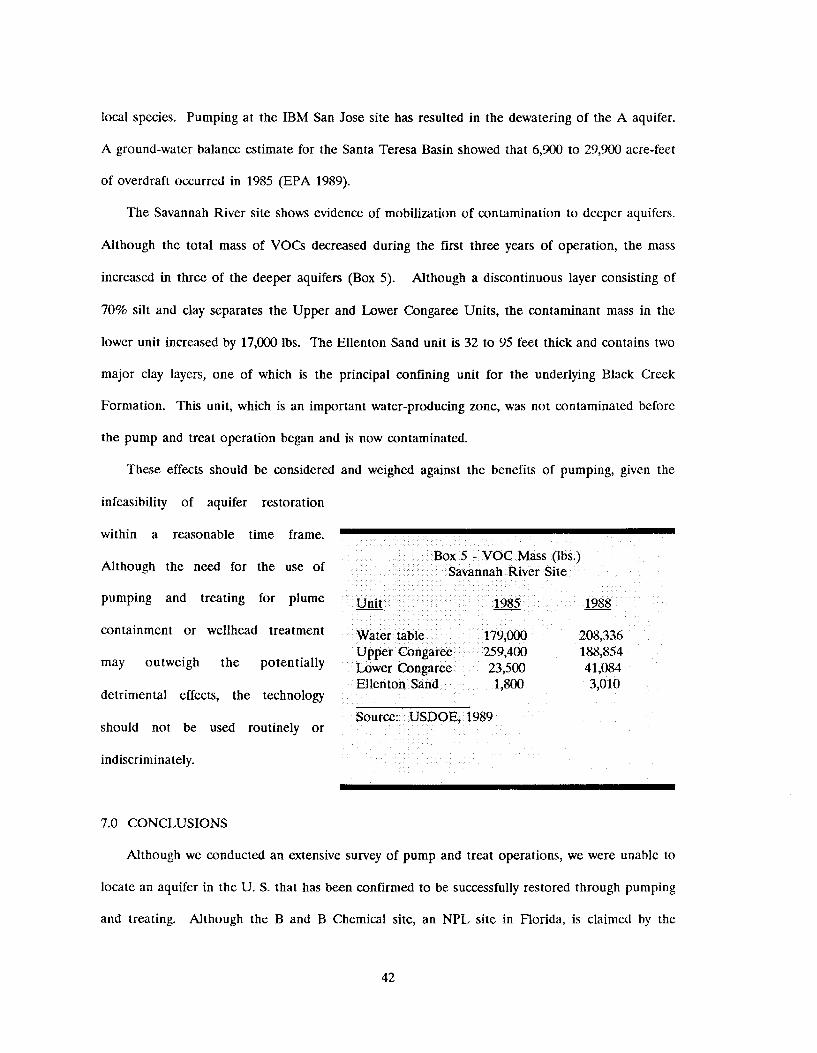
The Savannah River site shows evidence of mobilization of contamination to deeper aquifers.
Although the total mass of VOCs decreased during the first three years of operation, the mass
increased in three of the deeper aquifers (Box 5). Although a discontinuous layer consisting of
70% silt and clay separates the Upper and Lower Congaree Units, the contaminant mass in the
lower unit increased by 17,000 Ibs. The Ellenton Sand unit is 32 to 95 feet thick and contains two
major clay layers, one of which is the principal confining unit for the underlying Black Creek
Formation. This unit, which is an important water-producing zone, was not contaminated before
the pump and treat operation began and is now contaminated.
These effects should be considered and weighed against the benefits of pumping, given the
infeasibility of aquifer restoration
within a rea$onable time frame.
Although the need for the use of
pumping and treating for plume
containment or wellhead treatment
may outweigh the potentially
detrimental effects, the technology
should not be used routinely or
indiscriminately.
7.0 CONCLUSIONS
Although we conducted an extensive survey of pump and treat operations, we were unable to
locate an aquifer in the U. S. that has been confirmed to be successfully restored through pumping
and treating. Although the B and B Chemical site, an NPL site in Florida, is claimed by the
42
responsible party to be cleaned up, the claim has not been substantiated by EPA, and the extent
of remediation is questionable because the responsible parties failed to submit appropriate
monitoring documentation (Personal communication, D. Danner, EPA Region 4). Another site,
Emerson Electric, a site in Florida involving low-level contamination, is also claimed to be cleaned
up. However, the validity of this claim is also questionable because doubt exists as to whether the
plume was captured by the system, and confirmation sampling was inadequate (EPA 1989).
Although pumping and treating has generally been effective for containing the contaminant
plume and reducing the mass of contamination at the sites reviewed, little success has been achieved
in reducing aquifer contaminant concentrations to the established cleanup goals. Two of the review
sites with the longest performance records, the IBM Dayton site and the Savannah River Plant site,
have changed the remedial objective from restoration to reduction of contaminant mass because of
the ineffectiveness of the pump and treat operation in meeting the remedial objectives.
At all the sites with performance records of more than two years, concentrations have leveled
after an initial decline. For some sites, leveling may take place at relatively low concentrations,
even though as much as 50% of the contaminant mass may still be present in the aquifer. Typically,
once the pumps are turned off, concentrations rise again, often to levels higher than initial
concentrations.
Based on our review of performance records and recent theoretical studies, the following can
be concluded regarding aquifer restoration :
0 Groundwater pumping is ineffective for restoring aquifers to health-based levels.
a Pumping is effective for contaminant mass reduction, plume containment, and extraction of groundwater for point-of-use treatment.
a Although significant removal of the contaminant mass may be achieved, contaminant concentrations may not be significantly reduced.
0 At sites where contarninant concentrations have leveled, concentrations remain significantly above drinking water standards.
D Even if target concentrations are reached, when pumps are turned off, concentrations rise again, often to levels higher than initial concentrations.
43
0 The primary contributors to the ineffectiveness of pumping for aquifer restoration are phenomena resulting from physical and chemical processes, such as contaminant sorption and the existence of non-aqueous phase liquids and zones of low permeability.
0 The longest remedial time frame predicted in the performance records reviewied was 30 years. Recent modeling studies, however, estimate that pump and treat time frames of 100 to 1,OOO years may be needed to restore aquifers.
Both performance records and modeling studies indicate that the pump and treat approach is
ineffective for aquifer restoration within a reasonable time frame. No evidence exists that pumping
can restore aquifers to a condition compatible with health-based standards. Containment, mass
reduction, and wellhead treatment are presently feasible objectives for pump and treat systems, and
future groundwater remedial action decisions and pump and treat system designs should be limited
to these objectives.
44
8.0 REFERENCES
Danner, D. A. (1990). Personal communication, Environmental Protection Agency, Region 4.
Doty, C. B. and Travis, C. C. (1989). "The Superfund Remedial Action Decision Process: A Review of 50 Records of Decision." Journal of the Air and Waste Management Association, 39 (12), 1535-1543.
Environmental Protection Agency, (1989). Evaluation of Groundwater Extraction Remedies, Office of Solid Waste and Emergency Response, EPA/540/0289/054.
Environmental Protection Agency (1990). Basics of Pump and Treat Groundwater Remediation Technology, EPA/600/8-90/D03, Robert S . Kerr Environmental Research Laboratory, Ada, OK
Fetter, C. W. (1988). Applied Hvdrogeoloa, Second Edition. Memll Publishing Company, Columbus, OH.
Freeze, R. A. and Cherry, J. A. (1989). "What Has Gone Wrong?" Groundwater, 27(4), 458-464.
Goltz, Mark N. and Paul V. Roberts (1986). "Diffusion of Sorbing Sollutes: Impact on Contaminant Transport in Groundwater, Contaminanf Hydrology, 1, 77-94.
Haiges, Lisa and Robert b o x (1987). "Groundwater Cleanup at Selected Superfund Sites," Proceedings of the Superfund '87 Conference. Institute, Silver Spring, MD.
Hazardous Material Control Research
Hall, C. W. (1988). "Practical Limits to Pump and Treat Technology for Aquifer Remediation," Groundwater Quality Protection Pre-Conference Workshop Proceedings; Water Pollution Control Federation.
Hunt, James R. and Nicholas Sitar (1988). "Nonaqueous Phase Liquid Transport and Cleanup. 1. Analysis of Mechanisms," Water Resources Res., 24, 1247-1258.
Keely, Joseph F. (1989). "Performance Evaluations of Pump-and-Treat Remediations," EPA/540/4-89/005, Robert S. Kerr Environmental Research Laboratory, Ada, OK.
Mackay, D. M. and Cheny, J. A. (1989). "Groundwater Contamination: Pump-and-treat Remediation," Environ Sci Technol., 23, 630-636.
Mackay, D. M. (1989). "Characterization of the Distribution and Behavior of Contaminants in the Subsurface," Proceedings of the National Research Council Water Sciences Technology Board Colloquium.
McCarthy, John F. and John M. Zachara (1989). "Subsurface Transport of Contaminants," Envli;on. Sci Technol., 23, 4%-502.
McCarty, Perry (1989). "Scientific Limits to Remediation of Contaminated Soils and Ground Water," Proceedings of the National Research Council Water Sciences Technology Board Colloquium.
45
Mercer, James W. and David C. Skipp (1990). "Considerations in the Design of Pump-and-Treat Systems," Proceedings of the Superfund '90 Conference, Hazardous Materials Control Research Institute, Silver Spring, MD.
Pavlostathis, Spyros G. and Jaglal Kendrick (1991). "Desorptive Behavior of Trichloroethylene in Contaminated Soil," Environ. Sci Technol., 25, 274-279.
Pignatello, Joseph J. (199Oa). "Slowly Reversible Sorption of Aliphatic Halocarbons in Soils. 1. Formation of Residual Fractions," Environ. Toxicol. Chent., 9, 1107-1115.
Pignatello, Joseph J. (199Ob). "Slowly Reversible Sorption of Aliphatic Halocarbons in Soils. 2. Mechanistic Aspects," Environ. Toricol. Chem., 9, 1117-1126.
Roberts, Paul V., Mark N. Goltz, and Douglas M. Mackay (1986). "A Natural Gradient Experiment on Solute Transport in a Sand Aquifer: Retardation Eqtimates and Mass Balances for Organic Solutes," Water Resources Research, 22, 2047-2058.
van der Heijde, Paul K. M., Aly I. El-Kadi, and Stan A. Williams (1989). Project Summary. Groundwater Modeling: An Overview and Status Report. EPA/600/S2-89/028, Robert S. Kerr Environmental Research Laboratory, Ada, OK.
Wu, Shian-chee, and Phillip M. Gschwend (1986). "Sorption Kinetics of Hydrophobic Organic Compounds to Natural Sediments and Soils," Environ. Sci Technol., 20, 71 7-725.
46
Appendix A
Summary of Effectiveness
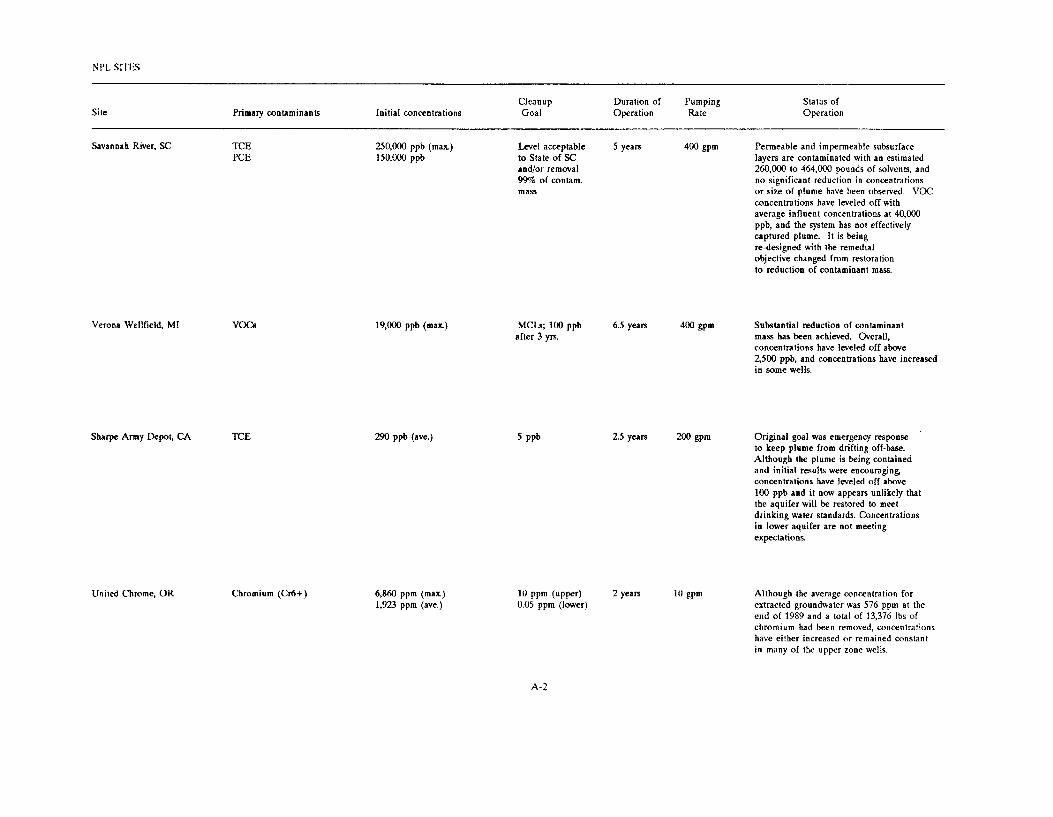
Site Cleanup Duration of Pumping Status of
Operation Primary contaminants Initial concentrations Goal Operation Rate
Savannah River. !E TCE PCE
Verona Wellfield. MI VOCS
Sharpe A m y Depot, CA TCE
United Chrome, OR Chromium (Cr6+)
250,OOO ppb (max) Level acceptable 5 yean 400 gpm Permeable and impermeable subsurface 150,000 ppb IO State of SC
and/or removal 99% of contam. mass or size of plume have been observed. VOC
layers are contaminated with an estimated 260,000 to 464,000 pounds of solvents, and no significant reduction in concentrations
concentrations have leveled off with average influent concentrations at 40,000 ppb, and the system has not effectively captured plume. It is being re-designed with rhe remedial objective changed from restoration to reduction of contaminant mass.
19,000 ppb (mar)
290 ppb (ave.)
M C b , 100 ppb after 3 yrs.
5 PPb
6.5 years 400 gpm Substantial reduction of contaminant mass has been achieved. Overall, concentrations have leveled off above 2,500 ppb, and concentrations have increased in some wells.
25years XX)gpm Original goal was emergency response to keep plume from drifting off-base. Although the plume is being contained and initial results were encouraging, concentrations have leveled olf above 100 ppb and it now appears unlikely that the aquifer will be restored to meet drinking water standards. Concentrations in lower aquifer are not meeting expectations.
10 ppm (upper) 2 years 0.05 ppm (lower)
Although the average concentration for extracted groundwater was 576 ppm at !he end of 19S9 and a total of 13,376 lbs of chromium had been removed, concentrations have either increased or remained constant in many of the upper zone wells.
A-2
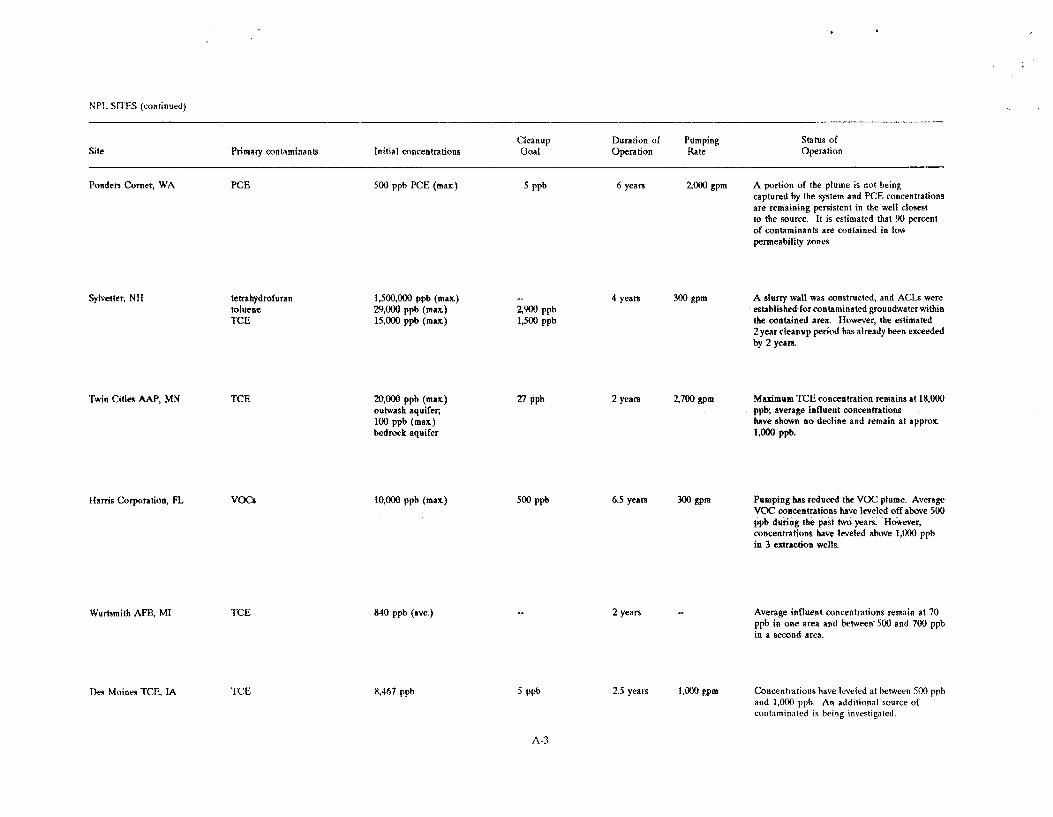
NPI. SI1 1 3 (continued)
Cleanup Duration of Pumping Status of Operation Site Primary contaminants Initial concentrations Goal Operation Rate
Ponders Corner, WA PCE 500 ppb PCE (max) 5 PPb 6 years 2,OOO gpm A portion of the plume is not being captured by the system and PCE concentrations are remaining persistent in the well elosest to the source. It is estimated that 90 percent of contaminants are contained in low permeability zones.
Sylvester. NH
Twin Citim AAP, MN
Harris Corporation, FL
Wurtsmith AFB. MI
Des h4oines K E , IA
tetrahydrofuran toluene TCE
VM=s
T C E
T C E
20,W ppb (mar) outwash aquifer; 100 ppb (max) bednrk aquifer
10,OOO ppb (max)
840 ppb (ave.)
8,467 ppb
500 PPb
5 PPb
A slurry wall was constructed, and ACLs were established for contaminated groundwater within the contained area. However, the estimated Zyear cleanup period has already been exeeeded by 2 years.
4 years 300 e m
2yeam 2700gpm Maximum W E concentration remains at 18,000 ppb; average influent concentrations have shown no decline and remain at approx 1,ooO ppb.
6.5 years 300 gpm Pumping has reduced the VOC plume. Average VOC concentrations have leveled off above 500 ppb during the past hvo years. However, concentrations have leveled above 1,OOO ppb in 3 extraction wells.
2 years Average influent ancentrations remain at 70 ppb in one area and between 5M) and 700 ppb in a second area.
2.5 years 1 , 0 gpm Concentrations have leveled at between 500 ppb and LOO0 ppb. An additional source of contaminated is being investigated.
A-3
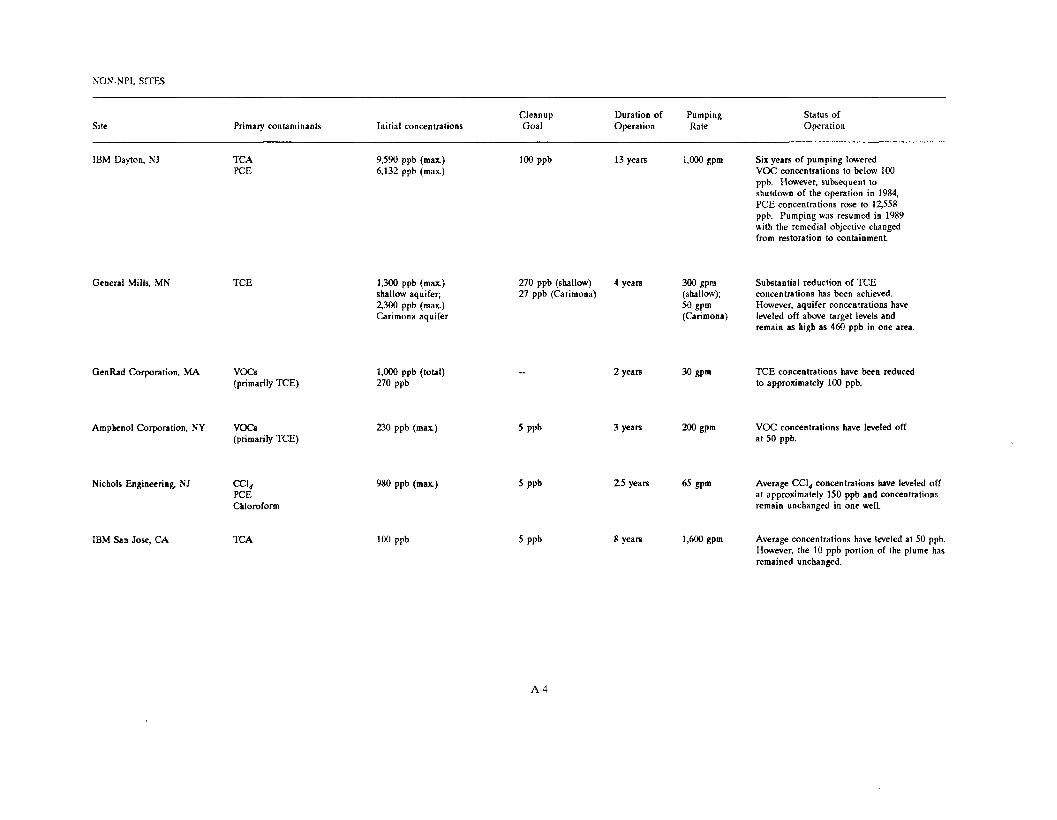
NON-NPL sms
Site Cleanup Duration of Pumping
Primary contaminants Initial concentrations Goal Operation Rate Status of Operation
IBM Dayton, NJ TCA YCE
General Mills, MN TCE
GenRad Corporation, MA VOCS (primarily TCE)
Amphenol Corporation. NY VOCS (primarily TCE)
Nichols Engineering NJ E', PCE
IBM San Jose, CA
Chlomfom
TCA
9,590 ppb (max) 100 PPb 13 years 1,OOO gpm Six years of pumping lowered 6,132 ppb (max) VOC concentrations to below 100
ppb. However, subsequent IO shutdown of the operation in 1984, PCE concentrations rose to 12,558 ppb. Pumping was resumed in 1989 with the remedial objective changed from restoration to containment
1,300 ppb (max)
2,300 ppb (max) shallow aquifer;
Carimona aquifer
1,ooO ppb (total) 270 ppb
230 PPb (ma%)
980 ppb (max)
270 ppb (shallow) 4 years 27 ppb (Carimona)
5 PPb
5 PPb
5 PPb
300 gpm Substantial reduction of TCE (shallow); concentrations has been achieved.
However. aquifer concentrations have (Clrimona) leveled off above target levels and
remain as high as 460 ppb in one area.
50 gpm
2 years 30 gpm TCE concentrations have been reduced to approximately 100 ppb.
3 years 200 gpm VOC concentrations have leveled off at 50 ppb.
2 5 years 65 gpm Average CCI, concentrations have leveled off at approximately 150 ppb and concentrations remain unchanged in one well.
8 years 1,600 gpm Average concentrations have leveled at 50 ppb. However, the IO ppb portion of the plume has remained unchanged.
A-4
Appendix B
Abstracts for Performance Records Reviewed
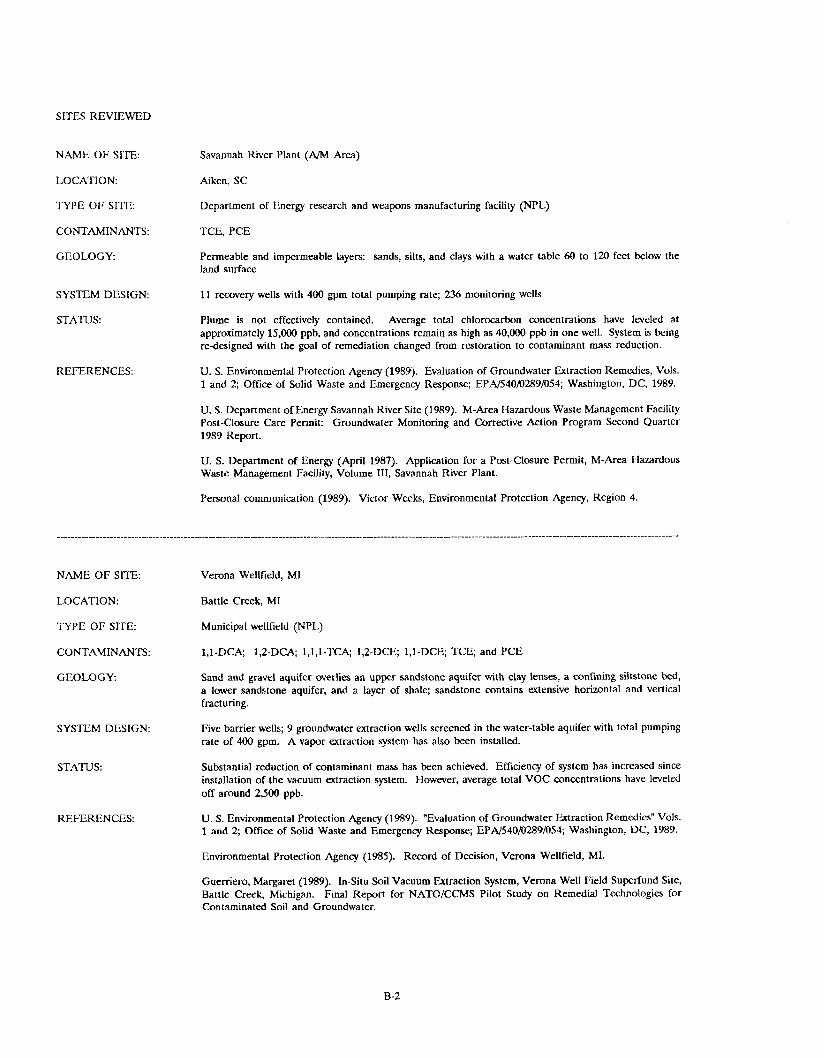
SITES REVIEWED
NAME OF SITE:
LOCKTION:
TYPE OF SITE:
CONTAMINANTS:
GEOLOGY
SYSTEM DESIGN:
STATUS:
REFERENCES:
Savannah River Plant (AM Area)
Aiken, SC
Department of Energy research and weapons manufacturing facility (NPJ-)
'TCE, PCE
Permeable and impermeable layers: sands, silts, and clays with a water table 60 to 120 feet below the land surface
11 recovey wells with 400 gpm total pumping rate; 236 monitoring wells
Plume is not effectively contained. Average total chlorocarbon concentrations have leveled at approximately 15,000 ppb, and concentrations remain as high as 40,000 ppb in one well. System is being redesigned with the goal of remediation changed from restoration to contaminant mass reduction.
U. S. Environmental Protection Agency (1989). Evaluation of Groundwater Extraction Remedies, Vols. 1 and 2; Office of Solid Waste and Emergency Response; EPN540/0289/054; Washington, DC, 1989.
U. S. Department of Energy Savannah River Site (1989). M-Area Ilazardous Waste Management Facility Post-Closure Care Permit: Groundwater Monitoring and Corrective Action Program Second Quarter 1989 Report.
U. S. Department of Energy (April 1987). Application for a Post-Closure Permit, M-Area Hazardous Waste Management Facility, Volume 111, Savannah River Plant.
Personal communication (1989). Victor Weeks, Environmental Protection Agency, Region 4.
NAME OF SITE
LOCATION:
TYPE O F SITE:
CONTAMINANTS:
GEOLOGY:
SYSTEM DESIGN:
ST.4TUS:
REFERENCES:
Verona Wellfield, MI
Rattle Creek, MI
Municipal wellfield (NPL)
1,l-DC& 1,2-DC& l,l,l-TCA; 1,2-DCE 1 , l -DCE TCE; and PCE
Sand and gravel aquifer overlies an upper sandstone aquifer with clay lenses, a confining siltstone bed, a lower sandstone aquifer, and a layer of shale; sandstone contains extensive horizontal and vertical fracturing.
Five barrier wells; 9 groundwater extraction wells screened in the water-table aquifer with total pumping rate of 400 gpm. A vapor srtraction system has also been installed.
Substantial reduction of contaminant mass has been achieved. Efficiency of system has increased since installation of the vacuum extraction system. However, average total VOC concentrations have leveled off around 2,500 ppb.
U. S. Environmental Protection Agency (1989). "Evaluation of Groundwater Extraction Remedies" Vols. 1 and 2; Office of Solid Waste and Emergency Response; EPNS40/0289/054; Washington, DC, 1989.
Environmental Protection Agency (1985). Record of Decision, Verona Wellfield, MI.
Guerriero, Margaret (1989). In-Situ Soil Vacuum Extraction System, Verona Well Field Superfund Site, Battle Creek, Michigan. Final Report for NATO/CCMS Pilot Study on Remedial Technologies for Contaminated Soil and Groundwater.
B-2
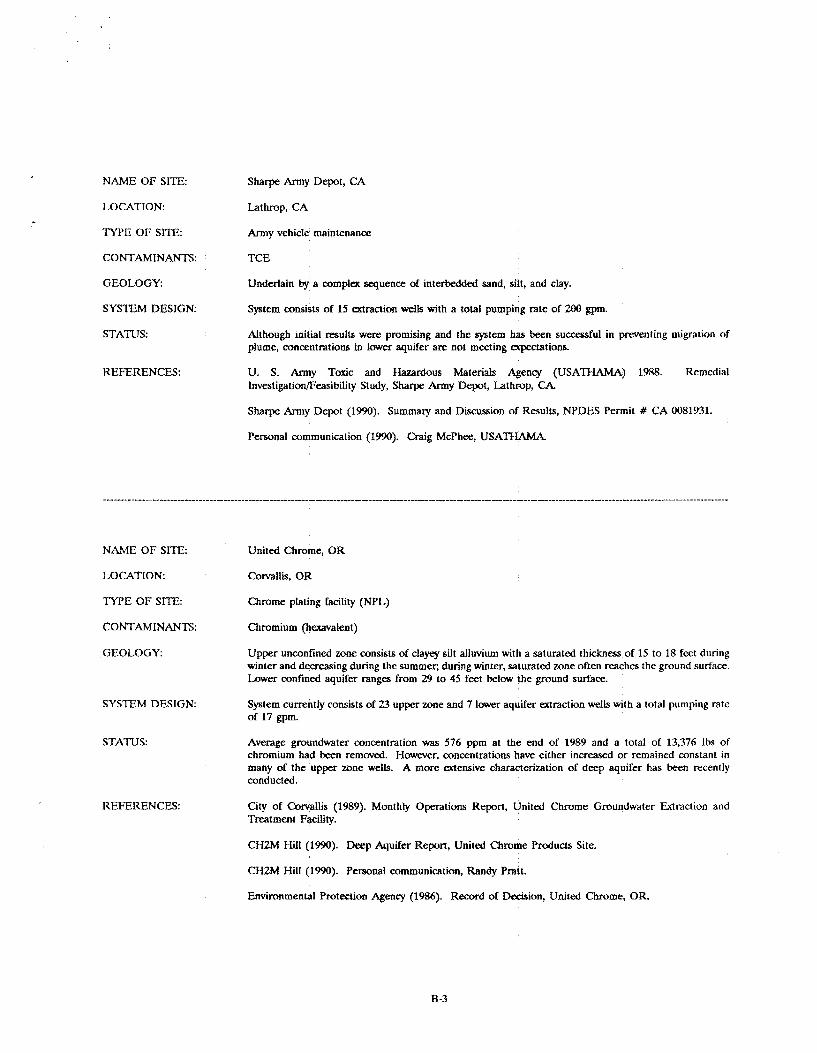
NAME OF SITE:
LOCATION: Lathrop, CA
TYPE OF SITE:
CONTAMINANTS: TCE
GEOLOGY.
SYSTEM DESIGN:
Sharpe. Army Depot, CA
Army vehicle maintenance
Underlain by a complex sequence of interbedded sand, silt, and clay.
System m i s t s of 15 &taction wells with a total pumping rate of 200 gpm.
STATUS: Although initial results were promising and the system has been successful in preventing migration of plume, concentrations in lower aquifer arc not meeting expectations
REFERENCES: U. S. Army Toxic and Hazardous Materials Agency (USATHAMA) 1958. Remedial Investigationfleasibility Study, Sharpe Army Depot, Lathrop, C k
Sharpe Army Depot (1990). Summary and Discussion of Results, NPDES Permit # CA 0081931.
Personal communication (1990). Craig McPhee, USATHAMA
NAME OF SITE United Chrome, OR
LOCATI ON: Corvallis, OR
TYPE. OF S m
CONTAMINANTS: Chromium (hexavalent)
Chrome plating facility (NPL)
GEOLOGY: Upper unconfined zone consists of clayey silt alluvium with a saturated thickness of 15 to 18 feet during winter and decreasing during the summer, during winter, saturated zone often reaches the ground surface. Lower confined aquifer ranges from 29 to 45 feet below the ground surface.
SYSTEM DESIGN: System currently consists of 23 upper zone and 7 lower aquifer extraction wells with a total pumping rate of 17 gpm.
STATUS: Average groundwater concentration was 576 ppm at the end of 1989 and a total of 13,376 Ibs of chromium had been removed. However, concentrations have either increased or remained constant in many of the upper zwe web. A more extensive characterization of deep aquifer has been recently conducted.
REFERENCES: City of Corvallis (1989). Monthly Operations Report, United Chrome Groundwater Extraction and Treatment Facility.
CHZM Hill (1990). Deep Aquifer Report, United Chrome Products Site.
CH2M Hill (1990). Personal communication, Randy Pratt.
Environmental Protection Agency (1986). Record of Decision, United Chrome, OR.
R-3
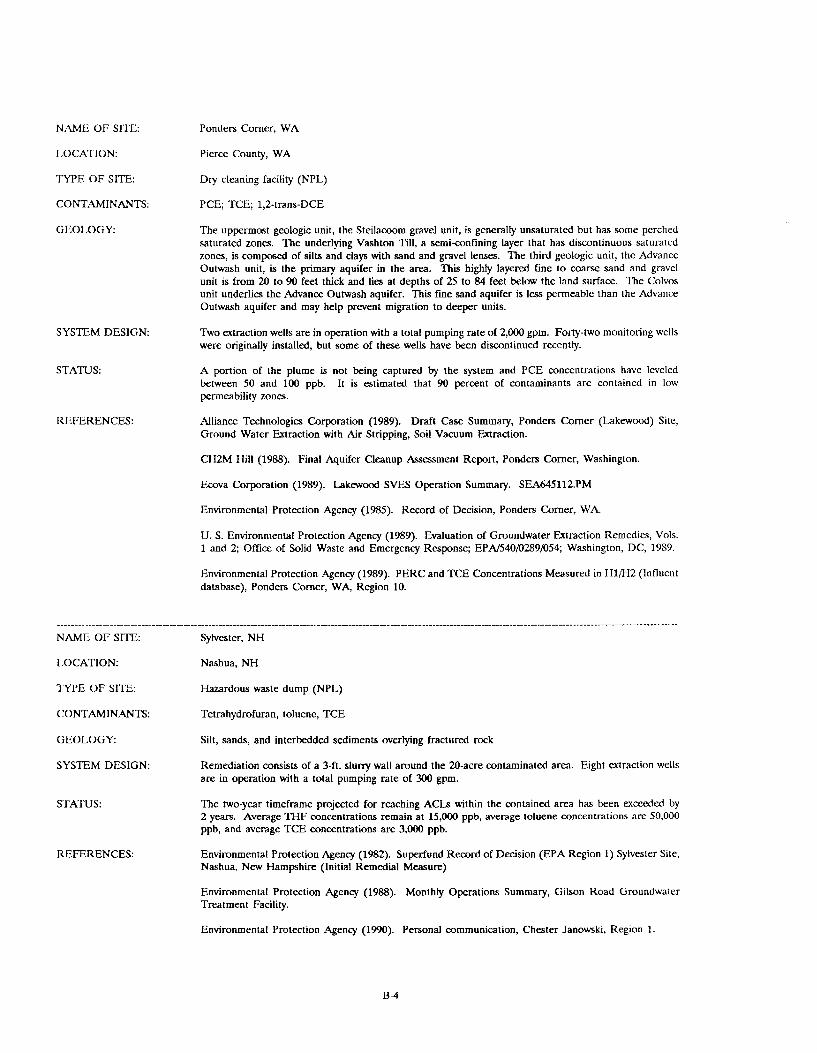
Ponders Corner. WA NAME OF SITE:
LOCATION:
TYPE OF SITE:
CONTAMINANTS:
GEOLOGY
SYSTEM DESIGN:
STATUS:
REFERENCES:
NAME O F SITE:
LOCATION:
TYPE O F SITE:
CONTAMINANTS:
GEOLOGY
SYSTEM DESIGN:
s'l-ATUS:
REFERENCES:
Pierce County, WA
Dry cleaning facility (NPL)
PCE; TCE; 1,2-trans-DCE
The uppermost geologic unit, the Steilacoom gravel unit, is generally unsaturated but has some perched saturated zones. The underlying Vashton Till, a semianfining layer that has discontinuous saturated zones, is composed of silts and clays with sand and gravel lenses. The third geologic unit, the Advance Outwash unit, is the primary aquifer in the area. This highly layered fine to coarse sand and gravel unit is from 20 to 90 feet thick and lies at depths of 25 to 84 feet below the land surface. The Colvos unit underlies the Advance Outwash aquifer. This fine sand aquifer is less permeable than the Advance Outwash aquifer and may help prevent migration to deeper units.
Two extraction wells are in operation with a total pumping rate of 2,000 gpm. Forty-two monitoring wells were originally installed, but some of these wells have been discontinued recently.
A portion of the plume is not being captured by the system and PCE concentrations have leveled between 50 and 100 ppb. It is estimated that 90 percent of contaminants are contained in low permeability zones.
Alliance Technologies Corporation (1989). Draft Case Summary, Ponders Corner (hlrewood) Site. Ground Water Extraction with Air Stripping, Soil Vacuum Extraction.
CH2M Hill (1988). Final Aquifer Cleanup Assessment Report, Ponders Corner, Washington
Ecova Corporation (1989). LakAvood SVES Operation Summary. SEA645112.PM
Environmental Protection Agency (1985). Record of Decision, Ponders Corner, \%'A
U. S. Environmental Protection Agency (1989). Evaluation of Groundwater Fxtraction Remedies, Vols. 1 and 2; Office of Solid Waste and Emergency Response; EPA/540/0289/054; Washington, DC, 1989.
Environmental Protection Agency (1989). PERC and TCE Concentrations Measured in I IlH2 (Influent database), Ponders Corner, WA, Region 10.
Sylvester, NH
Nashua, NH
Hazardous waSte dump (NPL)
Tetrahydrofuran, toluene, TCE
Silt, sands, and interbedded sediments overlying fractured rock
Remediation consists of a 34. slurry wall around the 20-acre contaminated art;?. Eight extraction wells are in operation with a total pumping rate of 300 gpm.
The two-year timeframe projected for reaching ACLs within the contained area has been exceeded by 2 years. Average THF concentrations remain at 15,OOO ppb, average toluene concentrations are 50,000 ppb, and average TCE concentrations are 3,000 ppb.
Environmental Protection Agency (1982). Superfund Record of Decision (EPA Region 1) Sylvester Site, Nashua, New Hampshire (Initial Remedial Measure)
Environmental Protection Agency (1988). Monthly Operations Summay, Gilson Road Groundwater Treatment Facility.
Environmental Protection Agency (1990). Personal communication, Chester Janowski, Region 1.
NAME OF SITE:
LOCATION:
TYPE OF SITE:
CONTAMINANTS:
GEOLOGY
SYSTEM DESIGN:
STATIJS:
REFERENCE3
Twin Cities Army Ammunition Plant, MN
New Brighton, MN
Ammunition production (NPL)
TCE
Organic soils, sands, and days are underlain by cohesive and relatively impervious till. The third unit consists of glacial outwash and/or valley fill materials 100 to 350 feet below the land surface. This unit IS underlain by a bedrock unit consisting of weathered and fractured dolomite overlying sandstone. Little hydraulic separation exists between the overburden and bedrock units.
Six boundary extraction wells were originally installed; three months later, more wells were added to the system. Currently, 12 boundary wells and fwe wlIs dawngradient of interior SOUKT a m s are operating at a total pumping rate of 2,700 gpm.
Although the plume has been captured and more than 21,OOO lbs. of VOCs have been extracted to date, maximum TCE concentrations remain as high as 18,ooO ppb; average VOC influent concentrations remain unchanged at approximately 1,ooO ppb.
U. S. Army TOXIC and Hazardous Materials Agency (USATHAMA), 1986. Twin Cities Army Ammunition Plant Ground Water Remedial Action Alternatives Analysis.
Twin Cities Army Ammunition Plant, 1990. Installation Restoration Program, Twin Cities Army Ammunition Plant Groundwater Recovery System (TGRS) 1989 Annual Monitaring Report and Monitoring Pian, Vols. 1 and 2. New Brighton, MN.
Personal communication, 1990. Juan Boston, USATHAMA
NAME OF SITE
LOCATION. Palm Bay, FL
TYPE OF SITE:
CONTAMINANTS:
Harris Corporation, FL
Manufacturing facility (NPL)
TCE, TCEA, vinyl chloride, methylene chloride, chlorobenzene, ethylbenzene, xylene
GEOLOGY
SYSTEM DESIGN:
STATUS:
REFERENCES:
The upper sand aquifer, an unconfined aquifer, 1s used locally as a water source. The layer below the upper aquifer is a 22-fool thick sandy clay laycr that acts as a leaky aquitard, retarding groundwater flow between the upper aquifer and the 30-fmt thick unconsolidated lower sand aquifer. Underlying the lower sand aquifer is the Hawthorne formation, a clay confining layer up to 200 feet thick. The fifth layer is the Floridan aquifer, a 1,OOO-fmt thick sequence of limeslone and dolomite.
The current system consists of 11 extraction wells, four of which are d e p aquifer bamer wells. The remaining wells recover ground water from both the shallow and deep aquifers. The pumping rate has remained constant since startup at 300 gpm.
Although the average treatment system influent VOC concentrations have declined and leveled at applPximately 500 ppb, concentrations have ieveled above 1,OOO ppb nn one shallow extraction well, two deep aquifer extraction wells, and one deep aquifer monitoring well. In one of the temporary onsite shallow monitoring wells instailed in 1987, VOC concentrations 5uciuated between 1 and 30,OOO ppb during 1988 and 1989 and remained at 14,000 ppb during 1389. This contamination can be attributed almost exclusively to xylene and ethyl benzene, as 0ppmx.I to TCE, DCEA, and wnyl chloride in the extraction wells.
U. S. Environmental Protection Agency (1989). Evaluation of Groundwater Extraction Remedies, Vols. 1 and 2; Office of Solid Waste and Emergency Response; EPA/S40h3289m54; Washington, DC, 1989.
H a d Corporation (1990). May 1990 Quarteriy Sampling of Groundwater Monitoring Wells. Melbourne, Florida.
B-5
NAME OF SITE:
LOCATION:
TYPE OF SITE:
CONTAMINANTS:
GEOLOGY:
SYSTEM DESIGN
STATUS:
REFERENCES:
Wurtsmith AFB, MI
Wurtsmith. MI
Underground storage tank (non-NPL)
TCE. DCE
A sand and gravel unit is underlain by a clay unit at approximately 62 feet below the land surface. Clay beds exist in the sand and gravel unit in the northern part of the site at depths of 5 to 15 feet below the land surface. The clay unit separates the aquifer from the underlying bedrock.
A two-well system began operation in 1978 at a pumping rate of 280 gpm. At that time, water was pumped into an aeration reservoir. A second aeration system was installed by 1979, consisting of six more wells with a pumping rate of 125 gpm. Later in 1979, the U. S. Geological Survey installed 217 monitoring wells both onsite and offsite. In 1981, the second aeration system was removed from service, and in 1982, the Arrow Street Purge Well System was installed with a pumping rate of 1200 gpm. A second system, the Mission Street system, consists of five extraction wells at a pumping rate of 220 gpm.
Concentrations remain at 70 ppb at the Arrow Street site after 13 years of pumping and between 500 and 700 ppb after two years of pumping at the Mission Street site.
Wurtsmith Air Force Base, 1990a. Groundwater Cleanup Factsheet. Wurtsmith AFB, MI.
Wurtsmith Air Force Base, 1990b. 379 Strategic HospitalBGPB, Wurtsmith AFB, Michigan, Water Sampling Information.
Wurtsmith Air Force Base, 1989. Wurtsmith AFB, MI; 4853-5300; 1989 Water Quality Data.
Personal communication, 1990. Mike Niclo, Wurtsmith AFB.
U. S. Geological Survey, 1983. Groundwater Contamination at Wurtsmith Air Force Base, Michigan. Water Resources Investigation Report 834002, Lansing, MI.
NAME OF SITE. Des Moines, ’I’CE, IA
LOCATION: Des Moines, IA
TYPE OF srm
CONTAMINANIS:
GEOLOGY
Municipal wellfield (NPL)
TCE, I’-12-DCE, and vinyl chloride
The area is underlain by a layer of silt and clay and a layer of unconsolidated sand and gravel. These layers are underlain by consolidated shale, siltstone, and sandstone. Below this system lies consolidated dolomite, limestone, sandstone, and shale formations. Three primary aquifer systems are associated with the site, two of which are important sources of drinking water in the area.
SYSTEM DESIGN:
STATUS:
REFERENCES:
Seven recovery wells were initially installed with a total pumping rate of 1,300 gpm. Six of these wells are still in operation at a pumping rate of 1,OOO gpm.
Concentrations have leveled at between 500 ppb and 100 ppb. An additional source of contamination is being investigated.
U. S. Environmental Protection Agency (1989). Evaluation of Groundwater Extraction Remedies, Vols. 1 and 2; Oftice of Solid Waste and Emergency Response; EPA/540/0289/054; Washington, DC, 1989.
Dico Company, Inc., 1989. Performance Evaluation Report No. 3, Groundwater Recovery and Treatment System, Des Moines TCE Site, Des Moines, Iowa.
Dim Company, Inc., 1990. Performance Evaluation Report No. 4, Groundwater Recovery and Treatment System, Des Moines TCE Site, Des Moines, Iowa.
B-6
NAME OF SITE:
LOCATION:
TYPE OF SITE:
CONTAMINANTS:
GEOLDGY
SYSTEM DESIGN:
STATUS:
REFERENCES
IBM Dayton, NJ
South Brumwick, NJ
Electronics manufacturing facility (non-NPL)
1,1,1-TCA and PCE
The shallow unconfined aquifer is comprised of the two upper geologic units which consist primarily of clay, silt, and gravel. These units are underlain by a thin discontinuous clay layer. The lower semi- confined aquifer consist of a sand and gravel unit underlain by datively impermeable shale.
Initial system installed in 1978 consisted of 13 shallow aquifer extraction wells, one deep aquifer extraction well, 1 offsite production well, and 100 monitoring web. The average pumping rate was 300 gpm with a maximum pumping rate at the offsite well of 500-600 gpm.
Six years of pumping lowered VOC concentrations to below 100 ppb. However, subsequent to shutdawn of the opetation in 1984, PCE concentrations cose to 12,558 ppb. Pumping was resumed in 1989 with the m e d i a l objective changed from restoration to containment.
U. S. Environmental Protection Agency (1989). Evaluation of Groundwater Extraction Remedies, Vols. 1 and 2; OEce of Solid Waste and Emergency Response; EPA/540P289105Q; Washington, DC, 1989.
NAME OF SITE: General Mills, MN
LOCATION: Minneapolis, MN
TYPE OF SITE:
CONTAMINANTS: TCE, TCA, PCE
GEOLOGY
Food research labratory @on-NPL)
Thirty to fifty feet of unconsolidated alluvial and glacial depasils are undedain by a sequence of fractured sandstone, shale, dolomite, and limestone.
Five skallow aquifer extraction welts are operating with a pumping rate of 370 gpm. One extraction well is in operation in the lower (Carimona) aquifer with a pumping rate of 50 gpm.
Substantial reduction of TCE concentrations has been achieved. However, aquifer concentrations have leveled off above target levels and remain as high as 460 ppb in one area.
U. S. Environmental Protection Agency (1989). Evaluation of Groundwater Extraction Remedies, Vols. 1 and 2; Office of Solid Waste and Emergency Response; EPA/540102$91DS4; Washington, DC, 1989.
SYSTEM DESIGN:
STATUS:
REFERENCES:
B -7
NAME OF SITE:
LOCATION
TYPE OF SITE:
CONTAMINANTS:
GEOLOGY
SYSTEM DF3IGN:
STATUS:
REFERENCES:
GenRad Corporation, MA
Bolton, hfA
Scientific and medical equipment mfg. (non-NPL)
TCE
Unconsolidated glacial deposits overlie metamorphic rocks. In low-lying areas, organic sediments overlie sands and gravels. Depth to groundwater is generally only fine feet.
Tbo plumes are present at the site. 'ho extraction wells have been installed to address the eastern plume at a pumping rate of 30 gpm. Northern plume discharges to a nearby river, and is not being addressed by the system.
TCE concentrations have been reduced to approximately 100 ppb after two years of pumping.
U. S. Environmental Protection Agency (1989). Evaluation of Groundwater Extraction Remedies, Vols. 1 and 2; Office of Solid Waste and Emergency Response; EPA/540/0289/054; Washington, DC, 1989.
Sixteen monitoring wells are in operation.
NAME OF SI'IE:
LOCATION: Sidney, NY
TYPE OF SITE:
CONTAMINAN'TS: TCE, Chloroform
GEOLOGY
Amphenol Corporation, NY
Electrical connector manufacturing facility (non-NPL)
A 100 to 200 foot thick layer of alluvial materials are underlain by glaciofluvial sands and gravels.
STATUS:
REFERENCES:
SYSTEM DESIGN: One shallow aquifer extraction well and one deep aquifer extraction well are in operation with a total pumping rate of 200 gpm. Seventeen monitoring wells were initially installed, but some have been discontinued.
Although initial maximum VOC concentrations were only 230 ppb, concentrations have leveled off at 50
PPb.
U. S. Environmental Protection Agency (1989). Evaluation of Groundwater Extraction Remedies, Vols. 1 and 2; Office of Solid Waste and Emergency Response; EPA/540/0289/054; Washington, DC, 1989.
B -8
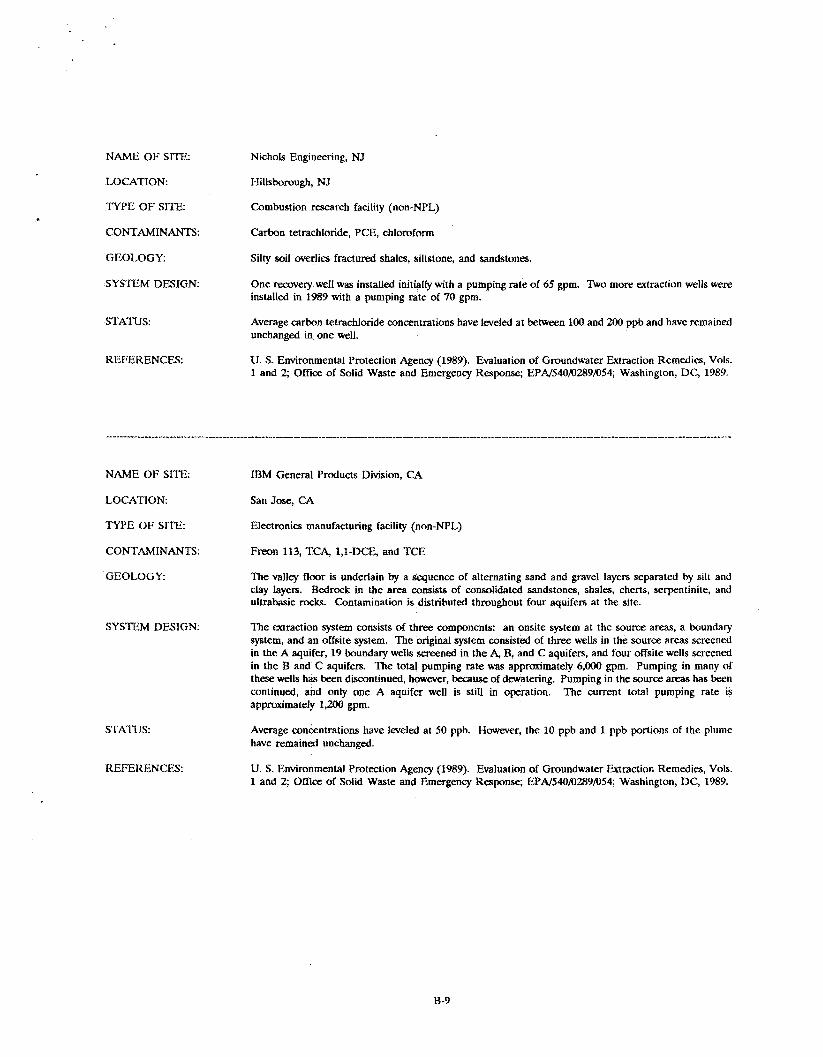
NAME OF SITE:
LOCATION
TYPE OF SITE:
CONTGMINANTS:
GEOLOGY
SYSTEM DESIGN:
STATUS:
REFERENCES:
Nichols Engineering, NJ
Hillsborough, NJ
Combustion research facility (non-NPL)
Carbon tetrachloride, PCE, chloroform
Silty soil overlies fractured shales, siltstone, and sandstones.
One rewev well was installed initially with a pumping rate of 65 gpm. Two more extraction wells were installed in 1989 with a pumping rate of 70 gpm.
Average carbon tetrachloride concentrations have leveled at between 100 and 200 ppb and have remained unchanged in one well.
U. S. Environmental Protection Agency (1989). Evaluation of Groundwater Extraction Remedies, Vols. 1 and 2; Office of Solid Waste and Emergency Response; EPA/540/0289/054; Washington, DC, 1989.
NAME OF SITE. IBM General Products Division, CA
LOC.4TION: San Jose, CA
TYPE OF SITE:
CONTAMINANTS:
Electronics manufacturing facility (non-NPL)
Freon 113, TCA, lJ-DCE, and TCE
GEOLOGY The valley floor is underiain by a sequence of alternating sand and gravel layers separated by silt and clay layers. Bedrock in the area consists of consolidated sandstones, shales, cherts, serpentinite, and ultrabasic rocks. Contamination is distributed througbout four aquifers at the site.
SYSTEM DESIGN:
STATUS:
KEFERENCES:
The extraction system consists of three components: an onsite system at the source areas, a boundary system, and an offsite system. The original system consisted of three wells in the source areas screened in the A aquifer, 19 boundary wells screened in the A, B, and C aquifers, and four offsite w e b screened in the B and C aquifers. The total pumping rate was appmmately 6,000 gpm. Pumping in many of these wells has been discontinued, however, because of dewatering. Pumping in the source a m s has been continued, and only one A aquifer well is still in operation. The current total pumping rate is approximately 1,200 gpm.
Average concentrations have leveled at 50 ppb. However, the 10 ppb and 1 ppb portions of the plume have remained unchanged.
U. S. Environmental Protection Agency (1989). Evaluation of Groundwater Extraction Remedies, Vols. 1 and 2; Offirr of Soli Waste and Emergency Response; EPA/540/0289/054; Washington, DC, 1989.
B-9

1-50. 51. 52. 53. 54. 55. 54. 57.
INTERNAL, DISTRIBUTION
C. B. Doty S. V. Kaye C. C. Travis Central Research Library Document Reference Station Laboratory Records - RC Laboratory Records Department ORNL Patent Office
EXTERNAL DISTRIBUTION
58.
59-68.
Ofice of the Assistant Manager, Energy Research and Development, U. S. Department of Energy, Oak Ridge Operations Office, Oak Ridge, TN 37831 Office of Scientific and Technical Information, P. 0. Box 62, Oak Ridge, TN 37831