the effectiveness of direct comparative advertisements for ... · before you lies the master thesis...
TRANSCRIPT

The effectiveness of direct comparative advertisements for
supermarkets and brands in a Facebook setting
Student Name: Eveline Verdiesen
Student Number: 459756
Supervisor: Dr. Sanne Opree
Master Media & Business
Erasmus School of History, Culture and Communication
Erasmus University Rotterdam
Master. Thesis
August 30, 2017

The effectiveness of direct comparative advertisements for supermarkets and brands in a
Facebook setting
ABSTRACT
The present research examines the effectiveness of comparative advertisements for different
type of segment supermarkets and brands in a social media setting. The hierarchy-of-effects
model was used in this research to define the concept of effectiveness. According to this
model effectiveness can be measured as increased awareness, knowledge, liking, preference,
conviction, and/or purchase intention. In this research, purchase intention was excluded
because the actual buying of a product was not measurable. In terms of methodology, an 2-
by-2 between subjects online experiment was conducted. The effectiveness of comparative
advertisements from high and low segment supermarkets (i.e., Albert Heijn and Aldi) with
high and low segment brands (i.e., Calvé and own label) were compared to each other. The
statistical population included a total of 131 respondents, consisting of 41 men with an
average age of 35.49 and 90 women with an average age of 31.09 years old. The data was
analyzed by using SPSS24, conducting chi-square tests for independence (with Yates’
Continuity Correction) and one-way between-groups analyses of variance with Tukey HSD
and post-hoc comparisons (ANOVAs). The results of the research showed that there was little
evidence for a difference in effectiveness in the combinations of high or low segment stores
and high or low segment brands using direct comparative advertising in a social media
setting. For the components awareness, knowledge, advertisement likeability, store likeability
and conviction there was no difference found. However, a difference was found for brand
likeability and preference. The respondents’ likeability of the brand was higher for the high
segment brand than for the low segment brand. Lastly, respondents preferred the high
segment store and the high segment brand over the low segment store and the low segment
brand. The findings of this research can give an insight in the field of comparative

advertisement in the Netherlands in a social media context. More specifically, these findings
can advise both high and low segment supermarkets on what type of segment brand they can
use best in a comparative advertisement on social media.
KEYWORDS: Direct comparative advertisement, Social media, Low vs. High segment
supermarket, Low vs. high segment brand, Effectiveness, Hierarchy-of-effects model

Preface
Before you lies the master thesis ‘The effectiveness of direct comparative advertisements for
supermarkets and brands in a Facebook setting.’ This thesis was written in the context of my
graduation of the master Media & Business at the Erasmus University in Rotterdam. Before
starting this Master I finished the bachelor Communication & Information Sciences with the
track ‘Corporate Communication and Digital Media’ at Tilburg University.
Along with my thesis supervisor, Dr. Sanne Opree, I formulated the research topic of my
master thesis. After conducting the survey experiment I was able to answer my research
question. During this research, Dr. Sanne Opree stood by my side for the entire proces. She
was always available to answer my questions and did so on a very short notice, enabling me
to proceed with my research without long periods of interruptions. Even when I did not finish
my thesis on time and she was going on a holiday, she left her personal number for me ‘in
case of an emergency.’ Herefore, Dr. Sanne Opree is the first person I would like to thank for
helping me with this master thesis.
The second person I would like to thank is father Bruno Verdiesen, both an inspirator and also
one of my best friends. Besides supporting me financially during my entire life as a student,
he was always there for me to check my homework, papers and even gave tutoring when
needed. I am sure he will always remember our long sittings on statistics and mathemathics.
My father worked hard as Vice President for Capgemini for over 30 years and has always
been an inspiration for both me and my brother to push ourselves to accomplish great things.
Besides, he was always there to play a round of golf with me when I needed a break from
writing this master thesis.
I would also like to thank my mother Wilma van Rijckevorsel, brother Walter Verdiesen and
boyfriend Niels Koornneef for putting up with my temper in times of stress about my study
and particularly this master thesis. There were times in which I was very stressed about this
thesis and I know that I did not was the most pleasant person to be around then. Thank you for
supporting me unconditionally and relativating my thoughts.
I hope you will enjoy reading this thesis.

With kinds regards,
Eveline Verdiesen
Breda, august 28, 2017
Table of Contents
Abstract and keywords
[Preface]
Chapter 1 Introduction ........................................................................................................... 1
1.1 Scientific and Social Relevance ....................................................................................... 3
Chapter 2 Literature Review and Theory ............................................................................... 5
2.1 Hierarchy-of-effects model ............................................................................................... 5
2.1.1 Awareness .................................................................................................................. 6
2.1.2 Knowledge ................................................................................................................. 8
2.1.3 Liking ......................................................................................................................... 9
2.1.4 Preference................................................................................................................. 12
2.1.5 Conviction ................................................................................................................ 13
Chapter 3 Methods ............................................................................................................... 15
3.1 Research Design ........................................................................................................ 15
3.2 Respondents ............................................................................................................... 16
3.3 Stimulus Material ...................................................................................................... 17
3.4 Description of the measures ...................................................................................... 19
3.4.1. Consent form ........................................................................................................... 19
3.4.2. Introductory questions ............................................................................................ 20
3.4.3 Questions about the six concepts of the hierarchy-of-effects model ....................... 20
3.4.3.1 Awareness and Knowledge ................................................................................... 20
3.4.3.2 Liking and Preference ........................................................................................... 21
3.4.3.3 Conviction and Purchase ....................................................................................... 24
3.5 Manipulation Check .................................................................................................. 26
Chapter 4 Results ................................................................................................................. 29
4.1 Awareness and Knowledge ............................................................................................ 29
4.2 Liking and Preference ..................................................................................................... 32
4.2.1 Advertisement Liking .............................................................................................. 32
4.2.2 Store Liking ............................................................................................................. 34
4.2.3 Brand Liking ............................................................................................................ 35
4.2.4 Preference................................................................................................................. 37
4.3 Conviction ...................................................................................................................... 37
Chapter 5 Conclusion & Discussion .................................................................................... 44
5.1 Conclusion ...................................................................................................................... 44
5.1 Awareness ....................................................................................................................... 44
5.2 Knowledge ...................................................................................................................... 45
5.3 Liking .............................................................................................................................. 46
5.4 Preference ....................................................................................................................... 47
5.5 Conviction ...................................................................................................................... 48
5.6 Practical conclusions ...................................................................................................... 49
5.7. Validity: Strengths and limitations ................................................................................ 50
5.7.1. Strengths ................................................................................................................. 50
5.7.2 Limitations ............................................................................................................... 51
5.8 Suggestions for future research ...................................................................................... 52
References 54
Appendix A The Consent Form (Dutch) ................................................................................. 60
Appendix B The Consent Form (English) .............................................................................. 61
Appendix C The questionnaire accessory to condition 1 and condition 3 (Dutch) ................ 62
Appendix D The questionnaire accessory to condition 1 and condition 3 (English) .............. 70
Appendix E The Questionnaire accessory to condition 2 and condition 4 (Dutch) ............... 78
Appendix F The Questionnaire accessory to condition 2 and condition 4 (English) ............. 86
Appendix G Stimuli Material Condition 1 .............................................................................. 94
Appendix H Stimuli Material Condition 2 .............................................................................. 95
Appendix I Stimuli Material Condition 3 .............................................................................. 96
Appendix J Stimuli Material Condition 4 .............................................................................. 97
1
Chapter 1 Introduction
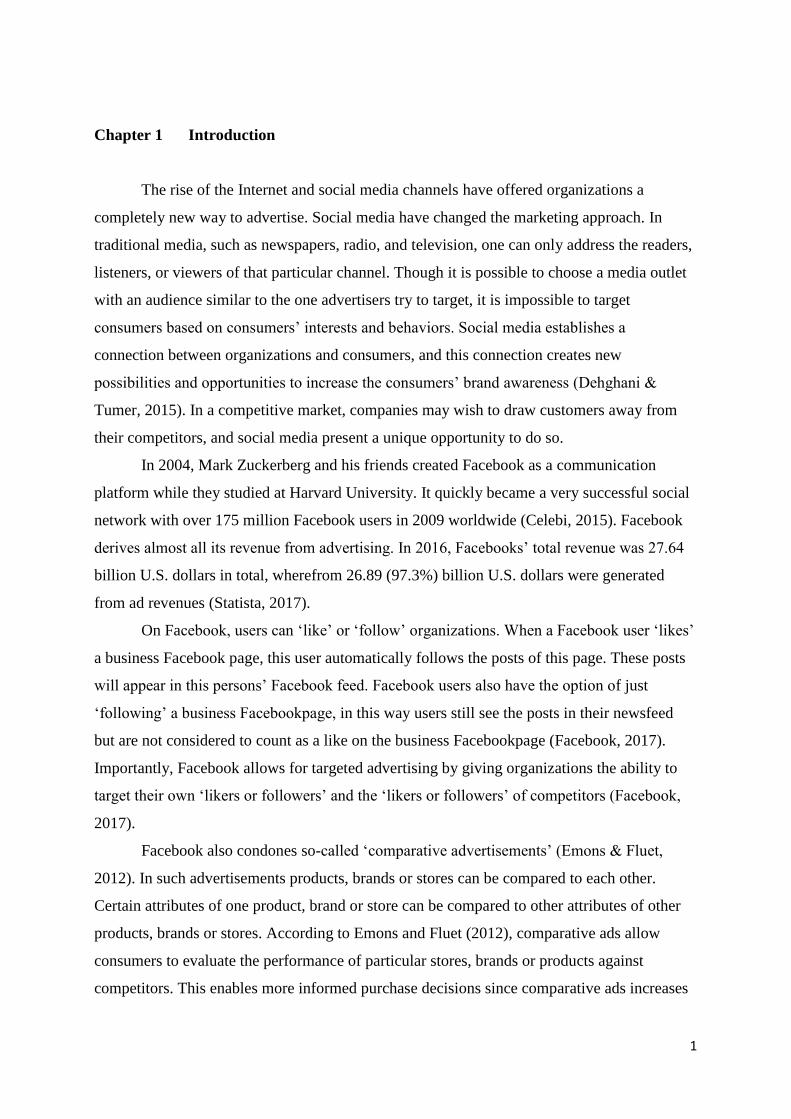
The rise of the Internet and social media channels have offered organizations a
completely new way to advertise. Social media have changed the marketing approach. In
traditional media, such as newspapers, radio, and television, one can only address the readers,
listeners, or viewers of that particular channel. Though it is possible to choose a media outlet
with an audience similar to the one advertisers try to target, it is impossible to target
consumers based on consumers’ interests and behaviors. Social media establishes a
connection between organizations and consumers, and this connection creates new
possibilities and opportunities to increase the consumers’ brand awareness (Dehghani &
Tumer, 2015). In a competitive market, companies may wish to draw customers away from
their competitors, and social media present a unique opportunity to do so.
In 2004, Mark Zuckerberg and his friends created Facebook as a communication
platform while they studied at Harvard University. It quickly became a very successful social
network with over 175 million Facebook users in 2009 worldwide (Celebi, 2015). Facebook
derives almost all its revenue from advertising. In 2016, Facebooks’ total revenue was 27.64
billion U.S. dollars in total, wherefrom 26.89 (97.3%) billion U.S. dollars were generated
from ad revenues (Statista, 2017).
On Facebook, users can ‘like’ or ‘follow’ organizations. When a Facebook user ‘likes’
a business Facebook page, this user automatically follows the posts of this page. These posts
will appear in this persons’ Facebook feed. Facebook users also have the option of just
‘following’ a business Facebookpage, in this way users still see the posts in their newsfeed
but are not considered to count as a like on the business Facebookpage (Facebook, 2017).
Importantly, Facebook allows for targeted advertising by giving organizations the ability to
target their own ‘likers or followers’ and the ‘likers or followers’ of competitors (Facebook,
2017).
Facebook also condones so-called ‘comparative advertisements’ (Emons & Fluet,
2012). In such advertisements products, brands or stores can be compared to each other.
Certain attributes of one product, brand or store can be compared to other attributes of other
products, brands or stores. According to Emons and Fluet (2012), comparative ads allow
consumers to evaluate the performance of particular stores, brands or products against
competitors. This enables more informed purchase decisions since comparative ads increases

2
the consumers’ information about alternative stores, brands or products (Emons & Fluet,
2012).
In the last couple of years, supermarkets in the Netherlands have started a so-called
commercial war against each other. Supermarkets like Albert Heijn, Jumbo, C1000, Aldi and
Dirk have been calling each other out in their commercials and ads (Van Oss, 2010; Van Oss,
2010a; Van Oss, 2015a; Van Oss, 2015b). These ads vary from showing and comparing cash
receipts from competitors to attacking claims or slogans of competitors. For example, Albert
Heijn, which is considered to be a high segment supermarket, attacks both Jumbo (also a high
segment supermarket) and the C1000 (low segment supermarket). When a competitor’s name
is directly mentioned this is called a direct (explicit) comparative ad (Emons & Fluet, 2012).
Direct comparative ads are usually used when the party using it has a feature that is allegedly
better than the competitors (Emons & Fluet, 2012). It is used as a marketing principle to
convince consumers that the offering is better than the competition. When a competitor’s
name is not directly mentioned, when for example an organization compares itself to ‘brand
X’, this is called an indirect (implicit) comparative ad (Emons & Fluet, 2012).
In contrast to existing research, which has mainly focused on the offline ads – more
particularly the influence of a direct comparative ad versus an indirect comparative ad and the
effects of comparative ads on consumers (Emons & Fluet, 2012; Chow & Luk, 2013; Pieters,
Warlop & Wedel, 2002; Pechmann & Stewart, 1990; Snyder, 1992), this research focuses on
the use of direct comparative ads on Facebook. The choice to focus only on Facebook is made
because of its opportunities to advertise on ‘followers’ of the page of the competitor enabling
organizations to ‘hijack’ consumers directly from the competitor. Therefore, Facebook gives
organizations a very convenient platform to use comparative ads. Moreover, based on data
gathered on the 8th of August 2017, Facebook is with over 9,500,000 users the most popular
social network site in the Netherlands (Internet World Stats, 2017).
To define the concept of effectiveness of the persuasive effect in this research the so-
called hierarchy-of-effects model is used. Robert J. Lavidge and Gary A. Steiner originally
founded this model in 1961. In this research, the persuasive effect is composed of the
compliance of the respondents on the six steps of the hierarchy-of-effects model after seeing
the ad. As presented by Lavidge and Steiner, these six steps are considered to be the ‘stages’ a
consumer goes through from viewing a product ad to eventually buying the seen product. It is
considered to be the advertisers’ main job to encourage the consumer to walk through all the
six steps of the hierarchy-of-effects model and buy the product. This research is aimed to
explore what type of segment store in combination with what type of segment brand is the

3
most effective. Hereby, the most effective combination is the combination of the comparative
ad with a certain store and brand segment that persuades the most respondents.
This research specifically investigates the difference between high segment stores and
brands versus low segment stores and brands using comparative ads in a social media setting.
Therefore, it can be beneficial to investigate what advantages a Facebook presence might
have over the use of more traditional comparative marketing strategies (Dehghani & Tumer,
2015). The research employs a 2 (high segment vs. low segment store)-by-2 (high segment vs.
low segment brand) between-subjects experimental design to compare the effectiveness of ads
in which (1) a high segment store compares itself to a low segment store while advertising a
high segment brand, (2) a high segment store compares itself to a low segment store while
advertising a low segment brand, (3) a low segment store compares itself to a high segment
store while advertising a high segment brand, and (4) a low segment store compares itself to a
high segment store while advertising a low segment brand. The following research question is
formulated:
RQ1 Is there a difference in effectiveness in the combinations of high or low
segment stores and high or low segment brands using direct comparative
advertising in a social media setting?
1.1 Scientific and Social Relevance
This research distinguishes between types of stores and brands in order to examine the
most effective combination of store segment and brand segment. A store cannot change its
segment, surely it is either low or high segment, but it can choose if it either uses a
comparative ad towards an upward or downward segment competitor. This research aims to
research and establish when a comparison is effective and when it is not. The research results
can thus result in an advice whether high or low segment stores should engage in comparative
advertising and when they do, whether they should advertise with high or low segment
brands.
Comparative ads are often used by supermarkets (and other companies) in the
Netherlands, but according to Polyorat and Alden (2005, p.37) little research has taken place
to the effects of comparative advertising (in a social media setting) outside the United States.
Polyorat and Alden (2005) state that cross-cultural differences can influence research results
tremendously. An example of an experiment cross-cultural difference by Polyorat and Alden

4
(2005) is the fact that Dutch people are considered to be very avaricious and Germans to be
very punctual (Scheepers, Willems, Cottaar, 1990). Since Dutch people are considered to be
avaricious, comparative ads could have more effect on Dutch people than for example on
Americans. Cross-cultural differences like this can lead to completely different research
results of the same research conducted in different countries (Polyorat & Alden, 2005).
Moreover, Celebi (2015, p. 313) state that “a possible way to get a clear understanding of
Internet advertising highly depends on the reasons why consumers use the Internet.” Internet
use cannot be generalized to other countries, since the drive and motivation of customers can
differ between countries (Celebi, 2015). Therefore, this research can contribute to already
existing research on the effectiveness of the use of comparative ads in a social media setting
and then specifically for the Netherlands. Should the research results be significant, the same
research can be conducted in other countries in order to learn if the related findings can be
generalized to those countries too (Celebi, 2015).

5
Chapter 2 Literature Review and Theory
This research investigates the effectiveness for supermarkets to use direct comparative
ads on social media. The effectiveness is measured in an experiment with the persuasive
effect of the ads on the respondents. To define the concept of effectiveness of the persuasive
effect this research builds on the hierarchy-of-effects model.
2.1 Hierarchy-of-effects model
Robert J. Lavidge and Gary A. Steiner originally founded the hierarchy-of-effects
model in 1961. Figure 1 shows the hypotheses of this research which are draught with an eye
on the hierarchy-of-effects model.
Figure 1 Model of all hypotheses.
The hierarchy-of-effects model is originally developed in the personal selling arena
but is widely adopted, and is still used for almost a century now, by marketing and marketing
practitioners in all kinds of different forms (Koshkaki & Solhi, 2016). The hierarchy-of-
effects model is a marketing model with the following principle: A consumer goes through six
steps starting after viewing a product ad to eventually purchasing the product (see Figure 2).
There is hierarchy in this model because the number of consumers moving on reduces with
each step: Many do not reach the purchase stage. Of course it is the advertiser’s goal to ensure
that many people do (Yun Yoo & Kim, 2005; Alexandris, Tsiotsou & James, 2012).
The hierarchy-of-effects model is a so-called ‘Tricomponent attitude model’, with the
following order of consumer processing: cognitive component (thinking), affective
H1, H2
H3, H4, H5, H6
H7, H8, H9, H10
H11, H12
H13, H14, H15, H16

6
component (feeling) and lastly the conative component (behavior) (Bagozzi, 2010). The
cognitive steps are about the consumer (1) becoming aware of the product and (2) gaining
knowledge about it. The affective steps are about making sure the consumer (3) likes and (4)
prefers the brand. And finally, the conative step is about the consumer (5) having conviction
in the product and (6) buying the product. Conviction is about creating an urge by the
consumer to purchase the product, preferring the product over other alternatives and visit the
store seen in the ad. As said, the advertiser’s goal is to get as many consumers as possible to
step six. The following six sub-paragraphs explain all the steps of the hierarchy-of-effects
model.
Figure 2 The six steps of the hierarchy-of-effects model. Reprinted from Hierarchy of
Effects model, by Marketing Inveterate (2011). Retrieved from
https://gimmecca.wordpress.com/2011/07/25/hierarchy-of-effects-model/.
2.1.1 Awareness
The first step of the hierarchy-of-effects model is the cognitive step awareness.
Awareness is defined as ‘how the consumer gets aware of the existence of the product’. In the
hierarchy-of-effects model the consumer becomes aware of the product by seeing the
product’s ad. It must be kept in mind that consumers see a lot of ads each single day and that

7
they only remember a tiny fraction of brands belonging to these products. There is no
guarantee if a customer will even be aware of the product brand after seeing an ad (Yun Yoo
& Kim, 2005; Alexandris & Tsiotsou, 2012). So one of the most important ‘jobs’ of the
advertizer is for the customer to still be ‘aware’ of the seen store, brand or product for quite
some time after seeing the ad in order for the customer to ‘walk through’ to the next step of
the hierarchy-of-effects model. A really important part of this step for the advertiser is to
know where the targeted consumer stands on the hierarchy model. Is the consumer already
familiar with the store, brand or product or is this the first time that the consumer encounters
it? According to Mihart (2012) a consumer’s store and brand awareness can be increased by
package change, product sampling or a marketing communication activity. Still, the most
important part for the advertiser is knowing how aware the consumer is of the store, brand or
product in order to come up with a strategy to increase the awareness (or increase it even
more, when the awareness is already high) (Mihart, 2012).
Albert Heijn is the high segment store in this research and is with a marketshare of
over 34% and over 850 stores the biggest and oldest supermarketchain in the Netherlands
(Albert Heijn, 2017a). In this research, it is therefore assumed that every respondent already is
aware of the existence of Albert Heijn. The same assumption is made for Aldi, the low
segment store in this research. With 7% Aldi has a considerably lower market share than
Albert Heijn but is still fairly represented in the Netherlands with over 400 stores (Aldi,
2017). It is also assumed that the respondent is already aware of the own label brands of
Albert Heijn and Aldi, which are the low segment brands in this research. Calvé, which is
used as the high segment brand in this research, is also perceived to be familiar to the
respondents as its peanut butter (the product that is used in the ad) is the most well-known in
the Netherlands (Calve, 2017).
It is assumed that the stores and the brands showed in the ads in this research are
already established in a ‘mental link’ between the consumer and the store or brand. A mental
link is established when the interest of a consumer is sparked long enough to establish a link
between the new seen object (store, brand or product) and its category (Smith, Chen & Yang,
2008). Smith, Chen and Yang (2008, p. 50) state that “when the mental link is established, the
consumer is aware of the object and will include it in the consideration set during decision
making.” Given the statistics mentioned above it seems to be likely for consumers to be more
aware of the information that was showed in the ad about the more familiar store Albert Heijn
and the more familiar brand Calvé. The following hypotheses are formulated:

8
H1 After being exposed to an advertisement of said store, respondents are more
aware of a high segment store than of a low segment store.
H2 After being exposed to an advertisement of said brand, respondents are more
aware of the high segment brand than of the low segment brand.
2.1.2 Knowledge
The second step of the hierarchy-of-effects model is also part of the cognitive steps,
namely knowledge. Knowledge involves learning and remembering the claims made in the ad
(Smith, Chen & Yang, 2008). Knowledge can be gained through several ways such as the
Internet, ads, retail advisors or a product package. Unlike the time period wherein the
hierarchy-of-effects model is founded, consumers in today’s modern society can gain
knowledge about a product within the click of a button. It is key for the advertiser to make
sure that there is as much information as possible easily available about a product. Consumers
can and will quickly move to a competing brand if they cannot find information about a
product fast enough (Yun Yoo & Kim, 2005; Alexandris & Tsiotsou, 2012).
Knowledge is also about information or comprehension that a consumer has about
attributes, characteristics or benefits of a product (Mihart, 2012). In order to enhance the
knowledge the consumer has of a store, brand or product Mihart (2012), again, stresses the
importance of analyzing the consumer level of knowledge. Mihart (2012) combines the so-
called Integrated Marketing Communication (IMC) component with the hierarchy-of-effects
model. The IMC components consist of four elements: product, price, distribution and
marketing communications. These four elements transit information to consumers that
enhances their learning process about a product. The more a consumer learns about a store,
brand or product the more purchase and consumption knowledge they acquire (Mihart, 2012).
This learning process is constantly subjected to change when a consumer acquires more
knowledge gained from reading, observation, discussions and actual experience.
Ads mostly promote the brand with positively valued traits associated with the product
(Smith, Chen & Yang, 2008). Most commonly, these positively valued traits are in line with
the four IMC components like the plus sides of a product, a good price, a good distribution
and a positive marketing communication (Mihart, 2012). A brand can also choose to advertise
in a different way and disassociate the brand with negatively evaluated traits such as a high
price (Smith, Chen & Yang, 2008). All this information given in an ad is learned by

9
consumers and becomes represented in the memory as brand-related beliefs. Smith, Chen and
Yang (2008) state that the more a consumer associates a brand with positive traits, the more
the consumer will favor this brand towards the purchase.
Emons and Fluet (2012) define brand familiarity as easy recognition of a well-known
brand. The research of Orsingher and colleagues (2010) shows that ‘purchasing the most
familiar brand’ is a dominant choice technique for consumers that have little experience with
a product or brand. Even when the quality of the most familiar brand was manipulated to be
lower, consumers still greatly went with the most familiar brand (Orsingher et al, 2010). A
consideration set (or evoked set) is defined by Wirtz & Mattila (2003) as the subset of top-of-
mind brands consumers evaluate when they are making a choice. The higher the brand
familiarity, the more likely it is for the brand to be in a consumers consideration set (Wirtz &
Mattila, 2003; Orsingher et al., 2010; Shapiro et al, 1997). Given the research results
mentioned above it seems to be likely for consumers to pay more attention to the attributes in
the ad of the more familiar store Albert Heijn and the more familiar brand Calvé. The
following hypotheses are formulated:
H3 The respondents’ knowledge of the product’s price is higher for the high
segment store than for the low segment store.
H4 The respondents’ knowledge of the product’s price is higher for the high
segment brand than for the low segment brand.
2.1.3 Liking
The third step of the hierarchy-of-effects model is liking. Liking is considered to be a
part of the affective steps of the model. It is the advertisers’ job to ensure that a customer likes
the product in the ad. Likeability can be defined as the feelings and affect level (like or
dislike) that consumers have for a store, brand or product (Belch & Belch, 2008). The
research of Smith, Chen and Yang (2008) shows that consumers are influenced by their
affective reactions to an ad. An example of such an affective reaction is the perceived
entertainment value of an ad and / or the affect that is transferred from more favorable ad
attitudes. So the more entertainment value an ad has, the more a consumer is positively
influenced by it (Smith, Chen & Yang, 2008).

10
According to Mihart (2012), the consumer’s attitude is influenced by the product,
price, distribution, and marketing communications. The consumer’s attitude is also formed
from direct or vicarious experience that one has with the store, brand or product (Mihart,
2012). This could either be favourable or onfavourable. It is likely to assume that consumers
like the more familiar store and brand in combination with the best price more than the less
familiar store and brand.
According to Bagozzi (2010), liking is about a consumer associating an object (stores /
brand etcetera) and the belonging attributes with certain feelings, sentiments, moods, values,
and emotions. The consumer evaluates and judges the object with these associations. Within
split seconds a consumer ‘labels’ an object with a like or a dislike. These feelings, sentiments,
moods, values, and emotions in a consumers mind are almost impossible to prepossess.
However, they are crucial in influencing behavior as is showed by the domino-model of
communication effects: when a so-called ‘attitude domino’ does not fall (because it is ‘stuck’
to emotions etcetera) then the ‘domino of behavior’, or in the hierarchy-of-effects model the
next step, will not be activated by its fall (Bagozzi, 2010).
The mere exposure effect is defined as people tending to prefer familiar to unfamiliar
objects. The frequency of exposure increases the consumer’s feelings of familiarity. The more
a consumer feels like something is familiar, the more likeable they consider it (Goodrich,
2011; Dreze, 2003; Janiszewski, 1993). Consumers can develop positive attitudes towards
objects, even when they cannot give the exact reason why they do. Brand preference can thus
be created by often repeating ads (Goodrich, 2011; Dreze, 2003; Janiszewski, 1993). These
are called low-attention effects (Goodrich, 2011). Recent research of Goodrich (2011) and
Maheswaran and Peracchio (2006) underline the impact of implicit processes on consumer
behaviour as one of the main themes that have emerged from consumer research in the past 15
years. Goodrich (2011) states that mere exposure effects were also identified by recent
research in low-attention situations. Goodrich (2011) also states that it is very well possible
for consumers to have different attitudes towards the same object. This can both be an implicit
attitude (consumer is unaware of the basis of this evaluation) as an explicit attitude that can be
formed by for example experience with an object or seeing an ad about the object. Both these
attitudes remain in the consumer memory and contribute to the consumer’s decision-making
process (Goodrich, 2011).
The mere exposure effect is relevant to this research because it can explain why people
like more ‘well-known’ brands better than unfamiliar lower-share brands. Calvé is perceived
to be more well-known than the own labels of Albert Heijn and Aldi since Calvé has a bigger

11
marketshare and advertising budget than the low segment brands. The same principle goes for
the more familiar high segment store Albert Heijn who has the means to advertise more on
multiple channels such as TV, radio and the Internet than the low segment store Aldi. In the
Netherlands, Albert Heijn held the third place in 2013 on the top 100 mediacosts list
(Intermediair, 2013). Albert Heijn has spent 75 million euros’s on marketing and advertising
in the year 2013 alone. The low segment store Aldi was not even mentioned in the top 100
list.
The research results of Chow and Luk (2013) imply that familiar brands profit more
from the use of comparative ads than less familiar brands. In addition, Chow and Luk (2013)
remark that it is ‘safer’ for familiar brands to incorporate a brand comparison in a
comparative ad than for less familiar brands to do so. Less familiar brands should avoid a
direct comparison with a well-known competitor (Chow & Luk, 2013). With an eye on the
existing literature the following hypotheses are formulated:
H5 The respondents’ liking of the advertisement is higher for the high segment
store than for the low segment store.
H6 The respondents’ liking of the advertisement is higher for the high segment
brand than for the low segment brand.
H7 The respondents’ liking of the store is higher for the high segment store than
for the low segment store.
H8 The respondents’ liking of the store is higher for the high segment brand than
for the low segment brand.
H9 The respondents’ liking of the brand is higher for the high segment store than
for the low segment store.
H10 The respondents’ liking of the brand is higher for the high segment brand than
for the low segment brand.

12
2.1.4 Preference
The fourth step and last step of the affective steps of the hierarchy-of-effects model is
preference. It is possible for consumers to like more than one product and brand. In this
setting, consumers can buy any one of the options given. It is the job of the advertiser to make
sure that a consumer buys their particular product and thus prefers this above products of
competitors. To ensure that the customer establishes a store, brand or product as a preference
the customer needs to move past the step of mere liking the product. When a consumer
prefers a certain store, brand or product that object creates approach behaviors from the
consumer (Smith, Chen & Yang, 2008).
Mihart (2012) states that the consumer’s preference is reflected in purchase motivation
the stronger the level of affect gets. A consumer passes through the last steps of the hierarchy-
of-effects model, the conative / behavioural stage, when a consumer believes that a certain
brand / product fulfills his aspirations and needs. Then, the consumer determines his
conviction to purchase the product (Mihart, 2012). A consumer’s motivation has the strength
to activate behaviour. With the right marketing communications component, which in this
research is the use of a comparative ad, preference can be influenced (Mihart, 2012).
Advertisers can use a comparative ad to highlight their brand’s benefits and unique
selling points in contrast to competitors. According to Muthukrishnan and Chattopadhyay
(2007), comparative ads are not effective when a consumer already has a negative first
impression of a brand or a company. Comparative ads are thus not effective in changing
already existing negative attitudes. In addition, the research results of Iyer, Soberman and
Villas-Boas (2005) imply that loyal customers to a brand are not sensitive to cheaper prices of
rival brands. Iyer, Soberman and Villas-Boas (2005) define loyal customers as consumers that
have a strong preferene for one particular brand. However, Esteves and Resende (2016) are
less explicit in their conclusion about consumers and brand loyalty. Esteves and Resende
(2016, p.578) claim that they ‘‘first assume that customers in a certain market segment prefer
the corresponding brand by a certain amount but are willing to consider buying the rival brand
if the price difference is conducive. Consumers may switch brands for pricing reasons.’’ In
this research, the high segment store Albert Heijn is offering a better price at the high segment
brand Calvé than the low segment store Aldi on the Calvé product (per recap, see page 3).
Moreover in another condition, the high segment store Albert Heijn is offering a better price
at the low segment own label than the low segment store Aldi on their own label. In the other
two conditions, low segment store Aldi is offering the high segment brand Calvé and low
segment brand own label for a better price than Albert Heijn. Given the literature above it is

13
likely to assume that the preference of consumers goes to the high segment store Albert Heijn
above the low segment store Aldi and to the high segment brand Calvé above the low segment
brand own label. This leads to the formulation of the following hypotheses:
H11 Respondents prefer the high segment store above the low segment store.
H12 Respondents prefer the high segment brand above the low segment brand.
2.1.5 Conviction
The second last step of the hierarchy-of-effects model addressed here and the first step
of the conative steps is conviction. Conviction is about creating a desire by the consumer to
purchase the product seen in the ad. Conviction thus mostly refers to the consumer’s
behavioral intentions or intended behaviour (Bagozzi, 2010). The four IMC components
(product, price, distribution and marketing communications) as formulated by Mihart (2012)
are also critical to the consumer’s conviction process (Yeboah & Atakora, 2013). Yeboah and
Atakora (2013) state that in today’s competitive environment, organizations should constantly
communicate with their customers and potential customers. Yeboah and Atakora (2013), like
Mihart (2012), also underline that organizations should provide a quality product and / or
service, attractive prices and easy acces to their customers. The component that brings all of
this together is a good marketing communication. The marketing communication used in this
research is comparative advertising. Consumers’ perceptions and attitudes towards certain
objects (store, brand and products) may be influenced through the ad and the message the ad
sends. The ad has the role to convince customers to purchase the product seen in the ad at the
store seen in the ad (Yeboah & Atakora, 2013).
In this research, the last step of the hierarchy-of-effects model, namely purchase is not
included in the measurements. Since the respondent actually buying the product is not
measurable. Herefore, conviction is measured in two ways in this research. The hypotheses
about conviction and solely purchase intention are separated from eachother. Firstly,
conviction is measured in an extensive way by asking the respondents if they preferred the
Albert Heijn, Aldi, Calvé and own label above competitors. Hereafter, respondents were
asked if they recommended Albert Heijn, Aldi, Calvé and own label to friends and
acquaintances. Lastly, respondents were asked if they considered purchasing products at
Albert Heijn and Aldi and from Calvé and own label. After these questions, conviction was

14
also measured by solely looking at the purchase intentions of the respondents. Respondents
were thus asked how likely it was for them to purchase a product at the Albert Heijn and Aldi
and a product from Calvé and own label.
Emons and Fluet (2012) state that comparative ads are more effective in increasing
purchase intentions and purchase behavior than traditional ads. However, the observed
increase in purchase intentions was merely achieved by highlighting differentiations from the
marketleader or by explaining how the advertising brand has better features than the market
leader. This is backed by the classical research results of Grewal and colleagues. (1997);
Pechmann and Stewart’s (1990); Manning and colleagues. (2001) and Gotlieb and Sarel
(1991).
A higher brand familiarity goes in line with a higher purchase intention. These results
are in line with the researches of Goodrich (2011) and Dreze (2003) and the more classical
research of Janiszewski (1993), which state that consumers like products more when they
have already processed the information in the ad preattentively than if they have not been
exposed to it. Considering the literature mentioned above, it is assumed that consumers feel
more conviction for and plan to purchase more at the high segment store and from the high
segment brand. This leads to the formulation of the following hypotheses:
H13 The respondents’ conviction is higher for the high segment store than for the
low segment store.
H14 The respondents’ conviction is higher for the high segment brand than for the
low segment brand.
H15 The respondents’ purchase intentions for the advertised product is higher for
the high segment store than for the low segment store.
H16 The respondents’ purchase intentions for the advertised product is higher for
the high segment brand than for the low segment brand.

15
Chapter 3 Methods
3.1 Research Design
In this research, the use of comparative ads on social media was investigated through
an experiment. The effect on persuasiveness of direct comparative ads on social media was
investigated with a questionnaire for ‘high segment’ brands versus ‘low segment’ stores and
brands. The persuasive effect was composed of the compliance of the respondents to the six
steps of the hierarchy-of-effects model after seeing the ad. This was done by a 2 (‘high
segment’ versus ‘low segment’ store) by 2 (high segment versus low segment brands)
research design, resulting in 4 distinct experimental conditions. The high and low segment
brands and the high and low segment brands were the independent variables in this research.
The first five steps of the hierarchy-of-effects model were the dependent variables in this
research. The final step, ‘purchase’, was not included as a variable since the respondent can
only complete this step after filling in the questionnaire. In this study, a between-subjects
design was used. Every respondent only got to see one type of store and brand. Figure 3
shows the conceptual model of this research.
Figure 3 Conceptual model of the research design.
To conduct this research an online questionnaire built with the web-based survey
service of Qualtrics (www.qualtrics.com) was used. Via the Erasmus University there was
access to a ‘student’ Qualtrics account and four surveys plus a survey randomizer were
created. For creating the stimuli material the graphic design software of the website Canva
(www.canva.com) was used.
H1, H2
H3, H4, H5, H6
H7, H8, H9, H10
H11, H12
H13, H14, H15, H16
16
To spread the online questionnaire the social net worksite Facebook was used mostly.
I recruited respondents through social media, approaching family, friends and acquaintances,
asking them to participate and to forward the invitation and/or share it on their Facebook
timeline. This method of sampling is called snowball sampling (Matthews & Ross, 2010). The
relevance of snowball sampling can be found in the fact that this research focuses on social
media. By approaching respondents through social media channels, I was sure that they are
actually using social media. I deliberately approached men and women of several age groups
to ensure the external validity of the experiment.
The respondents were able to fill in the questionnaire on their laptop, tablet and mobile
with no time limit. The online questionnaire started with an introductory text about the
researcher, the nature of the investigation and the goal where the research results will be used.
Then the respondents could click on the bottom ‘further’ and were then, through the survey
randomizer, assigned to one of the four conditions. At the end of the survey, the respondent
got the possibility to fill in their e-mail address in order to win one of the two gift vouchers.
Among the respondents two gift vouchers were raffled off with a value of 25,- each. The
raffling of the gift voucher was also communicated with the spreading of the survey. The
raffling of the gift voucher is a form of creating reciprocity. According to Matthews and Ross
(2010) reciprocity is one of the six basic principles of social influencing. Giving something
away (the chance on a gift voucher) increases the compliance of the respondents (Matthews &
Ross, 2010).
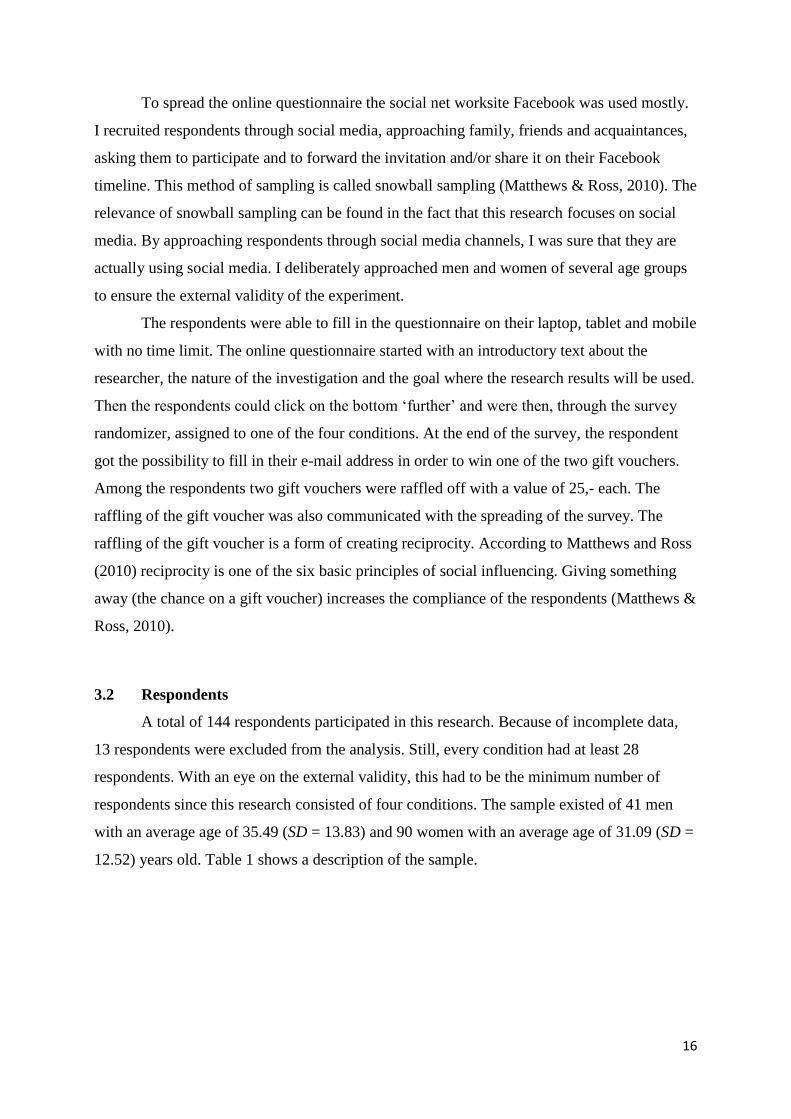
3.2 Respondents
A total of 144 respondents participated in this research. Because of incomplete data,
13 respondents were excluded from the analysis. Still, every condition had at least 28
respondents. With an eye on the external validity, this had to be the minimum number of
respondents since this research consisted of four conditions. The sample existed of 41 men
with an average age of 35.49 (SD = 13.83) and 90 women with an average age of 31.09 (SD =
12.52) years old. Table 1 shows a description of the sample.

17
Table 1 Description of the sample in total and per condition
Total
(N=131)
Condition 1
(N=28)
Condition 2
(N=38)
Condition 3
(N=31)
Condition 4
(N=34)
Gender N (%)
Male 35.49
(13.83)
11 (39,3%) 13 (34,2%) 10 (32,3%) 7 (20,6%)
Female 31.09
(12.52)
17 (60,7%) 25 (65,8%) 21 (67,7%) 27 (79,4%)
Age in years
M (SD)
32.47
(13.06)
31.79 (13.05) 33.66 (14.36) 31.65 (12.11) 32.44 (12.85)
Occupation N
(%)
Student 51 (38.9%) 10 (35.7%) 14 (36.8%) 14 (45.2%) 13 (38.2%)
Employee 66 (50.4%) 15 (53.6%) 19 (50.0%) 16 (51.6%) 16 (47.1%)
Entrepreneur 9 (6.9%) 2 (7.1%) 3 (7.9%) 2 (6.5%) 2 (5.9%)
No job / in
between jobs
6 (4.6%) 0 1 (2.6%) 2 (6.5%) 3 (8.8%)
Other 8 (6.1%) 3 (10.7%) 3 (7.9%) 0 2 (5.9%)
Shops for
groceries N
(%)
On a daily
basis
50 (38.2%) 10 (35.7) 12 (31.6%) 14 (45.2%) 14 (41.2%)
On a weekly
basis
76 (58.0%) 17 (60.7%) 25 (65.8%) 17 (54.8%) 17 (54.8%)
On a monthly
basis
5 (3.8%) 1 (3.6%) 1 (2.6%) 0 3 (8.8%)
Never 0 0 0 0 0
3.3 Stimulus Material
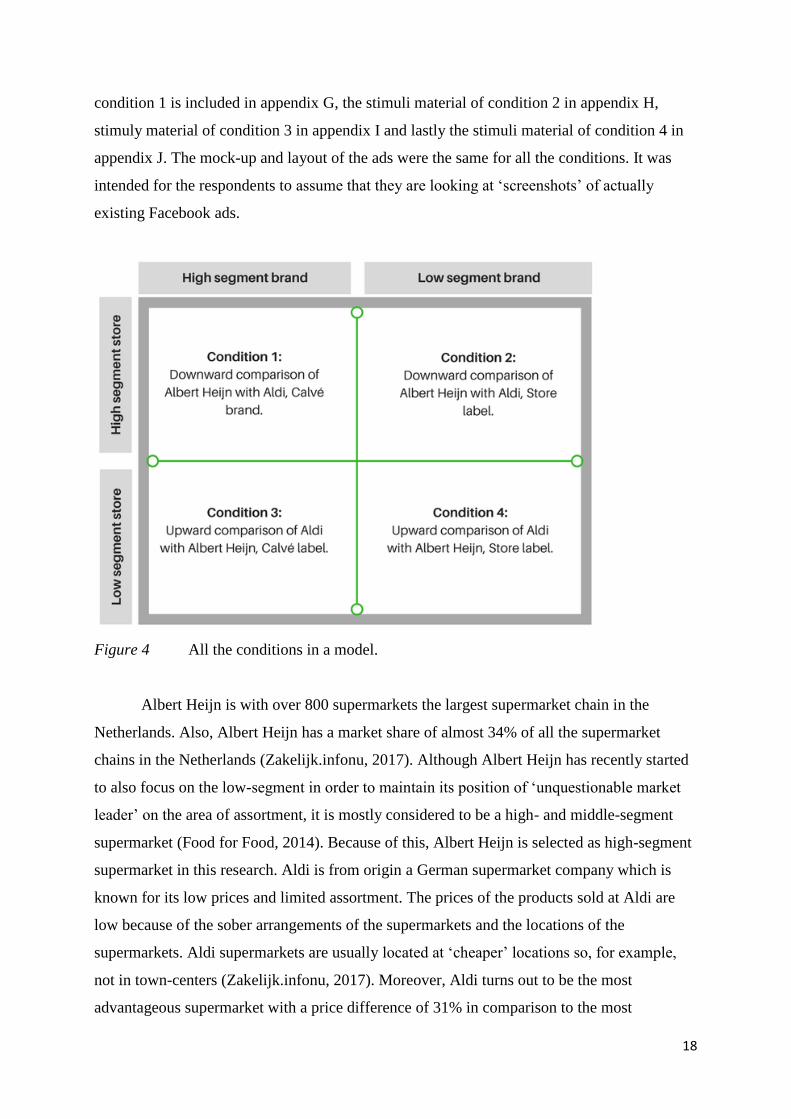
In this research, an experiment with 4 conditions is conducted. Figure 4 shows all the
conditions in a model. Based on the look of the true-life ads of the supermarkets Albert Heijn
and Aldi four comparative social media ads are created. The stimuli material corresponding to
18
condition 1 is included in appendix G, the stimuli material of condition 2 in appendix H,
stimuly material of condition 3 in appendix I and lastly the stimuli material of condition 4 in
appendix J. The mock-up and layout of the ads were the same for all the conditions. It was
intended for the respondents to assume that they are looking at ‘screenshots’ of actually
existing Facebook ads.
Figure 4 All the conditions in a model.
Albert Heijn is with over 800 supermarkets the largest supermarket chain in the
Netherlands. Also, Albert Heijn has a market share of almost 34% of all the supermarket
chains in the Netherlands (Zakelijk.infonu, 2017). Although Albert Heijn has recently started
to also focus on the low-segment in order to maintain its position of ‘unquestionable market
leader’ on the area of assortment, it is mostly considered to be a high- and middle-segment
supermarket (Food for Food, 2014). Because of this, Albert Heijn is selected as high-segment
supermarket in this research. Aldi is from origin a German supermarket company which is
known for its low prices and limited assortment. The prices of the products sold at Aldi are
low because of the sober arrangements of the supermarkets and the locations of the
supermarkets. Aldi supermarkets are usually located at ‘cheaper’ locations so, for example,
not in town-centers (Zakelijk.infonu, 2017). Moreover, Aldi turns out to be the most
advantageous supermarket with a price difference of 31% in comparison to the most

19
expensive supermarket in the Netherlands according to the television show ‘Kassa’ (which
means: cash desk) (Fooglog, 2016). This is why Aldi is selected as low-segment supermarket
in this research.
Calvé is a Unilever brand that was founded in 1898 from a merger between the Dutch
Oil fabric in Delft and the French company of the brothers Emmanuel and George Calvé.
Calvé stands for quality and the best flavors (Unilever, 2017). Calvé is a brand that focuses on
delivering the best quality to its customers and can be categorized as a high-segment brand
considering its prices in comparison to competitors. Therefore, Calvé is chosen as the high-
segment brand in this research. Albert Heijn’s and Aldi’s own label are used as the low-
segment brands in this research. Albert Heijn’s own label promises a low price with still an
excellent quality because of large-scale purchasing and direct bonds with suppliers (AH,
2017). Aldi’s own label is the cheapest own label in comparison to other supermarkets’ own
labels in the Netherlands (Foodlog, 2016).
3.4 Description of the measures
Through an online experiment questionnaire (survey), it is investigated how
respondents evaluated the stores, brands and ads. The questionnaire consisted of three parts,
being the consent form (see Appendix A), introductory questions and questions about the six
concepts of the hierarchy-of-effects model. The questionnaire was the same for all the
conditions; only the names of the brands, stores and the accessory evaluation questions were
changed to match every condition. In the questionnaire, only already existing and established
brands were used in order to increase credibility. The questionnaires that were used for the
survey can be found in appendix C and E; the first was used for condition 1 and condition 3,
the latter for conditions 2 and 4. Appendix B contains a translation of the consent form from
Dutch to English. Appendix D and F contain translations of the questionnaire from Dutch to
English. These translations are merely added for the second reader of this research and were
not used in the research itself.
3.4.1. Consent form
The consent form started with discussing what the study is about, what the respondent
was asked to do and the voluntary participation. According to the research methods of
Matthews and Ross (2010) respondents should be informed about the way the findings of the

20
research are disseminated, to enable them to make a proper decision about participation.
Hereafter, the consent form addressed the confidentiality of the respondents’ answers and
how the respondent could get in touch with the researcher and obtain the results of the study.
This was done to assure the respondents that they would not be identified in the research and
that their input to the experiment would be confidential (Matthews & Ross, 2010). Then it
named the email-address of the researcher and a checkbox for the respondents where they
could mark if they fully understood the terms and conditions of the research. Only then they
were able to participate.
3.4.2. Introductory questions
The online questionnaire started with a couple of introductory questions. These
introductory questions had a multiple-choice format and covered the demographics of the
respondents such as gender, age and job. According to the research methods of Matthews and
Ross (2010), it is important to gather information about the respondents themselves and their
demographics in order to have a complete image of the research sample. In addition the
respondents were asked how often they go grocery shopping. This information was needed
because of the answers of respondents who never or almost never go grocery shopping were
perceived to be not very relevant for this research, which is why they were redirected to the
end of the survey.
3.4.3 Questions about the six concepts of the hierarchy-of-effects model
3.4.3.1 Awareness and Knowledge
After the introductory questions, a page break and an explanatory text followed that
instructed the respondents’ to take a look at the print screens of the Facebook ads.
Respondents were showed one of the four adsaccessory to one of the four conditions. In the
hierarchy-of-effects model awareness is constructed out of the way a consumer becomes
aware of the existence of the product (Yun Yoo & Kim, 2005; Alexandris & Tsiotsou, 2012).
To measure if the respondent was aware of the store and brand showed in the ad and
remembers them, two aided recall questions were being asked. These questions were:
(1) From which of the stores displayed underneath did you just saw an advertisement?
(2) From which of the brands displayed underneath did you just saw an advertisement?

21
For the first question, respondents could choose from the options Albert Heijn, Jumbo,
Aldi, C1000, and Lidl, and for the second question from the options Calvé, Croma, and
Huismerk. In both instances, their responses were recoded as right (1) or wrong (0). In the
analysis of the respondents’ awareness of the store, the responses of condition 1 and condition
2 were grouped together into one variable since both conditions showed respondents the
Albert Heijn ad. The responses of condition 3 and condition 4 were also grouped together into
one variable since those two conditions showed the respondents the Aldi ad.
In the analysis of the respondents’ awareness of the brand, condition 1 and condition 3
were grouped together into one variable since both conditions showed respondents the Calvé
brand ad. Condition 2 and condition 4 were also grouped together into one variable since
those two conditions showed the respondents the own label ad.
To measure knowledge about the mentioned prices in the ads of the stores and brands,
respondents were asked two aided recall questions. In the hierarchy-of-effects model,
knowledge is reached when the consumer has gained knowledge about a product (Yun Yoo &
Kim, 2005; Alexandris & Tsiotsou, 2012). These recall questions measuring the respondents’
knowledge on the price of the product were:
(1) What was the price of the two jars of (Calvé or own label) peanut butter in the
advertisement of Albert Heijn?
(2) What was the price of the two jars of (Calvé or own label) peanut butter in the
advertisement of Aldi?
In the analysis, these two questions were recoded into one binary question (0 = wrong
answer; 1 = right answer). The right answers for condition 1 and condition 2 were 1.99 and
3.00, for condition 3 and 4 the right answers were 1.99 and 2.99.
3.4.3.2 Liking and Preference
For measuring the respondents’ liking and preference of the store and brand a pool of
items with a Likert-type scale was used. A Likert-type scale is often used to measure attitudes
directly. This attitude measurement was operationalized by asking respondents to respond to a
series of statements about a topic in terms to the extent to which they agree with them (Likert,
1932). Likert-type scales are the most used scales in (online) questionnaires (Lavrakas, 2008).
22
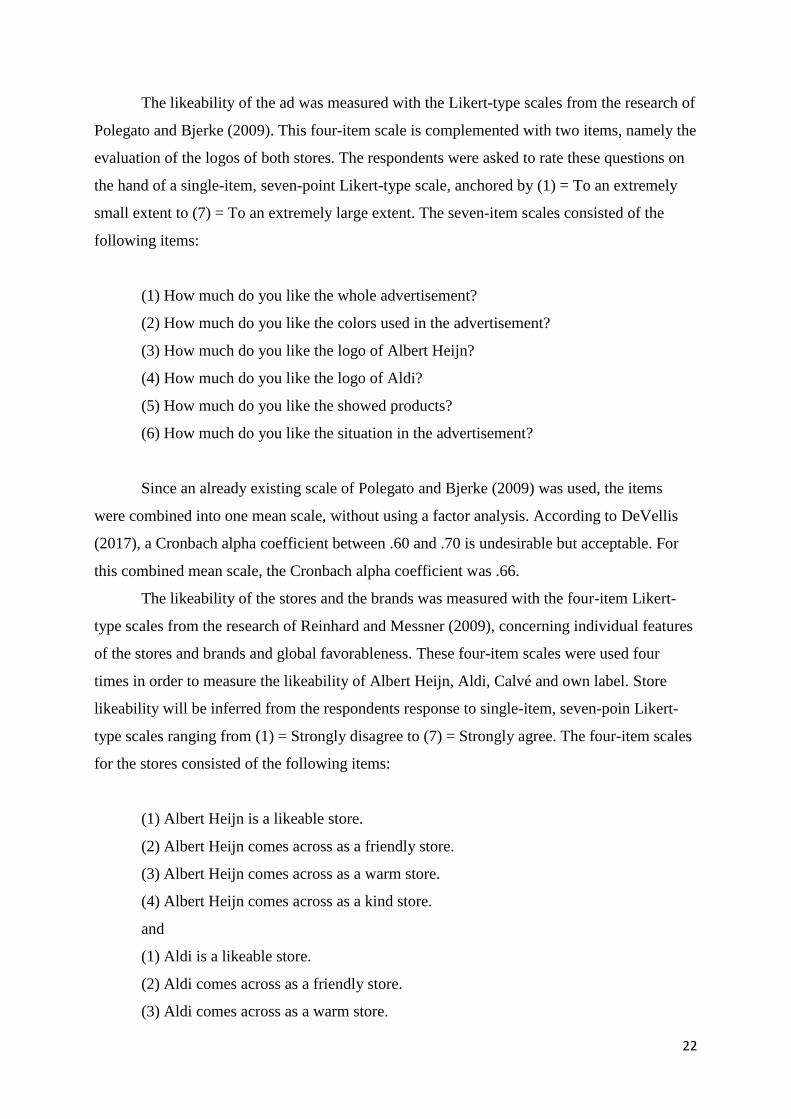
The likeability of the ad was measured with the Likert-type scales from the research of
Polegato and Bjerke (2009). This four-item scale is complemented with two items, namely the
evaluation of the logos of both stores. The respondents were asked to rate these questions on
the hand of a single-item, seven-point Likert-type scale, anchored by (1) = To an extremely
small extent to (7) = To an extremely large extent. The seven-item scales consisted of the
following items:
(1) How much do you like the whole advertisement?
(2) How much do you like the colors used in the advertisement?
(3) How much do you like the logo of Albert Heijn?
(4) How much do you like the logo of Aldi?
(5) How much do you like the showed products?
(6) How much do you like the situation in the advertisement?
Since an already existing scale of Polegato and Bjerke (2009) was used, the items
were combined into one mean scale, without using a factor analysis. According to DeVellis
(2017), a Cronbach alpha coefficient between .60 and .70 is undesirable but acceptable. For
this combined mean scale, the Cronbach alpha coefficient was .66.
The likeability of the stores and the brands was measured with the four-item Likert-
type scales from the research of Reinhard and Messner (2009), concerning individual features
of the stores and brands and global favorableness. These four-item scales were used four
times in order to measure the likeability of Albert Heijn, Aldi, Calvé and own label. Store
likeability will be inferred from the respondents response to single-item, seven-poin Likert-
type scales ranging from (1) = Strongly disagree to (7) = Strongly agree. The four-item scales
for the stores consisted of the following items:
(1) Albert Heijn is a likeable store.
(2) Albert Heijn comes across as a friendly store.
(3) Albert Heijn comes across as a warm store.
(4) Albert Heijn comes across as a kind store.
and
(1) Aldi is a likeable store.
(2) Aldi comes across as a friendly store.
(3) Aldi comes across as a warm store.

23
(4) Aldi comes across as a kind store.
Because an already existing scale of Reinhard and Messner (2009) was used, the items
were combined into one mean scale, without using a factor analysis. According to DeVellis
(2017), a Cronbach alpha coefficient between .70 and .90 is acceptable. For this combined
mean scale, the Cronbach alpha coefficient was .73.
The four-item scales for the brand consisted of the following items for condition 1 and
condition 3. These items were also combined into one mean scale with a Cronbach alpha
coefficient of .82:
(1) Calvé is a likeable brand.
(2) Calvé comes across as a friendly brand.
(3) Calvé comes across as a warm brand.
(4) Calvé comes across as a kind brand.
The four-item scales for the brand consisted of the following items for condition 2 and
condition 4. Lastly, these items were combined into one mean scale with a Cronach alpha
coefficient of .82:
(1) Own label is a likeable brand.
(2) Own label comes across as a friendly brand.
(3) Own label comes across as a warm brand.
(4) Own label comes across as a kind brand.
To measure the respondents’ preference for the store and for the brand two
comparison questions were asked. Both the store and brand were compared to the competitor.
Respondents were asked which store and brand they preferred above the other. These
questions were:
(1) Which store do you like better?
o Albert Heijn
o Aldi
(2) Which brand do you like better?
o Calvé

24
o Own label
In the analysis, the ‘Albert Heijn’ (high segment store) conditions 1 and 2 were
grouped together into one binary variable (0 = Albert Heijn; 1 = Aldi). The ‘Aldi’ (low
segment store) conditions 3 and 4 were also grouped together into binary one variable (0 =
Albert Heijn; 1 = Aldi). Moreover, the ‘Calvé’ (high segment brand) conditions 1 and 3 were
grouped together into one binary variable (0 = Calvé; 1 = own label). Lastly, the ‘own label’
(low segment brand) conditions 2 and 4 were grouped together into one variable (0 = Calvé; 1
= own label).
3.4.3.3 Conviction and Purchase
Conviction was measured with questions based on the measurement of ‘behavioral
intentions’ of Alexandris and Tsiotsou (2012). It must be noted that the measurement of
purchase intentions (conviction) is the closest step to actual consumer behavior but there is no
guarantee that a positive purchase intention translates into actual purchase behavior (Baker &
Crompton, 2000; Madrigal, 2001). Therefore, in contrast to the research of Alexandris and
Tsiotsou (2012), the respondents were not asked about how certain it was that they would buy
at one (or both) of the stores and buy products from the named brands in the ad. For all four
of the conditions, the 12-item Likert scales consisted of the following items:
(1) I prefer Albert Heijn above competitors
(2) I prefer Aldi above competitors
(3) I prefer Calvé above competitors
(4) I prefer own label above competitors
(5) I recommend Albert Heijn to my friends and acquaintances
(6) I recommend Aldi to my friends and acquaintances
(7) I recommend Calvé to my friends and acquaintances
(8) I recommend own label to my friends and acquaintances
(9) I am considering buying products at Albert Heijn
(10) I am considering buying products at Aldi
(11) I am considering buying products from Calvé
(12) I am considering buying products from own label.

25
The twelve seven-point Likert scales were anchored by (1) = Strongly disagree to (7)
Strongly agree to measure the respondents’ conviction after reading and looking at the ad.
The only difference between the conditions was that for condition 2 and condition 4 (ads
showed only own label brands) the words ‘peanut butter’ were placed behind Calvé. This was
to clarify to the respondents that Calvé was the A-label alternative for the own label brands of
which they saw an ad.
Since an already existing scale of Alexandris and Tsiotsou (2012) was used, the items
measuring the same store of brand are combined into one mean scale, without using a factor
analysis. To make this clearer, the items that are combined into one mean scale are marked in
the same color. According to DeVellis (2017), a Cronbach alpha coefficient between .70 and
.90 is acceptable. Firstly, the items concerning Albert Heijn were combined into one mean
scale, with a Cronbach alpha coefficient of .75. Secondly, the items concerning Aldi were
combined into one mean scale, with a Cronbach alpha coefficient of .77. Thirdly, the items
concerning Calvé were combined into one mean scale, with a Cronbach alpha coefficient of
.86. Lastly, the items concerning own label were combined into one mean scale, with a
Cronbach alpha coefficient of .68, which is considered undesirable but acceptable by DeVellis
(2017).
In addition, the respondents were asked with four seven-point Likert-scales anchored
by (1) = very unlikely (7) = very likely to report how likely it was that they would ‘‘Consider
buying products at the store’’ and ‘‘Consider buying products from the brand’’. These items
were based on the measurement method for measuring ‘behavioral intentions’ by Alexandris
and Tsiotsou (2012), only they were formulated differently to ‘weaken’ the statements from
‘certainty’ of buying products to ‘likelihood’ of buying products. These items were:
(1) How likely is it that you will buy products at Albert Heijn?
(2) How likely is it that you will buy products at Aldi?
(3) How likely is it that you will buy products from Calvé?
(4) How likely is it that you will buy products from own label brands?
The only difference between the conditions was that for condition 2 and condition 4
(ads showed only own label brands) the words ‘peanut butter’ were placed behind Calvé. This
was to clarify to the respondents that Calvé was the high segment alternative for the own label
brands of which they saw an ad.
26
3.5 Manipulation Check
In this research a manipulation check on the respondents’ evaluation of both the stores
and brands was conducted. This was done to verify that the independent variable
manipulation had the effect that was intended and thus to guarantee internal validity. The
respondents were asked to evaluate Albert Heijn, Aldi, Calvé and own label as either: (1)
High segment, (2) Middle segment, (3) Low segment. The results of the manipulation test are
presented in Table 2.

27
Table 2 Store and brand segment manipulation check N (%)
Total
(N=131)
Condition 1
(N=28)
Condition 2
(N=38)
Condition 3
(N=31)
Condition 4
(N=34)
Albert Heijn:
High segment
Middle
segment
Low segment
111 (84.73%)
20 (15.27%)
0
23 (82.1%)
5 (17.9%)
0
32 (84.2%)
6 (15.8%)
0
27 (87.1%)
4 (12.9%)
0
29 (85.3%)
5 (14.7%)
0
Aldi:
High segment
Middle
segment
Low segment
2 (1.53%)
72 (54.96%)
57 (43.51%)
0
18
(64.29%)
10
(35.71%)
2 (5.26%)
21 (55.26%)
15 (39.47%)
0
10 (32.26%)
21 (67.74%)
0
23 (67.65%)
11 (32.35%)
Calvé:
High segment
Middle
segment
Low segment
119 (90.84%)
11 (8.40%)
1 (0.76%)
24 (85.7%)
3 (10.7%)
1 (3.6%)
36 (94.7%)
2 (5.3%)
0
26 (83.9%)
5 (16.1%)
0
33 (97.1%)
1 (2.9%)
0
Own label:
High segment
Middle
segment
Low segment
3 (2.29%)
72 (54.96%)
56 (42.75%)
0
16 (57.1%)
12 (42.9%)
3 (7.9%)
23 (60.5%)
12 (31.6%)
0
14 (45.2%)
17 (54.8%)
0
19 (55.9%)
15 (44.1%)
In total, it can be concluded that the manipulation for Albert Heijn was a success. With
84.7%, over three-quarter of the respondents evaluated Albert Heijn as a high segment store.
The manipulation for Aldi was successful too: Only 1.5% evaluated Aldi as a high segment
store – most people perceived to be a ‘middle segment’ store (55%) or ‘low segment’ store
(43.5%). Moreover, it can be concluded that with 119 (90.8%) of the 131 respondents the
manipulation for Calvé was a success. With 90.8%, over three-quarter of the respondents
evaluated Calvé as a high segment brand. Likewise, the manipulation for the own brand was

28
also successful: Only 2.3% evaluated the own labels as high segment – most people perceived
them to belong to the ‘middle segment’ (55%) or ‘low segment’ (43.5%).

29
Chapter 4 Results
This chapter formulates an answer on the question what the effectiveness is for
supermarkets to use direct comparative ads in a social media setting. Also, an answer to the
question if there is a difference in persuasiveness in the combinations of high- or low segment
brands and high or low segment stores using direct comparative advertising campaigns in a
social media setting is given. For the result section to be synoptic, the paragraphs are divided
per component of the hierarchy-of-effects model.
4.1 Awareness and Knowledge
Hypothesis 1 concerned the relation between the respondents’ awareness of the shown
store in the ad. The respondents’ awareness of the store was measured by aided open recall
question. The recall question measured the respondents’ recall on the store where the ad was
from. To test the relation between the respondents’ awareness and the shown store in the ad a
chi-square test for independence was performed. Table 3 gives an overview of the
respondents who remembered the store right.
Table 3 Respondents who remembered the store right N (%)
Right answer Wrong answer
Respondents that saw the
Albert Heijn advertisement
(N=66)
29 (43.9%) 37 (56.1%)
Respondents that saw the
Aldi advertisement (N=65)
36 (55.4%) 29 (44.6%)
Total (N=131) 65 (49.6%) 66 (50.4%)
The respondents’ recall was 43.9% for the Albert Heijn (high segment store) versus
55.4% for the Aldi (low segment store), and thus lower for the high segment store. A chi-
square test for independence (with Yates’ Continuity Correction) indicated no significant
difference between the percentage of respondents that saw the Albert Heijn ad and
respondents that saw the Aldi ad, χ2 (1, n = 131) = 1,29, p = .26, phi = .11. This result rejects
30
hypothesis 1: the respondent was not more aware of the shown high segment store than of the
shown low segment store.
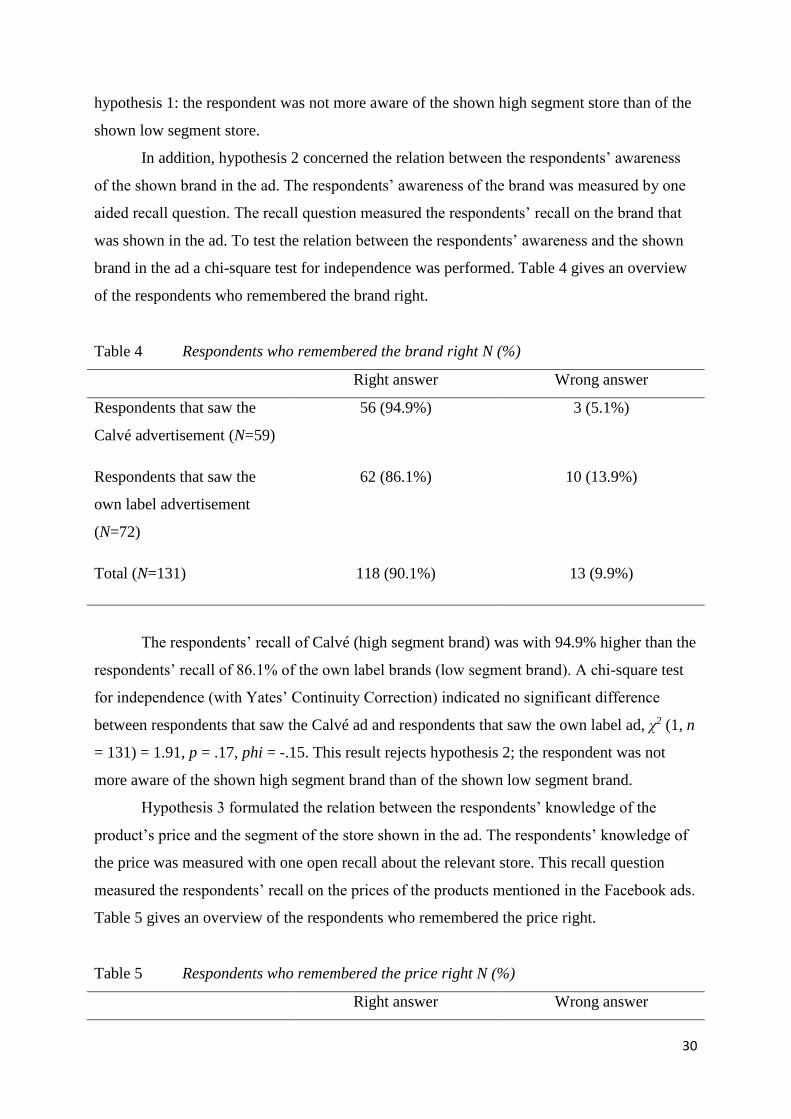
In addition, hypothesis 2 concerned the relation between the respondents’ awareness
of the shown brand in the ad. The respondents’ awareness of the brand was measured by one
aided recall question. The recall question measured the respondents’ recall on the brand that
was shown in the ad. To test the relation between the respondents’ awareness and the shown
brand in the ad a chi-square test for independence was performed. Table 4 gives an overview
of the respondents who remembered the brand right.
Table 4 Respondents who remembered the brand right N (%)
Right answer Wrong answer
Respondents that saw the
Calvé advertisement (N=59)
56 (94.9%) 3 (5.1%)
Respondents that saw the
own label advertisement
(N=72)
62 (86.1%) 10 (13.9%)
Total (N=131) 118 (90.1%) 13 (9.9%)
The respondents’ recall of Calvé (high segment brand) was with 94.9% higher than the
respondents’ recall of 86.1% of the own label brands (low segment brand). A chi-square test
for independence (with Yates’ Continuity Correction) indicated no significant difference
between respondents that saw the Calvé ad and respondents that saw the own label ad, χ2 (1, n
= 131) = 1.91, p = .17, phi = -.15. This result rejects hypothesis 2; the respondent was not
more aware of the shown high segment brand than of the shown low segment brand.
Hypothesis 3 formulated the relation between the respondents’ knowledge of the
product’s price and the segment of the store shown in the ad. The respondents’ knowledge of
the price was measured with one open recall about the relevant store. This recall question
measured the respondents’ recall on the prices of the products mentioned in the Facebook ads.
Table 5 gives an overview of the respondents who remembered the price right.
Table 5 Respondents who remembered the price right N (%)
Right answer Wrong answer

31
Respondents that saw the
Albert Heijn advertisement
(N=66)
49 (66%) 17 (25.8%)
Respondents that saw the
Aldi advertisement (N=65)
63 (96.9%) 2 (3.1%)
Total (N=131) 112 (85.5%) 19 (14.5%)
The respondents’ knowledge of the price was with 66% respondents lower for the
respondents that saw the Albert Heijn ad (high segment) than for the respondents’ that saw
the Aldi ad. From the respondents that saw the Aldi ad, 96.9% recalled the price right. A chi-
square test for independence (with Yates’ Continuity Correction) indicated a significant
difference between the respondents that saw the Albert Heijn ad and respondents that saw the
Aldi ad, χ2 (1, n = 131) = 11.82, p = .001, phi = .32. This result rejects hypothesis 3; the
respondents’ knowledge of the product’s price was not higher for the high segment store than
for the low segment store. It was the other way around; the respondents’ knowledge of the
product’s price was significantly higher for the low segment store than for the high segment
store.
Hypothesis 4 formulated the relation between the respondents’ knowledge of the
product’s price and the segment of the brand shown in the ad. The respondents’ knowledge
was measured with one open recall question about the relevant brand. This recall question
measured the respondents’ recall on the prices of the products mentioned in the Facebook ads.
Table 6 gives an overview of the respondents who remembered the price right.
The respondents’ knowledge was with 84.7% higher for the respondents that saw the
own label ad, than percentage of 86.4% for the respondents that saw the Calvé ad. A chi-
square test for independence (with Yates’ Continuity Correction) indicated no significant
difference between the respondents that saw the Calvé ad and respondents that saw the own
label ad, χ2 (1, n = 131) = .001, p = .98, phi = -.02. This result rejects hypothesis 4; the
respondents’ knowledge of the product’s price is not higher for the high segment brand than
for the low segment brand.

32
Table 6 Respondents who remembered the price right N (%)
Right answer Wrong answer
Respondents that saw the
Calvé advertisement (N=59)
51 (86.4%) 8 (13.6%)
Respondents that saw the
own label advertisement
(N=72)
61 (84.7%) 11 (15.3%)
Total (N=131) 112 (85.5%) 19 (14.5%)
4.2 Liking and Preference
In this research the respondents’ liking and preference for the high and low segment
store and the high and low segment brand and the ads are measured. For this paragraph to be
synoptic, liking will be divided into three sub-paragraphs: (1) Advertisement liking, (2) Store
liking, (3) Brand liking. Hereafter, the paragraph will discuss the respondents’ preference.
4.2.1 Advertisement Liking
Hypothesis 5 concerned the relation between the respondents’ evaluation on likeability
of the ad and store segment. Moreover, hypothesis 6 concerned the relation between the
respondents’ evaluation on likeability of the ad and brand segment. Table 8 displays the
means and standard deviations of the ad likeability for all four of the conditions.

33
Table 8 Mean scores for advertisement likeability (standard deviation in parentheses)
Condition Advertisement likeability
Condition 1 (N=28) 3.96 (.71)
Condition 2 (N=38) 3.98 (.78)
Condition 3 (N=31) 3.89 (.68)
Condition 4 (N=34) 3.66 (.92)
Total (N=131) 3.87 (.78)
A one-way between-groups analysis of variance was conducted to explore the
differences between means of the respondents’ conditions on the ad likeability. Hereby, a
non-significant F-test shows no difference between the four groups, in contrast a significant
F-test shows that there are differences between the groups. Post-hoc tests are only reported for
a significant F-test. To determine the difference in effectiveness on respondents’ likeability of
the ad between the Albert Heijn and the Aldi, post-hoc tests of condition 1 and condition 3
(both high-segment brand) and condition 2 and condition 4 (both low segment brand) were
compared. Post-hoc comparisons using the Tukey HSD test indicated that the mean score for
condition 1 (M = 3.96, SD = .71) was higher than the mean score for condition 3 (M = 3.89,
SD = .68). So, the ad likeability was higher for the high segment store in combination with the
high segment brand than for the low segment store in combination with the high segment
brand. Post-hoc comparisons using the Tukey HSD test indicated that the mean score for
condition 2 (M = 3.98, SD = .78) was higher than the mean score for condition 4 (M = 3.66,
SD = .92). This indicates that the ad likeability was higher for the high segment store in
combination with the low segment brand than for the low segment store in combination with
the low segment brand. However, these differences were not statistically significant, F (3,
127) = 1.21, p = .31.
Additionally, to determine the difference in effectiveness on respondents’ likeability
of the ad between Calvé and own label, post-hoc tests of condition 1 and condition 2 (both
high segment store) and condition 3 and condition 4 (both low segment store) were compared.
Post-hoc comparisons using the Tukey HSD test indicated that the mean score for condition 2
(M = 3.98, SD = .78) was higher than the mean score of condition 1 (M = 3.96, SD = .71). So

34
the ad likeability was higher for the high segment store in combination with the low segment
brand than for the high segment store in combination with the high segment brand. Post-hoc
comparisons using the Tukey HSD test indicated that the mean score for condition 3 (M =
3.89, SD = .68) was higher than the mean score for condition 4 (M = 3.66, SD = .92). This
means that the ad likeability was higher for the low segment store in combination with the
high segment brand than for the low segment store in combination with the low segment
brand. However, these differences were not statistically significant, F (3, 127) = 1.21, p = .31.
In order to conclude if a certain combination of store and brand is the most successful
the mean score for that condition had to be higher than the other conditions and the difference
had to be statistically significant. None of the differences between the groups were
statistically significant so these results reject hypothesis 5 and hypothesis 6. The respondents’
evaluation on likeability of the ad was not significantly higher for the high segment store and
brand than for the low segment store and brand.
4.2.2 Store Liking
Hypothesis 7 concerns the relation between the respondents’ evaluations of likeability
of the store and the store segment. In addition, hypothesis 8 concerns the respondents’
likeability of the store and the brand segment. Table 9 displays the means and standard
deviations of the store likeability for all four of the conditions.
Table 9 Mean scores for store likeability (standard deviation in parentheses)
Condition Store likeability
Condition 1 (N=28) 4.15 (.76)
Condition 2 (N=38) 4.64 (.76)
Condition 3 (N=31) 4.50 (.77)
Condition 4 (N=34) 4.34 (.74)
Total (N=131) 4.43 (.77)
A one-way between-groups analysis of variance was conducted to explore the
differences between means of the respondents’ conditions on the ad likeability. Post-hoc

35
comparisons using the Tukey HSD test indicated that the mean score for condition 3 (M =
4.50, SD = .77) was higher than the mean score of condition 1 (M = 4.15, SD = .76). This
means that the store liking was higher for the low segment store in combination with the high
segment brand than for the high segment store in combination with the high segment brand.
Post-hoc comparisons using the Tukey HSD test indicated that the mean score for condition 2
(M = 4.64, SD = .76) was higher than the mean score of condition 4 (M = 4.34, SD = .74).
This indicates that the store liking was higher for the high segment store in combination with
the low segment brand than for the low segment store in combination with the low segment
brand. These results however were not statistically significant, F (3, 127) = 2.56, p = .06.
Additionally, to determine the difference in effectiveness on respondents’ likeability
of the store between Calvé and own label, post-hoc tests of condition 1 and condition 2 (both
high segment store) and condition 3 and condition 4 (both low segment store) were compared.
Post-hoc comparisons using the Tukey HSD test indicated that the mean score for condition 2
(M = 4.64, SD = .76) was higher than the mean score of condition 1 (M = 4.15, SD = .76).
This means that the score liking was higher for the high segment store in combination with
the low segment brand than for the high segment store in combination with the high segment
brand. Post-hoc comparisons using the Tukey HSD test indicated that the mean score for
condition 3 (M = 4.50, SD = .77) was higher than the mean score of condition 4 (M = 4.34, SD
= .74). This indicates that the mean store liking was higher for the low segment store in
combination with the high segment brand than for the low segment store in combination with
the low segment brand. However, these results were not statistically significant, F (3, 127) =
2.56, p = .06
In order to conclude if a certain combination of store and brand is the most successful
the mean score for that condition had to be higher than the other conditions and the difference
had to be statistically significant. None of the differences between the groups were
statistically significant so these results reject hypothesis 7 and hypothesis 8. The respondents’
evaluation on likeability of the store was not significantly higher for the high segment store
and brand than for the low segment store and brand.
4.2.3 Brand Liking
Hypothesis 9 concerned the relation between the respondents’ evaluation on likeability
of the brand and the store segment. Secondly, hypothesis 10 concerned the relation between
the respondents’ evaluation on likeability of the brand and the brand segment. Table 10

36
displays the means and standard deviations of the brand likeability for all four of the
conditions.
Table 10 Mean scores for brand likeability (standard deviation in parentheses)
Condition Brand likeability
Condition 1 (N=28) 5.50 (.69)
Condition 2 (N=38) 4.66 (1.04)
Condition 3 (N=31) 5.48 (1.00)
Condition 4 (N=34) 4.68 (1.02)
Total (N=131) 5.04 (1.04)
A one-way between-groups analysis of variance was conducted to explore the
differences between means of the respondents’ conditions on the brand likeability. To
determine the difference in effectiveness on respondents’ likeability of the brand between
Albert Heijn and Aldi, post-hoc tests of condition 1 and condition 3 (both high-segment
brand) and condition 2 and condition 4 (both low segment brand) were compared.
Additionally, to determine the difference in effectiveness on respondents’ likeability
of the brand between Calvé and own label, post-hoc tests of condition 1 and condition 2 (both
high segment store) and condition 3 and condition 4 (both low segment store) were compared.
In order to conclude if a certain combination of store and brand is the most successful the
mean score for that condition had to be higher than the other conditions and the difference had
to be statistically significant.
There was a statistically significant difference at the p < .001 level in brand likeability
scores for the four conditions: F (3, 130) = 7.8, p = .000. Post-hoc comparisons using the
Tukey HSD test indicated that the mean score for Condition 1 (M = 5.50, SD = .69) was
significantly different from Condition 2 (M = 4.66, SD = 1.04, p = .003). The mean score for
Condition 2 (M = 4.66, SD = 1.04) was significantly different from Condition 3 (M = 5.48, SD
= 1.00, p = .003). Condition 4 (M = 4.68, SD = 1.02) did not differ significantly from
Condition 1, Condition 2 or Condition 3. These results reject hypothesis 9; while the
evaluation on likeability of the brand was higher for the low segment store than for the high
segment store, only one of the differences was statistically significant, the differences
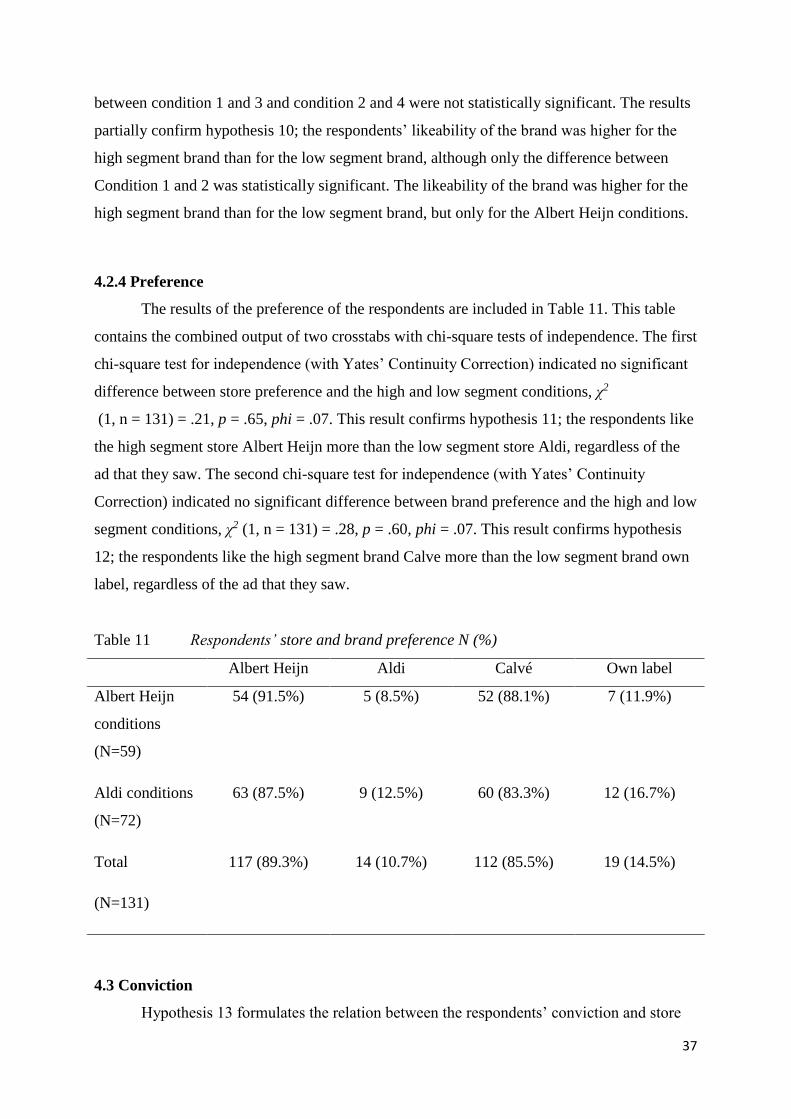
37
between condition 1 and 3 and condition 2 and 4 were not statistically significant. The results
partially confirm hypothesis 10; the respondents’ likeability of the brand was higher for the
high segment brand than for the low segment brand, although only the difference between
Condition 1 and 2 was statistically significant. The likeability of the brand was higher for the
high segment brand than for the low segment brand, but only for the Albert Heijn conditions.
4.2.4 Preference
The results of the preference of the respondents are included in Table 11. This table
contains the combined output of two crosstabs with chi-square tests of independence. The first
chi-square test for independence (with Yates’ Continuity Correction) indicated no significant
difference between store preference and the high and low segment conditions, χ2
(1, n = 131) = .21, p = .65, phi = .07. This result confirms hypothesis 11; the respondents like
the high segment store Albert Heijn more than the low segment store Aldi, regardless of the
ad that they saw. The second chi-square test for independence (with Yates’ Continuity
Correction) indicated no significant difference between brand preference and the high and low
segment conditions, χ2 (1, n = 131) = .28, p = .60, phi = .07. This result confirms hypothesis
12; the respondents like the high segment brand Calve more than the low segment brand own
label, regardless of the ad that they saw.
Table 11 Respondents’ store and brand preference N (%)
Albert Heijn Aldi Calvé Own label
Albert Heijn
conditions
(N=59)
54 (91.5%) 5 (8.5%) 52 (88.1%) 7 (11.9%)
Aldi conditions
(N=72)
63 (87.5%) 9 (12.5%) 60 (83.3%) 12 (16.7%)
Total
(N=131)
117 (89.3%) 14 (10.7%) 112 (85.5%) 19 (14.5%)
4.3 Conviction
Hypothesis 13 formulates the relation between the respondents’ conviction and store

38
segment. Moreover, hypothesis 14 concerns the relation between the respondents’ conviction
and brand segment. Table 12 displays the means and standard deviations of the respondent’
felt conviction sorted per store and brand.
Table 12 Mean scores for respondents’ felt conviction (standard deviation in
parentheses)
Condition Albert Heijn Aldi Calvé Own label
Condition 1
(N=28)
4.87 (1.26) 3.14 (1.35) 4.63 (1.28) 3.68 (1.17)
Condition 2
(N=38)
4.97 (1.21) 3.55 (1.16) 4.80 (1.61) 3.86 (1.02)
Condition 3
(N=31)
4.91 (1.32) 3.67 (1.30) 4.70 (1.42) 4.01 (1.17)
Condition 4
(N=34)
5.09 (1.22) 3.19 (1.22) 4.62 (1.48) 4.18 (0.87)
Total (N=131) 4.97 (1.24) 3.40 (1.26) 4.70 (1.45) 3.94 (1.06)
A one-way between-groups analysis of variance was conducted to explore the
difference between the respondents’ conviction for the Albert Heijn, Aldi, Calvé and own
label. To determine the difference in effectiveness on respondents’ conviction of Albert Heijn
and Aldi, post-hoc tests of condition 1 and condition 3 (both high-segment brand) and
condition 2 and condition 4 (both low segment brand) were compared.
For the conviction of Albert Heijn post-hoc comparisons using the Tukey HSD test
indicated that the mean score for condition 3 (M = 4.91, SD = 1.32) was higher than the mean
score of condition 1 (M = 4.87, SD = 1.26). In addition, post-hoc comparisons using the
Tukey HSD test indicated that the mean score for condition 4 (M = 5.09, SD = 1.22) was
higher than the mean score of condition 2 (M = 4.97, SD = 1.21). These results indicate that
the conviction of Albert Heijn was higher for the respondents who saw the low segment store
ad in combination with the high segment brand in contrast to the respondents who saw the
high segment store ad in combination with the high segment brand. Moreover, the conviction
of Albert Heijn was also higher for the respondents who saw the low segment store ad in
combination with own label brand in contrast to respondents who saw the high segment store

39
ad in combination with own label brand. However, none of these differences were statistically
significant, F (3, 127) = 0.18, p = .91.
For the conviction of Aldi post-hoc comparisons using the Tukey HSD test indicated
that the mean score for condition 3 (M = 3.67, SD = 1.30) was higher than the mean score for
condition 1 (M = 3.14, SD = 1.35). Furthermore, post-hoc comparisons using the Tukey HSD
test indicated that the mean score for condition 2 (M = 3.55, SD = 1.16) was higher than the
mean score of condition 4 (M = 3.19, SD = 1.22). These results show that the conviction of
Aldi was higher for the respondents who saw the low segment store ad in combination with
the high segment brand in contrast to the respondents who saw the high segment store ad in
combination with the high segment brand. In contrast, the conviction of Aldi was higher for
respondents who saw the high segment store ad and the own label brand than for respondents
that saw the low segment store ad and the high segment brand. However, none of these
differences were statistically significant, F (3, 127) = 1.38, p = .25.
Additionally, to determine the difference in effectiveness on respondents’ conviction
of Calvé and own label, post-hoc tests of condition 1 and condition 2 (both high segment
store) and condition 3 and condition 4 (both low segment store) were compared.
For the conviction of Calvé post-hoc comparisons using the Tukey HSD test indicated
that the mean score for condition 2 (M = 4.80, SD = 1.61) was higher than the mean score of
condition 1 (M = 4.63, SD = 1.28). Moreover, post-hoc comparisons using the Tukey HSD
test indicated that the mean score for condition 3 (M = 4.70, SD = 1.42) was higher than the
mean score of condition 4 (M = 4.62, SD = 1.48). These results indicate that the conviction for
Calvé was higher for the respondents who saw the ad with the high segment store and the own
label brand than for the respondents who saw the ad with the high segment store and the high
segment brand. Furthermore, the conviction for Calvé was higher for the respondents who
saw the ad of the low segment store in combination with the high segment brand than for the
respondents who saw the ad of the low segment store and own label brand. These results,
however, were not statistically significant, F (3, 127) = 0.11, p = .95.
For the conviction of own label, post-hoc comparisons using the Tukey HSD test
indicated that the mean score for condition 2 (M = 3.86, SD = 1.02) was higher than the mean
score for condition 1 (M = 3.68, SD = 1.17). In addition, post-hoc comparisons using the
Tukey HSD test indicated that the mean score for condition 4 (M = 4.18, SD = 0.87) was
higher than the mean score of condition 3 (M = 4.01, SD = 1.17). These results imply that the
conviction for own label was higher for the respondents who saw the high segment store ad in
combination with the own label brand in contrast to the respondents who saw the high
40
segment store ad in combination with the high segment brand. Moreover, the results also
imply that the conviction for the own label brand was higher for the respondents who saw the
low segment store ad in combination with the own label brand in contrast to respondents who
saw the low segment store ad in combination with the high segment brand. However, none of
these differences were statistically significant, F (3, 127) = 1.26, p = .29.
In order to conclude if a certain combination of store and brand is the most successful
the mean score for that condition had to be higher than the other conditions and the difference
had to be statistically significant. But there was no statistical significant difference found
between the four conditions. These results reject both hypotheses 13 and 14; the respondents’
conviction was not higher for either the high segment store or the high segment brand than for
the low segment store and the low-segment brand.
Lastly, hypothesis 15 concerned the relation between the respondents’ plan to
purchase the shown product and the store segment. Hypothesis 16 concerned the relation
between the respondents’ plan to purchase the shown product and the brand segment. Table
13 displays the means and standard deviations of the respondent’ plan to purchase at Albert
Heijn and Aldi and also the respondents’ plan to purchase products of Calvé and own label.

41
Table 13 Mean scores for respondents’ plan to buy a product at Albert Heijn and Aldi
and a product from Calvé and own label (standard deviation in parentheses)
Condition Albert Heijn Aldi Calvé Own label
Condition 1
(N=28)
5.71 (1.33) 3.82 (1.82) 5.00 (1.68) 4.46 (1.53)
Condition 2
(N=38)
5.63 (1.04) 3.92 (1.81) 4.76 (1.81) 4.50 (1.67)
Condition 3
(N=31)
5.84 (1.59) 4.16 (1.95) 4.94 (1.71) 4.55 (1.61)
Condition 4
(N=34)
6.00 (1.30) 3.91 (1.88) 4.91 (1.68) 5.15 (1.37)
Total (N=131) 5.79 (1.40) 3.95 (1.85) 4.89 (1.71) 4.67 (1.56)
A one-way between-groups analysis of variance was conducted to explore the
difference between the respondents’ plan to buy a product at Albert Heijn and Aldi and to buy
a product from Calvé and own label. To determine the difference in effectiveness between the
respondents’ plan to buy a product at Albert Heijn and Aldi or from Calvé and own label,
post-hoc tests of condition 1 and condition 3 (both high-segment brand) and condition 2 and
condition 4 (both low segment brand) were compared.
For the respondents’ plan to purchase a product at Albert Heijn post-hoc comparisons
using the Tukey HSD test indicated that the mean score for condition 3 (M = 5.84, SD = 1.59)
was higher than the mean score of condition 1 (M = 5.71, SD = 1.33). In addition, post-hoc
comparisons using the Tukey HSD test indicated that the mean score for condition 4 (M =
6.00, SD = 1.30) was higher than the mean score of condition 2 (M = 5.63, SD = 1.04). These
results imply that respondents who saw the low segment store ad in combination with the high
segment brand are more likely to buy products at Albert Heijn than respondents who saw the
high segment store ad in combination with the high segment brand. Additionally, the results
also imply that respondents who saw the low segment store ad in combination with the low
segment brand are more likely to buy products at Albert Heijn than respondents who saw the

42
high segment store ad in combination with the low segment brand. However, these results did
not differ significantly, F (3, 127) = 0.45, p = .72.
For the respondents’ plan to purchase a product at Aldi post-hoc comparisons
using the Tukey HSD test indicated that the mean score for condition 3 (M = 4.16, SD = 1.95)
was higher than the mean score of condition 1 (M = 3.82, SD = 1.82). Also, post-hoc
comparisons using the Tukey HSD test indicated that the mean score for condition 2 (M =
3.92, SD = 1.81) was higher than the mean score of condition 4 (M = 3.91, SD = 1.88). These
results indicate that respondents who saw the low segment store ad in combination with the
high segment brand were more likely to buy products at Aldi than respondents who saw the
high segment store ad in combination with the high segment brand. Furthermore, the results
also indicate that respondents who saw the high segment store ad in combination with the low
segment brand were more likely to buy products at Aldi than respondents who saw the low
segment store ad in combination with the low segment brand. However, none of these
differences were statistically significant, F (3, 127) = 0.19, p = .91.
For the respondents’ plan to purchase a product from Calvé, post-hoc comparisons
using the Tukey HSD test indicated that the mean score for condition 1 (M = 5.00, SD = 1.68)
was higher than the mean score for condition 3 (M = 4.94, SD = 1.71). Furthermore, post-hoc
comparisons using the Tukey HSD test indicated that the mean score for condition 4 (M =
4.91, SD = 1.68) was higher than the mean score of condition 2 (M = 4.76, SD = 1.81). These
results imply that respondents who saw the high segment store ad in combination with the
high segment brand ad were more likely to buy products from Calvé than respondents who
saw the low segment store ad in combination with the high segment brand. More over, these
results also imply that respondents who saw the low segment store ad in combination with the
low segment brand were more likely to buy products from Calvé than respondents who saw
the high segment store ad in combination with the low segment brand. However, these results
were not statistically significant, F (3, 127) = 0.12, p = .96.
For the respondents’ plan to purchase a product from own label post-hoc comparisons
using the Tukey HSD test indicated that the mean score for condition 3 (M = 4.55, SD = 1.61)
was higher than the mean score for condition 1 (M = 4.46, SD = 1.53). In addition, post-hoc
comparisons using the Tukey HSD test indicated that the mean score for condition 4 (M =
5.15, SD = 1.37) was higher than the mean score for condition 2 (M = 4.50, SD = 1.67). These
results suggest that respondents who saw the low segment store ad in combination with the
high segment brand were more likely to buy products from own label than respondents who
saw the high segment store ad in combination with the high segment brand. Additionally, the

43
results also suggest that respondents who saw the low segment store ad in combination with
the low segment brand were more likely to buy products from own label than respondents
who saw the high segment store ad in combination with the low segment brand. But these
results were not statistically significant, F (3, 127) = 1.45, p = .23.
In order to conclude if a certain combination of store and brand is the most successful
the mean score for that condition had to be higher than the other conditions and the difference
had to be statistically significant. These results reject both hypothesis 15 as hypothesis 16; the
respondents’ plan to purchase the shown product was not higher for the high segment store
than for the low segment store. Moreover, the respondents’ plan to purchase the shown
product was not higher for the high segment brand than for the low segment brand.

44
Chapter 5 Conclusion & Discussion
5.1 Conclusion
This research addressed the following research question: ‘Is there a difference in effectiveness
in the combinations of high or low segment stores and high or low segment brands using
direct comparative advertising in a social media setting?’ To do so, an experimental 2-by-2
between subjects experiment was conducted in order to compare the effectiveness of
comparative ads in a social media setting. The research results imply that there was little
difference in effectiveness of direct comparative advertising between combinations of high or
low segment stores with high or low segment brands using comparative ads in a social media
setting. The following subsections contain the results on all the hypotheses of this research.
5.1 Awareness
The research results do not add up to the expectations for awareness. The expectations
were for the respondents to be more aware of the store and brand after seeing a direct
comparative advertisement from the high segment store Albert Heijn and the high segment
brand Calvé than after seeing a direct comparative advertisement from the low segment store
Aldi and the low segment brand own label. Both hypotheses 1 and 2 were rejected by the
research results. The respondents were not more aware of the shown high segment store than
of the shown low segment store. Moreover, the respondents were not more aware of the
shown high segment brand than of the shown low segment brand. Rather it was the other way
around, the respondents were more aware of the low segment store and the low segment
brand. But these results were not statistically significant. These results can be explained by
the research results of Pieters, Warlop, and Wedel (2002). Their results indicated that direct
comparative ads detract purchase intentions for established well-known brands because they
increase the consumer’s awareness of lower-share competitors and sponsor misidentifications.
In this research, Albert Heijn and Calvé can be seen as the better-known brands in contrast to
Aldi and own label.
Another explanation for these research results could be the fact that it is less common
for consumers to see an ad from Aldi then from Albert Heijn. This can be assumed, as Albert
Heijn is by far the biggest supermarket chain in the Netherlands. Albert Heijn owns more than
double the number of supermarket stores that Aldi does in the Netherlands and has a much
bigger advertising budget (Intermediair, 2013). Seeing an advertisement of Albert Heijn is

45
much more common than seeing an advertisement of Aldi. The respondents, therefore, could
have been either surprised or impressed by the advertisement of Aldi and therefore paid more
attention to it. The same principle goes for the products. Calvé is an established high segment
brand in the Netherlands and a part of Unilever, which has a very big advertising budget. It is
likely to assume that respondents have seen a lot more ads about Calvé products than about
own label products.
5.2 Knowledge
In this research, the respondents’ knowledge of the product’s price was expected to be
higher for the high segment store Albert Heijn and high segment brand Calvé in contrast to
low segment store Aldi and low segment brand own label. The research results, however,
indicated that for the knowledge of the product’s price the knowledge of the low segment
store Aldi was higher than the knowledge of the product’s price of the high segment store
Albert Heijn. This result was statistically significant. Moreover, the knowledge was also
higher for the low segment brand own label than for the high segment brand Calvé. Still, these
results were not statistically significant. Hypothesis 3 and 4 were both rejected by the research
results. Respondents seemed to remember the price of the low segment store and low segment
brand better than the price of the high segment store and the high segment brand. These
results too can be explained based on the research of Pieters, Warlop, and Wedel (2002) as
mentioned in the awareness subsection awareness above. A possible explanation for the
results is that the ads of the low segment store and brand detracted attention from the high
segment store and brands by increasing the consumers’ knowledge of lower-share competitors
and their offers.
Moreover, as in the subsection awareness above already is stated, respondents could
have been either surprised or impressed by an advertisement of Aldi and therefore could have
paid more attention to it. Considering that, it is much more common for a consumer to see an
advertisement from Albert Heijn than an advertisement from Aldi. Another explanation for
the results can be that a rather large part of the respondents (38.9%) is still a student. Students
are known for not having much money to spend (Nibud, 2017). Therefore, it makes sense for
students to pay more attention to the prices of the low segment store and brand. In addition,
popular websites among students write a lot about how students can save money on groceries
by shopping at low segment supermarkets and buying own label brands (Studenten.net, 2017;
Telegraaf, 2012; Telegraaf 2014). When searching for ‘saving money on groceries’ on the

46
website Studenten.net (which can be translated to Students.net), over 30 articles mention
buying products from own labels to save money (Studenten.net, 2017).
5.3 Liking
The research results do not meet up to the expectations for ad likeability. It was
expected for the respondents’ to like the ad of the high segment store Albert Heijn and the
high segment brand Calvé more than the ad of the low segment store Aldi and the low
segment brand own label. The respondents’ evaluation on likeability of the ad was not
significantly higher in the high segment store conditions 1 and 2 than in the low segment store
conditions 3 and 4. Moreover, the respondents’ evaluation on likeability of the ad was not
significantly higher for the high segment brand conditions 1 and 3 than for the low segment
brand conditions 2 and 4. So the research results rejected hypotheses 5 and 6. These results
may be explained by the research results of Smith and colleagues (2007). This research shows
a powerful effect between ad creativity and ad liking. The more creative the consumer
perceived the ad to be, the more the consumer liked the ad (Smith et al., 2007). The ads used
in this research were not very creative. The ads of both Albert Heijn and Aldi have changed
very little over the last couple of years. So, the ads of both supermarkets are looking more or
less the same for quite some time now. Therefore, it is likely to assume that consumers do not
perceive the ads to be creative or innovative, and also do not prefer one ad above the other
based on the features of the ad. This argument is supperted by the research results wherein the
respondents’ ad likeability was neutral for all the conditions.
The research results also do not meet up to the expectations for store likeability. It was
expected that the respondents’ store likeability would be higher for the high segment store
Albert Heijn and the high segment brand Calvé in contrast to the low segment store Aldi and
low segment brand own label. The respondents’ evaluation on likeability of the store was not
significantly higher for the high segment store than for the low segment store. In addition, the
respondents’ evaluation on likeability of the store was not significantly higher for the high
segment brand than for the low segment brand. Both hypothesis 7 and 8 were rejected on the
hand of the research results. These results can be explained by the fact that supermarkets and
their offerings are of high quality in the Netherlands. The own label is often perceived as just
as good as the high segment brand (Motivaction, 2012). Moreover, according to the article of
Motivaction (2012), the packaging of the own label is often very similar to the packaging of
the high segment brand. These little differences in packaging (and product) can have an effect

47
on the evaluation of liking of the respondents. In this research, the high segment store and
brand were originally presumed to be more desirable by consumers. Yet, the respondents
perhaps viewed the high segment store and brand product as rather similar to the low segment
store and own label product, and this could have had an influence on their store liking.
The expectations for brand likeability of the brand were partially met. The brand
likeability was expected to be higher for the high segment store than for the low segment
store. Interesting, however, the respondents’ evaluation on likeability of the brand was higher
for the low segment store than for the high segment store. So, this result is in contrast with
what was expected but the result was not statistically significant. Therefore, hypothesis 9 was
rejected by the research results. This deviating finding could be explained by the research
results of Pieters, Warlop & Wedel (2002). According to these researchers, the perceptions of
a low segment store or brand are improved by using a comparative advertisement in opposite
of a high segment store or brand. Pieters, Warlop & Wedel (2002) state that low segment
stores or brands, which they also call ‘underdogs,’ evoke more sympathy by consumers when
using a comparative ad than when high segment stores or brands use a comparative ad. These
findings are backed by older studies of Pechmann & Stewart (1990) and Snyder (1992).
Hypothesis 10 was partially confirmed by the research results: the respondents’
likeability of the brand was higher for the high segment brand than for the low segment brand.
There was a significant difference between condition 1 (a high segment store compares itself
to a low segment store while advertising a high segment brand) and condition 2 (a high
segment store compares itself to a low segment store while advertising a low segment brand).
This research result is in line with the researches of Bagozzi (2010); Goodrich (2011); Dreze
(2003); Chow and Luk (2013) and the classic research of Janiszewski (1993).
5.4 Preference
The expectations for preference were both met up to in this research. The respondents
were expected to prefer the high segment store over the low segment store, and to prefer the
high segment brand over the low segment brand. These research results reconfirm the findings
of Goodrich (2011); Dreze (2003) and the classic research of Janiszewski (1993). The
research results confirmed hypothesis 11. The respondents preferred the high segment store
Albert Heijn more than the low segment store Aldi, regardless of the ad that they saw.
Hypothesis 12 was also confirmed, the respondents preferred the high segment brand Calve
more than the low segment brand own label, regardless of the ad that they saw. Still, the fact

48
that preference did not differ across conditions indicates that the difference in preference
between the high and low segment store and the high and low segment brand cannot be
attributed to the different direct comparative advertisements, but that they are rather the result
of respondents’ prior dispositions. It is likely that the respondents already had a preference for
Albert Heijn and Calvé prior to this research.
5.5 Conviction
In this research, conviction was measured in two different ways. The first manner
purely as conviction and the second manner as purchase intention. It was expected that the
conviction would be higher for the high segment store and brand than for the low segment
store and brand since it was also expected that the preference for the high segment store and
brand would be higher than for the low segment store and brand. Both of the expectations did
not come true. The respondents’ conviction was not higher for either the high segment store
or the high segment brand than for the low segment store and the low-segment brand. Thus,
hypothesis 13 and 14 were rejected by these research results. These results can be explained
through the findings of Yeboah and Atakora (2013). They state that the information that the
consumer has about a store or brand is critical to the consumers’ conviction process. This
information should exist of at least the product, price, and distribution. The information
should be accompanied by good marketing communication (Yeboah & Atakora, 2013). In this
research, the information provided to the respondent was limited. The respondent only got to
see one ad that only mentioned the price of the product. The ad did not mention anything else
about the product or the distribution except for the fact where the product could be bought for
the best price. The respondents’ could have been more influenced if the ad contained more
information.
Moreover, the respondents’ plans to purchase the advertised product were expected to
be higher for the low segment store than for the high segment store. In addition, the
respondents’ purchase intentions for the advertised product were expected to be higher for the
high segment brand than for the low segment brand. Both of these expectations turned out to
be false. The respondents’ plan to purchase the shown product was not higher for the low
segment store than for the high segment store. Moreover, the respondents’ plan to purchase
the shown product was not higher for the high segment brand than for the low segment brand.
Therefore, hypothesis 15 and hypothesis 16 were also both rejected by the research results.
These results could also be explained by the lack of information provided in the ads. The

49
respondents’ might have been more willing to purchase at an advertised store or a product
from an advertised brand when the ad had provided more information about the store and
brand. Also, Emons and Fluet (2012) state that comparative ads are more effective than non
comparative ads when they highlight differentiations which explain why the advertising brand
has better features than the other. The only differentiation characteristic used in this research
is price. The research results could have been different if there were added more
differentiation characteristics.
5.6 Practical conclusions
In this research, little evidence was found for a difference in effectiveness in the
combinations of high or low segment stores and high or low segment brands using direct
comparative advertising in a social media setting. For the components awareness, knowledge,
ad likeability, store likeability and conviction no difference was found in effectiveness of the
comparative ads between the different conditions. The expectations about the respondents’
preference were confirmed; the respondents preferred Albert Heijn above Aldi and Calvé
above the own label. For the component brand likeability, a difference in effectiveness has
been found. The respondents’ likeability of the brand was slightly higher for the high segment
brand than for the low segment brand. This was only the case for the high segment store
conditions in combination with the ad of Albert Heijn. This result implies that it can be
effective for a high segment store, such as Albert Heijn, to use a comparative ad in
combination with a high segment brand in a social media setting. Although there is no
certainty if these significant research results are based on the type of advertisement. The
significant research differences between the high and low segment store and high and low
segment brand can be based on the reputation that the store and brand already had before this
research amongst the respondents.
Moreover, the use of comparative ads is not without risk. Starting a comparative ad
campaign can cause a lot of fuss in the media, on social media, by consumers and of course
by the competitor that is mentioned (NRC, 2015). Comparative ads can be seen as a more
‘aggressive’ way of advertising than normal ads, since it is an ‘attack’ on the competitor and
its services and / or products (NRC, 2015). It is thus likely that this way of advertising is not
condoned by every consumer. Moreover, in the Netherlands there is a so-called ‘advertising
code’. In Dutch legislation, there are rules established concerning comparative ads in the art.
6:19 Civil Code. These rules are based on a European alignment. The use of comparative ads

50
is allowed under strict conditions wherein the consumers’ interest is central. Comparative ads
are not allowed to be misguiding to the consumer, confusing, disparagingly or contain unfair
benefits. Moreover, statements made in a comparative ad should always be verifiable and
objective (Dirkzwager, 2017). It is herefore questionable for organizations if the use of a
comparative ad weights up to the possible fuss it may cause.
5.7. Validity: Strengths and limitations
5.7.1. Strengths
In this research, four questionnaires have been used to examine the effectiveness of
comparative ads for different type of segment supermarkets and brands in a social media
setting. These questionnaires were spread out to 144 respondents. These 144 respondents
were mostly reached through the spreading of the questionnaire on Facebook. So the research
is conducted among social media users who are used to this type of content (i.e. ads on social
media). Therefore, it can be stated that the research is conducted in for the respondent familiar
environment which makes the research and its results valid according to Matthews and Ross
(2010).
With a minimum group size of 28 respondents, the group size was sufficient enough to
make valid comparisons against each other. The group size was large enough for the
researcher to undertake all the planned analyses to test the differences between the groups and
for the data to be usefull (Matthews & Ross, 2015). With this data, the effectiveness of the
different combinations of comparative ads with high and low segment stores and brands was
determined.
In order to test the internal validity of this research a manipulation check was
performed. Internal validity can be defined as ‘‘a measure of research quality, meaning that
the data that is planned to be gathered and worked to address the research question is a close
representation of the aspect of social reality that is studied’’ (Matthews & Ross, 2015). In
order to test if the manipulation was right, respondents were asked to rate the segment of the
high segment supermarket and low segment supermarket of this research. The results showed
that the manipulation of the store segment was a success.
51
5.7.2 Limitations
This paragraph described the limitations of this research. The limitations of this
research can mostly be found in the short time frame that was given to conduct the
experiment. Because of the time frame of this research, the gathered data is rather limited.
The responses of 13 respondents were excluded from the analysis because of incomplete data.
So with a total of 131 respondents this research is not externally valid according to the
definition of external validity of Matthews and Ross (2010). According to Matthews and Ross
(2010), research results are external valid when they are generalizable to a wider population.
When it can be statistically demonstrated that research findings can be regarded as more or
less true for the population as a whole the research results are externally valid. This research
is too small scaled to be generalizable to a wider population. Even though the research results
are not generalizable to a wider population, the research was valid on its own.
Moreover, as stated earlier in the introduction, cross-cultural differences can influence
research results tremendously (Polyorat & Alden, 2005; Celebi, 2015). Cross-cultural
differences like habits or ‘typical’ characteristics belonging to people of a certain culture can
lead to completely different research results of the same research conducted in different
countries (Polyorat & Alden, 2005). Moreover, Celebi (2015) states that because of these
cross-cultural differences the way people use the Internet can differ. The drive and motivation
of customers can differ between countries (Celebi, 2015). Cross-cultural differences are
another reason why the research results of this research cannot be generalized to a wider
population. This research was only focused on the Netherlands. Therefore, the research results
of this research show insight into the effectiveness of comparative ads on social media
(Facebook) in a Dutch context.
Another limitation of this research is the fact that in everyday life, consumers pay less
attention to ads of products in which they are not interested. Moreover, Facebook uses Google
content to generate ads personalized to the user. This means that Facebook users get to see
more ads of products based on their search behavior on Google. Facebook also uses pages a
user likes, general demographic information of the Facebook user and information from
marketing partners to personalize their ads to their users (Facebook, 2017a). In this research,
this was not the case since all the respondents got to see one of the four ads about peanut
butter sold at Albert Heijn and Aldi. It is assumable that this product or these stores are not
relevant to all of the respondents and this could have an influence on the research results.
When a product is not relevant to a respondent, the respondent pays less attention to the ad.
And when a respondent pays less attention to an ad, the respondent is less likely to walk

52
through the steps of the hierarchy of effects model (Bagozzi, 2010). It was beyond the scope
of this study to examine more different combinations of products, stores and brands but this
can be a suggestion for following up research.
Another limitation is the fact that this research asks respondents about their felt
conviction and purchase intention based on one ad. It is plausible to assume that consumers
view multiple sources of information before they are convinced enough to feel conviction or
even to buy a product. The fact that respondents only got to see one ad instead of several ads
with the same load of information could have influenced the research results. Then, the mere
exposure effect as formulated by Goodrich (2011); Dreze (2003) and Janiszewski (1993)
could have occurred in the research setting. Moreover, according to Yeboah and Atakora
(2013) the amount of information a consumer has about a particular store of product is critical
to the consumers’ decision-making processes. Giving the respondent more information about
the store and product could influence the consumers’ decisions. To make the setting more
natural and realistic in follow up research multiple online ads on the same product could be
added.
Finally, respondents that already have experience with the advertised product can
either be positively or negatively influenced by this prior experience according to Mihart
(2012). Respondents that did not have any experience with the advertised product could have
responded differently to the questionnaire and thus the comparative ad when a product was
advertised which was familiar to them.
5.8 Suggestions for future research
The reader should bear in mind that this study is based on only one type of product,
namely peanut butter of either a high or low segment brand in combination with only one high
segment store and one low segment store. It is safe to assume that if there were more different
ads of more different type of products in combination with more different stores the research
results could have been different. This research is unable to encompass a lot of different
products in different ads combined with more different types of stores because of the time
frame of this research. Future research could address this limitation by enlarging the research
by adding more different products from different product categories such as food, beauty,
lifestyle, interior, kitchen supplies etcetera. This increases the chance that a respondent is
personally interested in (at least) one of the advertised product. And respondents pay more
attention to ads of products in which they are interested (Bagozzi, 2010; Wirtz & Mattila,

53
2003; Orsingher et al., 2010; Shapiro et al., 1997).
In order to be able to generalize the research results of this research to a wider
population, the exact same research should be conducted in other countries in order to learn of
the related findings can be generalized to those countries (Celebi, 2015). Such research could
also reveal whether there are differences between countries in how consumers respond
towards comparative ads. Though the research of Jeon and Beatty (2002) is precedent in this
area, it only examined the differences between the United States and Korea in how citizens
reacted to direct comparative, indirect comparative and noncomparative ads. In addition, this
research also did not examine comparative ads in a social media setting.
Moreover, in this research there was no difference found for the respondents’
conviction between the four conditions. But that does not mean that comparative ads are not
more effective than normal ads. An implication for future research is recreating the current
research and inserting a control variable with a normal ad to see if the conviction differs
between the respondents.
This research provided evidence for the theories of Goodrich (2011); Dreze (2003) and
Janiszewski (1993) that respondents prefer the more familiar high segment supermarkets and
brands over low segment supermarkets and brands. Moreover, this research showed that it is
effective for high segment stores to use a comparative ad in combination with a high segment
brand in a social media setting. In practice, these research results can form an advice for
Albert Heijn (and other high segment supermarkets) and Calvé (and other high segment
brands) on using comparative ads on social media, and Facebook in particular. The advice
would be to use a comparative ad in a social media setting in combination with a high
segment brand.

54
References
Albert Heijn. (2017). AH Huismerk [Web Page]. Retrieved from https://www.ah.nl/over-
ah/merken/huismerk
Albert Heijn. (2017a). Feiten & cijfers [Web Page]. Retrieved from https://www.ah.nl/over-
ah/geschiedenis/feiten
Aldi. (2017). Over ons [Web Page]. Retrieved from https://www.aldi.nl/aldi_over
_ons_11285.html
Alexandris, K., & Tsiotsou, R. (2012). Testing a hierarchy of effects model of sponsorship
effectiveness. Journal of Sport Management, 26(5), 363-363. doi:10.1123/
jsm.26.5.363
Bagozzi, R. (2010). The construct validity of the affective, behavioral, and cognitive
components of attitude by analysis of covariance structures. Multivariate Behavioral
Research, 13(1), 9-31. doi:10.1207/s15327906mbr1301_2
Baker, D., & Crompton, J. (2000). Quality, satisfaction and behavioral intentions. Annals of
Tourism Research, 27(3), 785-804. doi:10.1016/S0160-7383(99)00108-5
Baltas, G., & Argouslidis, P. (2007). Consumer characteristics and demand for store
brands. International Journal of Retail & Distribution Management, 35(5), 328-341.
doi:10.1108/09590550710743708
Belch, G., & Belch, M. (2009). Advertising and promotion: An integrated marketing
communications perspective (8th ed.). Boston, MA: McGraw-Hill Irwin.
Calvé. (2017). Pindakaas [Web Page]. Retrieved from https://www.calve.nl/pindakaas/
Case, D. O. (2012). Looking for information: A survey of research on information seeking,
needs and behavior (3rd ed.). Bingley, UK: Emerald.
Celebi, S. (2015). How do motives affect attitudes and behaviors toward internet advertising
and facebook advertising? Computers in Human Behavior, 51, 312-324.
doi:10.1016/j.chb.2015.05.011
Chow, C., & Luk, C. (2013). Effects of comparative advertising in high-and low-cognitive
elaboration conditions. Journal of Advertising, 35(2), 55-67.
doi:10.1080/00913367.2006.10639229
Dehghani, M., & Tumer, M. (2015). A research on effectiveness of facebook advertising on
enhancing purchase intention of consumers. Computers in Human Behavior, 49(12),
597-600. doi:10.1016/j.chb.2015.03.051
DeVellis, R. F. (2017). Scale development: theory and applications. Los Angeles, CA:

55
Sage.
Dirkzwager. (2017). Reclamerecht [Web Page]. Retrieved from
http://dirkzwagerieit.nl/rechtsgebiedenreclamerecht/
Distrifood. (2017). Marktaandelen [Web Page]. Retrieved from
http://www.distrifood.nl/service/marktaandelen
Dreze, X. (2003). Internet advertising: Is anybody watching? Journal of Interactive
Marketing, 17(4), 8-23. doi:10.1002/dir.10063
Emons, W., & Fluet, C. (2012). Non-comparative versus comparative advertising of
quality. International Journal of Industrial Organization, 30(4), 352-352. Retrieved
from doi:10.1016/j.ijindorg.2012.01.004
Esteves, R., & Resende, J. (2016). Competitive targeted advertising with price
discrimination. Marketing Science, 35(4), 576-587. doi:10.1287/mksc.2015.0967
Facebook. (2017). Je doelgroep kiezen [Web Page]. Retrieved from https://
www.facebook.com/business/products/ads/ad-targeting
Facebook. (2017a). Hoe bepaalt Facebook welke advertenties ik te zien krijg en hoe kan ik
beheren welke advertenties ik te zien krijg? [Web Page]. Retrieved from
https://www.facebook.com/help/562973647153813/
Foodlog. (2016). In de media heeft Aldi de voordeligste huismerken [Web Article]. Retrieved
from https://www.foodlog.nl/artikel/kort/aldi-heeft-voordeligste-huismerken/
Food for Food. (2014). Inspelen op de nieuwe koers van Albert Heijn [Web Article].
Retrieved from http://www.foodforfood.info/hoofdartikelen/artikel/inspelen-op-de-
nieuwe-koers-van-albert-heijn/
Gotlieb, J., & Sarel, D. (1991). Comparative advertising effectiveness: The role of
involvement and source credibility. Journal of Advertising, 20(1), 38-38.
doi:10.1080/00913367.1991.10673205
Goodrich, K. (2011). Anarchy of effects? Exploring attention to online advertising and
multiple outcomes. Psychology & Marketing, 28(4), 417-441. doi:10.1002/mar.20371
Grewal, D., Fern, E., Costley, C., & Barnes, J. (1997). Comparative versus noncomparative
advertising: A meta-analysis. Journal of Marketing, 61(4), 1-15. doi:10.2307/1252083
Intermediar. (2013). Dit is hoebeel KPN uitgeeft aan media-uitingen [Web Article]. Retrieved
from https://www.intermediair.nl/vakgebieden/marketing/dit-hoeveel-geld-kpn-
uitgeeft-aan-media-uitingen?utm_referrer=https%3A%2F%2Fwww.google.nl%2F
Internet World Stats. (2017). Internet in Europe stats; Internet user statistics & 2017

56
population for the 53 European countries and regions [Web Page]. Retrieved from
http://www.internetworldstats.com/stats4.htm
Iyer, G., Soberman, D., & Villas-Boas, J. (2005). The targeting of advertising. Marketing
Science, 24(3), 461-476. doi:10.1287/mksc.1050.0117
Janiszewski, C. (1993). Preattentive mere exposure effects. Journal of Consumer Research,
20(3), 376-392. doi:10.1086/209356
Jeon, J., & Beatty, S. (2002). Comparative advertising effectiveness in different national
cultures. Journal of Business Research, 55(11), 907-914. doi:10.1016/S0148-
2963(01)00210-7
Koshkaki, E., & Solhi, S. (2016). The facilitating role of negative emotion in decision making
process: A hierarchy of effects model approach. Journal of High Technology
Management Research, 27(2), 119-128. doi:10.1016/j.hitech.2016.10.010
Lavrakas, P. (Ed.). (2008). Encyclopedia of survey research methods. Thousand Oaks, CA:
Sage.
Likert, R. (1932). A technique for the measurement of attitudes. Archives of
Psychology, (140), pp. 1–55. Retrieved from https://legacy.voteview.com/
pdf/Likert_1932.pdf
Madrigal, R. (2001). Social identity effects in a belief-attitude-intentions hierarchy:
Implications for corporate sponsorship. Psychology and Marketing, 18(2), 145-165.
doi:10.1002/1520-6793(200102)18:23.0.CO;2-T
Maheswaran, D., & Peracchio, L. (2006). Mapping the frontiers: Theoretical advances in
consumer research on memory, affect, and persuasion. Journal of Consumer
Research, 33(1), 139-149. doi: 10.1086/500493
Manning, K., Miniard, P., Barone, M., & Rose, R. (2013). Understanding the mental
representations created by comparative advertising. Journal of Advertising, 30(2), 27-
39. doi:10.1080/00913367.2001.10673635
Matthews, B., & Ross, L. (2010). Research methods: a practical guide for the social
sciences. New York, NY: Pearson Longman.
Mihart (Kailani), C. (2012). Modelling the influence of integrated marketing communication
on consumer behaviour: An approach based on hierarchy of effects concept. Procedia
- Social and Behavioral Sciences, 62, 975-980. doi:10.1016/j.sbspro.2012.09.166
Milgram, S. (1974). Obedience to authority: An experimental view. London, UK: Tavistock.
Miniard, P., Barone, M., Rose, R., & Manning, K. (2006). A further assessment of indirect

57
comparative advertising claims of superiority over all competitors. Journal of
Advertising, 35(4), 53-64. doi:10.2753/JOA0091-3367350404
Motivaction. (2012). A-merken moeten écht waardevol zijn [Web Article]. Retrieved from
https://www.motivaction.nl/kennisplatform/archief/archief-2012/a-merken-moeten-
echt-waardevol-zijn
Muthukrishnan, A., & Chattopadhyay, A. (2007). Just give me another chance: The strategies
for brand recovery from a bad first impression. Journal of Marketing Research, 44(2),
334-334. doi:10.1509/jmkr.44.2.334
Newell, S., & Goldsmith, R. (2001). The development of a scale to measure perceived
corporate credibility. Journal of Business Research, 52(3), 235-247. Retrieved from
http://www.sciencedirect.com.eur.idm.oclc.org/science/article/pii/S014829639900104
6?_rdoc=1&_fmt=high&_origin=gateway&_docanchor=&md5=b8429449ccfc9c3015
9a5f9aeaa92ffb&ccp=y
Nibud. (2017). Rondkomen van je studentenbudget [Web Page]. Retrieved from
https://www.nibud.nl/consumenten/rondkomen-van-je-studentenbudget/
NRC. (2015). Reclame maken ten koste van je concurrent? Dit mag wel en niet [Web
Article]. Retrieved from https://www.nrc.nl/nieuws/2015/09/28/reclame-maken-ten-
koste-van-je-concurrent-dit-mag-wel-en-niet-a1494908
Orsingher, C., Valentini, S., & De Angelis, M. (2010). A meta-analysis of satisfaction with
complaint handling in services. Journal of the Academy of Marketing, 38(2), 169-186.
doi:10.1007/s11747-009-0155-z
Van Oss, M. (2010). Reclameaanval Jumbo op Dirk (zonder die naam te noemen) [Web
Article]. Retrieved from http://reclamewereld.blog.nl/inhakersactueel/
2010/05/06/reclameaanval-jumbo-op-dirk-zonder-die-naam-te-noemen
Van Oss, M. (2010a). Jumbo neemt Albert Heijn op de korrel (’10% goedkoper’) [Web
Article]. Retrieved from http://reclamewereld.blog.nl/campagne/2010/06/03/jumbo-
neemt-albert-heijn-op-de-korrel-10-goedkoper
Van Oss, M. (2015a). Aanval Dirk op laagste prijs-garantie van Jumbo [Web Article].
Retrieved from http://reclamewereld.blog.nl/inhakersactueel/2015/03/14/aanval-dirk-
op-laagste-prijs-garantie-van-jumbo.
Van Oss, M. (2015b). Jumbo pakt Albert Heijn weer keihard aan met Laagsteprijsgarantie-
reclame [Web Article]. Retrieved from http://reclamewereld.blog.nl/campagne/
2015/02/28/jumbo-pakt-albert-heijn-weer-aan-met-laagsteprijsgarantie-reclame.
Pechmann, C., & Stewart, D. (1990). The effects of comparative advertising on attention,
58
memory, and purchase intentions. Journal of Consumer Research, 17(2), 180-180.
doi:10.1086/208548
Pieters, R., Warlop, L., & Wedel, M. (2002). Breaking through the clutter: Benefits of
advertisement originality and familiarity for brand attention and memory.
Management Science, 48(6), 765-781. doi:10.1287/mnsc.48.6.765.192
Polegato, R., & Bjerke, R. (2009). Cross-cultural differences in ad likeability and ad element
likeability: The case of benetton. Journal of Promotion Management, 15(3), 382-382.
doi:10.1080/10496490903196460
Polyorat, K., & Alden, D. L. (2005). Self-construal and need-for-cognition effects on brand
attitudes and purchase intentions in response to comparative advertising in Thailand
and the United States. Journal of Advertising, 34(1), 37-48. doi:10.1080/
00913367.2005.10639179
Priester, J., Godek, J., Nayakankuppum, D., & Park, K. (2004). Brand congruity and
comparative advertising: When and why comparative advertisements lead to greater
elaboration. Journal of Consumer Psychology, 14(1-2), 115-123.
doi:10.1207/s15327663jcp1401&2_13
Rabobank. (2017). Supermarkten [Web Page]. Retrieved from
https://www.rabobankcijfersentrends.nl/index.cfm?action=branche&branche=superma
rkten
Reinhard, M., & Messner, M. (2009). The effects of source likeability and need for cognition
on advertising effectiveness under explicit persuasion. Journal of Consumer
Behaviour, 8(4), 179-179. doi:10.1002/cb.282
Reysen, S. (2005). Construction of a new scale: The Reysen Likability Scale. Social Behavior
and Personality: An International Journal, 33(2), 201-208. doi:10.2224/
sbp.2005.33.2.201
Scheepers, P., Willems, W., & Cottaar, A. (1990). Het beeld van Nederland: Hoe zien
Molukkers, Chinezen, woonwagenbewoners en Turken de Nederlanders en
zichzelf? Sociologische Gids, 37, 473-474.
Smith, R., MacKenzie, S., Yang, X., Buchholz, L., & Darley, W. (2007). Modeling the
determinants and effects of creativity in advertising. Marketing Science, 26(6), 819-
833. doi:10.1287/mksc.1070.0272
Shapiro, S., MacInnis, D., & Heckler, S. (1997). The effects of incidental ad exposure on the
formation of consideration sets. Journal of Consumer Research, 24(1), 94-104.
doi:10.1086/209496

59
Smith, R., Chen, J., & Yang, X. (2008). The impact of advertising creativity on the hierarchy
of effects. Journal of Advertising, 37(4), 47-62. doi:10.2753/JOA0091-3367370404
Snyder, R. (1992). Comparative advertising and brand evaluation: Toward developing a
categorization approach. Journal of Consumer Psychology, 1(1), 15-30.
doi:10.1016/S1057-7408(08)80043-5
Statista. (2017). Facebook's advertising revenue worldwide from 2009 to 2016 (in million
U.S. dollars) [Web Page]. Retrieved from https://www.statista.com/statistics/
271258/facebooks-advertising-revenue-worldwide/
Studenten.net. (2017). Search results for ‘besparen boodschappen’ [Web Page]. Retrieved
from https://www.studenten.net/zoeken?indexCatalogue
=fullsitesearch&searchQuery=besparen%20boodschappen&wordsMode=AllWords
De Telegraaf. (2012). Foldertjes uitpluizen maakt boodschappen 33 procent goedkoper [Web
Article]. Retrieved from http://www.telegraaf.nl/dft/geld/article20044214.ece
De Telegraaf. (2014). Goedkoop de studietijd door: 13 bespaartips [Web Article]. Retrieved
from http://www.telegraaf.nl/dft/geld/consument/Studeren/20794475/__Goedkoop
_de_studietijd_door__13_bespaartips__.html
Unilever. (2017). Calvé [Web Page]. Retrieved from https://www.unilever.nl/brands/bekijk-
onze-merken/calve.html
Wirtz, J., & Mattila, A. (2003). The effects of consumer expertise on evoked set size and
service loyalty. Journal of Services Marketing, 17(7), 649-665.
doi:10.1108/08876040310501223
Yeboah, A., & Atakora, A. (2013). Integrated marketing communication: how can it
influence customer satisfaction? European Journal of Business and Management,
5(2), p. 41. Retrieved from http://www.iiste.org/Journals/index.php/
EJBM/article/view/3929
Yun Yoo, C., & Kim, K. (2005). Processing of animation in online banner advertising: The
roles of cognitive and emotional responses. Journal of Interactive Marketing, 19(4),
18-34. doi:10.1002/dir.20047
Zakelijk.infonu. (2017). Supermarkten in Nederland [Web Page]. Retrieved from
http://zakelijk.infonu.nl/detailhandel/72950-supermarkten-in-nederland.html

60
Appendix A The Consent Form (Dutch)
Beste deelnemer,
Bedankt voor je interesse in dit onderzoek. Dit onderzoek wordt uitgevoerd door een Master
student van het master programma Media & Business van de Erasmus Universiteit Rotterdam.
Het bestaat uit een online experiment waarin het gebruik van advertenties door supermarkten
onderzocht wordt. Daarom zal je een advertentie van een supermarkt te zien krijgen waar na
afloop enkele vragen over worden gesteld.
Wees je ervan bewust dat je deelname vrijwillig is. Dit betekent dat je kunt stoppen op elk
moment tijdens het onderzoek. Daarnaast zal er strikt vertrouwelijk worden omgegaan met je
persoonlijke gegevens. De uitkomsten van dit onderzoek zullen alleen worden gebruikt voor
onderzoeksdoeleinden. Daarom is je anonimiteit ten alle tijden gewaarborgd.
Het onderzoek duurt ongeveer 5 minuten. Mocht je vragen hebben gedurende het onderzoek
of na afloop van je deelname, neem dan gerust contact op met de onderzoekster: Eveline
Verdiesen ([email protected]).
o Ik begrijp bovenstaande en ik verklaar vrijwillig mee te doen aan dit onderzoek.
Nogmaals bedankt!
Eveline Verdiesen

61
Appendix B The Consent Form (English)
Dear respondent,
Thank you for your interest in this research. This research is conducted by a Master student
from the Master program Media & Business of the Erasmus University Rotterdam. This
research deals with supermarket advertisement. You will be shown an advertisement from a
supermarket and asked to complete a couple of questions after.
Please be aware of the fact that you participation is voluntary. This means that you can stop at
any point. The researcher maintains strict confidentiality of the collected respondents’
personal data and the research results will be used for research purposes only. Therefore, your
anonymity is safeguarded at any time.
Completing this survey will takes approximately 5 minutes. In case you have any questions
during the research or after your participation you are very welcome to contact the researcher:
Eveline Verdiesen ([email protected]).
I fully understand the text above and hereby I declare to participate in this research
voluntarily.
Thank you, again!
Eveline Verdiesen

62
Appendix C The questionnaire accessory to condition 1 and condition 3 (Dutch)
Deze vragenlijst begint met een aantal korte introductievragen. Na het invullen van deze
vragen mag u beginnen met het invullen van de daadwerkelijke vragenlijst. Alvast bedankt!
Ik ben een
o Man
o Vrouw
Hoe oud bent u?
__________ jaren oud.
Wat is uw huidige status? (Er zijn meerdere antwoorden mogelijk)
o Student
o Werknemer
o Entrepreneur
o Geen werk / tussen banen in
o Anders
Doet u wel eens boodschappen bij een supermarkt?
o Ja, dagelijks
o Ja, wekelijks
o Ja, maandelijks
o Nee
Je mag beginnen met het bekijken van deze Facebook advertentie. Vul daarna de vragenlijst
in!
*** Ofwel het stimuli materiaal uit bijlage G of bijlage I ***
Ik ben benieuwd naar uw mening over de advertentie die u zojuist heeft bekeken. Daarom zou
ik u hier graag wat vragen over stellen.
Van welke winkel van de onderste 5 opties heeft u zojuist een advertentie gezien?

63
o Albert Heijn
o Jumbo
o Aldi
o C1000
o Lidl
Van welk merken van de onderste 5 opties heeft u zojuist een advertentie gezien? (U kunt
meerdere antwoorden aanklikken)
o Calvé
o Croma
o Huismerk
Wat was de prijs van de twee potten Calvé pindakaas in de advertentie?
o 1.99
o 2.00
o 2.99
o Weet ik niet
Wat was de prijs van de twee potten Aldi huismerk pindakaas in de advertentie?
o 1.99
o 2.00
o 3.00
o Weet ik niet
De Albert Heijn valt volgens mij onder het volgende segment supermarkten:
o Hoog segment
o Midden segment
o Laag segment
De Aldi valt volgens mij onder het volgende segment supermarkten:
o Hoog segment
o Midden segment
o Laag segment

64
Calvé valt volgens mij onder het volgende segment merken:
o Hoog segment
o Midden segment
o Laag segment
Huismerk valt volgens mij onder het volgende segment merken:
o Hoog segment
o Midden segment
o Laag segment
Ik ben ook benieuwd naar in welke mate u de volgende zaken leuk vindt:
Hoe leuk vindt u…..
De advertentie
(1) In erg weinige mate leuk (2) in weinige mate leuk (3) in lichte mate niet leuk (4) neutraal
(5) in lichte mate wel leuk (6) in grote mate leuk (7) in erg grote mate leuk
De kleuren in de advertentie
(1) In erg weinige mate leuk (2) in weinige mate leuk (3) in lichte mate niet leuk (4) neutraal
(5) in lichte mate wel leuk (6) in grote mate leuk (7) in erg grote mate leuk
Het logo van de Albert Heijn
(1) In erg weinige mate leuk (2) in weinige mate leuk (3) in lichte mate niet leuk (4) neutraal
(5) in lichte mate wel leuk (6) in grote mate leuk (7) in erg grote mate leuk

65
Het logo van de Aldi
(1) In erg weinige mate leuk (2) in weinige mate leuk (3) in lichte mate niet leuk (4) neutraal
(5) in lichte mate wel leuk (6) in grote mate leuk (7) in erg grote mate leuk
De getoonde producten
(1) In erg weinige mate leuk (2) in weinige mate leuk (3) in lichte mate niet leuk (4) neutraal
(5) in lichte mate wel leuk (6) in grote mate leuk (7) in erg grote mate leuk
De situatie in de advertentie
(1) In erg weinige mate leuk (2) in weinige mate leuk (3) in lichte mate niet leuk (4) neutraal
(5) in lichte mate wel leuk (7) in grote mate leuk (7) in erg grote mate leuk
Ik ben ook benieuwd naar de mate waarin u het eens bent met de volgende stellingen:
De Albert Heijn is een ‘likeable’ winkel
(1) Helemaal mee oneens (2) mee oneens (3) een beetje mee oneens (4) niet mee oneens/niet
mee eens (5) een beetje mee eens (6) mee eens (7) helemaal mee eens
De Albert Heijn komt over als een vriendelijke winkel
(1) Helemaal mee oneens (2) mee oneens (3) een beetje mee oneens (4) niet mee oneens/niet
mee eens (5) een beetje mee eens (6) mee eens (7) helemaal mee eens
De Albert Heijn komt over als een warme winkel
(1) Helemaal mee oneens (2) mee oneens (3) een beetje mee oneens (4) niet mee oneens/niet
mee eens (5) een beetje mee eens (6) mee eens (7) helemaal mee eens
De Albert Heijn komt over als een aardige winkel

66
(1) Helemaal mee oneens (2) mee oneens (3) een beetje mee oneens (4) niet mee oneens/niet
mee eens (5) een beetje mee eens (6) mee eens (7) helemaal mee eens
De Aldi is een ‘likeable’ winkel
(1) Helemaal mee oneens (2) mee oneens (3) een beetje mee oneens (4) niet mee oneens/niet
mee eens (5) een beetje mee eens (6) mee eens (7) helemaal mee eens
De Aldi komt over als een vriendelijke winkel
(1) Helemaal mee oneens (2) mee oneens (3) een beetje mee oneens (4) niet mee oneens/niet
mee eens (5) een beetje mee eens (6) mee eens (7) helemaal mee eens
De Aldi komt over als een warme winkel
(1) Helemaal mee oneens (2) mee oneens (3) een beetje mee oneens (4) niet mee oneens/niet
mee eens (5) een beetje mee eens (6) mee eens (7) helemaal mee eens
De Aldi komt over als een aardige winkel
(1) Helemaal mee oneens (2) mee oneens (3) een beetje mee oneens (4) niet mee oneens/niet
mee eens (5) een beetje mee eens (6) mee eens (7) helemaal mee eens
Calvé is een ‘likeable’ merk
(1) Helemaal mee oneens (2) mee oneens (3) een beetje mee oneens (4) niet mee oneens/niet
mee eens (5) een beetje mee eens (6) mee eens (7) helemaal mee eens
Calvé komt over als een vriendelijk merk
(1) Helemaal mee oneens (2) mee oneens (3) een beetje mee oneens (4) niet mee oneens/niet
mee eens (5) een beetje mee eens (6) mee eens (7) helemaal mee eens
Calvé komt over als een warm merk
(1) Helemaal mee oneens (2) mee oneens (3) een beetje mee oneens (4) niet mee oneens/niet
mee eens (5) een beetje mee eens (6) mee eens (7) helemaal mee eens
Calvé komt over als een aardig merk
(1) Helemaal mee oneens (2) mee oneens (3) een beetje mee oneens (4) niet mee oneens/niet
mee eens (5) een beetje mee eens (6) mee eens (7) helemaal mee eens
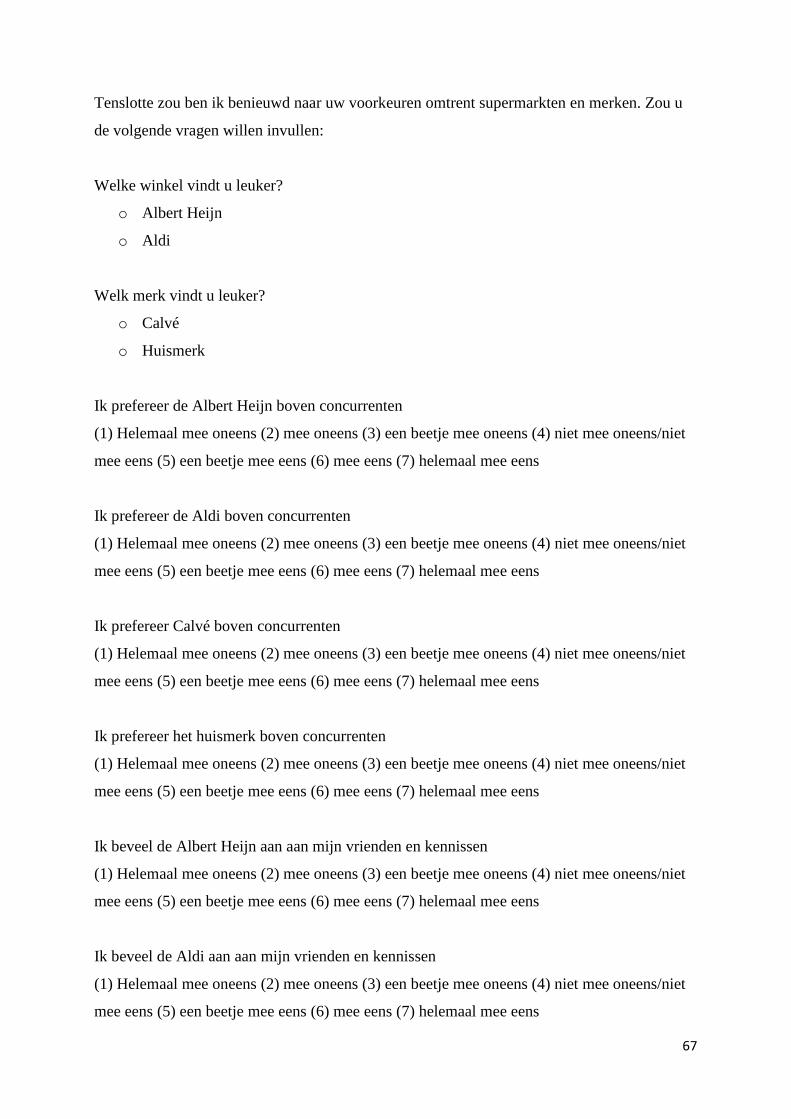
67
Tenslotte zou ben ik benieuwd naar uw voorkeuren omtrent supermarkten en merken. Zou u
de volgende vragen willen invullen:
Welke winkel vindt u leuker?
o Albert Heijn
o Aldi
Welk merk vindt u leuker?
o Calvé
o Huismerk
Ik prefereer de Albert Heijn boven concurrenten
(1) Helemaal mee oneens (2) mee oneens (3) een beetje mee oneens (4) niet mee oneens/niet
mee eens (5) een beetje mee eens (6) mee eens (7) helemaal mee eens
Ik prefereer de Aldi boven concurrenten
(1) Helemaal mee oneens (2) mee oneens (3) een beetje mee oneens (4) niet mee oneens/niet
mee eens (5) een beetje mee eens (6) mee eens (7) helemaal mee eens
Ik prefereer Calvé boven concurrenten
(1) Helemaal mee oneens (2) mee oneens (3) een beetje mee oneens (4) niet mee oneens/niet
mee eens (5) een beetje mee eens (6) mee eens (7) helemaal mee eens
Ik prefereer het huismerk boven concurrenten
(1) Helemaal mee oneens (2) mee oneens (3) een beetje mee oneens (4) niet mee oneens/niet
mee eens (5) een beetje mee eens (6) mee eens (7) helemaal mee eens
Ik beveel de Albert Heijn aan aan mijn vrienden en kennissen
(1) Helemaal mee oneens (2) mee oneens (3) een beetje mee oneens (4) niet mee oneens/niet
mee eens (5) een beetje mee eens (6) mee eens (7) helemaal mee eens
Ik beveel de Aldi aan aan mijn vrienden en kennissen
(1) Helemaal mee oneens (2) mee oneens (3) een beetje mee oneens (4) niet mee oneens/niet
mee eens (5) een beetje mee eens (6) mee eens (7) helemaal mee eens

68
Ik beveel Calvé aan aan mijn vrienden en kennissen
(1) Helemaal mee oneens (2) mee oneens (3) een beetje mee oneens (4) niet mee oneens/niet
mee eens (5) een beetje mee eens (6) mee eens (7) helemaal mee eens
Ik beveel het huismerk aan aan mijn vrienden en kennissen
(1) Helemaal mee oneens (2) mee oneens (3) een beetje mee oneens (4) niet mee oneens/niet
mee eens (5) een beetje mee eens (6) mee eens (7) helemaal mee eens
Ik overweeg om dingen te gaan kopen bij de Albert Heijn
(1) Helemaal mee oneens (2) mee oneens (3) een beetje mee oneens (4) niet mee oneens/niet
mee eens (5) een beetje mee eens (6) mee eens (7) helemaal mee eens
Ik overweeg om dingen te gaan kopen bij de Aldi
(1) Helemaal mee oneens (2) mee oneens (3) een beetje mee oneens (4) niet mee oneens/niet
mee eens (5) een beetje mee eens (6) mee eens (7) helemaal mee eens
Ik overweeg om dingen te gaan kopen van Calvé
(1) Helemaal mee oneens (2) mee oneens (3) een beetje mee oneens (4) niet mee oneens/niet
mee eens (5) een beetje mee eens (6) mee eens (7) helemaal mee eens
Ik overweeg om dingen te gaan kopen van het huismerk
(1) Helemaal mee oneens (2) mee oneens (3) een beetje mee oneens (4) niet mee oneens/niet
mee eens (5) een beetje mee eens (6) mee eens (7) helemaal mee eens
Hoe aannemelijk is het dat u producten bij de Albert Heijn gaat kopen?
(1) Helemaal niet aannemelijk (2) niet aannemelijk (3) een beetje niet aannemelijk (4)
neutraal (5) een beetje aannemelijk (6) aannemelijk (7) heel erg aannemelijk
Hoe aannemelijk is het dat u producten bij de Aldi gaat kopen?
(1) Helemaal niet aannemelijk (2) niet aannemelijk (3) een beetje niet aannemelijk (4)
neutraal (5) een beetje aannemelijk (6) aannemelijk (7) heel erg aannemelijk
Hoe aannemelijk is het dat u producten van Calvé gaat kopen?

69
(1) Helemaal niet aannemelijk (2) niet aannemelijk (3) een beetje niet aannemelijk (4)
neutraal (5) een beetje aannemelijk (6) aannemelijk (7) heel erg aannemelijk
Hoe aannemelijk is het dat u producten van het huismerk gaat kopen?
(1) Helemaal niet aannemelijk (2) niet aannemelijk (3) een beetje niet aannemelijk (4)
neutraal (5) een beetje aannemelijk (6) aannemelijk (7) heel erg aannemelijk
Bedankt voor het invullen van mijn vragenlijst! Als u nog vragen / opmerkingen heeft kunt u
deze in het veld hieronder invullen. Om kans te maken op een van de waardebonnen voor de
Albert Heijn dient u uw e-mail adres in te vullen.
Met vriendelijke groeten,
Eveline Verdiesen

70
Appendix D The questionnaire accessory to condition 1 and condition 3
(English)
This questionnaire starts with a couple of short introductory questions. After filling in these
questions you may commence with filling in the actual questionnaire. Thank you!
I am a
o Men
o Woman
What is your age?
__________ years old.
What is your current status? (There are multiple answers possible)
o Student
o Employee
o Entrepreneur
o Unemployed / in between jobs
o Otherwise
Do you ever go grocery shopping at a supermarket?
o Yes, on a daily basis
o Yes, on a weekly basis
o Yes, on a monthly basis
o No
You may now commence with looking at this Facebook advertisement. Then fill in the
questionnaire!
*** Either the stimuli material from appendix G or appendix I ***
I am curious about your opinion about the advertisement you just viewed. This is why I would
like to ask you some questions about this advertisement.
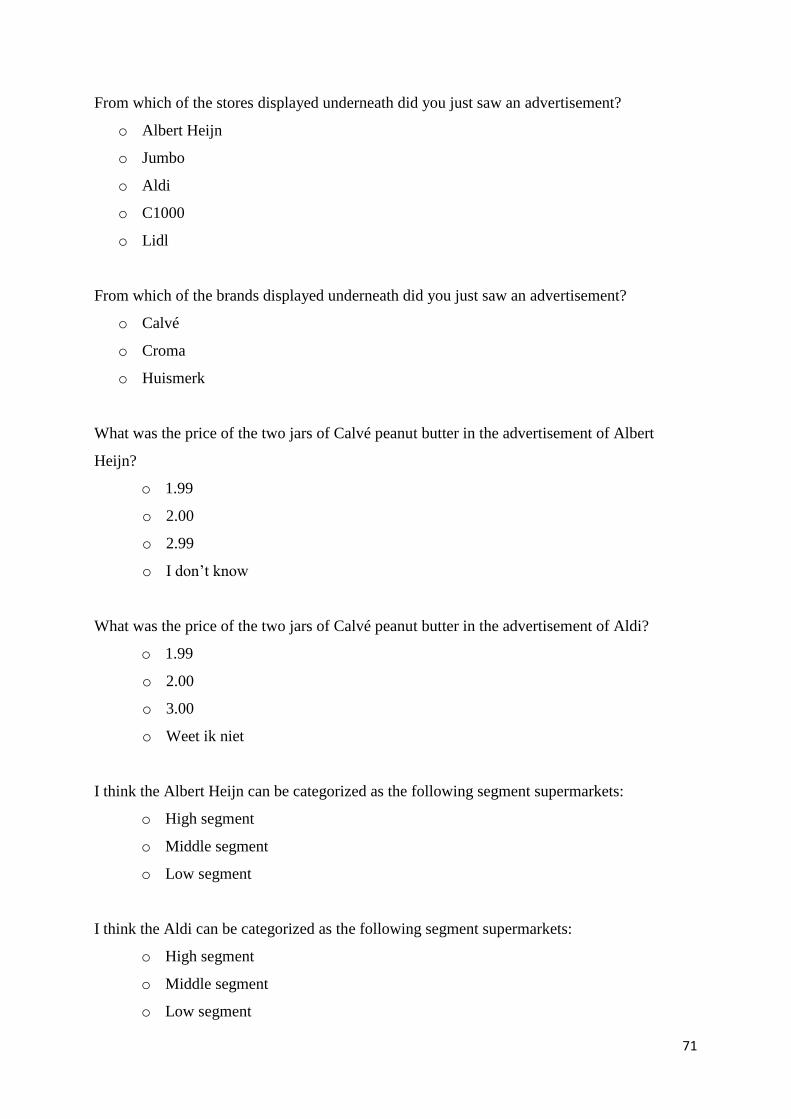
71
From which of the stores displayed underneath did you just saw an advertisement?
o Albert Heijn
o Jumbo
o Aldi
o C1000
o Lidl
From which of the brands displayed underneath did you just saw an advertisement?
o Calvé
o Croma
o Huismerk
What was the price of the two jars of Calvé peanut butter in the advertisement of Albert
Heijn?
o 1.99
o 2.00
o 2.99
o I don’t know
What was the price of the two jars of Calvé peanut butter in the advertisement of Aldi?
o 1.99
o 2.00
o 3.00
o Weet ik niet
I think the Albert Heijn can be categorized as the following segment supermarkets:
o High segment
o Middle segment
o Low segment
I think the Aldi can be categorized as the following segment supermarkets:
o High segment
o Middle segment
o Low segment

72
I think Calvé can be categorized as the following segment brand:
o High segment
o Middle segment
o Low segment
I think own label can be categorized as the following segment brand:
o High segment
o Middle segment
o Low segment
I am also curious about how much you like the following matters:
How much do you like…..
The whole advertisement
(1) To an extremely small extent (2) to a very small extent (3) To a small extent (4) neutral
(5) to a large extent (6) to a very large extent (7) to an extremely large extent
The colors used in the advertisement
(1) To an extremely small extent (2) to a very small extent (3) To a small extent (4) neutral
(5) to a large extent (6) to a very large extent (7) to an extremely large extent
The logo of the Albert Heijn
(1) To an extremely small extent (2) to a very small extent (3) To a small extent (4) neutral
(5) to a large extent (6) to a very large extent (7) to an extremely large extent

73
The logo of the Aldi
(1) To an extremely small extent (2) to a very small extent (3) To a small extent (4) neutral
(5) to a large extent (6) to a very large extent (7) to an extremely large extent
The showed products
(1) To an extremely small extent (2) to a very small extent (3) To a small extent (4) neutral
(5) to a large extent (6) to a very large extent (7) to an extremely large extent
The situation in the advertisement
(1) To an extremely small extent (2) to a very small extent (3) To a small extent (4) neutral
(5) to a large extent (6) to a very large extent (7) to an extremely large extent
I am also curious about the degree in which you agree with the following statements:
The Albert Heijn is a likeable store.
(1) Strongly disagree (2) disagree (3) mildly disagree (4) neither agree nor disagree (5) mildly
agree (6) agree (7) strongly agree
The Albert Heijn comes across as a friendly store.
(1) Strongly disagree (2) disagree (3) mildly disagree (4) neither agree nor disagree (5) mildly
agree (6) agree (7) strongly agree
The Albert Heijn comes across as a warm store.
(1) Strongly disagree (2) disagree (3) mildly disagree (4) neither agree nor disagree (5)
mildly agree (6) agree (7) strongly agree
The Albert Heijn comes across as a kind store.

74
(1) Strongly disagree (2) disagree (3) mildly disagree (4) neither agree nor disagree (5)
mildly agree (6) agree (7) strongly agree
The Aldi is a likeable store.
(1) Strongly disagree (2) disagree (3) mildly disagree (4) neither agree nor disagree (5)
mildly agree (6) agree (7) strongly agree
The Aldi comes across as a friendly store.
(1) Strongly disagree (2) disagree (3) mildly disagree (4) neither agree nor disagree (5)
mildly agree (6) agree (7) strongly agree
The Aldi comes across as a warm store.
(1) Strongly disagree (2) disagree (3) mildly disagree (4) neither agree nor disagree (5)
mildly agree (6) agree (7) strongly agree
The Aldi comes across as a kind store.
(1) Strongly disagree (2) disagree (3) mildly disagree (4) neither agree nor disagree (5) mildly
agree (6) agree (7) strongly agree
Calvé is a likeable brand.
(1) Strongly disagree (2) disagree (3) mildly disagree (4) neither agree nor disagree (5) mildly
agree (6) agree (7) strongly agree
Calvé comes across as a friendly brand.
(1) Strongly disagree (2) disagree (3) mildly disagree (4) neither agree nor disagree (5) mildly
agree (6) agree (7) strongly agree
Calvé comes across as a warm brand.
(1) Strongly disagree (2) disagree (3) mildly disagree (4) neither agree nor disagree (5) mildly
agree (6) agree (7) strongly agree
Calvé comes across as a kind brand.
(1) Strongly disagree (2) disagree (3) mildly disagree (4) neither agree nor disagree (5) mildly
agree (6) agree (7) strongly agree
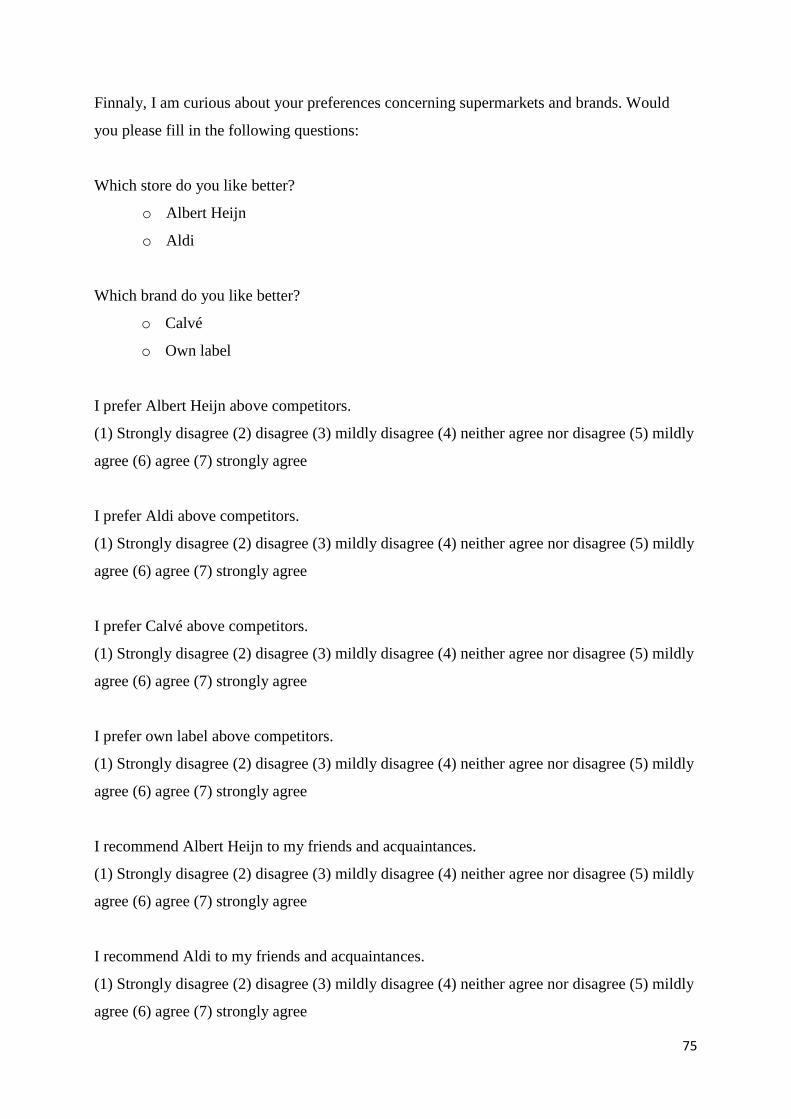
75
Finnaly, I am curious about your preferences concerning supermarkets and brands. Would
you please fill in the following questions:
Which store do you like better?
o Albert Heijn
o Aldi
Which brand do you like better?
o Calvé
o Own label
I prefer Albert Heijn above competitors.
(1) Strongly disagree (2) disagree (3) mildly disagree (4) neither agree nor disagree (5) mildly
agree (6) agree (7) strongly agree
I prefer Aldi above competitors.
(1) Strongly disagree (2) disagree (3) mildly disagree (4) neither agree nor disagree (5) mildly
agree (6) agree (7) strongly agree
I prefer Calvé above competitors.
(1) Strongly disagree (2) disagree (3) mildly disagree (4) neither agree nor disagree (5) mildly
agree (6) agree (7) strongly agree
I prefer own label above competitors.
(1) Strongly disagree (2) disagree (3) mildly disagree (4) neither agree nor disagree (5) mildly
agree (6) agree (7) strongly agree
I recommend Albert Heijn to my friends and acquaintances.
(1) Strongly disagree (2) disagree (3) mildly disagree (4) neither agree nor disagree (5) mildly
agree (6) agree (7) strongly agree
I recommend Aldi to my friends and acquaintances.
(1) Strongly disagree (2) disagree (3) mildly disagree (4) neither agree nor disagree (5) mildly
agree (6) agree (7) strongly agree

76
I recommend the Calvé to my friends and acquaintances.
(1) Strongly disagree (2) disagree (3) mildly disagree (4) neither agree nor disagree (5) mildly
agree (6) agree (7) strongly agree
I recommend own label to my friends and acquaintances.
(1) Strongly disagree (2) disagree (3) mildly disagree (4) neither agree nor disagree (5) mildly
agree (6) agree (7) strongly agree
I am considering buying products at Albert Heijn.
(1) Strongly disagree (2) disagree (3) mildly disagree (4) neither agree nor disagree (5) mildly
agree (6) agree (7) strongly agree
I am considering buying products at Aldi.
(1) Strongly disagree (2) disagree (3) mildly disagree (4) neither agree nor disagree (5) mildly
agree (6) agree (7) strongly agree
I am considering buying products from Calvé.
(1) Strongly disagree (2) disagree (3) mildly disagree (4) neither agree nor disagree (5) mildly
agree (6) agree (7) strongly agree
I am considering buying products from own label.
(1) Strongly disagree (2) disagree (3) mildly disagree (4) neither agree nor disagree (5) mildly
agree (6) agree (7) strongly agree
How likely is it that you will buy products at Albert Heijn?
(1) Very unlikely (2) unlikely (3) somewhat unlikely (4) undecided (5) somewhat likely (6)
likely (7) very likely
How likely is it that you will buy products at Aldi?
(1) Very unlikely (2) unlikely (3) somewhat unlikely (4) undecided (5) somewhat likely (6)
likely (7) very likely
How likely is it that you will buy products from Calvé?

77
(1) Very unlikely (2) unlikely (3) somewhat unlikely (4) undecided (5) somewhat likely (6)
likely (7) very likely
How likely is it that you will buy products from own label brands?
(1) Very unlikely (2) unlikely (3) somewhat unlikely (4) undecided (5) somewhat likely (6)
likely (7) very likely
Thank you for filling in my questionnaire! If you have a question / remark you can mention
this in the field below. For a chance to win one of the gift certificates of the Albert Heijn you
must submit your e-mailadress.
With kind regards,
Eveline Verdiesen
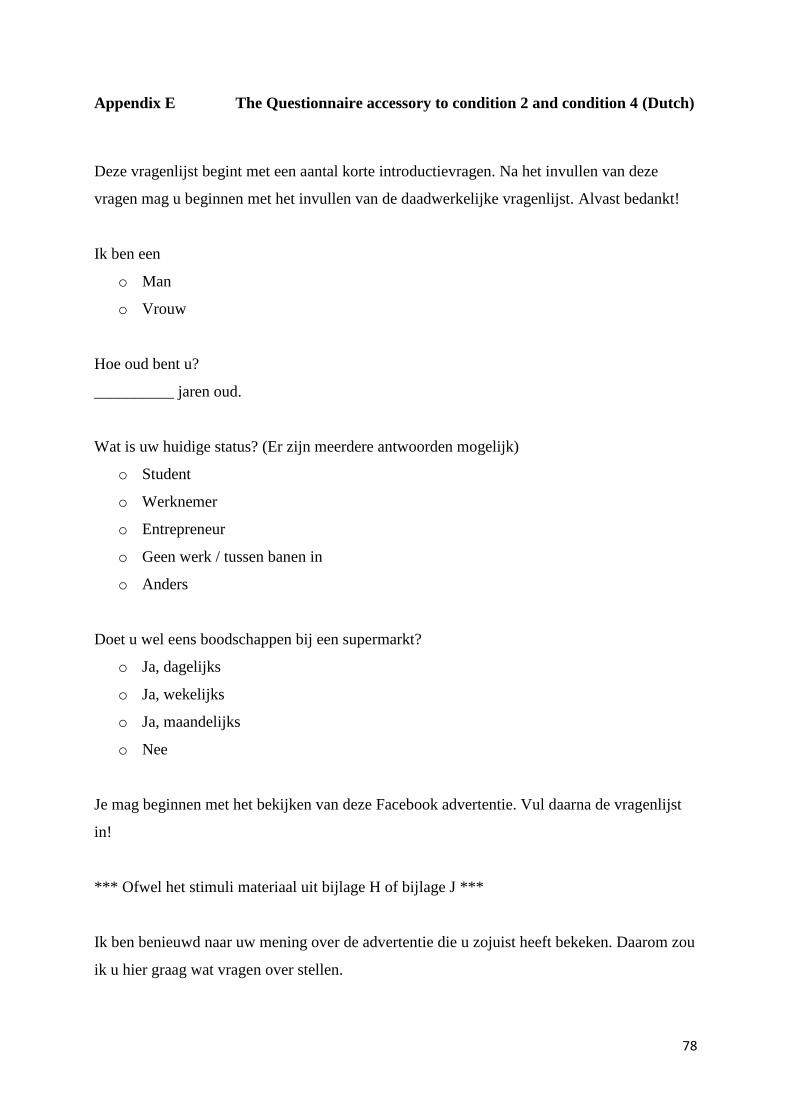
78
Appendix E The Questionnaire accessory to condition 2 and condition 4 (Dutch)
Deze vragenlijst begint met een aantal korte introductievragen. Na het invullen van deze
vragen mag u beginnen met het invullen van de daadwerkelijke vragenlijst. Alvast bedankt!
Ik ben een
o Man
o Vrouw
Hoe oud bent u?
__________ jaren oud.
Wat is uw huidige status? (Er zijn meerdere antwoorden mogelijk)
o Student
o Werknemer
o Entrepreneur
o Geen werk / tussen banen in
o Anders
Doet u wel eens boodschappen bij een supermarkt?
o Ja, dagelijks
o Ja, wekelijks
o Ja, maandelijks
o Nee
Je mag beginnen met het bekijken van deze Facebook advertentie. Vul daarna de vragenlijst
in!
*** Ofwel het stimuli materiaal uit bijlage H of bijlage J ***
Ik ben benieuwd naar uw mening over de advertentie die u zojuist heeft bekeken. Daarom zou
ik u hier graag wat vragen over stellen.

79
Van welke winkel van de onderste 5 opties heeft u zojuist een advertentie gezien?
o Albert Heijn
o Jumbo
o Aldi
o C1000
o Lidl
Van welk merken van de onderste 5 opties heeft u zojuist een advertentie gezien? (U kunt
meerdere antwoorden aanklikken)
o Calvé
o Croma
o Huismerk
Wat was de prijs van de twee potten Albert Heijn huismerk pindakaas in de advertentie?
o 1.99
o 2.00
o 2.99
o Weet ik niet
Wat was de prijs van de twee potten Aldi huismerk pindakaas in de advertentie?
o 1.99
o 2.00
o 3.00
o Weet ik niet
De Albert Heijn valt volgens mij onder het volgende segment supermarkten:
o Hoog segment
o Midden segment
o Laag segment
De Aldi valt volgens mij onder het volgende segment supermarkten:
o Hoog segment
o Midden segment
o Laag segment
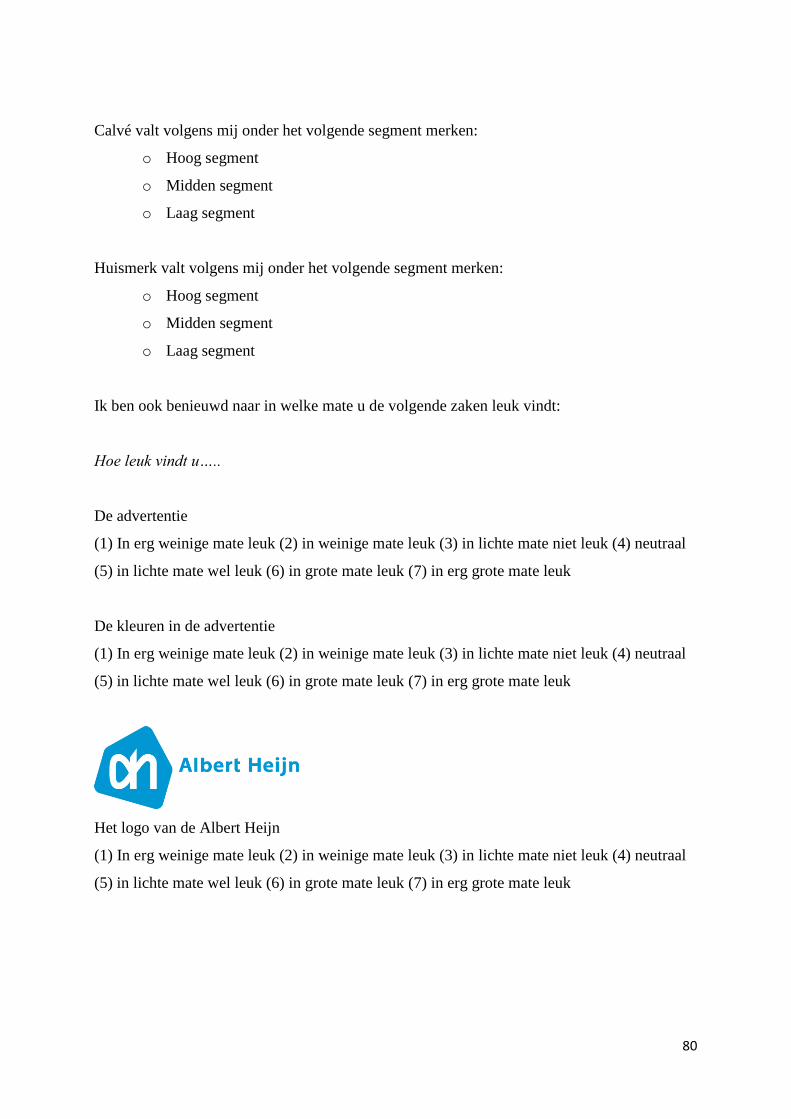
80
Calvé valt volgens mij onder het volgende segment merken:
o Hoog segment
o Midden segment
o Laag segment
Huismerk valt volgens mij onder het volgende segment merken:
o Hoog segment
o Midden segment
o Laag segment
Ik ben ook benieuwd naar in welke mate u de volgende zaken leuk vindt:
Hoe leuk vindt u…..
De advertentie
(1) In erg weinige mate leuk (2) in weinige mate leuk (3) in lichte mate niet leuk (4) neutraal
(5) in lichte mate wel leuk (6) in grote mate leuk (7) in erg grote mate leuk
De kleuren in de advertentie
(1) In erg weinige mate leuk (2) in weinige mate leuk (3) in lichte mate niet leuk (4) neutraal
(5) in lichte mate wel leuk (6) in grote mate leuk (7) in erg grote mate leuk
Het logo van de Albert Heijn
(1) In erg weinige mate leuk (2) in weinige mate leuk (3) in lichte mate niet leuk (4) neutraal
(5) in lichte mate wel leuk (6) in grote mate leuk (7) in erg grote mate leuk

81
Het logo van de Aldi
(1) In erg weinige mate leuk (2) in weinige mate leuk (3) in lichte mate niet leuk (4) neutraal
(5) in lichte mate wel leuk (6) in grote mate leuk (7) in erg grote mate leuk
De getoonde producten
(1) In erg weinige mate leuk (2) in weinige mate leuk (3) in lichte mate niet leuk (4) neutraal
(5) in lichte mate wel leuk (6) in grote mate leuk (7) in erg grote mate leuk
De situatie in de advertentie
(1) In erg weinige mate leuk (2) in weinige mate leuk (3) in lichte mate niet leuk (4) neutraal
(5) in lichte mate wel leuk (7) in grote mate leuk (7) in erg grote mate leuk
Ik ben ook benieuwd naar de mate waarin u het eens bent met de volgende stellingen:
De Albert Heijn is een ‘likeable’ winkel
(1) Helemaal mee oneens (2) mee oneens (3) een beetje mee oneens (4) niet mee oneens/niet
mee eens (5) een beetje mee eens (6) mee eens (7) helemaal mee eens
De Albert Heijn komt over als een vriendelijke winkel
(1) Helemaal mee oneens (2) mee oneens (3) een beetje mee oneens (4) niet mee oneens/niet
mee eens (5) een beetje mee eens (6) mee eens (7) helemaal mee eens
De Albert Heijn komt over als een warme winkel
(1) Helemaal mee oneens (2) mee oneens (3) een beetje mee oneens (4) niet mee oneens/niet
mee eens (5) een beetje mee eens (6) mee eens (7) helemaal mee eens
De Albert Heijn komt over als een aardige winkel

82
(1) Helemaal mee oneens (2) mee oneens (3) een beetje mee oneens (4) niet mee oneens/niet
mee eens (5) een beetje mee eens (6) mee eens (7) helemaal mee eens
De Aldi is een ‘likeable’ winkel
(1) Helemaal mee oneens (2) mee oneens (3) een beetje mee oneens (4) niet mee oneens/niet
mee eens (5) een beetje mee eens (6) mee eens (7) helemaal mee eens
De Aldi komt over als een vriendelijke winkel
(1) Helemaal mee oneens (2) mee oneens (3) een beetje mee oneens (4) niet mee oneens/niet
mee eens (5) een beetje mee eens (6) mee eens (7) helemaal mee eens
De Aldi komt over als een warme winkel
(1) Helemaal mee oneens (2) mee oneens (3) een beetje mee oneens (4) niet mee oneens/niet
mee eens (5) een beetje mee eens (6) mee eens (7) helemaal mee eens
De Aldi komt over als een aardige winkel
(1) Helemaal mee oneens (2) mee oneens (3) een beetje mee oneens (4) niet mee oneens/niet
mee eens (5) een beetje mee eens (6) mee eens (7) helemaal mee eens
Huismerk is een ‘likeable’ merk
(1) Helemaal mee oneens (2) mee oneens (3) een beetje mee oneens (4) niet mee oneens/niet
mee eens (5) een beetje mee eens (6) mee eens (7) helemaal mee eens
Huismerk komt over als een vriendelijk merk
(1) Helemaal mee oneens (2) mee oneens (3) een beetje mee oneens (4) niet mee oneens/niet
mee eens (5) een beetje mee eens (6) mee eens (7) helemaal mee eens
Huismerk komt over als een warm merk
(1) Helemaal mee oneens (2) mee oneens (3) een beetje mee oneens (4) niet mee oneens/niet
mee eens (5) een beetje mee eens (6) mee eens (7) helemaal mee eens
Huismerk komt over als een aardig merk
(1) Helemaal mee oneens (2) mee oneens (3) een beetje mee oneens (4) niet mee oneens/niet
mee eens (5) een beetje mee eens (6) mee eens (7) helemaal mee eens

83
Tenslotte zou ben ik benieuwd naar uw voorkeuren omtrent supermarkten en merken. Zou u
de volgende vragen willen invullen:
Welke winkel vindt u leuker?
o Albert Heijn
o Aldi
Welk merk vindt u leuker?
o Calvé
o Huismerk
Ik prefereer de Albert Heijn boven concurrenten
(1) Helemaal mee oneens (2) mee oneens (3) een beetje mee oneens (4) niet mee oneens/niet
mee eens (5) een beetje mee eens (6) mee eens (7) helemaal mee eens
Ik prefereer de Aldi boven concurrenten
(1) Helemaal mee oneens (2) mee oneens (3) een beetje mee oneens (4) niet mee oneens/niet
mee eens (5) een beetje mee eens (6) mee eens (7) helemaal mee eens
Ik prefereer Calvé (pindakaas) boven concurrenten
(1) Helemaal mee oneens (2) mee oneens (3) een beetje mee oneens (4) niet mee oneens/niet
mee eens (5) een beetje mee eens (6) mee eens (7) helemaal mee eens
Ik prefereer het huismerk boven concurrenten
(1) Helemaal mee oneens (2) mee oneens (3) een beetje mee oneens (4) niet mee oneens/niet
mee eens (5) een beetje mee eens (6) mee eens (7) helemaal mee eens
Ik beveel de Albert Heijn aan aan mijn vrienden en kennissen
(1) Helemaal mee oneens (2) mee oneens (3) een beetje mee oneens (4) niet mee oneens/niet
mee eens (5) een beetje mee eens (6) mee eens (7) helemaal mee eens
Ik beveel de Aldi aan aan mijn vrienden en kennissen
(1) Helemaal mee oneens (2) mee oneens (3) een beetje mee oneens (4) niet mee oneens/niet
mee eens (5) een beetje mee eens (6) mee eens (7) helemaal mee eens
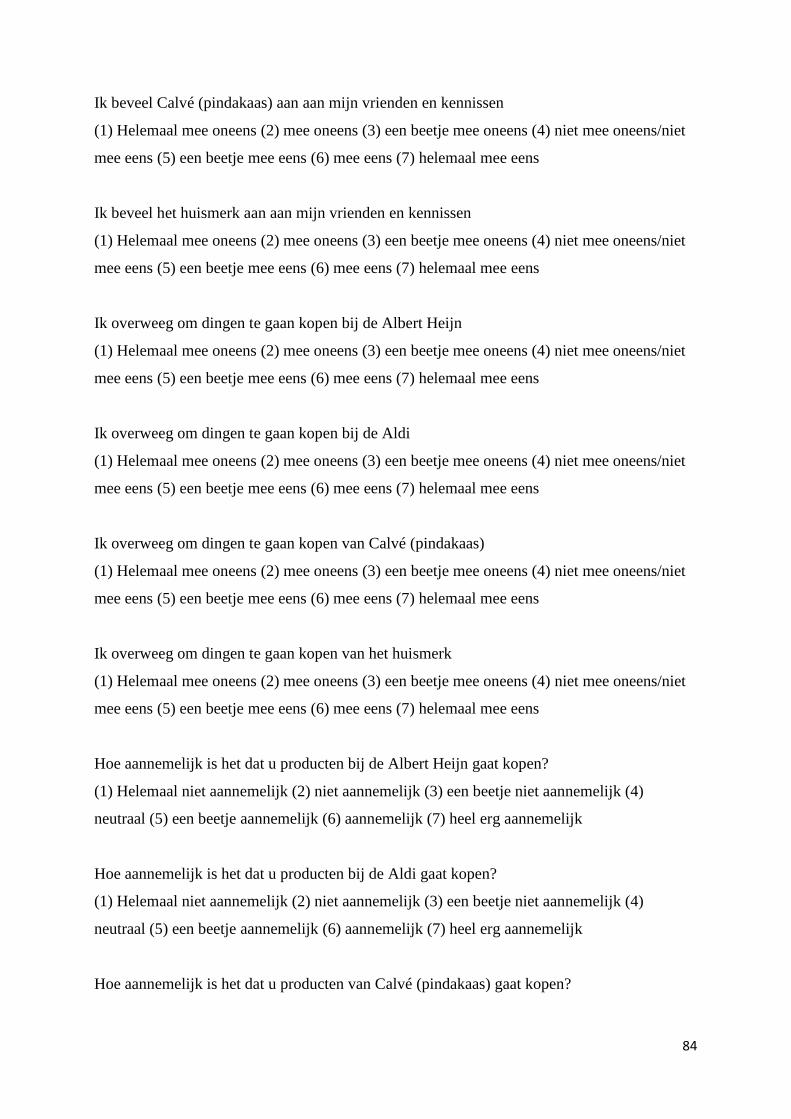
84
Ik beveel Calvé (pindakaas) aan aan mijn vrienden en kennissen
(1) Helemaal mee oneens (2) mee oneens (3) een beetje mee oneens (4) niet mee oneens/niet
mee eens (5) een beetje mee eens (6) mee eens (7) helemaal mee eens
Ik beveel het huismerk aan aan mijn vrienden en kennissen
(1) Helemaal mee oneens (2) mee oneens (3) een beetje mee oneens (4) niet mee oneens/niet
mee eens (5) een beetje mee eens (6) mee eens (7) helemaal mee eens
Ik overweeg om dingen te gaan kopen bij de Albert Heijn
(1) Helemaal mee oneens (2) mee oneens (3) een beetje mee oneens (4) niet mee oneens/niet
mee eens (5) een beetje mee eens (6) mee eens (7) helemaal mee eens
Ik overweeg om dingen te gaan kopen bij de Aldi
(1) Helemaal mee oneens (2) mee oneens (3) een beetje mee oneens (4) niet mee oneens/niet
mee eens (5) een beetje mee eens (6) mee eens (7) helemaal mee eens
Ik overweeg om dingen te gaan kopen van Calvé (pindakaas)
(1) Helemaal mee oneens (2) mee oneens (3) een beetje mee oneens (4) niet mee oneens/niet
mee eens (5) een beetje mee eens (6) mee eens (7) helemaal mee eens
Ik overweeg om dingen te gaan kopen van het huismerk
(1) Helemaal mee oneens (2) mee oneens (3) een beetje mee oneens (4) niet mee oneens/niet
mee eens (5) een beetje mee eens (6) mee eens (7) helemaal mee eens
Hoe aannemelijk is het dat u producten bij de Albert Heijn gaat kopen?
(1) Helemaal niet aannemelijk (2) niet aannemelijk (3) een beetje niet aannemelijk (4)
neutraal (5) een beetje aannemelijk (6) aannemelijk (7) heel erg aannemelijk
Hoe aannemelijk is het dat u producten bij de Aldi gaat kopen?
(1) Helemaal niet aannemelijk (2) niet aannemelijk (3) een beetje niet aannemelijk (4)
neutraal (5) een beetje aannemelijk (6) aannemelijk (7) heel erg aannemelijk
Hoe aannemelijk is het dat u producten van Calvé (pindakaas) gaat kopen?

85
(1) Helemaal niet aannemelijk (2) niet aannemelijk (3) een beetje niet aannemelijk (4)
neutraal (5) een beetje aannemelijk (6) aannemelijk (7) heel erg aannemelijk
Hoe aannemelijk is het dat u producten van het huismerk gaat kopen?
(1) Helemaal niet aannemelijk (2) niet aannemelijk (3) een beetje niet aannemelijk (4)
neutraal (5) een beetje aannemelijk (6) aannemelijk (7) heel erg aannemelijk
Bedankt voor het invullen van mijn vragenlijst! Als u nog vragen / opmerkingen heeft kunt u
deze in het veld hieronder invullen. Om kans te maken op een van de waardebonnen voor de
Albert Heijn dient u uw e-mail adres in te vullen.
Met vriendelijke groeten,
Eveline Verdiesen
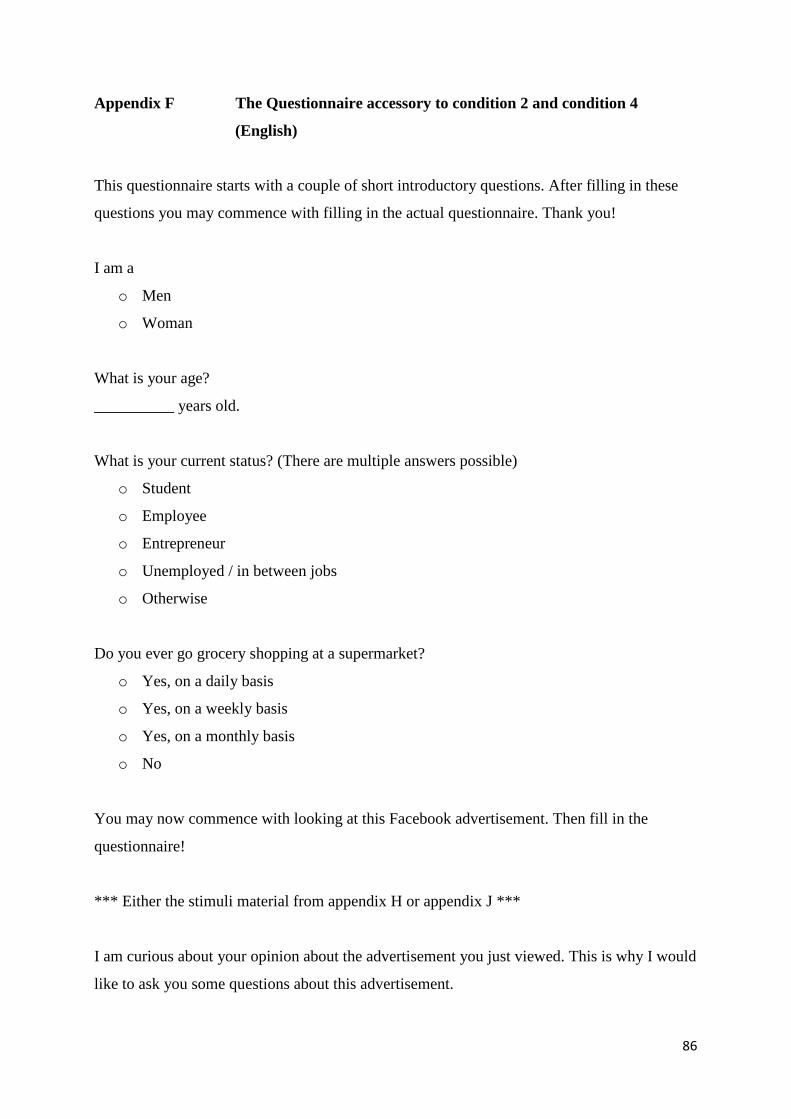
86
Appendix F The Questionnaire accessory to condition 2 and condition 4
(English)
This questionnaire starts with a couple of short introductory questions. After filling in these
questions you may commence with filling in the actual questionnaire. Thank you!
I am a
o Men
o Woman
What is your age?
__________ years old.
What is your current status? (There are multiple answers possible)
o Student
o Employee
o Entrepreneur
o Unemployed / in between jobs
o Otherwise
Do you ever go grocery shopping at a supermarket?
o Yes, on a daily basis
o Yes, on a weekly basis
o Yes, on a monthly basis
o No
You may now commence with looking at this Facebook advertisement. Then fill in the
questionnaire!
*** Either the stimuli material from appendix H or appendix J ***
I am curious about your opinion about the advertisement you just viewed. This is why I would
like to ask you some questions about this advertisement.

87
From which of the stores displayed underneath did you just saw an advertisement?
o Albert Heijn
o Jumbo
o Aldi
o C1000
o Lidl
From which of the brands displayed underneath did you just saw an advertisement?
o Calvé
o Croma
o Huismerk
What was the price of the two jars of Albert Heijn’s own label peanut butter in the
advertisement of Albert Heijn?
o 1.99
o 2.00
o 2.99
o I don’t know
What was the price of the two jars of Aldi’s own label peanut butter in the advertisement of
Aldi?
o 1.99
o 2.00
o 3.00
o Weet ik niet
I think the Albert Heijn can be categorized as the following segment supermarkets:
o High segment
o Middle segment
o Low segment
I think the Aldi can be categorized as the following segment supermarkets:
o High segment
o Middle segment

88
o Low segment
I think Calvé can be categorized as the following segment brand:
o High segment
o Middle segment
o Low segment
I think own label can be categorized as the following segment brand:
o High segment
o Middle segment
o Low segment
I am also curious about how much you like the following matters:
How much do you like…..
The whole advertisement
(1) To an extremely small extent (2) to a very small extent (3) To a small extent (4) neutral
(5) to a large extent (6) to a very large extent (7) to an extremely large extent
The colors used in the advertisement
(1) To an extremely small extent (2) to a very small extent (3) To a small extent (4) neutral
(5) to a large extent (6) to a very large extent (7) to an extremely large extent
The logo of the Albert Heijn
(1) To an extremely small extent (2) to a very small extent (3) To a small extent (4) neutral
(5) to a large extent (6) to a very large extent (7) to an extremely large extent

89
The logo of the Aldi
(1) To an extremely small extent (2) to a very small extent (3) To a small extent (4) neutral
(5) to a large extent (6) to a very large extent (7) to an extremely large extent
The showed products
(1) To an extremely small extent (2) to a very small extent (3) To a small extent (4) neutral
(5) to a large extent (6) to a very large extent (7) to an extremely large extent
The situation in the advertisement
(1) To an extremely small extent (2) to a very small extent (3) To a small extent (4) neutral
(5) to a large extent (6) to a very large extent (7) to an extremely large extent
I am also curious about the degree in which you agree with the following statements:
The Albert Heijn is a likeable store.
(1) Strongly disagree (2) disagree (3) mildly disagree (4) neither agree nor disagree (5) mildly
agree (6) agree (7) strongly agree
The Albert Heijn comes across as a friendly store.
(1) Strongly disagree (2) disagree (3) mildly disagree (4) neither agree nor disagree (5) mildly
agree (6) agree (7) strongly agree
The Albert Heijn comes across as a warm store.
(1) Strongly disagree (2) disagree (3) mildly disagree (4) neither agree nor disagree (5)
mildly agree (6) agree (7) strongly agree
The Albert Heijn comes across as a kind store.

90
(1) Strongly disagree (2) disagree (3) mildly disagree (4) neither agree nor disagree (5)
mildly agree (6) agree (7) strongly agree
The Aldi is a likeable store.
(1) Strongly disagree (2) disagree (3) mildly disagree (4) neither agree nor disagree (5)
mildly agree (6) agree (7) strongly agree
The Aldi comes across as a friendly store.
(1) Strongly disagree (2) disagree (3) mildly disagree (4) neither agree nor disagree (5)
mildly agree (6) agree (7) strongly agree
The Aldi comes across as a warm store.
(1) Strongly disagree (2) disagree (3) mildly disagree (4) neither agree nor disagree (5)
mildly agree (6) agree (7) strongly agree
The Aldi comes across as a kind store.
(1) Strongly disagree (2) disagree (3) mildly disagree (4) neither agree nor disagree (5) mildly
agree (6) agree (7) strongly agree
Own label is a likeable brand.
(1) Strongly disagree (2) disagree (3) mildly disagree (4) neither agree nor disagree (5) mildly
agree (6) agree (7) strongly agree
Own label comes across as a friendly brand.
(1) Strongly disagree (2) disagree (3) mildly disagree (4) neither agree nor disagree (5) mildly
agree (6) agree (7) strongly agree
Own label comes across as a warm brand.
(1) Strongly disagree (2) disagree (3) mildly disagree (4) neither agree nor disagree (5) mildly
agree (6) agree (7) strongly agree
Own label comes across as a kind brand.
(1) Strongly disagree (2) disagree (3) mildly disagree (4) neither agree nor disagree (5) mildly
agree (6) agree (7) strongly agree

91
Finnaly, I am curious about your preferences concerning supermarkets and brands. Would
you please fill in the following questions:
Which store do you like better?
o Albert Heijn
o Aldi
Which brand do you like better?
o Calvé
o Own label
I prefer Albert Heijn above competitors.
(1) Strongly disagree (2) disagree (3) mildly disagree (4) neither agree nor disagree (5) mildly
agree (6) agree (7) strongly agree
I prefer Aldi above competitors.
(1) Strongly disagree (2) disagree (3) mildly disagree (4) neither agree nor disagree (5) mildly
agree (6) agree (7) strongly agree
I prefer Calvé (peanut butter) above competitors.
(1) Strongly disagree (2) disagree (3) mildly disagree (4) neither agree nor disagree (5) mildly
agree (6) agree (7) strongly agree
I prefer own label above competitors.
(1) Strongly disagree (2) disagree (3) mildly disagree (4) neither agree nor disagree (5) mildly
agree (6) agree (7) strongly agree
I recommend Albert Heijn to my friends and acquaintances.
(1) Strongly disagree (2) disagree (3) mildly disagree (4) neither agree nor disagree (5) mildly
agree (6) agree (7) strongly agree
I recommend Aldi to my friends and acquaintances.
(1) Strongly disagree (2) disagree (3) mildly disagree (4) neither agree nor disagree (5) mildly
agree (6) agree (7) strongly agree

92
I recommend the Calvé (peanut butter) to my friends and acquaintances.
(1) Strongly disagree (2) disagree (3) mildly disagree (4) neither agree nor disagree (5) mildly
agree (6) agree (7) strongly agree
I recommend own label to my friends and acquaintances.
(1) Strongly disagree (2) disagree (3) mildly disagree (4) neither agree nor disagree (5) mildly
agree (6) agree (7) strongly agree
I am considering buying products at Albert Heijn.
(1) Strongly disagree (2) disagree (3) mildly disagree (4) neither agree nor disagree (5) mildly
agree (6) agree (7) strongly agree
I am considering buying products at Aldi.
(1) Strongly disagree (2) disagree (3) mildly disagree (4) neither agree nor disagree (5) mildly
agree (6) agree (7) strongly agree
I am considering buying products from Calvé (peanut butter).
(1) Strongly disagree (2) disagree (3) mildly disagree (4) neither agree nor disagree (5) mildly
agree (6) agree (7) strongly agree
I am considering buying products from own label.
(1) Strongly disagree (2) disagree (3) mildly disagree (4) neither agree nor disagree (5) mildly
agree (6) agree (7) strongly agree
How likely is it that you will buy products at Albert Heijn?
(1) Very unlikely (2) unlikely (3) somewhat unlikely (4) undecided (5) somewhat likely (6)
likely (7) very likely
How likely is it that you will buy products at Aldi?
(1) Very unlikely (2) unlikely (3) somewhat unlikely (4) undecided (5) somewhat likely (6)
likely (7) very likely
How likely is it that you will buy products from Calveé (peanut butter)?

93
(1) Very unlikely (2) unlikely (3) somewhat unlikely (4) undecided (5) somewhat likely (6)
likely (7) very likely
How likely is it that you will buy products from own label brands?
(1) Very unlikely (2) unlikely (3) somewhat unlikely (4) undecided (5) somewhat likely (6)
likely (7) very likely
Thank you for filling in my questionnaire! If you have a question / remark you can mention
this in the field below. For a chance to win one of the gift certificates of the Albert Heijn you
must submit your e-mailadress.
With kind regards,
Eveline Verdiesen

94
Appendix G Stimuli Material Condition 1

95
Appendix H Stimuli Material Condition 2
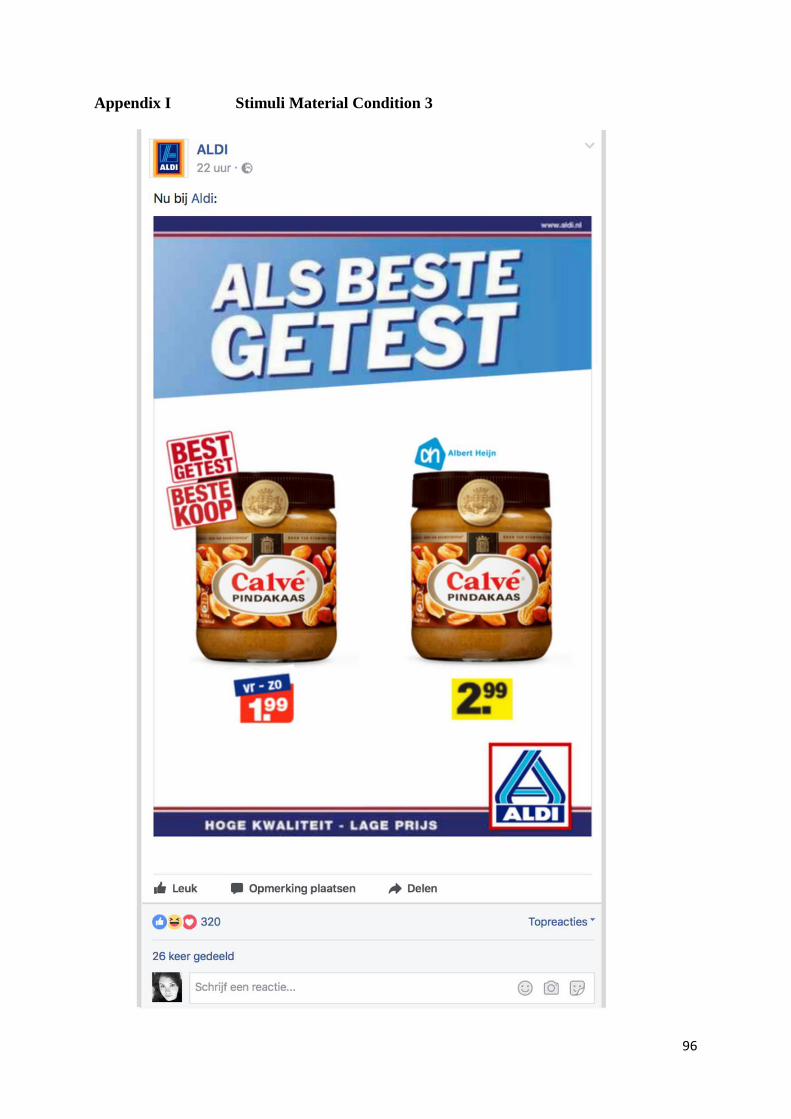
96
Appendix I Stimuli Material Condition 3

97
Appendix J Stimuli Material Condition 4