the effect of working time preferences and fair wage perceptions on entrepreneurial intentions among...
TRANSCRIPT

The effect of working time preferences and fair wageperceptions on entrepreneurial intentions among employees
Arndt Werner • Johanna Gast • Sascha Kraus
Accepted: 10 November 2013
� Springer Science+Business Media New York 2013
Abstract To date, little is known about how working
time preferences and fair wage perceptions affect
employees’ entrepreneurial intentions. Using data
from the German Socio-Economic Panel Study, we
provide first evidence that the difference between the
actual and desired amount of working hours in paid
employment is positively related to the propensity to
switch to self-employment. Furthermore, our analysis
supports the hypothesis that employees who perceive
their current wage level as very unfair are more likely
to have higher entrepreneurial intentions. However,
the closer actual wages get to the wage levels
perceived as fair, the more employees are likely to
remain in their current employment situation. We also
tested the interaction effect of working time
preferences and fair wage perceptions. In line with
our theoretical considerations, we find that employees
who perceive their wages as unfair and, simulta-
neously, prefer different work hours have the strongest
entrepreneurial intentions.
Keywords Employee entrepreneurship �Entrepreneurial intentions � Reference points �Working time preferences
JEL Classifications J3 � J24 � J28 � L26
1 Introduction
Recently, researchers have started to recognize the
importance of analyzing the very early stages of new
firm creation in more detail (Davidsson and Gordon
2012) and to explore factors that influence an individ-
ual’s intention to engage in entrepreneurship. This has
led to the rise of the relatively new research field of
‘‘nascent entrepreneurship’’ which aims to examine the
very first stages of the start-up process, namely the
factors that potentially influence the employees’ inten-
tion to switch to self-employment. Although the impact
of many of these factors is accepted, there are still many
gaps in this body of research literature.
For example, it is a standard fact in entrepreneur-
ship literature that an individual’s intention to become
self-employed is not made in a vacuum but instead
depends on different factors such as human and
A. Werner (&)
Institut fur Mittelstandsforschung Bonn (IfM Bonn),
University of Siegen, Maximilianstraße 20, 53111 Bonn,
Germany
e-mail: [email protected]
J. Gast � S. Kraus
Institute for Entrepreneurship, University of
Liechtenstein, Furst-Franz-Josef-Strasse, 9490 Vaduz,
Liechtenstein
e-mail: [email protected]
S. Kraus
e-mail: [email protected]; [email protected]
S. Kraus
Utrecht University School of Economics, P.O. Box 80125,
3508 TC Utrecht, The Netherlands
123
Small Bus Econ
DOI 10.1007/s11187-013-9528-2

financial capital endowments, demographic and psy-
chological aspects, or regional conditions (e.g., Ve-
rheul et al. 2002; Blanchflower 2000; Parker 2004;
Grilo and Thurik 2005; Davidsson 2006; Grilo and
Irigoyen 2006). In particular, recent research literature
indicates that entrepreneurial behavior should not be
analyzed in isolation. Existing firms, for example,
have been identified as an important source of new
entrepreneurs (e.g., Hellmann 2007). In fact, the
majority of new entrepreneurs actually launch their
new venture following a period of employment in
established companies (e.g., Burton et al. 2002;
Gompers et al. 2005). Consequently, this finding has
sparked a growing interest in recent entrepreneurship
literature regarding the role of the work environment
in employees’ motivation to switch into self-employ-
ment from paid employment (e.g., Hellmann 2007;
Parker 2007, 2009). Recent literature has identified
several firm-related attributes—such as firms’ size,
labor income, or length of job tenure—which affect
the rate at which new entrepreneurs are spawned by
established firms (e.g., Evans and Leighton 1989;
Wagner 2004; Gompers et al. 2005; Campbell et al.
2012).
Although the impact of many of these factors is
accepted, there are still many gaps in this body of
research literature. Little is known, for example, about
the impact of working time preferences and fair wage
perceptions on the entrepreneurial intentions of
employees. With regard to working time preferences,
it can be argued that flexible work schedules may help
to reconcile work and private life preferences of
individuals because of more flexible work schedules in
self-employment compared to paid employment. With
regard to fair wage perceptions, it can be argued that
employees’ utility not only depends on absolute wage
levels but also on the relationship of the actual income
in paid employment to a specific reference wage (see,
e.g., Kahneman and Tversky 1979). Following this
line of thought, employees are assumed to have a
certain wage target in mind which they judge as being
appropriate for their work and which they do not want
to fall below. In this article, we argue that if the actual
income level of an employee is below but lies very
close to his or her specific reference wage, he or she
will stay in paid employment because switching to
self-employment may bear the risk of falling even
further below the target income (i.e. the wage level
perceived as fair for the work load). However, if the
difference between the absolute and the target income
is very large (i.e. the actual wage level is perceived as
very unfair), employees may consider self-employ-
ment as an occupational alternative to their paid
employment situation and, accordingly, as an occu-
pational alternative to reaching their target income in
the near future.
Finally, employees may have higher entrepreneur-
ial intentions if they perceive their wage as unfair and
at the same time prefer a different work schedule. It
can be argued, for example, that employees may
consider increasing the amount of working hours to
earn a wage level which they considered as fair.
However, due to organizational constraints, increasing
the work hours may be difficult to realize. In such
cases, switching to self-employment may become
particularly attractive.
Overall, the present study contributes a novel
approach to the entrepreneurship literature as it is—
to the best of our knowledge—the first to discuss the
role of working time preferences and fair wage
perceptions in a comparative analysis. Using data
from the German Socio-Economic Panel Study
(SOEP), we explore how these factors affect the very
early stages of the firm creation process, the intention
to switch to entrepreneurship. Our findings provide
strong evidence that employees indeed care about
working time preferences and fair wage perceptions.
On the one hand, we show that the difference between
the actual and desired amount of working hours in paid
employment positively affects the propensity to
switch to self-employment. On the other hand, the
analysis supports our hypotheses that, if the gap
between the actual wage level and the wage the
employees consider fair is high, then the entrepre-
neurial intentions will also be high. However, if this
gap is relatively low, employees are more likely to
remain in their current employment situation. Finally,
and in line with our theoretical considerations, we find
that both factors together additionally affect the
propensity of employees to become entrepreneurs.
2 Theory and hypotheses
In the following section, we develop a theoretical
framework dealing with working time preferences and
fair wage perceptions. To outline the above-mentioned
research gap, we performed a systematic literature
A. Werner et al.
123
review in a first step—closely following the guidelines
for an evidence-informed, systematic review method
proposed by Tranfield et al. (2003) and, for example,
being applied in entrepreneurship research by Cesinger
et al. (2012). After scanning six electronic databases,
we found a total of 25 peer-reviewed articles which
conducted an empirical analysis testing the influence of
different explanatory variables on the dependent var-
iable of nascent entrepreneurship or a closely related
concept (e.g., latent entrepreneurship). We found that
most of these studies base their empirical analyses on
longitudinal data for a certain country or set of countries
(e.g., Mueller 2006; Townsend et al. 2010; Fairlie and
Krashinsky 2012). Interestingly, except for five articles,
all these contributions were written after 2005, showing
that nascent entrepreneurship has recently been at the
center of research attention. The literature review
specifically reveals that the intention to leave paid
employment for self-employment can depend on a
number of different factors. On the one hand, personal
and regional factors as well as perceptional variables
seem to affect the occupational choice decision (e.g.,
Delmar and Davidsson 2000; Arenius and Minniti
2005; Bergmann and Sternberg 2007; Grilo and
Irigoyen 2006). On the other hand, pecuniary and
non-pecuniary aspects of the current employment
situation are important factors because they influence
an individual’s job satisfaction and therefore the
propensity towards entrepreneurship. Occupational
choice models have received ample attention in differ-
ent disciplines such as psychology, sociology and, more
recently, economics (e.g., Blaikie 1971; Kanbur 1979;
Jacobs 2008; Sullivan 2009).
Standard labor economic models as a rule assume
that the occupational choice between employment
alternatives is based on rational behavior and utility
maximization (Uusitalo 2001; Bergmann and Stern-
berg 2007). This basically means that individuals
choose entrepreneurship over salaried employment if
the expected utility derived from self-employment is
higher than that from salaried employment (e.g.,
Douglas and Shepherd 2000). However, while tradi-
tional research in this field has looked at the monetary
effects and/or differences in predicted earnings with
respect to the decision between paid and self-employ-
ment (e.g., Rees and Shah 1986; de Wit and van
Winden 1989; Taylor 1996; Johansson 2000; Anders-
son and Wadensjo 2013), recent work in entrepre-
neurship research has started to pay more attention to
the question of how non-monetary factors can influ-
ence the individuals’ utility and, consequently, his or
her occupational choice.
In line with this body of work, Hamilton (2000), for
example, finds that most entrepreneurs enter and
persist in self-employment despite the fact that they
have both lower initial earnings and lower earnings
growth than in paid employment. Without going into
detail, Hamilton assumes that being self-employed has
to be aligned with some kind of non-pecuniary value
(e.g., ‘being their own boss’) that individuals cannot
acquire in paid employment. The results of a study by
Benz and Frey (2004) point in a similar direction.
Focusing on household panels in England, Germany,
and Switzerland, the authors show that the self-
employed are generally more satisfied and happy with
their work situation than paid employees—even after
controlling for income and work hours (see also Taylor
1996; Blanchflower 2000; Hundley 2001; Kawaguchi
2002). Other studies by contrast find evidence that
being dissatisfied with an employment situation can be
an important reason for employees to switch to
entrepreneurship. Werner and Moog (2007) show that
including a vector of variables capturing poor working
conditions in paid employment (e.g., work climate, and
the relationship of the employees to their colleagues
and superiors) has a strong positive effect on the
intention of employees to switch to self-employment.
Also underlying the effect of job dissatisfaction,
Cromie and Hayes (1991) find that, in aggregate,
entrepreneurs were relatively less satisfied with the
jobs they held prior to founding their own business. So,
in sum, the literature shows that individuals can be
satisfied or dissatisfied with their occupation not only
because of economic outcomes but also due to the non-
pecuniary aspects of their current employment situa-
tion. Such workplace characteristics can influence an
individual’s utility and, consequently, his or her
propensity to switch to entrepreneurship.
Apart from concentrating on absolute wage levels as
well as the differences in predicted earnings, a second
line of recently evolved research provides evidence
that fairness perceptions of different wage levels may
influence the individual’s employment choice (e.g.,
Camerer et al. 1997; Fehr and Gotte 2007; Abeler et al.
2011). The key idea underlying this body of research is
the assumption that the utility an individual can derive
from a certain income not only depends on the level of
the absolute wage but also hinges on the relationship of
Effect of working time preferences
123

this absolute wage to a certain reference wage. That is,
even if the employees do not know the exact wage
levels of their co-workers, they do form reasonable
estimates of where they lie regarding pay (Bewley
1999; Mayraz et al. 2009; Clark and Senik 2010).
Accordingly, recent studies in economics have started
to emphasize the possible effect reference points can
have on an individual’s evaluation of economic
outcomes and the effectiveness of incentives (e.g.,
Mohnen and Pokorny 2005; Ockenfels et al. 2010). To
date, however, the impact of such relative wage
comparisons has received little attention in entrepre-
neurship. One notable exception is the study by
Schneck (2011). Using panel data of German males
between the age of 19 and 55, the author shows that
relative wage positions, generated as measures within
three different hierarchical positions (low, medium,
and high), have an effect on the likelihood of preferring
self-employment over wage employment. In contrast
to this approach, which is based on income compar-
isons (pay ordering) of responding employees in
different firms, we consider fairness perceptions of
employees as a direct measure of such relative wage
positions. As a result, we argue that comparisons with
co-workers will directly influence the employee’s
fairness perception of his or her own wage, and expect
that differences between absolute and the perceived
fair wage income levels will affect an individual’s
choice in favor of or against nascent entrepreneurship.
Our literature review finds an overall considerable
proof that specific non-pecuniary workplace attributes
can strongly affect the employees’ utility level and,
consequently, the decision of employees to switch to
entrepreneurship. Moreover, and to the best of our
knowledge, none of the articles have so far explicitly
dealt with the effect of working time preferences and
fair wage perceptions as potential non-pecuniary
factors affecting the decision between paid and self-
employment. We intend to fill this gap in research
literature in the following by focusing our analysis on
the relationship between working time preferences,
fair wage perceptions, and entrepreneurial intentions.
2.1 Working time preferences
and the entrepreneurial intentions
of employees
While standard labor supply models usually assume
that individuals can freely choose their amount of
working hours (Wooden et al. 2009), empirical
evidence suggests that many employees would actu-
ally prefer to work fewer hours than they have to, even
if this would mean a change in income (Wooden et al.
2009; Heineck and Moller 2012). Moreover, several
studies which empirically analyze the pattern of actual
and preferred working hours observe an increasing
tension between these two variables (e.g., Fagan et al.
2006; Heineck and Moller 2012). Heineck and Moller
(2012), for example, show that more than 60 % of full-
time working employees prefer to work fewer hours
than they actually do, taking the accompanied loss of
earnings into account. There is obviously a mismatch
between actual and preferred working hours, which
may affect employees’ utility function and, conse-
quently, their occupational decision. Concentrating on
working hours of entrepreneurs, Boden (1999) shows
that new business owners are more satisfied with their
work schedules compared to employees, even though
they work longer hours on average. Accordingly,
Golden (2001) finds that self-employed individuals are
more than twice as likely to adapt their working
schedules to their own needs compared to paid
employees. Based on this finding, the author concludes
that work schedule flexibility should be seen as a
‘‘major reason to become self-employed’’ (Golden
2001, p. 59). Thus, even though the self-employed
work longer hours, switching to self-employment
seems to help reconcile work and private life and,
consequently, increase the individuals’ utility. Simi-
larly, using panel data from Sweden, Andersson
(2008) reports a causal effect between self-employ-
ment and job as well as life satisfaction, indicating that
the self-employed are more likely to feel an increase in
job and life satisfaction compared to wage earners.
Hence, more generally, if employees have to work
more hours for their company than they are willing to,
they may consider switching to self-employment,
because this occupational alternative will reflect a
higher degree of autonomy and work schedule flexi-
bility than is found in an employment situation.
Furthermore, we expect that the larger the differ-
ence between actual and preferred working hours, the
lower the degree of individual utility and the higher
the entrepreneurial intentions will be. To be sure,
employees could also switch to a new occupation in
paid employment if they are unsatisfied with the
flexibility of their work schedule. However, we
believe that, on average, this occupational alternative
A. Werner et al.
123

will again involve a lower degree of autonomy and
work schedule flexibility than is the case with self-
employment, because the employee will again switch
to a given organizational structure with given working
positions and (more or less) predetermined (i.e. less
flexible) work schedules (e.g., Stier and Lewin-
Epstein 2003). We therefore hypothesize the
following:
H1 The larger the difference between the actual
amount of working hours and the time an employee
would prefer to work, the higher the positive effect on
the employee’s entrepreneurial intentions.
2.2 Fair wage perceptions and the entrepreneurial
intentions of employees
Recent studies in labor market research have aimed to
analyze the effect that relative wage positions and
reference points can have on an individual’s evalua-
tion of economic outcomes and the effectiveness of
incentives. Researchers have tried, especially in the
field of behavioral economics, to shed more light on
the question of how far reference-dependent prefer-
ences can influence the individual utility function
(e.g., Kahneman and Tversky 1979; Bolton and
Ockenfels 2000). The key idea underlying this field
of research is that the individual utility not only
depends on the absolute wage level but also on
comparisons of the absolute wage level to a specific
reference wage level (i.e. the wage level of co-
workers). As discussed above, the novelty of our
approach is that we define reference wages based on
the employees’ fairness perceptions and relate this
concept to entrepreneurial behavior. In particular, we
expect that differences between the absolute wage (i.e.
actual wage level in paid employment) and the target
wage (wage levels employees perceive as fair for their
work) will affect their propensity towards entrepre-
neurship. By doing this, we assume that comparisons
with co-workers will influence an employee’s fairness
perception of his or her own wages. Consequently,
when the actual income lies very close to a perceived
fair income, we expect employees to stay in paid
employment because switching to self-employment
bears the risk of falling farther below the target
income. However, if the difference between the
absolute and the target income is very large (i.e. the
actual income is perceived as very unfair), we expect
employees to consider self-employment as an
occupational alternative to wage employment because
switching to self-employment enhances the chance to
reach the desired target income. Therefore, we
hypothesize:
H2a If the difference between the actual wage and
the wage an individual considers as fair is very high,
then employees’ entrepreneurial intentions will be
high.
H2b If the difference between the actual wage and
the wage an individual considers as fair is very low,
then employees’ entrepreneurial intentions will be
low.
2.3 Interaction effect between working time
preferences and fair wages
So far, we have argued that working time preferences
and the fairness perception of wages separately have
the potential to influence the entrepreneurial intentions
of employees through their effect on job satisfaction.
Nevertheless, the literature review has demonstrated
that the choice of becoming a nascent entrepreneur
does not depend only on single factors, but rather on a
variety of several variables which should not be
analyzed in isolation. Accordingly, we believe it is
worthwhile to relate the probability of becoming a
nascent entrepreneur to the interaction between our
two explanatory variables of (1) working time pref-
erences and (2) fair wages. By analyzing this interac-
tion term instead of just the separate factors, we
examine the case in which an employee works more
hours than individually preferred and simultaneously
earns less than his/her target wage. Since the utility
and satisfaction that an individual derives from a
certain employment situation depends among other
things on non-monetary (e.g., amount of working
hours) and monetary factors (e.g., wages) (Wagner
2004), it can be expected that, in a situation as
described here, job satisfaction diminishes and the
discontent with the current employment situation
increases. According to several studies, such dissatis-
faction and poor working conditions predict higher
entrepreneurial intentions of employees (e.g., Cromie
and Hayes 1991; Werner and Moog 2007). The fact
that in this case two elements of poor working
conditions are simultaneously in place may perpetuate
job dissatisfaction even more and hence stimulate the
entrepreneurial intentions of employees. Furthermore,
to earn a wage level which is perceived as fair
Effect of working time preferences
123

compared to a certain reference group, the individual
might consider increasing his/her working hours.
However, the employer might not always allow this
due to, e.g., higher overall wage costs or organiza-
tional constraints. When this is the case, dissatisfac-
tion of the individual accordingly increases even more
and he/she will search for options to get closer to the
desired target wage outside the company. In such a
case, switching to self-employment becomes particu-
larly attractive. We thus predict the interaction term
between working time preferences and fair wages to
positively affect nascent entrepreneurship. Hypothesis
3 therefore reads:
H3 Employees have higher entrepreneurial inten-
tions if they perceive their wages as unfair while
simultaneously preferring to work different hours than
they have to in paid employment.
3 Data and variables
To test our hypotheses, our paper employs SOEP data
conducted by the German Institute for Economic
Research (DIW). The SOEP is a representative panel
study of private households in Germany that began in
1984 and is updated annually. A detailed description
of the survey can be found in Wagner et al. (2007). The
dataset provides information on socio-demographic
characteristics (e.g., gender, age, education, fields of
professional experience) and a number of firm-specific
characteristics of employees’ firms (e.g., firm size,
industry, job tenure). Our analysis makes use of the
survey wave of 2009 because it contains a special
block of questions dealing with working time prefer-
ences as well as fair wage perceptions of employees.
We restrict our sample to full-time and part-time
employees (blue-collar and white-collar workers),
between 21 and 65 years old, and working in the
private sector with a maximum job tenure of 40 years.
Our sample as a result excludes the self-employed,
public sector employees, and people not currently in
the labor force. Moreover, the data revealed some
implausibly low monthly wages. Thus, we decided to
exclude employees with wages below the marginal
employment ceiling of 400 Euros per month (see, e.g.,
Pfeiffer and Schneck 2012 for details). Put differently,
employees who earn \13.33 Euros per day are
dropped from our analysis. These restrictions result
in an estimation sample of 4,382 observations.
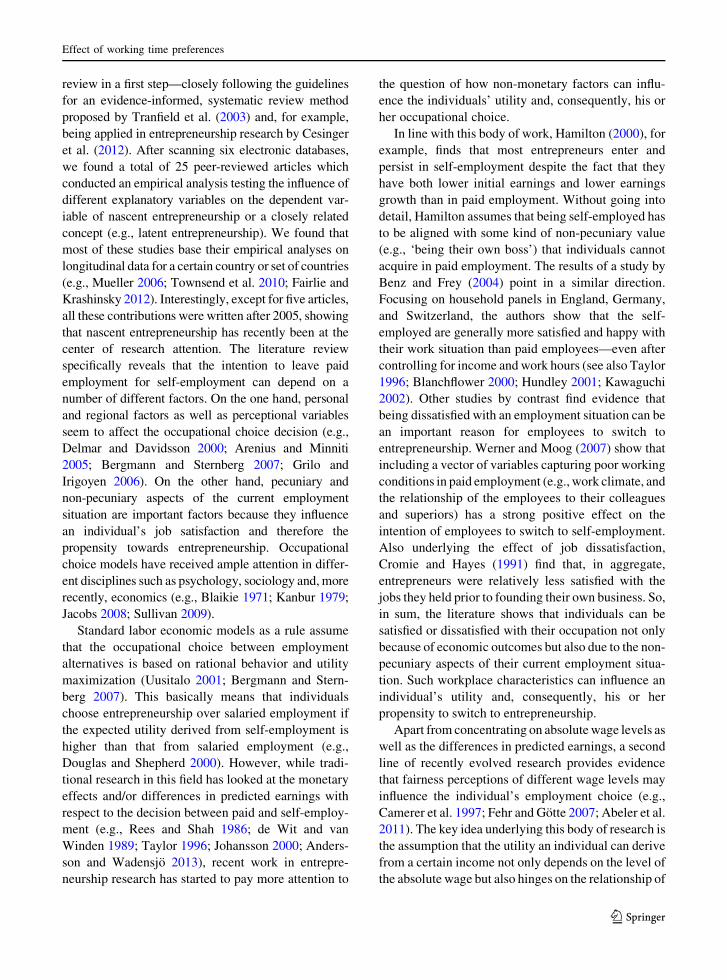
3.1 Dependent variable
3.1.1 Propensity to become self-employed
For the composition of our dependent variable, we rely
on the answers given to the question regarding
possible future career changes. Part of the data in the
SOEP deals with entrepreneurial activities. For exam-
ple, the interviewees were asked if they plan to
become self-employed in the near future. In particular,
respondents were asked to estimate the probability of
becoming self-employed within the next 2 years. The
exact question was as follows: ‘‘How likely is it that
the following career changes will take place in your
life within the next 2 years?—Have you become self-
employed and/or freelance, and/or a self-employed
professional?’’ The employees were asked to estimate
the probability of such an occupational change in the
near future on a scale from 0 to 100 % in increments of
10; where 0 means that such a change will definitely
not take place and 100 means that such a change will
definitely take place in the near future.
The left column of Fig. 1 shows the distribution of
this variable. While nearly three-quarters (73.5 %) of
the interviewees do not consider becoming self-
employed at all, \1 % consider a definite propensity
to become self-employed. Moreover, 20.1 % of the
respondents estimate their probability to switch to
self-employment in the next 2 years as being between
10 and 40 %. We believe that these individuals are
likely to have not yet been actively involved in starting
a new business. However, they have probably taken
entrepreneurship into consideration and/or might not
be averse to it. In other words, it is rather implausible
to assume these individuals as nascent entrepreneurs
(i.e. people who by themselves or with others are
actively involved in starting a new business); they may
rather be defined as latent entrepreneurs (e.g., Blanch-
flower et al. 2001). On the other hand, respondents
who rated their likelihood of becoming self-employed
at a minimum of 50 % are probably more likely to
already be actively involved in starting a business
(Mueller, 2006). Accordingly, the right column of
Fig. 1 groups the answers on the basis of a three-item
Likert scale ranging from ‘‘1’’ (those who do not
consider becoming self-employed at all), ‘‘2’’ (those
who rated their probability of becoming self-
employed at 10–40 %) and ‘‘3’’ (those who rated their
probability at a minimum of 50 %). This classification
A. Werner et al.
123

brings forth 20.1 % latent entrepreneurs and approx-
imately 6 % (6.4 %) nascent entrepreneurs. For easier
interpretation, the results presented in the next sections
will be based on regression models using this three-
item ordinal scale.
3.2 Independent variables
3.2.1 Working time preferences
The responding employees were asked to indicate (1)
how many hours they work per week including
possible overtime and (2) how many hours they would
prefer to work, taking a change in income into account
(based on Merz 2002; Reynolds 2003; Wooden et al.
2009; Tam 2010). We then calculated the absolute
difference between the values of these two metric
variables and, by doing so, constructed our first
explanatory variable of working time preferences,
which allows us to measure the level of time-related
under- or over-employment of employees, and to
explore the impact of the individual’s satisfaction with
regard to working time on our dependent variable of
nascent entrepreneurship. Figure 2 shows the histo-
gram of this variable. As the results show, there is a
fair amount of variation in the answers, with a mean of
5.9 h, and a standard deviation of 6.3 h.
3.2.2 Fair wage perceptions
This variable refers to the degree to which employees
perceive their wages as fair. This variable is generated
from the question of whether the current monthly
income was fair from their point of view. If the
respondents answered ‘‘no’’, they were additionally
asked to indicate how high their net income per month
would have to be in order to be perceived as fair. Of the
4,382 employees in our sample, 1,562 (35.6 %) stated
their income at their current job was not fair. In order
to generate a measure for fair wage perceptions, we
divided the amount of the monthly ‘fair wage’ for this
group by the amount of their actual monthly net wage.
We call this measure the fair wage ratio. The average
fair wage ratio between what this group perceives as a
fair wage for their work and their actual net wage is
.482 with a standard deviation of .635. Note that 2,820
(64.4 %) employees stated that their actual wage level
can be considered fair. This group will be used as the
reference group in our regressions. Further, note that
none of the respondents in our analysis said that a fair
wage should actually be lower than their current net
wage.
Figure 3 shows the distribution of the answers
reflecting the fair wage ratio. A first observation is that
most of the 1,562 employees who state that their actual
wage lies below what they perceive as fair are
characterized by a relatively high average ratio value.
In other words, roughly two-thirds report a fair wage
ratio that is higher than 25 %, around 25 % state that a
fair wage for the work they do should be at least
10–25 % higher, and around 3 % say that a fair wage
should amount to a pay raise of up to 10 %. To
summarize, most of these employees report a
substantial degree of disagreement with respect to
020
4060
80
Per
cent
0% 10% 20% 30% 40% 50% 60% 70% 80% 90% 100%
Self-reported probability to become self-employed in the next two years, in %
020
4060
80
No Intention Latent Intention Nascent Intention
Self-reported probability to become self-employed in the next two years, 3-item-Likert scale
(Percent)Propensity to become self-employed
Fig. 1 Distribution of the propensity to become self-employed. Source SOEP 27 (2011)
Effect of working time preferences
123

what they should earn, so we find a sufficient degree of
variation in our fair wage ratio measure to test how
strong different levels of wage ratios affect the
propensity of the employees to become self-employed
in the near future. To test Hypotheses 2a and 2b, we
constructed 6 % dummy variables ranging from an
average ratio of up to 10 % to a difference of more
than 50 % in increments of 10 %.
3.3 Control variables
We included several control variables in our study that
might affect employees’ working time preferences,
fair wage perceptions, and the propensity to become
self-employed. We included years of job tenure and
education because these variables capture different
aspects of human capital and have shown their
influence on the ability to evaluate reference wages
(Gachter and Thoni 2010). In particular, education
controls for differences in the initial stock of human
capital, and job tenure reflects an increase in an
employee’s productivity by on-the-job training (e.g.,
Werner and Moog 2007). Moreover, we also include
educational degree levels in our regression models
because only including number of years of education
is misleading (Jaeger and Page 1996). Thus, we
additionally control for vocational training and a
university degree level.
We also controlled for firm size because working in
small organizations makes individuals more likely to
launch their own businesses. Smaller organizations are
said to have a comparative advantage over larger
organizations in furnishing their employees with
productive experiences that are conducive to entre-
preneurship (e.g., Wagner 2004; Hyytinen and Mal-
iranta 2006). We added log net monthly wage because
this variable may also influence reference wage
assessments as well as the propensity to start a new
venture. Moreover, it is often argued that entrepre-
neurs face capital constraints when trying to acquire
010
2030
Per
cent
0 5 10 15 20 25 30 35 40
Abs(Real Work Time - Preferred Work Time), in Hours per Week
(Percent)Work Time PreferencesFig. 2 Distribution of
working time preferences.
Source SOEP 27 (2011)
02
46
810
Per
cent
0 .25 .5 .75 1 1.25
Fair Wage Ratio, in %
* Ratio between amount of fair wage and ampunt of actual wage; N=1,562
(Percent)Fair Wage Ratio*Fig. 3 Distribution of the
fair wage ratio. Source
SOEP 27 (2011)
A. Werner et al.
123

the necessary financial resources during the start-up
process (Parker and van Praag 2006; Backes-Gellner
and Werner 2007). However, if employees earn
enough money to permit them to build up sufficient
savings, it will be easier for them to overcome such
financial constraints and enter self-employment more
easily. We also included gender because in Germany,
as in many other countries, fewer women than men
start new businesses. And we controlled for age
because as individuals get older they tend to have
higher wages in paid employment while exceeding
lower levels of effort than younger individuals
(Waldman 1984; Hutchens 1989; Prendergast 1999).
Moreover, age can also be seen as a proxy of personal
wealth to overcome the capital constraints discussed
above. However, older employees may also be more
risk averse than younger ones and less capable of
working the long hours often necessary for entrepre-
neurs (Parker 2004). These arguments imply that both
younger and older employees will tend to stay with
their employer compared to those in their middle age.
Thus, we add age2 to test this concave effect of age on
the entrepreneurial intentions of employees.
To control for the rate of foreign employees and the
special conditions they face when trying to evaluate
reference wages and occupational choices, we
included two variables indicating different aspects of
the respondents’ national backgrounds. For example,
it is an established fact in ethnic minority entrepre-
neurship that entrepreneurship can offer a way out of
the discrimination perpetrated by employers in the
labor market, banks in capital markets, or consumers
in product markets (Parker 2004). Even so, minorities
may also face discrimination that hinders their ability
to practice entrepreneurship. Thus, we took a closer
look at (1) the total early stage entrepreneurial activity
(TEA) and (2) the type of economy of the countries
from which the foreign employees came. We gener-
ated these two variables based on information we
gathered from the the Global Entrepreneurship Mon-
itor (GEM) country reports (Sternberg et al. 2013). In
particular, we took into consideration that—compared
to Germany—self-employment in some foreign coun-
tries is overrepresented or underrepresented. Second,
we included a variable indicating whether the employ-
ees in our data come from innovation- or efficiency-
driven economies. A number of studies also confirm
the phenomenon that children of self-employed par-
ents are more likely to become self-employed (see,
e.g., Dunn and Holtz-Eakin 2000; Fairlie and Robb
2007). Self-employed parents can provide social
networks and human and financial resources condu-
cive to self-employment. Growing up in such a family
may also lead to a positive attitude towards entrepre-
neurship or a desire for independence or autonomy
(Mueller 2006). Additionally, children may be moti-
vated to inherit the family business. To provide an
indicator for the necessary constraints, with which an
employee may be confronted when deciding to switch
to entrepreneurship, we also controlled for the labor
force downsize factor, as well as full-time employment
to account for differences in physical presence at the
workplace, which may well influence the reference
wage and work time assessments (Fladung and Iseke
2010). Additionally, we controlled for different
industry sectors, the occupational status of the
employees, and their job satisfaction in paid employ-
ment which may also influence reference wage
assessments and the propensity to become self-
employed (Fehr and Gotte 2007).
Although some work time schedules offered by
companies are more flexible than others, job and
organizational characteristics largely influence the
actual amount of working hours, as employers’ and
employees’ preferences regarding the regulation of
work hours may diverge (Reynolds 2003). These
organizational constraints may force individuals to
think about how to change their employment situation
so that their preferred working hours better match their
actual working hours, e.g., through within- or
between-employer job changes (Boheim and Taylor
2004) or by switching to self-employment (Taylor
1996). Thus, to control for currently existing work
time flexibility, we incorporated the control variable
flexible work time schedule. Last, we included a
control variable for the fact that employees might
consider to take a second job, implying that they
become self-employed while sticking with their cur-
rent employer. As we are interested in the employees’
intention to switch to entrepreneurship instead of wage
employment, not controlling for a second job might
bias our regression results. Last but not least, we
controlled for regional differences in nascent entre-
preneurship within Germany, since previous research
reported that several macro-economic aspects such as
GDP per capita, unemployment rate, population
density, and agglomeration can have an influence on
the self-employment rate and start-up behavior
Effect of working time preferences
123

Table 1 Definitions of variables and descriptive statistics
Description Mean SD Min Max
Self-employment How likely is it that you become self-employed and/or freelance, and/
or a self-employed professional within the next 2 years? 11-item
Likert scale, [0;100]
7.66 17.56 0.00 100.00
Tenure Since when have you been working for your current employer? In
years
10.78 9.27 0.00 40.00
Education (years) Generated variable. Years of education 12.52 2.58 7.00 18.00
University degree
(1 = yes)
Did you conclude your education with a university degree? 1 = yes,
0 = no
0.22 0.42 0.00 1.00
Prof. education_1 Did you have a vocational training degree? 1 = no, 0 = else 0.23 0.42 0.00 1.00
Prof. education_2 Did you have a vocational training degree? 1 = other, 0 = else 0.14 0.35 0.00 1.00
Prof. education_3 Did you have a vocational training degree? 1 = apprenticeship,
0 = else
0.54 0.50 0.00 1.00
Prof. education_4 Did you have a vocational training degree? 1 = master craftsman,
0 = else
0.08 0.27 0.00 1.00
Firm size _1 Approximately how many people does the company employ as a
whole? 1 = \ 20, 0 = else
0.25 0.44 0.00 1.00
Firm size_2 Approximately how many people does the company employ as a
whole? 1 = from 20, but \200, 0 = else
0.30 0.46 0.00 1.00
Firm size_3 Approximately how many people does the company employ as a
whole? 1 = from 200, but \2,000, 0 = else
0.21 0.41 0.00 1.00
Firm size_4 Approximately how many people does the company employ as a
whole? 1 = 2,000 or more people, 0 = else
0.23 0.42 0.00 1.00
Wage How high was your net income from employment last month? Log
net monthly wage
7.32 0.55 5.99 9.90
Gender Your sex? 1 = female, 0 = male 0.42 0.49 1.00 2.00
Age Your year of birth? (generated, years) 42.94 10.51 21.00 65.00
Entrepreneurial_Activity_1 Generated variable: total early stage entrepreneurial activity in
Country of origin: 1 = Germany, 0 = else
0.94 0.24 0.00 1.00
Entrepreneurial_Activity_2 Generated variable: total early stage entrepreneurial activity in
country of origin: 1 = lower or equal to Germany, 0 = else
0.01 0.12 0.00 1.00
Entrepreneurial_Activity_3 Generated variable: total early stage entrepreneurial activity in
country of origin: 1 = higher than Germany, 0 = else
0.05 0.22 0.00 1.00
Type of economy Generated variable (GEM): type of economy in country of Origin:
0 = efficiency-driven economy, 1 = innovation-based economy
0.97 0.18 0.00 1.00
Parent(s) self-employed Is/was your father/mother self-employed? 1 = yes, 0 = no 0.10 0.30 0.00 1.00
East Germany Place of residence? 1 = East Germany, 0 = West Germany 0.24 0.43 0.00 1.00
Full-time Are you currently engaged in paid employment? If yes, which of the
following applies best to your status? 1 = Full-time employed,
0 = part-time employed
0.81 0.39 0.00 1.00
Second job It is possible to work in addition to regular employment. Are you
engaged in a second job next to your main employment activity?
1 = yes, 0 = no
0.07 0.25 0.00 1.00
Flex. work time schedule How many hours are stipulated in your contract (excluding
overtime)? 1 = no set hours, 0 = else
0.07 0.25 0.00 1.00
Labour force downsize What developments do you anticipate in your occupational area: will
the number of employees increase, decrease, or stay the same over
the next 12 months? 1 = decrease, 0 = else
0.31 0.46 0.00 1.00
Job satisfaction How satisfied are you with your job? 11-item Likert scale, [0;10] 6.84 2.03 0.00 10.00
A. Werner et al.
123

(Wagner and Sternberg 2005; Bergmann and Stern-
berg 2007). Hence, we included a dummy variable for
East Germany. Table 1 provides the description of the
variables and detailed descriptive statistics.
3.4 Analytical approach
In the empirical models discussed below, we regress
the propensity of employees to leave paid employment
for self-employment on working time preferences, fair
wage perceptions, and the control variables discussed
above. In particular, four different specifications of the
empirical model were estimated.
In Models 1 and 2, the dependent variable is the
three-item ordinal scale variable described above
taking the value ‘1’ if the employees do not consider
becoming self-employed at all, ‘2’ if they rated their
probability of becoming self-employed at 10–40 %,
and ‘3’ if they rated their probability at a minimum of
50 %. The appropriate econometric model to use in
this case is a regression model for ordinal outcome
variables. In Model 1, we test Hypotheses 1, 2a, and 2b
by including the control variables and the variables
representing the working time preferences and the fair
wage perceptions by using the above described set of
percentage interval dummies indicating different fair
wage ratio levels. In Model 2, we test Hypothesis 3 by
replacing the interval dummies with a single dummy
variable (coded as ‘1’ if the responding employees
state that their income at their current job is not fair
and ‘0’ if the employees perceive their current income
as fair) and interacting this variable with the working
time preferences variable described above. Note, in
the cases where we illustrate our results (Figs. 4, 5),
we display the predictive probabilities and the 95 %-
confidence intervals of the likelihood of becoming an
entrepreneur at a minimum of 50 % compared to the
case where the employees do not consider becoming
self-employed at all.
In Models 3 and 4, we test for the robustness of our
results by checking what happens to the results if we
use the original 11-level ordinal variable as our
dependent variable in a Tobit model. Since our
dependent variable has an overload of employees
who have no entrepreneurial intentions at all, the
variable could be classified as left-censored at zero.
Overall, we find that the results of our central variables
remain robust and in line with our hypotheses. That is
all models show similar effects (same signs and the
statistical significance of the estimates is similar
compared to those in the ordered probit models) of
working time preferences and fair wage perceptions of
employees’ propensity to leave paid employment for
self-employment (e.g., Wooldridge 2003).
Finally, note that all the empirical models presented
here have robust standard errors with correction for
heteroskedasticity. We also computed for all the
models several regression diagnostics and checked
the variance inflation factors (VIF) to exclude multi-
collinearity. Table 3 in the appendix provides the pair-
wise correlations of key variables used in our empir-
ical analysis.
4 Results
Table 2 presents the regression results. As displayed
in Models 1 and 3, the effect of working time
preferences is statistically significantly different from
zero at any conventional level (Model 1: b = .006,
i \ .1; Model 3: b = .264, p \ .1). For example,
considering the effect of working time preferences
in Model 1, each hour increase or decrease in
working time preferences increases the propensity to
Table 1 continued
Description Mean SD Min Max
Working time preferences Generated variable: How many hours do your actual working-hours
consist of including possible over-time? If you could choose your
own number of working hours, taking into account that your
income would change according to the number of hours: How many
hours would you want to work? Difference in hours
5.91 6.26 0.00 39.90
Fair wage perceptions Generated variable: Is the income that you earn at your current job
fair, from your point of view? If no, how high would your net
income have to be in order to be fair? Fair wage ratio
0.17 0.44 0.00 15.48
Source SOEP 27 (2011)
Effect of working time preferences
123

entrepreneurship by .006 standard deviations, holding
all the other covariates fixed at their mean values.
Thus, Hypothesis 1 is supported by the data: employ-
ees who prefer to work other hours than they actually
do in paid employment also have a higher propensity
to become self-employed.
The predictive probabilities are displayed in the left
panel of Fig. 4 (based on Model 1). The results show
that for 5 h of increase or decrease, the probability of
becoming an entrepreneur at a minimum of 50 %
(which is true for 6.4 % of all employees in the data)
increases from by .35 % points on average compared
to those employees who actually work in their
preferred work schedule. Moreover, in Models 1 and
3, the negative and significant coefficient of the
variable Difference Fair Wage (up to 10 %) supports
Hypothesis 2a. As discussed above, this significant
influence suggests that employees who are close to
their target wage are likely to remain in their current
employment situation rather than switch to self-
employment (Model 1: b = -.381, p \ .1; Model 3:
b = -17.35, p \ .1). These employees are about to
earn their target wage, which they do not put at stake
by becoming self-employed. For Hypothesis 2b, we
also find supporting results. The coefficients of the two
categories Difference Fair Wage more than 40 and
.04
.06
.08
.1.1
2
Pr(
Nas
cent
Ent
repr
eneu
r)
0 5 10 15 20 25 30 35 40
Abs(Real Work Time - Preferred Work Time), in Hours per Week
(Predictive Margins)Work Time Preference
0.0
5.1
.15
Net = Fair Wage <10% [10; 20%[ [20; 30%[ [30; 40%[ [40; 50%[ >50%
Percentage Intervals
(Predictive Margins)Fair Wage Perceptions
Note: Confidence intervalls shown as shaded region
Fig. 4 Working time preferences, fair wage perceptions, and the probability to become a nascent entrepreneur. Source SOEP 27
(2011). All other covariates are fixed at their mean values
0.0
5.1
.15
.2.2
5
Pr(
Nas
cent
Ent
repr
eneu
r)
0 5 10 15 20 25 30 35 40
Abs(Real Work Time - Preferred Work Time), in Hours per Week
Income at Current Job is Fair Income at Current Job is not Fair
Note: Graphs include confidence intervals
(Predictive Margins)Interaction: Fair Wage Perceptions * Work Time PreferenceFig. 5 Working time
preferences, fair wage
perceptions, and the
probability to become self-
employed (moderated
effects). Source SOEP 27
(2011). All other covariates
are fixed at their mean
values
A. Werner et al.
123

Table 2 Ordered probit and tobit estimation results
DV Models 1 and 2: entrepreneurial intentions
(3-item-Likert scale)
DV Models 3 and 4: entrepreneurial intentions
(11-item-Likert scale)
Ordered probit Tobit
Model 1
Coeff.
Model 2
Coeff.
Model 3
Coeff.
Model 4
Coeff.
Controls
Tenure (in years) -0.013***
(0.003)
-0.012***
(0.003)
-0.614***
(0.126)
0.606***
(0.125)
Education (in years) 0.040***
(0.015)
0.040***
(0.015)
1.875***
(0.624)
1.895***
(0.628)
University degree (1 = yes) -0.005
(0.090)
-0.001
(0.091)
-0.928
(3.739)
-0.765
(3.753)
Professional education levels (1 = other
professional education)a0.067
(0.076)
0.066
(0.075)
3.820
(3.090)
3.757
(3.081)
Professional education levels
(1 = apprenticeship)a-0.093*
(0.059)
-0.092*
(0.059)
-3.908
(2.403)
-3.893
(2.402)
Professional education levels (1 = master
craftsman education)a0.077
(0.090)
0.076
(0.089)
4.676
(3.739)
4.647
(3.724)
Firm size (1 = \20 employees)b 0.191***
(0.068)
0.189***
(0.068)
8.785***
(2.843)
8.751***
(2.852)
Firm size (more than 20 and\200 employees)b 0.047
(0.061)
0.038
(0.061)
2.141
(2.589)
1.680
(2.586)
Firm size (more than 200 and \2,000
employees)b0.118**
(0.061)
0.115**
(0.061)
4.966*
(2.544)
4.845*
(2.546)
Log net monthly earnings (in Euros) 0.201***
(0.071)
0.172***
(0.070)
9.998***
(2.993)
8.563***
(2.929)
Gender (1 = Female) -0.224***
(0.055)
-0.230***
(0.055)
-10.23***
(2.263)
-10.53***
(2.263)
Age (in years) 0.029*
(0.017)
-0.028*
(0.017)
1.212*
(0.717)
1.166
(0.716)
Age squared (in years) -0.000***
(0.001)
-0.001***
(0.000)
-0.025***
(0.009)
-0.025***
(0.009)
Total early stage entrepreneurial activity
(1 = lower or equal to Germany)c-0.299
(0.214)
-0.297
(0.213)
-12.42
(9.522)
-12.29
(9.512)
Total early stage entrepreneurial activity
(1 = higher than Germany)c0.368***
(0.159)
0.377***
(0.156)
16.72**
(6.555)
17.09***
(6.428)
Type of economy (1 = innovation-based
economy)
0.556***
(0.198)
0.562***
(0.195)
24.39***
(8.342)
24.63***
(8.225)
Parent(s) self-employed (1 = yes) 0.149**
(0.066)
0.160***
(0.066)
6.837**
(2.703)
7.349***
(2.706)
East Germany (1 = yes) 0.088*
(0.052)
0.099**
(0.052)
4.028*
(2.163)
4.581***
(2.157)
Full-time employment (1 = yes) -0.185***
(0.075)
-0.177***
(0.075)
-9.260***
(3.143)
-8.899***
(3.155)
Second job (1 = yes) 0.374***
(0.077)
0.369***
(0.077)
18.74***
(3.192)
18.43***
(3.195)
Effect of working time preferences
123

\50 % (Model 1: b = .196, p \ .05; Model 3:
b = 9.249, p \ .05) and Difference Fair Wage more
than 50 % (Model 1: b = .130, p \ .05; Model 3:
b = 7.077, p \ .05) are significantly different from
zero at any conventional level and positive. Hence, the
intention of leaving paid employment for self-employ-
ment increases if the difference between the actual net
wage and the target wage (fair wage) increases. For
Table 2 continued
DV Models 1 and 2: entrepreneurial intentions
(3-item-Likert scale)DV Models 3 and 4:
entrepreneurial intentions (11-item-Likert scale)
Ordered probit Tobit
Model
1Coeff.
Model
2Coeff.
Model
3Coeff.
Model
4Coeff.
Flexible work time schedule (1 = yes) 0.085
(0.085)
0.091
(0.085)
4.922
(3.504)
5.205
(3.501)
Firm’s labour workforce (1 = downsize in next
12 month)
0.127***
(0.048)
0.127***
(0.048)
6.106***
(2.006)
6.114***
(2.004)
Job satisfaction (scale from 0 = ‘totally
unsatisfied’ to 10 = ‘totally satisfied’)
-0.077***
(0.011)
-0.077***
(0.011)
-3.689***
(0.458)
-3.713***
(0.455)
Central variables
Working time preferences (actual minus
desired working time, in hours)
0.006*
(0.003)
0.001
(0.005)
0.264*
(0.142)
-0.0237
(0.185)
Difference fair wage (up to 10 %)d -0.381*
(0.245)
-17.35*
(10.14)
Difference fair wage ([10 % B 20 %)d -0.048
(0.092)
-2.116
(3.855)
Difference fair wage ([20 % B 30 %)d 0.012
(0.078)
1.262
(3.287)
Difference fair wage ([30 % B 40 %)d -0.009
(0.089)
-0.261
(3.745)
Difference fair wage ([40 % B 50 %)d 0.196**
(0.092)
9.249**
(3.803)
Difference fair wage (more than 50 %)d 0.130**
(0.074)
7.077**
(3.109)
Difference fair wage (1 = yes) -0.049
(0.063)
-2.049
(2.602)
Difference fair wage (1 = yes)* working time
preferences
0.014**
(0.007)
0.713***
[0.272)
Log likelihood -2868.4 -2871.4 -7261.7 -7264.6
Observations 4,382 4,382 4,382 4,382
Source SOEP 27 (2011). Regressions in all columns include indicator variables for industrial sector (agriculture, energy, mining,
manufacturing, construction, trade, transport, banking and insurance), and occupational status in private employment. Models 1 and 2:
Y-standardized ordered probit regression coefficients displayed. Models 3 and 4: Tobit regression coefficients estimates displayed.
Robust standard errors in parenthesesa Reference: no professional educationb Reference: firm size with more than 2,000 employeesc Reference: country of origin is Germanyd Reference: net wage = fair wage
***, **, * indicate significance at 1, 5, and 10 % levels, respectively.
A. Werner et al.
123

these employees, reaching the target wage in the
current employment situation appears to be a distant
prospect, and the transition to entrepreneurship might
be an option to come closer to the target wage.
Moreover, note that, while the two coefficients
Difference Fair Wage more than 40 and \50 % and
Difference Fair Wage more than 50 % are statistically
different from zero compared to the reference category
Net wage = Fair Wage, they are not significantly
different from each other (p = .488). The right panel
of Fig. 4 displays the predictive probabilities.
We also predicted a positive interaction effect
between working time preferences and fair wages in
Models 2 and 4, meaning that, if the employees are
exposed to both working conditions simultaneously,
the entrepreneurial intentions are higher. Thus,
Hypothesis 3 is also born out of the data; the coefficient
of Difference Fair Wage (1 = yes) 9 Working Time
Preferences is significantly positive (Model 2:
b = .014, p \ .05; Model 4: b = .713, p \ .01). To
give a better impression of how differences in fair wage
perceptions and working time preferences impact
entrepreneurial intention, Fig. 5 also plots the predic-
tive probabilities of these variables (based on Model 2).
As the results reveal, employees have increasing
entrepreneurial intentions for every 1 h increase or
decrease in the working hours they would prefer, but
the effect is much stronger if they perceive their wage
as unfair.
With respect to the control variables, the results
show that tenure, gender, age, full-time employment,
and job satisfaction have a negative influence on the
probability of a switch to self-employment from paid
employment, whereas the estimated coefficients of
years of education, small firm size, net monthly wage,
parental self-employment, expected labor force down-
size, and having a second job next to the main or
regular position show significant positive effects. In
fact, age is nonlinear; i.e., both the very young and the
old are less likely enter self-employment compared to
those employees in middle ages.
Regarding the regional differences in Germany, we
find that the propensity to become self-employed is
significantly higher in East Germany than it is in West
Germany. We believe that this effect is due to different
labor market conditions—especially the fact that the
unemployment rate is about twice as high in the East
as it is in the West should ‘‘push’’ individuals into self-
employment (Dawson et al. 2009). Regarding
nationality differences, our findings show that
employees from countries with a higher TEA indeed
report a higher intention to quit wage-employment for
self-employment. Furthermore, under equal condi-
tions, employees who originally come from innova-
tion-driven economies are more eager to start-up their
own business than the ones coming from efficiency-
driven economies. This behavior might be traced back
to traditions which are inherent in the home countries
of the employees in our sample.
Note that we also tested for the robustness of our
results by checking what happens to the results if we
use the original 11-level ordinal variable as our
dependent variable in an ordered probit model. We
find that the results of our central variables remain
quite robust and in line with our hypotheses. More-
over, we also checked for nonlinearity graphically and
analytically (i.e. by using power terms) in the
relationship between our continuous predictors and
the outcome variable. With regard to our control
variables and working time preferences, we could not
find any statistically significant effects (besides age)
and therefore decided to not include these terms in the
regression models. With regard to our fair wage
perception variable, we found a cubic relationship.
However the predicted values were too high in the
region close to the target wage. Thus, we decided to
use the six-percentage dummy variables described
above which, in addition, also fit the model better than
when using power terms.
5 Discussion and conclusion
Our study sought to examine the environment in which
an employee decides on his/her career as a potential
nascent entrepreneur. Using data of the SOEP, we are
able to identify these potential nascent entrepreneurs
and to explore factors that affect the very early stages
of the firm creation process, the intention to switch to
entrepreneurship, and not the actual switch.
Prior research has shown that utility-maximizing
occupational choice decisions are not made randomly,
but depend on a variety of different factors and their
possible interplay with one another. To outline these
factors, we performed a systematic literature review
which revealed that, on the one hand, personal and
regional factors as well as perceptional variables,
macro-level influences, and institutional and cultural
Effect of working time preferences
123

factors matter for the occupational choice. On the
other hand, the pecuniary and non-pecuniary aspects
of the current employment situation are also impor-
tant, as they can influence an individual’s job
satisfaction and the propensity to switch to entrepre-
neurship. However, although the impact of these
factors is today generally accepted, there are still many
gaps in the research literature. Little research has been
done to date on, for example, the possible influence of
workplace and job characteristics on the entrepre-
neurial intention of employees, even though the
importance of these variables has in fact been stressed.
It is also one reason why this paper has looked at the
influence of working time preferences and fair wage
perceptions on employee entrepreneurship.
Grounded in the notion that, from the employees’
perspective, utility, and job satisfaction are derived
from income comparisons and flexible work sched-
ules, we developed hypotheses of why and how these
working conditions affect the likelihood of becoming
self-employed. In contrast to standard labor economic
models which assume that employees can freely
choose their amount of working hours, we suggest
that employees—although they do in fact want to
change their working hours—are unable to do so
because of organizational constraints in paid employ-
ment. Moreover, we argue that mismatches or tension
exist between actual and preferred working hours,
which can influence the employees’ occupational
choice due to their influence on utility and satisfaction
derived from a certain employment alternative. We
found that, compared to the situation in which
preferred hours match actual work hours, both positive
as well as negative deviations are positively related to
the probability of switching into self-employment.
This effect seems to be even stronger if the employees
want to reduce their working hours. Hence, we believe
that satisfaction with working time is one of the key
factors of overall utility that is derived by a certain
employment option. Becoming self-employed may
therefore help to reconcile work and private life while
increasing job satisfaction and individual utility.
Furthermore, we argued that an important pecuni-
ary factor which determines the occupational choice of
employees is the earned wage. Since income is part of
the utility an employee derives from a certain job,
wages can also influence an employee’s satisfaction
with the current (employment) situation. Nevertheless,
from the literature review, we infer that not many
studies have so far investigated the potential effect of
wage-related aspects on the propensity of becoming an
entrepreneur. The studies that have in fact done so
show that not only the difference between the expected
income of self-employment and wage-employment
must be considered as being relevant for the decision
to engage in entrepreneurship, as the level of co-
workers’ income in paid employment and the fairness
perception of these wage levels also seem to matter
when it comes to the decision to become an entrepre-
neur. However, the impact of relative wages in
entrepreneurship research has so far received little
attention, even though recent studies emphasize the
possible effect that reference points can have on an
individual’s evaluation of economic outcomes and the
effectiveness of incentives.
Since comparisons with co-workers seem to influ-
ence an employee’s fairness perception of their own
wages, and because the occupational choice is based
on the utility derived from a certain employment
situation, we argued that the difference between the
absolute and the target income can affect an individ-
ual’s choice for or against nascent entrepreneurship.
Moreover, in the case where the absolute wage is close
to the target wage, we argued that employees most
probably perceive the target income to be fair and
within reach because an employee will not risk lost
income by leaving his/her job to start their own
business. When the difference is larger, however, and
the target income is perceived to be unfair and out of
reach, we argue that an individual might consider self-
employment as a real alternative to wage employment.
We also argue, that, to earn a wage level which is
perceived as fair, employees can increase their work-
ing hours. However, if employees are unable to choose
the number of work hours they prefer (e.g., due to
organizational constraints), this will additionally
stimulate their entrepreneurial intentions. Put differ-
ently, individual dissatisfaction with the employment
situation will increase even more, and employees will
have an incentive to search for options outside the
company to get closer to the target wage. Our results
provide evidence that fair wage perceptions influence
the propensity to switch to self-employment. Those
employees who perceive their current wage level as
very unfair are more likely to have entrepreneurial
intentions. However, those whose wages are very
close to the wage level they perceive as fair are more
likely to remain in their current employment situation.
A. Werner et al.
123

Moreover, those employees who perceive their wages
as unfair, while simultaneously preferring more flex-
ible work hours, show especially high entrepreneurial
intentions.
Regarding our control variables, most of our results
are in line with the expectations based on previous
research. However, there are some interesting corre-
lations which deserve further mention, especially
control variables related to working conditions, such
as firm size, second jobs, and flexible work time
schedule. The results for the firm size measures
supports the notion that small firms are more likely
to produce more entrepreneurs than larger ones. This
might, at least partly, be explained by the fact that
employees in small firms are confronted with various
task packages which increase their learning and
experience on-the-job faster or because small firms
offer limited promotion possibilities due to their firm
size. Additionally, the fact that ‘‘having a second job
while entering nascent entrepreneurship’’ is, com-
pared to some other control variables, quite strong,
which implies that employees are likely to hold on to
their current job, at least for some time, while starting-
up their own venture. This might help the young
entrepreneur to acquire the necessary finances and
might represent a fallback option in case their own
start-up does not render the (financial) results
expected. Next, existing flexible work time schedules
were found to be insignificant in our model, although
we expected that existing organizational constraints
would enhance the individual’s likelihood of thinking
about job changes, either within or between employ-
ers, or by switching to self-employment.
In view of our results concerning not only our
independent variables working time preferences and
fair wage perceptions but also some workplace-related
control variables, we can conclude that it will be
scientifically fruitful to further address the question of
whether and to what extent direct exposure to specific
working conditions is beneficial for entrepreneurship.
Some limitations should be kept in mind when
considering our results. First, our data do not (yet)
offer any information regarding whether the respond-
ing employees did in fact start their own business.
Thus, we cannot directly test whether and how our
central variables impact the real occupational deci-
sion. We do acknowledge the limitation of using
entrepreneurial intentions as our dependent variable
instead of actual switches to entrepreneurship. How-
ever, the new SOEP data of 2010 and 2011 showed a
strong correlation between higher entrepreneurial
intentions in 2009 and entrepreneurial entry in 2010
and 2011. Nevertheless, employees with strong entre-
preneurial intentions in 2009 may plan to start a new
business in the next 3–5 years but not within the next
2 years, which limits the possibility to test the
influence of our variables on the real switch to
entrepreneurship. But as we aim to shed more light
on the relatively new research field of nascent
entrepreneurship, we have focused in this paper on
the factors that affect the very early staged of the firm
creation process, hence the intention to switch to
entrepreneurship and not the actual switch. It can also
be argued that employees who, for example, state that
the income they earn is not fair are the ones that have a
higher propensity to switch to new occupations
altogether. Again, we cannot rule out this explanation
because we do not currently have the data to observe
the real occupational choice of the respondents.
Moreover, one could reverse the interpretation of the
results and say that an increasing intention of switch-
ing from paid employment to entrepreneurship is not a
consequence of different working time preferences
and fair wage perceptions, but its cause. Thus, we note
that the reverse causality problem as an additional
limitation of our study. But even with these limitations
in mind, we are quite confident that our results
represent a contribution to entrepreneurship research.
For the entrepreneurship discussion, we deliver the
first insights into why specific working conditions—
i.e. fair wage perceptions and flexible work time
schedules—affect the propensity to become an entre-
preneur in the near future.
Appendix
See Table 3.
Effect of working time preferences
123

Ta
ble
3P
air-
wis
eco
rrel
atio
ns
amo
ng
key
var
iab
les
(1)
(2)
(3)
(4)
(5)
(6)
(7)
(8)
(9)
(10
)(1
1)
(12
)(1
3)
(1)
Sel
f-em
plo
ym
ent
[0;1
00
]
1
(2)
Ten
ure
(yea
rs)
-.1
31
(3)
Ed
uca
tio
n
(yea
rs)
.14
-.0
91
(4)
Un
iver
sity
Deg
ree
(1=
yes
)
.11
-.0
5.8
11
(5)
Pro
f.ed
uca
tio
n
(1=
no
)
.06
-.0
8.3
1.4
71
(6)
Pro
f.ed
uca
tio
n
(1=
oth
er)
.03
-.0
1.0
3-
.07
-.2
31
(7)
Pro
f.ed
uca
tio
n
(1=
app
ren
tice
ship
)
-.0
9.0
4-
.29
-.3
2-
.60
-.4
51
(8)
Pro
f.ed
uca
tio
n
(1=
mas
ter
craf
tsm
an)
.04
.05
.00
-.0
5-
.16
-.1
2-
.32
1
(9)
Fir
msi
ze
\2
0
.07
-.1
6-
.07
-.0
7-
.07
.06
.02
.00
1
(10
)F
irm
size
[20
;20
0]
-.0
4-
.07
-.0
5-
.04
-.0
2.0
2.0
2-
.02
-.3
81
(11
)F
irm
size
[20
0;2
,00
0]
-.0
2.0
9-
.00
.01
.04
-.0
1-
.02
-.0
1-
.30
-.3
41
(12
)F
irm
size
[2
,00
0
-.0
1.1
6.1
2.1
1.0
6-
.07
-.0
2.0
3-
.32
-.3
6-
.28
1
(13
)W
age
(lo
gn
etm
on
thly
wag
e)
.06
.27
.36
.35
.14
-.0
9-
.11
.09
-.2
9-
.08
.11
.29
1
(14
)G
end
er
(1=
fem
ale)
-.0
6-
.08
.02
-.0
2-
.02
.11
-.0
2-
.09
.10
-.0
1-
.02
-.0
7-
.47
(15
)A
ge
(yea
rs)
-.1
3.4
7-
.02
.06
-.0
3.0
1-
.02
.08
-.0
8.0
2.0
4.0
2.1
5
(16
)E
ntr
epre
neu
rial
acti
vit
y
(1=
Ger
man
)
.01
.02
.17
.06
-.1
4-
.01
.10
.06
.03
.00
-.0
7.0
4.0
6
A. Werner et al.
123

Ta
ble
3co
nti
nu
ed
(1)
(2)
(3)
(4)
(5)
(6)
(7)
(8)
(9)
(10
)(1
1)
(12
)(1
3)
(17
)E
ntr
epre
neu
rial
acti
vit
y
(1B
Ger
man
)
-.0
2-
.02
-.0
7-
.02
.04
.02
-.0
4-
.02
-.0
1.0
1.0
3-
.03
-.0
1
(18
)E
ntr
epre
neu
rial
acti
vit
y
(1=
Ger
man
)
.01
-.0
1-
.15
-.0
5.1
4.0
0-
.09
-.0
5-
.02
-.0
1.0
6-
.03
-.0
6
(19
)T
yp
eo
fec
on
om
y
(1=
Inn
ov
atio
n-b
ased
)
.02
.01
.14
.04
-.1
2.0
1.0
8.0
4.0
2-
.00
-.0
5.0
3.0
7
(20
)P
aren
t(s)
self
-em
pl.
(1=
yes
)
.06
.00
.07
.06
.01
-.0
1-
.01
.02
.05
-.0
4-
.03
.02
.04
(21
)E
ast
Ger
man
y
(1=
yes
)
.01
-.0
7.0
5.0
4-
.08
.10
-.0
1.0
1.0
4.0
8-
.03
-.1
1-
.18
(22
)F
ull
-tim
e
(1=
yes
)
.03
.06
.05
.07
.01
-.0
6.0
0.0
6-
.13
.02
.06
.05
.56
(23
)S
eco
nd
job
(1=
yes
)
.13
-.0
5.0
5.0
3.0
2-
.01
-.0
2.0
3.0
7.0
0-
.03
-.0
4-
.03
(24
)F
lex
.w
ork
tim
esc
hed
.
(1=
yes
)
.04
-.0
0.0
5.0
7.0
8-
.02
-.0
6.0
2.0
6-
.01
-.0
3-
.02
.08
(25
)L
abo
ur
forc
ed
ow
nsi
ze
(1=
yes
)
.03
.18
.03
.04
.02
-.0
8.0
2.0
4-
.22
-.0
9.0
9.2
3.2
2
(26
)Jo
bsa
tisf
acti
on
[0;1
0]
-.1
0-
.05
.07
.04
.03
-.0
1-
.02
-.0
0.0
2-
.03
.00
.00
.06
(27
)W
ork
ing
tim
ep
refe
ren
ces
(ho
urs
).0
9-
.03
.10
.10
.04
.00
-.0
5.0
2.0
2-
.01
-.0
4.0
3.1
3
(28
)F
air
wag
ep
erce
pti
on
s
(fai
rw
age
rati
o)
.05
-.0
8-
.03
-.0
0-
.03
.04
-.0
1-
.01
.07
.03
-.0
4-
.07
-.2
0
(14
)(1
5)
(16
)(1
7)
(18
)(1
9)
(20
)(2
1)
(22
)(2
3)
(24
)
(1)
Sel
f-em
plo
ym
ent
[0;1
00
]
(2)
Ten
ure
(yea
rs)
(3)
Ed
uca
tio
n
(yea
rs)
(4)
Un
iver
sity
Deg
ree
(1=
yes
)
Effect of working time preferences
123

Ta
ble
3co
nti
nu
ed
(14
)(1
5)
(16
)(1
7)
(18
)(1
9)
(20
)(2
1)
(22
)(2
3)
(24
)
(5)
Pro
f.ed
uca
tio
n
(1=
no
)
(6)
Pro
f.ed
uca
tio
n
(1=
oth
er)
(7)
Pro
f.ed
uca
tio
n
(1=
app
ren
tice
ship
)
(8)
Pro
f.ed
uca
tio
n
(1=
mas
ter
craf
tsm
an)
(9)
Fir
msi
ze
\2
0
(10
)F
irm
size
[20
;20
0]
(11
)F
irm
size
[20
0;2
,00
0]
(12
)F
irm
size
[2
,00
0
(13
)W
age
(lo
gn
etm
on
thly
wag
e)
(14
)G
end
er
(1=
fem
ale)
1
(15
)A
ge
(yea
rs)
-.0
41
(16
)E
ntr
epre
neu
rial
acti
vit
y
(1=
Ger
man
)
.02
.02
1
(17
)E
ntr
epre
neu
rial
acti
vit
y
(1B
Ger
man
)
-.0
1-
.00
-.4
71
(18
)E
ntr
epre
neu
rial
acti
vit
y
(1=
Ger
man
)
-.0
2-
.03
-.8
7-
.03
1
(19
)T
yp
eo
fec
on
om
y
(1=
Inn
ov
atio
n-b
ased
)
.02
.05
.71
-.0
1-
.80
1
(20
)P
aren
t(s)
self
-em
pl.
(1=
yes
)
.01
.00
.03
-.0
3-
.01
.02
1
A. Werner et al.
123

Ta
ble
3co
nti
nu
ed
(14
)(1
5)
(16
)(1
7)
(18
)(1
9)
(20
)(2
1)
(22
)(2
3)
(24
)
(21
)E
ast
Ger
man
y
(1=
yes
)
.04
.00
.14
-.0
7-
.12
.10
-.1
01
(22
)F
ull
-tim
e
(1=
yes
)
-.4
8-
.05
.01
.02
-.0
2.0
3-
.02
.03
1
(23
)S
eco
nd
job
(1=
yes
)
-.0
0-
.05
.00
.00
-.0
0.0
1.0
8-
.04
-.0
31
(24
)F
lex
.w
ork
tim
esc
hed
.
(1=
yes
)
-.0
6.0
6-
.02
.01
.02
-.0
3.0
2-
.04
.01
-.0
21
(25
)L
abo
ur
forc
ed
ow
nsi
ze
(1=
yes
)
-.1
0.0
7-
.01
-.0
0.0
1-
.02
.01
-.0
9.1
0-
.02
-.0
41
(26
)Jo
bsa
tisf
acti
on
[0;1
0]
.03
-.0
7.0
2.0
3-
.04
.04
.01
-.0
1-
.04
.01
.03
-.1
81
(27
)W
ork
ing
tim
ep
refe
ren
ces
(ho
urs
)-
.04
.03
.02
-.0
2-
.01
.00
.03
.04
.07
.02
.12
.01
-.1
41
(28
)F
air
wag
ep
erce
pti
on
s
(fai
rw
age
rati
o)
.03
-.0
2-
.05
.06
.02
-.0
3.0
4.1
3-
.01
.02
-.0
0-
.02
-.1
3.0
71
So
urc
eS
OE
P2
7(2
01
1)
Effect of working time preferences
123

References
Abeler, J., Falk, A., Gotte, L., & Huffman, D. (2011). Reference
points and effort provision. American Economic Review,
101(2), 470–492.
Andersson, P. (2008). Happiness and health: Well-being among
the self-employed. Journal of Socio-Economics, 37(1),
213–236.
Andersson, P., & Wadensjo, E. (2013). The best and the
brightest or the least successful? Self-employment entry
among male wage-earners in Sweden. Small Business
Economics, 40(1), 155–172.
Arenius, P., & Minniti, M. (2005). Perceptual variables and
nascent entrepreneurship. Small Business Economics,
24(3), 233–247.
Backes-Gellner, U., & Werner, A. (2007). Entrepreneurial sig-
naling via education: A success factor in innovative start-
ups. Small Business Economics, 29(1–2), 173–190.
Benz, M., & Frey, B. (2004). Being independent raises happiness
at work. Swedish Economic Policy Review, 11, 95–134.
Bergmann, H., & Sternberg, R. (2007). The changing face of
entrepreneurship in Germany. Small Business Economics,
28(2), 205–221.
Bewley, T. (1999). Why wages don’t fall during a recession?.
Cambridge, USA: Harvard University Press.
Blaikie, N. W. (1971). Towards a theoretical model for the study
of occupational choice. Sociology, 5(3), 313–333.
Blanchflower, D. (2000). Self-employment in OECD Countries.
Labour Economics, 7(5), 471–505.
Blanchflower, D., Oswald, A., & Stutzer, A. (2001). Latent
entrepreneurship across nations. European Economic
Review, 45(4), 680–691.
Boden, R. (1999). Flexible working hours, family responsibili-
ties and female self-employment: gender differences in
self-employment selection. American Journal of Eco-
nomics and Sociology, 58(1), 71–83.
Boheim, R., & Taylor, M. P. (2004). Actual and preferred
working hours. British Journal of Industrial Relations,
42(1), 149–166.
Bolton, G., & Ockenfels, A. (2000). ERC: A theory of equity,
reciprocity, and competition. American Economic Review,
90(1), 166–193.
Burton, M. D., Sørensen, J. B., & Beckman, C. (2002). Coming
from good stock: Career histories and new venture for-
mation. Research in the Sociology of Organizations, 19,
229–262.
Camerer, C., Babcock, L., Loewenstein, G., & Thaler, R. (1997).
Labor supply of New York City cabdrivers: One day at a
time. Quarterly Journal of Economics, 112(2), 407–441.
Campbell, B. A., Ganco, M., Franco, A. M., & Agarwal, R.
(2012). Who leaves, where to, an why worry? Employee
mobility, entrepreneurship and effects on source firm per-
formance. Strategic Management Journal, 33(1), 65–87.
Cesinger, B., Fink, M., Madsen, T. K., & Kraus, S. (2012).
Rapidly internationalizing ventures: How definitions can
bridge the gap across contexts. Management Decision,
50(10), 1816–1842.
Clark, A., & Senik, C. (2010). Who compares to whom? The
anatomy of income comparisons in Europe. Economic
Journal, 120(544), 573–594.
Cromie, S., & Hayes, J. (1991). Business ownership as a meansof overcoming job dissatisfaction. Personnel Review,
20(1), 19–24.
Davidsson, P. (2006). Nascent entrepreneurship: Empirical
studies and developments. Foundations and Trends in
Entrepreneurship Research, 2(1), 1–76.
Davidsson, P., & Gordon, S. (2012). Panel studies of new ven-
ture creation: A methods-focused review and suggestions
for future research. Small Business Economics, 39(4),
853–876.
Dawson, C., Henley, A., & Latreille, P. (2009). Why do indi-
viduals choose self-employment? Institute for the Study of
Labor (IZA), Discussion Paper No. 3974.
de Wit, G., & van Winden, F. (1989). An empirical analysis of
self-employment in the Netherlands. Small Business Eco-
nomics, 1(4), 367–397.
Delmar, F., & Davidsson, P. (2000). Where do they come from?
Prevalence and characteristics of nascent entrepreneurs.
Entrepreneurship and Regional Development, 12(1), 1–23.
Douglas, E., & Shepherd, D. (2000). Entrepreneurship as a
utility-maximizing response. Journal of Business Ventur-
ing, 15(3), 231–252.
Dunn, T., & Holtz-Eakin, D. (2000). Financial capital, human
capital and the transition to self-employment: Evidence
from intergenerational links. Journal of Labor Economics,
18(2), 282–305.
Evans, D. S., & Leighton, L. S. (1989). Some empirical aspects
of self-employment. American Economic Review, 79(3),
519–535.
Fagan, C., Anxo, D., & Boulin, J. (2006). Working time options
over the life course: New work patterns and company
strategies. Gothenburg, Sweden: Centre for European
Labor Market Studies HB (CELMS HB).
Fairlie, R., & Krashinsky, H. (2012). Liquidity constraints,
household wealth and entrepreneurship revisited. Review
of Income and Wealth, 58(2), 279–306.
Fairlie, R., & Robb, A. (2007). Families, human capital, and
small business: Evidence from the characteristics of busi-
ness owners survey. Industrial and Labor Relations
Review, 60(2), 225–245.
Fehr, E., & Gotte, L. (2007). Do workers work more when
wages are high? Evidence from a randomized field exper-
iment. American Economic Review, 97(1), 298–317.
Fladung, E., & Iseke, A. (2010). Satisfaction and discrepancies
between actual and desired job characteristics: A com-
parison between part-time and full-time employees based
on the German socio-economic panel. Working Paper.
Gachter, S., & Thoni, C. (2010). Social Comparison and Per-
formance: Experimental. Evidence on the Fair Wage-
Effort Hypothesis. Institute for the Study of Labor (IZA),
Discussion Paper No. 4687.
Golden, L. (2001). Flexible work schedules: What are we trading
off to get them? Monthly Labor Review, 124, 50–67.
Gompers, P., Lerner, J., & Scharfstein, D. (2005). Entrepre-
neurial spawning: Public cooperations and the genesis of
new ventures, 1986 to 1999. Journal of Finance, 60(2),
577–614.
Grilo, I., & Irigoyen, J. (2006). Entrepreneurship in the EU: To
wish and not to be. Small Business Economics, 26(4),
305–318.
A. Werner et al.
123

Grilo, I., & Thurik, A. (2005). Entrepreneurial engagement
levels in the European Union. International Journal of
Entrepreneurship Education, 3(2), 143–168.
Hamilton, B. (2000). Does entrepreneurship Pay? An empirical
analysis of returns to self-employement. Journal of Polit-
ical Economy, 108(3), 605–631.
Heineck, G., & Moller, J. (2012). Geschlechtsspezifisches
Arbeitsmarktverhalten, Verdienste und Wohlbefinden im
Familienkontext. In H. Bertram and M. Bujard (Eds). Zeit,
Geld, Infrastruktur—Zur Zukunft der Familienpolitik, So-
ziale Welt. Sonderband 19, Nomos, Baden–Baden.
Hellmann, T. (2007). When do employees become entrepre-
neurs? Management Science, 53(6), 919–933.
Hundley, G. (2001). Why and when are the self-employed more
satisfied with their work? Industrial Relations, 40(2),
293–316.
Hutchens, R. (1989). Seniority, wages and produtivity: A tur-
bulent decade. Journal of Economic Perspectives, 3(4),
49–64.
Hyytinen, A., & Maliranta, M. (2006). When do employees
leave their job for entrepreneurship: Evidence from linked
employer-employee data. Research Institute of the Finnish
Economy Discussion Paper No.1023.
Jacobs, G. (2008). An occupational choice model for developing
countries. Journal of Economic Development, 33(2),
125–153.
Jaeger, D., & Page, M. E. (1996). Degrees matter: New evidence
on sheepskin effects in the returns to education. Review of
Economics and Statistics, 78(4), 733–739.
Johansson, E. (2000). Self-employment and the predicted
earnings differential—Evidence from Finland. Finnish
Economic Review, 13(1), 45–55.
Kahneman, D., & Tversky, A. (1979). Prospect theory: An
analysis of decision under risk. Econometrica Journal of
the Econometric Society, 47(2), 263–291.
Kanbur, S. M. (1979). Impatience, information and risk taking in
a general equilibrium Model of occupational choice.
Review of Economic Studies, 46(145), 707–719.
Kawaguchi, D. (2002). Compensating Wage Differentials
among Self-employed Workers: Evidence from Job Satis-
faction Scores. Institute of Social and Economic Research,
Osaka University Discussion Paper No. 568.
Mayraz, G., Wagner, G., & Schupp, J. (2009). Life satisfaction
and relative income-perceptions and evidence. SOEP
Papers on Multidisciplinary Panel Data Research at DIW
Berlin No. 214.
Merz, J. (2002). Time and economic well-being: A panel ana-
lysis of desired versus actual working hours. Review of
Income and Wealth, 48(3), 317–346.
Mohnen, A., & Pokorny, K. (2005). Reference dependent
preferences in employer-employee-relationships: a real
effort experiment on the incentive impact of the fixed wage.
Working Paper.
Mueller, P. (2006). Entrepreneurship in the region: Breeding
ground for nascent entrepreneurs? Small Business Eco-
nomics, 27(1), 41–58.
Ockenfels, A., Sliwka, D., & Werner, P. (2010). Bonus Pay-
ments and Reference Point Violations. The Institute for the
Study of Labor (IZA), Discussion Paper 4795.
Parker, S. (2004). The economics of self-employment and
entrepreneurship. Cambridge, UK: Cambridge University
Press.
Parker, S. (2007). Which firms do the entrepreneurs come from?
Economics Bulletin, 10(10), 1–9.
Parker, S. (2009). Why do small firms produce the entrepre-
neurs? Journal of Socio-Economics, 38(3), 484–494.
Parker, S., & van Praag, C. M. (2006). Schooling, capital con-
straints, and entrepreneurial performance. Journal of
Business and Economic Statistics, 24(4), 416–431.
Pfeiffer, C., & Schneck, S. (2012). Relative wage positions and quit
behavior: Evidence from linked employer-employee data.
Industrial and Labor Relations Review, 65(1), 126–147.
Prendergast, C. (1999). The provision of incentives in firms.
Journal of Economic Literature, 37(1), 7–63.
Rees, H., & Shah, A. (1986). An empirical analysis of self-
employed in the UK. Journal of Applied Econometrics,
1(1), 95–108.
Reynolds, J. (2003). You can’t always get the hours you want:
Mismatches between actual and preferred work hours in
the US. Social Forces, 81(4), 1171–1199.
Schneck, S. (2011). The effect of relative standing on consid-
erations about self-employment. SOEP Papers on Multi-
disciplinary Panel Data Research at DIW Berlin No. 426.
Sternberg, R., Vonderwuelbecke, A., & Brixy, U. (2013). Glo-
bal entrepreneurship monitor—Landerbericht Deutsch-
land 2012. Hannover/Nurnberg: Global Entrepreneurship
Research Association (GERA).
Stier, H., & Lewin-Epstein, N. (2003). Time to work: A com-
parative analysis of preferences for working hours. Work
and Occupations, 30(3), 302–326.
Sullivan, P. (2009). Estimation of an occupational choice model
when occupations are misclassified. Journal of Human
Resources, 44(2), 495–535.
Tam, H. (2010). Characteristics of the underemployed and the
overemployed in the UK. Economics and Labour Market
Review, 4(7), 8–20.
Taylor, M. (1996). Earnings, independence or unemployment:
Why become self-employed? Oxford Bulletin of Econom-
ics and Statistics, 58(2), 253–266.
Townsend, D., Busenitz, L., & Arthurs, J. (2010). To start or not
to start: Outcome and ability expectations in the decision to
start a new venture. Journal of Business Venturing, 25(2),
192–202.
Tranfield, D., Denyer, D., & Smart, P. (2003). Towards a
methodology for developing evidence-informed manage-
ment knowledge by means of systematic review. British
Journal of Management, 14(3), 207–222.
Uusitalo, R. (2001). Homo entreprenaurus? Applied Economics,
33(13), 1631–1638.
Verheul, I., Wennekers, S., Audretsch, D., & Thurik, R. (2002).
An eclectic theory of entrepreneurship: Policies, institu-
tions and culture. In D. B. Audretsch, A. R. Thurik, I.
Verheul, & A. R. M. Wennekers (Eds.), Entrepreneurship:
Determinants and policy in a European-US comparison
(pp. 11–81). Boston/Dordrecht: Kluwer.
Wagner, J. (2004). Are young and small firms hothouses for
nascent entrepreneurs? Applied Economics Quarterly,
50(4), 379–391.
Effect of working time preferences
123

Wagner, J., & Sternberg, R. (2005). Personal and regional
determinants of entrepreneurial activities: Empirical evi-
dence from the Regional Entrepreneurship Monitor (REM).
Jahrbuch fur Regionalwissenschaft, 25(1), 91–105.
Wagner, G., Frick, J., & Schupp, J. (2007). The German Socio-
Economic Panel Study (SOEP)—Evolution, scope and
enhancements. SOEP paper No.1.
Waldman, M. (1984). Job assignments, signaling and efficiency.
RAND Journal of Economics, 15(2), 431–460.
Werner, A., & Moog, P. (2007). Arbeitsbedingungen in KMU
und ihr Einfluss auf die Neigung zur Selbstandigkeit: Eine
empirische und theoretische Untersuchung auf Basis des
Humankapitalansatzes. Zeitschrift fur Betriebswirtschaft,
Special Issue, 6, 75–97.
Wooden, M., Warren, D., & Drago, R. (2009). Working time
mismatch and subjective well-being. British Journal of
Industrial Relations, 47(1), 147–179.
Wooldridge, J. M. (2003). Introductory econometrics: A modern
approach. Mason: Thomson.
A. Werner et al.
123