the effect of using virtual manipulatives on students
TRANSCRIPT

University of Missouri, St. Louis University of Missouri, St. Louis
IRL @ UMSL IRL @ UMSL
Dissertations UMSL Graduate Works
5-8-2020
The Effect of Using Virtual Manipulatives on Students’ Ability to The Effect of Using Virtual Manipulatives on Students’ Ability to
Mentally Compare Proper Fractions Mentally Compare Proper Fractions
William Wilson McNeary III University of Missouri-St. Louis, [email protected]
Follow this and additional works at: https://irl.umsl.edu/dissertation
Part of the Science and Mathematics Education Commons
Recommended Citation Recommended Citation McNeary, William Wilson III, "The Effect of Using Virtual Manipulatives on Students’ Ability to Mentally Compare Proper Fractions" (2020). Dissertations. 962. https://irl.umsl.edu/dissertation/962
This Dissertation is brought to you for free and open access by the UMSL Graduate Works at IRL @ UMSL. It has been accepted for inclusion in Dissertations by an authorized administrator of IRL @ UMSL. For more information, please contact [email protected].

Effect of Manipulatives on Fraction Comparison 1
The Effect of Using Virtual Manipulatives on Students’ Ability to Mentally Compare
Proper Fractions
William McNeary
M.N.S. Mathematics, Southeast Missouri State University, 2012
Masters Business Administration, University of Texas at Dallas, 1993 B.E. Electrical Engineering/Computer Science, Vanderbilt University, 1985
A Dissertation Submitted to The Graduate School at the University of Missouri-St. Louis in partial fulfillment of the requirements for the degree of Doctor of Philosophy in Education with
an emphasis in Teaching and Learning Processes
August 2020
Advisory Committee
Dr. Keith Miller, Ph.D. Chairperson
Dr. Natalie Bolton, Ph.D.
Dr. Amber Candela, Ph.D.
Dr. Helene Sherman, Ed.D.
Copyright, William W. McNeary, III, 2020
Effect of Manipulatives on Fraction Comparison 2
Abstract
This study proposes a method to analyze the effects of the use of virtual fraction
models (circle/bar/number line) on students’ ability to mentally compare proper fractions.
Since developing a sense of magnitude with both whole numbers and rational numbers is
highly correlated with improved performance on standardized assessments and improved
performance in later algebra classes, special attention is directed to the bar and number
line as they are linear representations.
The study used an experimental pretest/posttest group design by randomly assigning
subjects within class sections to a control group (physical fraction circles) and treatment
groups with seven different methods of comparing fractions (virtual fraction circle,
virtual bar model, virtual number line, and all combinations). The pretest and posttest
instruments identifying student reasoning in fraction comparison used in the study were
developed by the Education Development Center’s Eliciting Mathematics
Misconceptions Project. The instruments were designed to gauge students’ dependence
on whole number reasoning, the unit fraction, and gap reasoning (the difference between
the numerator and denominator)
The use of the virtual fraction circle should determine whether a technology bias is
inherent in the study, while the bar model and the number line model show a more linear
view of the fractions. A t-test showed significant improvement in the overall sample, but
analysis of variance by manipulative on the differences between pretest and posttest
scores and the differences between a pre/post classification on a scale of student
comparison method showed no significant differences between the manipulatives.

Effect of Manipulatives on Fraction Comparison 3
Dedication
I would like to dedicate this to my family. My parents, Bill and Peggy McNeary,
have supported me in so many ways throughout my life and educational career. Thank
you for your enduring love and affection. Likewise, my wife, Charlotte, has been my rock
throughout our marriage. She complains that I have been in school the whole time we
have been married, but she has been there every step of the way. To my three children,
Wilson, Mari and Maggie, each of you serves as an inspiration to me every day of my
life. Your spirit, work, dedication, and expectations challenge me to be better.
Effect of Manipulatives on Fraction Comparison 4
Acknowledgements
A great many people have supported me in this endeavor. I would like to
recognize those who were the most instrumental. To Dr. Tamela Randolph, my mentor
and my friend, this would never have happened without you. Dr. Keith Miller has been
there literally from day one of this doctoral journey. He was part of my interview
committee for the program, taught my first class, and served as my advisor. I took a class
from Dr. Natalie Bolton in my second semester and her encouragement, support and
friendship have been vital to getting me through this journey. She sponsored all of my
internships and allowed me to participate in her joint projects with Maryville University
and the elementary mathematics teachers in the St. Louis school district. While I never
took a class from Dr. Amber Candela, she offered me a unique opportunity to observe her
class on a regular basis during the semester when she was recognized as an outstanding
faculty member as UMSL. Finally, Dr. Helene Sherman was the last to join my
committee, but her experience, encouragement and thoroughness helped make me better
and helped make this thesis a much better document. Thank you all from the bottom of
my heart.

Effect of Manipulatives on Fraction Comparison 5
Contents Definition of Terms……………………………………………………………………10
Chapter 1……………………………………………………………………………….12
Introduction…………………………………………………………………………….12
Math Education Since 1950……………………………………………………13
A Theoretical Model of Fractions……………………………………………...16
Fractional Scheme Theory……………………………………………………..20
Curricular Issues……………………………………………………………….22
Integrated Theory of Number Development…………………………………..24
Test Scores in the State of Missouri…………………………………………...28
Purpose of the Study…………………………………………………………………...29
Research Questions, Hypotheses, and Objectives……………………………………..30
Delimitations…………………………………………………………………………..31
Significance…………………………………………………………………………...32
Organization of the Study……………………………………….…………………….32
Chapter 2……………………………………………………………………………...33
Literature Review…………………………………………………………………......33
Misconceptions and Constructivism………………………………………….33
Theories of Number Development……………………………………………35
Rational Number Learning……………………………………………………39
Technology and Rational Number Learning………………………………….41
Identification of Understanding………………………………………………44
Remediation of Understanding……………………………………………….47
Fraction Comparison…………………………………………………………48

Effect of Manipulatives on Fraction Comparison 6
Summary…………………………………………………………………………..…52
Chapter 3……………………………………………………………………………..54
Methodology………………………………………………………………..………..54
Research Design……………………………………………………………..………54
Scale of Fraction Understanding…………………………………………….55
Threats to Internal Validity…………………………………………..……...57
Threats to External Validity…………………………………………..……..58
Research Questions……………………………………………………..…...58
Hypotheses………………………………………………………….…….....58
Population and Sample………………………………………………..……..58
Instrumentation…………………………………………………….…..……59
Treatment………………………………………………….……..….59
Test Instrument…………………………………………….……..…62
Generalizability…………………………………………………….…..…...66
Data Collection…………………………………………………………….……......66
Data Analysis…………………………………………….………………...………..67
Variables…………………………………………………..………….……..67
Ethics and Human Relations………………………………………………..………68
Chapter 4……………………………………………………………………..……..70
Results………………………………………………………………………..……..70
Pilot Study………………………………………………………..…………70
Sample Distributions..……………………………………..………..70
Descriptive Statistics………………………………………..………71

Effect of Manipulatives on Fraction Comparison 7
Paired Sample t-tests on Pretest/Posttest and Preclassification/Post
classification………………………………………………..………71
ANOVA on Test Score Differences…………………………..……72
ANOVA on Pre/Post classification differences………………..…..72
The Study………………………………………………………………..…73
Sample Distributions..…………………………………………..….73
Descriptive Statistics…………………………………………….....74
t-test for Equality of Means on Pretest scores and classifications....74
Paired Sample t-tests on Pretest/Posttest and Preclassification/Post
classification………………………………………………………..76
ANOVA on Test Score Differences………………………..………76
ANOVA on Pre/Post classification differences……………..……..77
Chapter 5……………………………………………………………………..…….80
Conclusion……………………………………………………………………..…..80
Discussion………………………………………………………..………...80
Significance of the Study…………………………………………..………83
Future Research…………………………………………………………….83
References………………………………………………………………..………...85
Appendix A…………………………………………………………..…………….96
Appendix B……………………………………………………………..………....102
Appendix C………………………………………………………………..………103
Appendix D………………………………………………………………..………107
Appendix E…………………………………………………………………..…….111

Effect of Manipulatives on Fraction Comparison 8
List of Tables
Table 1. Manipulative assignment…………………..…………………………..………59
Table 2. Models for the research questions.………………………………………….…67
Table 3. Mean and Standard deviation for Pre/Post Test Scores, Pre/Post Classifications
and Test/Classification Differences.………………………………………….…71
Table 4. t-test Results: Comparison of Pretest and Posttest Mean Scores of Test and
Classification Differences for sample.…………………………………………...72
Table 5. Mean and Standard deviation for Pre/Post Test Scores, Pre/Post Classifications
and Test/Classification Differences……………………………………………...74
Table 6. Independent sample t-test: pretest comparison for each group to the control. .75
Table 7. Independent sample t-test: PreClassification comparisons for each group to the
control. …………………………………………………………………….……75
Table 8. t-test Results: Comparison of Pretest and Posttest Mean Scores of Test
Differences and Classification Differences for sample. …………..……………….…...76
Table 9. ANOVA results for test score gains. ………………………………….………77
Table 10. ANOVA results for classification gains. …………………..………….……..77
Table 11. Scratch Tool Accesses by Manipulative. ……………………………………80

Effect of Manipulatives on Fraction Comparison 9
List of Figures
Figure 1. The theoretical model linking the five subconstructs of fractions to the different
operations of fractions and to problem solving. ……….……....……..…………17
Figure 2. Partitioning in fraction models. ……………………………………………...17
Figure 3. Linear, Area, and Discrete Models. ………………………………………….24
Figure 4. Missouri NAEP Scores, 2011/2013/2015. ……………………………………28
Figure 5. Missouri MAP Scores, 2015-2016. …………………………………………..28
Figure 6. Steffe’s Schemes. ……………………………………………………………..39
Figure 7. A sample correct trial (top) and a sample incorrect trial (bottom) from Catch
the Monster. ………………………………………………………..……………43
Figure 8. Randomized Pretest-Posttest Control/Comparison Group Design (per class
section). …………………………………………………………………………54
Figure 9. Initial screen for fraction manipulative tool. …………………..……………60
Figure 10. Creation of circle models in virtual manipulative. ………………….……..60
Figure 11. Creation of bar models in virtual manipulative. ……………….…………..61
Figure 12. Creation of a number line representation in virtual manipulative. ………..61
Figure 13. Commercial circle model tool. ……………………………………………..62
Figure A1. EDC Pretest. ……………………………………………………………….95
Figure A2. EDC Posttest. ………………………..…………………………………….97
Figure A3. Test Scoring Guide. ………………..……………………………..….…….99
Figure A4. Sample Daily Problem sheet. ……………………………………..………100

Effect of Manipulatives on Fraction Comparison 10
Definition of Terms
Area Model – A fraction model that uses the two dimensional area of a geometric shape
to designate the unit which is then subdivided to indicate fractional parts
Benchmarking – A method of fraction comparison where the two fractions of interest are
compared to a third fraction of known size such as ½ . In attempting to compare
2/5 and ¾, understanding that 2/5 is less than ½ and ¾ is greater than ½ allows
you to state that ¾ must be greater than 2/5.
Biologically primary/secondary – In the Privileged Domain Theory of numbers, the
central principles that serve as the basis for understanding numbers are counting
and one to one correspondence. The fact that infants recognize the relative size of
sets of objects makes the counting numbers primary and relegates other numbers
that are derived operationally from counting numbers such as integers and
rationals to secondary status.
Discrete Model – A model that uses a quantity of separate items such as counters to
define the unit. If four counters make up the unit, then two counters would
represent ½.
Gap Reasoning – The idea that the difference between the numerators and denominators
of two fractions defines their relative size. When using gap reasoning, ¾ and 2/3
would be equivalent since the difference between each numerator and
denominator is 1.
Linear Model – A category of models that uses the length of a segment to define the unit.
This is generally different from a number line in that the linear model has a finite
length associated with the unit and is not mapped to the set of real numbers.

Effect of Manipulatives on Fraction Comparison 11
Part/Whole Model – A model that represents a unit divided into equal parts.
Partitioning – The act of dividing a whole into parts; equi-partitioning would result in
equal parts.
Residual thinking – A method of fraction comparison that involves understanding the
relative distance from one. This is more complete than gap reasoning because it
involves understanding that the gap represents a fractional piece. In comparing
2/3 and ¾, residual thinking deduces that they are both one “away” from the unit,
but the 2/3 is 1/3 of a unit away while the ¾ is ¼ of a unit away. Since ¼ is
smaller than 1/3 then ¾ must be closer to one so it is the larger fraction.

Effect of Manipulatives on Fraction Comparison 12
The Effect of Using Virtual Manipulatives on Students’ Ability to Mentally
Compare Proper Fractions
Chapter 1
Introduction
“Why should we pay the same amount for a third of a pound of meat as we do for
a quarter pound of meat at McDonald’s? You’re overcharging us.” (Taubman, 2009, p.
62) So said the focus groups organized by A&W after their campaign to sell a larger,
better-tasting burger at the same price as McDonald’s quarter-pounder failed to gain
traction during the early 1980s. The potential customers assumed that the fraction of meat
with the larger denominator was the larger portion demonstrating one of the more
significant misconceptions regarding the comparison of fractions.
“The teaching and learning of fractions is not only very hard, it is, in the broader
scheme of things, a dismal failure” (Davis et al., 1993, p. 1) Fractions are often
introduced using an area model (Simon et al., 2018) with a pizza or pie or cookie for
context. This can limit students to always seeing fractions as less than one, and the lack
of a connection between the model and the number line deemphasizes the fact that the
fraction represents a real number with a location (and magnitude). For students trained to
operate with numerals, the numerator and the denominator appear to be separate numbers
which must be analyzed accordingly. This separation of the numbers in a fraction is
further accentuated by a focus on parts and wholes when constructing fractions. This
leads students to add and subtract numerators and denominators rather than finding
common denominators when performing fraction arithmetic. (Siegler, et al., 2010)

Effect of Manipulatives on Fraction Comparison 13
While ancient Egyptians and Babylonians left evidence of the use of fractions,
Flemish mathematician Simon Stevin was among the first to propose the existence of a
continuous magnitude of number in his work, Arithme’tique, in 1585 (Malet, 2006). This
means that the conception of rational numbers as “numbers” is only a little older than
Calculus, developed in the mid-1600s by Liebnitz and Newton.
Using a measurement model in mathematics also dates back to the ancient
Egyptians, but “the earliest recorded instance in a US textbook of the words ‘number
line’ paired with an infinite line marked with both integers and rational number
representations occurs in Merrill’ Modern Algebra” (McNeary, 2012, p. 4) published in
1962. Standards documents such as the Common Core State Standards now include a
standard for locating a fraction on a number line at around the fifth-grade level, but most
schools still introduce fractions at earlier grade levels fairly exclusively using part/whole
fraction models (circles and bars).
The sequence of the introduction of number systems in school mathematics has
followed the historical “discoveries” of these systems. Counting numbers (1,2,3,…) come
first, followed by whole numbers (0 and the counting numbers). Next are the positive
rationals (fractions) followed by integers (whole numbers and their opposites). Negative
rationals and irrationals (numbers that cannot be represented as fractions) complete the
real number system. When analyzing number systems based on the concept of closure
(arithmetic operations in a set result in a number in the set), integers result from the lack
of closure in the whole numbers on the operation of subtraction while rationals arise due
to the lack of closure on the operation of division.
Math Education Since 1950

Effect of Manipulatives on Fraction Comparison 14
According to Woodward (2004), mathematics education in the US over the last half
of the twentieth century was divided into three time periods that all carried implications
specifically for the teaching of rational numbers.
1) The 1950s and 1960s – The New Math
2) The 1970s and 1980s – Back to Basics
3) The 1990s – Excellence in Education
The New Math phase resulted from developments in the Cold War and is often
tied directly to the launch of Sputnik and the Space Race of the 1960s. The federal
government diverted extensive funding for research and training in mathematics and the
development of new curricula. This resulted in more focus on discovery and
understanding and a move away from the three decades of focus on connectionist theory
advocated by Thorndike (Woodward, 2004) and the more recent advent of Skinner’s
operant conditioning (Woodward, 2004). “Behaviorism placed a premium on the efficient
development of bonds through rote practice and memorization” (Woodward, 2004, p. 6).
The material stressed topics “such as set theory, operations, and place value through
different base systems … and alternative algorithms for division and operations on
fractions” (Woodward, 2004, p. 5). This period also saw a rise in the influence of Piaget’s
theories of child development and Bruner’s work in educational psychology (Woodward,
2004).
The New Math era failed to deliver on expectations and the resulting backlash led to
the Back to Basics movement of the 1970s (Woodward, 2004). Part of the problem with
New Math was that some teachers were not prepared for discovery learning or higher
order mathematical concepts traditionally taught in secondary curriculum or higher

Effect of Manipulatives on Fraction Comparison 15
education and had a tendency to guide students through the learning process in a very
structured way. (Woodward, 2004). As well, scores on national standardized tests geared
to more procedural types of questions rather than developmental, did not improve. (Kena,
2016) The Back to Basics movement returned to an emphasis on rote memorization of
math facts and procedural competence as opposed to understanding.
When a researcher in the 1970s advocating the removal of fractions from the
curriculum, “[s]ince both the metric system and the hand-held calculator use decimals, in
twenty-five years common fractions will be as obsolete as Roman numerals are today”
(Usiskin, 1979, p. 1), Usiskin (1979) argued strenuously against this idea by pointing out
that every use of division results in the use of a fraction, and the use of fractions is
pervasive in algebraic expressions and equations where the calculator has no particular
advantage. He categorized the uses of fractions beyond measurement as Splitting up
(dividing a portion equally), Rate (any comparison of units begins as a fraction),
Proportion (an equality of two fractions), Formulas (many important formulas
incorporate fractions, such as the area of a triangle, A=1/2 base*height), and Sentence-
solving (use of division to solve equations such as 7x=1).
According to Woodward (2004), Project Follow Through, one of the largest federally
funded quantitative studies of early education conducted between 1967 and 1977, was
used as justification for the efficacy of the formulaic direct/active instruction model
which breaks curricular units into lessons that start with a brief review followed by the
“development portion of the lesson (20 minutes), independent seatwork (15 minutes), and
a homework assignment.” (Woodward, 2004) The tide began to turn again in the late
1970’s and early 1980’s as cognitive science gained influence as a new framework for

Effect of Manipulatives on Fraction Comparison 16
educational research. “By the 1980’s, problem solving had become a central theme in
mathematics education, … and [b]y the mid-1980’s, cognitive research was the dominant
framework in mathematics education. Cognitive scientists attempted to articulate the
fundamental role of visual imagery as a representational form of memory.” (Woodward,
2004) By the end of the decade, cognitive researchers, influenced by information
processing theory, were including constructivist theory in their work. Broader educational
policy initiatives from the 1980’s reignited many of the reform ideas of the “New Math”
era as part of the Excellence in Education movement of the 1990’s. According to
Woodward (2004), one of the primary drawbacks in this era was that researchers focused
on basic skills continued to hold sway in the areas of special education and LD (learning
disabilities).
A Theoretical Model of Fractions
Throughout the various periods of education, the primary methods for introducing
fractions have not changed significantly. (Simon et al., 2018) They include the use of set
(discrete) models, area models, linear models, and number line models and the teaching
of procedural competence. (Kieren, 1976) Circle models and part/whole modeling have
long dominated rational number instruction even after Kieren (1976) introduced the idea
of interrelated subconstructs for rational numbers beyond the idea of part/whole - ratio,
operator, quotient and measure. In his conceptualization, the subconstructs worked
together to demonstrate the part/whole construct which he expressly avoided identifying
as a fifth subconstruct. Later work by Behr et al. (1983) extended the subconstructs to
include part/whole as one of the five areas of fraction conceptualization- part/whole,
ratio, operator, quotient and measure. Behr et al. (1983) developed a theoretical model

Effect of Manipulatives on Fraction Comparison 17
tying the five constructs to the basic operations of fractions, fraction equivalence and
problem-solving (see Figure 1). Fundamental to the idea was that “[e]quivalence and
partitioning are constructive mechanisms operating across the … subconstructs to extend
images and build mathematical ideas.” (Behr M. et al., 1983, p. 3) Later research by
Hannula (2003) added decimal as a possible sixth construct.
Figure 1
The theoretical model linking the five subconstructs of fractions to the different
operations of fractions and to problem solving (Behr M. et al., 1983)
Charalambus & Pitta-Pantazi (2007) describe the five subconstructs in detail. In the
part/whole subconstruct, the fraction represents a comparison between the number of
parts selected and the whole unit where the unit is partitioned into equal parts (Figure 2).
Figure 2
Partitioning in fraction models

Effect of Manipulatives on Fraction Comparison 18
To master the part/whole subconstruct, students must grasp the partitioning of the whole
into equal parts. This can be demonstrated through the partitioning of a discrete set into
equal size groups or partitioning a continuous length or area into equal parts. Several
ancillary ideas contribute to complete understanding such as- all of the parts taken
together exhaust the whole; the more parts, the smaller the part; the relationship between
the parts and the whole is conserved over size, shape, and arrangement of equivalent
parts. A full understanding of the part/whole subconstruct depends on the student’s
ability to unitize and reunitize. Charalambos (2007) describes this as a reconstruction of
the whole based on its parts and repartitioning already equipartitioned wholes (construct
3/8 from a whole partitioned into fourths). Area models are the most commonly used
methods for teaching about part/whole relationships. (Tunc-Pekkan, 2015)
The ratio subconstruct relates the notion of a comparison of two numbers by the
operation of division, but this relationship extends beyond just part/whole. In that regard,
it is considered a “comparative index rather than a number” (Carraher, 1996, p. 245).
Ratios can compare separate quantities or measures of different units (which are more
specifically identified as rates). Students demonstrate a full understanding of ratios when
they construct the idea of relative amounts and grasp the notion of the covariance
between the quantities as well as the invariance of the relationship (multiplication of the
ratio by a whole number retains the value of the ratio). Since covariance/invariance is a
property of ratios, it becomes a distinguishing factor between the understanding of ratio
and part/whole interpretations.
The operator subconstruct regards rational numbers as a scale factor or as pair of
functions to be applied to some other number, object, or set. Mastering the operator

Effect of Manipulatives on Fraction Comparison 19
subconstruct requires students to interpret the fractional multiplier in several ways. Three
fourths can be seen either 3 x [one fourth of a unit] (dubbed stretcher/shrinker context by
Behr et al. (1993)) or one fourth x [3 units] (duplicator/partition-reducer). Charalambos
(2007) also describes how students should be able to name a single fraction to perform a
composite operation and relate outputs to inputs. This subconstruct requires students to
move beyond understanding multiplication as repeated addition and see it as a scaling
operation. Multiplication can result in larger products when the factors are whole
numbers OR smaller products when one of the factors is a proper fraction.
The quotient subconstruct requires students to see the fraction as the result of a
division. The fraction represents the numerical value that is obtained by the division. The
quotient subconstruct (and division in general) is often introduced under the idea of “fair
share”- I have three pizzas to share among four friends, how much pizza does each friend
get? Like the ratio subconstruct, the quotient subconstruct potentially deals with different
units within the subconstruct (pizzas vs friends) as opposed to equal parts of a whole. In
mastering the concept, students need to understand the two types of division- partitive
(dividing a quantity into shares resulting in the size of each share) and quotitive (dividing
a quantity by the size of each share to determine the number of shares)- and “the role of
the dividend and the divisor” (Charalambos, 2007, p. 106). The dividend refers to the
number of parts in each share, and the divisor names the fraction of each share.
The pizza example cited above demonstrates partitive division. The three pizzas
are divided into fourths and each person gets three shares. In partitive division, the result
is the amount each person receives. Quotitive division results in the number of equal
shares- three pizzas are to be shared among some friends, if each friend gets three fourths

Effect of Manipulatives on Fraction Comparison 20
of a pizza, how many friends are there? The pizza model context does lend weight to the
use of a circle model, but division can also be demonstrated with rectangular area models
and linear models.
Fractional Scheme Theory
Tunc-Pekkan (2015) combined the work of Charalambos & Pitta-Pantazi (2007),
(Kieren, 1976), and Steffe (2001) to propose Fractional Scheme Theory where schemes
are defined as “goal-directed activities that consist of three parts: an assimilated situation,
an activity, and a result.” (Tunc-Pekkan, 2015, p. 422) Fraction Scheme Theory consists
of the following-
1. Part/Whole subconstruct
a. Parts within wholes fraction scheme- Only partitioning is observed.
Students partition wholes, but not necessarily equally.
b. Part-whole fraction scheme- Partitioning and disembedding (seeing a
fraction of the whole as related to the whole) are observed. Students
partition wholes equally and recognize fractional parts in the context of
the whole.
2. Beyond part/whole subconstuct (and leading to the measurement subconstruct)
a. Partitive unit fraction scheme- Partitioning, disembedding, and iterating
(replicating the unit fraction to the whole to ensure the unit is correct) are
observed. Students can also take a unit fraction and iterate to find the
whole.

Effect of Manipulatives on Fraction Comparison 21
b. Partitive fractional scheme- Partitioning, disembedding, and iterating are
observed. Given a whole, students can find a proper fraction by
partitioning to the unit and iterating to the desired fraction.
c. Iterative fractional scheme- Splitting (a combination of partitioning and
iterating) and disembedding are observed. Students can find an improper
fraction based on the whole by partitioning and iterating or find the whole
by splitting an improper fraction into the appropriate unit fraction (based
on the numerator rather than the denominator) and iterating to the whole.
This study focuses on the measure subconstruct which is addressed to some
degree by the last three schemes in Fractional Scheme Theory. As with whole numbers,
each fraction has a place on the number line that represents its magnitude, but it also
represents the length or space over which a unit fraction defined by the denominator can
be iterated to its numerator. It is a subtle difference, but the place is absolute and tied to a
distance from zero, while the space is relative and can start from anywhere. The fraction
¾ corresponds to a distance of 3 (one fourth-units) which can be measured from 0,
stopping at the place, three fourths or it can be measured from any other marker, like 1
and stop at the place three fourths of a unit past the starting point (in this case 1 ¾). The
number line is the primary tool used for learning about the magnitude of fractions, but
students struggle with partitioning and the fact that fractions do not follow the counting
sequence. Overcoming this struggle provides the opportunity to consider the density of
rational numbers which implies that between any two fractions lies an infinite number of
fractions. (Charalambos, 2007) Students also demonstrate difficulty with the number line
through the counting of marks as opposed to partitions. That particular issue is not

Effect of Manipulatives on Fraction Comparison 22
confined to fractions as they often include 0 in the natural number counting sequence.
Understanding magnitude can be closely tied to understanding order and equivalence in
rational numbers.
In considering the different contexts of fractions, selecting one model as better
than any other is shortsighted. The strengths of the various models apply to the different
interpretations of fractions in different ways and so where one may be better in terms of a
particular construct, the “best” method is the use of multiple models to work with
students to understand multiple representations of rational numbers. If the models do not
provide a particular differentiation for the overall learning of fractions, then one might
consider how the models are used to try and find a better way of teaching fractions.
Curricular Issues
Gearhar, et al. (1999) studied the difference in the use of a problem-solving
curriculum and a skills-based curriculum while providing professional development
support in both scenarios. They found that professional development was especially
critical to the implementation of the problem-solving curriculum. This finding supports
the ideas that led to the implementation of New Math as a response to the “Back to
Basics” by trying to develop a deeper understanding before attempting to apply
procedural routines to operations. The finding also points to some of the reasons for a
lack of success due to insufficient professional development. (Gearhart, et al., 1999)
Cramer et al. (2002) also studied the use of contrasting curricula by using reform
material from the Rational Number Project (RNP) and comparing it to commercially
available curricula. Interestingly, the RNP curriculum was built in a way that minimized
the need for professional development during its implementation. The researchers saw

Effect of Manipulatives on Fraction Comparison 23
significant gains for the students in classrooms using the RNP material which is primarily
built around unit circles and sets. The commercially available curricula provided little
modeling for students in the control group and were almost entirely focused on
procedural fluency. The key element in the RNP is not the specific fraction model, but
the use of multiple representations in the introduction of fractions and the transfer
between the representations to address a variety of subconstructs of fractions. (Cramer et
al., 2002)
Bailey et al. (2015) argue that procedural fluency aids the development of fraction
concepts which then in turn aids in the development of procedural fluency. In the
researchers’ attempt to resolve the dilemma as to which comes first, they studied the
development of fraction concepts in US and Chinese children. Bailey et al. (2015)
determined that the development of conceptual knowledge of fraction magnitude
contributed to procedural fluency in fraction addition which then resulted in a better
conceptual understanding of fraction addition.
For particular models, Jigyel & Afamasaga-Fuata’I (2007) studied the
performance of year 4, 5 and 6 students in Australia on tests of fractions and equivalence.
The predominant model used in these classrooms was the unit circle. Unlike the results of
the RNP, they found disappointing results on the equivalence tests for these students.
Their struggles with fraction equivalence suggest that it may not be just the model that
determines success.
On the other hand, Gould (2013) suggests moving away from the area and
discrete models in Australia and toward a linear model, see Figure 3. He contends that the
students do not have a well-defined understanding of area, and the fractions that they

Effect of Manipulatives on Fraction Comparison 24
create come from a counting perspective rather than a true understanding of the fractional
area that is displayed. Often they lose sight of the fact that the pieces of an area must be
partitioned equally to properly model a fraction. The use of a linear model (not a number
line) can focus them on the need to partition equally based on units of length rather than
units of area.
Figure 3
Linear, Area, and Discrete Models (Gould, 2013)
Mills (2011) devised a different approach by using “body fractions” to introduce
fractional concepts. Despite the loss of precision in comparing body parts, the idea of
introducing kinesthetic activity to learn is a good one. In essence, each student can
represent a unit from fingertip to fingertip. That means that one arm represents one half
and the length from fingertip to elbow is one fourth. Students can then stand together to
represent the same fractions in different ways or display different fractions.
Integrated Theory of Number Development
Students develop conclusions early in elementary school around whole numbers
that often do not hold for the real number system. These include operational perceptions
such as addition/multiplication make larger, subtraction/division make smaller; language-

Effect of Manipulatives on Fraction Comparison 25
based ideas perpetuated by the teacher like “ you can’t take away a larger number from a
smaller number”; and student-created understanding that teachers fail to correct.
These understandings, especially around subtraction and multiplication are
influenced by teachers’ operational understandings. In an anecdotal survey (McNeary,
2012), three teachers- one primary, one middle school, and one high school- responded to
the question, “What is subtraction?” with three different answers – take away, counting
backward, and a difference. Each one demonstrated a larger and more inclusive
understanding of the operation that often escapes students because they most often
understand subtraction as take away.
Teachers limit students’ understanding of operations like subtraction by teaching
it only as take away and multiplication by focusing on repeated addition. (Devlin, 2008)
Teaching multiplication as repeated addition inhibits the understanding of proportionality
and scaling that is essential to multiplicative reasoning. (Devlin, Devlin's Angle, 2011)
The lack of understanding of the scaling nature of multiplication also impedes the
understanding of fraction operations.
This can lead to the idea that rational numbers are completely different from
whole numbers. As such, some researchers (and many students) treat the transition from
whole numbers to rational numbers as less of a transition and more as the development of
a completely different understanding of numbers (Gelman & Williams, 1998; Geary,
2006; Vosniadou et al., 2008).
In contrast, Siegler et al. (2011) proposed an integrated theory of numerical
development in which they consider the transition from natural numbers to rational
numbers by emphasizing the properties and concepts that carry forward.

Effect of Manipulatives on Fraction Comparison 26
This theory proposes that numerical development is at its core a
process of progressively broadening the class of numbers that are
understood to possess magnitudes and of learning the functions
that connect that increasingly broad and varied set of numbers to
their magnitudes. In other words, numerical development
involves coming to understand that all real numbers have
magnitudes that can be ordered and assigned specific locations on
number lines. … (T)he central conceptual structure for whole
numbers, a mental number line, is eventually extended to other
types of numbers, including rational numbers.
(Siegler et al., 2011, p. 274)
The comparison (and addition) of numbers provides an example where common
concepts between number systems could be emphasized. If one person has five apples
and another three oranges and you want to compare (or add) the quantities, you have to
understand that they are all pieces of fruit, a common unit. In that scenario, you see that
the person with the apples has two more pieces of fruit than the person with the oranges
or they have eight pieces of fruit together. Using a number line and the idea of a common
unit when working with whole numbers can lay the groundwork for an easier transition to
understanding rational numbers and the need to have a common denominator.
As an algebra teacher, the researcher observed that students’ failure to understand
the basic nature of numbers including properties of equality, operations, and identity; the
need for common units in addition and subtraction; and the difference in context for
numbers in multiplication and division inhibits their success. They see two numbers, an

Effect of Manipulatives on Fraction Comparison 27
operation, and an equal sign as the signal to perform a rote calculation without
understanding the context or relationship of the numbers to each other and to the answer
of their calculation. For the four basic arithmetic operations, the relationships of the two
numbers involved in the operation are critical to the performance of the operation. For
addition and subtraction, the two numbers must have identical units; for multiplication,
one of the numbers is a scale factor (the multiplier) and the other is a unit-based number
(the multiplicand). Because division can be defined as the inverse of multiplication, the
operation leads to two scenarios- dividing a unit based number by a scale factor to obtain
a unit based answer or dividing a unit based number by a unit based number resulting in a
scale factor. Consider a cookie sharing example. If a teacher has 12 cookies to share
among 3 students, then each student gets 4 cookies, an example of a partitive or sharing
division. In contrast, if a teacher has 12 cookies and wants to share 4 cookies each with a
group of students, 3 students would receive cookies, which demonstrates quotitive or
measurement division. The basic understanding of the need for common units to add,
subtract and perform one form of division, while one of the numbers in a multiplication
operation is a scalar can serve as a bridge to understanding the need for finding common
denominators when adding and subtracting fractions, but not when multiplying them. It
turns out that the second division scenario (unit by unit) also lends itself to using
common denominators, but that is not taught as much as the “invert and multiply”
method of dividing fractions. While the Common Core State Standards address the
acquisition of whole number operations knowledge mostly by fifth grade, the acquisition
of knowledge regarding fractions begins to ramp up in fourth grade with a heavier
emphasis on operations in fifth grade.

Effect of Manipulatives on Fraction Comparison 28
Test Scores in the State of Missouri
As seen in Figures 4 and 5, student test scores show a significant decrease in
percent Proficient/Advanced between the fourth and eighth grade in the state of Missouri
on both nationally administered and state-administered standardized tests. (Missouri
DESE - NAEP, 2019)
Figure 4
Missouri NAEP Scores, 2011/2013/2015
The decrease between fourth and eighth grade shows up consistently across most
state and national tests. While part of the decrease is attributable to the introduction of
Algebra in sixth and seventh grade, Figure 5 shows the first large decrease happens
between fourth and fifth grade- the year that most students begin to work with rational
numbers. (Missouri DESE - NAEP, 2019)
Figure 5
Missouri MAP Scores, 2015-2016

Effect of Manipulatives on Fraction Comparison 29
Purpose of the Study
The purpose of this study is to describe the effect of the use of various
manipulatives on the changes in performance (and classification of same) on an identified
test instrument for students at a midwestern regional university. The treatments
specifically address the comparison of two fractions by displaying area models and/or
relative positions on the number line. They are intended to help students overcome
common perceptions in fraction comparison such as whole number reasoning, reliance on
the unit fraction, and gap reasoning. In gap reasoning, students understand the gap
between the numerator and the denominator of a fraction to be the determining factor in
the relative size of the fractions. (Fagan et al., 2016) Many students think if the gap is the
same, the fractions are equal, otherwise, the fraction with the greater gap is the smaller
amount. For instance, a student operating under this idea would state that ½ is equal to
2/3 since the difference between the numerator and the denominator in each case is one.
Much of the previous research on rational number development, and gap
reasoning in particular, tends to explain the difficulty in understanding fractions as whole
number or natural number bias. This research posits that understanding rational numbers

Effect of Manipulatives on Fraction Comparison 30
requires a different framework than the one used for understanding whole numbers
(Gelman & Williams, 1998; Geary, 2006; Vosniadou et al., 2008). Other research looks
at proposed solutions, several focused specifically on the use of technology (Bulut et al.,
2014; Fazio et al., 2016; Neshar, 1987; Olive et al, 2010). However, none of the research
emphasizes the conversion between early fraction models and number line placement.
This study will address that specific deficiency concerning the particular classifications
of understanding known as whole number reasoning, reliance on the unit fraction, and
gap reasoning in fraction comparison by applying a specific treatment that converts
fraction models to comparative locations on a number line and attempting to determine if
the treatments improve student performance on proper fraction comparison activities.
Research Questions, Hypotheses, and Objectives
This study is framed with the research question “How does the use of multiple
virtual fraction models affect students’ mental comparison of the size of two proper
fractions?” The hypotheses are the following:
H0 1: There is no significant difference in the test score differences between
groups of test subjects using assigned manipulatives to complete their exercises.
H0 2: There is no significant difference in the classification differences on the
scale of fraction understanding (described in Chapter 3) between groups of test
subjects using assigned manipulatives.
The virtual manipulatives were created using the Scratch programming
environment, the outcome of a project of the Lifelong Kindergarten Group at the MIT
Media Lab (Massachusetts Institute of Technology, 2019). Scratch enables users to
visually write scripts in a proprietary web-based scripting language to tell stories,

Effect of Manipulatives on Fraction Comparison 31
perform animations, and play games and was originally conceived as a way to introduce
8 to 16-year-olds to computer programming.
Delimitations
This study proposes using a fraction modeling tool that emphasizes the
connection between the early models and locating a fraction on a number line in
introductory university mathematics classes. Students in most of these classes have
generally displayed weak computational skills as evidenced by placement based on lower
ACT scores (15-21). The study will be limited to university classrooms on a single
campus in southeast Missouri. The student population spans a cross-section of
socioeconomic status. In addition to lacking a significant ethnic diversity, the population
is slightly more female since the initial mathematics content for teacher classes (which
traditionally contain over 90% female students) comprise about one-fourth of the classes
in the study. These classes also contain students with higher ACT scores because the
classes have no upper limit on the ACT score (>15).
Students may complete the pretest using procedural comparison methods such as
cross products, common denominators, and conversion to decimal as opposed to making
a mental comparison. Administrators of the tests will read a script emphasizing the use of
mental comparison and exhorting students to compare the fractions they see without
changing them in any way. The specific methods are not mentioned in the script to not
encourage their use if the students had not considered them.
The fact that students will not receive any additional instruction is of some
concern. However, Boaler (2016) discusses a study that gave subjects a 10-minute
exercise to work over 15 days, and participants experienced structural brain changes.
Effect of Manipulatives on Fraction Comparison 32
Significance
The unique elements of the treatment include the use of technology to create more
accurate models than drawing by hand and the use of circular and bar area models as well
as positions on a number line. Torbeyns et al. (2015) showed a correlation between the
ability to locate fractions on a number line and improved general mathematical
achievement. If successful, further study using this tool to introduce fractions at lower
grade levels would be a natural extension.
Organization of the Study
The remainder of this study is structured in four additional chapters. The second
chapter contains the literature review discussing mathematical misconceptions- the
constructivist view of misconceptions, theories of number development, rational number
learning, use of technology for identification and remediation- as well as research on
fraction comparison. The third chapter specifies the research design and methodology,
the fourth includes the data analysis and findings, and the fifth summarizes the study,
discusses the conclusions, and makes recommendations regarding future research.

Effect of Manipulatives on Fraction Comparison 33
Chapter 2
Literature Review
Misconceptions and Constructivism
Smith et al. (1993) attempt to reorient the traditional discussion of student
misconceptions to a more constructivist framework. In the first part of the article the
authors discuss misconceptions research and some of the central tenets that fly in the face
of constructivism. Much of the research on misconceptions discussed in their article
implies that misconceptions interfere with learning. As such, misconceptions should be
identified specifically; confronted explicitly; and replaced with expert knowledge. Less
emphasis in this previous research is noted on “modeling the learning of successful
students in those domains, … characterizing how misconceptions (and the cognitive
structures that embed them) evolve, or to describing the nature of instruction that
successfully promotes such learning.” (Smith et al., 1993, p. 123)
In one scenario from the text, students from novice to master were presented with
a series of fraction tasks including comparison. (Smith et al., 1993) They make the point
that students classified as masters use some of the same knowledge and structures in their
reasoning that novices do, but masters have built and expanded upon that knowledge and
structure. In the researchers’ discussion of strategies of fraction comparison, they note
that while novices focus on models, masters have used the divided whole concepts from
the models to develop reasoning about the quantities themselves.
Even though textbooks and curriculum focus on two primary strategies for
fraction comparison (and operations), conversion to common denominator and
conversion to decimal, mastery depends on a wider variety of strategies, many only

Effect of Manipulatives on Fraction Comparison 34
useful within a specific context. (Smith et al., 1993) Some of those strategies included
benchmarking (comparing to a common reference point such as ½ or 1) and easy
relationships between numerator and denominator (12/24 and 8/16 are one half). Both
masters and novices tended to develop common strategies that they would use within the
context of a problem type, falling back on the taught strategies when they could find no
easy relationships. One of the key findings was that these student-developed strategies
are rarely taught explicitly. (Smith et al., 1993)
Neshar (1987) proposes an instructional theory based on using student
misconceptions to guide instruction. The author makes the point that cognitive
dissonance is necessary for learning and that often specific student errors arise from more
general misconceptions that will yield both correct and incorrect answers, depending on
the question. The paper cites two approaches involving decimal comparison- either
longer is larger (whole number thinking) or shorter is larger (tenths are bigger than
hundredths). In both cases, students using these approaches will (potentially) correctly
answer any question where the number of decimal places in the two numbers is the same.
Also, the approaches can yield the correct answer to questions that are set up in a
particular way. When comparing .4 vs .125 students using the shorter/larger approach
will choose the correct answer while students using the longer/larger will not. On the
other hand, when comparing .4 vs .675, the longer/larger approach will lead to a correct
answer while the shorter/larger will not). Neshar (1987) discusses the implementation of
the proposed instructional theory with a learning system/microworld containing an
“articulation of the unit of knowledge” or “knowledge component” and an
“exemplification component” which must be familiar but serve as a stepping stone to
Effect of Manipulatives on Fraction Comparison 35
“new concepts and relationships”. The fraction comparison application for this project
provides just such a microworld with basic fraction knowledge serving as the knowledge
component and the models as the exemplification component.
While the word misconception itself implies a deficit, it is the vocabulary that
appears in much of the research that I used for my thesis. However, the use of the word
“misconception” does not go as far as “mistake” or “error” in terms of labeling and
creating an impression of “wrongness”. Smith et al (1993) include an appendix with an
extensive discussion of the language surrounding misconceptions. They point out that
even “alternative conceptions” (which may, in some cases, still be correct) implies a
difference from the “right” conception like “informal knowledge” is somehow not as
good as “formal knowledge”. They do not offer a solution to the discussion although the
idea of a “preconception” does not carry a particular connotation. Still, in common usage,
preconceptions tend to be somewhat negative- preconceived notions, etc. Regardless of
the label, students will perform a fraction comparison in the way that they have
developed to understand it, and my goal is to see if this tool can move them to a more
complete understanding.
Theories of Number Development
The teaching of elementary mathematics from the perspective of privileged
domain theory (Gelman & Williams, 1998), evolutionary theories of numerical
development (Geary, 2006), and conceptual change theories (Vosniadou et al., 2008)
treat the teaching of whole numbers and the teaching of rational numbers as completely
different processes requiring a different framework for understanding the rational number
system.

Effect of Manipulatives on Fraction Comparison 36
According to privileged domain theories (Gelman & Williams, 1998) and
evolutionary number theories (Geary, 2006), whole number reasoning lies at the heart of
many of the difficulties students have in learning about fractions and rational numbers. In
some ways, the lack of understanding that fractions are rational (and real) numbers with
associated locations on the real number line inhibits the transfer of operational knowledge
from whole numbers to rational numbers. Students see the two numerals of a fraction, the
numerator and denominator, as representing distinct values requiring separate analysis.
This thinking is a logical extension of much of the fraction modeling that is used in
elementary school, especially circular models where students learn to count the
numerator and denominator separately.
Theories of numerical development that focus on the acquisition of whole number
knowledge treat the development of knowledge of other types of numbers (integers and
rationals) as distinct (Gelman & Williams, 1998) (separate number systems) and
secondary (Geary, 2006) (whole numbers take precedence) and point to ways in which
the interpretation of whole numbers inhibits the understanding of the other types of
numbers. The theories emphasize the discontinuity between the number systems- whole
numbers are different from integers and both are different from rational numbers.
“Privileged domain theories argue that specialized learning mechanisms make it easier to
learn about whole numbers than about fractions or other types of numbers.” (Gelman &
Williams, 1998, p. 11)
Geary (2006) proposed an evolutionary theory that whole numbers are
“biologically primary” and that other types of numbers are “biologically secondary”. The
fact that infants recognize different sizes of sets establishes the primacy of counting as a

Effect of Manipulatives on Fraction Comparison 37
way of understanding numbers. In that sense, whole numbers (or even more specifically,
counting numbers) are tied to the innate understanding of numerosity. According to this
theory (and privileged domain theories) the counting elements of whole numbers, like the
one to one correspondence of sets to the counting numbers and the fact that the cardinal
number is the last number counted in a set, make it harder to understand fractions because
they have no analog in the rational number system.
According to Vosniadou et al. (2008) conceptual change theories place a greater
emphasis on fraction knowledge development but still focus on the differences between
learning whole numbers and fractions. Vamakoussi & Vosniadou (2010) speculate that
children develop a framework for understanding numbers as counting numbers that
“constitutes an initial, domain-specific theory of number”. Using a framework theory
approach to conceptual change, the misconceptions due to natural number reasoning are
an indication that students use their understanding of counting numbers to try and make
sense of rational numbers. This leads to ideas like larger numbers make larger fractions.
Siegler et al. (2011) propose an integrated theory of number development that
contrasts with much of the research in support of privileged domain theories and
evolutionary development theories of number development. This integrated theory
recognizes the differences between whole numbers and fractions, but it posits that they
share the important commonality of the centrality of numerical magnitudes in the overall
understanding of numbers. The researchers found that:
accuracy of fraction magnitude representations is closely related to both fraction
arithmetic proficiency and overall mathematics achievement test scores, that
fraction magnitude representations account for substantial variances in

Effect of Manipulatives on Fraction Comparison 38
mathematics achievement test scores beyond that explained by fraction arithmetic
proficiency and that developing effective strategies plays a key role in improved
knowledge of fractions. (Siegler et al., 2011, p. 22)
Moving from misconception/alternative conception/preconception to a more
complete understanding can be approached from a constructivist point of view. The
integrated number theory work of Siegler et al. (2011) proposed that rational number
learning should be treated as an extension of whole number learning instead of as
something different. In that sense, the constructivist ideas for building on existing
knowledge as opposed to trying to create a different understanding just for rational
numbers come into play. The activities in this project attempt to transition the students
from the part-whole circle model understanding to the idea of magnitude on a number
line. The part-whole ideas are not necessarily replaced by the magnitude representation,
but they are supplemented or expanded as the understanding of fractions and rational
numbers are multilayered.
In the vein of supplementing as opposed to replacing, the transition between
number systems should focus on the operational properties of numbers that do not change
and the positioning of numerical values on a number line. Also, the further emphasis
during whole number learning on the things that numbers represent in whole number
operations can lay a better foundation for rational number learning. Emphasis needs to be
placed on the fact that in addition and subtraction all of the numbers represent common
units regardless of the number system, while in one step multiplication and division
(involving three numbers), two of the numbers represent unit-based quantities while the
third is a unitless scale factor.
Effect of Manipulatives on Fraction Comparison 39
Rational Number Learning
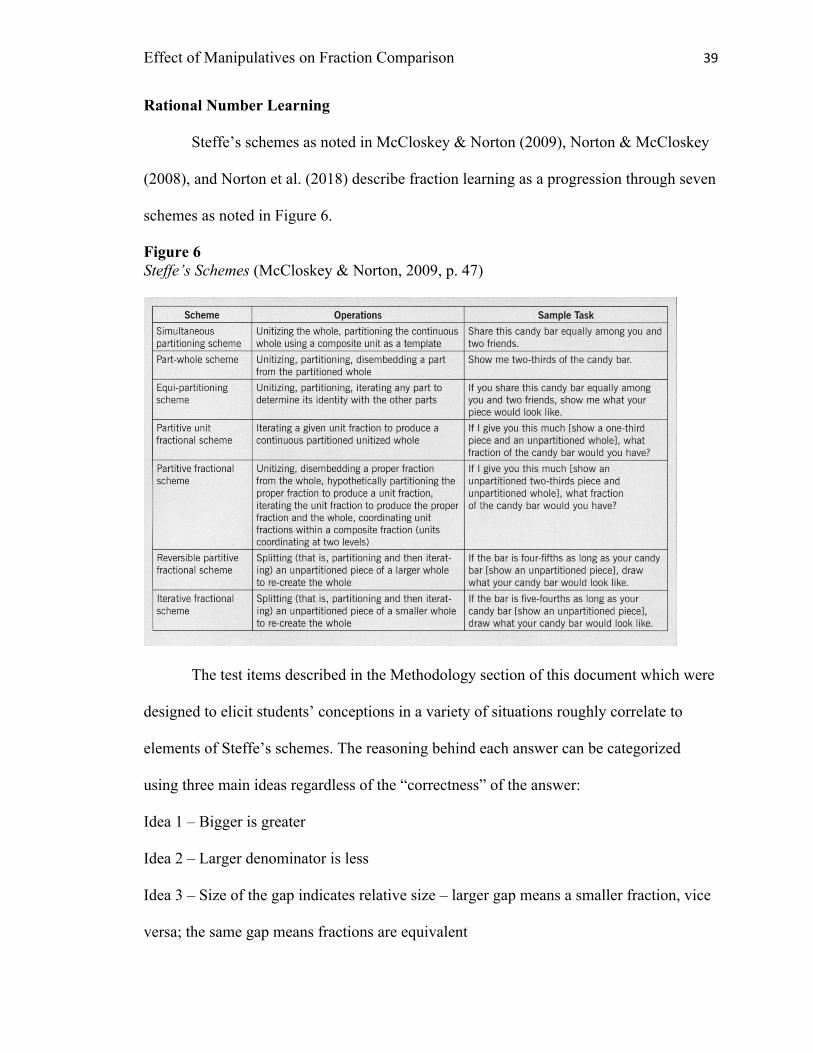
Steffe’s schemes as noted in McCloskey & Norton (2009), Norton & McCloskey
(2008), and Norton et al. (2018) describe fraction learning as a progression through seven
schemes as noted in Figure 6.
Figure 6 Steffe’s Schemes (McCloskey & Norton, 2009, p. 47)
The test items described in the Methodology section of this document which were
designed to elicit students’ conceptions in a variety of situations roughly correlate to
elements of Steffe’s schemes. The reasoning behind each answer can be categorized
using three main ideas regardless of the “correctness” of the answer:
Idea 1 – Bigger is greater
Idea 2 – Larger denominator is less
Idea 3 – Size of the gap indicates relative size – larger gap means a smaller fraction, vice
versa; the same gap means fractions are equivalent

Effect of Manipulatives on Fraction Comparison 40
In looking at these three ideas, one can begin to see a progression through Steffe’s
schemes. The idea that larger numbers yield larger fractions is a counting based idea that
prefaces the earliest Steffe scheme of Part/Whole as the student does not grasp that the
whole is partitioned into equal pieces. The idea that a larger denominator indicates a
smaller fraction indicates an understanding of a unit fraction under the Part/Whole
scheme as the student understands the partitioning of the whole, but not the iteration of
the parts. Gap reasoning falls somewhere in the equi-partitioning scheme as the student
has an understanding of the division of the whole and counting of the parts to create the
fractions, but they have not put it all together for comparison of two fractions. Leveraging
the fact that an equal gap comparison transitions to a “common numerator” comparison,
if one considers which fraction is closer to/further from 1 (benchmarking), means that it
might be possible to modify a student’s use of gap reasoning to better fit the circumstance
rather than replacing it entirely. Finally, Steffe’s more advanced schemes revolve around
iteration which is easily seen in the context of the number line.
Norton et al. (2018) investigated whether Steffe’s schemes were particular to US
schools by studying Chinese students. The researchers found similar schemes in both
countries even though students in the US are primarily introduced to fractions through
part/whole concepts while Chinese students learn more from the measurement model.
“Collectively, our findings suggest a common cognitive core in students’
development of fractions knowledge, which is described in terms of the
progression of fraction schemes shared in Table 1. Educators could foster
student growth by building from primitive part-whole schemes toward
measurement schemes (e.g., PUFS). Previous research has indicated that

Effect of Manipulatives on Fraction Comparison 41
engaging in tasks involving iterating unit fractions can support that growth
(Tzur, 1999). Such tasks already play a prominent role in the elementary
school curriculum in China (Li et al., 2009).” (Norton et al., 2018, p. 225)
Technology and Rational Number Learning
While Neshar (1987) describes the construction of microworlds using technology
to create learning systems, Olive, et al (2010) provide a discussion of technology
specifically related to mathematics education in their chapter of the 17th ICMI Study,
Mathematics Education and Technology, Rethinking the Terrain. The chapter is divided
into three main subjects- “1) mathematical knowledge and learning that results from the
use of technology, 2) mathematical knowledge on which the technologies are based, and
3) mathematical practices that are made possible through the use of technology.”
In the first section, the authors make the point that a significant application of
technology is geared toward more efficiency in the same classroom environment, but that
the opportunity exists for much more. They contrast the use of technology for efficiency
with the TIMA software application that Olive and Steffe developed at the University of
Georgia also documented in Steffe & Olive (2002). TIMA is a multi-faceted computer
environment that allows students to access fractions as elements of sets, measurements,
and area. It addresses a wide range of fraction learning allowing students to “enact their
mathematical operations of unitizing, uniting, fragmenting, segmenting, partitioning,
disembedding, iterating and measuring.” (Steffe & Olive, 2002, p. 55)
The primary point they are trying to make is that through interaction within the
context of a microworld such as TIMA, students are more able to construct mathematics
and develop a deeper understanding. An interesting element of this idea is the context.

Effect of Manipulatives on Fraction Comparison 42
Much of the development of regular curriculum focuses on bringing “real world” aspects
to the learning environment, but they contend that this strategy still misses the mark. The
parameters have to be controlled to the point where the scenarios are not real outside the
manufactured context developed by the curriculum. In a micro world, students are
solving the problems in the context of that world and do not necessarily need the element
of reality to develop an understanding of the mathematics. (Steffe & Olive, 2002)
Bulut et al. (2014) developed a Dynamic Geometry Environment microworld for
third graders in Turkey using Geogebra. Bulut et al (2014) presented a technology
enhancement of the current classroom process by creating dynamic software models of
the physical representations normally used. ”In the experimental group dynamic oriented
activities were used by using [a] constructive approach.” (Bulut et al., 2014) Students
were able to see a wider range of fractions and use the software to change the models in
ways not possible with physical manipulatives.
Fazio, Kennedy & Siegler (2016) modified a program developed for decimal
magnitude to create a microworld called Catch the Monster with Fractions and deployed
it as an instructional supplement. Students received the same instruction, but the control
group performed their activities using worksheets while the experimental group played
the “Catch the Monster” game. The game itself was designed to emphasize fraction
magnitude, understanding the measurement context of a fraction especially regarding the
position on a number line (see Figure 7). “The [Common Core] standards’ focus on
understanding fractions as numbers with magnitude dovetails with recent emphasis
within cognitive psychological theories on the centrality of magnitude understanding to
mathematical knowledge.” (Fazio et al, 2016)

Effect of Manipulatives on Fraction Comparison 43
Catch the Monster with Fractions was used for two studies. The first involved 26
fourth and fifth graders near Pittsburgh, PA, and the second expanded to 51 fifth graders
in the same area. Even though the size and education level of the two studies were
different, both indicated significant improvement in the experimental groups as compared
to the control groups.
Figure 7 A sample correct trial (top) and a sample incorrect trial (bottom) from Catch the Monster
(Fazio et al., 2016)
Olive, et al (2010) point out that a significant amount of potentially complicated
mathematics can serve as the underpinnings for any microworld. A teacher or student
does not need to understand all of the underlying mathematics to use the microworld, but
anyone who is building a microworld needs to understand the consequences of changes to
any particular aspect of the program.
The final element of technology use in mathematics education is the development
of mathematical practices. As students are allowed to explore and discover they use more

Effect of Manipulatives on Fraction Comparison 44
of the practices that form the fundamental element of what distinguishes the Common
Core Standards. By interacting and receiving feedback, students can implement the
mathematical practices listed in the Common Core standards.
• Make sense of problems and persevere in solving them.
• Construct viable arguments and critique the reasoning of others.
• Reason abstractly and quantitatively.
• Model with mathematics.
• Attend to precision.
• Use appropriate tools strategically.
• Look for and make use of structure.
Identification of Understanding
Mazzocco et al. (2013) demonstrated how a qualitative error analysis of early
symbolic number knowledge reveals potential sources of differences that may affect
mathematics outcomes. The article discusses some specific errors, but the objective was
to show how qualitative analysis can augment test scores. They found that gaps in the
number knowledge of second and third graders appeared to predict specific types of error
on eighth-grade math assessments. They showed “that early whole number
misconceptions predict slower and less accurate performance, and atypical computational
errors, on Grade 8 arithmetic tests … (and) that basic number misconceptions can be
detected by idiosyncratic responses to number knowledge items” (Mazzocco et al., 2013,
p. 33).
Steinle & Stacey (2003) showed variations in the patterns of understandings and
developed estimates of the lifetime prevalence of these misconceptions. While they
Effect of Manipulatives on Fraction Comparison 45
focused specifically on two understandings related to decimal comparison- longer is
larger, classified as (L) and shorter is larger, classified as (S), the larger point is the
different ways in which related misconceptions manifest themselves. They found that
second through fifth-grade students were more likely to exhibit (L), but that its
appearance decreased over time. Of more interest was the fact that the (S) understanding
increased over time and persisted in high school. In a different study using the same test
data, Steinle & Stacey (2004) classified the (S) understandings in more specific ways
based on students’ comparisons of decimals with the same number of digits. They
devised (S1) for denominator based thinking (since 1/100 is less than 1/10, anything with
hundredths must be less than something with tenths) and place value number line
thinking (since three-digit numbers follow two-digit numbers on the number line, it
follows that the order is reversed on the other side of the decimal so all three-digit
decimals must be less than all two-digit decimals); (S3) for reciprocal thinking
(1/73<1/6, so .73 must be less than .6) or negative thinking (-73<-6, so .73 must be less
than .6); and (A2) for money thinking (everything is truncated to two decimal places and
the resulting two-digit decimal is compared). The authors found that younger students
demonstrating (S1) and (A2) were more likely to move to expertise on their following
tests where students falling into (S3) were more likely to stay there. However, older
students for all three categories were less likely to ever move to expertise, possibly
because they have demonstrated some type of learning disability. (Steinle & Stacey,
2004)
Finally, Kerr (2014) hypothesized that educational video games can reveal
understandings in ways unavailable in traditional environments. One of the major issues

Effect of Manipulatives on Fraction Comparison 46
proved to be separating mistakes in the video games from mathematical errors which
became the basis of the research question – “Can mathematical misconceptions be
identified solely from actions students take in an educational video game?” (Kerr, 2014,
p. 8) Through the use of cluster analysis on two separate video games and surveys, the
researcher showed that certain understandings could be isolated from difficulties with the
structure of the games. The first game, Save Patch, was designed to test students’ ability
to understand the meaning of the unit, the meaning of addition as applied to fractions, and
the meaning of the numerator and the denominator. The most common misconception
was a misunderstanding of how to partition fractions. Students viewed a rectangular grid
divided into equal sections by posts and counted the posts to construct their denominators
rather than the spaces between the posts. This misunderstanding is reinforced by the use
of circular models because the amount of cuts required to divide a circle is equal to the
resulting denominator. The next most common misconception revolved around an
inability to properly establish the unit upon which the fraction was based. About two-
thirds of the problems in Save Patch were designed to use fractions greater than one, but
students with the misconception consistently set their unit as one by including the entire
grid.
As a check regarding the understandings, the researcher presented the students
with a series of number line problems outside the game and found that the same students
made the same errors. Finally, the researcher used a second game, Wiki Jones, which had
a remediation element to it and found similar results thus concluding that common
understanding identified in the video game matched real mathematical understandings
encountered by students.

Effect of Manipulatives on Fraction Comparison 47
Remediation of Student Understanding
The development of the fraction comparison tool is supported by research on the
remediation of student understanding. Riccomini (2005) studied teachers as a source of
remediation for students and found that when they can identify errors, they often do not
shift their instruction based on the errors they see. The researcher presented teachers with
two systematic error patterns in subtraction and asked them to identify and propose
remediation. About 60% of the teachers correctly identified both errors, but they did not
base their instructional focus on the pattern of errors. It is not enough to identify errors;
teachers must tie remediation to the pattern of error. If this project is successful, the
design of the comparison tool can allow teachers to address misconceptions in fraction
comparison.
According to Durkin & Rittle-Johnson (2012), misconceptions can be useful
teaching tools. Researchers examined students' performance on a decimal understanding
task based on learning with correct examples versus intervention with incorrect examples.
They hypothesized that the students using the intervention with incorrect examples would
do outperform the students learning with correct examples. The researchers designed two
sets of tasks to follow similar instruction. In the set of tasks for the first group, students
were presented with one correct and one incorrect placement of a decimal on a number
line with explanations of the reasoning, and in the tasks for the second group, the students
were presented with two correct placements and the associated explanations. The
researchers found that the use of the incorrect examples supported greater learning of
correct procedures and retention of correct concepts. The comparison tool for my
research project was designed specifically to address misconceptions in fraction

Effect of Manipulatives on Fraction Comparison 48
comparison. Students have the opportunity to consider their approach to fraction
comparison when their predictions do not match the models.
Finally, according to Hewitt (2012) technology can support remediation. This
researcher examined the use of software to introduce algebraic notation to 9-10-year-olds.
The software, Grid Algebra, was designed to introduce formal notation and help students
solve linear equations. The software is built around a multiplication grid and the idea that
moving spaces to the right represents addition, moving spaces to the left represents
subtraction, spaces down represents multiplication and moving spaces up represents
division. By moving around the grid, students build a series of arithmetic operations. This
alternative approach to linear equations avoided some common difficulties that often
arise especially in understanding the building of equivalent expressions as opposed to
creating calculations. This research, as well as the work of Fazio, Kennedy, & Siegler
(2016) supports the idea of using technology as a remediation tool.
Fraction Comparison
According to Siegler et al. (2011), many theories of numerical cognition accept
that whole number knowledge is organized around a mental number line. They also state
that research has shown that number line estimation is an underutilized task that can be
useful for studying the development of whole number magnitude representations. The
advantage of number line estimation is that it is not limited to whole numbers, but it can
also be used with any type of real number, large or small.
Siegler et al. (2011) propose five commonalities between magnitude
representations of whole numbers and fractions in their proposal of an integrated theory
of number development-

Effect of Manipulatives on Fraction Comparison 49
1) Alternative measures of fraction magnitude knowledge are highly correlated.
2) Numerical magnitude comparisons with fractions yield distance effects.
3) Knowledge of different ranges of fractions develops at different times (earlier for
fractions from 0 to 1 than from 0 to 5).
4) Knowledge of fraction magnitudes varies greatly among individuals and
correlates with both arithmetic proficiency and mathematics achievement test
scores.
5) Relations between fraction magnitude representations and mathematics
achievement test scores extend beyond their common relation to arithmetic
knowledge.
These commonalities support the value of the development of a single integrated theory
for the development of whole numbers and fractions as proposed by Siegler et al. (2011).
Clark & Roche (2009) studied students’ mental fraction comparison strategies on
a set of eight different pairs of fractions and broke the strategies down into four broad
categories:
1) Residual thinking – how much left to get to the unit (2/3 is 1/3 away from 1, 2/5 is
3/5 away from 1)
2) Benchmarking (or transitive) – how close to benchmark fractions (1/4, 1/3, ½, 2/3,
3/4)
3) Common denominators- transform the fractions to equivalent fractions with equal
denominators. Because fractions with common denominators are obtained
through a series of three multiplications, it is a more procedural strategy that
requires less conceptual knowledge of the relative size of the fractions.

Effect of Manipulatives on Fraction Comparison 50
4) Gap thinking – a comparison of the difference between the numerator and the
denominator. Gap thinking is tied to the idea that the numerator and denominator
exist as separate entities. When using gap thinking a student would look at ¾ and
3/5 and make their comparison based on the fact that the difference between the
numerator and denominator in the first fraction is 1 while the difference between
the numerator and denominator in the second is 2. Since ¾ has a smaller gap, then
it must be a larger fraction. Four of the pairs yielded the correct answer through
incorrect gap thinking, so the explanation from the students was key to
determining how they arrived at their answers.
Students reported benchmarking and/or residual thinking the most on six out of
the eight comparisons. However, in situations where those two strategies were most
appropriate, the most widely used strategy was common denominators that favor
procedural over conceptual knowledge.
Clark & Roche (2009) found that students with the greatest success tended to use
residual thinking or benchmarking. Students with a better conceptual understanding
leaned on benchmarking and residual thinking as well, but teachers did not use or teach
these strategies. Many teachers were unable to offer a strategy other than common
denominators leading the authors to speculate that teachers were generally unaware of
these strategies.
If students do not recognize the relative size of fractions, they will struggle to
conceptualize any associated operations on fractions. Post et al. (1986) note that
“children’s understandings about ordering whole numbers often adversely affect their
early understandings about ordering fractions.” (pg 33) For some children, these
Effect of Manipulatives on Fraction Comparison 51
misunderstandings persist even after relatively intense instruction based on the use of
manipulative aids such as diagrams and fraction circles, but Kilpatrick et al. (2001) argue
that “of all the ways which rational numbers can be interpreted and used, the most basic
is the simplest- rational numbers are numbers. That fact is so fundamental that it is easily
overlooked.” (pg. 235)
The ability to perceive the ordered pair in a fraction symbol as a conceptual unit
rather than as two individual numbers was found to be an indicator for successful
performance by Clark & Roche (2009). Also, the researchers noted that using models
such as the circular type of fraction models often introduced with fractions to make
comparison decisions caused problems because children are often “model poor”. This
idea is supported by Post et al. (1986) who found that “a crucial point in acquisition of
the order and equivalence concept is reached when children’s understanding of fractions
becomes detached from concrete embodiments and children are able to deal with
fractions as numbers.” Moss & Case (1999) laid out an instructional program to address
this that included a greater emphasis on the meaning of rational numbers as opposed to
the procedures for manipulating them, greater emphasis on the proportionality of rational
numbers with an attendant focus on the differences with whole numbers, and the use of
an alternative visual representation between proportional quantities and their numeric
representation (something other than pie charts).
Summary
The research of Smith, diSessa, & Roschelle supports the idea of constructivist
approaches like the use of models in addressing students’ perceptions of fractional

Effect of Manipulatives on Fraction Comparison 52
comparison. Furthermore, Neshar’s work supports the idea of a microworld such as the
limited one built for this exercise.
The Integrated Theory of Number Development proposed by Siegler, Thompson,
& Schneider lays the groundwork for understanding that fraction magnitude is similar to
whole number magnitude and that modeling of fractions as positions on a number line
provides the context for better understanding of fraction operations. This supports
Steffe’s schemes that indicate that fraction understanding is not complete until students
can demonstrate measurement aspects of fractions.
Technology is ubiquitous today, and educators need to find ways to leverage it in
their classrooms. While certain aspects of physical manipulatives are difficult to
replicate, the ability to share technology across a wider field of students bends the arc
toward its use, especially if student performance is at least the same when using
technology versus not. In addition, the identification and remediaton of understanding in
general, and fraction comparison in this study, can be enhanced by technology.
Students use a variety of strategies for fraction comparison that are often not
taught. Tapping into these strategies directly and supporting them with models can help
students not only with fraction comparison, but with understanding fraction magnitude
which is highly correlated with improved performance on mathematics aptitude tests on a
variety of subjects.

Effect of Manipulatives on Fraction Comparison 53
Chapter 3 Methodology
This study is focused on answering the two research questions, “How does the use
of virtual fraction models affect students’ mental comparison of the size of two proper
fractions as reflected in performance on a test designed to identify fraction comparison
strategies?” and “How does the use of virtual fraction models affect students’ mental
comparison of the size of two proper fractions as reflected on a scale of fraction
understanding?” by determining whether the associated hypotheses can be supported.
Chapter three describes the research design, sampling, variables, data analysis, and ethics
for the study.
Research Design
To investigate the effects of the treatment in addressing a specific mathematical
skill, the study used a pretest/posttest control/comparison group design with random
assignment of control and treatment groups within different class sections. Seven
different treatment groups were created using all combinations of the manipulatives. The
experiment involved eleven lower-division university level math classes, and the
manipulatives were distributed randomly within these classes so that approximately the
same number of students used each manipulative. Figure 8 shows a visual model of the
design.
Figure 8 Randomized Pretest-Posttest Control/Comparison Group Design (per class section)

Effect of Manipulatives on Fraction Comparison 54
Random Assignment Group Pretest Interventions Posttest A Virtual Pie
B Virtual Bar
C Virtual NL
R D Virtual Pie/Bar
E Virtual Pie/NL
F Virtual Bar/NL
G Pie/Bar/NL
H
Time
Scale of Fraction Understanding
According to the senior researcher on the EM^2 project, P. Clements (personal
communication, April 24, 2020), the tests were not designed to measure a single
construct like fraction comparison so they have relatively low internal reliability. They
were designed to indicate the probability of whether a student has any of the identified
misconceptions. The patterns of correct and incorrect answers indicate whether the
student understands fraction comparison in a particular way so performing an analysis
and classification of the data is recommended.
EM2 provided a comprehensive analysis of the test instruments that can be
used to identify whether a student exhibits one of the three comparison methods targeted
by the Comparison of Fractions Assessment (included in Appendix A). Students took a
pretest designed to identify particular approaches in the area of fraction comparison, and
student scores on the pretest were classified based on the students’ methods of comparing
fractions – cross products, decimal conversion, common denominators, whole number
reasoning, dependence on the unit fraction, and gap reasoning. Pretest answers were

Effect of Manipulatives on Fraction Comparison 55
analyzed to classify each students’ reasoning on a scale of fraction understanding as
detailed below-
• 0 procedural application of comparison (cross products, decimal
conversion, common denominator)
• 1 whole number reasoning (larger numbers make larger fractions)
• 2 unit fraction reasoning (larger denominators make smaller fractions)
• 3 gap reasoning (a larger gap between numerator and denominator makes
smaller fraction)
• 4 mastery
The control group received practice work and a physical manipulative (chosen to
determine whether technological bias might be an influence) while the treatment groups
received the same practice work to be completed using the treatment designed for their
assigned group. No additional instruction was administered for any of the groups. The
practice work included sets of the following types of fraction comparisons (an example is
included in Appendix A)-
• Proper fractions with a common difference between the numerator and
denominator
• Proper fractions with numerator and denominator of one fraction greater
than numerator and denominator of the other fraction
• Equivalent proper fractions with denominators less than or equal to twelve
• Equivalent proper fractions, one with a denominator less than twelve and
the other with a denominator greater than twelve

Effect of Manipulatives on Fraction Comparison 56
The practice work was designed as seven separate assignments, each with four
fraction comparison problems to be completed over a one to two-week period. The
students used their assigned tool (physical manipulative vs virtual manipulative) to
complete each worksheet designed to address the types of fraction comparisons
mentioned in the preceding paragraph. Upon completion of the series of worksheets, the
students completed the post-test.
After administering the posttest, an independent sample t-test was used to
establish whether the pretest scores or pretest classifications varied significantly between
the groups. Additionally, a paired samples t-test was performed to determine whether the
students in the entire sample exhibited significant improvement in test scores and/or
classification. ANOVA was used on the gain scores (differences of the pre-test and post-
test mean scores) of the groups to show any between-group differences. Additional
categorization of the pretest and post-test results assisted in identifying the presence of
various types of comparison (whole number thinking, gap reasoning, and denominator
focus) allowing for a separate analysis of the treatments and types of comparison, and
ANOVA was used to compare the differences of the classifications from before and after
administration of the treatments.
Threats to Internal Validity
Possible threats to internal validity include regression, selection,
compensatory/resentful demoralization, compensatory rivalry, and instrumentation.
Regression and selection were minimized by random assignment. Since this is a blind
study and students will receive completion grades, I do not anticipate either of the
compensatory items being a significant issue, but the nature of the treatment will be such

Effect of Manipulatives on Fraction Comparison 57
that any student can take advantage of it after the study is complete. Concerning
instrumentation, the exact questions were not the same on the pretest and post-test, but
the corresponding questions test the same ideas using the same restrictions on the
fractions in the question.
Threats to External Validity
Setting and the selection of participants are the most common threats to external
validity as they often limit the generalizability of a study. In this case, the subjects are
students in lower-division mathematics courses at a small regional university in the
Midwest. As such, results should not extend beyond the population in the study.
Research Questions
1) “How does the use of virtual fraction models affect students’ mental comparison
of the size of two proper fractions as reflected in performance on a test designed
to identify fraction comparison strategies?”
2) “How does the use of virtual fraction models affect students’ mental comparison
of the size of two proper fractions as reflected on a scale of fraction
understanding?”
Hypotheses
H0 1: There is no significant difference in the test score differences between
groups of test subjects using assigned manipulatives to complete their exercises.
H0 2: There is no significant difference in the classification differences on the
scale of fraction understanding between groups of test subjects using assigned
manipulatives.
Population and Sample

Effect of Manipulatives on Fraction Comparison 58
The study involved students from twelve mathematics classes at a regional
university located in a Midwestern state. The total enrollment of classes in the study was
approximately 350 students of which 211 ended up in the study. See Table 1 for the
manipulative assignments. An approximately equal number of each manipulative type
was assigned to each class section and manipulatives were distributed at random to all
students in the section. Pretest and posttest scores were collected and classified according
to the types of students’ approaches to comparing fractions as described earlier in this
section.
Table 1 Manipulative assignment
Manipulative Student Count
Physical Fraction Circle 28 Virtual Fraction Circle 29 Virtual Bar 28 Virtual Number Line 25 Virtual Circle/Bar 28 Virtual Circle/Number Line 26 Virtual Bar/Number Line 22 Virtual Circle/Bar/Number Line 25 Total 211
Instrumentation
Treatment
The researcher designed the specific treatment for this study using the Scratch
scripting language developed at Massachusetts Institute of Technology (MIT).
(Massachusetts Institute of Technology, 2019) Seven different levels of treatment were
investigated. In the first level, students used an electronic version of the circle model. The
intent was to account for any technology bias on the part of the students. The second

Effect of Manipulatives on Fraction Comparison 59
level used a bar model for the fraction comparison. In this case, did the linearity of the
bar model have the same effect as number line placement? The third group used a
number line. The number line eliminates the use of an area construction in the fraction
model. Also, groups were assigned combinations of the models to see if the interaction
between the models made any difference. The fourth group used both a circle model and
a bar model, the fifth group a circle model and number line, the sixth group a bar model
and number line and the seventh used all three models.
The treatment groups were intended to use their assigned manipulative in their
practice. In opening the tool, the student was presented with a screen that allowed them to
input two fractions for comparison (see Figure 9). Using the increment/decrement
symbols next to each numerator and denominator, they can enter any proper fraction with
a denominator up to twelve. At any point, the student can predict the relationship between
the two fractions as <, >, or = by clicking the symbol between the two fractions.
Figure 9 Initial screen for fraction manipulative tool
Clicking the circular symbol on the left creates circle models for the two fractions
(Figure 10).
Figure 10 Creation of circle models in virtual manipulative

Effect of Manipulatives on Fraction Comparison 60
Clicking the rectangular symbol on the left creates bar models for the two
fractions (Figure 11).
Figure 11 Creation of bar models in virtual manipulative
Finally, clicking on the arrow symbol draws two number lines, partitions them
based on the denominator and iterates across the line to the location of the fraction
(Figure 12).
Figure 12 Creation of a number line representation in virtual manipulative

Effect of Manipulatives on Fraction Comparison 61
The study did not require additional instruction since all of the participants had
received previous instruction on fractions and operations. All students received a set of
fraction comparison problems for practice. Those in the treatment groups used a version
of the virtual manipulative to model each problem before completing their answer.
Students in the control group worked the same set of problems, but they received a
commercial set of fraction circle models divided into halves, thirds, fourths, fifths, sixths,
eighths, ninths, tenths, and twelfths (see Figure 13).
Figure 13 Commercial circle model tool
Test Instrument
The Education Development Center initiated the Eliciting Mathematical
Misconceptions project (Education Development Center, 2014) to develop open-source
diagnostic assessments to specifically identify fraction related understanding. The project
produced a series of assessments on Representing Fractions, Comparing Two Fractions,
and Comparing Decimals. Each assessment is designed to identify specific
understandings related to fractions and decimal understanding. They have published their
testing material at em2.edc.org. (Education Development Center, 2014) For the fraction
comparison assessments, each test consists of seven questions where the student is asked

Effect of Manipulatives on Fraction Comparison 62
to select the appropriate comparison (<, >, or =) and explain their reasoning. Both the
Pretest and Posttest are included in Appendix A.
According to EDC (2015), “The EM2 diagnostic assessments help teachers
identify which of their students are likely to have specific types of rational number
misconceptions. Teachers can then use this information to inform their instruction.” (p.
Research Foundations) They based the development on two areas of research- learning
rational number concepts and formative assessment. The EM2 project used “diagnostic
cognitive modeling (DCM) methods described by Rupp, Templin, and Henson’s book on
diagnostic measurement (2010). While the longer-term goal of the project is to use more
sophisticated DCM analysis to empirically confirm the hypothesized structure of the
assessments, analyses conducted to date have focused on qualitative scoring conducted
by expert coders and item-level descriptive statistics (including the Kullback-Liebler
Information index).” (Clements, Buffington, & Tobey, 2013)
The EM2 research on rational number concepts closely tracks much of the work
cited in this proposal’s literature review. The complexity of the rational number system
can impede the mathematical development of students. The things that students learn,
understand, and internalize regarding whole numbers can lead to misconceptions about
rational numbers. “While whole number relationships are based on additive properties,
rational numbers have relationships based on multiplicative relations. Moreover, rational
numbers can be expressed in many different forms and can be designated by an infinite
number of equivalent representations.” (Education Development Center, 2014, p.
Research Foundations)

Effect of Manipulatives on Fraction Comparison 63
Further complicating matters is the use of two numerals in a fraction to represent
a single number (1/2 to represent the value “one half”). Students also have difficulty
distinguishing between the various meanings of a fraction, “referred to as ‘sub-
constructs’ of rational numbers such as part-whole relation (4 of 5 equal shares), quotient
interpretation (implied division, 2 sandwiches divided by 3 boys), measure (fixed
quantity on a number line), ratio (5 girls to 6 boys), and multiplicative operator
(scaling).” (EDC, 2015, p. Research Foundations)
EM2 designed the Comparing Two Fractions assessment to diagnose three of the
major misconceptions that students hold regarding fraction comparison. The first two
misconceptions arise from a lack of understanding of the fraction symbol which leads
students “to focus on either the numerators or denominators when ordering or comparing
common fractions.” (EDC, 2015, p. Research Foundations) When comparing two
fractions such as 2/3 to 3/5, they may notice that either/both the 3 and the 5 are greater
than the 2 and the 3 so, therefore, they would incorrectly conclude that 3/5 is greater than
2/3. In some cases, like comparing 2/3 to ½, they may obtain the correct answer using
flawed reasoning.
Consistently focusing solely on the denominator is considered a separate
misconception, misunderstanding the unit fraction. In this case, they rightly understand
that a larger denominator makes a smaller unit fraction, fifths are less than fourths, but
incorrectly extend that to an idea that 4/5 is less than ¾ because they are focused on the
denominator.
“Students may also have difficulty with fact that the two numbers composing a
common fraction--the numerator and denominator--are related through multiplication and

Effect of Manipulatives on Fraction Comparison 64
division, not addition” (EDC, 2015, p. Research Foundations). Students exhibiting this
last misconception, described earlier in this paper as gap reasoning, will focus on the
difference between the numerator and the denominator of the fraction and inaccurately
conclude that fractions such as ¾ and 5/6 are equivalent since the difference between
each numerator and denominator is one.
“To develop diagnostic assessments that will support teachers’ efforts to identify
student misconceptions, the EM2 Project used an iterative process that drew on the
expertise of many individuals to develop each assessment.” (EDC, 2015, p. Assessment
Research). They assured validity (assessment accurately measures what it is supposed to
measure) by employing a “principled and systematic approach” to each assessment
design which allowed them to establish content validity and examine the convergent
validity of each assessment. They used Susan Embretson’s cognitive design framework,
Embretson (1998), to develop each assessment. According to EDC (2015), components
of the framework include:
• clearly articulating what we want to accomplish with each
assessment,
• identifying relevant features in the “task domain” (i.e.,
what are we asking students to do,
• developing a cognitive model for the assessment (i.e.,
what are the different types of thinking in which we think
students will engage to answer the items),
• generating items according to the cognitive model, and
• evaluating the cognitive model. (p. Assessment Research)

Effect of Manipulatives on Fraction Comparison 65
The Education Development Center (2015) describes the Comparing Two
Fractions Assessment as follows-
The Comparing Two Fractions assessment is designed to elicit
information about several common misconceptions that students
have when comparing two fractions:
• Misconception 1 (M1): Viewing a Fraction as Two
Separate Numbers / Applying Whole-Number Thinking
• Misconception 2 (M2): An Over-Reliance on Unit
Fractions / A Focus on “Smaller Is Bigger”
• Misconception 3 (M3): Numerator and Denominator Have
an Additive Relationship / A Focus on the Difference from
One Whole (p. Assessment Research)
Generalizability
The sample selection of the original study combined with the demographics of the
participants limits the generalizability of the initial study. Also, the generalizability of the
study is limited due to the final sizes of the control and treatment groups. While the
original sample was large enough to accommodate at least 30 subjects in one control and
seven treatment groups, due to various factors, the actual group sizes ended up with 24 to
29 subjects.
Data Collection
The instructors administered the pretests with paper and pencil at the beginning of
the study. Each test consists of seven questions where the student is asked to select the
appropriate comparison (<, >, or =) and explain their reasoning. I collected the pretests

Effect of Manipulatives on Fraction Comparison 66
and consent forms immediately. After receiving their packet of practice problems, the
students were given a week to complete them. After collecting the practice problems, the
class instructors administered the posttest and turned the problems and tests into me.
Data Analysis
Selection of the variables, construction of the models, and a decision on the
appropriate statistical analysis preceded the sorting of the data. In addition, the project
required Institutional Review Board (IRB) approval from two institutions prior to
implementation.
Variables
The assignment to control and treatment groups is the independent variable. The
dependent variable for the first research question is the test score difference between
pretest and posttest. The difference in classification of comparison type as analyzed
pretest and posttest serves as the dependent variable for the second research question. The
main analysis used ANOVA on the test score and classification differences as the
dependent variables. Table 1 describes the two models for the research questions.
Table 2 Models for the research questions
Model Research Question Independent Variable(s)
Dependent Variable
Comparison Group
1 How does the use of virtual fraction models affect students’ ability to mentally compare fractions as reflected by performance on a test designed to identify fraction comparison strategies?
manipulative Difference in test scores
control
2 How does the use of virtual fraction models affect students’ ability to mentally compare fractions as reflected on a scale of fraction understanding?
manipulative Difference in classification
control
Effect of Manipulatives on Fraction Comparison 67
The choice of ANOVA on gain scores over ANCOVA using the pretest score as a
covariate for the posttest score is tied primarily to the difference in the research questions
that they answer. According to Smolkowski (2020) the ANOVA answers the question of
whether the group means change significantly over time (or test occurrence) while the
ANCOVA answers the question of whether an individual in one group starting at the
same level as an individual in another group can be expected to improve at the same rate.
Smolkowski (2020) also identifies three additional factors that favor the choice of
ANOVA over ANCOVA-
1. Covariate adjustment can bias results, especially in observational or quasi-
experimental studies.
2. “[T]he difference score is an unbiased estimate of true change.” (Rogosa, 1988, p.
180)
3. ANCOVA assumes pretest measurements are made without error.
The raw scores were used to calculate descriptive statistics, specifically mean and
standard deviation, for Pretest Scores, Posttest scores, test score differences, pretest
classification, posttest classification, and classification differences. A paired-samples t-
test showed overall improvement between test score means and classification means, but
additional analysis of group differences in an ANOVA failed to reveal significant impacts
on the students’ approaches to fraction comparison using the eight control/treatment
groups.
Ethics and Human Relations
To maintain privacy and confidentiality, participants in the study were randomly
assigned an identification number. Once the pretest and posttest scores were matched

Effect of Manipulatives on Fraction Comparison 68
with an identification number, the data was entered into spreadsheets with no facility to
match the summary data with individual students. All of the pretest and posttest items
were completed on paper so there is no online record to access with student names or
identifiers.

Effect of Manipulatives on Fraction Comparison 69
Chapter 4
Results
Two sets of results are described in this chapter. The first set came from a pilot
study that only used a control and three types of virtual manipulatives due to the limited
student population and the need to assign manipulatives randomly on a class-wide basis
rather than randomly assigned to individuals. This was necessitated by the fact that
students were doing the work in class, and it reduced the organizational load on the
participating instructors. The second set of results came from the actual study that used a
control group, three virtual manipulatives and the various combinations of those virtual
manipulatives.
Pilot Study
A pilot study was used to test the process for administration of the pretests,
exercises, and posttests as well as to preview the data analysis. In this case, three
instructors with six lower-division university classes participated. All classes received the
same instructions and tests and each class was randomly assigned a single manipulative
which they were to use in class over two weeks to complete the exercises. The total
number of students originally in the classes numbered around 250, but about two-thirds
of them had to be excluded for various reasons (mostly missing the permission form, one
of the tests or the set of exercises).
Sample Distributions
Graphs of the distributions of the pretest and posttest scores across the entire
sample show a left skew to the data (Appendix B). This is partially due to the extensive
use of algorithmic comparisons by a majority of the students which resulted in mostly

Effect of Manipulatives on Fraction Comparison 70
perfect scores on the tests for those individuals. The classifications have more of a right
skew. This is also likely due to the students using algorithmic calculations as they were
classified with a 0 since their understanding of fraction magnitudes could not be
determined. The differences between the test scores and the differences between the
classifications look more normal, although the middle peak is particularly high indicating
a significant number of students had similar differences in their scores/classifications
regardless of their initial pretest score/classification.
Descriptive Statistics
Table 3 lists descriptive statistics for the variables in the study: the mean and
standard deviation across the entire sample for Pretest Scores, Posttest Scores, Pre/Post-
test score difference, Pretest Classification, Posttest Classification, and Pre/Post-test
classification difference.
Table 3 Mean and Standard deviation for Pre/Post Test Scores, Pre/Post Classifications and Test/Classification Differences Variable N Mean Std Dev Pretest Score 96 5.63 1.81 Posttest Score 96 6.15 1.31 PreClassification 96 1.27 1.48 PostClassification 96 1.39 1.64 Test Difference 96 .52 1.65 Classification Difference 96 .11 1.83
Paired Sample t-tests on Pretest/Posttest and Preclassification/Post classification
A t-test indicated on average, students scored higher on the posttest (M=6.15,
SE=0.13) than they did on the pretest (M=5.62, SE=.19). This difference, -0.52, 95% CI
[-0.86,-.0.19], was significant t(95)= -3.08, p=.003 and represented a relatively small-
sized effect, d=.331. A t-test also indicated on average, students received a higher
classification score after the posttest (M=1.39, SE=.17) than they did after the pretest

Effect of Manipulatives on Fraction Comparison 71
(M=1.27, SE=.15). This difference, however, -.11, 95% CI [-.49, .26], was NOT
significant t(95)=-0.61, p=.542. Also, the Confidence Interval included 0. T-test results
are in Table 4.
Table 4 t-test Results: Comparison of Pretest and Posttest Mean Scores of Test and Classification Differences for sample Pretest Posttest
Category M SD M SD t-test df Test Score 5.63 1.81 6.15 1.31 -3.08** 95
Classification 1.27 1.48 1.39 1.64 .542 95
Note. M = mean. SD = standard deviation. Test Score Range 0-7, Classification Range 0-4.
**p < .01. ***p < .001.
ANOVA on Test Score Differences
The pretest/posttest score differences were approximately normally distributed
across the sample, but after running an ANOVA, the Levene Statistic, p=.014 indicated
variance between the groups which violates normality and calls into question using
ANOVA for further analysis. In this case, mean pretest/posttest score differences showed
no significant effect between manipulatives on Pre/Post-test score differences, F(3,
92)=.78, p=.507.
ANOVA on Pre/Post classification differences
An ANOVA on the classification differences yielded slightly different results.
The Levene Statistic to test homogeneity of variances showed no significant variance
between the groups as indicated by p=.811. Again, however, there was no significant
effect between manipulatives on Pre/Post-test classification differences, F(3,92)=.45, p
=.715. In this case, the result was expected since the t-test indicated no significant
difference between classifications in the overall sample.
Effect of Manipulatives on Fraction Comparison 72
The Study
The study consisted of administering the same sequence of
pretest/practice/posttest as the pilot to a different set of introductory university
mathematics courses. In this case, the sample size was a bit larger than the pilot, and the
out of class practice work allowed students in the same section to be assigned different
manipulatives. As a result, various combinations of individual manipulatives were
included in the study. The original sample consisted of about 350 students in seven
Precalculus with Integrated Review courses (approximately 30 students per section) and
five Math Content for Elementary Teachers courses (approximately 25 students per
section). Instructors read from a script to describe the study and the sequence of actions,
then administered the pretest. After completion of the pretest, students received a
randomly assigned packet of practice materials with a manipulative to complete over a
week. During that week, I sent messages encouraging the students to complete the
packets and emphasizing the need to perform the comparisons non-algorithmically. At
the end of the week, the instructor administered the posttest and turned the data over to
the researcher. In this case, I still ended up discarding a large percentage of the student
data due to missing paperwork or a lack of following directions (no explanation on the
practice work, evidence of algorithmic comparison on the practice work, pictures on the
practice not matching the assigned manipulative)
Sample Distributions
Graphs of the distributions for the pretest and posttest scores across the entire
sample show a left skew to the data similar to the pilot, especially in the posttest scores.
Unlike the pilot, the classifications have less skew but are still not very normally

Effect of Manipulatives on Fraction Comparison 73
distributed. In looking at the differences between the test scores and the differences
between the classifications the histograms appear much more normally distributed across
the sample. However, Kolmogorov-Smirnov and Shapiro Wilk tests for normality
indicate a lack thereof in the samples (See Appendix E). Transformations using logs,
roots, reciprocals, and powers did not fix the normality issues. However, “Norton (1951,
cit. Lindquist, 1953) analyzed the effect of distribution shape on robustness (considering
either that the distributions had the same shape in all the groups or a different shape in
each group) and found that, in general, F-test was quite robust, the effect being
negligible.” (Blanca, 2017) Histograms for the test differences and class differences
appear in Appendix C.
Descriptive Statistics
Table 5 lists descriptive statistics for the variables in the study: mean and standard
deviation across the entire sample for Pretest Scores, Posttest Scores, Pre/Post-test score
difference, Pretest Classification, Posttest Classification, and Pre/Post-test classification
difference.
Table 5 Mean and Standard deviation for Pre/Post Test Scores, Pre/Post Classifications and
Test/Classification Differences
Variable N Mean Std Dev Pretest Score 211 4.32 1.97 Posttest Score 211 5.49 1.77 PreClassification 211 2.18 1.18 PostClassification 211 2.93 1.28 Test Difference 211 1.17 2.09 Classification Difference 211 .75 1.4
t-test for Equality of Means on Pretest scores and classifications

Effect of Manipulatives on Fraction Comparison 74
An independent sample t-test indicated no significance concerning the equality of
means on the pretest scores (Table 6) or pretest classifications (Table 7) between the
treatment and control groups. Equality of variance between the treatment and control
groups showed no significance except for the comparison of treatment group 7 to the
control group with regard to classification.
Table 6 Independent sample t-test: Pretest comparison for each group to the control.
Group
Levene’s Test for Equality of Variance
t-test for Equality of Means
T df Sig.
(2-tailed) Mean
Difference Std. Error Difference
95% Confidence Interval of the
Difference
F Sig. Lower Upper 1 .307 .582 -.169 55 .866 -.0936 .5540 -1.204 1.0168 2 .016 .900 -.922 54 .361 -.5000 .5420 -1.587 .58748 3 .072 .790 -.372 51 .712 -.19429 .52259 -1.243 .85485 4 .023 .880 .419 54 .677 .21429 .51121 -.8106 1.2392 5 .007 .935 -1.28 52 .208 -.67582 .52967 -1.739 .38704 6 .702 .406 .708 48 .483 .37662 .53226 -.6936 1.4468 7 1.501 .226 1.454 51 .152 .72571 .49922 -.2765 1.72795
Table 7 Independent sample t-tetst: PreClassification comparisons for each group to the control
Group
Levene’s Test for Equality of Variance
t-test for Equality of Means
t df Sig.
(2-tailed) Mean
Difference Std. Error Difference
95% Confidence Interval of the
Difference
F Sig. Lower Upper 1 .117 .734 -.310 55 .758 -.10653 .34409 -.7961 .58305 2 .413 .523 -1.31 54 .196 -.44643 .34109 -1.130 .23742 3 .023 .880 -.575 51 .568 -.20929 .36384 -.9397 .52115 4 2.249 .139 -1.06 54 .295 -.33929 .32075 -.9824 .30378 5 .021 .885 -.65 52 .448 -.28159 .36825 -1.021 .45735 6 3.127 .083 -.927 48 .358 -.31656 .34131 -1.003 .36970

Effect of Manipulatives on Fraction Comparison 75
7 4.565 .037 -1.58 51 .121 -.50929 .32321 -1.158 .13959 Paired Sample t-tests on Differences in Test Scores and Classification
A t-test indicated on average, students scored higher on the posttest (M=5.4882,
SE=0.12) than they did on the pretest (M=4.3175, SE=.14). This difference, -1.17, 95%
CI [-1.973,-.527], was significant t(210)= -8.125, p=.000 and represented a medium-sized
effect, d=.63. A t-test also indicated on average, students received a higher classification
score after the posttest (M=2.9336, SE=.088) than they did after the pretest (M=2.1825,
SE=.081). This difference, -.75118, 95% CI [-.9412, -.5612], was significant t(210)=-
7.793, p=.000 and represented a medium-sized effect d=0.61. The results for the t-tests
are shown in Table 8.
Table 8 t-test Results: Comparison of Pretest and Posttest Mean Scores of Test Differences and Classification Differences for sample Pretest Posttest
Category M SD M SD t-test df Test Score 4.3175 1.97089 5.4882 1.76571 -8.125*** 210
Classification 2.1825 1.18166 2.9336 1.28001 -7.793*** 210
Note. M = mean. SD = standard deviation. Test Score Range 0-7, Classification Range 0-4.
**p < .01. ***p < .001.
ANOVA on Test Score Differences
While the pretest/posttest scores appeared somewhat normally distributed across
the sample, the normality of the sample was only partially maintained at the level of each
manipulative (see Appendix D). An ANOVA on the mean pretest/posttest score
differences showed no significant variance between the groups as indicated by Levene
Statistic with p=.813. However there was no significant effect between manipulatives on

Effect of Manipulatives on Fraction Comparison 76
Pre/Post-test score differences, F(7, 203)=1.236, p=.284. Therefore I cannot reject the
null hypothesis for the first research question:
H0 1: There is no significant difference in the test score differences between
groups of test subjects using assigned manipulatives.
Table 9 displays the complete results of the ANOVA on test score gains.
Table 9 ANOVA results for test score gains
Sum of Squares df Mean
Square F Sig
Between Groups 37.607 7 5.372 1.236 .284
Within Groups 882.250 203 4.346
Total 919.858 210
ANOVA on Pre/Post classification differences
While the classification differences appeared somewhat normally distributed
across the sample, they also only nominally maintained that normality in the
manipulative assignments. An ANOVA on the classification differences yielded similar
results. As with the test score differences, the Levene Statistic to test homogeneity of
variances showed no significant variance between the groups as indicated by p=.358.
Again, however, there was no significant effect between manipulatives on Pre/Post-test
classification differences, F(7,203)=1.524, p =.161. Therefore, I cannot reject the null
hypothesis from the second research question:
H0 2: There is no significant difference in the classification differences between
groups of test subjects using assigned manipulatives.
Table 10 displays the complete results for the ANOVA on classification gains.
Table 10 ANOVA results for classification gains.
Sum of Squares df Mean
Square F Sig

Effect of Manipulatives on Fraction Comparison 77
Between Groups 20.557 7 2.937 1.524 .161
Within Groups 391.130 203 1.927
Total 411.687 210

Effect of Manipulatives on Fraction Comparison 78
Chapter 5
Conclusion
Discussion
The pilot study conducted in the spring with a control group and the three primary
virtual manipulatives revealed potential issues with the approach to fraction comparison
used by a significant number of students. Whereas I had anticipated issues with cross
products, many more students used decimal conversion and common denominators
during both the pretest and the posttest administrations. This led to changes in the initial
script emphasizing the need to not change the fractions subject to comparison, and the
posting of supplementary instructions to each class in the main project on their Moodle
forum after the pretest specifically asking them to avoid the use of algorithmic
comparison strategies. Also, about two-thirds of the sample had to be discarded for
incomplete or missing paperwork (pretest, posttest, permission, practice material).
Students in the pilot performed the comparison practice activities in class over a
two-week period which provided some assurance that the activities were completed using
the appropriate tools, but this resulted in a significant impact on class time over the two
weeks. The study was redesigned so that the activities became part of a take-home packet
for the students to work daily over one week. In addition to saving class time, this also
allowed random assignment of the manipulatives within the class sections. Unfortunately,
it magnified a major flaw in the implementation of the study- students had little incentive
to properly complete the activities
Upon review of the practice activities for the main project, nearly half of the
samples were discarded for various reasons- practice items not completed, pictures on

Effect of Manipulatives on Fraction Comparison 79
practice did not match the tool assigned, use of algorithms to complete the practice, and
incomplete or missing paperwork (pretest, posttest, permission, practice material). Even
among the ones retained, it was not always possible to verify that students followed the
directions.
The manipulative tools have a counter which tracks their usage (Table 11), and
the numbers from those tools support the idea that the fraction practice was a possible
driver in student improvement as opposed to any tool. Students in the pilot study
averaged between two and five tool accesses per student while the students in the main
study only averaged between one and three tool accesses per student.
Table 11
Scratch Tool Accesses by Manipulative
Manipulative Total Times Accessed Virtual Circle 187* Virtual Bar 164* Virtual Number line 194* Pie/Bar 68 Pie/NL 73 Bar/NL 75 Pie/Bar/NL 85
*Used in both Pilot and Main project The results of the study were inconclusive with respect to differences between the
manipulatives. While the overall sample showed improvement in test score and
classification means as indicated by the paired samples T-test, and each manipulative
showed improvement in test score (Figure 14) and classification means (Figure 15), the
ANOVA analyses showed no significant difference in the improvement in scores from
the pretest to the post-test between manipulatives, and no significant difference in the
improvement in classification from pretest to posttest between the manipulatives. The
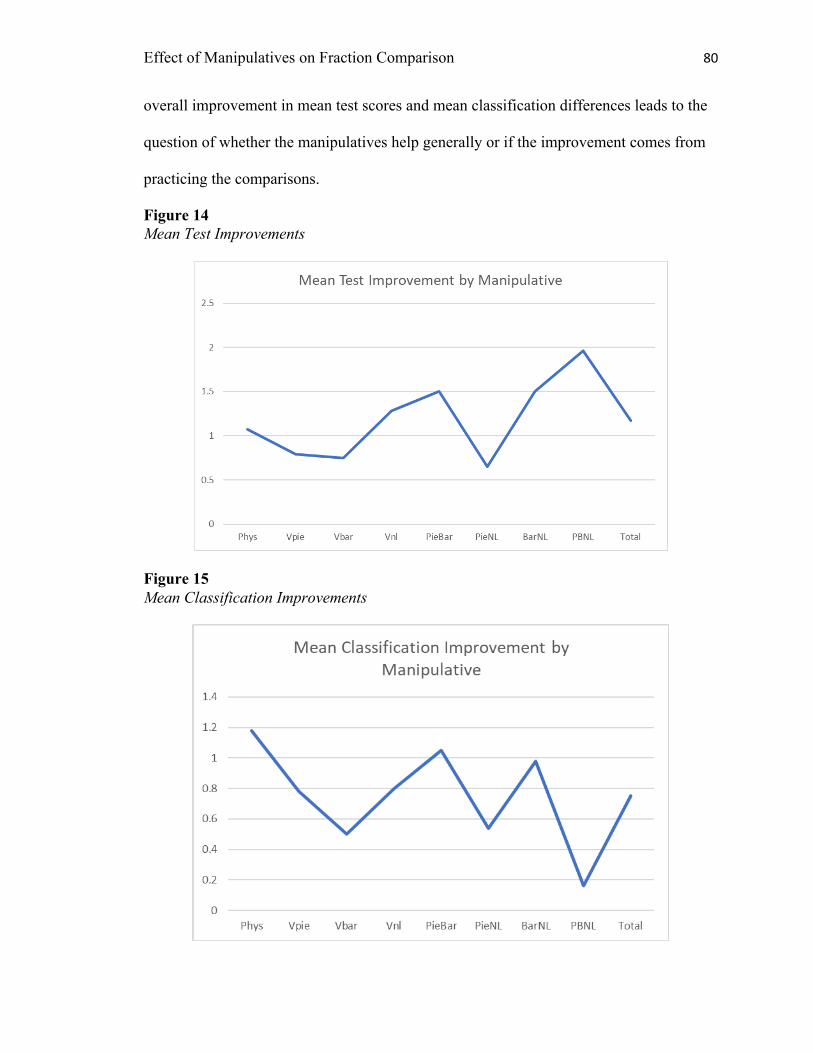
Effect of Manipulatives on Fraction Comparison 80
overall improvement in mean test scores and mean classification differences leads to the
question of whether the manipulatives help generally or if the improvement comes from
practicing the comparisons.
Figure 14 Mean Test Improvements
Figure 15 Mean Classification Improvements

Effect of Manipulatives on Fraction Comparison 81
Significance of the Study
While I did not see the expected differences between the manipulatives, I was
encouraged by the fact that all the manipulative combinations resulted in significant
improvements of the variables in the study. The overall improvements have potential
implications for mathematics education, mathematics instruction, professional
development, and research. In terms of education, if virtual manipulatives have no
significant drop off from physical manipulatives, they can be replicated more easily and
made more widely available at a potentially lower cost than physical manipulatives. In
addition, they do not have small pieces that can get lost (or swallowed).
With current events driving more online instruction, virtual manipulatives provide
a natural fit in a remote environment. They can be easily displayed in a remote classroom
session, and, while technology can be limiting for underserved populations, virtual
manipulatives can be easily distributed where technology is available.
Drawing on the same advantages, virtual manipulatives could become a staple of
professional development for teachers. More research on the impacts on early fraction
learners would be necessary before fully committing to this avenue as the group of
students in this study had all completed high school so they had significant experience
with both fractions and their operations. The methods used to teach them comparison
specifically are unclear although general practice is to teach common denominators
followed by cross products very early in the process.
Future Research

Effect of Manipulatives on Fraction Comparison 82
This leaves several unanswered questions. Most obvious, does working practice
problems with a manipulative improve performance over just practicing? If students had
properly used the manipulatives more consistently, would that have made a difference in
the analysis? Does a particular manipulative or combination of manipulatives have more
of an effect on any of the types of reasoning identified for this study? Do manipulatives
have more impact on fraction learners in elementary school than students that are
anywhere from five to eight years removed from initial fraction learning?
I think a better implementation of this study would be to create a control group
with no manipulative and conduct it at several different levels of education beginning
with elementary students learning about fraction comparison. It might help to have a
preconfigured lesson on comparison to accompany the treatment. I found elementary
schools to be very protective of their instructional time as I was unable to convince any
elementary administrators to assist with my study as it was originally designed. Having a
lesson ready to go with the study might convince them that the time will be well spent.
If I were to redesign this study for use at the university level, I would implement
it in the teacher education courses during the unit on fractions. Students would take the
pretest, and then participate in a lesson on fraction comparison which would include a
single homework assignment with 20-25 fraction comparison problems due the next day.
Because of the smaller student population, the study would have to span several
semesters; four semesters would yield around 150 students for an individual instructor,
which would necessitate reconfiguring the groups to the control (no manipulative), a
physical fraction circle and the three virtual items and not including the various
combinations of manipulatives.

Effect of Manipulatives on Fraction Comparison 83
References
Arnon, I., Nesher, P., & Nirenburg, R. (2001). Where do fractions encounter their
equivalents? International Journal of Computers for Mathematical Learning, 6,
167-214.
Bailey, D. H., Zhou, X., Zhang, Y., Cui, J., Fuchs, L. S., Jordan, N. C., . . . Siegler, R. S.
(2015). Development of fraction concepts and procedures in U.S. and Chinese
children. Journal of Experimental Psychology, 129, 68-83.
Behr, M. H., Post, T., & Lesh, R. (1993). Rational number: Toward a semantic analysis-
emphasis on the operator construct. Rational Numbers: An Integration of
Research, 13-47.
Behr, M., Post, T., Lesh, R., & Silver, E. (1983). Rational number concepts. (R. Lesh, &
M. Landau, Eds.) Acquisition of Mathematics Concepts and Processes, 91-125.
Blanca, M. J. (2017). Non-normal data: Is ANOVA still a valid option? Psicothema,
29(5), 552-557. Retrieved 03 26, 2020, from https://doi-
org.ezproxy.umsl.edu/10.7334/psicothema2016.383
Boaler, J. (2016). Mathematical Mindsets. San Francisco, CA: Jossey-Bass.
Bulut, M., Akcakin, H. U., Kaya, G., & Akcakin, V. (2014). The effects of Geogebra on
third grade primary students' academic achievement in fractions. Mathematics
Education, 11(2), 347-355.
Carraher, D. W. (1996). Learning about fractions. (L. Steffe, P. Nesher, P. Cobb, G.
Goldin, & B. Greer, Eds.) Theories of Mathematical Learning, 241-266.

Effect of Manipulatives on Fraction Comparison 84
Charalambos, C. Y. (2007). Developing and testing a scale for measuring students'
understanding of fractions. Proceedings of the 31st Conference of The
International Group for the Psychology of Mathematics Education, 105-112.
Charalambous, C. Y., & Pitta-Pantazi, D. (2007). Drawing on a theoretical model to
study students' understandings of fractions. Educational Studies in Mathematics,
64, 293-316. doi:10.1007/s10649-006-9036-2
Chesney, D. L., & McNeil, N. M. (2014). Activation of operational thinking during
arithmetic practice hinders learning and transfer. The Journal of Problem Solving,
7(1), 4.
Clark, D. M., & Roche, A. (2009, September). Students' fraction comparison strategies as
a window into robust understanding and possible pointers for instruction.
Educational Studies in Mathematics, 72(1), 127-138. Retrieved April 3, 2017
Clements, P., Buffington, P., & Tobey, C. (2013). Middle-grade students’ misconceptions
about the graphical representation of simple fractions: An assessment from the
Eliciting Mathematical Misconceptions Project (EM2). SREE Fall 2013
Conference. Washington, D.C.: Society for Research on Educational
Effectiveness.
Cockburn, A., & Littler, G. H. (2008). Mathematical Misconceptions. Los Angeles:
SAGE.
Cramer, K. A., Post, T. R., & delMas, R. C. (2002). Initial fraction learning by fourth-
and fifth-Grade students: A comparison of the effects of using commercial
curricula with the effects of using the Rational Number Project curriculum.
Journal of Research in Mathematics Education, 33(2), 111-144.

Effect of Manipulatives on Fraction Comparison 85
Davis, G. E., Hunting, R. P., & Pearn, C. (1993). What might a fraction mean to a child
and how would a teacher know? The Journal of Mathematical Behavior, 12, 63-
76.
Devlin, K. (2008, June). It ain't no repeated addition. Retrieved from Devlin's Angle:
https://www.maa.org/external_archive/devlin/devlin_06_08.html
Devlin, K. (2011, January). Devlin's Angle. Retrieved from Mathematical Association of
America: https://www.maa.org/external_archive/devlin/devlin_01_11.html
Durkin, K., & Rittle-Johnson, B. (2012). The effectiveness of using incorrect examples to
support learning about decimal magnitude. Learning and Instruction, 22(3), 206-
214.
Education Development Center. (2014, March). Eliciting Mathematical Misconceptions-
Comparing Two Fractions. Retrieved from Internet Archive Wayback Machine:
https://web.archive.org/web/20170909020926/http://em2.edc.org/portfolio/compa
ring-two-fractions
Embretson, S. E. (1998). A cognitive design system approach to generating valid tests:
Application to abstract reasoning. Psychological Methods, 3(3), 380-396.
Fagan, E. R., Tobey, C. R., & Brodesky, A. R. (2016). Targeting instruction with
formative assessment probes. Teaching Children Mathematics, 23(3), 146-157.
Fazio, L. K., Kennedy, C. A., & Siegler, R. S. (2016). Improving children's knowledge of
fraction magnitudes. (B. De Smedt, Ed.) PLoS ONE, 11(10), 1-14.
Gearhart, M., Saxe, G. B., Seltzer, M., Schlackman, J., Ching, C. C., Nasir, N., . . . Sloan,
T. F. (1999). Opportunities to learn fractions in elementary mathematics
classrooms. Journal for Research in Mathematics Education, 30(3), 286-315.

Effect of Manipulatives on Fraction Comparison 86
Geary, D. C. (2006). Development of mathematical understanding. In W. Damon, D.
Kuhn, & R. S. Siegler (Eds.), Handbook of child psychology: Cognition,
perception, and language (Vol. 2, pp. 777-810). Hoboken, NH: Wiley.
Gelman, R., & Williams, E. (1998). Enabling constraints for cognitive development and
learning: Domain specificity and epigenesis. In W. Damon, D. Kuhn, & R. S.
Siegler (Eds.), Handbook of child psychology. New York: Wiley.
Gould, P. (2013). Australia's next top fraction model. APMC, 18(3), 5-12.
Hannula, M. S. (2003). Locating fractions on a number line. Proceedings of the 27th
Annual Conference of the International Group for the Psychology of Mathematics
Education (pp. 3-24). Honolulu: PME.
Hewitt, D. (2012). Young students learning formal algebraic notation and solving linear
equations: Are commonly experienced difficulties avoidable? Educational Studies
in Mathematics, 81(2), 139-159.
Hunting, R. P. (1986). Rachel's schemes for constructing fraction knowledge.
Educational Studies in Mathematics, 17, 49-66. Retrieved April 3, 2017, from
http://www.jstor.org/stable/3482191
Jigyel, K., & Afamasaga-Fuata'i, K. (2007). Students' conceptions of models of fractions
and equivalence. AMT, 63(4), 17-25.
Kena, G. H.-G.-F. (2016). The Condition of Education 2016 (NCES 2016-144).
Washington, D.C.: U.S. Department of Education, National Center for Education
Statistics.

Effect of Manipulatives on Fraction Comparison 87
Kerr, D. (2014). Idenitfying common mathematical misconceptions from actions in
educational video games. CRESST Report 838. National Center for Research on
Evaluation, Standards, and Student Testing, (CRESST).
Kieren, T. E. (1976). On the mathematical, cognitive, and instructional foundations of
rational numbers. In R. Lesh (Ed.), Number and Measurement: Papers from a
Research Workshop ERIC/SMEAC, (pp. 101-144). Columbus, OH.
Kilpatrick, J., Swafford, J., & Findell, B. (Eds.). (2001). Adding it up: Helping children
learn mathematics. Washington, DC: National Academy Press.
Lewis, K. E., & Lynn, D. (2018). An insider's view of a mathematics learning disability:
compensating to gain access to fractions. Investigations in Mathematics Learning,
NA. doi:10.1080/19477503.2018.1444927
Li, X., Ding, M., Capraro, M. M., & Capraro, R. M. (2008). Sources of differences in
children's understandings of mathematical equality: Comparative analysis of
teacher guides and student texts in China and the United States. Cognition and
Instruction, 26(2), 195-217.
Malet, A. (2006). Renaissance notions of number and magnitude. Historia Mathematica,
63-81.
Manfreda, K. V., & Hodnik Cadez, T. (2012). Analysis of factors influencing the
understanding of the concept of infinity. Educational Studies in Mathematics,
80(3), 389-412.
Massachusetts Institute of Technology. (2019, January 8). About Scratch. Retrieved from
Scratch: https://scratch.mit.edu/about

Effect of Manipulatives on Fraction Comparison 88
Mazzocco, M., Murphy, M., Brown, E. C., Rinne, L., & Herold, K. H. (2013). Persistent
consequences of atypical early number concepts. Frontiers in Psychology, 4, 486.
McCloskey, A. V., & Norton, A. H. (2009). Using Steffe's advanced fraction schemes.
Mathematics Teaching in the Middle School, 15(1), 44-50.
McNeary, W. W. (2012). Places and spaces: A study of the use of the number line as a
tool for implementation of the Common Core standards. Masters Dissertation.
Cape Girardeau, MO: Southeast Missouri State University.
McNeil, N. M. (2014). A change-resistant account of children's difficulties understanding
mathematical equivalence. Child Development Perspectives, 8(1), 42-47.
Mills, J. (2011). Body fractions: A physical approach to fraction learning. APMC, 16(2),
17-22.
Missouri DESE - NAEP. (2019, October 14). Retrieved from Missouri Department of
Elementary and Secondary Education: https://dese.mo.gov/college-career-
readiness/assessment/naep#mini-panel-naep-assessment3
Moss, J., & Case, R. (1999). Developing children's understanding of rational numbers: A
new model and an experimental curriculum. Journal for Research in Mathematics
Education, 30, 127-147.
Neshar, P. (1987). Towards an instructional theory: the role of student's misconceptions.
For the Learning of Mathematics, 7(3), 33-40.
Norton, A. H., & McCloskey, A. V. (2008). Modeling students' mathematics using
Steffe's fraction schemes. Teaching Children Mathematics, 2008(8), 48-54.

Effect of Manipulatives on Fraction Comparison 89
Norton, A., Wilkins, J. L., & Xu, C. z. (2018). Brief report: a progression of fraction
schemes common to Chinese and US students. Journal of Research in
Mathematics Education, 49(2), 210-226.
Olive, J., Makar, K., Hoyos, V., Kor, L. K., Kosheleva, O., & Straber, R. (2010).
Learning and assessing mathematics with and through digital technologies. In
Mathematics Education and Technology- Rethinking the Terrain (pp. 133-177).
ICMI. doi:10.1007/978-1-4419-0146-0
Peck, D. M., & Jencks, S. M. (1981, November). Conceptual issues in the teaching of
fractions. Journal for Research in Mathematics Education, 12(5), 339-348.
Retrieved April 3, 2017
Post, T., Behr, M. J., & Lesh, R. (1986). Research-based observations about children's
learning of rational number concepts. Focus on Learning Problems in
Mathematics, 8(1), 39-48.
Post, T., Wachsmuth, I., Lesh, R., & Behr, M. (1986). Order and equivalence of rational
numbers: A cognitive analysis. Journal for Research in Mathematics Education,
16(1), 18-36.
Reimer, K., & Moyer, P. S. (2005). Third-graders learn about fractions using virtual
manipulatives: a classroom study. The Journal of Computers in Mathematics and
Science Teaching, 24(1), 5-25.
Riccomini, P. J. (2005). Identification and Remediation of Systematic Error Patterns in
Subtraction. Learning Disability Quarterly, 28(3), 233.

Effect of Manipulatives on Fraction Comparison 90
Rogosa, D. (1988). Myths about longitudinal research. (K. W. Schaie, R. T. Campbell,
W. M. Meredith, & S. Rawlings, Eds.) Methodological issues in aging research,
171-209.
Ross, J. A., & Bruce, C. D. (2009, September 15). Student achievement effects of
technology-supported remediation of understanding of fractions. International
Journal of Mathematics Education in Science and Technology, 40(6), 713-727.
doi:10.1080/00207390902971999
Siegler, R. S., Thompson, C. A., & Schneider, M. (2011). An integrated theory of whole
number and fractions development. Cognitive Psychology, 62, 273-296.
doi:10.1016/j.cogpsych.2011.03.001
Siegler, R., Carpenter, T., Fennell, F., Geary, D. L., Okamoto, Y., Thompson, L., & &
Wray, J. (2010). Developing effective fractions instruction for kindergarten
through 8th grade: A practice guide (NCEE #2010-4039). Washington, D.C.:
National Center for Education Evaluation and Regional Assistance, Institute of
Education Sciences, U.S. Department of Education. Retrieved from
http://ies.ed.gov/ncee/wwc/publications/practiceguides/
Simon, M. A., Placa, N., Avitzur, A., & Kara, M. (2018). Promoting a concept of
fraction-as-measure: A study of the Learning Through Activity research program.
Journal of Mathematical Behavior, 52, 122-133.
Smith, J. P., diSessa, A. A., & Roschelle, J. (1993). Misconceptions reconceived: a
constructivist analysis of knowledge in transition. The Journal of Learning
Sciences, 3(2), 115-163.
Effect of Manipulatives on Fraction Comparison 91
Smolkowski, K. (2020, April 17). Gain Score Analysis. Retrieved from Oregon Research
Institute: https:/;/homes.ori.org//keiths/Tips/Stats_GainScores.html
Stafylidou, S., & Vosniadou, S. (2004). The development of students' understanding of
the numerical value of fractions. Learning and Instruction, 14, 503-518.
doi:10.1016/j.learninstruc.2004.06.015
Steffe, L. P. (2001). A new hypothesis concerning children's fractional knowledge.
Journal of Mathematical Behavior, 20(3), 267-307.
Steffe, L., & Olive, J. (2002). Design and use of computer tools for interactive
mathematical activity (TIMA). Journal of Educational Computing Research,
27(1&2), 55-76.
Steinle, V., & Stacey, K. (2003). Grade-related Trends in the Prevalence and Persistence
of Decimal Misconceptions. International Group for the Psychology of
Mathematics Education.
Steinle, V., & Stacey, K. (2004). Persistence of Decimal Misconceptions and Readiness
to Move to Expertise. International Group for the Psychology of Mathematics
Education.
Stephens, A. C. (2006). Equivalence and relational thinking: Preservice elementary
teachers' awareness of opportunities and misconceptions. Journal of Mathematics
Teacher Education, 9(3), 249-278.
Taubman, A. A. (2009). Threshold Resistance: The Extraordinary Career of a Luxury
Retailing Pioneer. New York: Harper Collins.
Torbeyns, J. S. (2015). Bridging the gap: Fraction understanding is central to
mathematics. Learning and Instruction, 37, 5-13.

Effect of Manipulatives on Fraction Comparison 92
Tunc-Pekkan, Z. (2015). An analysis of elementary school children's fractional
knowledge depicted with circle, rectangle, and number line representations.
Educational Studies in Math, 89(3), 419-441.
Usiskin, Z. P. (1979, January). The Future of Fractions. Arithmetic Teacher, 26, 18-20.
Vamakoussi, X., & Vosniadou, S. (2010). How many decimals are there between two
fractions? Aspects of secondary school students' understanding of rational
numbers and their notation. Cognition and Instruction, 28, 181-209.
Van Hoof, J., Janssen, R., Vaerschaffel, L., & Van Dooren, W. (2015). Inhibiting natural
knowledge in fourth graders: towards a comprehensive test instrument. ZDM
Mathematics Education, 47, 849-857. doi:10.1007/s11858-014-0650-7
Vosniadou, S., Vamvakoussi, X., & Skopeliti, I. (2008). The framework theory approach
to conceptual change. In S. Vosniadou (Ed.), International handbook of research
on conceptual change (pp. 3-34). Mahwah, NJ: Erlbaum.
Westenskow, A., & Moyer-Packenham, P. (2015). Using an iceberg intervention model
to understand equivalent fraction learning when students with mathematical
learning difficulties use different manipulatives. International Journal of
Technology in Mathematics Education, 23(2), 45-62. doi:10.1564/tme_v23.2.01
Woodward, J. (2004). Mathematics education in the United States: Past to present.
Journal of Learning Disabilities, 37(1), 16-31.
Yopp, D. A., Burroughs, E. A., & Lindaman, B. J. (2011). Why it is important for in-
service elementary mathematics teachers to understand the equality .999...=1.
Journal of Mathematical Behavior, 30(4), 304.

Effect of Manipulatives on Fraction Comparison 93
Zazkis, R. (1999). Divisors and Quotients Acknowledging Polysemy. For the Learning of
Mathematics, 18(3), 27-30.

Effect of Manipulatives on Fraction Comparison 94
Appendix A
EDC Instruments and Analysis; Sample Practice Item Figure A1
EDC Pretest

Effect of Manipulatives on Fraction Comparison 95

Effect of Manipulatives on Fraction Comparison 96
Figure A2
EDC Posttest

Effect of Manipulatives on Fraction Comparison 97

Effect of Manipulatives on Fraction Comparison 98
Figure A3 EDC Test Scoring Guide

Effect of Manipulatives on Fraction Comparison 99
Figure A4
Sample Daily Problem Sheet
Day 1 Problems Make a prediction about the comparison, then model the two fractions using the manipulative at the following link:
http://bit.ly/PBarNL
Problem Explanation
Prediction
Comparison 𝟑𝟓 𝟓
𝟖
Prediction
Comparison 𝟑𝟒 𝟐
𝟑
Prediction
Comparison 𝟏𝟑 𝟑
𝟓
Prediction
Comparison 𝟐𝟑 𝟔
𝟗

Effect of Manipulatives on Fraction Comparison 100
Appendix B
Pilot Study – Histograms

Effect of Manipulatives on Fraction Comparison 101
Appendix C
Project Histograms and Boxplots

Effect of Manipulatives on Fraction Comparison 102
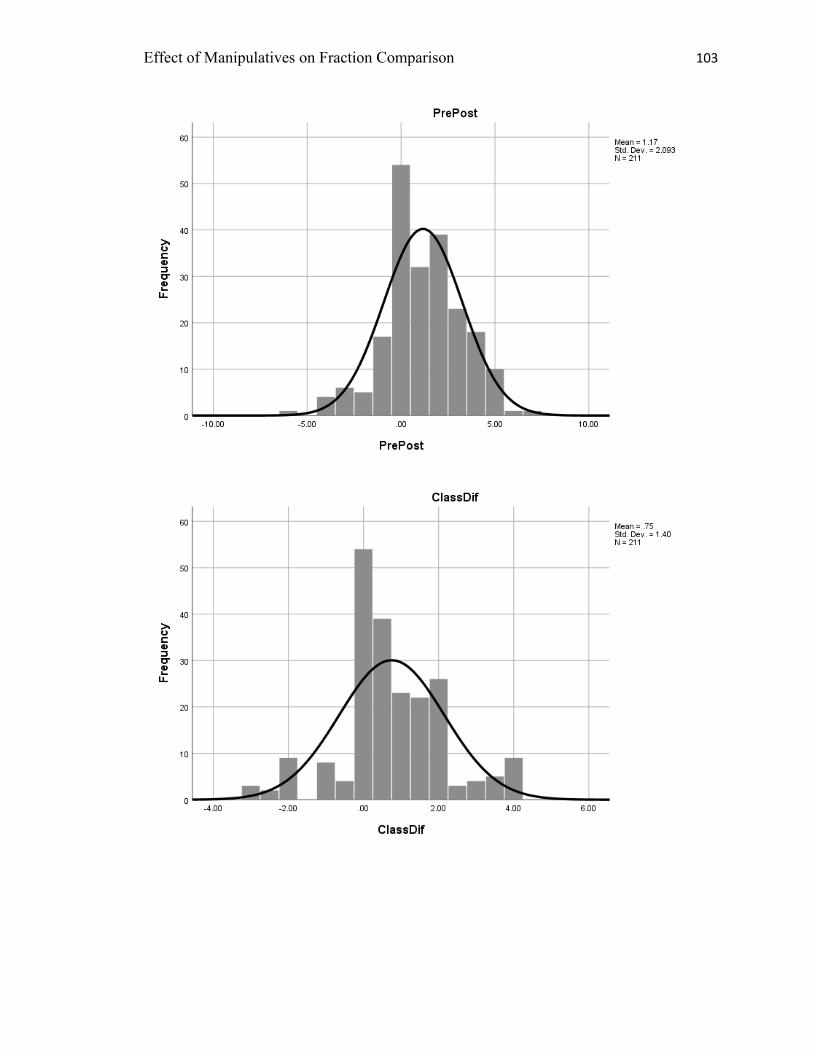
Effect of Manipulatives on Fraction Comparison 103

Effect of Manipulatives on Fraction Comparison 104

Effect of Manipulatives on Fraction Comparison 105
Appendix D
Histograms by Manipulative
Pre/Post Test Score Differences by Manipulative

Effect of Manipulatives on Fraction Comparison 106

Effect of Manipulatives on Fraction Comparison 107
Pre/Post Classification Differences by Manipulative

Effect of Manipulatives on Fraction Comparison 108

Effect of Manipulatives on Fraction Comparison 109
Appendix E
Assumptions for t-tests and ANOVA
Assumption 1: Independence
Based on the research design, the data was randomly and independently sampled
so the assumption is met.
Assumption 2: Scale of Measurement
All of the variables used for the t-tests and ANOVAs have scaled values.
Test Independent Variable
Dependent Variable Scale
T-test Equality of Means between manipulatives, Pretest
Manipulative Pretest score 0-7
T-test Equality of Means between manipulatives, PreClassification
Manipulative PreClassification 0-4
T-test, test score difference
Pretest Score Posttest Score -7 to 7
T-test, classification difference
PreClassification PostCassification -4 to 4
ANOVA on test score difference
Manipulative Test score difference -7 to 7
ANOVA on classification difference
Manipulative Classification difference -4 to 4
Assumption 3: Normality
While the histograms and QQ plots for score and classification differences appear
fairly normal as do the histograms and QQ plots for their residuals, both the K-S and
Shapiro-Wilk tests for normality indicate otherwise.
Variable Skewness (range -1 to 1)
Kurtosis (range -1 to 1)
K-S Sig Shapiro-Wilk
Sig
Posttest score -1.198 .580 .249 .000 .811 .000 Post Classification
-1.173 .230 .240 .000 .800 .000
Test score difference
-.175 .425 .132 .000 .967 .000

Effect of Manipulatives on Fraction Comparison 110
Residual for test score difference
-.032 .336 .052 .200 .992 .317
Classification difference
.080 .685 .173 .000 .947 .000
Residual for classification difference
.143 .544 .081 .000 .974 .001
Histograms for Residuals (other histograms included in Appendix C)
QQ Plots for Post Test/Classification
QQ Plots for Test/Classification Differences

Effect of Manipulatives on Fraction Comparison 111
QQ Plots for Residuals of Test/Classification Differences
Assumption 4: Homogeneity/Equality of Variance (Independent Sample t-test and
ANOVA)

Effect of Manipulatives on Fraction Comparison 112
The Levene Statistic for the independent sample t-test on Pretest/Postest Scores
shows no significant variance, but for the Preclassification/post-classification pair in the
independent sample t-test shows significant variance. The Levene statistic for the two
ANOVA tests shows no significant variance.
Test Levene Statistic Significance Independent Sample t-test on Pretest/Posttest scores
1.013 .423
Independent Sample t-test on Pre/Post classifications
2.177 .038
ANOVA on test score differences
.527 .813
ANOVA on classification differences
1.110 .358