the effect of tuition fees on university applications and …ftp.iza.org/dp8364.pdf · the effect...
TRANSCRIPT
DI
SC
US
SI
ON
P
AP
ER
S
ER
IE
S
Forschungsinstitut zur Zukunft der ArbeitInstitute for the Study of Labor
The Effect of Tuition Fees on University Applications and Attendance: Evidence from the UK
IZA DP No. 8364
August 2014
Filipa Sá
The Effect of Tuition Fees on University
Applications and Attendance: Evidence from the UK
Filipa Sá King’s College London
and IZA
Discussion Paper No. 8364 August 2014
IZA
P.O. Box 7240 53072 Bonn
Germany
Phone: +49-228-3894-0 Fax: +49-228-3894-180
E-mail: [email protected]
Any opinions expressed here are those of the author(s) and not those of IZA. Research published in this series may include views on policy, but the institute itself takes no institutional policy positions. The IZA research network is committed to the IZA Guiding Principles of Research Integrity. The Institute for the Study of Labor (IZA) in Bonn is a local and virtual international research center and a place of communication between science, politics and business. IZA is an independent nonprofit organization supported by Deutsche Post Foundation. The center is associated with the University of Bonn and offers a stimulating research environment through its international network, workshops and conferences, data service, project support, research visits and doctoral program. IZA engages in (i) original and internationally competitive research in all fields of labor economics, (ii) development of policy concepts, and (iii) dissemination of research results and concepts to the interested public. IZA Discussion Papers often represent preliminary work and are circulated to encourage discussion. Citation of such a paper should account for its provisional character. A revised version may be available directly from the author.

IZA Discussion Paper No. 8364 August 2014
ABSTRACT
The Effect of Tuition Fees on University Applications: Evidence from the UK*
This article uses variation in university tuition fees over time and across countries in the UK to examine the effect of fees on university applications and attendance. It focuses on two policy changes: the removal of upfront tuition fees in Scotland in 2001 and the increase in fees in England in 2012. It finds that applications decrease in response to higher fees, especially for courses with lower salaries and lower employment rates after graduation. Attendance also falls in response to higher fees, but there is no evidence of a larger reduction for students from disadvantaged backgrounds. JEL Classification: I21, J24 Keywords: tuition fees, university applications, university attendance Corresponding author: Filipa Sá Department of Management King’s College London Franklin Wilkins Building 150 Stamford Street London SE1 9NH United Kingdom E-mail: [email protected]
* I thank Suzanne Campbell at the Universities and Colleges Admissions Service (UCAS) and Rebecca Hobbs at the Higher Education Statistics Agency (HESA) for providing the data used in this study. Financial support from a British Academy/Leverhulme Small Research Grant (reference SG122737) is gratefully acknowledged.
1 Introduction
The cost of a degree is an important determinant of the decision to apply to university. In the
UK, there have been signi�cant changes in tuition fee policy in recent years. Before 1998, the cost
of a university degree was entirely supported by the government. Since then, students pay part of
the cost of higher education, with some signi�cant variation in the level of tuition fees across UK
countries.
This article uses variation in tuition fees over time and across countries in the UK to study the
e¤ect of fees on the demand for higher education, university attendance and course choice. I focus on
two policy changes: the removal of upfront fees in Scotland in 2001 (2001 reform) and the increase
in fees in England in 2012 (2012 reform). The 2001 reform replaced upfront fees of $1; 000 per year
with an endowment scheme in which students pay a total of $2; 000 after graduation. This applied
only to Scottish-domiciled students attending university in Scotland. The 2012 reform increased
fees from $3; 375 to a maximum of $9; 000 per year for students at English universities.
Using di¤erence-in-di¤erences estimation, I �nd that the 2001 reform increased applications by
21 log points, while the 2012 reform reduced applications by 25 log points. The results imply an
elasticity of applications with respect to fees between �0:14 and �0:26. To test whether the e¤ect
of fees on applications varies by course, I merge data on applications with information on average
salaries and employment rates six months after graduation, disaggregated by subject, institution
and gender. I �nd that applications to courses that o¤er weaker employment prospects are more
sensitive to changes in tuition fees. This suggests that applicants take expected future earnings
and employment prospects into account when making their course choices.
In addition to applications, I look at the e¤ect of tuition fees on the number of �rst-year
undergraduate students. I �nd that the increase in fees in 2012 reduced the number of �rst-year
undergraduates by 33 log points. This e¤ect is smaller for non-white students and for students
from local authorities with low rates of participation in higher education. This suggests that credit
constraints do not seem to play an important role in the decision to go to university. There are two
factors that may explain this �nding. First, the vast majority of students �nance their studies with
government-provided student loans. Second, universities that charge higher fees need to have access
agreements approved by the O¢ ce for Fair Access (OFFA) outlining their measures to attract and
2

support students from disadvantaged backgrounds.
This article contributes to the literature on the e¤ect of schooling costs on schooling outcomes.
The identi�cation challenge in this literature is the fact that unobservable individual characteristics
a¤ect schooling outcomes. Therefore, a simple regression of schooling outcomes on schooling costs
would su¤er from an omitted variable bias.
A number of studies use quasi-experimental methods to get around this issue. Deming and
Dynarski (2009) review this literature for the US and �nd that most studies provide evidence that
reducing college costs can increase college entry and persistence. The evidence for other countries
also points to a negative e¤ect of tuition fees on enrollment. Neill (2009) uses the political party in
power in Canadian provinces as an instrument for provincial tuition fees and �nds a negative e¤ect
of fees on enrollment. Hübner (2012) uses the introduction of tuition fees in some German states
in 2007 to design a natural experiment to identify the e¤ect of fees on enrollment. His results also
suggest that tuition fees reduce enrollment, by a similar magnitude to the e¤ects identi�ed with US
data. Nielsen et al (2010) look at the e¤ect of a reform that increased the amount of study grants
in Denmark in 1988. Using variation in the level of educational grants as a function of parental
income, the authors �nd that the increase in grants had a positive e¤ect on college enrollment.
Garibaldi et al (2012) look at the e¤ect of tuition fees on the probability of late graduation, i.e.,
completing a degree in more than four years, for students at Bocconi University in Italy. They
adopt a regression discontinuity design to exploit variation in the level of tuition paid by students
as a function of parental income. Their �ndings suggest that an increase in tuition fees reduces the
probability of late graduation.
For the UK, Dearden et al (2011) use data on university participation from the UK Labour
Force Survey from 1992 to 2007 to estimate a �xed-e¤ects regression of participation rates on the
level of tuition fees and grants. They �nd that fees have a signi�cant adverse e¤ect on university
participation, while maintenance grants have a positive impact. Crowford and Dearden (2010)
study the e¤ect of the introduction of higher tuition fees in England in academic year 2006/07
on university participation. They use di¤erence-in-di¤erences estimation, comparing attendance
rates of English students living near Scotland and English students living far from Scotland. The
intuition for this identi�cation strategy is that English students attending university in Scotland
still have to pay fees, but at a lower level than if they were attending university in England. The
3

results suggest that the reform did not have a signi�cant e¤ect on participation. However, the
authors attach little weight to these �nding because participation trends prior to the reform appear
di¤erent for the two groups of students.
Some policy reports use descriptive statistics to examine the e¤ect of the most recent increase in
fees in England in 2012 on university applications. The report of the Independent Commission on
Fees (ICOF, 2012) shows that the number of applicants decreased signi�cantly in 2012 compared
with 2010. This reduction was mainly seen in England, with applications broadly constant in
Scotland. The reduction in applications a¤ected students from all backgrounds, but was larger for
students from local areas with higher rates of participation in higher education. Similar �ndings
are reported in UCAS (2012).
To my knowledge, this article is the �rst to evaluate the e¤ect of the removal of upfront fees in
Scotland in 2001 and the increase in fees in England in 2012 using quasi-experimental methods. It
also adds to the existing academic literature by looking at applications as well as attendance and by
looking at di¤erences across courses with di¤erent employment prospects and across demographic
groups.
The rest of the article is organised as follows. The next section presents the institutional
framework, summarising the main changes in tuition fees across the UK and over time. Section 3
presents a theoretical framework which provides clear predictions about the e¤ect of tuition fees on
the decision to go to university for students with di¤erent levels of access to credit and for courses
that lead to di¤erent salaries after graduation. Section 4 discusses the empirical methodology.
Section 5 discusses the data and presents descriptive statistics. Empirical results are presented and
discussed in Section 6 and Section 7 concludes.
2 Institutional Framework
University tuition fees were �rst introduced in all UK countries in September 1998. Fees were set at
$1; 000 per year, with the expectation that means testing would imply that one third of students
would not pay any fees.1 Since then, there have been several changes in the level of tuition fees, with
1Students were exempt from fees if their families earned less than $23; 000 per year and were charged reducedfees on a sliding scale if their families earned between $23; 000 and $35; 000. Students whose families earned morethan $35; 000 were charged full fees.
4

important variation across countries. In 1999, a devolution government was established in Scotland.
The new Scottish Parliament received separate legislative powers in many areas, including tuition
fees. From its creation, the Scottish Parliament adopted a distinctively di¤erent policy regarding
tuition fees from that followed in the rest of the UK.
Figure 1 shows a time line with the evolution of tuition fees in England and Scotland. In
Scotland, tuition fees were replaced with an endowment scheme in 2001. Instead of paying fees
upfront, Scottish-domiciled students were required to pay a total of $2; 000 after graduation if
their annual earnings exceeded $10; 000. In 2007, the Scottish government went one step further
and eliminated fees altogether for Scottish-domiciled students graduating on or after April 2007.
Students at Scottish universities qualify for no tuition only if they have been living in Scotland for
at least three years by the time they start university or if they have moved to Scotland for a reason
other than study.
England has also made changes to tuition fees since their �rst introduction in 1998. In 2004, it
was announced that, from academic year 2006/07, upfront tuition fees of $1; 000 per year would
be replaced with variable fees to be paid after graduation if annual earnings exceeded $15; 000.
Universities had discretion over the amount of fees they charged, up to a maximum of $3; 000
per year.2 In 2010, the government announced that this cap would be raised to $9; 000 per year
for students entering university in academic year 2012/13. This announcement generated intense
discontent among students and led to a number of public demonstrations.
Although universities have discretion over the amount of fees they charge, there is evidence
that most universities in England have increased their fees substantially in response to increases
in the maximum tuition limit. According to Universities UK (2009), almost all higher education
institutions in England chose to set fees at the $3; 000 cap from 2006/07. Regarding the most
recent reform, evidence from HEFCE (2013) shows that, in 2012/13, 42 of 124 higher education
institutions in England were charging the maximum level of fees of $9; 000 and no institutions were
charging less than $6; 000. The sector average fee was $8; 040 in 2012/13 and $8; 507 in 2013/14.
In Wales, the cap on tuition fees was also increased to $9; 000 in 2012, but the Welsh Assembly
pays fee costs above $3; 465 per year for Welsh students studying at any UK university. In Northern
Ireland, fees were capped at $3; 465 in 2012 for students from Northern Ireland, to rise in line with
2This limit increased slightly every year in line with in�ation and was at $3; 375 in 2011/12.
5

in�ation in subsequent years. Fees for students from outside Northern Ireland were not capped,
but were not expected to exceed $9; 000.
This article uses variation in tuition fees in Scotland and England to identify the causal e¤ect
of fees on schooling decisions. It focuses on two reforms: the replacement of tuition fees with an
endowment scheme in Scotland in 2001 (2001 reform) and the increase in the cap on tuition fees in
England in 2012 (2012 reform). The 2006 reform in England is not analysed because it would be
di¢ cult to separately identify its e¤ect from the removal of fees in Scotland in 2007.
Both reforms analysed in this article introduced signi�cant changes in the amount of tuition
fees paid by a¤ected students. From the introduction of upfront fees in 1998 until the 2001 reform,
Scottish students had to pay $1; 000 per year, making the tuition cost of a degree equal to $3; 000.3
After the 2001 reform, the tuition cost of a degree for Scottish students attending university in
Scotland fell to $2; 000, with the added advantage of only being paid after graduation. In England,
the 2012 reform increased the tuition cost of a degree from just over $10; 000 to $27; 000, for
students at universities that charge maximum fees.
The increase in fees in England led to a signi�cant change in the sources of funding used
by students. Figure 2 reports the percentage of English-domiciled students studying full time at
universities in England by funding source. Until the increase in fees in 2006, the fraction of students
who borrowed to cover the cost of tuition was about the same as the fraction who did not receive any
�nancial support. The increase in fees led to an increase in the fraction of students who fund their
education with loans and a reduction in the fraction of self-funded students. This trend continued
and in 2012 the vast majority of students (74%) were borrowing to pay tuition fees.
Student loans are provided by the government-owned Student Loans Company (SLC). Students
can borrow to pay tuition fees and maintenance costs and only start repaying their loans once they
earn more than $21; 000 a year. The average amount of debt owed by students in England at the
time when they start repaying their loans has been increasing steadily over time, according to data
from the SLC. The amount of student debt on entry into repayment (including both tuition and
maintenance loans) was just over $20; 000 in 2014, which is about the same level as the average
3The typical duration of a university degree for full-time students is four years in Scotland and three years inEngland. However, fees for the �nal year of study in Scotland were waived to bring the total cost of a degree in linewith the rest of the UK.
6
annual salary of English graduates six months after graduation.4 This is expected to rise even
further once students who pay fees at $9; 000 start repaying their loans. By contrast, student debt
in Scotland is much lower (at $7; 600) because students do not have to pay fees and only borrow
to cover maintenance costs.
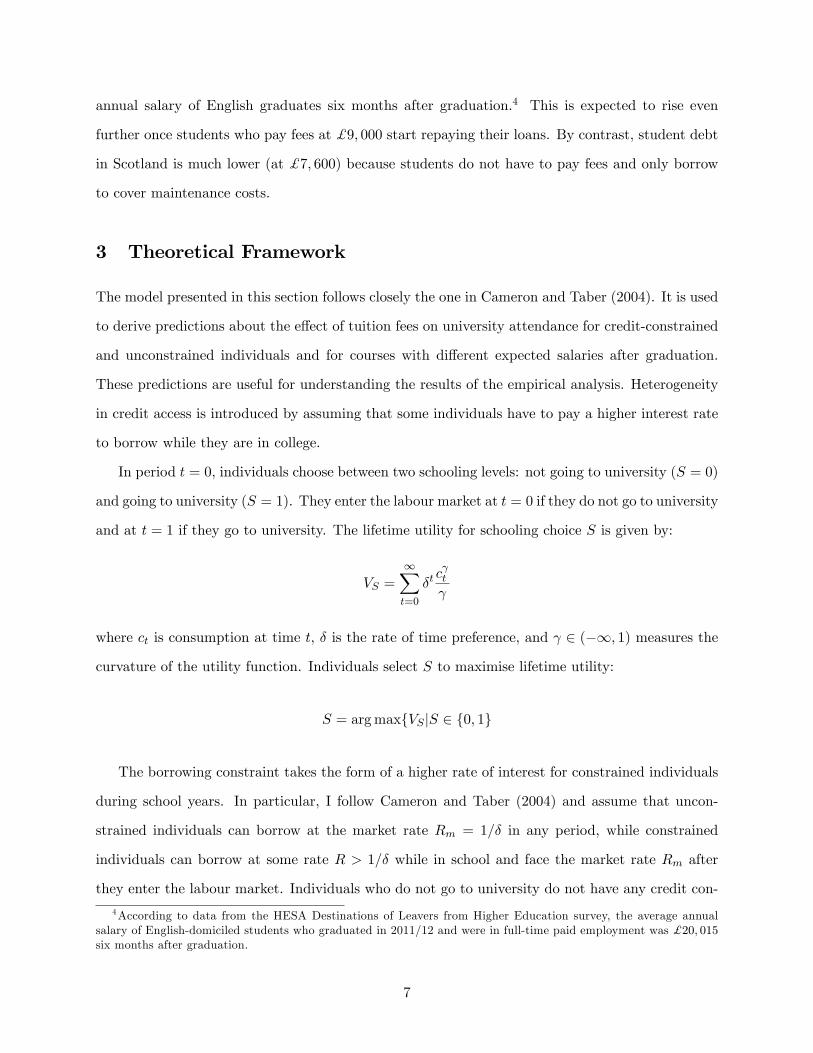
3 Theoretical Framework
The model presented in this section follows closely the one in Cameron and Taber (2004). It is used
to derive predictions about the e¤ect of tuition fees on university attendance for credit-constrained
and unconstrained individuals and for courses with di¤erent expected salaries after graduation.
These predictions are useful for understanding the results of the empirical analysis. Heterogeneity
in credit access is introduced by assuming that some individuals have to pay a higher interest rate
to borrow while they are in college.
In period t = 0, individuals choose between two schooling levels: not going to university (S = 0)
and going to university (S = 1). They enter the labour market at t = 0 if they do not go to university
and at t = 1 if they go to university. The lifetime utility for schooling choice S is given by:
VS =1Xt=0
�tc t
where ct is consumption at time t, � is the rate of time preference, and 2 (�1; 1) measures the
curvature of the utility function. Individuals select S to maximise lifetime utility:
S = argmaxfVS jS 2 f0; 1g
The borrowing constraint takes the form of a higher rate of interest for constrained individuals
during school years. In particular, I follow Cameron and Taber (2004) and assume that uncon-
strained individuals can borrow at the market rate Rm = 1=� in any period, while constrained
individuals can borrow at some rate R > 1=� while in school and face the market rate Rm after
they enter the labour market. Individuals who do not go to university do not have any credit con-
4According to data from the HESA Destinations of Leavers from Higher Education survey, the average annualsalary of English-domiciled students who graduated in 2011/12 and were in full-time paid employment was $20; 015six months after graduation.
7
straints and face the market rate in all periods. This heterogeneity in interest rates during school
years could re�ect di¤erences in the ability to collateralise loans with personal or family assets
during school. I solve the model for credit-constrained individuals. The solution for unconstrained
individuals can be obtained as a special case where R = 1=�.
The lifetime budget constraint for each schooling choice is given by:
1Xt=0
�tct � I0 if S = 0
c0 +1
R
1Xt=1
�t�1ct � I1 if S = 1
where I0 is the present value of income if the individual does not go to university; and I1 is the
present value of income if he goes to university, net of direct schooling costs.
The �rst order conditions for utility maximisation are given by:
ct = c0; 8t if S = 0
ct = c0; if t = 0 and S = 1
ct = (R�)1
1� c0; if t � 1 and S = 1
Substituting these values in the budget constraint gives:
I0 =c01� � if S = 0
I1 = c0 + (R�) =(1� )[�=(1� �)]c0 if S = 1
Solving for c0 as a function of IS and inserting into the utility function gives the lifetime utility
for each schooling choice:
V0 =I 0 [1=(1� �)]1�
V1 =I 1 f1 + (R�) =(1� )[�=(1� �)]g1�
The present value of income (IS) depends on the schooling choice. Individuals who do not go to
university receive a wage w0t in each period t. Individuals who go to university have zero earnings
8
while studying and pay a direct cost � , which includes tuition fees and maintenance costs. After
graduation, they receive a wage w1t in each period t. The present discounted value of income for
each schooling choice is given by:
I0 =
1Xt=0
�tw0t =W0
I1 =1
R
1Xt=1
�t�1w1t � � =1
RW1 � �
where W0 �P1t=0 �
tw0t is the present value of earnings for an individual who does not go to
university, discounted to time t = 0 and W1 �P1t=1 �
t�1w1t is the present value of earnings for an
individual who goes to university, discounted to time t = 1.
Substituting in the lifetime utility values above gives:
V0 =W 0 [1=(1� �)]1�
V1 =[(W1=R)� � ] f1 + (R�) =(1� )[�=(1� �)]g1�
An individual chooses to go to university if D = V1 � V0 > 0.
The model can be used to study how changes in tuition fees (�) a¤ect the decision to go to
university:@D
@�=@V1@�
= � V1I1
< 0
Proposition 1 An increase in tuition fees makes it less likely that an individual will choose to go
to university.
The e¤ect of credit constraints on the decision to go to university is captured by the e¤ect of
changes in the interest rate R:
@D
@R=@V1@R
= � V1RI1
(c0 + �) < 0
Proposition 2 An increase in credit constraints makes it less likely that an individual will choose
to go to university.
The model can also be used to study whether individuals with a higher R are more sensitive to
9
changes in fees:@2D
@R@�= � V1
RI21[(c0 + �)(1� ) + c0(R�) =(1� )
�
1� � ] < 0
Proposition 3 An increase in tuition fees reduces the value of going to university by more for
individuals who are credit constrained.
Cameron and Taber (2004) do not examine whether the e¤ect of tuition fees on the decision to
attend university depends on the present value of earnings of a university graduate (W1). However,
their model can be easily used to analyse this di¤erential e¤ect:
@2D
@W1@�= V1RI21
(1� ) > 0
Proposition 4 An increase in tuition fees reduces the value of going to university by less for
courses that lead to higher salaries after graduation.
4 Empirical Methodology
The identi�cation challenge associated with estimating the e¤ect of schooling costs on schooling
decisions is discussed, for example, in Dynarski (2003). In principle, this e¤ect could be captured
by a reduced-form model with a measure of educational attainment as the dependent variable
(for example, an indicator variable for whether an individual attends university or the number of
university applications) and a measure of schooling costs as independent variable. The problem
with this approach is that the cost of education is likely a function of omitted variables correlated
with the demand for education. Institutional changes that introduce a discrete shift in the cost of
education can induce variation that is uncorrelated with these unobserved determinants of schooling.
In the UK, the 2001 and 2012 reforms created variation in the cost of higher education that can
be used to identify its e¤ect on schooling decisions. I use variation in tuition fees over time and by
country of domicile and estimate the following di¤erence-in-di¤erences (DD) model:
ln(ydjt) = d + �t + �Ddt +X0djt� + "djt (1)
where d denotes country of domicile, j denotes gender, age group, institution and subject group
10

(as described in the data section) and t denotes year. When looking at the e¤ect on applications,
the dependent variable is the log of the number of university applications. When looking at the
e¤ect on attendance, it is the log of the number of �rst-year undergraduate students. The model
includes country of domicile �xed e¤ects ( d) and year �xed e¤ects (�t). The vector of controls
(Xdjt) includes dummies for gender and age group and the log of population living in country d, in
gender and age group j in year t.
The regressor of interest is Ddt and indicates observations for students who lived in the country
a¤ected by the change in tuition fees before they started university (treatment group) in the period
after the change. When analysing the removal of upfront fees in Scotland in 2001, this indicator
is equal to one for Scottish-domiciled students in the period from 2001 to 2004 (the pre-treatment
period goes from 1998 to 2000). The analysis stops in 2004 as this is the year when variable
tuition fees where announced in England. When analysing the increase in fees in England in
2012, the indicator Ddt takes the value one for English-domiciled students in 2012 and 2013. The
pre-treatment period goes from 2008, after the removal of fees in Scotland, to 2011.
The causal e¤ect of tuition fees on university applications is captured by � and can be interpreted
as the change (in log points) in the number of applications induced by the reforms. The speci�cation
controls for changes over time in log applications and for average di¤erences in log applications
between students from Scotland and students from England. The key identifying assumption is
that trends in log applications would have been the same for English and Scottish students in
the absence of the reforms. The reforms induce a deviation from this common trend, which is
measured by the DD estimator. Although the log level of applications in England and Scotland
may be di¤erent, this di¤erence should be captured by the country of domicile �xed e¤ects ( d).
To check the common trends assumption, I add country-speci�c time trends in equation (1) and
estimate:
ln(ydjt) = 0d + 1dt+ �t + �Ddt +X0djt� + "djt (2)
where 0d is a country-speci�c intercept, as before, and 1d is a country-speci�c trend coe¢ cient
multiplying the time trend variable t.
An important feature of the UK reforms is that students at Scottish institutions only qualify
11
for no tuition if they have been living in Scotland for at least three years by the time they start
university or if they have moved to Scotland for a reason other than study. English students who
move to Scotland to attend university still have to pay tuition fees. This is important because it
reduces the potential for selection bias. If students were able to qualify for no fees simply by going
to university in Scotland, we would probably observe that those who move to Scotland are more
likely to go to university, i.e. there would be a positive selection bias in the DD estimator for the
2001 reform and a negative bias for the 2012 reform. The requirement that a student must have
lived in Scotland for at least three years to qualify for no tuition implies that membership of the
treatment and control groups is arguably unrelated to individual choices.
Scottish-domiciled students still have to pay higher tuition fees if they decide to go to university
in England. For the 2001 reform, this implies that the coe¢ cient � captures the e¤ect of being
eligible for reduced or no fees rather than the e¤ect of actually paying reduced fees. For the 2012
reform, this implies that some students assigned to the control group actually receive treatment. In
the language of experiments, � captures the intention-to-treat e¤ect. In practice, however, the vast
majority of Scottish-domiciled students apply to university in Scotland. In 2012, 96:5% of Scottish-
domiciled applicants applied to university in Scotland (UCAS (2012)). Therefore, the coe¢ cient �
is a close approximation of the e¤ect of the treatment on the treated.
5 Data and Descriptive Statistics
Data on applications was produced on request by the Universities and Colleges Admissions Service
(UCAS), which manages all applications to undergraduate courses in the UK. The information
provided is the number of applications to English and Scottish universities by country of domicile
(England and Scotland), institution (156 universities and colleges), gender, age group (18 years and
under, 19, 20, and 21 and over), and subject (16 categories), for the period from 1998 to 2013.
Applicants are allowed to make more than one application to university. Until 2007, each
applicant could apply to up to six courses. From 2008, the maximum number of choices was
reduced to �ve. Data from UCAS shows that the number of applications per applicant fell from
4:4 to 3:7 in 2008. Apart from that year, the number of applications per applicant has been
broadly constant in the periods before and after 2008. This implies that the results that I obtain
12

for applications should also provide information about the e¤ect of tuition fees on the number of
applicants.
Data on the number of undergraduate students was obtained from the Higher Education Sta-
tistics Agency (HESA). The information is disaggregated at the same level as the data from UCAS
and covers the period from 2008 to 2013. In addition, these data contain information on year of
study (�rst year and non-�rst year), ethnicity (white, Asian, black and other) and the local author-
ity where the student was domiciled before going to university. I use information on ethnicity and
local authority to test whether the increase in fees in 2012 had a larger negative e¤ect on students
from minority groups or from local areas with low rates of participation in higher education. Infor-
mation on rates of participation in higher education by local authority is obtained from the Higher
Education Funding Council for England (HEFCE) and is known as POLAR 3. The numbers used
measure rates of participation in higher education for people who reached age 18 between 2005 and
2009.
Data on salaries and employment rates after graduation are from the HESA Destinations of
Leavers from Higher Education (DLHE) survey, which covers the universe of all leavers who were
domiciled in the UK prior to attaining higher education (with a response rate of 75%) and is
conducted six months after graduation. The survey provides information on the activity of �rst-
degree graduates: in full-time paid employment (including self-employment), in part-time paid
employment, in voluntary/unpaid employment, in further study and assumed to be unemployed.
It also reports the salaries of graduates in full-time paid employment and contains information on
age, gender, institution and subject. I use data for students who graduated in 2002/03 and 2011/12
and calculate average salaries and average employment rates by gender, institution and subject.
I combine this information with applications data to examine how changes in tuition fees a¤ect
applications to courses with di¤erent expected future earnings and employment rates.
The model controls for the log of population by country, year, gender, and age group (obtained
from the O¢ ce for National Statistics mid-year population estimates). Between 1998 and 2013,
population aged 17 to 24 increased by 20:1% in England, compared with 12:9% in Scotland. This
should lead to a relative increase in applications and attendance by English-domiciled students,
regardless of the level of tuition fees. I account for this by controlling for population in the model.
The common trends assumption is investigated in Figures 3 and 4. Figure 3 shows the evolution
13

in the log number of applications in England and Scotland. This variable follows a slight downward
trend in both countries until 2001. After the removal of upfront fees in Scotland in 2001, log
applications continue to decrease slightly in England but begin to increase slightly in Scotland. In
2008, log applications fall in both countries because of the reduction in the number of choices that
each applicant was allowed to make, from six to �ve. Between 2008 and 2011, log applications
increase in both countries. There is a clear reduction in England in 2012, when higher tuition
fees were introduced, followed by a slight increase in 2013. Figure 4 shows the evolution in the log
number of �rst-year undergraduates in both countries between 2008 and 2013. This variable follows
a slight downward trend in both countries until 2011. There is a marked reduction in England in
2012, when higher fees were introduced. This number remains broadly constant between 2012 and
2013.
These two �gures support the assumption of common trends and suggest that changes in fees
have induced transitory deviations from the trend. They provide suggestive evidence that higher
tuition fees discourage university applications and attendance. In the next section, I use regional
variation in the level of fees to measure the causal e¤ect of changes in tuition fees on applications
and attendance.
6 Results
6.1 Applications
Table 1 reports the results with the log of university applications as the dependent variable. To
account for correlation in the error terms within country in each year, heteroskedasticity-robust
standard errors clustered by country�year are reported in parentheses. As emphasised in Moulton
(1986), ignoring such clustering can greatly underestimate the true OLS standard errors. However,
because I estimate a di¤erence-in-di¤erences model, there is the added concern that there may
be serial correlation in the error terms within country, as highlighted in Bertrand, Du�o and
Mullainathan (2004). To account for this, I also report standard errors clustered by country (in
square brackets).5
5A practical limitation of inference in my study is the small number of clusters: with two countries and six yearsof data, there are only 12 clusters when clustering by country�year and two clusters when clustering by country.To account for this, Stata uses a small-sample correction and forms critical values using a t-distribution with G� 1
14

The results suggest that the removal of upfront fees in Scotland in 2001 increased applications
by 21:4 log points. This e¤ect is even stronger (at 22:9 log points) in the model with country-speci�c
time trends. The increase in tuition fees in England in 2012 reduced applications by 25 log points
(20:5 in the model with country-speci�c time trends).
These results are not entirely comparable with previous estimates, because previous studies
have focused on attendance rates rather than applications. Nonetheless, it is useful to benchmark
them against previous estimates for attendance rates. Deming and Dynarski (2009) summarise the
�ndings of a number of quasi-experimental studies conducted for the US. These studies �nd that
an increase in student subsidies to higher education by $1; 000 increases the college attendance rate
by about four percentage points. This is equivalent to an increase of about 6:9%, evaluated at an
average attendance rate of 58% for 23 year olds in 2005.
The 2001 reform replaced upfront tuition costs of $3; 000 for a degree with an endowment
scheme in which students paid $2; 000 after graduation. It is plausible that applicants viewed
this reform as a �rst step towards complete elimination of fees in Scotland. If the 2001 reform is
treated as complete removal of fees, an increase in applications by 21:4 log points corresponds to
an increase of 8% for a $1; 000 reduction in fees. Converting to US dollars using the 2001 exchange
rate, this implies an increase in applications of 5:4% for a $1; 000 reduction in fees, which is in line
with the e¤ects on attendance in the US literature. The 2012 reform increased the cost of a degree
from $10; 395 to about $24; 120.6 A reduction in applications by 25 log points corresponds to a
reduction of 1:6% for a $1; 000 increase in fees or about 1% for a $1; 000 increase in fees (at the
2012 exchange rate), a smaller e¤ect than that found in the US literature for attendance.7
The results can also be expressed in terms of price elasticity of demand for higher education.
Treating the 2001 reform as complete elimination of fees and the 2012 reform as an increase in
fees from $10; 395 to $24; 120, the coe¢ cients in Table 1 imply an elasticity of applications with
respect to fees between �0:14 and �0:26.
The third column in table 1 studies the timing of the e¤ect for the 2012 reform. Because the
increase in fees was announced in 2010 to take e¤ect in 2012, it may have a¤ected the decision of
degrees of freedom, where G is the number of clusters.6 I assume that, if the cap on fees had not been increased, tuition fees in 2012/13 would have been set at $3; 465
(the same level as in 2011/12, adjusted for in�ation). The level of fees after the reform ($24; 120) is calculatedassuming annual fees of $8; 040 (the average level set by universities and colleges in 2012/13).
7 I use the end of year spot exchange rates in 2001 and 2012, reported by the Bank of England.
15

when to apply to university. In particular, it is possible that students who were deciding whether
to take a gap year or apply to university in 2010 or 2011, decided to apply earlier to avoid paying
higher fees. I test this hypothesis by including leads and lags of the reform indicator. This approach
is similar to the one adopted in Autor (2003) to study the dynamic e¤ects of employment protection
on the use of temporary help workers. The results suggest that there was some positive e¤ect on
applications in 2010, but this e¤ect is small compared with the reduction in applications observed
after the implementation of the reform.
6.2 Course Choice
The theoretical model discussed in Section 3 suggests that changes in tuition fees should have a
larger e¤ect on applications for courses that lead to lower wages after graduation. To test this
hypothesis, I combine data on average salaries and employment rates after graduation by gender,
institution and subject group with applications data and study the e¤ect of the 2001 and 2012
reforms on applications at di¤erent quartiles of the distribution of expected future salaries and
employment rates.
Salary and employment data are obtained from the HESA DLHE survey. The survey re-
ports salaries of �rst-degree graduates in full-time paid employment (including self-employment)
six months after graduation. To reduce the e¤ect of outliers, I calculate average salaries for workers
age 20 to 30 earning less than $60; 000 per year. For employment, the survey reports the activity
of graduates six months after graduation. I calculate average employment rates as the share of the
population of graduates in full-time paid employment six months after graduation. When analysing
the 2001 reform, I use data for students who graduated in academic year 2002/03. For the 2012
reform, I use data for students who graduated in academic year 2011/12.
Table 2 reports average salaries and employment rates by subject for students who graduated in
academic year 2011/12. The table reveals large heterogeneity in average salaries and employment
rates across subjects. Graduates in medicine and dentistry have the highest annual average salary
(at almost $29; 000) and also the highest employment rate (at 92%). Graduates in creative arts and
design have the lowest annual average salary (at just over $16; 000) and graduates in law have the
lowest employment rate (at 35%).8 There is also large variation across institutions within subject,
8The ranking of salaries across subjects is similar to the one reported in Chevalier (2011) for 2002/03 graduates.
16
as suggested by the standard deviations reported in the table.
To test how changes in fees a¤ect applications along the distribution of expected salaries and
employment rates, I �rst calculate the quartiles of the distribution of salaries and employment
rates by subject, institution and gender. I then estimate the model including an indicator for each
quartile and interactions of these indicators with the treatment variable (Ddt in model (1)).
The results, reported in Table 3, suggest that the removal of upfront fees in Scotland in 2001
increased applications by more for courses with lower expected future earnings. Applications to
courses in the lowest quartile of the salary distribution increased by 75:2 log points. The e¤ect
decreases monotonically as we move to higher quartiles of the salary distribution and is essentially
zero for courses in the top quartile. The results for employment are similar and show a much larger
increase in applications for courses with weaker employment prospects.
Turning to the 2012 reform, the increase in fees in England reduced applications by less for
courses with higher expected future earnings. Applications to courses in the lowest quartile of the
salary distribution decreased by 32:2 log points, compared with 22 log points for courses in the top
quartile. A similar pattern is found when looking at employment rates. I �nd a negative e¤ect on
applications to courses that lead to lower salaries after graduation despite the fact that students
who borrow to cover the cost of higher education only start repaying their loans when their annual
earnings reach $21; 000. Without this design feature of the student loans system, I would expect
higher tuition fees to have an even larger negative e¤ect on applications to courses with poor job
prospects.
These �ndings are consistent with the predictions of the theoretical model and suggest that
students take expected future earnings and employment prospects into account when making their
course choices. They are also consistent with the �ndings in Chevalier (2011), who reports large
di¤erences in earnings by subject and calculates a graduate tax �in the form of tuition fees �that
captures these subject wage premia. He concludes that there is some scope for charging subject-
speci�c fees. My �ndings suggest that students are indeed willing to pay higher fees for institutions
and subjects that lead to better employment prospects after graduation.
Average salaries are higher in Chevalier (2011) because he works with a version of the DLHE which is conductedthree years after graduation.
17

6.3 Attendance
Another prediction of the theoretical model is that credit-constrained students should be more
sensitive to changes in tuition fees than unconstrained students. To test this hypothesis, I use
data from HESA on the number of �rst-year undergraduate students at English and Scottish
universities by country of domicile (England and Scotland), gender, age group and two further
levels of disaggregation: ethnicity or the local authority where the student was domiciled before
going to university. These data are not available for the period before the 2001 reform. For this
reason, I only analyse attendance for the 2012 reform.
Table 4 reports the results of estimating model (1) with the log of the number of �rst-year
undergraduate students as the dependent variable. In panel I, the model is estimated separately
for each ethnic group. In panel II, local authorities are divided into two groups according to the
rate of participation in higher education of people who reached age 18 between 2005 and 2009.
Local authorities with a rate of participation below the median are classi�ed as low participation
areas.
The results show that the increase in fees in 2012 reduced attendance of white students by 33:3
log points, with a much smaller e¤ect for other ethnic groups. When comparing di¤erent local
authorities, the results show that the 2012 reform reduced attendance by more for students from
local authorities with higher rates of participation in higher education.
These results suggest that students who face tighter credit constraints � those from ethnic
minorities and less advantaged local areas � do not appear to be more a¤ected by the increase
in fees in 2012. This could be explained by the fact that government-provided student loans relax
credit constraints. In addition, universities that change tuition fees above $6; 000 need to have
an access agreement approved by the OFFA, setting out the measures adopted to improve access
for students from less advantaged backgrounds. These �ndings are consistent with the evidence in
Carneiro and Heckman (2003), who �nd no evidence of signi�cant credit constraints in the decision
to attend college in the US. Dearden at al (2004) obtain similar results for the UK.
18
7 Conclusions
In the UK, changes in tuition fees have created large heterogeneity in the cost of higher education
over time and across countries. However, few studies exploit these sources of variation to estimate
the causal e¤ect of tuition fees on schooling outcomes. This article studies the e¤ect on applications
and attendance of two policy changes: the removal of upfront fees in Scotland in 2001 and the
increase in fees in England in 2012.
The results from both experiments are consistent and suggest that increases in tuition fees have
a negative e¤ect on applications to higher education. I �nd that the removal of upfront fees in
Scotland in 2001 increased applications by 21 log points, while the increase in fees in England in
2012 reduced applications by 25 log points. These results imply an elasticity of demand for higher
education with respect to fees between �0:14 and �0:26.
Looking at the impact on applications by subject and institution, I �nd evidence that changes
in tuition fees have a smaller e¤ect on applications to courses with higher employment probabilities
and higher average wages after graduation. This suggests that, when faced with higher fees, students
take future employment prospects into account when deciding which subjects and institutions to
apply for. There is, therefore, scope for fees to vary by course and be set at a higher level for
courses that o¤er better employment prospects after graduation.
Turning to the e¤ect on attendance, I �nd that the increase in fees in England in 2012 reduced
attendance of white students by 33 log points. The e¤ect is smaller for ethnic minorities and for
students from local authorities with lower rates of participation in higher education, suggesting
that credit constraints do not play a signi�cant role in the decision to attend university.
19

References
[1] Autor, D. (2003). �Outsourcing at Will: The Contribution of Unjust Dismissal Doctrine to the
Growth of Employment Outsourcing�, Journal of Labor Economics, vol. 21(1), pp. 1-42.
[2] Bertrand, M., Du�o, E. and Mullainathan, S. (2004). �How Much Should We Trust Di¤erence-
in-Di¤erences Estimates?�, The Quarterly Journal of Economics, vol. 119(1), pp. 249-75.
[3] Cameron, S. V. and Taber, C. (2004). �Estimation of Educational Borrowing Constraints Using
Returns to Schooling�, Journal of Political Economy, vol. 112 (1), pp. 132-82.
[4] Carneiro, P. and Heckman, J. (2003). �Human Capital Policy�, in (J. Heckman and A. Krueger,
eds.), Inequality in America: What Role for Human Capital Policies, pp. 77-240, Cambridge,
Massachusetts: MIT Press.
[5] Chevalier, A. (2011). �Subject choice and earnings of UK graduates�, Economics of Education
Review, vol. 30(6), pp. 1187�1201.
[6] Crowford, C. and Dearden, L. (2010). �The impact of the 2006-07 HE �nance reforms on HE
participation�, BIS Research Paper no. 13.
[7] Dearden, L., McGranahan, L. and Sianesi, B. (2004). �The Role of Credit Constraints in
Educational Choices: Evidence from the NCDS and BCS70�, Centre for the Economics of
Education DP 48.
[8] Dearden, L., Fitzsimons, E. and Wyness, G. (2011). �The impact of tuition fees and support
on university participation in the UK�, Centre for the Economics of Education DP 126.
[9] Deming D. J. and Dynarski, S. M. (2010). �Into college, out of poverty? Policies to increase
the postsecondary attainment of the poor�, in (P. Levine and D. Zimmerman, eds.), Targeting
investments in children: �ghting poverty when resources are limited, pp. 283-302, Chicago:
University of Chicago Press.
[10] Dynarski, S. M. (2003). �Does aid matter? Measuring the e¤ect of student aid on college
attendance and completion�, American Economic Review, vol. 93(1), pp. 279-288.
20
[11] Garibaldi, P., Giavazzi, F., Ichino, A. and Rettore, E. (2012). �College cost and time to complete
a degree: evidence from tuition discontinuities�, Review of Economics and Statistics, vol. 94(3),
pp. 699-711.
[12] HEFCE (2013). �Higher education in England: impact of the 2012 reforms�, Higher Education
Funding Council for England report 2013/03.
[13] Hübner, M. (2012). �Do tuition fees a¤ect enrollment behavior? Evidence from a �natural
experiment�in Germany�, Economics of Education Review, vol. 31(6), pp. 949�960.
[14] Independent Commission on Fees (2012). �Analysis of UCAS applications for 2012/13 admis-
sions�.
[15] Moulton, B. (1986). �Random Group E¤ects and the Precision of Regression Estimates�, Jour-
nal of Econometrics, vol. 32(3), pp. 385-397.
[16] Neill, C. (2009). �Tuition fees and the demand for university places�, Economics of Education
Review, vol. 28(5), pp. 561�570.
[17] Nielsen, H. S., S�rensen, T. and Taber, C. (2010). �Estimating the e¤ect of student aid on
college enrollment: evidence from a government grant policy reform�, American Economic
Journal: Economic Policy, vol. 2(2), pp. 185-215.
[18] UCAS (2012). �How have applications for full-time undergraduate higher education in the UK
changed in 2012?�, UCAS Analysis and Research, July 2012.
[19] Universities UK (2009). �Changing landscapes: future scenarios for variable tuition fees�, re-
search report March 2009.
21

England
Figure 1. Tuition fees in England and Scotland
1998: Tuition fees introduced at £1,000/year
No fees
No fees
2001: Endowment scheme. Students to pay £2,000 after graduation, starting with cohort graduating in April 2005. Only applicable to Scottish-domiciled students.
Scotland
2004: Announcement of variable tuition fees, with a cap at £3,000/year. Applicable to students starting university from academic year 2006/07.
2007: No fees. Only applicable to Scottish-domiciled students.
2010: Announcement of increase in cap on tuition fees to £9,000/year. Applicable to students starting university from academic year 2012/13.
1998: Tuition fees introduced at £1,000/year

Figure 2. Percentage of students by major source of tuition fees
Source: HESA student database. Note: Percentages calculated for students with domicile in England attending English institutions.
Figure 3. Log number of applications by country of domicile
Source: UCAS.
Figure 4. Log number of first-year undergraduate students by country of domicile
Source: HESA student database.
020
4060
80%
2002 2004 2006 2008 2010 2012Year
No financial support Student loanCentral and local government Other
1112
1314
15ln
(app
licat
ions
)
1995 2000 2005 2010 2015year
England Scotland
Log applications
1111
.512
12.5
1313
.5ln
(firs
t yea
r stu
dent
s)
2008 2009 2010 2011 2012 2013year
England Scotland
Log first-year students

Table 1. Effect on applications
Log applications I. 2001 reform
Treatment group × post treatment 0.214 0.229 (0.041) *** (0.112) * [0.028]* [0.022]* Observations 81,847 81,847 R-squared 0.238 0.258
II. 2012 reform Treatment group × post treatment -0.250 -0.205 (0.013) *** (0.070) ** [0.014]** [0.009]** Treatment group × 2010 0.023 (0.023)
[0.001]* Treatment group × 2011 0.002 (0.023)
[0.016] Treatment group × 2012 -0.237 (0.023) ***
[0.018]** Treatment group × 2013 -0.251 (0.023) ***
[0.017]** Observations 72,892 72,892 72,892 R-squared 0.190 0.219 0.190
Country-specific trends No Yes No Notes. Robust standard errors clustered by country × year in parentheses and by country in square brackets. Regressions include year and country of domicile fixed effects, the log of population, and indicators for gender and age group. Leads and lags of the reform (Treatment group × year) are equal to one in the year indicated for students with domicile in England and zero otherwise. *** significant at 1%, ** significant at 5%, * significant at 10%.
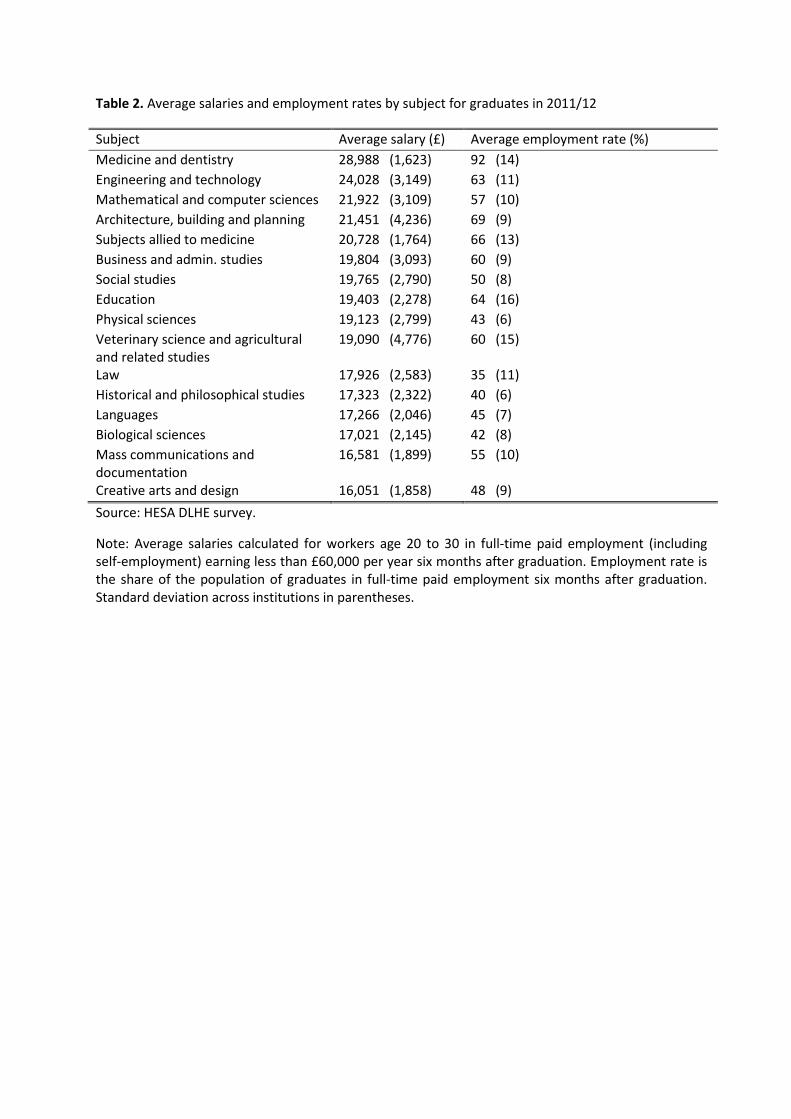
Table 2. Average salaries and employment rates by subject for graduates in 2011/12
Subject Average salary (£) Average employment rate (%) Medicine and dentistry 28,988 (1,623) 92 (14) Engineering and technology 24,028 (3,149) 63 (11) Mathematical and computer sciences 21,922 (3,109) 57 (10) Architecture, building and planning 21,451 (4,236) 69 (9) Subjects allied to medicine 20,728 (1,764) 66 (13) Business and admin. studies 19,804 (3,093) 60 (9) Social studies 19,765 (2,790) 50 (8) Education 19,403 (2,278) 64 (16) Physical sciences 19,123 (2,799) 43 (6) Veterinary science and agricultural and related studies
19,090 (4,776) 60 (15)
Law 17,926 (2,583) 35 (11) Historical and philosophical studies 17,323 (2,322) 40 (6) Languages 17,266 (2,046) 45 (7) Biological sciences 17,021 (2,145) 42 (8) Mass communications and documentation
16,581 (1,899) 55 (10)
Creative arts and design 16,051 (1,858) 48 (9) Source: HESA DLHE survey.
Note: Average salaries calculated for workers age 20 to 30 in full-time paid employment (including self-employment) earning less than £60,000 per year six months after graduation. Employment rate is the share of the population of graduates in full-time paid employment six months after graduation. Standard deviation across institutions in parentheses.
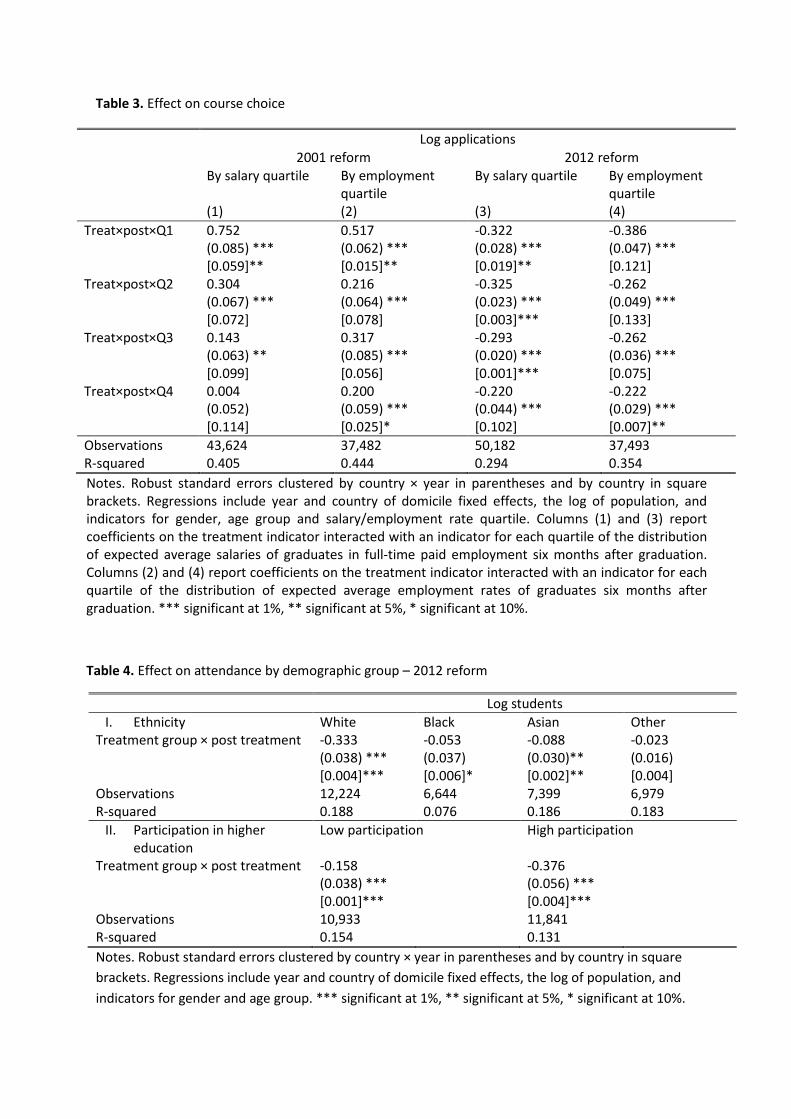
Table 3. Effect on course choice
Log applications 2001 reform 2012 reform
By salary quartile By employment quartile
By salary quartile By employment quartile
(1) (2) (3) (4) Treat×post×Q1 0.752 0.517 -0.322 -0.386 (0.085) *** (0.062) *** (0.028) *** (0.047) *** [0.059]** [0.015]** [0.019]** [0.121] Treat×post×Q2 0.304 0.216 -0.325 -0.262 (0.067) *** (0.064) *** (0.023) *** (0.049) *** [0.072] [0.078] [0.003]*** [0.133] Treat×post×Q3 0.143 0.317 -0.293 -0.262 (0.063) ** (0.085) *** (0.020) *** (0.036) *** [0.099] [0.056] [0.001]*** [0.075] Treat×post×Q4 0.004 0.200 -0.220 -0.222 (0.052)
[0.114] (0.059) *** [0.025]*
(0.044) *** [0.102]
(0.029) *** [0.007]**
Observations 43,624 37,482 50,182 37,493 R-squared 0.405 0.444 0.294 0.354 Notes. Robust standard errors clustered by country × year in parentheses and by country in square brackets. Regressions include year and country of domicile fixed effects, the log of population, and indicators for gender, age group and salary/employment rate quartile. Columns (1) and (3) report coefficients on the treatment indicator interacted with an indicator for each quartile of the distribution of expected average salaries of graduates in full-time paid employment six months after graduation. Columns (2) and (4) report coefficients on the treatment indicator interacted with an indicator for each quartile of the distribution of expected average employment rates of graduates six months after graduation. *** significant at 1%, ** significant at 5%, * significant at 10%.
Table 4. Effect on attendance by demographic group – 2012 reform
Log students I. Ethnicity White Black Asian Other
Treatment group × post treatment -0.333 -0.053 -0.088 -0.023 (0.038) ***
[0.004]*** (0.037) [0.006]*
(0.030)** [0.002]**
(0.016) [0.004]
Observations 12,224 6,644 7,399 6,979 R-squared 0.188 0.076 0.186 0.183
II. Participation in higher education
Low participation High participation
Treatment group × post treatment -0.158 (0.038) ***
-0.376 (0.056) ***
Observations
[0.001]*** 10,933
[0.004]*** 11,841
R-squared 0.154 0.131 Notes. Robust standard errors clustered by country × year in parentheses and by country in square brackets. Regressions include year and country of domicile fixed effects, the log of population, and indicators for gender and age group. *** significant at 1%, ** significant at 5%, * significant at 10%.