the effect of treadmill vs. nustep recumbent cross trainer
TRANSCRIPT

Wayne State University
Wayne State University Dissertations
1-1-2018
The Effect Of Treadmill Vs. Nustep RecumbentCross Trainer On Gait And Lower ExtremityElectromyography After Chronic StrokeNicholas Joseph SiekirkWayne State University,
Follow this and additional works at: https://digitalcommons.wayne.edu/oa_dissertations
Part of the Kinesiology Commons
This Open Access Dissertation is brought to you for free and open access by DigitalCommons@WayneState. It has been accepted for inclusion inWayne State University Dissertations by an authorized administrator of DigitalCommons@WayneState.
Recommended CitationSiekirk, Nicholas Joseph, "The Effect Of Treadmill Vs. Nustep Recumbent Cross Trainer On Gait And Lower ExtremityElectromyography After Chronic Stroke" (2018). Wayne State University Dissertations. 2068.https://digitalcommons.wayne.edu/oa_dissertations/2068

THE EFFECT OF TREADMILL VS. NUSTEP RECUMBENT CROSS TRAINER ON
GAIT AND LOWER EXTREMITY ELECTROMYOGRAPHY AFTER CHRONIC
STROKE
by
NICHOLAS J. SIEKIRK
DISSERTATION
Submitted to the Graduate School
of Wayne State University,
Detroit, Michigan
in partial fulfillment of the requirements
for the degree of
DOCTOR OF PHILOSOPHY
2018
MAJOR: KINESIOLOGY
Approved By:
Advisor Date

© COPYRIGHT BY
NICHOLAS J. SIEKIRK
2018
All rights Reserved

ii
DEDICATION
To those who have inspired me...
__________________
And to those who we have lost:
Tau Kappa Epsilon Theta Omicron
Justin C.Z. Rush (1989-2018)
Siekirk
John F. Siekirk (1924-2000)
Pulaski
Eugene R. Pulaski (1922-2009)
Anastasia S. Pulaski (1921-2012)
Alan D. Kirchoff (1974-2015)
James J. David (1976-2014)
Muhleck
Earl N. Muhleck (1931 – 2017)
Nave
Reno V. Nave (1938-2017)
__________________
L'espoir ne meurt jamais

iii
ACKNOWLEDGEMENTS
Thank you to my advisor, Dr. Qin Lai for without you I would have never found a home
at Wayne State University. You inspired me to pursue Motor Behavior, for that, I am eternally
grateful. Thank you Drs. Sujay Galen and Victoria Pardo for without you, I would never be a
Neurotechian. These projects would not be possible without you To my lab assistants (Trevor
and Samantha), I am forever grateful for your contribution. I thank my Master’s committee
chair, Dr. Brian Goslin for his benevolence and preparing me for the demands of a Ph.D.
program. Dr. Tamara Hew: thank you for your never ending well of positivity, unconditional
support and belief in me. I thank Dr. Brian Rider for always know what advice to give. I landed
an academic job because of you. To my “unofficial” undergraduate academic advisor, thank
you Dr. Coughlin for introducing me to exercise science. Dr. Brad Kendall, thank you for your
camaraderie and pensive conversation. This feat was possible through our friendship. I look
forward to a lifetime of collaboration. Alex Kemp, thank you for your support these past four
years. We will always be roommates. Lastly, to my fraternity brothers, I’m not sure where I
would be without our comradery
This study was supported, in part, by grants from the National Institutes of Health (P30
AG015281), Michigan Center for Urban African American Aging Research, NuStep LLC, The
State of Michigan and Wayne State University’s Graduate School.

iv
PREFACE
The basis for this research stemmed from a passionate and continued curiosity on how exercise
can assist those with chronic disease and disability. Progression requires the continued
validation and critical examination of methods and machinery.

v
TABLE OF CONTENTS
Dedication_______________________________________________________________
ii
Acknowledgements_________________________________________________________
iii
Preface___________________________________________________________________
iv
List of Tables_____________________________________________________________
x
List of Figures_____________________________________________________________
xi
List of Schemes____________________________________________________________
xii
Chapter 1 Introduction______________________________________________________
1
Statement of the Problem – Muscle Adaptation – Pilot 1______________________
2
Statement of the Problem – Muscle Activation – Pilot 2______________________
3
Statement of the Problem – NuStep Cross Trainer vs. Treadmill________________
4
Chapter 2 Background______________________________________________________
7
Cerebral Vascular Accident____________________________________________
7
Locomotion_________________________________________________________
9
Stroke Locomotion___________________________________________________
11
Central Pattern Generators____________________________________________
13
Descending Signals___________________________________________________
18
Motor Memory Consolidation___________________________________________
20
Exercise and Neural Plasticity__________________________________________
20
Recommendation for Exercise Programming with Stroke Survivors_____________
22
Ergometry____________________________________________________
23
Treadmill_____________________________________________________
23
NuStep Cross Trainer___________________________________________
24

vi
Chapter 3 Methods – Muscle Activation – Pilot 1_________________________________
27
Participants_________________________________________________________
27
Measures___________________________________________________________
27
Procedures_________________________________________________________
29
Statistical Analysis___________________________________________________
31
Chapter 4 Results – Muscle Activation – Pilot 1__________________________________
32
Chapter 5 Methods – Muscle Adaptation – Pilot 2_________________________________
37
Participants_________________________________________________________
37
Measures___________________________________________________________
37
Procedures_________________________________________________________
39
Statistical Analysis___________________________________________________
40
Chapter 6 Results – Muscle Adaptation – Pilot 2__________________________________
41
Mean Electromyography (EMG)________________________________________
41
Peak Electromyography (EMG)_________________________________________
43
Chapter 7 Methods – NuStep vs. Treadmill (NVT)________________________________
47
Participants________________________________________________________
47
Baseline Measurements_______________________________________________
47
Procedures_________________________________________________________
48
Wireless Gait Assessment (WiGAT)_______________________________
48
Self-Selected (SS) Protocols_____________________________________
49
Electromyography_____________________________________________
51
Maximum Voluntary Contractions (MVC)__________________________
53
Exercise Protocol______________________________________________
54

vii
Wireless Goniometery__________________________________________
55
Heart Rate (HR) and Blood Pressure (BP)___________________________
55
Statistical Analysis___________________________________________________
56
Chapter 8 Results – NuStep vs. Treadmill (NVT)_________________________________
58
Age_______________________________________________________________
58
BMI_______________________________________________________________
59
Height_____________________________________________________________
59
Weight_____________________________________________________________
59
Rating of Perceived Exertion (RPE) - Between Conditions____________________
59
Rating of Perceived Exertion (RPE) - Within Conditions_____________________
60
Self-Selected (SS) Protocol – By Exercise Mode____________________________
61
Treadmill Speed_______________________________________________
61
NuStep Cross Trainer___________________________________________
62
Force – Between Conditions____________________________________________
63
Knee________________________________________________________
63
Ankle________________________________________________________
64
Force – Within Conditions_____________________________________________
65
Healthy Knee__________________________________________________
66
Healthy Ankle_________________________________________________
66
Stroke Knee___________________________________________________
67
NuStep Cross Trainer Static Knee Positions________________________________
67
NuStep Cross Trainer Seat Position______________________________________
68
Heart Rate__________________________________________________________
68

viii
Systolic Blood Pressure________________________________________________
69
Diastolic Blood Pressure______________________________________________
70
Goniometers________________________________________________________
70
Treadmill ∆ROM – Between Conditions____________________________
70
NuStep ∆ROM – Between Conditions______________________________
72
Healthy ∆ROM – Within Condition________________________________
74
Stroke ∆ROM – Within Condition_________________________________
75
Mean Electromyography (mEMG)_______________________________________
77
mEMG NuStep Cross Trainer – Between Conditions__________________
77
mEMG Treadmill – Between Conditions____________________________
81
mEMG Stroke – Within Condition_________________________________
84
mEMG Healthy – Within Condition________________________________
87
mEMG Stroke – Affected Side____________________________________
90
mEMG Stroke – Non-affected Side________________________________
92
Wireless Gait Assessment (WiGAT)______________________________________
93
Left Stride Length______________________________________________
93
Right Stride Length_____________________________________________
95
Walking Speed________________________________________________
96
Double Support Time (DST)______________________________________
97
Asymmetry Index (AI)__________________________________________
98
Left Stance Percentage (%) ______________________________________
99
Right Stance Percentage (%) _____________________________________
100
Left Swing Percentage (%)_______________________________________
100

ix
Right Swing Percentage (%)______________________________________
101
Affected Side Stance %__________________________________________
101
Non- Affected Side Stance %_____________________________________
102
Affected Side Swing %__________________________________________
103
Non- Affected Side Swing %_____________________________________
104
Affected Side Stride Length______________________________________
105
Non- Affected Stride Length______________________________________
106
Chapter 9 Discussion________________________________________________________
107
Muscle Activation Pilot 1______________________________________________
108
Muscle Adaptation Pilot 2______________________________________________
110
NuStep Cross Trainer vs. Treadmill______________________________________
111
Appendix A_______________________________________________________________
121
Appendix B_______________________________________________________________
129
Appendix C_______________________________________________________________
141
Appendix D_______________________________________________________________
142
Appendix E_______________________________________________________________
143
Appendix F______________________________________________________________
144
Appendix G_______________________________________________________________
145
References________________________________________________________________
146
Abstract__________________________________________________________________
153
Autobiographical Statement__________________________________________________
156

x
LIST OF TABLES
Table 1: Stages of Human Gait.................................................................................................. 11
Table 2: Rhythmic Activity of Central Pattern Generators........................................................
14
Table 3: Mean Electromyography (mEMG) – Pilot 1...............................................................
33
Table 4: Peak Electromyography (pEMG) – Pilot 1..................................................................
34
Table 5: mEMG Across Protocols – Pilot 1...............................................................................
35
Table 6: pEMG Across Protocols – Pilot 1................................................................................
36
Table 7: Order of Data Collection – NVT.................................................................................
48
Table 8: Participant’s Leg Preference – NVT............................................................................
58
Table 9: Subject Data – NVT.....................................................................................................
59
Table 10: Asymmetry Index – NVT..........................................................................................
98

xi
LIST OF FIGURES
Figure 1a: NuStep Recumbent Cross Trainer Visual Feedback...............................................
30
Figure 1b: NuStep Recumbent Cross Trainer Visual Feedback..............................................
55
Figure 2: NuStep Pedal Down Position...................................................................................
50
Figure 3: NuStep Pedal Up Position........................................................................................
50
Figure 4: Heart Rate—NVT.....................................................................................................
69
Figure 5: Left Stride Length (WiGAT) – NVT –By Exercise Treatment................................
94
Figure 6: Left Stride Length (WiGAT) – NVT– By Condition. .............................................
94
Figure 7: Right Stride Length (WiGAT) – NVT– By Condition.............................................
97
Figure 8: Walking Speed (WiGAT) – NVT.............................................................................
97
Figure 9: Double Support Time (WiGAT) – NVT..................................................................
97
Figure 10: Asymmetry Index (WiGAT) – NVT......................................................................
99
Figure 11: Affected Side Stance % Mean Data (WiGAT) – NVT..........................................
101
Figure 12: Non-Affected Side Stance % Median Data (WiGAT) – NVT...............................
102
Figure 13: Affected Side Swing % Mean Data (WiGAT) – NVT...........................................
103
Figure 14 Non-Affected Side Swing % Median Data (WiGAT) – NV...................................
104
Figure 15: Affected Side Stride Length (m) Mean Data (WiGAT) – NVT.............................
105
Figure 16: Non-Affected Side Stride Length (m) Mean Data (WiGAT) – NVT.....................
105

xii
LIST OF SCHEMES
Scheme 1: Simplified Central Pattern Generator.......................................................................
16
Scheme 2: Locomotive Pattern Generator.................................................................................
16
Scheme 3: WiGAT Sensor Location..........................................................................................
49
Scheme 4: Electromyography (EMG) Box Placement..............................................................
52
1
CHAPTER 1 INTRODUCTION
Humans will perform various rhythmic movements as part of their day’s activities. This
whole body movement is naturally multiplanar and requires a blend of acceleration, deceleration
and dynamic stabilization (Wannier, Bastiaanse, Colombo & Dietz, 2001). Human locomotion is
a rhythmic whole body movement that consists of alternating coupled patterns of flexion and
extension. Rhythmic and coupled patterns of muscle activation (Jakobi & Chilibeck, 2001) and
reflex responses (Cerri, Borroni & Baldissera., 2003; Zehr et al., 2007) have been observed
across multijoint and multi-limb motor patterns such as walking, crawling and swimming
(Huang & Ferris, 2009b). In populations that find whole body movement to be burdensome
following injury or disease, an intermediary or assistive device is often deployed. Howbeit,
targeted and purposeful exercise (with or without the assisted device) should also be considered
as part of therapeutic programming. Ideally, this programming should promote muscle activation
without compromising the exerciser’s safety. Most individuals with a recent history of a cerebral
vascular accident (CVA) are deconditioned; exhibiting a peak oxygen consumption that is about
half of age-matched controls (Palmer-McLean & Harbst, 2003). This deconditioned state leaves
tremendous room for improvement (Palmer-McLean & Harbst, 2003). Exercise not only can
improve aerobic capacity but self-selected (SS) walking speed, increased mobility and reduced
reliance on assisted devices (Palmer-McLean & Harbst, 2003). Rehabilitative exercise that
targets locomotor pathways may improve quality of life (Stoloff, Zehr & Ferris, 2007).
Improvements in gait provide a significant clinical marker of recovery (Yang et al., 2005).
Therefore, it seems intuitive to investigate exercise modes that would improve gait.
The NuStep® (NuStep LLC Ann Arbor, MI, USA) is a widely available and commonly
used recumbent cross-trainer that has been used both in clinical and research settings. NuStep
2
provides a coupled reciprocal leg extension-flexion with corresponding opposite arm flexion-
extension (Stoloff et al., 2007). The motion simulates a reciprocal pattern similar to walking but
in a seated and guided manner.
Statement of Problem – Muscle Activation – Pilot 1
Previous investigations have only studied the NuStep cross trainer during predetermined
cadences. These predetermined cadences have varied between 30-120 steps per minute across
several investigations (Huang & Ferris, 2004; Kao & Ferris, 2005; Billinger, Loudon &
Gajewsk, 2008; Huang & Ferris, 2009a; Huang & Ferris, 2009b; Dalleck et al., 2011, Billinger et
al., 2012; de Kam et al., 2013; Wilson et al., 2017). One previous investigation also matched
stepping frequency on the NuStep Cross Trainer to the participant’s stepping frequency while on
the Treadmill (TM) (Stoloff, Zehr & Ferris, 2007). None of these investigations attempted to
determine an individuals' self-selected cadence despite the clinical commonality of such use.
That is, in clinical practice, patients are often asked to step at a comfortable pace as part of a
warm-up. Moreover, despite this commonality of this cue, the muscular response is not clear.
Therefore, the effect of a self-selected cadence, as determined by an individual's rating of
perceived exertion on lower extremity muscle activation (as measured by EMG amplitude) on
the NuStep cross trainer has yet to be determined. Furthermore, muscle activity of the lower
extremity, in the absence of arm movement has not been investigated to date and therefore
remains unknown.
For these reasons, our investigation sought answers to the following research questions:
1– What is the RPE based self-selected (SS) cadence of healthy exercisers on the NuStep? 2 -
How does a deviation in SS cadence affect EMG recruitment on NuStep? 3 – How does an
increase in resistance (while performing SS cadence) affect EMG recruitment on NuStep?

3
The purpose of this pilot was to study the electromyographic (EMG) activity of 12 lower
extremity muscles during five different 5 minute stepping protocols; self-selected level 1 (SSL1),
self-selected level 8 (SSL8), +20% self-selected (SS+20), -20% self-selected (SS-20), and 80
steps per minute at resistance level 1 (80SL1). Based on these research questions, we
hypothesized that an increase in stepping cadence (above the participant’s SS cadence) and an
increase in resistance (at level 8) would result in higher mean EMG (mEMG) amplitudes. We
also hypothesized that a decrease in stepping cadence (below the participant’s SS cadence)
would result in lowered mean EMG amplitudes.
Statement of the Problem Muscle Adaptation –Pilot Part II
Exercise has been shown to improve neural plasticity (Kandel et al., 2015). Previous
research concluded that recumbent stepping relies on similar neural networks as walking, and
therefore have suggested that the NuStep can promote neural plasticity and recovery of walking
(Stoloff, Zehr & Ferris, 2007). It is also theorized that muscle recruitment becomes more
efficient as a result of task-specific training (Kenny, Wilmore & Costil, 2015). Although muscle
activity while stepping with a NuStep has been studied previously, the potential change in
muscle activity to stepping over time has yet to be determined. Therefore the investigation
sought to answer the following questions: 1 - Does the deviation from a self-selected stepping
speed result in a delayed adaptation of muscle activation on the NuStep? 2 - Does an increase in
stepping resistance at self-selected stepping speed result in a delayed adaptation of muscle
activation on the NuStep?
The purpose of this investigation was to study the electromyographic (EMG) activity of
12 lower extremity muscles during five different stepping protocols; self-selected level 1 (SSL1),
self-selected level 8 (SSL8), +20% self-selected (SS+20), -20% self-selected (SS-20), and 80

4
steps per minute at resistance level 1 (80SL1) at minute 2 and minute 4 of a 5 minute exercise
protocol. Based on these research questions, we hypothesized that both elevated cadence
(SS+20) and resistance (SSL8) would result in the highest adaptation in participant’s EMG
between minute 2 and minute 4 of the exercise protocol.
Statement of the Problem – NuStep Cross Trainer vs. Treadmill
Leg impairments continue to undermine the performance of valued activities long after
formal rehabilitation has ended (Page, Levine, Teepen & Hartman, 2008). If locomotion is
reliant on central pattern generators (CPG) – is it reasonable to investigate methods to activate
such networks (Dietz, 2002). Therefore, the NuStep recumbent stepper can be a potential
intervention to improve muscle activation and, perhaps, lower limb symmetry during gait with
chronic stroke patients. Over time, these improvements in gait may improve functional mobility
or quality of life. Stoloff, Zehr, and Ferris compared muscle activation and kinematics of 50%
and 0% bodyweight walking vs. recumbent stepping (2007). The authors suggested that walking
and recumbent stepping use similar muscular activation patterns despite substantial differences
in joint kinematics (e.g., the range of motion and temporal differences in muscle EMG).
Although these tasks differ in kinematics, recumbent stepping seems to rely on similar but
simpler neural networks as walking (Stoloff, Zehr et Ferris, 2007). Neurologically impaired
individuals may be able to improve walking ability from recumbent stepping (Huang & Ferris,
2009; Kao & Ferris, 2005; Stoloff, Zehr et Ferris, 2007; Zehr et al., 2007).
Spatiotemporal asymmetry is quite typical of poststroke gait. Hemiparetic gait is also
characterized by slow and asymmetric steps (Yavuzer et al., 2006). This asymmetry leads to
increased energy expenditure and risk of falls given equilibrium reaction is slowed (Sackley,
Baguley, Gent & Hodgson, 1992). Impaired balance and increased fall risk are strongly

5
correlated with abnormal locomotive ability, functional deficits and length of stay in inpatient
rehabilitation facilities (Pollock, Baer, Pomeroy and Langhorne, 2004). The restoration of hip,
trunk and limb mechanics including improved weighting bearing on the paretic limb is of top
priority in stroke rehabilitation. Since locomotion, balance and functional abilities (i.e., Activities
of Daily Living, ADL) are dependent on the paretic limb’s muscular activation - post-stroke, this
dissertation focused on the effect of two exercise modalities on muscular activation (as measured
by EMG) and joint excursion (∆ROM). The effect of a self-selected cadence (as determined by
an individual's perceived exertion) on lower extremity muscle activation (as measured by EMG
amplitude) on the NuStep Cross Trainer and Treadmill in a CVA population is yet to be
adequately investigated. Therefore, this investigation sought answers to the following research
questions: 1 - What is the mEMG/ ∆ROM response on TM vs. NS in CVA population? 2 - What
immediate effect does this modality have on gait in CVA? 3 - What is the mEMG/∆ROM
response to TM vs. NS in age/sex-matched population? 4 - What immediate effect does this
modality have on gait in CVA? The purpose of this investigation was, therefore, to compare the
effects of treadmill walking vs. recumbent stepping on muscle mean EMG (mEMG) and joint
excursion in chronic stroke survivors (i.e.,> 6 months post-CVA) vs. age (± 5 years) and sex-
matched healthy participants. Secondly, the immediate effect of each exercise intervention on the
participant's gait (over-ground 10m walk) was examined. We hypothesized that the TM would
promote higher mEMG values below the knee as compared to the NuStep Cross Trainer (Soloff,
Zehr, Ferris 2007). However, we expected to observe higher mEMG outputs in the thigh at a
matched RPE based SS cadence on the NuStep. We expected to see similar joint excursions in
the knee. However, we expected to see higher hip excursion but smaller ankle while on the

6
NuStep. Furthermore, it is hypothesized that following exercise on the NuStep Cross Trainer,
gait parameters would improve in the CVA population.

7
CHAPTER 2 BACKGROUND
Cerebral Vascular Accident
The brain is highly vulnerable to disturbances of its blood supply (Barrett, Barman,
Biotano, Brooks, 2012). CVAs are among the most frequent neurological disorders ranking fifth
in the cause of death in the United States (Kochanket et al., 2014). About 795,000 people in the
United States have a stroke each year (Mozzafarian et al., 2016). Stroke costs the United States
an estimated $34 billion each year (Benjamin et al., 2017). This total includes the cost of health
care services, medicines to treat stroke, and missed days of work (Benjamin et al., 2017).
Approximately 66% will survive (Palmer-McLean & Harbst, 2003). The majority of CVA cases
affect the elderly however 20% of strokes will occur in those less than 65 years of age (Palmer-
McLean & Harbst, 2003).
A CVA is the result of vascular insufficiency in the brain through occlusion or
hemorrhage of the brain's feeder vessels. This focal and acute disturbance not only affects
nutrient delivery (i.e., oxygen and glucose) but metabolite removal (i.e., carbon dioxide). Due to
this reduced blood supply (i.e., ischemia), CVA may breed both localized anoxia (i.e., the
absence of oxygen) and hypoglycemia (i.e., low glucose). When ischemic conditions are severe
and prolonged, neuronal infarction (i.e., neuron death) may occur. Atherosclerosis and
thrombosis cause most occlusive strokes (Barrett, Barman, Biotano, Brooks, 2012). By
comparison, hemorrhagic strokes are closely associated with advanced hypertension or an
aneurysm (Barrett, Barman, Biotano, Brooks, 2012). Additionally, plaque can activate the body's
clotting mechanism to reduce or worst-case block an artery. Strokes of either type may occur at
any age from many other causes, including hypertension, diabetes mellitus, coronary arterial
disease, smoking, alcoholism, trauma, infection, tumor, abnormal blood states (i.e., dyscrasia),

8
vascular malformation, immunological disorder, and exogenous toxins (Barrett, Barman,
Biotano, Brooks, 2012; Palmer-McLean & Harbst, 2003).
The resulting neurological impairment depends on both the size and location of the
ischemic area, as well as the availability of collateral blood flow (Palmer-McLean & Harbst,
2003). Following a CVA, persons may present with motor and sensory impairment, visual field
deficits, impaired speech (i.e., expressive and receptive aphasia), mental confusion (Palmer-
McLean & Harbst, 2003). Impairment of motor and sensory function may occur in the upper or
lower extremity, or in both extremities, on the involved side (Palmer-McLean & Harbst, 2003).
Cognitive and behavioral sequelae may influence exercise program retention and compliance
(Palmer-McLean & Harbst, 2003). Frontal lobe involvement may reduce the drive for exercise
initiation. Furthermore, apathy, frustration, loss of inhibition may occur as a result of impaired
cognitive and executive functions (Palmer-McLean & Harbst, 2003). Temporal lobe involvement
may limit future learning and interfere with memory recall (Palmer-McLean & Harbst, 2003).
Finally, brain areas that mediate perception and arousal may lead to difficulty in maintaining
attention (Palmer-McLean & Harbst, 2003).
Stroke is a leading cause of severe long-term disability. Stroke reduces mobility in more
than half of stroke survivors age 65 and over (Benjamin et al., 2017). If the majority of strokes
occur in the elderly, exercise prescription is further complicated by arthritis, orthopedic and
cardiovascular ailments prevalent in the elderly (Palmer-McLean & Harbst, 2003).
CVAs may occur secondary to atherosclerotic lesions (Palmer-McLean & Harbst, 2003).
Therefore many persons who experience a CVA have either coexisting coronary artery disease or
are at risk for developing coronary artery disease. Therefore, exercise testing should be
completed under the supervision of a qualified medical team complete with a 12-lead ECG

9
(Palmer-McLean & Harbst, 2003). The mode of exercise testing depends on the severity of
neurological involvement. Keep in mind; exercise testing with focal neurological deficits can be
more challenging than in the non-disabled persons (Palmer-McLean & Harbst, 2003). Exercise
training programs can improve VO2 peak, endurance, and muscle strength. As a direct result,
clients can elevate their independence and therefore become more employable (Palmer-McLean
& Harbst, 2003).
Retraining of walking is a significant goal for persons with stroke (Olney & Richards,
1996). Only 23-37% of persons who have sustained a stroke can walk independently after one
week (von Schroeder, Coutts, Lyden & Nickel, 1995) but 50-80% of survivors can ambulate
unaided at 3 weeks or discharge (Burdett, Borello-France, Blatchly & Potter, 1988). At six
months, <85% of survivors may walk unaided (Wade, Wood, Heller & Maggs, 1987). Reduced
walking speeds and extended stance phases, longer on the unaffected side, are reported (Olney &
Richards, 1996).
Locomotion
Humans utilize coordination patterns that maintain an integral frequency ratio between
the upper limbs and lower limbs. This “coupling” is apparent during whole body rhythmic
actions such as walking, crawling, and swimming. Muscle activation patterns and reflex
responses during multijoint and multi-limb task have suggested that the "coupling" is driven by a
neural component (Huang & Ferris 2009). Propriospinal connections between upper limb neural
networks and lower limb neural networks have been implicated for this facilitation. Previous
research on rhythmicity indicates that upper extremity activation (i.e., afferent feedback) may
improve lower limb muscle recruitment (Huang & Ferris 2009).

10
It is hypothesized that basic neural signals are produced by a locomotor pattern generator
and are shaped appropriately by cortical inputs and peripheral afferent feedback to regulate
rhythmic movement (Stoloff, Zehr & Ferris, 2007). Locomotion is produced at seemingly low
levels of the central nervous system (CNS) and is possible without intervention from higher
centers (i.e., midbrain, cerebral cortex). However, because locomotion may occur in unfamiliar
or unpredictable environments, higher center overwatch is often required (Pearson & Gordon,
2013). Real-time modification of the conventional- locomotive – motor program is necessary to
adapt to changing environments. We must consider how neurons coordinate locomotion and how
sensory input (e.g., visual, touch, or proprioceptive) may alter locomotion.
Modern research on the neural control of locomotion reached breakthrough by
application of adrenergic drugs and later, the electrical brain stimulation of a de-cerebrate cat
(Schmidt et al., 2018). Animal modeling (e.g., drug preparation, decerebrate preparation,
deafferented preparation, immobilized preparation) of quadrupedal stepping have eluded that
supraspinal commands are not necessary to produce the stepping motor pattern. The spinal cord
neuron also houses the neural circuits responsible for locomotion. These spinal neurons are
subject to supraspinal modulation. Lastly, these spinal pattern-generating networks do not
require sensory input, however, are strongly influenced by the limb’s sensory input (Pearson &
Gordon, 2013).
Locomotion involves the coordinated contraction of several muscles. The analysis of gait
reveals inherent complexities. However, gait may be broken into four distinct parts (Table 1).
The stepping motor pattern is not merely an alteration of flexion and extension; instead,
contractions are precisely timed and scaled to achieve a specific task (Pearson & Gordon, 2013).
Contraction of the flexor muscles occurs during the early swing. Extensor muscles will contract
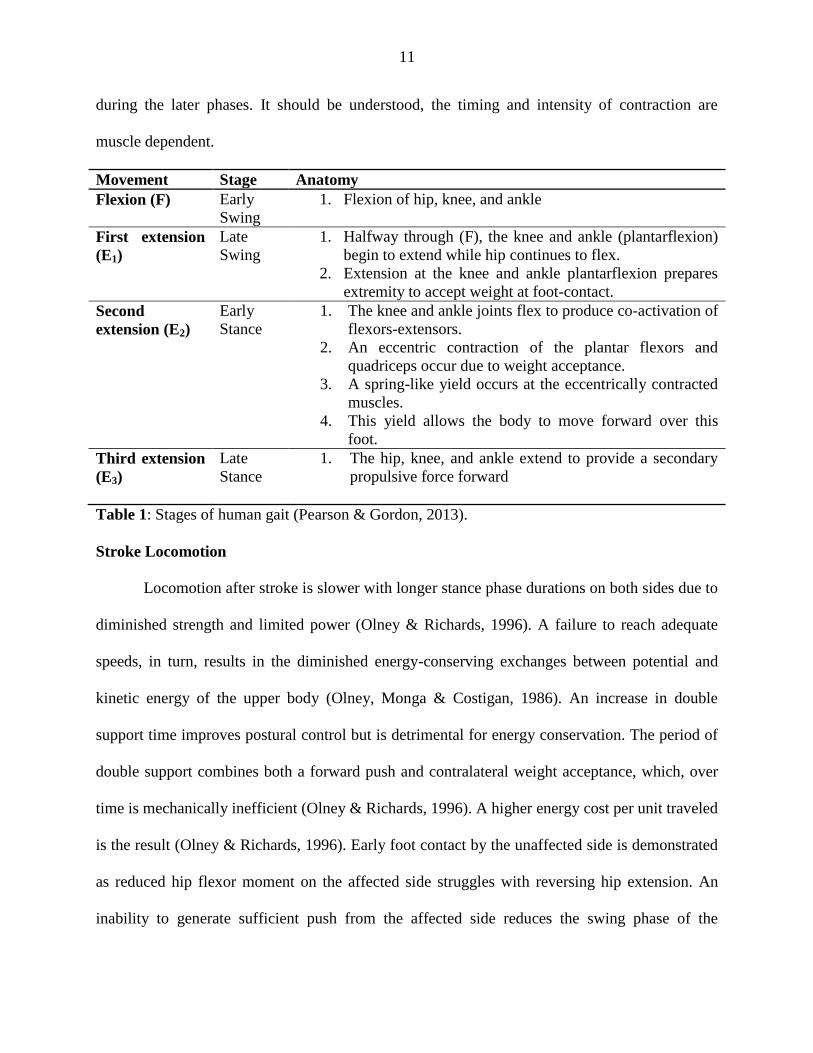
11
during the later phases. It should be understood, the timing and intensity of contraction are
muscle dependent.
Movement Stage Anatomy
Flexion (F) Early
Swing
1. Flexion of hip, knee, and ankle
First extension
(E1)
Late
Swing
1. Halfway through (F), the knee and ankle (plantarflexion)
begin to extend while hip continues to flex.
2. Extension at the knee and ankle plantarflexion prepares
extremity to accept weight at foot-contact.
Second
extension (E2)
Early
Stance
1. The knee and ankle joints flex to produce co-activation of
flexors-extensors.
2. An eccentric contraction of the plantar flexors and
quadriceps occur due to weight acceptance.
3. A spring-like yield occurs at the eccentrically contracted
muscles.
4. This yield allows the body to move forward over this
foot.
Third extension
(E3)
Late
Stance
1. The hip, knee, and ankle extend to provide a secondary
propulsive force forward
Table 1: Stages of human gait (Pearson & Gordon, 2013).
Stroke Locomotion
Locomotion after stroke is slower with longer stance phase durations on both sides due to
diminished strength and limited power (Olney & Richards, 1996). A failure to reach adequate
speeds, in turn, results in the diminished energy-conserving exchanges between potential and
kinetic energy of the upper body (Olney, Monga & Costigan, 1986). An increase in double
support time improves postural control but is detrimental for energy conservation. The period of
double support combines both a forward push and contralateral weight acceptance, which, over
time is mechanically inefficient (Olney & Richards, 1996). A higher energy cost per unit traveled
is the result (Olney & Richards, 1996). Early foot contact by the unaffected side is demonstrated
as reduced hip flexor moment on the affected side struggles with reversing hip extension. An
inability to generate sufficient push from the affected side reduces the swing phase of the

12
unaffected side (Olney and Richards, 1996). The affected side will have diminished knee flexion
in the swing as the stroke survivor has the desire to keep the foot close to the ground.
Furthermore, fear of lateral instability reinforces the need for double support (Olney and
Richards, 1996). There is limited dorsiflexion at initial contact and during stance after stroke
(Olney & Richards, 1996). Limited dorsiflexion stems from diminished strength and inadequate
voluntary activation of the dorsiflexors. A lack of recruitment acuity in the shank may result in
co-activation of the plantarflexors. Coupled with increased stiffness of the ankle plantarflexors
(Dietz & Berger, 1984), ankle dorsiflexion is inadequate to clear the floor in swing (Olney &
Richards, 1996).
The affected side knee may experience excessive knee flexion or hyperextension during
stance. The person may seek stability and demonstrate hyperextension (compared to an able-
bodied person) or excessively flex the knee because of reduced moment generation of the knee
extensors, ankle plantarflexors and the hip extensors (Olney & Richards, 1996). Continued knee
hyperextension into late stance prevents an effective push (Olney & Richards, 1996). In this
case, failure to flex the knee causes the limb to stay extended through swing. To prevent
dragging of the affected foot, the hip may hike or circumduct to clear the floor.
There is also evidence to suggest inappropriately timed and graded contraction on the
affected side (Olney & Richards, 1996). A forward postural lean is coupled with continued
activation of the hamstrings in the stance phase of the affected side (Olney & Richards, 1996).
The hip and knee seem to compensate (i.e., extended activity) for diminished plantarflexion.
Keep in mind; ankle plantarflexion is higher on the unaffected side. Overall, there is an excessive
energy cost per unit walked (Olney & Richards, 1996).
13
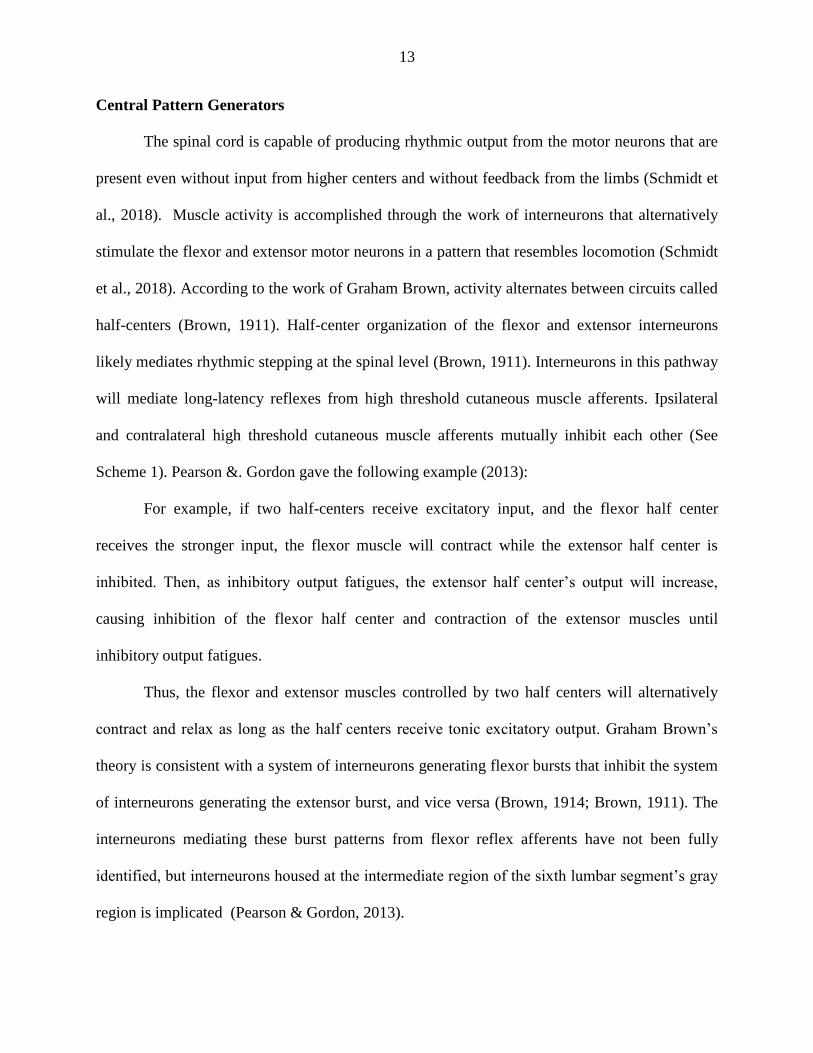
Central Pattern Generators
The spinal cord is capable of producing rhythmic output from the motor neurons that are
present even without input from higher centers and without feedback from the limbs (Schmidt et
al., 2018). Muscle activity is accomplished through the work of interneurons that alternatively
stimulate the flexor and extensor motor neurons in a pattern that resembles locomotion (Schmidt
et al., 2018). According to the work of Graham Brown, activity alternates between circuits called
half-centers (Brown, 1911). Half-center organization of the flexor and extensor interneurons
likely mediates rhythmic stepping at the spinal level (Brown, 1911). Interneurons in this pathway
will mediate long-latency reflexes from high threshold cutaneous muscle afferents. Ipsilateral
and contralateral high threshold cutaneous muscle afferents mutually inhibit each other (See
Scheme 1). Pearson &. Gordon gave the following example (2013):
For example, if two half-centers receive excitatory input, and the flexor half center
receives the stronger input, the flexor muscle will contract while the extensor half center is
inhibited. Then, as inhibitory output fatigues, the extensor half center’s output will increase,
causing inhibition of the flexor half center and contraction of the extensor muscles until
inhibitory output fatigues.
Thus, the flexor and extensor muscles controlled by two half centers will alternatively
contract and relax as long as the half centers receive tonic excitatory output. Graham Brown’s
theory is consistent with a system of interneurons generating flexor bursts that inhibit the system
of interneurons generating the extensor burst, and vice versa (Brown, 1914; Brown, 1911). The
interneurons mediating these burst patterns from flexor reflex afferents have not been fully
identified, but interneurons housed at the intermediate region of the sixth lumbar segment’s gray
region is implicated (Pearson & Gordon, 2013).

14
The network capable of generating a rhythmic pattern of motor activity without phasic
and peripheral input is a central pattern generator (CPG). CPGs have been analyzed and
identified in 50+ motor systems that produce rhythmic behaviors such as walking, swimming,
feeding, respiration and flying (Pearson & Gordon, 2013). Experimental induced CPGs, as
compared to the naturally occurring phenomenon may differ. In nature, the shapes of these CPGs
are, perhaps modulated by a sensorial input. The CPG’s motor activity will depend on three
factors (Table 2).
Cellular properties Synaptic properties Patterns of connections
Threshold Sign Reciprocal inhibition
Frequency-current
relationship
Strength Recurrent inhibition
Spike frequency
adaptation
Time course Parallel excitation and
inhibition
Post-burst
hyperpolarization
Transmission
(electrical, chemical)
Mutual excitation
Delayed excitation Release mechanisms
(spike, graded signal)
Post-inhibitory periods Multi-component postsynaptic
potentials
Bursting
(endogenous, conditional)
Facilitation/ depression
(short term, long term).
Table 2: Rhythmic motor activity generated by CPGs depends on three factors: (1): Cellular
properties, (2): Synaptic properties between neurons and (3): Patterns of connections between
neurons. Adopted from Pearson & Gordon (2013).
A simple network can generate rhythmic activity if a neurons firing rate can be inhibited
or promoted per a timing pattern. For example, there is a brief increase in excitability of a neuron
after an inhibitory tone has ended (i.e., post-inhibitory rebound). Two neurons that mutually
inhibit each other (Scheme 1) can oscillate in an alternating fashion (i.e., each neuron has post-
inhibitory rebound). Other time-dependent processes include synaptic depression, delayed
excitation, and differences in time course of synaptic actions connecting two neurons (Pearson &
Gordon, 2013).

15
The sequencing of motor neuron activity is regulated by diverse mechanisms (e.g.,
mutual inhibition, the rate of recovery from inhibition, mutual excitation) (See: Scheme 3).
Mutual inhibition occurs when neurons firing in opposite phases are typically reciprocally
coupled by inhibitory connections. Neurons may differ in the rate of inhibitory recovery. This
rate will influence a different temporal onset of activity in two neurons that have been released
from inhibition. Mutual excitation establishes synchronous firing in neuronal groupings. When a
rapid, high-intensive burst of neurons is required, a mutual excitation can instigate the process
(Pearson & Gordon, 2013).
Mammals constantly adjust to terrain and external conditions. These adjustments result in
a motor pattern specific to the needs of the acute scenario. Input from the visual, vestibular and
somatosensory systems may give precision to the foundational CPG. Proprioceptive input (i.e.,
via the Golgi tendon apparatus, muscle spindle, joint receptors) regulates the timing and
amplitude of stepping.
This regulation is best shown in animal preparation (e.g., spinal and de-cerebrate cats)
where intact proprioceptive input allows the animal to match the speed of a motorized treadmill.
As speed has increased, the stepping rate increased via a reduction in time spent in stance phase
(Pearson & Gordon, 2013). Proprioception regulates the timing and amplitude of stepping
(Pearson & Gordon, 2013).
Sensory input, in part, regulates the length of stance and initiation of swing. During
entrainment, a burst of activity in hip flexor motor neurons is initiated in synchrony with hip
extension (Kriellaars, Brownstone, Noga, & Jordan, 1994). The afferent input that codes the
correct hip angle at which swing initiation will arise is from the hip flexor's spindle (Pearson &
Gordon, 2013). The stretching of the hip flexor inhibits the extensor's half center and will

16
facilitate burst activity in flexor motor neurons during gait (Hiebert, Whelan, Prochazka, &
Pearson, 1996).
Scheme 1: CPG Networking: With tonic-excitatory input, inhibitory fatigue allows alternative
contraction of flexor-extensors half centers. (++) stimulus strength > (+) stimulus strength;
Scheme inspired by Pearson & Gordo (2013).
Scheme 2: Locomotor Pattern Generator: The primary rhythmic activity is produced by mutually
inhibiting flexor and extensor half centers. The interneurons of these half centers drive motor
neurons through an intermediate patterning network. This network controls the timing of
activation of motor neurons across classes. Scheme inspired by Pearson & Gordo (2013).
Motor
Patterns
Motor Patterns
Extensor Half
Center
Flexor Half
Center
Contraction No Contraction
++ +
Contraction
-
No Contraction
Fatigue
Tonic Stimulus
-
Extension
Pattern Network
Flexion
Inhibitory
Neuron
Inhibitory
Neuron
Afferent Signals
Motor Neurons
Descending Signal

17
Unloading of the extensor muscle occurs typically near end of stance. Extensor muscles
must be unloaded to reduce GTO activity. Stimulation of the extensor's GTO and muscle spindle
has prolonged stance phase as the GTO has an excitatory action on the ankle dorsiflexors during
gait (Whelan, Hiebert, & Pearson, 1995). Other limbs accept the weight, and the extensor
muscles are shortened which compromises the ability to produce high levels of force.Three
excitatory pathways transmit sensory information from extensor muscles to extensor motor
neurons:
1. Primary muscle spindles (group Ia afferent); mono-synaptic
2. Primary muscle spindles (group Ia afferent) and GTOs (group Ib afferent); disynaptic
3. Primary muscle spindles (group Ia afferent) and GTOs (group Ib afferent) + interneurons
in the CPG; polysynaptic.
Afferent pathway from extensor muscle: Two mutually inhibiting groups of extensor and flexor
interneurons constitute a CPG. Feedback from extensor muscles increase the activity in extensor
motor neurons during stance and maintains activity while the extensor muscles are loaded
(Pearson & Gordon, 2013). Ongoing and continuous regulation of extensor activity is completed
through proprioceptive feedback. Feedback allows automatic adjustment of the force and length
in extensor muscles in response to changing conditions (Pearson & Gordon, 2013). Additionally,
cutaneous (i.e., exteroreceptors) receptors adjust stepping to external stimuli. Sensory input from
the skin allows stepping to adjust to unexpected obstacles. This adjustment, however, is phase
dependent. The same stimulus excites one group of motor neurons during one phase of
locomotion may activate the antagonist motor neurons during another phase (Pearson & Gordon,
2013).
The CPG is thought to be activated or deactivated by supraspinal centers. In some cases,
only a single pulse is required to initiate the CPG with no further higher level activity necessary
for the oscillator to continue to operate (Schmidt et al., 2018). In other cases, a continuous input

18
but not necessarily rhythmic may be necessary (Schmidt et al., 2018). The activity may also be
turned on by sensory input. Therefore, they can be turned on by a variety of stimulation sources,
and they can continue until they are “run down” or are stopped by some other source of input
(Schmidt et al., 2018). Although the prewired CPG evokes stereotyped action, modification of
the basic pattern is possible in “higher” species such as cats (Schmidt et al., 2018). Examples of
modification include speed and force of pattern. Additionally, lower feedback sources may serve
to alter the particular pattern. Lastly, these pattern generators do not require conscious awareness
to operate. Once initiated, they may continue without the involvement of the higher centers shall
the environment not require high levels of attention (Schmidt et al., 2018).
Descending Signals
Stepping’s basic motor pattern may be generated in the spinal cord. Fine control and
modulation of stepping involve higher brain regions such as the motor cortex, cerebellum, and
brainstem. Neurons in these regions are also rhythmically active during locomotion. Each region,
however, plays a differing role in the regulation of normal locomotive function (Pearson &
Gordon, 2013).
Visual information is relayed to motor cortex which enables guidance to movement. The
visual cortex projects to the motor cortex. This pathway can also modify stepping movements
according to visual input. Many neurons of the cortex project directly to the spinal cord and thus
regulate the CPG’s interneurons for locomotion. This projection helps the motor cortex adapt the
timing and magnitude of motor activity to a specific task (Pearson & Gordon, 2013).
The cerebellum receives signals from both peripheral receptors (via the dorsal tracts) and
spinal CPGs and adjusts locomotion via the brainstem’s nuclei. The cerebellum modulates the

19
motor system. The cerebellum alters motor commands issued by the motor hierarchy to improve
efficiency by three primary functions in motor control:
1. Comparison: The cerebellum compares intended movements to actual movements and
corrects continuous movement in real time to minimize error.
2. Procedural Memory: The cerebellum plays a critical role in motor learning.
3. Integration: The cerebellum integrates information from entire motor hierarchy and
proceeds to coordinate all aspects (from the spinal cord, brain stem, and cerebral
cortex) leading to smooth and coordinated movement.
Most human CPG evidence comes from investigating human development. If an infant is
held upright and moved over a horizontal surface; the baby can inadvertently mimic a stepping
pattern. This mimicry suggests that basic neuronal circuits – characteristic of our species are in
fact present at birth. Stepping has also been documented in infants with anencephaly (i.e., infants
lacking cerebral and skull structure). Therefore, it is suggested that CPG circuits are located at or
below the brain stem (Pearson & Gordon, 2013).
As automatic stepping turns to a functional walk, it is thought that supraspinal centers
have begun regulation of the lower hierarchy. This voluntary control may be a result of the
maturation of the reticulospinal pathway and regions of the brain stem (Pearson & Gordon,
2013). It is also plausible that descending brain systems have maturated and modulation of this
matured system has begun.
Currently, serotonin and norepinephrine are thought to be modulators of the human
locomotor system. These modulators regulate the magnitude and timing of motor neuron activity
in the spinal cord (Pearson et Gordon, 2013). NMDA-type receptors in the spinal cord are
thought to initiate locomotor activity (Pearson & Gordon, 2013). Current evidence suggests that
the signal to activate locomotion and later to control speed is transmitted to the spinal cord by
glutamatergic neurons in the ventral reticulospinal pathway.

20
Evidence suggests that human walking relies on the same general principles of neuron
organizations as quadrupedal walking (Pearson & Gordon, 2013). Intrinsic oscillatory networks
are activated and modulated by higher brain centers and afferent input. However, a bipedal
movement may place a higher demand on supraspinal centers. This demand may, in part, explain
why human locomotion occurs later in life as compared to other species (Pearson & Gordon,
2013).
Motor Memory Consolidation
Shadmehr et. Holcomb (1997) demonstrated a structural shift in how the human brain
consolidates motor memory. Using positron emission tomography (PET), the authors monitored
regional cerebral blood flow, an indirect marker of neural activity. The investigation
demonstrated that consolidation occurs through a shift from prefrontal regions of the cortex to
the premotor, posterior parietal and cerebellar cortex structures. This shift was specific to the
recalled and learned motor skill (rapid movements in a particular design against a robot induced
resistance). With the passage of time, the devolvement of the prefrontal cortex suggests a change
in the neural representation of the task's internal model. This change in neural representation may
underlie the increased stability found in long-term memory.
Exercise and Neural Plasticity
Trained muscles generate a given amount of submaximal force with less EMG activity;
suggesting a more efficient motor unit recruitment with practice (Kenney, Willmore & Costill,
2015). The benefits of physical activity on cognitive function have been previously linked.
Physical activity can impact a wide variety of cognitive and learning processes including
executive control, attention processing, and spatial memory. Exercise elicits structural plasticity
in a wide variety of brain regions related to cognitive function. Neural plasticity is the change in

21
neural structure and function in response to experience based stimuli including hippocampal
angiogenesis, changes in dendritic density/volume and neurogenesis (Kandel at al., 2015).
Long-term potentiation (LTP) and long-term depression (LTD) in the hippocampus are
implicated in the generation of long-lasting changes in synaptic function (i.e., synaptic plasticity)
(Pearson & Gordon, 2013). The bidirectional control of synaptic strength by LTP and LTD is
believed to be essential for experience-dependent plasticity. LTP is NMDA receptor and
experience dependent. LTP may work through transcription (receptor trafficking) or receptor
function (phosphorylation). LTP is modifiable and changing often. LTP is thought to play a role
in how motor patterns are learned and consolidated.
It seems that growth factors are implicated in mediating structural and cognitive plasticity
post exercise. Growth factors include; Insulin-Like Growth Factor – 1 (IGF-1), Vascular
Endothelial Growth Factor (VEG-F) and Brain-Derived Neurotrophic Factor (BDNF). These
growth factors can influence the brain directly, and they have been shown to be important in
neurogenesis and the antidepressant effects of exercise in animal models. Exercise can also alter
the synthesis of these growth factors in the areas of the hippocampus, cortex, and amygdala.
Blocking the function of BDNF has been reported to prevent the enhancement of cognitive
function produced by exercise in rats (Kandell et al., 2015). BDNF could also contribute to the
increase in synaptic plasticity and neurogenesis following exercise. In addition to enhancing
cognitive function and learning and memory processes, physical activity is also well known to
confer protection against deleterious effects of stress, a "stress-buffering effect."
One issue that arises when investigating the effects of exercise on brain and behavior is the
ability to differentiate exercise effects from those of environmental enrichment. Recent work
seems to suggest that long-term exercise by rodents have effects that are above and beyond those
22
demonstrated by enriched environments. Therefore, at least some of the benefits of exercise are
independent of environmental enrichment.
Exercise's improvement of cognition (i.e., attention processing, executive function) and
hippocampal-dependent memory have primarily been demonstrated primarily in aerobic exercise
and yoga. Exercise has also demonstrated stress resilience effect reducing occurrences of
anxiety and depression. The effects of exercise may have a top-down effect (i.e., brain to
muscle) or a "bottom-up" effect (muscle to the brain). Areas of neural circuitry activated during
exercise may provide signaling to induce change (i.e., motor systems, reward areas).
Additionally, the periphery may signal the CNS via myokines or gut microbial resulting in brain
adaptability and plasticity. Both these systems are thought to work through norepinephrine and
serotonin pathways.
Recommendation for Exercise Programming with Stroke Survivors
Exercise training programs can improve mobility and independence post CVA. The
ability to exercise will depend on the severity of neurological involvement and existing co-
morbidities (Palmer-McLean & Harbst, 2003). Muscle weakness, limited range of motion and
impaired sensation may preclude independent ambulation and or ability to exercise in the
standing position. Lack of adequate balance may interfere with seated arm or leg ergometry.
Muscular weakness and limited range of motion may also interfere with a person’s ability to
maintain crank rates (Palmer-McLean & Harbst, 2003). Aphasia, apraxia, and mental confusion
may interfere with the ability to comprehend directions during exercise. The exercise
professional should consider the client’s motor abilities when selecting an appropriate exercise
device. Common exercise modes are discussed in the following sections:

23
Treadmill.
Treadmill use may be appropriate for individuals with minimal motor impairment, who
have stable standing balance and can ambulate independently without an assistive device
(Palmer-McLean & Harbst, 2003). Previous trials suggest that task-specific training regimens
increase affected leg movement (Macko et al., 2005; Smith, Silver, Golberg & Macko, 1999).
Furthermore, the task-specific nature of this therapy increases plasticity in the spinal cord and
improves functional mobility (Stoloff, Zehr & Ferris, 2007). Treadmill exercise should avoid
abrupt changes in speed to reduce fall risk (Palmer-McLean & Harbst, 2003). Individuals with a
sensorimotor impairment that result in weakness, loss of movement, or balance deficits may be
unsafe on the treadmill (Palmer-McLean & Harbst, 2003). To improve safety and, in cases of
severe weakness, bodyweight harnesses may be utilized to prevent a fall in the event of a misstep
or loss of balance (Palmer-McLean & Harbst, 2003). Preferred walking speeds will be much
slower, and energy expenditure at a specific work rate will be 55-64% greater in individuals with
a CVA (Palmer-McLean & Harbst, 2003).
Ergometry.
Standard leg cycle ergometry may be utilized if the individual can safely maintain sitting
balance (Palmer-McLean & Harbst, 2003). The affected extremities may require strapping to
maintain machine contact if the individual cannot keep it secure independently. Exercise
guidelines should be individualized; however, general testing guidelines have been suggested
(i.e., 50 revolutions per minute with an output of 20 watts, with 20-watt increments per stage)
(Palmer-McLean & Harbst, 2003).
If spasticity or muscle weakness in the affected extremity interferes with the ability to
maintain pedal cadence, individuals could only use the unaffected side. However, it may be
24
difficult to achieve a work rate that can stress the heart. Therefore, combination ergometers (i.e.,
arms plus legs) are particularly useful. That is if spasticity or weakness of the affected side does
not interfere with global, whole-body cadence (Palmer-McLean & Harbst, 2003). A hand/foot
strap or mitt may be used to secure the hand of an individual whose extremity control is
compromised (Palmer-McLean & Harbst, 2003). Situations that require the use of straps should
be closely supervised (Palmer-McLean & Harbst, 2003).
NuStep Cross Trainer.
Exercise interventions that approximate the stepping motion could be useful for the
neurological rehabilitation of gait (Stoloff, Zehr & Ferris, 2007). Bilateral, recumbent training
devices offer a promising alternative to treadmill based approaches (Page, Levine, Teepen &
Hartman, 2008). The NuStep combines both arm and leg exercise in a seated position (Palmer-
McLean & Harbst, 2003). This device includes a seat with back support with the option of a
seatbelt that produces additional trunk stability for the client with poor seated balance (Palmer-
McLean & Harbst, 2003). For the client with significant mobility impairment, the seat can swivel
to accommodate a transfer. Additionally, the armrests can hinge upward further facilitating
transfer onto the device (Palmer-McLean & Harbst, 2003). Arm handles require a neutral-like
position that is easier for clients with a limited range of motion. It is thought that this neutral-like
position encourages a more upright trunk position (Palmer-McLean & Harbst, 2003). Finally, as
opposed to tradition bike pedals, the NuStep’s footplate contains raised lateral and posterior
borders to maintain foot contact (Palmer-McLean & Harbst, 2003). Foot straps are optional.
Older adults seem to prefer the recumbent position (Looney & Rimmer, 2003).
The NuStep Cross-trainer simulates the reciprocal motion of walking but in a seated and
controlled manner. Differences between the NuStep and walking on joint kinematics (e.g.,

25
reduced the range of motion and shank temporal differences in muscle electromyography) have
been documented (Stoloff, Zehr & Ferris, 2007). This research on the NuStep Cross Trainer has
demonstrated that the quadriceps group (Vastus Medialis, Vastus Lateralis, and Rectus Femoris),
medial hamstring, Soleus, and Gastrocnemius are primarily driving the pedals down phase
(Huang & Ferris, 2004; Stoloff, Zehr & Ferris, 2007) (See Figure 2). Whereas, the anterior
tibialis couples with the medial hamstring and gastrocnemius to drive the pedals’ up phase (See
Figure 3).
Movements of the handles are coupled to that of the foot pedals, so that extension of the right leg
is associated with retraction of the left handle (Huang and Ferris, 2004). This mechanical
coupling allows the arms to assist leg motion and vice versa (Zehr et al., 2007). Previous
research on rhythmicity indicated that upper extremity activation and the consequential afferent
feedback might improve lower limb muscle recruitment. As a result, researchers have
demonstrated facilitation of leg muscles by simultaneous arm movements (Huang & Ferris,
2004; Billinger, Loudon & Gajewsk, 2008; Huang & Ferris, 2009). However, when legs are
maximally activated, the combination of arm and leg movements did not provide additional
facilitation to the already activated leg muscles (Huang & Ferris, 2004, Huang & Ferris, 2009).
Ipsilateral coupling was also demonstrated when upper limb muscle activation increased muscle
activation more in the same side lower limb as compared to the contralateral side. Reflex studies
suggest that contralateral upper to lower limb coupling may be more prevalent during rhythmic
movement compared to ipsilateral upper to lower limb coupling. Therefore, these data suggested
that the supraspinal drive may be more critical compared to spinal mechanisms (i.e., contralateral
reflexes) during maximal effort on the NuStep (Huang & Ferris, 2009a). In a subsequent
investigation, arm movement also facilitated lower extremity electromyography (EMG) in

26
submaximal recumbent stepping (de Kam et al., 2013). When arm and leg movements were
mechanically decoupled, maximal arm movement still facilitated muscle activity in passively
moved legs (Billinger, Loudon & Gajewski, 2008).
Assumptions and Limitations
The subsequent investigation assumed that individuals studied put forth adequate effort.
Geographic area was the City of Detroit and surrounding areas, which may limit conclusions to
urban settings. The findings of this investigation are limited to the laboratory setting. Studied
sample may not be representative of the larger population.

27
CHAPTER 3 METHODS MUSCLE ACTIVATION PILOT 1
Participants
Healthy males and females (n = 23) aged 23.52 ± 4.23 years were recruited to participate
in the study. Participants had no neurologic conditions or acute orthopedic surgeries that
impaired their ability to step. Furthermore, any cardiopulmonary diagnoses that reduced exercise
capacity were excluded from this investigation. Participants had no known skin allergies to
topical agents or adhesives. Participants signed an informed consent before testing. The
investigation was approved by Wayne State University’s institutional review board (Appendix
A).
Measures
An instrumented version of the commercially available T5 NuStep Recumbent cross
trainer (NuStep Inc., Ann Arbor, MI, USA) was utilized. The instrumented T5 NuStep
Recumbent Cross Trainer can measure cadence of the participant (electronic step cadence meter
and counter) while providing real-time visual feedback on pace against 15 levels of resistance
(15 being the most challenging; at 1.0 increments of resistance). Both distal and proximal foot
straps were utilized. The participant confirmed symmetrical tightness between each foot before
all exercise bouts. Participants performed recumbent stepping without upper extremity
assistance. The seat position was set so that the participant's right knee was near full extension
(~15-20° of knee flexion when full knee extension = 0°) at the step's terminal range of motion. A
goniometer was used to measure both the knee at full knee extension (i.e., pedal down) and right
knee flexion (pedal up position). As the participants remained seated, the center of a handheld
goniometer was placed over the lateral epicondyle of the femur. The proximal arm was placed at
the lateral midline of the femur with reference to the greater trochanter whereas the distal arm
28
was aligned the lateral midline of the fibula with reference to the lateral malleolus. The degree of
knee motion was quantified by both the participant's seat position and the degree of knee
extension. Participants were instructed to keep their pelvis stable to reduce ipsilateral rotation
and posterior tilting while stepping. Lastly, participants were instructed to step at a range of
motion – that was as great as possible without using the pedal’s end range bumper to propel the
subsequent step and for which the seat position allowed one to remain seated.
Each electrode location was prepared by cleaning with rubbing alcohol and abrasive
paper (Electrode Skin Prep Pads, Dynarex Corporation, Orangeburg, NY, USA). The electrodes
(pre-gelled Ag/AgCl Noraxon Single Electrode, Noraxon USA Inc., AZ, USA) were placed over
the muscle belly along the long axis and secured with paper tape based upon the Surface
Electromyography for the Non-Invasive Assessment of Muscles (SENIAM’s) recommendations
(Hermens et al., 1999). The alcohol was allowed to vaporize so that the skin was dry before
electrode placement. The reference electrode was placed at a location in which the risk for
disturbance signal was minimized. After the electrodes were placed, the electrode’s (including
the reference electrode) signal was assessed for contamination of movement artifacts and
background noise. The electrode’s final location was determined based on both initial palpation
and assessment of signal quality.
We recorded muscle activity from 12 muscles (6 per lower extremity) using a surface
electromyography system (16 channel wireless) with an EMG bandwidth of 5-500 Hz (Noraxon
Inc. Scottsdale, AZ, USA). The Noraxon EMG system was synced with the instrumented
NuStep cross trainer using a customized program written in Labview (National Instruments,
Austin, TX, USA). This program collected EMG data in alternating 10-second epochs for the 3
minutes (minutes 2-4) of the 5-minute exercise protocol. EMG was processed with a second

29
order high pass filter (cut off frequency 80-250 Hz) with zero phase lag to attenuate low-
frequency components such as mechanical artifact. EMG data were full wave rectified, smoothed
at 300ms and normalized to the participant’s maximum voluntary contraction (MVC). Mean
EMG amplitude (mEMG) and peak EMG amplitude (pEMG) data were converted to a
percentage of MVC. mEMG and pEMG of the rectus femoris (RF), vastus medialis oblique
(VMO), semitendinosus (ST), tibialis anterior (TA), medial gastrocnemius (MG) and soleus
(SOL) were recorded bilaterally.
Procedures
Before subsequent measurement blocks and to better acclimate to the task, participants
performed two practice 5-second MVCs. The subsequent measured MVC blocks required 3 sets
of 5 seconds each. Knee extension (i.e., VMO and RF MVC) was performed seated and at 60º
and 15º of knee extension (0º = full knee extension). Knee flexion (i.e., ST MVC) was also
performed seated and at 60º (0º = full extension) of knee flexion. SOL and TA MVCs were
performed supine with hip and knee flexion of 90°. All MVCs were performed on the Humac
Norm Machine (Computer Sports Medicine, Stoughton, MA, USA) except for bilateral
plantarflexion (i.e., MG MVC). Bilateral MG MVC was performed standing and through active
plantarflexion while full knee extension was maintained. Peak force and pEMG amplitude (uV)
were recorded.
Initial cadence was first subjectively chosen by the participant in response to the
statement "step at a pace in which you're comfortable." After each progressive minute,
participants were asked to report their rating of perceived exertion (RPE) (Appendix C). If a
participant reported below 12 or higher than 16 on the RPE scale during any one of the interval
checks, the participant was instructed to speed up – or slow down accordingly. The perceived
30
exertion based SS cadence was then estimated as an average over the 10 min SS protocol. During
this 10 min SS protocol, a clipboard covered the digital output so that no visual feedback on step
rate was provided during the determination of SS cadence. The instrumented T5 NuStep cross
trainer calculated SS cadence. This average (i.e., steps/min) was later rounded to meet the 5
step/min intervals of the system's pace partner. This pace partner would later establish cadence
for the participant during each of the exercise protocols.
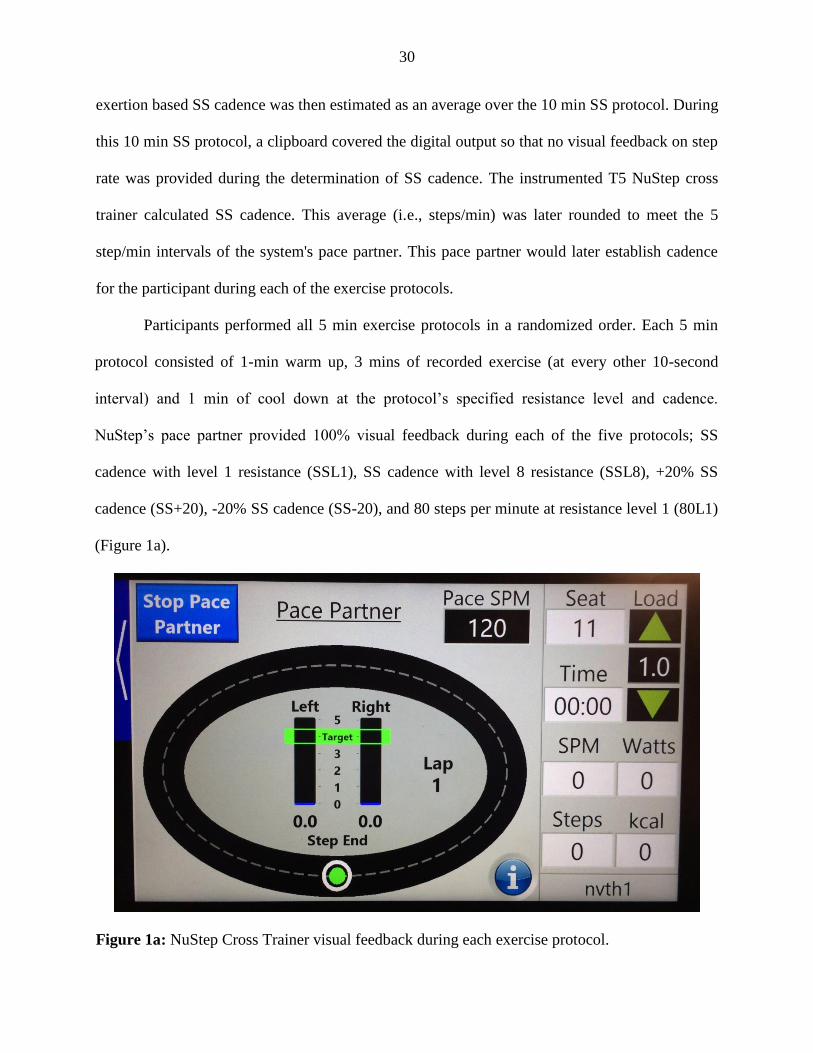
Participants performed all 5 min exercise protocols in a randomized order. Each 5 min
protocol consisted of 1-min warm up, 3 mins of recorded exercise (at every other 10-second
interval) and 1 min of cool down at the protocol’s specified resistance level and cadence.
NuStep’s pace partner provided 100% visual feedback during each of the five protocols; SS
cadence with level 1 resistance (SSL1), SS cadence with level 8 resistance (SSL8), +20% SS
cadence (SS+20), -20% SS cadence (SS-20), and 80 steps per minute at resistance level 1 (80L1)
(Figure 1a).
Figure 1a: NuStep Cross Trainer visual feedback during each exercise protocol.

31
Participants were instructed to keep their representative green circle (i.e., their current and real-
time speed) inside the pace partner's white circle (i.e., pace partner) by stepping at their measured
RPE based self-selected (SS) average steps per minute (aSPM). The pace partner progressed
counterclockwise around the visual track displayed in front of the exercising participant.
Statistical Analysis
pEMG and mEMG were used to describe intramuscular signaling. pEMG and mEMG
were evaluated by IBM SPSS Statistics 23. Twelve (i.e., 6 right, 6 left) one-way within subject
ANOVAs were conducted to determine protocol effect on each muscle. All data were checked
for one-way within-subject ANOVA assumptions including sphericity (Meyers, Gamst &
Guarino, 2006, Vincent & Weir, 2012). Following a statistically different Mauchly’s test of
sphericity (p < .05), the sphericity corrected Greenhouse-Giesser F ratio was evaluated at p < .05.
A pairwise t-test with a Bonferroni-corrected alpha was applied to the means of the 5 protocols
post hoc, (i.e., exploratory α = 0.10/ 10 comparisons = 0.01).
32
CHAPTER 4 RESULTS – MUSCULAR ACTIVATION – PILOT PART 1
Participant’s mean height and weight were 1.68m ± 0.13m and 69.54kg ± 26.70kg,
respectively (BMI = 24.32 ± 9.38). The most frequent seat position was NuStep setting #10 (n =
6, seat position ranged #5-13). Seat position resulted in a static mean right knee extension of
19.64 ± 6.25º and 78.82 ± 5.74º of right knee flexion at a terminal range of motion (full knee
extension = 0º). Participant’s RPE based SS cadence was 123.86 ± 18.12 steps per minute (spm).
Mean cadence was calculated at 103.64spm ± 21.94spm for SS-20 and 142.73spm ± 25.25 spm
for SS+20 respectively.
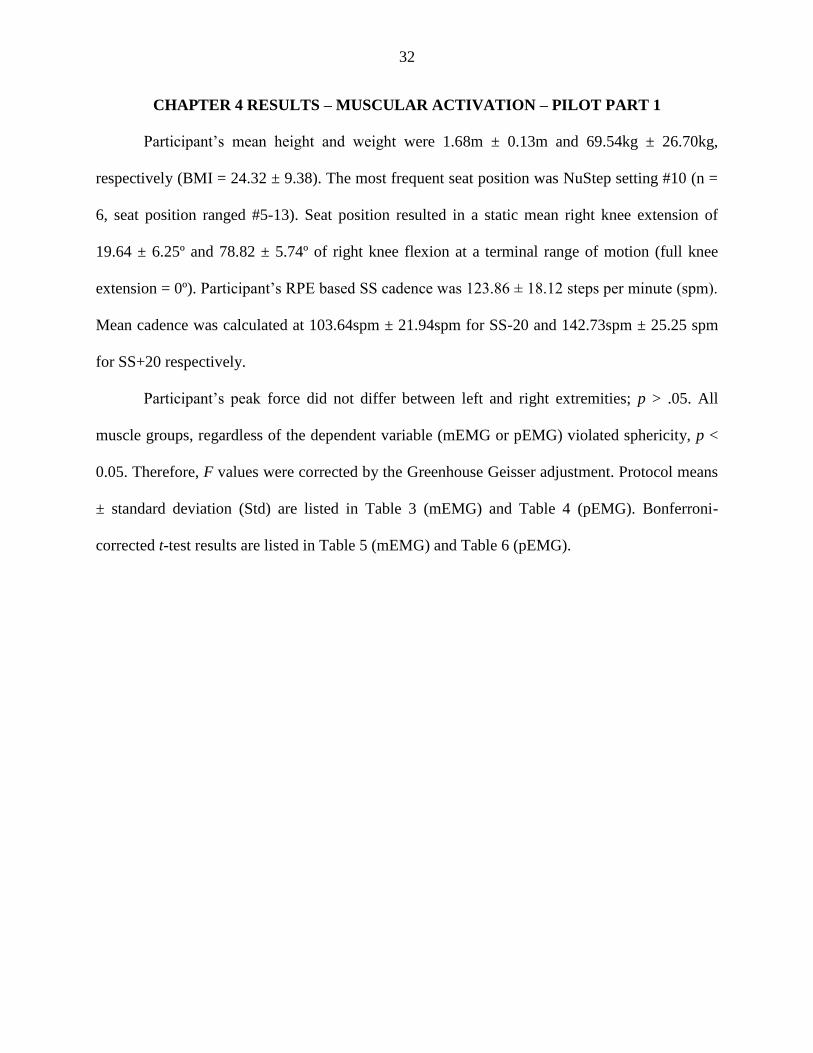
Participant’s peak force did not differ between left and right extremities; p > .05. All
muscle groups, regardless of the dependent variable (mEMG or pEMG) violated sphericity, p <
0.05. Therefore, F values were corrected by the Greenhouse Geisser adjustment. Protocol means
± standard deviation (Std) are listed in Table 3 (mEMG) and Table 4 (pEMG). Bonferroni-
corrected t-test results are listed in Table 5 (mEMG) and Table 6 (pEMG).

33
Muscle SSL8
%MVC
mean ± Std
SS+20
%MVC
mean ± Std
SS-20
%MVC
mean ± Std
SSL1
%MVC
mean ± Std
80L1
%MVC
mean ± Std
LRF 13.61 ± 5.60 6.13 ± 4.14 2.49 ± 1.12 3.47 ± 1.31 2.33 ± 0.93
95% CI 11.48-15.87 4.64-7.95 2.05-2.97 2.97-4.00 1.97-2.70
RRF 20.71 ± 9.92 8.51 ± 4.63 3.41 ± 1.22 4.88 ± 2.79 4.35 ± 2.52
95% CI 16.64-25.01 6.64-10.54 2.93-3.95 3.74-6.17 3.41-5.45
LVMO 24.95 ± 10.54 12.70 ± 6.01 6.63 ± 2.42 8.28 ± 3.68 5.93 ± 2.27
95% CI 20.75-29.46 10.33-15.28 5.65-7.60 6.78-9.86 5.04-6.90
RVMO 22.89 ± 14.31 10.60 ± 6.48 5.48 ± 3.05 6.94 ± 4.07 4.36 ± 2.79
95% CI 17.35-28.81 7.81-13.39 4.25-6.83 5.20-8.80 3.27-5.66
LST 13.23 ± 8.90 7.83 ± 5.24 3.95 ± 2.92 4.91 ± 2.85 2.76 ± 1.65
95% CI 9.60-16.65 5.81-10.13 2.81-5.17 3.77-6.03 2.13-3.45
RST 9.03 ± 6.13 5.01 ± 3.71 2.87 ± 1.97 3.40 ± 2.10 1.73 ± 0.97
95% CI 6.80-11.59 3.61-6.58 2.05-3.75 2.63-4.31 1.36-2.12
LSOL 17.78 ± 12.46 7.82 ± 4.59 3.73 ± 2.99 6.35 ± 5.74 2.12 ± 1.36
95% CI 12.64-23.34 5.84-9.81 2.59-5.17 4.01-8.94 1.54-2.70
RSOL 19.68 ± 13.86 8.26 ± 4.34 4.45 ± 3.29 4.74 ± 3.22 3.43 ± 2.42
95% CI 14.13-26.03 6.48-10.14 3.08-5.98 3.45-6.10 2.45-4.57
LMG 18.97 ± 10.56 9.23 ± 5.98 3.07 ± 1.85 5.35 ± 4.06 2.73 ± 1.77
95% CI 14.88-23.16 6.89-11.86 2.38-3.81 3.90-7.09 2.06-3.47
RMG 20.44 ± 10.06 9.18 ± 5.47 4.54 ± 2.90 6.49 ± 4.63 4.03 ± 2.52
95% CI 16.57-24.57 7.08-11.47 3.52-5.82 4.83-8.58 3.08-5.08
LTA 12.41 ± 6.13 5.87 ± 4.03 2.82 ± 2.21 4.03 ± 2.95 2.26 ± 1.62
95% CI 10.03-14.89 4.28-7.55 1.98-3.74 2.86-5.26 1.64-3.00
RTA 15.76 ± 10.51 7.93 ± 5.54 3.75 ± 2.58 5.47 ± 3.97 3.47 ± 2.22
95% CI 11.54-20.28 5.78-10.40 2.71-4.91 3.97-7.12 2.63-4.37
Table 3: mEMG Mean ± Standard Deviation(Std) normalized to percentage of Maximum
Voluntary Contraction (%MVC). 95% Confidence Interval (CI) is listed. Bonferroni-corrected
alpha was applied to the means of the 5 protocols post hoc, (i.e. exploratory α = 0.10/ 10
comparisons = 0.01).
34
Muscle SSL8
%MVC
mean ± Std
SS+20
%MVC
mean ± Std
SS-20
%MVC
mean ± Std
SSL1
%MVC
mean ± Std
80L1
%MVC
mean ± Std
LRF 20.44 ± 9.91 7.91 ± 5.18 3.51 ± 1.48 4.89 ± 1.78 3.38 ± 1.38
95% CI 16.28-25.13 5.77-10.26 2.88-4.15 4.11-5.63 2.76-3.93
RRF 30.22 ± 12.83 11.35 ± 5.65 5.56 ± 0.2.88 6.85 ± 3.92 6.68 ± 4.0
95% CI 24.86-35.59 8.94-14.03 5.12-8.70 5.27-8.73 5.12-8.27
LVMO 38.18 ± 15.96 18.74 ± 9.27 10.47 ± 4.24 12.45 ± 5.77 9.57 ± 3.78
95% CI 31.95-44.76 14.94-22.61 8.73-12.27 10.07-14.73 8.03-11.51
RVMO 30.61 ± 18.98 15.05 ± 9.56 8.13 ± 4.73 10.29 ± 6.33 6.28 ± 3.95
95% CI 22.43-38.92 11.16-19.31 6.21-10.22 7.74-13.05 4.69-8.13
LST 17.82 ± 10.68 11.72 ± 7.73 5.53 ± 4.01 7.49 ± 4.68 4.10 ± 2.56
95% CI 13.57-22.36 8.72-14.95 3.96-7.32 5.69-9.39 3.08-5.06
RST 12.80 ± 7.60 6.12 ± 4.26 4.02 ± 2.81 5.00 ± 3.45 2.42 ± 1.37
95% CI 9.68-15.99 4.50-8.09 2.87-5.27 3.62-6.49 1.87-3.00
LSOL 17.64 ± 7.30 11.47 ± 6.32 6.43 ± 5.41 9.61 ± 8.69 3.20 ± 1.76
95% CI 14.37-20.59 8.83-14.05 4.21-8.77 6.07-13.57 2.46-3.96
RSOL 28.49 ± 22.97 10.71 ± 5.10 6.33 ± 4.74 7.14 ± 5.04 4.22 ± 2.63
95% CI 19.50-38.43 8.61-12.92 4.32-8.52 5.09-9.33 3.11-5.33
LMG 24.28 ± 13.72 12.23 ± 8.17 4.07 ± 2.26 7.21 ± 5.41 4.40 ± 2.92
95% CI 18.61-30.17 9.04-16.66 3.18-5.12 5.11-9.62 3.28-5.67
RMG 26.69 ± 12.35 12.57 ± 7.16 6.32 ± 3.89 10.28 ± 7.84 5.86 ± 3.29
95% CI 21.67-32.11 9.60-15.76 4.81-7.96 7.24-13.69 4.50-7.25
LTA 17.04 ± 8.44 8.08 ± 5.47 3.94 ± 3.01 5.72 ± 4.17 3.43 ± 2.22
95% CI 13.30-20.93 6.00-10.51 2.76-5.30 4.05-7.48 2.56-4.38
RTA 19.97 ± 13.37 10.01 ± 6.78 5.14 ± 3.65 6.88 ± 4.11 4.80 ± 2.85
95% CI 14.53-25.87 7.34-13.00 3.74-6.62 5.21-8.66 3.63-5.99
Table 4: pEMG Mean ± Standard Deviation (Std) normalized to percentage of Maximum
Voluntary Contraction (%MVC). 95% Confidence Interval (CI) is listed.

35
Table 5: Bonferroni Corrected Pairwise Comparison for mEMG across protocols: SSL8 (5),
80L1 (4), SS-20% (3), SS+20% (2), SSL1 (1). Significant is set at p < .01 (α=0.10/10
comparisons p ≤ 0.01). *Comparisons with 0.05> p>0.01 are noted in parenthesis.
Muscle Protocol mEMG Difference
LRF 5>1,2,3,4; 2>3,4; 2=1 ;1>4,3; 3=4
*(2 vs. 1, p=0.013);
RRF 5>1,2,3,4; 2>1,3,4; 1=3=4
LVMO 5>1,2,3,4; 2>1,2,3,4; 1=3=4
*(1 vs. 4, p=0.011, 1 vs. 3, p=0.035)
RVMO 5>1,2,3,4; 2>1,3,4; 1>3,4; 3=4
LST 5>1,2,3,4; 2>3,4; 2=1; ); 1>4, 1=3
*(2 vs. 1, p=0.016)
RST 5>1,2,3,4; 2>4; 2=1=3; 1>4
*(2 vs. 1, p=0.022)
LMG 5>1,2,3,4; 2>1,3,4; 1=3=4
RMG 5>1,2,3,4; 2>1,3,4; 1>3;3=4
LSOL 5>1,2,3,4; 2>3,4; 2=1; 1=3=4
*(1 vs. 4, p=0.012; 1 vs. 3, p=0.049)
RSOL 5>1,2,3,4; 2>1,3,4; 1=3=4
LTA 5>1,2,3,4; 2>1,3,4; 1=3=4
*(1 vs. 4, p=0.017, 1 vs. 3, p=0.049)
RTA 5>1,2,3,4; 2>3,4: 2=1
*(1 vs. 2, p=0.024); 1=3=4

36
Table 6. Bonferroni Corrected Pairwise Comparison for pEMG across protocols: SSL8 (5), 80L1
(4), SS-20% (3), SS+20% (2), SSL1 (1). Significant is set at p<0.01 (α=0.10/10 comparisons p ≤
0.01). *Comparisons with 0.05>p>0.01 are noted in parenthesis.
Muscle Protocol pEMG Difference
LRF 5>1,2,3,4; 2>3,4; 2=1; 1>3,4; 3=4
*(2 vs. 1, p=0.031)
RRF 5>1,2,3,4; 2>1,3,4; 1=3=4
LVMO 5>1,2,3,4; 2>1,3,4; 1=3=4
RVMO 5>1,2,3,4; 2>1,3,4; 1>4; 1=3; 3=4
*(1 vs, 3, p=0.015)
LST 5>1,3,4; 5=2 *(5 vs. 2, p=.022); 2>1,3,4; 1>4: 1=3; 3=4
*(1 vs, 3, p=0.032)
RST 5>1,2,3,4; 2>4; 2=1=3; 1>4; 3=4
*(3 vs. 4, p=0.04)
LMG 5>1,2,3,4; 2>1,3,4; 1=3=4
RMG 5>1,2,3,4; 2>3,4; 2=1; 1=3=4
LSOL 5>2,3,4; 5=1;2> 3,4; 2=1; 1=3=4
*(1 vs. 4, p=0.02; 5 vs. 1, p=0.013);
RSOL 5>1,3,4; 5=2 2>3,4; 2 =1; 1=3=4
*(1 vs 4, p=0.037; 5 vs. 2, p=0.14; 2 vs. 1, p=0.031)
LTA 5> 1,2,3,4; 2> 1,3,4; 1=3=4
*(1 vs. 3, p=.025; 1 vs. 4, p=0.036)
RTA 5>1,2,3,4; 2>3; 2=4=1
*(2 vs. 4, p=0.011; 2 vs. 1, p=0.021; 2 vs. 4, p= 0.011); 3=4=1

37
CHAPTER 5 METHODS – MUSCLE ADAPTATION –PILOT PART 2
Participants
Healthy males and females (n = 23) aged 23.52 ± 4.23 years were recruited to participate
in the study. Participants had no neurologic conditions or acute orthopedic surgeries that
impaired their ability to step. Furthermore, any cardiopulmonary diagnoses that reduced exercise
capacity were excluded from this investigation. Participants had no known skin allergies to
topical agents or adhesives. Participants signed an informed consent before testing. The
investigation was approved by Wayne State University’s institutional review board (Appendix
A).
Measures
An instrumented version of the commercially available T5 NuStep Recumbent cross
trainer (NuStep Inc., Ann Arbor, MI, USA) was utilized. The instrumented T5 NuStep
Recumbent Cross Trainer can measure cadence of the participant (electronic step cadence meter
and counter) while providing real-time visual feedback on pace against 15 levels of resistance
(15 being the most challenging; at 1.0 increments of resistance). Both distal and proximal foot
straps were utilized. The participant confirmed symmetrical tightness between each foot before
all exercise bouts. Participants performed recumbent stepping without upper extremity
assistance. The seat position was set so that the participant's right knee was near full extension
(~15-20° of knee flexion when full knee extension = 0°) at the step's terminal range of motion.
A goniometer measured full knee extension and right knee flexion. As the participants remained
seated, the center of a handheld goniometer was placed over the lateral epicondyle of the femur.
The proximal arm was placed at the lateral midline of the femur with reference to the greater
trochanter whereas the distal arm was aligned the lateral midline of the fibula with reference to
38
the lateral malleolus. The degree of knee motion was quantified by both the participant's seat
position and the degree of knee extension. Participants were instructed to keep their pelvis stable
to reduce ipsilateral rotation and posterior tilting while stepping. Lastly, participants were
instructed to step at a range of motion – that was as great as possible without using the pedal’s
end range bumper to propel the subsequent step and for which the seat position allowed one to
remain seated.
Each electrode location was prepared by cleaning with rubbing alcohol and abrasive
paper (Electrode Skin Prep Pads, Dynarex Corporation, Orangeburg, NY, USA). The electrodes
(pre-gelled Ag/AgCl Noraxon Single Electrode, Noraxon USA Inc., AZ, USA) were placed over
the muscle belly along the long axis and secured with paper tape based upon the Surface
Electromyography for the Non-Invasive Assessment of Muscles (SENIAM’s) recommendations
(Hermens et al., 1999). The alcohol was allowed to vaporize so that the skin was dry before
electrode placement. The reference electrode was placed at a location in which the risk for
disturbance signal was minimized. After the electrodes were placed, the electrode’s (including
the reference electrode) signal was assessed for contamination of movement artifacts and
background noise. The electrode’s final location was determined based on both initial palpation
and assessment of signal quality.
We recorded muscle activity from 12 muscles (6 per lower extremity) using a surface
electromyography system (16 channel wireless) with an EMG bandwidth of 5-500 Hz (Noraxon
Inc. Scottsdale, AZ, USA). The Noraxon EMG system was synced with the instrumented
NuStep cross trainer using a customized program written in Labview (National Instruments,
Austin, TX, USA). This program collected EMG data in alternating 10-second epochs for the 3
minutes (minutes 2-4) of the 5-minute exercise protocol. EMG was processed with a second

39
order high pass filter (cut off frequency 80-250 Hz) with zero phase lag to attenuate low-
frequency components such as mechanical artifact. EMG data were full wave rectified, smoothed
at 300ms and normalized to the participant’s maximum voluntary contraction (MVC). Mean
EMG amplitude (mEMG) and peak EMG amplitude (pEMG) data were converted to a
percentage of MVC. mEMG and pEMG of the rectus femoris (RF), vastus medialis oblique
(VMO), semitendinosus (ST), tibialis anterior (TA), medial gastrocnemius (MG) and soleus
(SOL) were recorded bilaterally.
Procedures
Before subsequent measurement blocks and to better acclimate to the task, participants
performed two practice 5-second maximum voluntary contractions (MVC). The subsequent
measured MVC blocks required 3 sets of 5 seconds each. Knee extension (i.e., VMO and RF
MVC) was performed seated and at 60º and 15º of knee extension (0º = full knee extension).
Knee flexion (i.e., ST MVC) was also performed seated and at 60º (0º = full extension) of knee
flexion. SOL and TA MVCs were performed supine with hip and knee flexion of 90°. All MVCs
were performed on the Humac Norm Machine (Computer Sports Medicine, Stoughton, MA,
USA) except for bilateral plantarflexion (i.e., MG MVC). Bilateral MG MVC was performed
standing and through active plantarflexion while full knee extension was maintained. Peak force
and pEMG amplitude (uV) were recorded.
Initial cadence was first subjectively chosen by the participant in response to the
statement "step at a pace in which you're comfortable." After each progressive minute,
participants were asked to report their RPE (Appendix C). If a participant reported below 12 or
higher than 16 on the RPE scale during any one of the interval checks, the participant was
instructed to speed up – or slow down accordingly. The perceived exertion based SS cadence

40
was then estimated as an average over the 10 min SS protocol. During this 10 min SS protocol, a
clipboard covered the digital output so that no visual feedback on step rate was provided during
the determination of SS cadence. The instrumented T5 NuStep cross trainer calculated SS cadence.
This average (i.e., steps/min) was later rounded to meet the 5 step/min intervals of the system's
pace partner. This pace partner would later establish cadence for the participant during each of
the exercise protocols. Participants performed all 5 min exercise protocols in a randomized order.
Each 5 min protocol consisted of 1-min warm up, 3 mins of recorded exercise (at every other 10-
second interval) and 1 min of cool down at the protocol’s specified resistance level and cadence.
NuStep’s pace partner provided 100% visual feedback during each of the five protocols; (SS)
cadence with level 1 resistance (SSL1), SS cadence with level 8 resistance (SSL8), +20% SS
cadence (SS+20), -20% SS cadence (SS-20), and 80 steps per minute at resistance level 1 (80L1)
(Figure 1a).
Statistical Analysis
EMG data were evaluated for parametric assumptions using IBM SPSS statistics 23.
Numerous EMG data violated normality, homogeneity of variance and sphericity. Both data sets
also contained high levels of skewness and kurtosis. Therefore, the EMG data were assessed with
non-parametric measures. EMG during minute 2 and EMG during minute 4 were compared
within protocols. 1x4 Friedman tests were conducted to determine a statistically significant
difference (p < .05) in mEMG and pEMG between minute 2 and minute 4. Following a
statistically significant Friedman test, a Wilcoxon Signed Rank test (WSRT) was conducted post
hoc. P-values were adjusted using the Bonferroni correction (α =.10/ 12 WSRT as determined a
priori, p < .0083).

41
CHAPTER 6 RESULTS – MUSCLE ADAPTATION –PILOT PART 2
Mean Electromyography (mEMG)
Rectus Femoris.
Rectus Femoris (RF) mEMG was statistically different at the different time points during
80L1, χ2(3) = 12.983, p = .004; SS+20, χ
2(3) = 9.873, p = .018; and SS-20, χ
2(3) = 9.873, p =
.018. SSL8 and SSL1 did not elicit statistically different results in RF, p > .05. A Wilcoxon
signed-rank test determined that there was no statistical difference in LRF mEMG at minute 4
(Mdn = 2.060%) compared to minute 2 (Mdn = 2.630 %) in 80L1, z = -2.2565, p = 0.022, r = -
.33. 19 participants demonstrated a lower RRF at minute 4 (Mdn = 2.550%) compared to minute
2 (Mdn = 3.010 %) in 80L1, p = .0066, r = -.39. In 18 participants, LRF at minute four (Mdn =
2.060 %) was lower than LRF at minute 2 (Mdn = 2.780 %) in SS-20, z = -2.738, p = .005, r = -
.40. 20 participants demonstrated a reduction in median mEMG at minute 4 (Mdn = 5.820%) as
compared to minute 2 (Mdn = 7.270%).
Vastus Medialis Oblique.
Vastus Medialis Oblique (VMO) was statistically different at the different time points
during 80L1, χ2(3) = 15.365, p = .001; SS+20, χ
2(3) = 11.800, p = .007; and SS-20, χ
2(3) =
15.470, p = .001. SSL8 and SSL1 did not elicit statistically different results in VMO, p > .05. 21
participants saw a reduction in LVMO mEMG at minute 4 (Mdn = 5.480%) compared to minute
2 (Mdn = 6.810 %) in 80L1, z = -3.5285, p < 0.005, r = -.52. 20 participants saw a lower median
RVMO mEMG at minute 4 (Mdn = 4.280 %) compared to minute 2 (Mdn = 6.170 %) in 80L1, z
= -3.1936, p = .0007, r = -.47. 20 participants demonstrated a reduction in LVMO mEMG at
minute 4 (Mdn = 9.685 %) compared to minute 2 (Mdn = 12.200 %) in SS+20, z = -3.328, p <
0.005, r = -.50.

42
Semitendinosus.
Semitendinosus (ST) was statistically different at the different time points during all
protocols; SSL1, χ2(3) = 14.486, p = .001; SSL8, χ
2(3) = 7.825, p = .048; 80L1, χ
2(3) = 15.991, p
= .001; SS+20, χ2(3) = 10.543, p = .013; and SS-20, χ
2(3) = 9.104, p = .026. A Wilcoxon signed-
rank test determined that there was no statistical difference in RST mEMG at minute 4 (Mdn =
3.015 %) compared to minute 2 (3.105 %), z = -2.516, p = 0.010 or LST at minute 4 (Mdn =
4.820) compared to minute 2 (Mdn = 4.670 %), z = -.812, p = .429 during SSL1. Post hoc
Wilcoxon Signed Rank test demonstrated that SSL8 elicited no statistical difference between
LST at minute 4 (Mdn = 10.500 %) and minute 2 in SSL8 (Mdn = 9.370 %), p = .335.
Additionally, RST was not different at minute 4 (Mdn = 6.19 %) or minute 2 (Mdn = 8.010 %) in
SSL8, p = .123. There was no statistical difference in LST mEMG at minute 4 (Mdn = 2.330 %)
compared to minute 2 (Mdn = 2.900 %) in 80L1, z = -2.2052, p = 0.026, r = -.33. 19 participants
saw a reduction in RST at minute 4 (Mdn = 1.480 %) as compared to minute 2 (Mdn = 1.850 %)
in 80L1, z = -2.6464, p = 0.007, r = -.39.
Medial Gastrocnemius.
Friedman test revealed no statistical differences in mEMG between time points, p > .05.
However, marginal statistical difference did occur in 80L1, χ2(3) = 7.591, p = .054.
Soleus.
Soleus (SOL) was statistically different at the different time points during SSL1, χ2(3) =
14.048, p = .002 and SS-20, χ2(3) = 13.690, p = .003. Friedman test revealed no statistical
differences in SOL mEMG between time points in SSL8, 80L1 or SS+20, p > .05. A Wilcoxon
signed-rank test determined that there was no statistical difference in LSOL mEMG at minute 4
(Mdn = 3.27 %) compared to minute 2 (Mdn = 3.690 %) during SSL1, z = -2.451, p = 0.013. 17

43
participants demonstrated a reduction in RSOL mEMG at minute 4 (Mdn = 3.440 %) compared
to minute 2 (Mdn = 4.120 %) during SSL1, z = -2.808, p = 0.004.
Tibialis Anterior.
Tibialis Anterior (TA) was statistically different at the different time points during 80L1,
χ2(3) = 14.048, p = .002. There was no statistical difference in LTA mEMG at minute 4 (Mdn =
1.170 %) compared to minute 2 (Mdn = 1.610 %) in 80L1, z = -2.3420, p = 0.0179, r = -.35. 18
participants saw a reduction in the RTA at minute 4 (Mdn = 2.590 %) compared to minute 2
(Mdn = 3.250 %) in 80L1, z = -2.2052, p = 0.0062, r = -.39
Peak Electromyography (pEMG)
Rectus Femoris.
RF pEMG was statistically different at the different time points during 80L1, χ2(3) =
12.965, p = .004. Friedman tests revealed no statistical differences in RF pEMG between time
points in other protocols, p > .05. 17 participants saw a non-statistically significant reduction in
LRF between minute 4 (Mdn = 6.280 %) and minute 2 (Mdn = 7.990 %) in 80L1, z = -2.540, p =
.009, r = -.38. 17 participants also saw a non-statistically significant reduction in RRF between
minute 4 (Mdn = 6.550 %) and minute 2 (Mdn = 14.100 %) during 80L1, z = -2.312, p = .010, r
= -.34.
Vastus Medialis Oblique.
VMO pEMG was statistically different at the different time points during all protocols;
SSL1, χ2(3) = 22.429, p < .0005; SSL8, χ
2(3) = 22.943, p < .0005; 80L1, χ
2(3) = 32.217, p <
.0005; SS+20, χ2(3) = 21.057, p < .0005; and SS-20, χ
2(3) = 26.188, p < .0005. 17 participants
demonstrated a statistically significant reduction in LVMO between minute 4 (Mdn = 16.500 %)
and minute 2 (Mdn = 27.700 %) in SSL1, z = -2.868, p = .003, r = -.49. 19 participants

44
demonstrated a statistically significant reduction in RVMO between minute 4 (Mdn = 10.800 %)
and minute 2 (Mdn = 26.300 %) in SSL1, z = -3.574, p < .0005, r = -.58.16 participants
demonstrated a statistically significant reduction in LVMO between minute 4 (Mdn = 30.050 %)
and minute 2 (Mdn = 62.800 %) in SSL8, z = -2.902, p = .002, r = -.51. 19 participants also
demonstrated a statistically significant reduction in RVMO between minute 4 (Mdn = 35.000 %)
and minute 2 (Mdn = 66.400 %) in SSL8, z = -3.263, p = .001, r = -.53.22 participants
demonstrated a statistically significant reduction in LVMO between minute 4 (Mdn = 6.920 %)
and minute 2 (Mdn = 23.200 %) in 80L1, z = -4.106, p < .0005, r = -.62. 19 participants also
demonstrated a statistically significant reduction in RVMO between minute 4 (Mdn = 7.910 %)
and minute 2 (Mdn = 18.700 %) in 80L1, z = -3.376, p < .0005, r = -.55. 22 participants
demonstrated a statistically significant reduction in LVMO between minute 4 (Mdn = 13.600 %)
and minute 2 (Mdn = 31.700 %) in SS+20, z = -4.107, p < .0005, r = -.62. 17 participants also
demonstrated a statistically significant reduction in RVMO between minute 4 (Mdn = 18.650 %)
and minute 2 (Mdn = 35.100 %) in SS+20, z = -2.906, p = .003, r = -.50. 19 participants
demonstrated a statistically significant reduction in LVMO between minute 4 (Mdn = 8.950 %)
and minute 2 (Mdn = 21.500 %) in SS-20, z = -4.107, p < .0005, r = -.62. 17 participants also
demonstrated a statistically significant reduction in RVMO between minute 4 (Mdn = 8.960 %)
and minute 2 (Mdn = 19.000 %) in SS-20, z = -2.312, p = .020, r = -.40.
Semitendinosus.
ST pEMG was statistically different at the different time points during SSL1, χ2(3) =
14.782, p = .001 and SSL8, χ2(3) = 22.527, p < .0005. Friedman test revealed no statistical
differences in ST pEMG between time points in 80L1, SS+20 nor SS-20, p > .05. 16 participants
demonstrated a non-statistically significant improvement in LST pEMG between minute 2 (Mdn

45
= 14.300 %) and minute 4 (Mdn = 25.050 %) in SSL1, z = -2.565, p = .00854, r = -.39. 18
participants also demonstrated a statistically significant improvement in RST between minute 2
(Mdn = 10.200 %) and minute 4 (Mdn = 25.050 %) in SSL1, z = -2.950, p = .002, r = -.43.17
participants demonstrated a non-statistically significant improvement in LST pEMG between
minute 2 (Mdn = 24.900 %) and minute 4 (Mdn = 44.200 %) in SSL8, z = -1.737, p = .085, r = -
.26. 20 participants also demonstrated a statistically significant improvement in RST between
minute 2 (Mdn = 23.400 %) and minute 4 (Mdn = 50.000 %) in SSL8, z = -3.467, p < .0005, r = -
.51.
Medial Gastrocnemius.
MG pEMG was statistically different at the different time points during SSL8, χ2(3) =
13.200, p = .003. Friedman tests revealed no statistical differences in MG pEMG between time
points in SSL1, 80L1, SS+20 nor SS-20, p > .05. However, post hoc analysis revealed no
statistical difference in LMG between minute 2 (Mdn = 48.200) and minute 4 (Mdn = 71.800), z
= -2.159, p = .030, r = -.33 or RMG between minute 2 (Mdn = 52.000) and minute 4 (Mdn =
75.900), z = -1.999, p = .046, r = -.31 during SSL8.
Soleus.
SOL pEMG was statistically different at the different time points during SSL1, χ2(3) =
10.200, p = .016 and SS-20, χ2(3) = 11.765, p = .007. Friedman tests revealed no statistical
differences in SOL pEMG between time points in SSL8, 80L1 or SS+20, p > .05. 18 participants
demonstrated a statistically significant improvement in LSOL pEMG between minute 2 (Mdn =
14.300 %) and minute 4 (Mdn = 17.500 %) in SSL1, z = -2.829, p = .003, r = -.42. 18
participants also demonstrated a non-statistically significant decrease in RSOL between minute 4
(Mdn = 7.770 %) and minute 2 (Mdn = 13.800 %) in SS-20, z = -2.555, p = .009, r = -.38.

46
Tibialis Anterior.
TA was statistically different at the different time points during SSL8, χ2(3) = 12.055, p =
.006 and SS+20, χ2(3) = 13.171, p = .003. 17 participants demonstrated a statistically significant
improvement in LTA pEMG between minute 2 (Mdn = 31.100 %) and minute 4 (Mdn = 56.000
%) in SSL8, z = -2.585, p = .0082, r = -.38. 18 participants demonstrated a non-statistically
significant improvement in RTA pEMG between minute 2 (Mdn = 31.200 %) and minute 4 (Mdn
= 47.450 %) in SSL8, z = -2.484, p = .011, r = -.37. 17 participants demonstrated a statistically
significant improvement in LTA pEMG between minute 2 (Mdn = 15.000 %) and minute 4 (Mdn
= 32.600 %) in SS+20, z = -2.776, p = .004, r = -.41.

47
CHAPTER 7 METHODS – NUSTEP CROSS TRAINER VS. TREADMILL
Participants
Both healthy (n=19) and chronic stroke (≥6 months post CVA, n = 15) participants (aged
18-80) were recruited. Any participant that was diagnosed with a musculoskeletal, neurological,
cardiopulmonary or respiratory condition that limited their ability to perform the investigation
was excluded. Participants had no skin allergies to topical agents or adhesives. All participants
signed an informed consent before testing. The investigation was approved by Wayne State
University’s institutional review board (Appendix B). All testing was conducted in the Neurotech
laboratory in the Eugene Applebaum College of Pharmacy and Health Sciences at Wayne State
University. This study was supported by a grant from the National Institutes of Health, P30
AG015281 and the Michigan Center for Urban African American Aging Research. Leg
preference data were collected after the initial lab visit. Participants answered the following
questions:
1- Which leg would you balance on for an extended period?
2- Which leg would you choose to kick with if you had to kick hard or far?
Baseline Measures
Upon the participant's arrival, researchers verbally explained the testing proceedings to
the participant. The participant was then free to read the informed consent. Participants initialed
and signed the informed consent when they had no more questions or concerns. Researchers then
verbally acquired their date of birth, age, and shoe size. Stroke hemisphere (i.e., side affected),
and date of CVA were obtained for the chronic stroke participants. Resting blood pressure was
taken on the participant's preferred side; in response to the inquiry; “Which side is your blood
pressure is usually taken at the doctor's office?' The subject was seated with the preferred arm
passively stabilized on a medical table with the arm around heart level. Baseline blood pressure

48
and pulse were measured and recorded (Omron 10 Series BP785N Upper Arm Blood Pressure
Monitor, Omron, Kyoto, Japan). Height and weight were measured. The order of testing
procedures is outlined in Table 7.
Step Element of Lab Visit
1 Informed Consent
2 Baseline (DOB, Shoe size, BPpre, HRpre)
3 WiGAT1
4 HR1 + BP1
5 RPE based Self Selected Protocol-1 (10 Minutes)
6 HR2 + BP2
7 RPE based Self Selected Protocol-2 (10 Minutes)
8 EMG setup
9 MVCs
10 Goniometer setup
11 HR3 + BP3
12 Exercise Protocol 1 (5 minutes)
13 WiGAT2
14 HR4 + BP4
15 Exercise Protocol 2 (5 minutes)
16 WIGAT3
Table 7: Order of data collection during NuStep vs. Treadmill (NVT)
Procedures
Wireless gait assessment (WiGAT).
Previous researchers described the need to quantify gait (Page, Levine, Teepen &
Hartman, 2008). The WiGAT system is an electronically infused shoe sole. The sole measured
various spatial and temporal gait parameters including, but not limited to walking speed (m/sec),
stride length, double support time, bilateral asymmetry, and stance-swing phase percentages.
Electrodes are located on the 1st, 5
th metatarsal heads, anterior toe and posterior heel (Scheme 3).
WiGAT has been previously validated (Macleod, Conway, Allan & Galen, 2014). Three 10
meter walks were conducted pre-exercise intervention to establish baseline parameters. Three 10
meter walks were conducted immediately post exercise interventions.

49
Scheme 3: Schematic representation of the WiGAT setup on the right foot. The red circles
represent the location of sensors whereas the yellow lines represent the hardwiring.
Self-selected (SS) protocols.
A random number generator was utilized to dictate the order of the RPE based SS
protocols. An even number (parameters, 1-100) resulted in the NuStep being performed first.
RPE was collected in the last 10-15 seconds of each minute during the ten-minute protocol.
RPE SS protocol – NuStep Cross Trainer.
An instrumented version of the commercially available T5 NuStep Recumbent cross
trainer (NuStep Inc., Ann Arbor, MI, USA) was utilized. The instrumented T5 NuStep
Recumbent Cross Trainer can measure cadence of the participant (electronic step cadence meter
and counter) while providing real-time visual feedback on pace against 15 levels of resistance
(15 being the most challenging; at 1.0 increments of resistance). Both the RPE based SS protocol
and the corresponding exercise bout were performed at level 1 of resistance. Both distal and
proximal foot straps were utilized. Before exercise, the participant confirmed symmetrical
tightness between each foot and between the distal and proximal foot straps. Participants
performed recumbent stepping without upper extremity assistance. The seat position was set so
Lateral

50
that the participant’s right knee was near full extension (~15-20° of knee flexion when full knee
extension = 0°) at the right step’s terminal down position (See Figure 2). Participants confirmed
a comfortable and safe position as previously described (Page, Levine, Teepen & Hartman,
2008). A handheld goniometer measured full knee extension and right knee flexion (See Figures
2 & 3). As the participants remained seated, the center of a handheld goniometer was placed over
the lateral epicondyle of the femur.
Figure 2: NuStep Cross Trainer – R pedal down position
Figure 3: NuStep Cross Trainer – R pedal up position
The proximal arm was placed at the lateral midline of the femur with reference to the greater
trochanter whereas the distal arm was aligned the lateral midline of the fibula with reference to
the lateral malleolus. The participant’s seat position influenced the degree of knee motion.

51
Participants were instructed to step at a full range of motion 1- without hitting bumper’s
end range and 2- for which the pedal position allows one to remain seated. The participant
subjectively chooses a self-selected cadence in response to the instruction “step at a pace in
which you’re comfortable.” After each minute, subjects are asked to report their Borg rating of
perceived exertion (RPE) (Borg, 1982) (Appendix C). Therefore, if a participant falls below a 12
or higher than a 16 on the RPE scale during any one of the interval checks, the subject was
instructed to speed up – or slow down accordingly. The preferred stepping rate (aSPM) was an
average calculated over the 10-minute protocol.
RPE SS Protocol – Treadmill.
Participants were instructed that our goal was to find a comfortable walking pace that
they could maintain for 10 minutes. Initial cadence was between 2.0-3.0 kph for healthy
participants and 1.0 kph-2.0 kph for chronic stroke. After each minute, subjects were asked to
report their RPE. If the participant fell below a 12 or higher than a 16 on the RPE scale during
any one of the interval checks, the treadmill speed was adjusted accordingly (±0.2-0.4 kph). The
preferred stepping rate was an average taken over the 10-minute protocol. If it was possible,
participants were instructed not to hold handrails.
Electromyography.
Each electrode location was prepared by cleaning with rubbing alcohol and abrasive
paper (Electrode Skin Prep Pads, Dynarex Corporation, Orangeburg, NY, USA). The surface
electrodes (pre-gelled Ag/AgCl Noraxon Single Electrode, Noraxon USA Inc., AZ, USA) were
placed over the muscle belly along the long axis and secured with paper tape based upon the
Surface Electromyography for the Non-Invasive Assessment of Muscles (SENIAM’s)
recommendations (Hermens et al., 1999). The reference electrode was placed at a location in

52
which the risk for disturbance signal was minimized (See Scheme 4). After the electrodes were
placed, the electrode’s (including the reference electrode) signal was assessed for contamination
of movement artifacts and background noise.
Scheme 4: Example of Left Rectus Femoris Box placement
The electrode’s final location was determined on both initial muscle palpation and the
visual assessment of signal quality (Scheme 6). We recorded muscle activity from 12 muscles (6
per lower extremity) using a surface electromyography system (16 channel wireless) with an
EMG bandwidth of 5-500 Hz (Noraxon Inc. Scottsdale, AZ, USA). The Noraxon EMG system
was synced with a customized program written in Labview (National Instruments, Austin, TX,
USA). This program collected EMG data in alternating 10-second epochs for the 3 minutes
(minutes 2-4) of the 5-minute exercise protocol. EMG was processed with a second order high
pass filter (cut off frequency 80-250 Hz) with zero phase lag to attenuate low-frequency
components such as mechanical artifact. EMG data were full wave rectified, smoothed at 300ms
and normalized to the participant’s maximum voluntary contraction (MVC). Mean EMG
amplitude (mEMG) were converted to a percentage of MVC. mEMG of the rectus femoris (RF),

53
vastus medialis oblique (VMO), semitendinosus (ST), tibialis anterior (TA), medial
gastrocnemius (MG) and soleus (SOL) were recorded bilaterally. To minimize mechanical
artifact, we secured the electrodes with tape and medical wrap as previously described (Stoloff,
Zehr & Ferris, 2007).
Scheme 6: Left: Anterior view. Right: Posterior view. The electrode’s final location was
determined on both initial muscle palpation and the visual assessment of signal quality.
Maximum Voluntary Contractions.
Before subsequently measured blocks and to acclimate, participants performed one to two
practice 5-seconds MVCs. Handheld dynamometer recorded both peak force and time to peak
force (sec) (Lafayette Instrument 01165 Manual Muscle Testing Device). pEMG amplitude (uV)
was measured. EMG signal processing and analysis is performed as per the International Society
of Electrophysiology and Kinesiology guidelines (Hermens et al., 1999). The subsequent

54
measured MVC blocks required 3 repetitions of 5 seconds each. Limited rest (i.e., 1-5 seconds)
separated each repetition. Participants were encouraged by the researcher yelling "push-push-
push" (i.e., knee extension, plantarflexion) or "pull-pull-pull" (i.e., knee flexion, dorsiflexion).
Participants were instructed to cross their arms and to breathe out during the 5-second repetition
slowly.
All MVCs were performed seated. All MVCS followed a preplanned order and were
performed on the right side before the left. Knee extension was performed first and later
followed by knee flexion. Dorsiflexion superseded ankle plantarflexion. One to two minutes rest
was given between joints. Isometric knee extension was performed at 90º (0º = full extension) of
hip and knee flexion. Whereas, isometric knee flexion was performed at 90º hip flexion and 70º
(0º = full extension) of knee flexion. Both plantarflexion and dorsiflexion were performed at 90°
of hip and knee flexion in ankle neutral (i.e., 0° dorsiflexion and 0° plantarflexion).
Exercise Protocol.
Subjects performed both exercise protocols in a randomized order. A second random
number generator determined this order. An even number (parameters: 1-100) determined that
the NuStep would be performed first. Each protocol is 5 minutes was duration. Each 5-minute
protocols consisted of a 1-minute acclimation, 3 minutes of recorded exercise (EMG and
wireless goniometer data) and 1 minute of non-recorded exercise. The researcher adjusted TM
pace whereas the participant maintained the NuStep pace through real-time feedback (See Figure
1b).

55
Figure 1b: NuStep Cross Trainer visual display during 5-minute exercise protocols.
Wireless Goniometry.
150mm twin axis goniometers were utilized at the hip and knee. 110 mm sensors were
mounted to the ankle, bilaterally. End blocks were placed with the strain gauge reaching across
the joint where the least movement occurred between the skin and underlying skeletal structure.
A medical grade double-sided adhesive tape was utilized for attachment of all goniometers to the
subject. Goniometer range of motion (ROM) was calculated as a difference score (i.e., maximum
minus minimum) during the 5-minute exercise bouts on both the NuStep (NS) and treadmill
(TM). The difference score represents the degrees of ROM that the joint experienced as a result
of the exercise mode.
Blood Pressure (BP) and Heart Rate (HR).
González-Camarena et al. (2000) demonstrated the need to reestablish baseline levels of
heart rate and blood pressure before a second exercise test. Therefore, heart rate (HR) and blood
pressure (BP) were collected 3-5 minutes post-exercise bout. HR and BP were collected after SS

56
protocol 1 and SS protocol 2. HR and BP were collected before and after Exercise Protocol 1
(Figure #). Participants were given additional rest if HR and BP remained elevated.
Statistical Analysis
Statistical analysis was conducted using SPSS (Version 25). SPSS classified outliers into
two categories. Extreme outliers were removed from data sets. Mild outliers were retained across
all data sets. SPSS makes a distinction between mild outliers that are more than 1.5 box lengths
from one hinge of the box (using a circle) and extreme outliers that are more than 3 box lengths
from a hinge (using an asterisk). If data sets met parametric assumptions, an independent t-test or
a Welch t-test (i.e., when the two samples have unequal variances and unequal sample size) was
utilized for planned comparisons between conditions (i.e., healthy vs. stroke). If parametric
assumptions were not met, the non-parametric Mann Whitney U test was utilized. Paired samples
t-test was utilized to compare within conditions (i.e., Treadmill stroke vs. NuStep stroke). If
parametric assumptions were not met, a Wilcoxon signed rank test or sign test was performed.
The Wilcoxon signed-rank test is used to determine whether there is a median difference
between paired or matched observations. The sign test is used to determine whether there is a
median difference between paired or matched observations. This test can be considered as an
alternative to the paired-samples t-test or Wilcoxon signed-rank test when the distribution of
differences between paired observations is neither normal nor symmetrical, respectively.
One way repeated measures ANOVA was used to compare gait parameters at baseline,
post-NuStep, and post TM. The one-way repeated measures analysis of variance (ANOVA) is an
extension of the paired-samples t-test and is used to determine whether there are any statistically
significant differences between the means of three or more levels of a within-subjects factor (i.e.,
independent variable). If parametric assumptions were not met, a non-parametric Friedman test

57
was employed. The Friedman test is the non-parametric alternative to the one-way repeated
measures ANOVA test and is used to determine whether there are any statistically significant
differences between the distributions of three or more related groups.
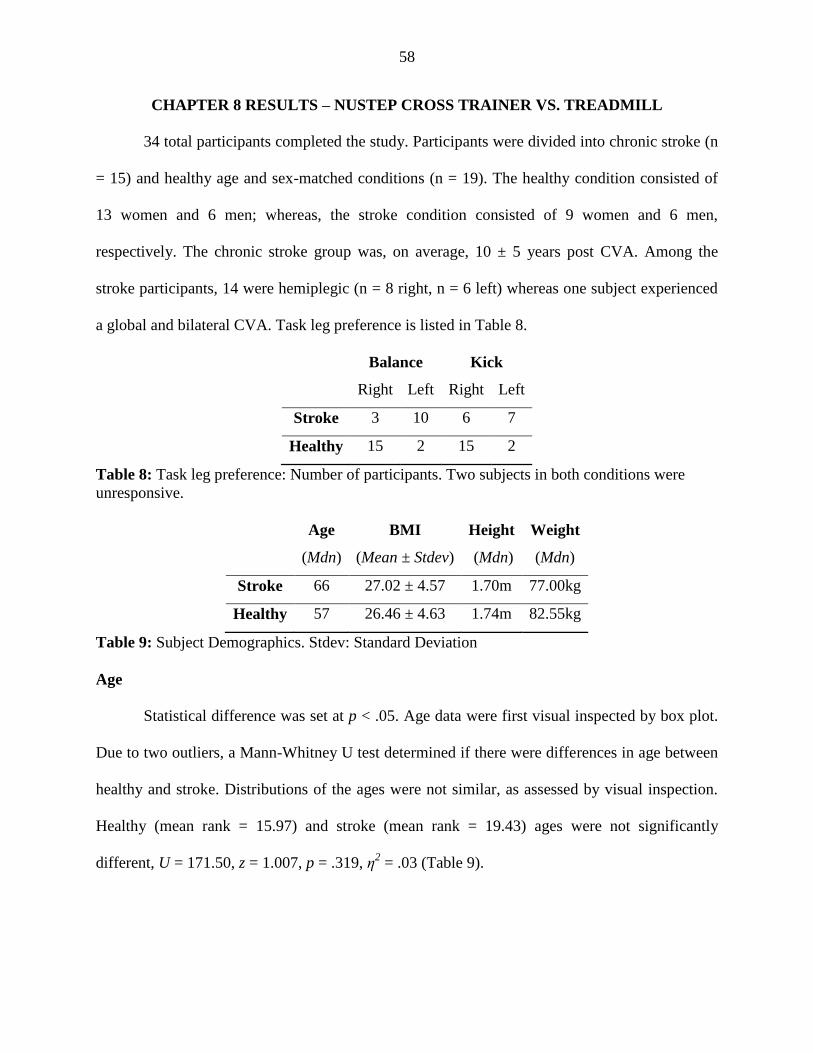
58
CHAPTER 8 RESULTS – NUSTEP CROSS TRAINER VS. TREADMILL
34 total participants completed the study. Participants were divided into chronic stroke (n
= 15) and healthy age and sex-matched conditions (n = 19). The healthy condition consisted of
13 women and 6 men; whereas, the stroke condition consisted of 9 women and 6 men,
respectively. The chronic stroke group was, on average, 10 ± 5 years post CVA. Among the
stroke participants, 14 were hemiplegic (n = 8 right, n = 6 left) whereas one subject experienced
a global and bilateral CVA. Task leg preference is listed in Table 8.
Balance Kick
Right Left Right Left
Stroke 3 10 6 7
Healthy 15 2 15 2
Table 8: Task leg preference: Number of participants. Two subjects in both conditions were
unresponsive.
Age
(Mdn)
BMI
(Mean ± Stdev)
Height
(Mdn)
Weight
(Mdn)
Stroke 66 27.02 ± 4.57 1.70m 77.00kg
Healthy 57 26.46 ± 4.63 1.74m 82.55kg
Table 9: Subject Demographics. Stdev: Standard Deviation
Age
Statistical difference was set at p < .05. Age data were first visual inspected by box plot.
Due to two outliers, a Mann-Whitney U test determined if there were differences in age between
healthy and stroke. Distributions of the ages were not similar, as assessed by visual inspection.
Healthy (mean rank = 15.97) and stroke (mean rank = 19.43) ages were not significantly
different, U = 171.50, z = 1.007, p = .319, η2 = .03 (Table 9).
59
BMI
Statistical difference was set at p < .05. There were no outliers in the BMI data, as
assessed by inspection of a boxplot. BMI data were normally distributed, as assessed by Shapiro-
Wilk's test (p > .05). There was homogeneity of variances for both healthy and stroke, as
assessed by Levene's test for equality of variances (p = .803). Therefore, an independent-samples
t-test determined if there was a statistical difference between the BMI of healthy and stroke
subjects. No statistical differences was observed between healthy BMI (M = 26.46, SD = 4.63)
and the stroke (M = 27.02, SD = 4.57) BMI, p > .05, d = .12 (Table 9).
Height
There were mild outliers in the healthy (n = 2) and stroke (n = 2) height data, as assessed
by inspection of a boxplot. Therefore, a Mann Whitney U test was used to compare the
conditions. Distribution shapes between the two groups were similar. Median height was not
statistically significantly different between healthy (Mdn = 1.70m) and stroke (Mdn = 1.74m), U
= 159.000, z = .574, p = .584 (Table 9), using an exact sampling distribution for U (Dinneen &
Blakesley, 1973).
Weight
There were mild outliers in the healthy (n = 4) and stroke (n = 0) height data, as assessed
by inspection of a boxplot. Therefore, a Mann Whitney U test was used to compare the
conditions. Distribution shapes between the two groups were similar. Median weight was not
statistically significantly different between healthy (Mdn = 77.00 kg) and stroke (Mdn = 82.55
kg), U = 173.000, z = 1.058, p = .302, using an exact sampling distribution for U (Dinneen &
Blakesley, 1973) (Table 9).

60
Rating of Perceived Exertion (RPE) - Between Conditions
Statistical difference was set at p < .025 unless otherwise noted. If parametric
assumptions were met, an independent t-test was utilized. If parametric assumptions were not
met, a Mann Whitney U test was utilized. If the two distributions have a different shape, the
Mann-Whitney U test was used to determine whether there were differences in
the distributions of the two compared groups. However, if the two distributions were the same
shape, the Mann-Whitney U test was used to determine whether there were differences in
the medians of the two compared groups.
Treadmill – healthy vs. stroke conditions.
Treadmill TM RPE contained mild outliers (n = 3). Therefore, a Mann-Whitney U test
was run to determine if there were differences in the 10 minute RPE based self-selected (SS)
protocol on TM between healthy and stroke conditions. Distributions of RPE for healthy and
stroke were not similar, as assessed by visual inspection. RPE for stroke (mean rank = 15.83)
was not statistically different to healthy RPE (mean rank = 18.82), U = 117, z = -.868, p = .391,
η2= .02.
NuStep – healthy vs. stroke conditions.
NuStep (NS) RPE did not contain outliers, as assessed by box plot. NS RPE was
normally distributed, as assessed by Shapiro-Wilk's test (p > .05). There was homogeneity of
variances, as assessed by Levene's test for equality of variances (p = .446). There was no
statistical difference in NS RPE between healthy (M = 12, SD = 2) and stroke (M = 11, SD =
2), t(32) = 1.026, p = .313, d = .35.

61
Rating of Perceived Exertion (RPE) - Within Conditions
When parametric assumptions were met, a paired t-test was utilized. Statistical difference
was set at p < .025 unless otherwise noted.
Healthy – treadmill vs. NuStep.
Healthy Treadmill RPE contained two outliers, as assessed by box plot. Wilcoxon Signed
Rank Test was utilized to describe the median differences between the 10 minute RPE based SS
protocol on TM and NS in healthy participants. The distribution of differences was
symmetrically shaped. Healthy RPE contained two mild outliers as assessed by inspection of a
boxplot. A Wilcoxon signed-rank test determined that there was no statistical difference in RPE
medians between TM (Mdn = 12.70) and the NS (Mdn = 11.90) in healthy subjects, z = -1.525, p
= .127, r = - .25.
Stroke – treadmill vs. NuStep.
Stroke TM RPE contained one mild outlier as assessed by inspection of a boxplot.
Wilcoxon Signed Rank Test was first utilized to describe the median differences between the 10
minute RPE based SS protocol on TM and NS. However, the distribution of differences was not
symmetrically shaped. Therefore, A sign test determined that there was no statistical difference
in RPE medians between TM (Mdn = 11.90) and the NS (Mdn = 11.40) in healthy subjects, z = -
.866, p = .388, r = - .16.
Self-Selected (SS) Protocol – By Exercise Mode
Statistical difference was set at p<.05. When parametric assumptions were met, an
independent t-test was utilized.

62
SS TM speed: – healthy vs. stroke conditions.
There were no outliers, as assessed by a boxplot. However, healthy SS TM Speed
violated normality, as described by Shapiro-Wilk, (p < .05). A Mann-Whitney U test was run to
determine if there were differences in SS TM speeds between healthy and stroke. Distributions
of SS TM speed were not similar, as assessed by visual inspection. Stroke SS TM speed (mean
rank = 9.20) was statistically lower than the healthy condition (mean rank = 24.05), U = 18.000,
z = -4.319, p < .0005, η2= 3.25.
SS NS average steps per minute (SPM).
Box plot inspected revealed mild outliers in the stroke condition (n=2). A Mann-Whitney
U test was run to determine if there were differences SS NS aSPM between healthy and stroke
on NuStep. Distributions of the aSPM were similar, as assessed by visual inspection. Stroke SS
NS speed (Mdn = 108 aSPM) was not statistically different than the healthy condition (Mdn =
121 aSPM), U = 91.000, z = -1.787, p = .078, η2= -.11.
10 minute SS exercise bout vs. 5 minute SS exercise bout pace.
Statistical difference was set at p < .05 unless otherwise noted. When parametric
assumptions were met, a paired t-test was utilized.
There was one mild outlier in the data (n = 1), as assessed by inspection of a boxplot for
values greater than 1.5 box-lengths from the edge of the box. The difference scores for the TM
average speed between the SS protocol and the 5 min exercise bout on TM bout were not
distributed normally; Shapiro-Wilk's test (p < .05). The distribution of the differences between
the two related groups was asymmetrical in shape. Therefore, an exact sign test was used to
compare the differences in TM speed (kph) between the 10 minute SS bout and the 5-minute

63
exercise bout. The TM calculated SS pace (Mdn = 3.550 kph), and TM set pace (Mdn = 3.500
kph) did not differ, p = 1.00.
There were no outliers in the NS data, as assessed by inspection of a boxplot for values
greater than 1.5 box-lengths from the edge of the box. The difference scores violated normality,
as assessed by Shapiro-Wilk's test (p < .05). Furthermore, the distribution of the differences
between the two related groups was asymmetrical in shape. Therefore, an exact sign test was
used to compare the steps per minute (spm) medians of the 10 minute SS bout and the 5-minute
exercise bout. 10 minute SS (Mdn = 112.50 spm) and the set 5 minute pace partner (Mdn =
113.50 spm) did not differ, p = .089.
Force: Between Conditions
Statistical difference was set at p < .025 unless otherwise noted. When parametric
assumptions were met, an independent samples t-test was utilized.
Knee – healthy vs. stroke conditions.
An independent t-test was administered to detect a difference between right (R) knee
extension (Ext) between healthy and stroke conditions. There were no outliers in the data, as
assessed by inspection of a boxplot. R Knee Ext force was normally distributed in both
conditions, as assessed by Shapiro-Wilk's test (p > .05). There was homogeneity of variances for
force for healthy and stroke conditions, as assessed by Levene's test for equality of variances (p =
.750). R knee Ext force was higher in healthy (M = 25.08kg, SD = 6.31kg) than stroke (M =
16.23kg, SD = 5.93kg). Independent t-test revealed a mean difference of 8.86kg between the
healthy and stroke participants; 95% CI [4.53 kg, 13.18 kg], t(32) = 4.175, p < .0005, d = 1.45.
There was one mild outlier in the healthy L knee Ext data, as assessed by inspection of a
boxplot. Therefore, a Mann Whitney U test was run to determine force differences in left (L)

64
knee Ext between conditions. Distributions of the force values were not similar, as assessed by
visual inspection. Distributions of the force values were not similar, as assessed by visual
inspection. Healthy force values (mean rank = 21.11) were statistically significantly higher than
for stroke (mean rank = 12.93), U = 74, z = -2.376, p = .017, η2= .17.
R knee flx force did not contain any outliers. Data were normally distributed, as assessed
by Shapiro-Wilk's test (p > .05). However, the assumption of homogeneity of variances was
violated, as assessed by Levene's test for equality of variances (p = .009). A Welch t-test
determined that healthy R knee Flx force was 12.70kg higher in the healthy condition (M = 21.71
kg, SD = 8.13kg) than stroke (M = 9.01kg, SD = 3.46kg), 95% CI [8.42 to 16.97kg], t(25.795) =
6.101, p < .0005.
An independent t-test was administered to detect a difference between L knee Flx
between healthy and stroke conditions. There were no outliers in the data, as assessed by
inspection of a boxplot. L Knee Flx force was normally distributed in both conditions, as
assessed by Shapiro-Wilk's test (p > .05). There was homogeneity of variances for force for
healthy and stroke, as assessed by Levene's test for equality of variances (p = .159). L knee Flx
force was higher in healthy (M = 21.30kg, SD = 8.21kg) than stroke (M = 14.63kg, SD = 6.29kg),
a statistically significant mean difference; M = 5.77kg, 95% CI [0.54, 10.99], t(32) = 2.247, p =
.032, d = .79.
Ankle – healthy vs. stroke conditions.
There were two mild outliers in the R dorsiflexion (dflex) data, as assessed by inspection
of a boxplot. A Mann-Whitney U test was run to determine if there were differences in R dflex
between healthy and stroke. Distributions of the force values were not similar, as assessed by

65
visual inspection. Healthy force values (mean rank = 24.00) were statistically and significantly
higher than for the stroke condition (mean rank = 9.27), U = 19, z = -4.284, p < .0005, η2= .56.
There were no outliers in the L dflex data, as assessed by inspection of a boxplot. L dflex
force was normally distributed, as assessed by Shapiro-Wilk's test (p > .05). The assumption of
homogeneity of variances was violated, as assessed by Levene's test for equality of variances
(p = .043). Therefore, a Welch t-test was run to determine if there were differences in L dflex
force between healthy and stroke. There was a statistically significant difference in L dflex
between conditions, with healthy (M = 15.88kg, SD = 4.60kg) scoring higher than stroke (M =
11.51kg, SD = 2.64kg), M = 4.36kg, 95% CI [1.64, 7.08], t(32) = 3.268, p = .002.
One mild Outlier existed in the R plantarflexion (pflex) data, as assessed by inspection of
the boxplot. A Mann-Whitney U test was run to determine if there were differences in R pflex
between healthy and stroke. Distributions of the force values were not similar, as assessed by
visual inspection. Healthy force values (mean rank = 24.47) were statistically significantly higher
than for stroke (mean rank = 8.67), U = 10, z = -4.596, p < .0005, η2= .64.
One mild Outlier also existed in the L plantarflexion (pflex) data, as assessed by
inspection of the boxplot. A Mann-Whitney U test was run to determine if there were differences
in L pflex between the conditions. Distributions of the force values were not similar, as assessed
by visual inspection. Healthy force values (mean rank = 22.53) were statistically significantly
higher than for stroke (mean rank = 11.13), U = 47, z = -3.313, p = .001, η2= .33.
Force: Within Conditions – Bilateral Comparison
Statistical difference was set at p<.025 unless otherwise noted. When parametric
assumptions were met, a paired samples t-test was utilized.

66
Healthy knee force – right vs. left.
There were two mild outliers in the healthy condition knee ext difference data. The
distribution of the differences between the two related groups was asymmetrical in shape.
Therefore, an exact sign test was used to compare the extremity force differences. Healthy
participants were stronger in L knee extension (Mdn = 28.321 kg) than R knee extension (Mdn =
26.323 kg); a median difference of 1.5574 kg, p = .004, r = -.52. Of the 19 healthy participants
recruited to the study, the L knee was stronger in 16 healthy participants, whereas three
participants demonstrated a higher median force in the R knee.
There were no outliers in the healthy knee flx difference data. The difference scores were
normally distributed, as assessed by Shapiro-Wilk's test (p > .05). Healthy subjects did not elicit
a difference in knee flx force between the L (M = 21.30 kg, SD = 8.21 kg) and the R (M =
21.71kg, SD = 8.13 kg), t(18) = -.492, p = .629, d = .05.
Healthy ankle force – right vs. left.
Dflex (n = 2) and pflex (n = 1) peak force contained outliers in the healthy condition. A
Wilcoxon signed-rank test determined that there was no statistically difference in healthy R dflex
(Mdn = 16.587kg) and L DorsiFlex (Mdn = 15.468kg), z = 1.529, p = .126, r = .25. A Wilcoxon
signed-rank test determined that there was no statistically significant median difference in force
production in L PlantarFlx (Mdn = 14.94kg) compared to R PlantarFlx (Mdn = 19.28kg) in the
healthy condition, z = 1.912, p = .056, r = .31.
Stroke knee force – right vs. left.
As assessed by inspection of a boxplot, there were no outliers in the knee ext difference
score within the stroke condition. The difference scores for stroke R knee ext and L knee ext
force were normally distributed, as assessed by Shapiro-Wilk's test (p > .05). A paired sample t-

67
test was run to test bilateral differences in knee extension. Stroke subjects produced a higher
level of force on the L side (M = 20.74 kg, SD = 6.637) as opposed to the R side (M = 16.23 kg,
SD = 5.925kg). L knee ext elicited a mean increase of 4.516 kg, 95% CI [2.125, 6.908] in force
compared to R side, t(14) = 4.050, p = .001, d = 1.05.
There were no outliers in the knee flx difference score within the stroke condition. The
difference scores for Stroke R knee flx and L knee flex force were normally distributed, as
assessed by Shapiro-Wilk's test (p > .05). Stroke participants produced a higher level of L knee
flex (M = 15.534kg, SD = 6.285kg) as opposed to R KneeFlx (M = 10.285kg, SD = 5.960kg), a
statistically significant mean difference of 5.248 kg, 95% CI [1.084, 9.413], t(14) = 2.703, p =
.017, d = 0.70.
Stroke ankle force – right vs. left.
Boxplot inspection revealed the existence of one mild outlier in stroke dorsiflexor
bilateral comparison. The distribution of the differences between the two related groups was
asymmetrical in shape. Therefore, an exact sign test was used to compare the extremity force
differences. Stroke participants exhibited no statistical difference between L DorsiFlx (Mdn =
11.401kg) than R DorsiFlex (Mdn = 6.079kg). However, a median difference of 4.824 kg was
found, p = .035, r = -.38. Of the 15 stroke participants recruited to the study, the L ankle elicited
an improvement in force production in 12 participants compared to the R ankle, whereas three
participants demonstrated a higher median force in the R ankle.
There were no outliers in the stroke pflex data. The differences between the PlantarFlx
forces were normally distributed, as assessed by Shapiro-Wilk's test (p > .05). Paired samples t-
test revealed no statistical difference between the right (M = 7.76kg, SD = 3.35kg) and left (M =
9.39kg, SD = 3.56kg) extremities, t(14) = 1.079, p = .299, d = .47.

68
NuStep Cross Trainer Static Knee Positions
There were no outliers in the data, as assessed by inspection of a boxplot for values
greater than 1.5 box-lengths from the edge of the box. Static R knee flx was normally distributed,
as assessed by Shapiro-Wilk's test (p > .05). Variances were homogeneous, as assessed by
Levene's test for equality of variances (p = .885). Right knee flexion was 5°, 95% CI [2°, 8°]
greater in the healthy condition (M = 79°, SD = 4°) than stroke (M = 74°, SD = 4°), t(32) =
3.515, p = .001, d = 1.21.
There were two mild outliers in the knee ext data, as assessed by inspection of a boxplot.
Therefore, a Mann-Whitney U test was run to determine if there were differences in knee ext
between conditions. Condition distributions were not similar, as assessed by visual inspection.
There was no statistical difference existed in knee extension between healthy (mean rank =
18.03) and stroke (mean rank = 16.83), U = 132.50, z = -.349, p = .732, η2= -.02, using an exact
sampling distribution for U (Dinneen & Blakesley, 1973).
NuStep Seat Positions
Inspection of the boxplot identified one mild outlier. A Mann-Whitney U test was run to
determine if there were differences in seat position between conditions. Condition distributions
were not similar, as assessed by visual inspection. There was a statistically significantly
difference in seat position between healthy (mean rank = 14.16) and stroke (mean rank = 21.73),
U = 206.000, z = 2.246, p = .027, η2= .15.
Heart Rate (HR)
There were no outliers in the HR data, as assessed by inspection of a boxplot for values
greater than 1.5 box-lengths from the edge of the box. HR was normally distributed at each time
point, as assessed by Shapiro-Wilk's test (p > .05). Mauchly test of sphericity indicated that the

69
assumption of sphericity was violated, χ2(9) = 18.270, p = .032. Epsilon (ε) was 0.741, as
calculated according to Greenhouse & Geisser (1959), and was used to correct the one-way
repeated measures ANOVA. HR was statistically significantly different at the different time
points during the exercise intervention, F(2.964, 82.996) = 14.562, p < .001, partial η2 = .34.
Post-hoc paired comparisons are outlined in Figure 4.
Figure 4: Subject Heart Rate (HR). HR pre: Resting HR, HR (1): Post WiGAT 1, HR (2): Post
SS Exercise Protocol 1, HR (3): After MVC, HR (4): After Exercise Bout 1. *p < .05
The highest HRs were recorded at baseline (Figure 4: HR (Pre)) (M = 76.59 bpm, SD = 11.97
bpm) and post 10 minute SS protocol 1; (Figure 4: HR (2)) (M = 77.90 bpm, SD = 13.67),
p<0.05. There was no statistical difference between HR (1) and HR (2), p =.478. A mean
difference of 3.45 beats occurred post MVC; (Figure 4: HR (3)) and prior to the last 5 minute
exercise bout (Figure 4: HR (4)), p = .01. HR (4) (M = 72.79 bpm, SD = 13.20bpm) was
statistically lower than HR (Pre) (M = 76.69bpm, SD = 11.97bpm).
*
*

70
Systolic Blood Pressure
There were two mild outliers in the systolic blood pressure (SBP) data, as assessed by
inspection of a boxplot for values greater than 1.5 box-lengths from the edge of the box.
Therefore, the non-parametric Friedman test was used to compare SBP mean ranks across time.
SBP was not statistically different at the different time points during the intervention, χ2
(4) =
3.665, p = .453.
Diastolic Blood Pressure
There were mild outliers in the diastolic blood pressure (DBP) data (n = 2). A non-
parametric Friedman test was used to compare DBP mean ranks across time. DBP was not
statistically different at the different time points during the intervention, χ2(4) = 1.662, p = .798.
Goniometers
TM ∆ROM – between conditions.
Right hip ∆ROM.
There were no R hip outliers in the TM ∆ROM data, as assessed by inspection of a
boxplot for values greater than 1.5 box-lengths from the edge of the box. R Hip ∆ROM values
were normally distributed for both conditions as assessed by Shapiro-Wilk's test (p > .05).
Variances were homogeneous, as assessed by Levene's test for equality of variances (p = .083).
There were 11 total healthy (M = 33.72º, SD = 14.01º) and 3 stroke participants (M = 22.23◦, SD
= 0.64º). There was no statistical difference between conditions on TM, t(12) = 1.379, p = .193, d
= 1.16.
Left hip ∆ROM.
There was one mild L hip outlier in the TM data. A Mann-Whitney U test was run to
determine if there were differences in L Hip ∆ROM between the stroke and healthy conditions

71
on the TM. There was no statistically significantly difference in L Hip ∆ROM mean rank
between the 6 stroke participants (mean rank = 18.54) and 13 healthy participants (mean rank =
21.58), U = 181, z = .785, p = .447, η2= .02.
Right knee ∆ROM.
TM R knee ∆ROM data did not contain outliers. However, R knee data violated
normality, as assessed by Shapiro Wilk, (p = .044). Therefore, A Mann-Whitney U test was run
to determine if there were differences in R Knee ∆ROM between stroke and healthy conditions
on the TM. Distributions of R knee ∆ROM for healthy and stroke were not similar, as assessed
by visual inspection. There was no statistically significantly difference in R Knee ∆ROM mean
rank between the 17 healthy participants (mean rank = 17.06) and 15 stroke (mean rank = 15.87)
participants, U = 181, z = .785, p = .447, η2= .02.
Left knee ∆ROM.
L Knee ∆ROM contained one mild outlier. A Mann-Whitney U test was run to determine
if there were differences in L Knee ROM between stroke and healthy conditions on the TM.
There was no statistically significantly difference in L Knee ROM between the 14 healthy
participants (mean rank = 11.07) and 9 stroke (mean rank = 13.44) participants, U = 76, z = .820,
p = .439, η2= .03.
Right ankle ∆ROM.
Six extreme outliers were removed from R ankle (ank) TM ∆ROM data. Two mild
outliers were retained. R ank data violated normality, p = .015. A Mann-Whitney U test was run
to determine if there were differences in R ank ∆ROM between stroke (n=10) and healthy (n=14)
conditions on the TM. There was no statistically significantly difference in R ank ∆ROM
between the conditions on the TM, U = 64, z = -.351, p = .752, η2 < .01.

72
Left ankle ∆ROM.
Three extreme outliers were removed from the L ank TM ∆ROM data. One mild outlier
was retained. A Mann-Whitney U test was run to determine if there were differences in L ank
∆ROM between stroke (n=12) and healthy (n=17) conditions on the TM. There was statistical
increase in L ank ROM in healthy (Mdn = 33.08°) as compared to the stroke (Mdn = 27.14°), U
= 48.000, z = -2.391, p = .016, η2= .20.
NS ∆ROM – between conditions.
Right hip ∆ROM.
There were no outliers in the R hip data, as assessed by inspection of a boxplot. NS R hip
∆ROM was normally distributed, as assessed by Shapiro-Wilk's test (p > .05). Variances were
homogeneous, as assessed by Levene's test for equality of variances (p = .755). An independent-
samples t-test was run to determine if there were differences in R hip ∆ROM between the healthy
(n = 10) and stroke (n = 3) conditions. ∆ROM did not differ between healthy (M = 25.35, SD =
10.59) than stroke participants (M = 19.84, SD = 9.04), t(11) = .810, p = .435, d = .56.
Left hip ∆ROM.
There were no outliers in the L hip data. Hip L was normally distributed, as assessed by
Shapiro-Wilk's test (p > .05). Homogeneity of variances, as assessed by Levene's test for equality
of variances was violated (p = .026). A Welch t-test was, therefore, run to determine if there
were differences in L hip ∆ROM between the healthy (n=12) and stroke (n=6) conditions.
∆ROM did not differ between healthy (M = 28.75, SD = 11.36) than stroke conditions (M =
48.31, SD = 48.31), t(5.280) = -.981, p = .370, d = 0.56.

73
Right knee ∆ROM.
There were no outliers in the R knee ∆ROM data. R knee was normally distributed, as
assessed by Shapiro-Wilk's test (p > .05). Variances were homogeneous, as assessed by Levene's
test (p = .218). An independent-sample t-test was run to determine if there were differences in R
Knee ∆ROM between the healthy (n = 19) and stroke (n = 15) conditions. ROM did not differ
between healthy (M = 60.89°, SD = 11.45°) and stroke participants (M = 67.55º, SD = 27.58º),
t(32) = -.218, p = .346, d = 0.32.
Left knee ∆ROM.
There was one mild outlier in the L knee ∆ROM data. A Mann-Whitney U test was run to
determine if there were differences in L knee ∆ROM between healthy (n=14) and stroke (n =
10). ∆ROM distributions were not similar, as assessed by visual inspection. There was no
statistically significantly difference in mean rank ∆ROM between healthy (mean rank = 10.93)
and stroke (mean rank = 14.70), conditions U = 92, z = 1.288, p = .212, η2= .07.
Right ankle ∆ROM.
Two extreme outliers were removed from the R ank ∆ROM data. Stroke R ank data
violated normality, p < 0005. A Mann-Whitney U test was run to determine if there were
differences in ∆ROM between healthy (n = 16) and stroke (n = 10). R ank ∆ROM distributions
were not similar, as assessed by visual inspection. There was no statistically significantly
difference in R ank ∆ROM between healthy (mean rank = 13.88) and stroke (mean rank = 12.90)
conditions, U = 74.000, z = -.316, p = .776, η2< .01.
L Ankle ∆ROM.
Three extreme outliers were removed from the L ank ∆ROM data. L ank was normally
distributed, as assessed by Shapiro-Wilk's test (p > .05). Variances were homogeneous, as

74
assessed by Levene's test, was violated (p = .138). A Welch t-test was, therefore, run to
determine if there were differences in L ank between the healthy (n = 18) and stroke (n = 12)
conditions. ROM did not differ between healthy (M = 22.28°, SD = 6.64°) and stroke participants
(M = 26.23º, SD = 22.13º), t(28) = -.717, p = .479, d =.24.
Healthy – Within Condition.
Statistical difference was set at p<.025 unless otherwise noted. When parameter
assumptions were met, a paired t-test was utilized. The ∆ROM difference (i.e., ROM TM – ROM
NS) was calculated and evaluated for outliers.
Right hip ∆ROM.
Healthy R (n = 1) and L hip (n = 1) both contained mild outliers. Distributions were not
symmetrical. Therefore, a sign test determined that there was no statistical difference in R hip
∆ROM between TM (Mdn = 33.61) and the NS (Mdn = 27.09) in healthy subjects, z = 1.206, p =
.277, r = .26.
Left hip ∆ROM.
A sign test also determined that there was no statistical difference in L hip ∆ROM
between TM (Mdn = 32.58) and the NS (Mdn = 25.15) in healthy subjects, z = 1.109, p = .267, r
= .22.
Right knee ∆ROM.
R knee ∆ROM did not contain outliers across the healthy condition. R knee difference
was normally distributed, as assessed by Shapiro-Wilk's test (p > .05). A paired t-test was
conducted to compare the TM (n = 18) to NS (n = 18). Healthy subjects produced a higher level
of R knee ∆ROM on TM (M = 74.78°, SD = 21.95°) as opposed to the NS (M = 61.00°, SD =

75
11.76°). TM R knee ∆ROM demonstrated a higher mean ROM of 13.79°, 95% CI [3.78°,
23.80°] compared to NS, t(17) = 2.91, p = .010, d = .78.
Left knee ∆ROM.
L knee ∆ROM contained one mild outlier. Distributions were not symmetrical. Therefore,
a sign test determined that there was no statistical difference in L knee ∆ROM between TM
(Mdn = 69.86) and the NS (Mdn = 61.74) in healthy subjects, z = .802, p = .424, r = .12.
Right ankle ∆ROM.
Healthy R ank ∆ROM contained three mild outliers. Therefore, an exact sign test
determined that there was a statistical difference in R ank ∆ROM between TM (Mdn = 39.33)
and the NS (Mdn = 25.43) in healthy subjects, z = 2.750, p = .004, r = .49.
Left ankle ∆ROM.
Two extreme outliers were removed in the L ank ∆ROM. One mild outlier was retained.
The distribution of differences was not symmetrically shaped. Therefore, an exact sign test was
used to compare the L ank differences between the NS (n = 18) and TM (n = 17). Healthy
participants demonstrated greater median ROM on TM (Mdn = 33.08º) than NS (Mdn = 21.76°),
z = 3.250, p = .001, r = .59.
Stroke – Within Condition.
Statistical difference was set at p<.025 unless otherwise noted. When parameter
assumptions were met, a paired t-test was utilized. The ∆ROM difference (i.e., ROM TM – ROM
NS) was calculated and evaluated for outliers.
Right hip ∆ROM.
R hip ∆ROM differences did not contain outliers in the stroke condition. R hip difference
was normally distributed, as assessed by Shapiro-Wilk's test (p > .05). Paired t-test was

76
conducted to compare R hip ∆ROM between the NS and TM (n = 3). Stroke participant’s R hip
∆ROM did not differ between the TM (M = 22.23º, SD = .64º) compared to NS (M = 19.84º, SD
= 9.04º), t(2) = -.430, p = .709, d = .37.
L Hip ∆ROM.
L hip ROM differences contained two extreme outliers in the stroke condition. L hip
difference was normally distributed, as assessed by Shapiro-Wilk's test (p > .05). Paired t-test
was conducted to compare L hip ∆ROM between the NS and TM (n = 4). The paired t-test
revealed no statistical differences between TM (M = 29.10º, SD = 8.72°) and NS (M = 61.31º, SD
= 56.43º), t(2) = 1.327, p = .316, d = .79.
Right knee ∆ROM.
R knee ∆ROM did not contain outliers in the stroke condition. R knee difference was
normally distributed, as assessed by Shapiro-Wilk's test (p > .05). Paired t-test was conducted to
compare R knee ∆ROM between the NS and TM (n = 15). Stroke participant’s R knee ∆ROM
did not differ between the TM (M = 72.02º, SD = 35.27º) compared to NS (M = 67.55º, SD =
27.58º), t(14) = -.360, p = .724, d = .14.
Left knee ∆ROM.
L knee ROM differences did not contain outliers in the stroke condition. L hip ∆ROM
was normally distributed, as assessed by Shapiro-Wilk's test (p > .05). Paired t-test was
conducted to compare L knee ∆ROM between the NS and TM (n=9). No statistical differences in
∆ROM existed between TM (M = 86.96º, SD = 40.22) and NS (M = 81.78º, SD = 31.45º), t(8) =
.281, p = .786, d = .11.

77
Right ankle ∆ROM.
The stroke condition’s R ank ∆ROM did not contain outliers. R ank ∆ROM was normally
distributed, as assessed by Shapiro-Wilk's test (p > .05). Paired t-test was conducted to compare
R ank ∆ROM between the NS and TM (n = 10). R ank ROM did not differ between the TM (M =
31.95º, SD = 15.37º) compared to NS (M = 52.63º, SD = 50.19º), t(9) = 1.388, p = .199, d = .56.
Left ankle ∆ROM.
Stroke L ank ROM differences did not contain outliers. L hip difference was normally
distributed, as assessed by Shapiro-Wilk's test (p > .05). Paired t-test was conducted to compare
L ank ∆ROM between the NS and TM (n = 15). The paired t-test revealed no statistical
differences between TM (M = 60.80º, SD = 61.49º) and NS (M = 54.63º, SD = 62.22º), t(14) = -
.275, p = .787, d = .09.
Mean Electromyography
mEMG NuStep Cross Trainer -- between conditions.
Statistical difference was set at p < .025 unless otherwise noted. When parameter
assumptions were met, an independent t-test was utilized. Mean electromyography (mEMG) was
reported as a percentage of maximum voluntary contraction (%). mEMG was evaluated for
outliers by box plot.
Rectus femoris.
One extreme outlier was removed from the right Rectus Femoris (RF) data set. RRF
mEMG was normally distributed for each condition, as assessed by Shapiro-Wilk's test (p > .05).
Variances were homogeneous, as assessed by Levene's test for equality of variances (p = .173).
Independent t-test demonstrated a statistically significant difference in RRF %MVC between
healthy (M = 6.24%, SD = 3.86%) and stroke (M = 12.17%, SD = 6.24%, t(31) = -3.552, p =

78
.001, d = 1.22. Stroke RRF %MVC was 5.924 degrees 95% CI [2.52, 9.33 %] higher than the
healthy condition.
One extreme outlier was removed from mean mEMG left Rectus Femoris (LRF) data set.
Mild outliers were retained (n=3). A Mann-Whitney U test was run to determine if there were
differences in LRF %MVC in healthy and stroke on NuStep. Distributions for healthy and stroke
were not similar, as assessed by visual inspection. LRF %MVC for stroke (mean rank = 19.93)
were statistically higher than for healthy (mean rank = 11.62), U = 174, z = 2.579, p = .009, η2=
.23.
Vastus medialis oblique.
One extreme outlier was removed for RVMO %MVC. Mild outliers were retained (n=3).
A Mann-Whitney U test was run to determine if there were differences in RMVO %MVC in
healthy and stroke on NuStep. Distributions for healthy and stroke were not similar, as assessed
by visual inspection. RVMO %MVC for stroke (mean rank = 16.93) was not statistically
different than RVMO %MVC healthy (mean rank = 17.05) on NuStep, U = 132, z = -.036, p =
.986, η2<.01.
One extreme outlier was removed for LVMO. Mild outliers were retained for LVMO (n
= 2). A Mann-Whitney U test was run to determine if there were differences in LVMO %MVC
in healthy and stroke on NuStep. Distributions for healthy and stroke were not similar, as
assessed by visual inspection. LVMO %MVC for stroke (mean rank = 20.96) was not
statistically different as compared to healthy (mean rank = 14.08), U = 188.500, z = 2.022, p =
.042, η2= 12.39.

79
Semitendinosus.
Extreme outliers were removed from mean mEMG right Semitendinosus (RST) dataset
(n = 2). Mild outliers were retained (n = 3). A Mann-Whitney U test was run to determine if
there were differences in RST %MVC between healthy and stroke on NuStep. Distributions were
not similar, as assessed by visual inspection. RST %MVC for stroke (mean rank = 22.77) was
statistically higher as compared to healthy (mean rank = 12.21), U = 205.000, z = 3.124, p =
.001, η2= .31.
Extreme outliers were removed from mean mEMG left Semitendinosus (LST) dataset
(n=2). Mild outliers of the LST were retained (n=2). A Mann-Whitney U test was run to
determine if there were differences in LST %MVC in healthy and stroke on NuStep. No
statistical difference between stroke (mean rank = 17.86) and healthy (mean rank = 15.44)
conditions was detected, U = 145.000, z = .722, p = .488, η2= .02.
Soleus.
Two extreme outliers were removed from the right Soleus (RSOL) data. The mild outlier
of the RSOL was retained (n = 1). A Mann-Whitney U test was run to determine if there were
differences in RSOL %MVC between healthy and stroke on NuStep. Distributions were not
similar, as assessed by visual inspection. RSOL %MVC for stroke (mean rank = 21.57) was
statistically higher as to the healthy condition (mean rank = 12.56), U = 197.000, z = 2.697, p =
.007, η2= .23.
Left Soleus (LSOL) contained two extreme outliers. These data points were removed.
LSOL did not contain any further outliers. LSOL mEMG was normally distributed for each
condition, as assessed by Shapiro-Wilk's test (p > .05). Variances were homogeneous, as
assessed by Levene's test for equality of variances (p = .284). An independent t-test revealed a

80
statistically significant difference in LSOL %MVC between healthy and stroke, t(30) = -
4.307, p < .0005, d = 1.49. Stroke LSOL mEMG was 6.847 %MVC, 95% CI [3.60, 10.09
%MVC) higher than the healthy condition.
Gastrocnemius.
The mild outlier of the right medial gastrocnemius (RMG) was retained (n=1). A Mann-
Whitney U test was run to determine if there were differences in RMG %MVC between healthy
and stroke on NuStep. Distributions of the %MVCs for healthy and stroke were not similar, as
assessed by visual inspection. RMG %MVC for stroke (mean rank = 22.93) were statistically
and significantly higher as compared to healthy (mean rank = 13.21), U = 224.000, z = 2.827, p =
.004, η2= .24.
One extreme outlier was removed from left medial gastrocnemius (LMG). The mild
outliers of the LMG were retained (n = 2). A Mann-Whitney U test was run to determine if there
were differences in LMG %MVC between healthy and stroke on NuStep. Distributions of the
%MVCs for healthy and stroke were not similar, as assessed by visual inspection. LMG %MVC
for stroke (mean rank = 22.82) was statistically and significantly higher as compared to healthy
(mean rank = 12.71), U = 214.000, z = 2.969, p = .002, η2= .27.
Tibialis anterior
The mild outliers of the right tibialis anterior (RTA) were retained (n = 2). Distributions
of the %MVCs for healthy and stroke were not similar, as assessed by visual inspection. A
Mann-Whitney U test was run to determine if there were differences in RTA %MVC between
healthy and stroke on NuStep. RTA %MVC for stroke (mean rank = 20.83) did not differ to
healthy (mean rank = 14.87), U = 192.500, z = 1.734, p = .083.

81
No outliers were present in the left tibialis anterior (LTA) data. LTA mEMG was
normally distributed for each condition, as assessed by Shapiro-Wilk's test (p > .05). Variances
were homogeneous, as assessed by Levene's test for equality of variances (p = .448).
Independent t-test revealed no statistically difference in LTA %max between healthy and
stroke, t(32) = -1.668, p = .105.
mEMG treadmill -- betwen conditions.
Statistical difference was set at p < .025. When parameter assumptions were met, an
independent t-test was utilized. Mean electromyography (mEMG) is reported as a percentage of
maximum voluntary contraction (%MVC). mEMG was evaluated for outliers by box plot.
Rectus femoris.
One extreme outlier was removed for RRF. One mild outlier was retained for RRF. A
Mann-Whitney U test was run to determine if there were differences in RRF %MVC between
healthy and stroke on the TM. Distributions of the %MVCs for healthy and stroke were not
similar, as assessed by visual inspection. RRF %MVC for stroke (mean rank = 22.93) were
statistically and significantly higher as compared to healthy (mean rank = 12.63), U = 216.000, z
= 3.024, p = .002, η2= .28.
Three extreme outliers were removed from the LRF data set. LRF mild outliers were
retained (n = 3). A Mann-Whitney U test was run to determine if there were differences in LRF
%MVC in healthy and stroke on TM. Distributions for healthy and stroke were not similar, as
assessed by visual inspection. LRF %MVC for stroke (mean rank = 18.53) did not differ to
healthy (mean rank = 13.62) on TM, U = 158.000, z = 1.502, p = .140, η2= .08.

82
Vastus medialis oblique.
Mild outliers were retained for RVMO (n = 2). A Mann-Whitney U test was run to
determine if there were differences in RMVO %MVC in healthy and stroke on TM. Distributions
for healthy and stroke were not similar, as assessed by visual inspection. RVMO %MVC for
stroke (mean rank = 21.23) did not differ from healthy (mean rank = 14.55), U = 198.500, z =
1.942, p = .051, η2= .24.
One extreme outlier was removed from LVMO. A mild outlier was retained for LVMO
(n = 1). A Mann-Whitney U test was run to determine if there were differences in LVMO
%MVC in healthy and stroke on NuStep. Distributions for healthy and stroke were not similar,
as assessed by visual inspection. LVMO %MVC for stroke (mean rank = 20.67) were not
statistically different as compared to healthy (mean rank = 13.94), U = 190.000, z = 1.989, p =
.048, η2= .12.
Semitendinosus.
Seven extreme outliers were removed from the RST data set. Mild outliers were retained
(n = 2). A Mann-Whitney U test was run to determine if there were differences in RST %MVC
between healthy and stroke on TM. Distributions were not similar, as assessed by visual
inspection. RST %MVC for stroke (mean rank = 19.22) were statistically and significantly
higher as compared to healthy (mean rank = 11.39), U = 128.000, z = 2.418, p = .015, η2= .22.
Four extreme outliers were removed from the LST dataset. One mild outlier of the LST was
retained (n = 1). A Mann-Whitney U test was run to determine if there were differences in LST
%MVC in healthy and stroke on TM. LST %MVC for stroke (mean rank = 13.83) did not differ
from healthy (mean rank = 16.61), U = 88.000, z = -.847, p = .415, η2= .06.

83
Soleus
Four extreme outliers were removed from the RSOL mEMG data. The mild outliers of
the RSOL were retained (n = 3). A Mann-Whitney U test was run to determine if there were
differences in RSOL %MVC between healthy and stroke on TM. RSOL %MVC for stroke
(mean rank = 18.92) did not differ from healthy (mean rank = 13.22), U = 149.000, z = 1.736, p
= .087, η2= .10.
LSOL data contained one extreme outlier. LSOL did not contain any mild outliers. LSOL
mEMG was normally distributed for each condition, as assessed by Shapiro-Wilk's test (p > .05).
Homogeneity of variances was violated, as assessed by Levene's test for equality of variances (p
= .020). An independent t-test, with equal variance not assumed revealed no statistical difference
in LSOL %MVC between healthy (M = 25.15%, SD = 7.78%) and stroke (M = 31.80%, SD =
12.70%), t(20.067) = -1.735, p = .098.
Gastrocnemius.
The mild outlier of the RMG was retained (n = 1). Two extreme outliers were removed.
A Mann-Whitney U test was run to determine if there were differences in RMG %MVC between
healthy and stroke on TM. Distributions of the %MVCs for healthy and stroke were not similar,
as assessed by visual inspection. RMG %MVC for stroke (mean rank = 19.23) did not differ
from healthy (mean rank = 14.63), U = 159.000, z = 1.362, p = .182, η2= .06.
One mild outlier of the LMG was retained (n = 1). One extreme outlier was removed. A
Mann-Whitney U test was run to determine if there were differences in LMG %MVC between
healthy and stroke on TM. Distributions of the %MVCs for healthy and stroke were not similar,
as assessed by visual inspection. LMG %MVC for stroke (mean rank = 18.57) did not differ
from healthy (mean rank = 15.84), U = 159.000, z = .801, p = .439, η2= .02.
84
Tibialis Anterior.
RTA mEMG did not contain any outliers LSOL data did not contain any outliers. RTA
mEMG was normally distributed for each condition, as assessed by Shapiro-Wilk's test (p > .05).
Homogeneity of variances was violated, as assessed by Levene's test for equality of variances (p
= .001). A Welch t-test revealed no statistical difference in RTA %MVC between healthy (M =
29.34%, SD = 12.84%) and stroke (M = 38.06%, SD = 31.31%) on TM, t(17.720) = -1.014, p =
.324.
One mild outlier of the LTA was retained (n=1). Two extreme outliers were removed. A
Mann-Whitney U test was run to determine if there were differences in LTA %MVC between
healthy and stroke on TM. Distributions of the %MVCs for healthy and stroke were not similar,
as assessed by visual inspection. LMG %MVC for stroke (mean rank = 13.08) did not differ
from healthy (mean rank = 18.84), U = 79.000, z = -1.708, p = .092, η2= .09.
Stroke mEMG within condition.
Statistical difference was set at p<.025. When parameter assumptions were met, a paired
t-test was utilized. Muscle difference (i.e., Muscle TM – Muscle NS) was calculated and
evaluated for outliers. Mean electromyography (mEMG) is reported as a percentage of maximum
voluntary contraction (%MVC). mEMG was evaluated for outliers by box plot.
Rectus femoris.
One extreme outlier was removed from RRF. RRF contained one mild outlier. A
Wilcoxon Signed Rank test was utilized to test for a difference between exercise modes in the
stroke participants. Of the 15 participants recruited to the study, the TM (Mdn = 19.8 %) elicited
a higher mEMG in 12 participants compared to the NuStep (Mdn = 13.00 %). The TM elicited a
statistically significant median increase in mEMG, z = -2.840, p = .005, r=-0.52.

85
One extreme outlier was removed from LRF. LRF contained no outliers in the data, as
assessed by inspection of a boxplot. The difference scores were not distributed normally, as
assessed by Shapiro-Wilk's test (p = .042). A Wilcoxon signed-rank test determined that there
was no statistical median difference between TM (Mdn = 25.30 %) and NuStep (Mdn = 27.50
%), z = .795, p = .427, r = .15.
Vastus medialis oblique.
One extreme outlier was removed from RVMO. RVMO difference contained no outliers
in the data. The difference scores were normally distributed, as assessed by Shapiro-Wilk's test
(p > .05). Paired t-test was utilized. TM produced higher mEMG in RVMO (M = 30.30%, SD =
25.76%) as opposed to the NuStep (M = 19.92%, SD = 17.40%). TM elicited a mean increase of
12.98 %, 95% CI [3.418, 22.538] in the 5 minute exercise protocol at the RPE based SS pace,
t(14) = 2.912, p = .011, d = 1.12.
LVMO difference contained no outliers in the data, as assessed by inspection of a
boxplot. The difference scores were normally distributed, as assessed by Shapiro-Wilk's test (p >
.05). A paired t-test demonstrated no statistical difference in LVMO between TM (M = 27.46 %,
SD = 15.95%) and NS (M = 24.26%, SD = 15.16%) in the stroke participants, t(14) = .764, p =
.458, d = .20.
Semitendinosus.
An extreme outlier was removed from the RST data set. RST difference contained no
further outliers. The difference scores were normally distributed, as assessed by Shapiro-Wilk's
test (p >.05). There was no statistical difference in RST between TM (M = 60.88%, SD =
75.19%) and NS (M = 67.05%, SD = 167.58%) in the stroke participants, t(14) = -.264, p =
.813, d = -.06.

86
An extreme outlier was removed from the LST dataset. One mild outlier was retained.
The distribution of differences was not symmetrically shaped. Therefore, an exact sign test was
used to compare the differences in %MVC between the two exercise modes. The TM (Mdn =
20.30%) elicited a statistically significant 7.155% Mdn increase compared to the NuStep (Mdn =
6.65%), p = .007, r = -.46.
Gastrocnemius.
Extreme outliers were removed from the RMG data set (n = 2). As a result, there were no
further outliers in the data. The RMG difference scores were normally distributed, as assessed by
Shapiro-Wilk's test (p = .558). No statistical differences existed between TM (M = 101.07%, SD
= 107.36%) and NuStep (M = 60.62%, SD = 167.58%) for RMG, t(14) = 2.775, p = .043, d =
.57.
One extreme outlier was removed from the LMG data set. The LMG difference score
were normally distributed, as assessed by Shapiro-Wilk's test (p > .05). No statistical differences
existed between TM (M = 102.07%, SD = 215.13%) and NuStep (M = 33.71%, SD = 167.58%)
for LMG in the stroke population, t(14) = 1.463, p = .166, d = .37.
Soleus.
Two extreme outliers were removed from the RSOL data set. The distribution of
differences was not symmetrically shaped. An exact sign test was used to compare the median
differences in RSOL %MVC between the two exercise modes. The TM (Mdn = 44.50%)
produced higher RSOL mEMG as compared to the NuStep (Mdn = 31.90 %), p = .001, r = -.57.
One extreme outlier was removed from the LSOL data set. The LSOL difference score
were normally distributed, as assessed by Shapiro-Wilk's test (p > .05). No statistical differences

87
existed between TM (M = 101.07%, SD = 107.36%) and NuStep (M = 60.62%, SD = 167.58%)
for RMG, t(14) = 2.775, p = .043, d = .57.
Tibialis anterior.
One mild RTA difference outlier was retained. The distribution of differences was not
symmetrically shaped. An exact sign test was used to compare the differences in %MVC
between the two exercise modes. There was no statistical difference between the TM (Mdn =
23.50%) and NuStep (Mdn = 19.20%) in stroke participants, p = .035, r = -.46.
LTA difference contained no outliers. The LTA difference score were normally
distributed, as assessed by Shapiro-Wilk's test (p >.05). LTA between was higher in TM (M =
26.51%, SD = 10.27%) as compared to the NuStep (M = 18.31%, SD = 167.58%), t(14) =
2.775, p = .015, d = .72.
Healthy mEMG within condition.
Statistical difference was set at p < .025. When parameter assumptions were met, a
paired t-test was utilized. Muscle differences (∆%MVC) (i.e., Muscle TM – Muscle NS) were
calculated and evaluated for outliers.
Rectus femoris.
RRF difference score did not contain any outliers. The difference scores for RRF were
normally distributed, as assessed by Shapiro-Wilk's test (p >.05). TM produced higher mEMG in
RRF (M = 9.67 %MVC, SD = 5.67) as opposed to the NS (M = 6.25%, SD = 3.86%). TM
elicited a mean increase of 3.34%, 95% CI [1.557%, 5.309%] in the 5 minute exercise protocol
at the RPE based SS pace, t(18) = 3.845, p = .001, d = .88.
Multiple extreme outliers were removed from the LRF dataset (n = 4). LRF contained
one mild outlier as assessed by inspection of a boxplot. The distribution of differences was

88
symmetrically shaped. A Wilcoxon signed-rank test determined that there was no statistical
difference in mEMG medians between TM (Mdn = 13.200%) and the NuStep (Mdn = 6.91%) in
healthy subjects, z = -1.891, p = .059, r = - .46.
Vastus medialis oblique.
RVMO difference contained no outliers in the data. The difference scores were normally
distributed, as assessed by Shapiro-Wilk's test (p = .971). There was no statistical difference in
RVMO between the TM (M = 16.04%, SD = 6.24%) and the NuStep (M = 14.03 %, SD =
6.11%), t(18) = 1.608, p = .125, d = .37.
LVMO difference contained one mild outlier in the data, as assessed by inspection of a
boxplot. The distribution of differences was symmetrically shaped. A Wilcoxon signed-rank test
determined that there was no statistical difference in LVMO medians between TM (Mdn = 17.10
%) and the NS (Mdn = 15.60%) in healthy subjects, z = -1.730, p = .084. r = - .41.
Semitendinosus.
Two extreme outliers were removed from the RST data set. RST difference contained no
further outliers in the data. The difference scores were normally distributed, as assessed by
Shapiro-Wilk's test (p > .05). There was no statistical difference in RST between TM (M =
33.39%, SD = 68.68%) and NS (M = 7.16%, SD = 3.71%) in the healthy participants, t(18) =
1.670, p = .112, d = 38.
Extreme outliers were removed from the LST data set (n = 3). LST difference contained
no further outliers in the data. The difference scores were normally distributed, as assessed by
Shapiro-Wilk's test (p > .05). TM produced higher mEMG in LST (M = 20.60%, SD = 10.44%)
as opposed to the NS (M = 10.28%, SD = 14.27%). TM elicited a mean increase of 10.32%, 95%

89
CI [1.952, 18.684] in the 5 minute exercise protocol at the RPE based SS pace, t(17) = 2.602, p =
.019, d = .61.
Medial gastrocnemius.
RMG difference did not contain any extreme outliers. As a result, there were no further
outliers in the data. The RMG difference scores were normally distributed, as assessed by
Shapiro-Wilk's test (p = .098). TM produced higher mEMG in RMG (M = 40.33%, SD =
21.85%) as opposed to the NuStep (M = 16.98%, SD = 13.38%). TM elicited a mean increase of
23.35%, 95% CI [15.603%, 31.102%] in the 5 minute exercise protocol at the RPE based SS
pace, t(18) = 6.331, p < .0005, d = 1.45.
LMG difference did not contain any extreme outliers. The LMG difference score were
normally distributed, as assessed by Shapiro-Wilk's test (p = .533). TM produced higher mEMG
in LMG (M = 34.93%, SD = 15.26%) as opposed to the NuStep (M = 13.02%, SD = 9.48%). TM
elicited a mean increase of 21.91%, 95% CI [16.381%, 27.433%] in the 5 minute exercise
protocol at the RPE based SS pace, t(18) = 8.329, p < .0005, d = 1.91.
Soleus.
One extreme outlier was removed from the RSOL data set. RSOL difference score did
not contain any further outliers. The RSOL difference score were normally distributed, as
assessed by Shapiro-Wilk's test (p = .629). TM produced higher mEMG in RSOL (M = 37.41%,
SD = 31.82%) as opposed to the NuStep (M = 9.76%, SD = 6.88%). TM elicited a mean increase
of 27.64%, 95% CI [12.089%, 43.194%] in the 5 minute exercise protocol at the RPE based SS
pace, t(18) = 3.734, p = .002, d = .86.
The LSOL difference score did not contain any outliers and was normally distributed, p =
.596. TM produced higher mEMG in LSOL (M = 25.15%, SD = 7.78%) as opposed to the

90
NuStep (M = 5.79%, SD = 3.57%). TM elicited a mean increase of 19.35%, 95% CI [16.117%,
22.600%] in the 5 minute exercise protocol at the RPE based SS pace, t(18) = 12.563, p <
.0005, d = 2.88.
Tibialis anterior.
One extreme RTA outlier was removed from the dataset. RTA difference score contained
one mild outlier. The difference scores were symmetrically distributed, as assessed by a
histogram. A Wilcoxon signed-rank test determined that there was a statistically significant
increase in mEMG (Mdn = 13.19%) when subjects walked on the TM (Mdn = 28.60%)
compared to the recumbent cross trainer (Mdn = 12.80%), z = -3.783, p < .0005, r = -.72.
LTA difference contained no extreme outliers. However, the set contained one mild
outlier. The difference scores were symmetrically distributed, as assessed by a histogram. A
Wilcoxon signed-rank test determined that there was a statistically significant increase in mEMG
(Mdn = 15.67%) when healthy subjects walked on the TM (Mdn = 28.70%) compared to the NS
(Mdn = 11.500%), z = -3.300, p = .001, r = -.62.
CVA Condition – affected side vs. non-affected side.
Unilateral stroke participants (n=14) were divided into left affected size (n = 6) and right
affected side (n = 8). One participant was removed from consideration due to the global nature of
their CVA. Alpha was set at p < .0167.
Affected side.
Three extreme outliers were removed from the NS affected RF data. Data did not contain
any mild outliers. However, NS affected RF data violated normality, as assessed by Shapiro-
Wilk's test (p < .001). The difference scores were symmetrically distributed, as assessed by a
histogram. A Wilcoxon signed-rank test determined that there was a statistically significant

91
increase in mEMG on the TM (Mdn = 19.80%) compared to the NS (Mdn = 13.00%), z = -2.701,
p = .007, r = -.60.
Affected VMO did not contain any outliers. VMO difference scores were normally
distributed, as assessed by Shapiro-Wilk's test (p = .200). TM produced higher mEMG in
affected VMO (M = 30.23 %MVC, SD = 19.67) as opposed to the NuStep (M = 19.20 %MVC,
SD = 6.88). TM elicited a mean increase of 11.03 %MVC, 95% CI [4.58, 17.88] in the 5 minute
exercise protocol at the RPE based SS pace, t(13) = 3.691, p = .003, d = .59.
Affected ST contained two extreme outliers that were removed. One mild outlier was
retained. The difference scores were symmetrically distributed, as assessed by a histogram. A
Wilcoxon signed-rank test determined that there was no statistically significant difference in
affected ST mEMG on the TM (Mdn = 30.80 %) compared to the NS (Mdn = 26.45 %), z = -
1.647, p = .099, r = -.34.
Affected TA data contained one mild outlier. The difference scores were symmetrically
distributed, as assessed by a histogram. A Wilcoxon signed-rank test determined that there was a
statistical increase of affected TA mEMG on the TM (Mdn = 25.35%) compared to the NS (Mdn
= 17.55 %), z = -2.417, p = .016, r = -.46.
Affected MG data contained three extreme outliers which were removed. Difference
scores were normally distributed, as assessed by Shapiro-Wilk's test (p = .20). TM produced
higher mEMG in affected MG (M = 63.84 %, SD = 43.75%) as opposed to the NuStep (M =
42.91%, SD = 39.66%). TM elicited a mean increase of 20.92%, 95% CI [5.72, 36.13] in the 5
minute exercise protocol at the RPE based SS pace, t(10) = 3.066, p = .012, d = .50.
Affected SOL data contained four extreme outliers which were removed. One mild
outlier was retained. A Wilcoxon signed-rank test determined that there was a statistical increase

92
of affected SOL mEMG on the TM (Mdn = 44.45%) compared to the NS (Mdn = 16.25%), z = -
2.803, p = .005, r = -.63.
Non-affected side.
Non affected RF Data contained three extreme outliers. RF data also contained 1 mild
outlier. The difference scores were not symmetrically distributed, as assessed by a histogram.
However, the distribution of differences was not symmetrically shaped. Therefore, A sign test
determined that there was no statistical difference in non-affected RF mEMG between TM (Mdn
= 25.90%) and the NS (Mdn = 20.65%) in CVA subjects, z = .000, p = 1.000.
Non affected VMO data contained one mild outlier. The difference scores were
symmetrically distributed, as assessed by a histogram. A Wilcoxon signed-rank test determined
that there was no statistically significant difference in mEMG on the TM (Mdn = 19.70%)
compared to the NS (Mdn = 20.30%), z = -.175, p = .861, r = -.03.
Non-affected ST contained one extreme outlier that was removed. One mild outlier was
retained. Wilcoxon signed-rank test determined that there was a statistically significant increase
in non-affected ST mEMG on the TM (Mdn = 23.55 %) compared to the NS (Mdn = 10.45 %), z
= -3.059, p = .002, r = -.62.
One extreme outlier was removed from non-affected TA data. Non-affected TA
difference scores were normally distributed, as assessed by Shapiro-Wilk's test (p = .136). TM
produced higher mEMG in non-affected TA (M = 26.65 %, SD = 11.25) as opposed to the
NuStep (M = 18.48 %, SD = 9.53). TM elicited a mean increase of 8.17 %, 95% CI [3.02, 13.32]
in the 5 minute exercise protocol at the RPE based SS pace, t(12) = 3.455, p = .005, d = .78.
Non-affected MG contained two extreme outliers which were removed. Difference scores
were normally distributed, as assessed by Shapiro-Wilk's test (p = .200). TM did not produce a

93
statistically different mEMG in non-affected MG (M = 35.25 %, SD = 21.32) as opposed to the
NuStep (M = 27.96 %, SD = 20.09), t(11) = 2.368, p = .037, d = .35.
Non-affected SOL data contained one extreme outlier which was removed. Two mild
outliers were retained. A Wilcoxon signed-rank test determined that there was a statistical
increase of non-affected SOL mEMG on the TM (Mdn = 24.30 %) compared to the NS (Mdn =
11.20 %), z = -3.040, p = .002, r = -.60.
Wireless Gait Assessment (WiGAT) - right vs. left.
Left stride length.
Six extreme outliers were moved from the raw data. Mild outliers were kept in the L
stride length data (n = 3). L stride length was normally distributed in both conditions, as assessed
by Shapiro-Wilk's test (p > .05). Mauchly's test of sphericity indicated that the assumption of
sphericity was violated, χ2(2) = 10.982, p = .004. Epsilon (ε) was 0.755, as calculated according
to Greenhouse & Geisser (1959), and was used to correct the one-way repeated measures
ANOVA. L stride length was statistically significantly different for treatment time during this
exercise intervention, F(1.510, 43.792) = 3.719, p =.044, partial η2 = .114 (Figure 5). The
interaction between exercise mode and condition was not statistically significant, F(1.510,
43.792) = .646, p =0.484, partial η2 = .022. Data are mean ± standard deviation unless otherwise
stated. Pairwise comparisons were adjusted for multiple comparisons with the Bonferroni
correction. There was an increase in L stride length from 1.25 ± 0.25 m at baseline to 1.28 ± 0.27
m post-TM, an increase of 0.33m, 95% CI [0.04m to .063], which was statistically
significant, p = .023. There was an increase in L stride length from 1.25m ± 0.25m at baseline to
1.29m ± 0.27m post-NS, an increase of 0.047m, 95% CI [-0.04m to .098m], which was not

94
statistically significant, p = .078. Post TM (1.28m ± 0.27m) and post NS (1.29m ± 0.27m) did
not differ in L stride length, p = 1.00 (See Figure 6).
Figure 5: Left stride length (m) by treatment.
Figure 6: WiGAT Left (L) stride length post-exercise mode between conditions compared to
baseline.
*
*

95
L stride length between conditions was statistically different, F(1, 29) = 29.82, p < .0005, partial
η2 = .507. Post hoc pairwise comparison demonstrated decreased L stride length in stroke
participants. This 0.362m decrement, 95% CI [0.226m to .497m] was statistically significant, p <
.0005 (Figure 6).
R stride length.
Outliers were kept in the R stride length data. R stride length was normally distributed, as
assessed by Shapiro-Wilk's test (p > .05). Mauchly's test of sphericity indicated that the
assumption of sphericity had been violated, χ2(2) = 17.086, p < .0005. Epsilon (ε) was 0.686, as
calculated according to Greenhouse & Geisser (1959), and was used to correct the one-way
repeated measures ANOVA. The exercise treatment did not lead to any statistically significant
changes in R stride length, F(1.373, 39.814) = 2.734, p = .095, η2 = .086 .
Figure 7: WiGAT Right (R) Stride Length post-exercise mode between conditions compared to
baseline.
*

96
The interaction between exercise mode and condition (i.e. stroke vs. healthy) was not statistically
significant, F(1.373, 39.814) = .116, p =.813, partial η2 = .004. R stride length between
conditions was statistically different, F(1, 29) = 28.813, p < .0005, partial η2 = .498. Post hoc
pairwise comparison demonstrated decreased R stride length in stroke participants. This 0.359m
decrement, 95% CI (0.222m to .496m) was statistically significant, p < .0005 (Figure 7).
Walking speed.
One mild outlier was retained in the R stride length data. Gait speed for each condition
and exercise mode was normally distributed, as assessed by Shapiro-Wilk's test (p > .05).
Mauchly's test of sphericity indicated that the assumption of sphericity was not violated, χ2(2) =
1.642, p = .440. The exercise treatments lead to statistically significant changes in gait
speed, F(2, 64) = 3.157, p = .049, η2 = .049 . However, the interaction between treatment and
condition was not statistically significant, F(2,64) = 1.083, p =.342, partial η2 = .033. Data are
mean ± standard deviation unless otherwise stated. Post hoc pairwise comparison demonstrated
that baseline gait speed (1.26 ± 0.35 mps), TM (1.30 ± 0.38 mps) and NS (1.30 ± 0.36 mps) did
not differ, p > 0.05.
Gait speed between conditions were statistically different, F(1, 32) = 33.769, p < .0005,
partial η2 = .513. Post hoc pairwise comparison demonstrated enhanced gait speed (m/sec) in
healthy participants. This 0.505 m/sec increase, 95% CI [0.328m/sec to 0.682m/sec] was
statistically significant, p < .0005 (See Figure 8).
Double support time.
One mild outlier was retained in the R stride length data. Double support time (DST) was
normally distributed, as assessed by Shapiro-Wilk's test (p > .05). Mauchly's test of sphericity
indicated that the assumption of sphericity was not violated, χ2(2) = 1.813, p = .404. The exercise

97
treatment did not lead to any statistically significant changes in double support time, F(2, 56) =
2.421, p = .098, η2
= .080 .
Figure 8: WiGAT Walking Speed post-exercise mode between conditions as compared to
baseline.
Figure 9: WiGAT Double Support Time (DST) post-exercise mode between conditions as
compared to baseline.
*
*

98
The interaction between exercise mode and condition (i.e. stroke vs. healthy) was also not
statistically significant, F(2,56) = .155, p =.857, partial η2 = .005. However, F test demonstrated
increased DST in stroke participants, F(1,28) = 13.130, p =.001, partial η2 = .319. This 0.041s
increase, 95% CI [0.018s to .065s] was statistically significant, p = .001 (See Figure 9).
Asymmetry index.
Extreme outliers were removed from asymmetry index (AI) data set. Mild outliers were
retained during analysis.
Condition Mean Standard Deviation N
Baseline Healthy -7.14 19.89 11
Stroke 47.25 51.35 14
Total 23.32 48.50 25
NuStep Healthy -1.17 8.19 11
Stroke 46.39 56.55 14
Total 25.47 48.38 25
Treadmill Healthy -7.94 16.23 11
Stroke 54.45 52.55 14
Total 27.00 51.03 25
Table 10: Asymmetry Index post exercise mode across conditions as compared to baseline;
positive = right > left, negative = left > right.
AI violated normal distribution, as assessed by Shapiro-Wilk's test (p > .05). Mauchly's test of
sphericity indicated that the assumption of sphericity was not violated, χ2(2) = 4.587, p = .101.
The exercise treatment did not lead to any statistically significant changes in AI, F(2, 46) =
.427, p = .655, η2 = .018 (Table 10). The interaction between exercise mode and condition was
also not statistically significant, F(2,56) = 2.056, p =.148, partial η2 = .082. AI between
conditions was statistically different, F(1, 23) = 11.449, p = .003, partial η2 = .332. Post hoc
pairwise comparison demonstrated increased AI in stroke participants. This 54.779 increase
(95% CI, 21.288 to 88.269) was statistically significant, p = .003 (Figure 10).
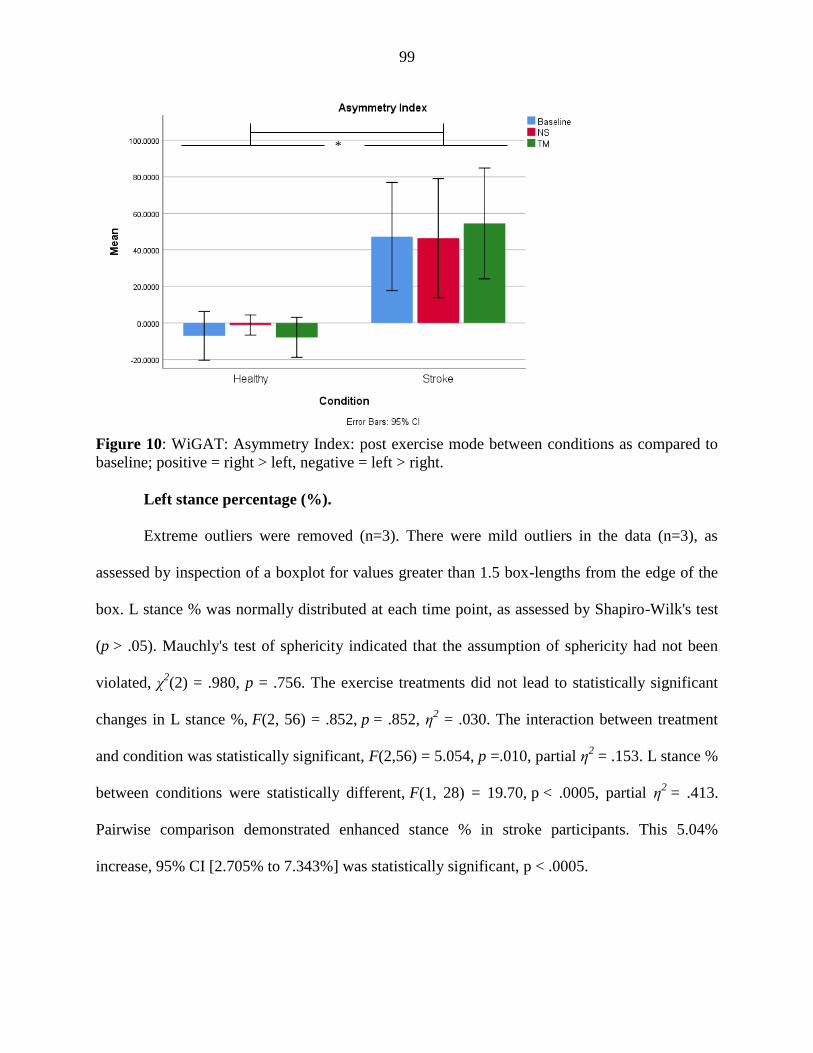
99
Figure 10: WiGAT: Asymmetry Index: post exercise mode between conditions as compared to
baseline; positive = right > left, negative = left > right.
Left stance percentage (%).
Extreme outliers were removed (n=3). There were mild outliers in the data (n=3), as
assessed by inspection of a boxplot for values greater than 1.5 box-lengths from the edge of the
box. L stance % was normally distributed at each time point, as assessed by Shapiro-Wilk's test
(p > .05). Mauchly's test of sphericity indicated that the assumption of sphericity had not been
violated, χ2(2) = .980, p = .756. The exercise treatments did not lead to statistically significant
changes in L stance %, F(2, 56) = .852, p = .852, η2 = .030. The interaction between treatment
and condition was statistically significant, F(2,56) = 5.054, p =.010, partial η2 = .153. L stance %
between conditions were statistically different, F(1, 28) = 19.70, p < .0005, partial η2 = .413.
Pairwise comparison demonstrated enhanced stance % in stroke participants. This 5.04%
increase, 95% CI [2.705% to 7.343%] was statistically significant, p < .0005.
*

100
Right stance percentage (%).
There were mild outliers in the data (n=2), as assessed by inspection of a boxplot for
values greater than 1.5 box-lengths from the edge of the box. R stance % was normally
distributed at each time point, as assessed by Shapiro-Wilk's test (p > .05). Mauchly's test of
sphericity indicated that the assumption of sphericity had not been violated, χ2(2) = 4.197, p =
.123. The exercise treatments did not lead to statistically significant changes in R stance %, F(2,
60) = 2.164, p = .124, η2 = .067. The interaction between treatment and condition was not
statistically different, F(2,60) = .231, p =.794, partial η2 = .008. Furthermore, F test for the effect
of condition demonstrated no statistical difference between healthy and stroke, F(1, 30) =
.898, p = .351, partial η2 = .029.
Left swing percentage (%).
Extreme outliers were removed (n=3). There were mild outliers in the data (n=5), as
assessed by inspection of a boxplot for values greater than 1.5 box-lengths from the edge of the
box. L swing % was normally distributed at each time point, as assessed by Shapiro-Wilk's test
(p > .05). Mauchly's test of sphericity indicated that the assumption of sphericity was violated,
χ2(2) = 7.192, p = .027. The exercise treatments did not lead to statistically significant changes in
L swing %, F(2, 54) = .552, p = .579, η2 = .020. The interaction between treatment and condition
was not statistically significant, F(2,54) = 1.171, p =.311, partial η2 = .042. F test for the effect
of condition demonstrated statistical difference between healthy and stroke, F(1, 27) =
20.076, p < .0005, partial η2 = .426. Post hoc pairwise comparison demonstrated enhanced L
swing % in healthy participants. This 5.258 % increase, 95% CI [2.850% to 7.666%] was
statistically significant, p < .0005.
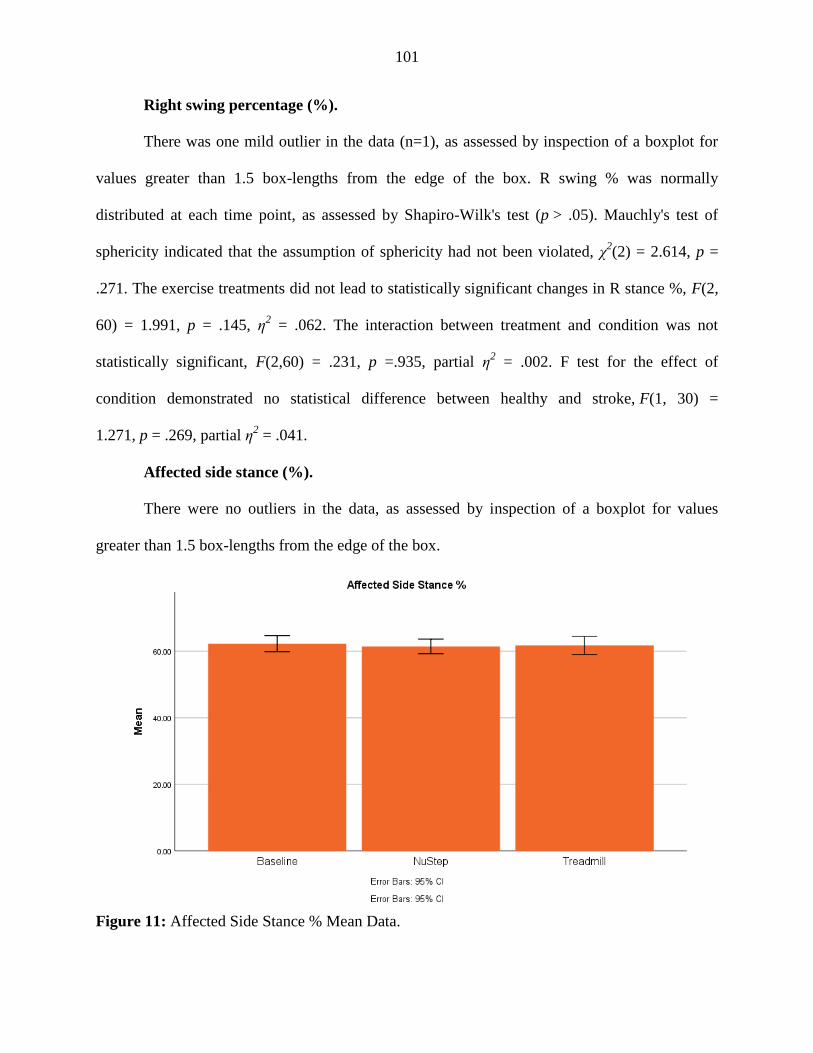
101
Right swing percentage (%).
There was one mild outlier in the data (n=1), as assessed by inspection of a boxplot for
values greater than 1.5 box-lengths from the edge of the box. R swing % was normally
distributed at each time point, as assessed by Shapiro-Wilk's test (p > .05). Mauchly's test of
sphericity indicated that the assumption of sphericity had not been violated, χ2(2) = 2.614, p =
.271. The exercise treatments did not lead to statistically significant changes in R stance %, F(2,
60) = 1.991, p = .145, η2 = .062. The interaction between treatment and condition was not
statistically significant, F(2,60) = .231, p =.935, partial η2 = .002. F test for the effect of
condition demonstrated no statistical difference between healthy and stroke, F(1, 30) =
1.271, p = .269, partial η2 = .041.
Affected side stance (%).
There were no outliers in the data, as assessed by inspection of a boxplot for values
greater than 1.5 box-lengths from the edge of the box.
Figure 11: Affected Side Stance % Mean Data.

102
Affected side stance % was normally distributed at each time point (i.e. baseline, post NuStep,
post treadmill), as assessed by Shapiro-Wilk's test (p > .05). Mauchly's test of sphericity
indicated that the assumption of sphericity had not been violated, χ2(2) = .124, p = .940. The
exercise intervention did not lead to any statistically significant changes in affected side stance
%, F(2, 26) = 1.032, p = .370, η2= .074 (Figure 11).
Non-affected side stance (%).
An extreme outlier was removed from the data, as assessed by inspection of a boxplot for
values greater than 1.5 box-lengths from the edge of the box.
Figure 12: Non-Affected Side Stance % Median Data. * p < .05.
One mild outlier was retained. Non-affected side stance % was statistically significantly different
at the different time points during the exercise intervention, χ2(2) = 6.500, p = .039. Pairwise
comparisons were performed with a Bonferroni correction for multiple comparisons. Non-
affected side stance % was statistically significantly different between baseline (Mdn = 67.89)
*

103
and NuStep (Mdn = 67.58), p = .043. Treadmill (Mdn = 67.89) did not differ from baseline, p =
1.00. Treadmill did not statistically differ from NuStep, p = .199 (Figure 12).
Affected side swing (%).
There were no outliers in the data, as assessed by inspection of a boxplot for values
greater than 1.5 box-lengths from the edge of the box. Affected side stance % was normally
distributed at each time point (i.e. baseline, post NuStep, post treadmill), as assessed by Shapiro-
Wilk's test (p > .05). Mauchly's test of sphericity indicated that the assumption of sphericity had
not been violated, χ2(2) = .124, p = .940. The exercise intervention did not lead to any
statistically significant changes in affected side swing %, F(2, 26) = 1.032, p = .370, η2= .074
(Figure 13).
Figure 13: Affected Side Swing % Mean Data.
Non-affected side swing (%).
An extreme outlier was removed from the data, as assessed by inspection of a boxplot for
values greater than 1.5 box-lengths from the edge of the box. A mild outlier were retained.

104
Non-affected side swing % was statistically significantly different at the different time points
during the exercise intervention, χ2(2) = 8.000, p = .018. Pairwise comparisons were performed
with a Bonferroni correction for multiple comparisons. Non-affected side swing % was
statistically significantly different between baseline (Mdn = 32.11) and NuStep (Mdn = 32.42), p
= .043. Treadmill (Mdn = 32.11) did not differ from baseline, p = 1.00. Treadmill was
statistically different from NuStep, p = .043 (Figure 14).
Figure 14: Non-Affected Side Swing % Median Data. * p < .05.
Affected side stride length (m).
There were no outliers in the data, as assessed by inspection of a boxplot for values
greater than 1.5 box-lengths from the edge of the box. Affected side stride length was normally
distributed at all time points, as assessed by Shapiro-Wilk's test (p < .05). Mauchly's test of
sphericity indicated that the assumption of sphericity had been violated, χ2(2) = 7.284, p = .026.
*
*

105
Figure 15: Affected Side Stride Length (m) Mean Data.
Figure 16: Non-Affected Side Stride Length (m) Mean Data.

106
Epsilon (ε) was 0.687, as calculated according to Greenhouse & Geisser (1959), and was used to
correct the one-way repeated measures ANOVA. The exercise interventions did not lead to any
statistically significant changes in affected side stride length F(1.375, 17.869) = .686, p = .464,
η2= .050 (Figure 15).
Non-affected side stride length (m).
There were no outliers in the data, as assessed by inspection of a boxplot for values
greater than 1.5 box-lengths from the edge of the box. Affected side stride length was normally
distributed at all time points, as assessed by Shapiro-Wilk's test (p < .05). Mauchly's test of
sphericity indicated that the assumption of sphericity had been violated, χ2(2) = 7.284, p = .026.
Epsilon (ε) was 0.674, as calculated according to Greenhouse & Geisser (1959), and was used to
correct the one-way repeated measures ANOVA. The exercise interventions did not lead to any
statistically significant changes in non-affected side stride length F(1.348, 16.172) = 3.096, p =
.088, η2= .205 (Figure 16).

107
CHAPTER 9 DISCUSSION
Muscle Activation – Pilot 1
To our knowledge, this is the first investigation to determine SS cadence based upon
participant's perceived exertion (i.e., RPE) using the NuStep Cross Trainer. All participants
completed all 5 protocols despite, anecdotally, participants being most challenged to meet their
SS cadence at resistance level 8. The results of this investigation are most likely dependent on
two factors: 1- An increase in speed and resistance causes an increase in global muscular
activation and 2- the researcher's specific directions to the participant.
The findings indicated that increased resistance (SSL8) and step cadence (SS+20%)
resulted in increased muscular activation as measured by mEMG and pEMG. Increased step
cadence (SS+20%) did not lead to enhanced neuromuscular recruitment of lower extremity
musculature over the SSL8 protocol. Rather, SSL8 produced the highest mEMG and pEMG
measurements for all muscles under all protocols. SSL8 elicited the highest pEMG measures of
38.18 ± 15.96% (95% CI = 31.95 – 44.7%) in LVMO (Table 6). SSL8 also resulted in the
highest mEMG of 24.95 ± 10.54% (95% CI = 20.75 -29.46 %) in LVMO. These percentages of
VMO activation are consistent with previous walking protocols (Powers, Landel & Perry, 1996).
Additionally, the protocol differences were consistent across both the right and left legs.
However, future research should identify whether a leg preference exists in NuStep
propulsion (e.g., higher mEMG and pEMG values in preferential legs across protocols). Our
findings are consistent with Huang & Ferris (2004) and Kao & Ferris (2005) where an increase
in resistance (i.e., highest resistance level in which participant could step for 20 seconds) and
frequency (30-120 steps/min) improved self-driven EMG amplitude. However, this
investigation’s SS cadence (123.86 ± 18.12 steps per minute) was similar to a 1.5 m/sec

108
frequency matched protocol in a previous investigation (i.e., 123 ± 3 steps per minute) (Stoloff,
Zehr & Ferris, 2007). However, unlike that investigation, our exercise bout was longer (i.e., 5
minutes vs. 10s). Current EMG analysis demonstrated that improving cadence or resistance
increased muscular activation in comparison to SS cadence without resistance.
When learning a motor task, the novice individual aims to limit task complexity.
According to Bernstein, the learning process requires the initial “freezing” of limbs (Schmidt &
Lee, 2011). This freezing reduces the number of degrees of freedom across multiple joints and
thus, a reduction of task complexity. Despite constrained kinematics, the NuStep is an exercise
modality that, when compared to walking has reduced degrees of freedom, and thereby, is a less
complicated task. An individual’s stepping is constrained by the seat and pedal positions
(Stoloff, Zehr & Ferris, 2007) As a result; recumbent stepping generally has smaller limb forces
(Huang and Ferris, 2004). However, recumbent stepping does not provide variability in step to
step kinematic motor pattern (Stoloff, Zehr & Ferris, 2007). Lastly, the need for the participant
to weight bear through the lower extremities is absent while stepping on a recumbent cross
trainer. The foot remains in contact with the pedal.
The seated posture and guided coordination (i.e., fixed footpath) is thought to reduce
cognitive demand. A reduction in cognitive demand is coupled with high levels of muscular
activation can be a potent recipe for neurological recovery. Therefore, the NuStep cross trainer
may provide an intermediate progression between supine and weight-bearing exercise.
Limitations and Future Direction
Peripheral factors may affect EMG amplitude, including but not limited to muscle fiber
composition, blood flow, fiber diameter, electrode location, intracellular action potential change
(i.e., calcium) and the quantity of subcutaneous tissue (De Luca, 1997; Reaz, Hussain, & Mohd-

109
Yasin, 2006; Arabadzhiev, Dimitrov, & Dimitrov, 2014). To improve internal validity and to
eliminate day to day variations in EMG measures, all testing was conducted within a single
session. Therefore, the location of EMG electrodes did not change. Nonetheless, caution should
be used when interpreting changes in EMG amplitude over time. Furthermore, the large number
of analyses may have risked Type I error. In contrast, the consequential alpha adjustments may
have reduced the investigation's ability to detect change (i.e., Type II error).
Muscle Adaptation – Pilot 2
The purpose of this investigation was to study the potential change in EMG activity of 12 lower
extremity muscles over a 5-minute exercise bout and during five different stepping protocols.
mEMG was compared between the second and fourth minute of this 5-minute exercise bout.
Results indicated a higher level of muscle adaptation, as measured by the reduction of mEMG
during minute 4 at protocols below the subject’s self-selected pace. Despite the changes in
mEMG, the subject’s work output was held constant. These statistically significant reductions in
muscle activation are interpreted as an acute response. At a significantly lower cadence, it is
presumed that a new motor pattern was acquired to adapt to the stepping demands. It appears that
each muscle may contain differing temporal costs to achieve exercise efficiency. Lastly, a
reduction in muscle adaptation occurred at the higher cadence (i.e., SS+20%) and resistance (i.e.,
SSL8). Trained muscles generate a given amount of submaximal force with less EMG activity;
suggesting a more efficient motor unit recruitment with practice (Kenney, Willmore & Costill,
2015).
We speculate that the self-selected speed is the cadence to which the participant operated
at the highest efficiency. A protocol that requires the exerciser to operate at speed significantly
below this self-selected cadence required the most significant change in muscle adaptation, and

110
perhaps, learning. In theory, as the participant's motor pattern adapted, we would expect to see
reduced cortical activity coupled with enhanced dendrite gyrus, basal ganglia, and cerebellum
activity. However, we only measured an acute performance variable and therefore can only
speculate at this time. Previous investigators also speculated that cortical reorganization, brought
about by repeated leg use in a functional manner, (i.e., simulation of walking), was at least
partially responsible for the improvement in balance and impairment (Page, Levine, Teepen,
Hartman, 2008).
Limitations and Future Directions.
This investigation validated the presence of an acute adaptation in muscle while on the
NuStep Cross Trainer. Future investigations should measure a potential learning effect at a
retention test (i.e. 24-48 hours after last practice trial). Additionally, the ability to decipher
whether leg dominance influences muscle adaptation during the exercise bout or learning (e.g., at
retention) is needed. This research demonstrated that recumbent stepping is altered as a
consequence of exercising below a self-selected cadence. Previously, it was assumed that
recumbent stepping patterns do not change as a function of time.
NuStep Cross Trainer vs. Treadmill
The purpose of this investigation was to compare the effects of treadmill walking vs.
recumbent stepping on muscle mEMG in chronic stroke survivors (i.e.,> 6 months post stroke)
vs. age and sex-matched healthy participants. More specifically, a self-selected cadence (as
determined by an individual's RPE) on lower extremity muscle activation (as measured by EMG
amplitude) between the NuStep Cross Trainer and Treadmill. Their subsequent effect on gait was
also investigated. BMI, age, height, and weight did not differ between the conditions. RPE based
10 minute SS protocol was not statistically different between the participant’s conditions on TM

111
or NS. Stroke RPE did not statistically differ on the TM (Mdn = 11.9) as compared to the NS
(Mdn = 11.4). Healthy subjects also did not differ in the RPE based SS protocol across exercise
modes. It seems that physiological state (as measured by HR and BP) did not influence our data.
HR was below 80 beats per minute at all points of measurement.
TM speed during the RPE based 10 minute SS protocol was higher in the healthy
condition despite no statistical difference in RPE. This is in agreement with previous
observations that individuals with stroke demonstrate excessive energy cost per distance walked
(Olney & Richards, 1996). Preferred walking speeds will be much slower, and energy
expenditure at a specific work rate will be 55-64% greater in individuals with a CVA (Palmer-
McLean & Harbst, 2003). NS Average steps per minute did not differ between the stroke and
healthy conditions during the RPE based 10 minute SS protocol.
Machine setting constraints (± 5 steps on NS, 0.2 kph on TM) did not create any
statistical differences between the RPE based 10 minute SS protocol and the 5-minute exercise
protocol. Chronic stroke subjects sat in a farther seat position from pedals. This seat position
perhaps led to the lessened degree of right knee flexion measured in the pedal up position (See
Figure 3). Height and weight were equated between the two groups. Therefore, height did not
account for this relationship. Perhaps, an extensor pattern (i.e., hip extension, knee extension, hip
adduction, hip internal rotation, plantarflexion and ankle inversion) was demonstrated in the
chronic stroke condition and consequently influenced a chosen comfortable seat position and
thus a pedal up knee flexion.
The healthy condition was stronger than the chronic strokes in all joint actions. Both
groups, however, demonstrated stronger L knee extension as compared to R knee extension. R
knee ext was performed first for both groups. This may be the result of an ordered learning

112
effect. Researchers verbally expressed both force and time to force to be recorded. This may
have led to a subconscious change in body position (i.e., hip extension) during L knee extension
that would be biomechanically more advantageous for the biarticulate rectus femoris . Otherwise,
the healthy condition was bilaterally symmetrical in knee flx, ankle dflx, and ankle plantarflx.
The stroke condition was comprised of 8 individuals with right side hemiplegia. Therefore, the
stroke condition demonstrated higher in strength in both L knee ext and L knee flx. However, no
strength deficits were observed in the ankle (i.e., plantar or dorsiflexion). Both leg preference
questions elicited a higher majority of CVA participants selecting the left leg to balance (n=10)
and kick (n=7).
NS resulted in higher mEMG of the RF (RRF and LRF), RST, SOL (RSOL and LSOL),
MG (RMG and LMG) in the stroke condition as compared to the healthy condition, p < .025.
The TM provoked a higher mEMG in RRF and RST in the stroke condition as compared to the
healthy, p < .025. Healthy condition saw higher mEMG on the TM in RRF, LST, MG (RMG and
LMG), SOL (RSOL and LSOL), and TA (RTA and LTA).However, when the NS is compared to
the TM within the stroke condition, mEMG is higher in RRF, RMVO, LST, RSOL and LTA on
TM as compared to NS, p < .025. RMG, LMG, and RTA saw a non-statistically different mean
averages favor the TM. Lofty standard deviations, perhaps due to a mechanical artifact, may
have influenced this statistical assessment. 5 of 12 (42%) measured muscles (i.e. left vs. right)
demonstrated higher mEMG outputs on the TM in the CVA population. 8 of 12 (67%) measured
muscles (i.e. left vs. right) demonstrated higher mEMG outputs on the TM in the healthy
population. Therefore, it seems the extent of this normative relationship (TM > NS) was
diminished in the CVA population.

113
mEMG was also evaluated by comparing the affected side (i.e., hemiplegic) to unaffected lower
extremity in the CVA population. All muscles on affected lower extremity saw a greater mEMG
on TM except ST. TM also demonstrated higher mEMG values of the non-affected lower
extremity in the ST, TA, and SOL. RF, VMO, and MG of the non-affected leg were not
statistically different between the exercise modes. Therefore, when comparing affected vs. non-
affected lower extremity in the CVA population, 8 of 12 muscles elicited higher mEMG on the
TM.
No difference existed between conditions on TM ∆ROM (i.e., total ROM excursion)
except for L ank where healthy ROM was higher than the stroke condition, p < .025. No
difference existed between conditions on NS across all joints between conditions, p < .025.
Healthy participants demonstrated higher ROM in R knee, R ank and L ank on TM compared to
NS, p < .025. No difference in the stroke condition between TM and NS suggesting that the
ROM excursion (i.e., max-min) experienced is similar between the modalities for chronic CVA.
However, this result should be taken with extreme caution as a result of goniometer malfunction
that reduced total n.
L stride and R stride lengths were longer in healthy participants. Both exercise modes
improved L stride length. However, TM elicited a statistically significant effect on L stride
length (M = 1.28m, SD = .27) in both conditions compared to baseline (M = 1.25, SD = .25m).
NS’s increased in L stride length was no statistically different from baseline. However, NS and
TM were also not statistically different. R stride length was unaffected by exercise. Longer
stance phases, greater on the unaffected side, are reported in a CVA population (Olney &
Richards, 1996). L stance % was higher in the stroke population. This also led to a decreased
swing percentage % on the L side. However, non-affected side stance % was increased with the

114
NS (Figure 12). Furthermore, the non-affected side swing % was statistically higher after NuStep
(Figure 14). The NuStep was an effective method for improving stance-swing parameters in the
non-affected leg despite the chronic nature of the stroke population. Exercise interventions did
not lead to changes in affected side stance %, swing %, and stride length. Lastly, exercise
interventions did not affect stride length on the non-affected lower extremity. Exercise treatment
proved to be ineffective in modulating double support time in either group. However, as
expected, double support time was longer in the chronic stroke condition (Olney & Richards,
1996).
The chronic stroke suffered from a higher asymmetry index, as calculated by the WiGAT
system. There is currently limited evidence on the effect of visual feedback (VF) while
exercising on the NS. Previous investigations saw that stepping on the NS caused specific
muscles (i.e., VMO and Soleus) in particular to be activated preferentially in chronic stroke
(Pardo et al., 2018). Participants who generated more force on their non-affected side without VF
had a more balanced force production with VF (n = 5, the others were closer to the optimal 50:50
stepping without visual feedback) (Pardo et al., 2018). Gait indices showed a trend towards
improved swing to stance ratio after training (Pardo et al., 2018). Clinically, the ability to
improve the symmetry of stepping in the stroke population by using visual feedback could be of
interest to clinicians, who may want to include the NuStep as an intervention to encourage the
forced use of the affected side. This preliminary investigation gives reasoning to perform a
longitudinal investigation whether the improvement of stepping symmetry after extended (i.e.,>1
day) NuStep training. In the current investigation, no cueing or instructions were given to the
participant in regards to exercise symmetry. This could, in part, explain why exercise treatment
did not elicit an effect on asymmetry.

115
Healthy individuals walked faster during the 3 x 10 m hallway walks. Exercise treatments
did not elicit change to participants walking speed compared to baseline. Normal gait mechanics
outline that a limb will spend 60% of the gait cycle in stance. L stance phase was higher in stroke
(M = 67.27%) as compared to healthy (M = 62.24%). L swing phase was lower in stroke (M =
32.73%) as compared to healthy (M = 37.99%). Exercise treatment did not affect L or R stance.
R stance phase was equal between the two conditions.
A reduction in cognitive demand is coupled with high levels of muscular activation can
be a potent recipe for promoting neurological recovery but maintaining patient safety. Both TM
and NS improved mEMG output. A TM, however, requires a higher level of postural control and
thus explains why TM had higher mEMG in the majority of muscles across both conditions.
Treadmill ambulation training can also require exceptional resources or additional personnel to
administer (Page, Levine, Teepen & Hartman, 2008). In the current investigation, the TM
protocols required a minimum of 2-3 researchers (1 to spot the participant, 1 to run the EMG
software, 1 to run TM). The NuStep only required one researcher. Clinically, a therapist acting
alone (i.e., without assistance) may choose the NS over TM to reduce perception or chances of
fall while maintaining high percentages of their MVC during the exercise bout. This reduces
accessibility to patients (Stoloff, Zehr & Ferris, 2007). Several sophisticated devices have been
developed to overcome these limitations, but their cost and size may limit their use. Less
expensive alternatives that facilitate muscle activity through a modified stepping pattern could
improve accessibility (Stoloff, Zehr & Ferris, 2007).
In a randomized, controlled, single-blinded crossover study, NuStep participation (3x per
week for 30 minutes) showed impairment reductions (i.e., increased score on Fugl-Meyer
Assessment of Motor Recovery after Stroke) and improved balance (i.e. Berg Balance Scale)

116
over 8 weeks (Page, Levine, Teepen & Hartman, 2008). Impairment changes included new and
isolated ankle movement and reduced dysmetria (i.e., lack of coordination of movement typified
by an undershooting or overshooting of intended position) and improved speed of affected heel
to opposite knee task. Berg Balance Scale assessment saw positive changes in sit to stand ability,
increased time in an unsupported stance, and transferability. However, due to the small sample
sizes, statistical analysis was not applied (Page, Levine, Teepen & Hartman, 2008). A 2007 study
was the first to compare muscle activation and kinematics of treadmill (TM) walking to the
NuStep Cross Trainer (NS) (Stoloff, Zehr & Ferris, 2007). The authors studied subjects that
walked with bodyweight support (i.e. 50% body weight) and without bodyweight (i.e. 0%
bodyweight) support at 0.5 meters/second (m/s), 1.0 m/s, and 1.5 m/s. (Robomedica, Inc. Irvine,
CA). Both arms and legs propelled the NuStep Cross Trainer to three different frequencies
corresponding to their preferred stride frequency at the speeds as mentioned above. The average
corresponding step frequencies for 0.5 m/s, 1.0 m/s and 1.5 m/s were 71 ± 3 steps/min, 101 ± 3
steps per min (steps/min) and 123 ± 3 steps/min (mean ± standard error of the mean). The 1.5
m/s stepping frequency was similar to our 5-minute exercise protocols during Pilot 1 (i.e., 123.86
± 18.12 steps/min). Resistance was increased to maximize EMG amplitude during the 20
seconds (stepping frequency of 0.5 m/s and 1.0 m/s) and 10 seconds (stepping frequency of 1.5
m/s) bouts. Ten healthy subjects (aged 18-27) participated in the investigation. Both goniometer
(ankle, knee, hip, elbow and shoulder) and EMG data (lower extremity: soleus, tibialis anterior,
medial and lateral gastrocnemius, vastus medialis, vastus lateralis, medial hamstring, rectus
femoris; upper extremity: biceps brachii, triceps brachii, anterior deltoid, posterior deltoid) was
recorded unilaterally on the subject’s left side (Appendices D & F). The current investigations
measured muscular activation bilaterally. Left heel strike to left heel strike defined the step cycle

117
while on TM. Whereas, left leg extension to left leg extension defined the step cycle on NS.
EMG data were normalized to the value calculated for walking at 1.5 m/s. Lower extremity
EMG results are outlined in Figure 11. During both stance and swing phases (corresponding to
limb extension and flexion for NuStep), thigh and upper limb muscles were lower during
walking than during the NuStep (Appendix D). That is, the NuStep cross trainer saw elevated
upper limb and thigh (vastus medialis, vastus lateralis, rectus femoris and medial hamstring)
EMG (Stoloff, Zehr & Ferris, 2007). Whereas, both healthy and stroke populations saw higher
RRF mEMG on the TM as compared to the NS. During the stance phase (i.e., extension phase
on NuStep), tibialis anterior and medial gastrocnemius EMG were lower during the NS as
compared to the TM, p < .01 (Stoloff, Zehr & Ferris, 2007). During the swing phase (i.e., flexion
on NuStep), soleus, medial gastrocnemius and lateral gastrocnemius were higher on NuStep, p <
.01(Stoloff, Zehr & Ferris, 2007). Medial hamstring activation was out of phase for the NuStep
as compared to walking (Appendix D) (Stoloff, Zehr & Ferris, 2007). Soleus activation was
shifted earlier in the step cycle on NuStep (Appendix D). The upper limb seemed to display
fundamentally different muscle activation patterns (Appendix E). Cross-correlation analysis of
individual muscle EMG between conditions showed a high correlation (r > 0.70) in 7 of 12
muscles (Appendix G). The soleus, tibialis anterior, medial hamstring, and gastrocnemius
(medial and lateral) demonstrated a low correlation between (r < 0.70) the conditions. The
correlation coefficient comparing walking and recumbent stepping were lower at faster speeds
for lateral gastrocnemius, rectus femoris, medial hamstring, biceps brachii and triceps brachii, p
< .05. All joints except the shoulder had significantly different minimum and maximum joint
angles for TM and NS (Stoloff, Zehr & Ferris, 2007). Minimum shoulder joints angles were
different, but maximum joint angles were comparable (Stoloff, Zehr & Ferris, 2007). Excursions

118
of the hip, elbow, and shoulder were significantly less for walking than for the NS. At some
speeds, the excursion of the knee and ankle were greater for the NS than it was for 50%
bodyweight support, p < .05. However, there was no significant difference between the knee and
ankle excursion for NS and 0% bodyweight support. There were no differences in minimum,
maximum or excursion across stepping speeds (Stoloff, Zehr & Ferris, 2007). These authors
concluded that stepping on the NuStep Cross trainer activates similar motor pathways as
walking, despite temporal differences in individual muscle EMG (Stoloff, Zehr & Ferris, 2007).
Authors speculated that the lower correlations observed in the leg might depend on afferent
feedback for activation (Stoloff, Zehr & Ferris, 2007).
Conclusions
The exercise professional should consider the client’s motor abilities when selecting an
appropriate exercise device. For example, impaired sitting balance may limit the use of upright
ergometers that do not have torso support. Elevated exercise modes may also require a step stool
to perform an independent or assisted transfer (Palmer-McLean & Harbst, 2003). A recumbent
device may be more appropriate (Palmer-McLean & Harbst, 2003). Furthermore, the NuStep
was among the preferred exercise modalities in the elderly (Looney & Rimmer, 2003).
The NuStep Cross Trainer may be a useful adjunct to physical therapy requiring
minimum supervision with lasting effects after discharge (Teepen, Baltzer, Dunning & Levine,
2005). It also offers promise to patients discharged from therapy as it combines aspects of
strength and cardiovascular training (Teepen, Baltzer, Dunning & Levine, 2005). However, the
potential drawback to exercise machines for stepping practice is that they sacrifice some task
specificity and lowered mEMG (Stoloff, Zehr & Ferris, 2007). To our knowledge, this is the first
investigation to examine the effect of a NS and TM on mEMG in a CVA and healthy (age and

119
sex matched) population. We demonstrated that the NuStep Cross Trainer immediately improved
gait parameters on the non-affected leg following a 5-minute stepping protocol.
Limitations and Future Directions.
Muscle strength tests can include computerized dynamometers (e.g., CybexTM,
BiodexTM) or manually by handheld dynamometers (Lafayette Instrument 01165 Manual
Muscle Testing Device). It should be noted that strength testing can be problematic in
populations with brain injury (Palmer-McLean & Harbst, 2003). Strength can only be reliably
tested when an individual can isolate joint movements.
Exercise programs for individuals with CVA should be aimed at not only at increasing
the levels of physical fitness but also at reducing risk factors (Palmer-McLean & Harbst, 2003).
Theoretically, a reduction in risk factors should decrease the incidence of secondary strokes
An aerobic conditioning program can alter several of the risk factors associated with CVA,
including reduced hypertension, enhanced glucose regulation, improved blood lipid profiles and
improved body composition (Palmer-McLean & Harbst, 2003). Associative depression may
improve as a result of exercise. Exercise is associated with a more significant reduction in
depression symptoms compared with no treatment, placebo, or active control interventions, such
as relaxation or meditation (Cooney, Dwan & Meed, 2014). However, analysis of high-quality
studies alone suggests only small benefits (Cooney, Dwan & Meed, 2014). This study did not
measure spasticity, passive range of motion, or motor recovery as outlined by previous
investigations (Page, Levine, Teepen & Hartman, 2008). However, the current population
accrued more time between CVA and testing (120 months ± 60 months) compared to 44.43 ±
24.48 months (Page, Levine, Teepen & Hartman, 2008). The current investigation did not
include exclusion criteria for prescribed medication that may improve spasticity. However, with
120
a repeated measures design, each participant served as their own control mitigating this
limitation. The current investigation lost goniometric data due to malfunctioning equipment. This
problem also occurred in prior investigations Stoloff, Zehr & Ferris, 2007). Future research
should examine the effects of NS practice over time. How the results of the current investigation
compare to a sub-chronic CVA population also remains unknown. Future research should
examine whether there are changes in CVA vs. healthy EMG according to pedal position or
stepping phase. Lastly, the effect of whole body NS exercise on gait should be investigated.

121
APPENDIX A

122

123
124
125

126

127

128

129
APPENDIX B

130

131

132
133

134

135
136

137

138

139

140

141
APPENDIX C

142
APPENDIX D
Adopted from Stoloff, Zehr & Ferris, 2007. Averaged rectified lower limb EMG and joint angle
averaged over 5 step cycles: (SO: soleus, TA: tibialis anterior, MG: medial gastrocnemius, LG:
lateral gastrocnemius, VM: vastus medialis, VL: vastus lateralis, MH: medial hamstring, RF:
rectus femoris). Grey traces indicate one standard deviation. The dashed line represents the split
between stance (extension) and swing (flexion).

143
APPENDIX E
Averaged root-mean-square (RMS) EMG during stance (extension) with standard error bars for
walking at 1.0 m/s and stepping at the corresponding frequency.

144
APPENDIX F
Adopted from Stoloff, Zehr & Ferris, 2007. Averaged rectified lower limb EMG and joint angle
averaged over 5 step cycles: (BB: biceps brachii, TB: triceps brachii, AD: anterior deltoid, PD:
posterior deltloid. Grey traces indicate one standard deviation. The dashed line represents the
split between stance (extension) and swing (flexion).

145
APPENDIX G
Adopted from Stoloff, Zehr & Ferris, 2007. Averaged (n = 10) correlation coefficient for muscle
EMG for walking at 1.0 m/s and stepping frequency.

146
REFERENCES
Arabadzhiev, T. I., Dimitrov, V. G., & Dimitrov, G. V. (2014). The increase in surface EMG
could be a misleading measure of neural adaptation during the early gains in strength.
European journal of applied physiology, 114(8), 1645-1655.
Barrett, K. E., Barman, Susan M., Biotano, Scott., Brooks, Heddwen L. (2012). Ganong's Review
of Medical Physiology (24 ed.): Tata McGraw-Hill
Billinger, S., Loudon, J., & Gajewski, B. (2008). Validity of a total body recumbent stepper
exercise test to assess cardiorespiratory fitness. The Journal of Strength & Conditioning
Research, 22(5), 1556-1562.
Benjamin, E. J., Blaha, M. J., Chiuve, S. E., Cushman, M., Das, S. R., Deo, R., Floyd, J.,
Fornage, M., Gillespie, C., Isasi, C. (2017). Heart disease and stroke statistics-2017
update: a report from the American Heart Association. Circulation, 135(10).
Billinger, S., Van Swearingen, E., McClain, M., Lentz, A., & Good, M. (2012). Recumbent
stepper submaximal exercise test to predict peak oxygen uptake. Medicine and science in
sports and exercise, 44(8), 1539.
Borg, G. A. (1982). Psychophysical bases of perceived exertion. Med sci sports exerc, 14(5),
377-381.
Brown, T. G. (1911). The intrinsic factors in the act of progression in the mammal. Proceedings
of the Royal Society of London. Series B, containing papers of a biological character,
84(572), 308-319.
Brown, T. G. (1914). On the nature of the fundamental activity of the nervous centres; together
with an analysis of the conditioning of rhythmic activity in progression, and a theory of
the evolution of function in the nervous system. The Journal of Physiology, 48(1), 18-46.
147
Burdett, R. G., Borello-France, D., Blatchly, C., & Potter, C. (1988). Gait comparison of subjects
with hemiplegia walking unbraced, with ankle-foot orthosis, and with Air-Stirrup®
brace. Physical Therapy, 68(8), 1197-1203.
Cerri, G., Borroni, P., & Baldissera, F. (2003). Cyclic H-reflex modulation in resting forearm
related to contractions of foot movers, not to foot movement. Journal of
Neurophysiology, 90(1), 81-88.
Cooney, G., Dwan, K., & Mead, G. (2014). Exercise for depression. Jama, 311(23), 2432-2433.
Dalleck, L. C., Borresen, E. C., Parker, A. L., Abel, K. M., Habermann, L. A., McLaughlin, S. J.,
& Tischendorf, J. S. (2011). Development of a metabolic equation for the NuStep
recumbent stepper in older adults. Perceptual and Motor Skills, 112(1), 183-192.
de Kam, D., Rijken, H., Manintveld, T., Nienhuis, B., Dietz, V., & Duysens, J. (2013). Arm
movements can increase leg muscle activity during submaximal recumbent stepping in
neurologically intact individuals. Journal of Applied Physiology, 115(1), 34-42.
De Luca, C. J. (1997). The use of surface electromyography in biomechanics. Journal of applied
biomechanics, 13(2), 135-163.
Dietz, V. (2002). Do human bipeds use quadrupedal coordination? Trends in neurosciences,
25(9), 462-467.
Dietz, V., & Berger, W. (1984). Interlimb coordination of posture in patients with spastic paresis:
impaired function of spinal reflexes. Brain, 107(3), 965-978.
Dinneen, L., Blakesley, B. (1973). Algorithm AS 62: a generator for the sampling distribution of
the Mann-Whitney U statistic. Journal of the Royal Statistical Society. Series C (Applied
Statistics), 22(2), 269-273.

148
González-Camarena, R., Carrasco-Sosa, S., Román-Ramos, R., Gaitán-González, M. J., Medina-
baÑuelos, V., & Azpiroz-Leehan, J. (2000). Effect of static and dynamic exercise on
heart rate and blood pressure variabilities. Medicine and science in sports and exercise,
32(10), 1719-1728.
Greenhouse, S. W., & Geisser, S. (1959). On methods in the analysis of profile data.
Psychometrika, 24(2), 95-112.
Hermens, H. J., Freriks, B., Merletti, R., Stegeman, D., Blok, J., Rau, G., Disselhorst-Klug, C.,
Hägg, G. (1999). European recommendations for surface electromyography. Roessingh
Research and Development, 8(2), 13-54.
Hiebert, G., Whelan, P., Prochazka, A., & Pearson, K. (1996). Contribution of hind limb flexor
muscle afferents to the timing of phase transitions in the cat step cycle. Journal of
Neurophysiology, 75(3), 1126-1137.
Huang, H. J., & Ferris, D. P. (2004). Neural coupling between upper and lower limbs during
recumbent stepping. Journal of Applied Physiology, 97(4), 1299-1308.
Huang, H. J., & Ferris, D. P. (2009a). Upper and lower limb muscle activation is bidirectionally
and ipsilaterally coupled. Medicine and science in sports and exercise, 41(9), 1778.
Huang, H. J., & Ferris, D. P. (2009b). Upper limb effort does not increase maximal voluntary
muscle activation in individuals with incomplete spinal cord injury. Clinical
Neurophysiology, 120(9), 1741-1749.
Jakobi, J. M., & Chilibeck, P. D. (2001). Bilateral and unilateral contractions: possible
differences in maximal voluntary force. Canadian journal of applied physiology, 26(1),
12-33.

149
Kandel, E. R., Schwartz, James, H., Jessell, Thomas, M., Siegelbaum, Steven, A., Hudspeth, AJ.
. (2013). Principles of Neural Science (5th ed.): McGraw Hill Medical.
Kao, P.-C., & Ferris, D. P. (2005). The effect of movement frequency on interlimb coupling
during recumbent stepping. Motor control, 9(2), 144-163.
Kenney, W. L., Wilmore, J. H., & Costill, D. L. (2015). Physiology of Sport and Exercise (6th
ed.): Human Kinetics.
Kochanek, K. D., Murphy, S. L., Xu, J., & Arias, E. (2014). Mortality in the united states, 2013.
In: US Department of Health and Human Services, Centers for Disease Control and
Prevention, National Center for Health Statistics.
Kriellaars, D., Brownstone, R., Noga, B. R., & Jordan, L. (1994). Mechanical entrainment of
fictive locomotion in the decerebrate cat. Journal of Neurophysiology, 71(6), 2074-2086.
Looney, M. A., & Rimmer, J. H. (2003). Aerobic exercise equipment preferences among older
adults: a preliminary investigation. Journal of applied measurement, 4(1), 43-58.
Macko, R. F., Ivey, F. M., Forrester, L. W., Hanley, D., Sorkin, J. D., Katzel, L. I., Silver, K.H.,
Goldberg, A. P. (2005). Treadmill exercise rehabilitation improves ambulatory function
and cardiovascular fitness in patients with chronic stroke: a randomized, controlled trial.
Stroke, 36(10), 2206-2211.
Macleod, C. A., Conway, B. A., Allan, D. B., & Galen, S. S. (2014). Development and validation
of a low-cost, portable and wireless gait assessment tool. Medical Engineering and
Physics, 36(4), 541-546.
Meyers, L. S., Gamst, G., & Guarino, A. J. (2006). Applied multivariate research: Design and
interpretation: Sage.

150
Mozaffarian, D., Benjamin, E. J., Go, A. S., Arnett, D. K., Blaha, M. J., Cushman, M., . . .
Fullerton, H. J. (2015). Heart disease and stroke statistics—2016 update: a report from
the American Heart Association. Circulation, CIR. 0000000000000350.
Olney, S. J., Monga, T. N., & Costigan, P. A. (1986). Mechanical energy of walking of stroke
patients. Archives of physical medicine and rehabilitation, 67(2), 92-98.
Olney, S. J., & Richards, C. (1996). Hemiparetic gait following stroke. Part I: Characteristics.
Gait & posture, 4(2), 136-148.
Palmer-McLean, K., & Harbst, K. B. (2003). Stroke and Brain Injury. In J. L. Durstine, Moore,
G.E. (Ed.), ACSM's Exercise Management for Persons with Chronic Diseases and
Disabilities (pg. 238-246): Human Kinetics.
Page, S. J., Levine, P., Teepen, J., & Hartman, E. C. (2008). Resistance-based, reciprocal upper
and lower limb locomotor training in chronic stroke: a randomized, controlled crossover
study. Clinical rehabilitation, 22(7), 610-617.
Pardo, V., Caldwell, J., DeAngelo, S., Rohkohl, A., Swadling, A.Galen, S.. (2018, Feb.). Effects
of Visual Feedback on Muscle Recruitment and Retention of Force Production During
Recumbent Stepping in Individuals With Stroke. APTA – Combined Sections Meeting.
New Orleans, LA.
Pearson, K., Gordon, E. (2013). Locomotion. In E. R. Kandel, Schwartz, James, H., Jessell,
Thomas, M., Siegelbaum, Steven, A., Hudspeth, A. (Ed.), Principles of Neural Science
(5th ed., pp. 813-834). United States of America: The McGraw-Hill Companies.
Pollock, A., Baer, G., Pomeroy, V., & Langhorne, P. (2004). Physiotherapy treatment approaches
for the recovery of postural control and lower limb function following stroke. Cochrane
Database of Systematic Reviews, 1, 1-31.

151
Powers, C. M., Landel, R., & Perry, J. (1996). Timing and intensity of vastus muscle activity
during functional activities in subjects with and without patellofemoral pain. Physical
Therapy, 76(9), 946-955.
Reaz, M. B., Hussain, M., & Mohd-Yasin, F. (2006). Techniques of EMG signal analysis:
detection, processing, classification and applications. Biological procedures online, 8(1),
11-35.
Sackley, C., Baguley, B., Gent, S., & Hodgson, P. (1992). The use of a balance performance
monitor in the treatment of weight-bearing and weight-transference problems after stroke.
Physiotherapy, 78(12), 907-913.
Schmidt, R. A., & Lee, T. D. (2011). Motor control and learning : a behavioral emphasis (5th
ed.). Champaign, IL: Human Kinetics.
Schmidt, R. A., Lee, T., Winstein, C., Wulf, G., & Zelaznik, H. (2018). Motor Control and
Learning, (6th
ed). Champaign, IL: Human kinetics.
Stoloff, R., Zehr, E., & Ferris, D. (2007). Recumbent stepping has similar but simpler neural
control compared to walking. Experimental brain research, 178(4), 427-438.
Teepen, J., Baltzer, K., Dunning, K., Levine, P., & Page, S. (2005). Stepping Out: Improving
Community Ambulation and Function After Stroke. Journal of Neurologic Physical
Therapy, 29(4), 215.
Vincent, W., & Weir, J. (2012). Statistics in kinesiology. Champaign, IL: Human Kinetics.
von Schroeder, H. P., Coutts, R. D., Lyden, P. D., & Nickel, V. L. (1995). Gait parameters
following stroke: a practical assessment. Journal of rehabilitation research and
development, 32(1), 25.
152
Wannier, T., Bastiaanse, C., Colombo, G., & Dietz, V. (2001). Arm to leg coordination in
humans during walking, creeping and swimming activities. Experimental brain research,
141(3).
Whelan, P., Hiebert, G., & Pearson, K. (1995). Stimulation of the group I extensor afferents
prolongs the stance phase in walking cats. Experimental brain research, 103(1), 20-30.
Wilson, D. R., Mattlage, A. E., Seier, N. M., Todd, J. D., Price, B. G., Kwapiszeski, S. J.,
Vardey, R., Billinger, S. A. (2017). Recumbent Stepper Submaximal Test response is
reliable in adults with and without stroke.
Yang, Y. R., Yen, J. G., Wang, R. Y., Yen, L. L., & Lieu, F. K. (2005). Gait outcomes after
additional backward walking training in patients with stroke: a randomized controlled
trial. Clinical rehabilitation, 19(3), 264-273.
Yavuzer, G., Eser, F., Karakus, D., Karaoglan, B., & Stam, H. J. (2006). The effects of balance
training on gait late after stroke: a randomized controlled trial. Clinical
rehabilitation, 20(11), 960-969.
Zehr, E. P., Balter, J. E., Ferris, D. P., Hundza, S. R., Loadman, P. M., & Stoloff, R. H. (2007).
Neural regulation of rhythmic arm and leg movement is conserved across human
locomotor tasks. The Journal of Physiology, 582(1), 209-227.

153
ABSTRACT
THE EFFECT OF TREADMILL VS. NUSTEP RECUMBENT CROSS TRAINER ON
GAIT AND LOWER EXTREMITY ELECTROMYOGRAPHY AFTER CHRONIC
STROKE
by
NICHOLAS J. SIEKIRK
August 2018
Advisor: Dr. Qin Lai
Major: Kinesiology
Degree: Doctor of Philosophy
Pilot Part 1: The purpose was to investigate the effect of a perceived exertion based
cadence on lower extremity muscle activation, as measured by surface electromyography (EMG)
on a recumbent cross trainer. The purpose of this investigation was to study the EMG activity of
12 lower extremity muscles during five different stepping protocols; perceived exertion based
self-selected (SS) cadence with level 1 resistance (SSL1), SS cadence with level 8 resistance
(SSL8), +20% SS cadence (SS+20), -20% SS cadence (SS-20), and at a set 80 steps per minute
at resistance level 1 (80L1). In order to determine SS cadence each participant performed 10
minutes (min) pretest of stepping with a rate of perceived exertion of 12 to16. Participants then
performed all five protocols in randomized order with 5 mins of rest between each protocol. Both
mean (mEMG) and peak (pEMG) normalized amplitudes were recorded from the rectus femoris
(RF), vastus medialis oblique (VMO), semitendinosus (ST), tibialis anterior (TA), medial
gastrocnemius (MG) and soleus (SOL) bilaterally. Healthy participant’s (n = 22, aged 23.52 ±
4.23 years) SS cadence was 123.86±18.12 steps/min. SSL8 and SS+20 produced the highest
mEMG and pEMG in all muscle groups (p<.05). Generally, SSL1, SS-20 and 80L1 did not

154
differentially activate muscles based on mEMG and pEMG. The present findings indicated that
increased resistance (SSL8) and increased step cadence (SS+20) resulted in the greatest
activation of lower extremity muscles during recumbent stepping.
Pilot Part 2: Muscle recruitment becomes more efficient as a result of task-specific
training. Although the muscle activity of recumbent stepping has been studied previously, it
remains unclear if an individual alters recruitment as they acclimate to the stepping motion. The
purpose of this study was to measure the change in EMG activity between minute (min) 2 and
min 4 of a 5 min stepping bout. EMG was measured bilaterally at 6 separate lower extremity
muscles during five different stepping protocols (self-selected level 1 [SSL1], self-selected level
8 [SSL8], +20% self-selected [SS+20], -20% self-selected [SS-20], and 80 steps per min
resistance level 1 [80SL1]). 22 healthy male and female adults (aged = 23.52 ± 4.23 years)
signed an informed consent prior to the study. Self-selected cadence was established during 10
mins of stepping with a RPE between 12 and 16. Participants then performed all 5-min protocols
in randomized order with 5 min of rest between each. Due to parametric violations, mean EMG
(mEMG) and peak EMG (pEMG) were analyzed with non-parametric tests. A 1 x 4 Friedman
test was conducted to determine statistical significant difference in mEMG and pEMG between
min 2 and min 4 of stepping in each muscle. Following a statistically significant Friedman test
(p<.05), a post hoc Wilcoxon Signed Rank test (WSRT) was conducted. Participants' self-
selected cadence was 126.80 ± 17.87 steps/min. WSRT showed a significant reduction in mEMG
activation at min 4 in 5 muscles (rectus femoris [RF], vastus medialis oblique [VMO],
semitendinosus [ST], tibialis anterior [TA]) at 80SL1, VMO at SS+20% and RF and VMO at SS-
20, (p<.01). WSRT showed a significant reduction in pEMG activation of VMO at min 4 in all
protocols, but higher pEMG at min 4 in ST in SSL1 and SSL8, soleus in SSL1 and TA in SS+20.

155
Results indicate a higher level of learning, as measured by the reduction of mEMG during min 4
at protocols below the subject’s self-selected pace. At a significantly lower cadence, it is
presumed that a new motor pattern was acquired to adapt to the stepping demands.
NuStep Cross Trainer vs. Treadmill: The NuStep Recumbent Cross Trainer relies on
similar neural networks as gait. Therefore, neurologically impaired individuals may improve
walking ability after exercise on the NuStep. The purpose of this investigation was to measure
the effect of two exercise mode (NuStep Recumbent Cross Trainer vs. Treadmill) on intra-
exercise muscle activity (as measured by mean electromyography) and post exercise spatial and
temporal gait parameters during a 3 x 10m hallway walk. 34 participants were divided into two
groups; chronic stroke (10 ± 5 years post cerebral vascular accident) and an age and sex matched
control. In order to determine SS cadence each participant performed 10 minutes (min) pretest of
stepping with a rate of perceived exertion (RPE) of 12 to16. Participants then performed two 5
minute exercise bouts on each mode. Mean electromyography (mEMG) values were normalized
to maximum voluntary contraction and were recorded from the rectus femoris (RF), vastus
medialis oblique (VMO), semitendinosus (ST), tibialis anterior (TA), medial gastrocnemius
(MG) and soleus (SOL) bilaterally. Stroke (n = 15) and healthy (n = 19) did not differ in age
(Mdn: 66 vs. 57, respectively) or BMI (Stroke: M = 27.02, SD = 4.57 vs. Healthy: M = 26.46, SD
= 4.63), p<.05. Healthy participants were stronger at all joints, p<.025. Goniometer data was
measured at the hip, knee and ankle. Range of motion change (∆ROM) was calculated
(maximum-minimum degree; ∆ROM). There was no statistical differences between the TM and
NS in ∆ROM. The TM elicited a higher mEMG on a majority of the observed muscles. The
NuStep Cross Trainer immediately improved gait parameters (i.e. decreased stance % and
increased swing %) on the non-affected leg following a 5-minute stepping protocol.

156
AUTOBIOGRAPHICAL STATEMENT
Nicholas (Nick) J. Siekirk completed his Ph.D. at Wayne State University (Detroit, MI,
USA) under the direction of Dr. Qin Lai (Texas A&M University) as part of the Motor Behavior
Lab in the Division of Kinesiology Healthy and Sports Sciences. Nick was awarded the
prestigious Rumble Fellowship from the College of Education in 2014. Nick later taught
coursework in motor behavior, biomechanics and anatomy/physiology. During his tenure, he
had the privileged opportunity to become a Research Assistant in the Neurotech Laboratory
(Physical Therapy Program, Eugene Applebaum College of Pharmacy and Health Sciences)
under Drs. Sujay Galen (University of Strathclyde, Glasgow, UK) and Victoria Pardo
(University of Indianapolis). Furthermore, in 2012, Nick received his Masters of Science in
Exercise Science from Oakland University (Rochester, MI, USA) under Drs. Brian Goslin
(University of Cape Town, South Africa), Tamara Hew-Butler (University of Cape Town in
South Africa) and Charles Marks (University of Michigan). As an undergraduate Nick attended
Adrian College (Adrian, MI, USA) under Dr. Adam Coughlin (Michigan State University) and
completed his Bachelors of Arts in Exercise Science in 2010. Nick was hired as an Assistant
Professor at Georgia Southern University (Statesboro, GA, USA) in 2018.