the effect of time of day on driver's injury severity at
TRANSCRIPT

ww.sciencedirect.com
j o u rn a l o f t r a ffi c a nd t r an s p o r t a t i o n e n g i n e e r i n g ( e n g l i s h e d i t i o n ) 2 0 1 6 ; 3 ( 1 ) : 3 7e5 0
brought to you by COREView metadata, citation and similar papers at core.ac.uk
provided by Elsevier - Publisher Connector
Available online at w
ScienceDirect
journal homepage: www.elsevier .com/locate/ j t te
Original Research Paper
The effect of time of day on driver's injuryseverity at highway-rail grade crossings inthe United States
Wei Hao a,*, Camille Kamga b, Dan Wan b
a Department of Civil and Environmental Engineering, New Jersey Institute of Technology, University Heights
Newark, NJ 07102, USAb University Transportation Research Center, City College of New York, New York, NY 10031, USA
a r t i c l e i n f o
Article history:
Received 29 January 2015
Received in revised form
21 October 2015
Accepted 26 October 2015
Available online 14 January 2016
Keywords:
Injury severity
Time of day
Highway-rail grade crossing
Ordered probit model
* Corresponding author. Tel.: þ1 201 881 619E-mail address: [email protected] (W. Hao).
Peer review under responsibility of Periodichttp://dx.doi.org/10.1016/j.jtte.2015.10.0062095-7564/© 2016 Periodical Offices of Changaccess article under the CC BY-NC-ND licen
a b s t r a c t
Based on the Federal Railway Administration (FRA) database, there were totally 25,945
highway-rail crossing crashes happened in the United States between 2002 and 2011. With
an extensive research, analysis results showed that there were substantial differences by
time of day for driver's injury severity at highway-rail grade crossings. However, there is no
published study on time of day analysis of driver's injury given that a highway-rail grade
crossing crash happens. This study applied ordered probit models to explore the de-
terminants of injury severity for motor vehicle drivers at highway-rail grade crossings. The
results show that motor vehicle driver's injury severity in highway-rail grade crossing
crashes that happen during a.m. peak, p.m. peak, and p.m. off-peak is extremely higher
than other time periods. However, speed control will significantly reduce driver's injury
severity. In addition, crashes that happen during early morning, a.m. peak, and p.m. peak
are more likely to be influenced by vehicle speed and train speed compared with other time
periods. Paved highways will significantly help to reduce driver's injury severity at high-
way-rail grade crossings. Drivers during peak hours, early morning and p.m. off-peak are
more likely to be influenced by unpaved roadway compared with other time periods.
© 2016 Periodical Offices of Chang'an University. Production and hosting by Elsevier B.V. on
behalf of Owner. This is an open access article under the CC BY-NC-ND license (http://
creativecommons.org/licenses/by-nc-nd/4.0/).
1. Introduction
Vehicle-train crash collisions are the most dangerous traffic
crashes at highway-rail grade crossings because the average
weight ratio of a train to a motor vehicle is about 1e4000
(Yan et al., 2010). Based on the Federal Railway Administration
2; fax: þ1 212 650 8374.
al Offices of Chang'an Un
'an University. Productionse (http://creativecommo
(FRA) database, there were 25,945 highway-rail crossing
crashes in the United States between 2002 and 2011.
Although the annual average collision rate for highway-rail
grade crossings is relatively lower compared with highway
crossings, these highway-rail crossing collisions result in
higher fatality rates making the study of them critically
important.
iversity.
and hosting by Elsevier B.V. on behalf of Owner. This is an openns.org/licenses/by-nc-nd/4.0/).
j o u r n a l o f t r a ffi c and t r an s p o r t a t i o n e n g i n e e r i n g ( e n g l i s h e d i t i o n ) 2 0 1 6 ; 3 ( 1 ) : 3 7e5 038
There are approximately 25,945 highway-rail grade cross-
ings in the United States. Among these crossings, approxi-
mately 39 percent are privately owned and the other 61
percent are publicly owned. Although the number of collisions
at highway-rail grade crossings has bean reduced, it is still
high and needs to be further reduced.
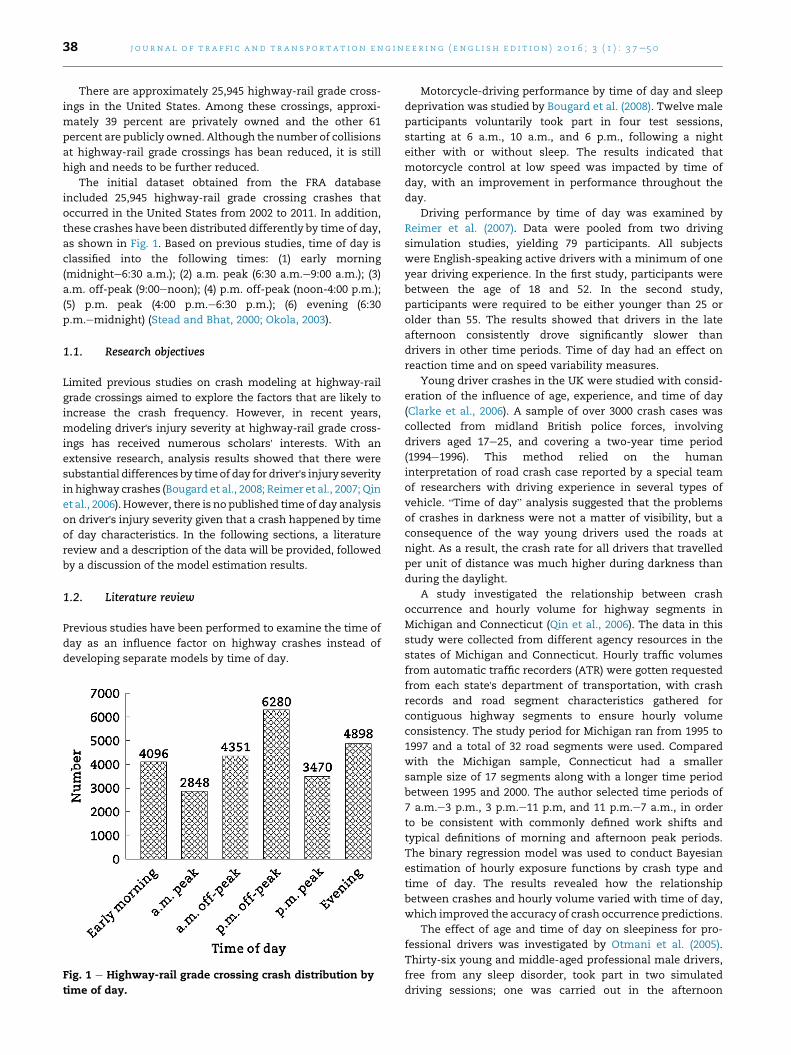
The initial dataset obtained from the FRA database
included 25,945 highway-rail grade crossing crashes that
occurred in the United States from 2002 to 2011. In addition,
these crashes have been distributed differently by time of day,
as shown in Fig. 1. Based on previous studies, time of day is
classified into the following times: (1) early morning
(midnighte6:30 a.m.); (2) a.m. peak (6:30 a.m.e9:00 a.m.); (3)
a.m. off-peak (9:00enoon); (4) p.m. off-peak (noon-4:00 p.m.);
(5) p.m. peak (4:00 p.m.e6:30 p.m.); (6) evening (6:30
p.m.emidnight) (Stead and Bhat, 2000; Okola, 2003).
1.1. Research objectives
Limited previous studies on crash modeling at highway-rail
grade crossings aimed to explore the factors that are likely to
increase the crash frequency. However, in recent years,
modeling driver's injury severity at highway-rail grade cross-
ings has received numerous scholars' interests. With an
extensive research, analysis results showed that there were
substantial differences by timeof day for driver's injury severityin highway crashes (Bougard et al., 2008; Reimer et al., 2007; Qin
et al., 2006). However, there is no published time of day analysis
on driver's injury severity given that a crash happened by time
of day characteristics. In the following sections, a literature
review and a description of the data will be provided, followed
by a discussion of the model estimation results.
1.2. Literature review
Previous studies have been performed to examine the time of
day as an influence factor on highway crashes instead of
developing separate models by time of day.
Fig. 1 e Highway-rail grade crossing crash distribution by
time of day.
Motorcycle-driving performance by time of day and sleep
deprivation was studied by Bougard et al. (2008). Twelve male
participants voluntarily took part in four test sessions,
starting at 6 a.m., 10 a.m., and 6 p.m., following a night
either with or without sleep. The results indicated that
motorcycle control at low speed was impacted by time of
day, with an improvement in performance throughout the
day.
Driving performance by time of day was examined by
Reimer et al. (2007). Data were pooled from two driving
simulation studies, yielding 79 participants. All subjects
were English-speaking active drivers with a minimum of one
year driving experience. In the first study, participants were
between the age of 18 and 52. In the second study,
participants were required to be either younger than 25 or
older than 55. The results showed that drivers in the late
afternoon consistently drove significantly slower than
drivers in other time periods. Time of day had an effect on
reaction time and on speed variability measures.
Young driver crashes in the UK were studied with consid-
eration of the influence of age, experience, and time of day
(Clarke et al., 2006). A sample of over 3000 crash cases was
collected from midland British police forces, involving
drivers aged 17e25, and covering a two-year time period
(1994e1996). This method relied on the human
interpretation of road crash case reported by a special team
of researchers with driving experience in several types of
vehicle. “Time of day” analysis suggested that the problems
of crashes in darkness were not a matter of visibility, but a
consequence of the way young drivers used the roads at
night. As a result, the crash rate for all drivers that travelled
per unit of distance was much higher during darkness than
during the daylight.
A study investigated the relationship between crash
occurrence and hourly volume for highway segments in
Michigan and Connecticut (Qin et al., 2006). The data in this
study were collected from different agency resources in the
states of Michigan and Connecticut. Hourly traffic volumes
from automatic traffic recorders (ATR) were gotten requested
from each state's department of transportation, with crash
records and road segment characteristics gathered for
contiguous highway segments to ensure hourly volume
consistency. The study period for Michigan ran from 1995 to
1997 and a total of 32 road segments were used. Compared
with the Michigan sample, Connecticut had a smaller
sample size of 17 segments along with a longer time period
between 1995 and 2000. The author selected time periods of
7 a.m.e3 p.m., 3 p.m.e11 p.m, and 11 p.m.e7 a.m., in order
to be consistent with commonly defined work shifts and
typical definitions of morning and afternoon peak periods.
The binary regression model was used to conduct Bayesian
estimation of hourly exposure functions by crash type and
time of day. The results revealed how the relationship
between crashes and hourly volume varied with time of day,
which improved the accuracy of crash occurrence predictions.
The effect of age and time of day on sleepiness for pro-
fessional drivers was investigated by Otmani et al. (2005).
Thirty-six young and middle-aged professional male drivers,
free from any sleep disorder, took part in two simulated
driving sessions; one was carried out in the afternoon

j o u rn a l o f t r a ffi c a nd t r an s p o r t a t i o n e n g i n e e r i n g ( e n g l i s h e d i t i o n ) 2 0 1 6 ; 3 ( 1 ) : 3 7e5 0 39
(between 2 p.m. and 4 p.m.) and the other was carried out in
the evening (between 11 p.m. and 1 a.m.). All the data were
analyzed by ANOVA, a statistical program. Data obtained on
visual analog scales (alertness and sleeping level) that were
recorded before and after the driving task were analyzed
with consideration of driver's age, traffic condition, time of
day, and reaction time. Young professional drivers were
found to be more susceptible to sleepiness and were more
often involved in sleep-related crashes. Besides, they were
more likely to present a strong decrease in their alertness
level than middle-aged drivers while driving. The effect of
time of day was clearly observed as many differences
appeared between afternoon and evening session.
Driving performance was different by time of day (Lenne
et al., 1997). Numerous factors contributed to the 24 h
pattern of automobile crashes. In this study, 11 male
subjects operated a driving simulator for 30 min at six
times of day. Driving performance was measured in terms
of the mean and standard deviation of lateral position and
speed. This study indicated that driving performance and
reaction time were affected by time of day. Driving
performance was more likely to be impaired at 200 h and
600 h, and improved between 1000 h and 2200 h without an
early afternoon dip. The significance of the early afternoon
period and associated dips in driving performance was also
highlighted.
Based on the abovementioned studies since 1990s, there is
clear evidence documenting a difference in crash occurrence
during different times of day. Although a few researches have
investigated whether driver's performance is affected by time
of day for highway crashes, no research is found to study
whether driver's injury severity is influenced by time of day at
highway-rail grade crossing crashes. In addition to the impact
of time of day, this research will investigate the impact of
highway characteristics, vehicle attributes, environmental
factors, and land use factors on driver's injury severity at
highway-rail grade crossings. The results can provide some
additional insights into this problem and suggest some ways
to improve highway-rail grade crossing safety for drivers in
different travel time periods.
2. Materials and methods
As demonstrated in previous studies, driver's injury level is
quite different in different time periods. Previous studies are
limited in studying the entire day period. This study attempts
to develop ordered probit models for different times of day
and explore the effect of time of day on drivers' injury severity
at highway-rail grade crossings. In addition, its objective is to
identify differences in driver's injury severity in different time
periods. To do this, separate models are estimated for drivers
in each time period. In the following sections, the data
collection, ordered probit model and statistical tests will be
described.
2.1. Data collection
In this study, the original dataset, which was obtained from
the FRA database, included 25,945 highway-rail grade crossing
crashes that occurred in the United States from 2002 to 2011.
Table 1 shows the frequency and percentage distribution of
the variables in each of six time periods. FRA database
includes both current and historical records of 80 � 103 to
100 � 103 crossings and is updated per year. In addition, it is
classified into three sub-databases including the highway-
rail grade crossing inventory, the highway-rail crossing
history file and the highway-rail crossing crash data. These
sub-databases, which are described below, are linked to
each other by a common crossing ID number.
The highway-rail grade crossing inventory collects current
crossing inventory which reflects the current state of each
crossing with reference attributes. This database was used in
this study to identify independent factors that reflect
crossing-related attributes and train/vehicle traffic patterns.
In the database of highway rail crossing history file, four types
of information were obtained for each crash at highway-rail
grade crossings: the warning device type, area type, annual
average daily traffic (AADT), and percentage of trucks. Six
types of factors in our final sample database are sourced from
highway-rail crossing crash data including: time factors
(month, hour, and a.m. & p.m.), vehicle information (vehicle
speed and vehicle type), train information (train speed),
weather information (visibility and weather condition), and
driver's information (age, gender, and injury level). The se-
lection of independent variables was based on previous
studies (Kockelman and Kweon, 2002;Morgan andMannering,
2011; Pai and Saleh, 2007; Zhang et al., 2011). The overall
process of creating the sample database used for model esti-
mations involved the following two steps: (1) highway-rail
grade crossing data were extracted from the FRA database; (2)
key variables obtained from the database were reclassified.
2.2. Ordered probit model
The methodology undertaken in this study includes devel-
oping, estimating, and analyzing statistical models that pre-
dict the probability of injury severity outcomes. A variety of
methodological techniques have been applied to analyze
crash injury severity data. Besides, three discrete driver-injury
severity outcomes are considered: property damaged only
(PDO), injury, and fatality. To analyze these types of discrete
outcome data, researchers have used a variety of methodo-
logical approaches including multinomial logit models, or-
dered probit models, latent class models, nested logit models,
and mixed (random parameters) logit models. A complete
review of crash injury severity models and methodological
approaches can be found by Savolainen et al. (2011). Statistical
models such as ordered probit models are widely used to fit
the ordinal structure of crash severity (Kockelman and
Kweon, 2002; Lee and Abdel-Aty, 2005; Siddiqui et al., 2006;
Zhang et al., 2011). The following subsections describe the
ordered probit approach, and its general specification is
given by Zhang et al. (2011).
y*i ¼ Xibþ 3i (1)
where Xi is a vector of observed non-random explanatory
variables measuring the attributes of crash victim i, b is a
vector of unknown parameters, and 3i is a random error term

Table 1 e Variables description.
Description Early morning a.m. peak a.m. off-peak p.m. off-peak p.m. peak Evening
Frequency Percentage(%)
Frequency Percentage(%)
Frequency Percentage(%)
Frequency Percentage(%)
Frequency Percentage(%)
Frequency Percentage(%)
Driver 0 ¼ PDO 2866 74.10 1806 65.79 2845 67.27 4050 66.88 2199 66.68 3355 73.61
1 ¼ Injured 755 19.52 688 25.06 1037 24.52 1487 24.55 824 24.98 908 19.92
2 ¼ Killed 247 6.39 251 9.14 347 8.21 519 8.57 275 8.34 295 6.47
Vehicle
speed
0 (More than 50 mph) 127 3.41 46 1.73 107 2.63 127 2.18 65 2.04 103 2.33
1 (Less than 50 mph) 3601 96.59 2608 98.27 3967 97.37 5703 97.82 3118 97.96 4323 97.67
Visibility 1 (Dawn) 261 6.37 287 10.08 30 0.69 39 0.62 24 0.69 46 0.94
2 (Dusk) 25 0.61 24 0.84 24 0.55 68 1.08 377 10.86 325 6.64
3 (Dark) 3256 79.49 245 8.60 252 5.79 394 6.27 596 17.18 3467 70.78
4 (Day) 554 13.53 2292 80.48 4045 92.97 5779 92.02 2473 71.27 1060 21.64
Weather 1 (Cloudy) 842 20.56 552 19.38 895 20.57 1269 20.21 677 19.51 917 18.72
2 (Rain) 388 9.47 173 6.07 235 5.40 315 5.02 173 4.99 404 8.25
3 (Fog) 152 3.71 85 2.98 38 0.87 26 0.41 17 0.49 63 1.29
4 (Sleet) 20 0.49 8 0.28 10 0.23 16 0.25 2 0.06 12 0.24
5 (Snow) 113 2.76 71 2.49 116 2.67 140 2.23 71 2.05 157 3.21
6 (Clear) 2581 63.01 1959 68.79 3057 70.26 4514 71.88 2530 72.91 3345 68.29
Train speed 0 (More than 50 mph) 531 13.74 486 17.24 625 14.49 830 13.34 573 16.70 694 14.76
1 (Less than 50 mph) 3335 86.26 2333 82.76 3689 85.51 5394 86.66 2859 83.30 4009 85.24
Vehicle type 1 (Truck) 441 13.09 970 34.59 1492 37.05 1367 33.42 1031 26.27 735 14.76
2 (Pick-up truck) 518 15.38 494 17.62 706 17.53 750 18.34 768 19.57 915 18.37
3 (Van) 159 4.72 108 3.85 183 4.54 194 4.74 193 4.92 232 4.66
4 (Bus) 6 0.18 6 0.21 3 0.07 6 0.15 11 0.28 8 0.16
5 (Motorcycle) 14 0.42 4 0.14 14 0.35 13 0.32 15 0.38 24 0.48
6 (Auto) 2230 66.21 1222 43.58 1629 40.45 1760 43.03 1907 48.59 3067 61.57
Control
device
0 (Active control) 2956 72.68 1683 59.58 2338 54.35 3449 55.48 2089 60.73 3257 66.88
1 (Passive control) 1111 27.32 1142 40.42 1964 45.65 2768 44.52 1351 39.27 1613 33.12
Driver's age 1 (Less than 25) 1073 31.16 592 23.27 639 16.57 891 16.78 532 18.63 726 19.52
2 (25e29) 502 14.58 274 10.77 349 9.05 427 8.04 227 7.95 353 9.49
3 (30e49) 1375 39.92 1025 40.29 1565 40.58 2094 39.44 1130 39.57 1492 40.12
4 (50e69) 424 12.31 507 19.93 891 23.10 1343 25.29 719 25.18 875 23.53
5 (70 and above) 70 2.03 146 5.74 413 10.71 555 10.45 248 8.68 273 7.34
Gender 0 (Male) 2948 76.93 2071 72.50 4085 76.60 4639 76.64 2483 74.83 3310 73.62
1 (Female) 884 23.07 711 27.30 1232 23.10 1414 23.36 835 25.17 1186 26.38
Area type 0 (Open space) 2552 24.20 2552 74.44 3314 78.14 1711 31.18 914 29.47 1115 24.87
1 (Other areas) 7995 75.80 7995 25.56 927 21.86 3777 68.82 2187 70.53 3369 75.13
Roadway
pavement
0 (Non-paved) 371 9.91 431 17.23 693 18.55 981 17.83 484 15.58 487 10.84
1 (Paved) 3374 90.09 2070 82.77 3043 81.45 4521 82.17 2623 84.42 4004 89.16
AADT 0 (More than 10,000) 690 18.63 326 13.25 438 11.93 690 12.78 467 15.21 731 16.48
1 (Less than 10,000) 3014 81.37 2134 86.75 3232 88.07 4709 87.22 2603 84.79 3704 83.52
journaloftraffic
and
transportatio
nengin
eerin
g(e
nglis
hedit
ion)2016;3
(1):
37e50
40

j o u rn a l o f t r a ffi c a nd t r an s p o r t a t i o n e n g i n e e r i n g ( e n g l i s h e d i t i o n ) 2 0 1 6 ; 3 ( 1 ) : 3 7e5 0 41
with zero mean and unit variance for the ordered probit
model. In addition, the error terms for different outcomes are
assumed to be uncorrelated.
The dependent variable in this study, Y, is coded as 1, 2,/,
J, and is defined in Eq. (2):
Y ¼8<:
1 �∞ � y*i < t1
j tj�1 � y*i < tj
J tJ�1 � ∞(2)
where J is the number of driver injury levels, tj is the threshold
value to be estimated for each level. The ordered probit model
in Eq. (3) provides the probabilities of y*i taking on each of
values (j ¼ 1, /, J).
P�y*i ¼ 1
� ¼ Fðt1 � XibÞP�y*i ¼ j
� ¼ F�tj � Xib
�� F�tj�1 � Xib
�P�y*i ¼ J
� ¼ 1� FðtJ�1 � XibÞ
9=; (3)
where Ф($) is the cumulative probability function of a normal
distribution, Pðy*i ¼ jÞ is the probability of response variable
taking a specific severity level j. In our case, yi is chosen as the
injury severity, which is grouped into three categories
including no-injury, injury, and death.
The parameters of the ordered probit model are estimated
using a maximum likelihood estimation method which in-
volves the systematic evaluation of the function at different
points to find the point at which the function can be maxi-
mized. The log likelihood function in Eq. (4) is the sum of the
individual log probabilities (L).
L ¼Xn
i¼1
X3
j¼1
log�F�tj � Xib
�� F�tj�1 � Xib
��(4)
Marginal effects are estimated in the ordered probit model
to get the impacts of variables on the probability of each injury
severity level (Zhang et al., 2011). For continuous variables, the
marginal effect of a variable on injury severity can be
determined by Eq. (5).
PðY ¼ iÞ=vX ¼ ½fðmi�1 � bXÞ � fðmi � bXÞ�b (5)
where f($) is the standard normal density, X is continuous
variable, m is the threshold value to be estimated for each
level.
For binary variables, the marginal effect of a variable on
injury severity can be determined by Eq. (6) and the outcome
when the variable is equal to one is compared with that
when the variable is zero, while all other variables remain
constant.
DðY ¼ i=xnÞ ¼ PrðY ¼ i=xn ¼ 1Þ � PrðY ¼ i=xn ¼ 0Þ (6)
where xn is binary variable, D($) is the marginal effect of a
variable on injury severity for binary variable.
2.3. Statistical tests
To determinewhether significant differences existed between
parameter estimates in different time periods, likelihood ratio
tests were performed as was done in previous studies (Islam
and Mannering, 2006; Morgan and Mannering, 2011). LL(bT)
estimates a model on all data (all time period groups being
tested) and thenPGLLðbgÞ estimates separate models for each
individual time period group. The six time periods being
tested include: 1) early morning; 2) a.m. peak; 3) a.m. off-peak;
4) p.m. off-peak; 5) p.m. peak; 6) evening. The test statistic is as
below
X2 ¼ �2
"LLðbTÞ �
XG
LL�bg
�#(7)
where LL(bT) is the model's log-likelihood at convergence of
the model estimate using data for the entire day, LL(bg) is the
log-likelihood at convergence of the model estimate using
data for time period group, and g and G is the set of all time
period groups. This statistic X2 is c2, which is distributed with
degrees of freedom and equal to the summation of estimated
coefficients in the subset-data models minus the number of
estimated coefficients in the total-data models.
The second version of the test is used to compare two in-
dividual time period groups. The test statistic is as follow
X2 ¼ �2½LLðbABÞ � LLðbBÞ� (8)
where LL(bAB) is the model log-likelihood using group B's data
and group A's estimated coefficients (the coefficients at
convergence of a model estimate on group A's data), LL(bB) is
the log-likelihood at convergence using group B's data and
group B's converged coefficients. This also can be reversed so
that group A's data is used with group B's estimated co-
efficients. In this test, the statistic is again c2, which is
distributed with degrees of freedom and equal to the number
of estimated coefficients.
3. Results
As described in the previous section, a likelihood ratio test is
performed to determine whether significant differences
existed between parameter estimates in six time periods
including: 1) early morning; 2) a.m. peak; 3) a.m. off-peak; 4)
p.m. off-peak; 5) p.m. peak; 6) evening. For differences be-
tween time periods, all tests indicate that the hypothesis that
time-of-day models are equal and can be rejected with over
99.5% confidence. These tests include comparing combined
time-of-daymodels with separate time-of-daymodels (Eq. (7))
and comparing two individual time-of-day models (Eq. (8)).
The combination of these two tests yields an excellent
assessment of the statistical differences between different
time periods. Therefore, separate time-of-day models are
developed.
3.1. Model estimation results
Based on the statistical tests above, six ordered probit models
are estimated using the Limdep software package to analyze
the injury levels for drivers involved in highway-rail grade
crossing crashes in six time periods. These models examine
the effects of explanatory variables on the dependent variable,
which is driver injury level. A positive sign for an estimated
parameter implies a higher probability of injury severity for
highway vehicle drivers as the value of the explanatory vari-
able increases. The significance of the independent variables

j o u r n a l o f t r a ffi c and t r an s p o r t a t i o n e n g i n e e r i n g ( e n g l i s h e d i t i o n ) 2 0 1 6 ; 3 ( 1 ) : 3 7e5 042
with a p-value <0.05 is also provided. Detailed model estima-
tion results are presented in Tables 2e7.
As estimated using the ordered probit model, the increase
in both highway vehicle speed and train speed will signifi-
cantly increase the level of injury severity given that crashes
happen, especially for crashes during the early morning
period. This can be seen in Table 2 which shows the estimates
for the early morning period. The estimated coefficients are
0.782 for vehicle speed and 0.792 for train speed, which are
larger than the coefficients in other time periods. Bad
weather conditions (snow, rain, and sleet) and bad visibility
(dark and dusk) can deadly cause high injury severity level
especially during the a.m. peak and p.m. peak. Drivers are
more likely to have high level injury severity in an open
Table 2 e Model results for early morning.
Variable description Parameter estimate p-
Vehicle speed
Veh. Spd > 50 mph 0.782
Veh. Spd < 50 mph e
Visibility
Dawn 0.239
Dusk 0.298
Dark 0.571
Day e
Weather condition
Cloudy 0.087
Rain 0.124
Fog 0.207
Sleet 0.351
Snow 0.123
Clear e
Train speed
Train Spd > 50 mph 0.792
Train Spd < 50 mph e
Vehicle type
Truck �0.032
Pick-up truck 0.265
Van 0.318
Bus 0.421
Motorcycle 0.536
Auto e
Control device
Active control 0.131
Passive control e
Driver's age
Less than 25 0.528
25 to 29 0.292
30 to 49 0.382
50 to 69 0.211
Over 70 e
Area type
Open space 0.019
Other area e
Pavement type
Non-paved 0.045
Paved e
Traffic volume
More than 10,000 0.128
Less than 10,000 e
No. of Obs. 3868
Log likelihood �681
Pseudo R-squared 0.021
p-value 0
space area during the p.m. off-peak, during which the
coefficient estimate is 0.081, higher than other time periods.
High level injury severity crashes are more likely to occur on
non-paved roadways, especially during peak hours, which
can be seen in Table 3 where the coefficient estimate is 0.075
for the a.m. peak and Table 6 where the coefficient estimate
is 0.059 for p.m. peak. Regarding the effect of driver's age,
the typical early morning crash drivers are in the age groups
of “less than 25” and “25 to 29”. The coefficient estimates are
0.528 for “less than 25” age group and 0.292 for “25 to 29” age
group which are larger than other age group coefficient
estimates. Typical drivers in peak hour crashes are the age
groups of “25 to 29” and “30 to 49”. During the a.m. peak, the
coefficient estimates are 0.371 for “25 to 29” age group and
value Marginal effect
0.008
0.008 �0.2897 0.1221 0.1676
e e e e
0.026
0.046 �0.0679 0.0401 0.0278
0.528 �0.0735 0.0408 0.0327
0.035 �0.0789 0.0368 0.0421
e e e e
0.021
0.038 �0.0682 0.0253 0.0429
0.016 �0.0501 0.0172 0.0329
0.033 �0.0371 0.0213 0.0158
0.028 �0.0520 0.0351 0.0169
0.037 �0.0457 0.0294 0.0163
e e e e
0.023
0.023 �0.2648 0.1225 0.1423
e e e e
0.029
0.026 0.0070 �0.0050 �0.0020
0.018 �0.0110 0.0090 0.0020
0.029 �0.0030 0.0020 0.0010
0.031 0.0060 �0.0040 �0.0020
0.042 �0.0130 0.0090 0.0040
e e e e
0.002
0.002 �0.0210 0.0150 0.0060
e e e e
0.035
0.021 �0.0250 0.0167 0.0083
0.039 �0.0132 0.0097 0.0035
0.052 �0.0066 0.0013 0.0053
0.219 �0.0160 0.0125 0.0035
e e e e
0.018
0.018 �0.0045 0.0027 0.0018
e e e e
0.021
0.021 �0.0636 0.0316 0.0532
e e e e
0.043
0.043 �0.0546 0.0125 0.0421
e e e e

Table 3 e Model results for a.m. peak.
Variable description Parameter p-value Marginal effect
Vehicle speed 0.044
Veh. Spd > 50 mph 0.609 0.044 �0.2551 0.1026 0.1525
Veh. Spd < 50 mph e e e e e
Visibility 0.029
Dawn 0.226 0.003 �0.0310 0.0180 0.0130
Dusk 0.365 0.036 �0.0130 0.0080 0.0050
Dark 0.852 0.027 �0.0430 0.0120 0.0310
Day e e e e e
Weather condition 0.025
Cloudy 0.352 0.019 �0.0875 0.0312 0.0563
Rain 0.294 0.009 �0.0687 0.0216 0.0471
Fog 0.172 0.027 �0.0145 0.0019 0.0126
Sleet 0.692 0.035 �0.0305 0.0123 0.0182
Snow 0.356 0.028 �0.0475 0.0183 0.0292
Clear e e e e e
Train speed 0.028
Train Spd > 50 mph 0.597 0.028 �0.2333 0.1012 0.1321
Train Spd < 50 mph e e e e e
Vehicle type 0.021
Truck �0.045 0.017 0.0080 �0.0050 �0.0030
Pick-up truck 0.268 0.021 �0.0090 0.0070 0.0020
Van 0.321 0.018 �0.0040 0.0020 0.0020
Bus 0.426 0.025 0.0070 �0.0040 �0.0030
Motorcycle 0.561 0.031 �0.0120 0.0070 0.0050
Auto e e e e e
Control device 0.005
Active control 0.145 0.005 �0.0190 0.0120 0.0070
Passive control e e e e e
Driver's age 0.031
Less than 25 0.421 0.045 �0.0251 0.0067 0.0184
25 to 29 0.371 0.021 �0.0172 0.0037 0.0135
30 to 49 0.081 0.019 �0.0106 0.0013 0.0093
50 to 69 0.133 0.053 �0.0136 0.0127 0.0009
Over 70 e e e e e
Area type 0.003
Open space 0.052 0.003 �0.0149 0.0021 0.0128
Other area e e e e e
Pavement type 0.005
Non-paved 0.075 0.005 �0.0644 0.0213 0.0431
Paved e e e e e
Traffic volume 0.009
More than 10,000 0.463 0.009 �0.0933 0.0212 0.0721
Less than 10,000 e e e e e
No. of Obs. 2745
Log likelihood �721
Pseudo R-squared 0.016
p-value 0
j o u rn a l o f t r a ffi c a nd t r an s p o r t a t i o n e n g i n e e r i n g ( e n g l i s h e d i t i o n ) 2 0 1 6 ; 3 ( 1 ) : 3 7e5 0 43
0.081 for “30 to 49” age group. During the p.m. peak, the
coefficient estimates are 0.317 for “25 to 29” age group and
0.348 for “30 to 49” age group.
3.2. Marginal effects analysis
Marginal effects analysiswas also conducted to directly reflect
the impact of contributing factors on each of the three types of
injury levels which are PDO, injury, and fatality. Themarginal
effects describe the increase or decrease in the probability of
each injury severity level associated with the change of sig-
nificant independent variables. For categorical variables, the
marginal coefficients reflect the change of probability of injury
severity compared with the reference categorical variables
when all other independent variables remain the same. To
keep this study a manageable size and to highlight the
important differences between different time periods, an
analysis of the two variables, vehicle speed and train speed,
having the greatest influence on injury severity level, is
presented.
Compared with the probability of a fatality in a highway-
rail grade crossing crash occurringwhen the train speed is less
than 50 mph, the probability of a fatality in a highway-rail
grade crossing crash at a train speed higher than 50 mph is
14.23% higher in the early morning, 13.21% higher during the
a.m. peak and 10.21% higher during the a.m. off-peak. In other
time periods, the probability of a fatality is also greater when
the train speed exceeds 50 mph than the probability of a
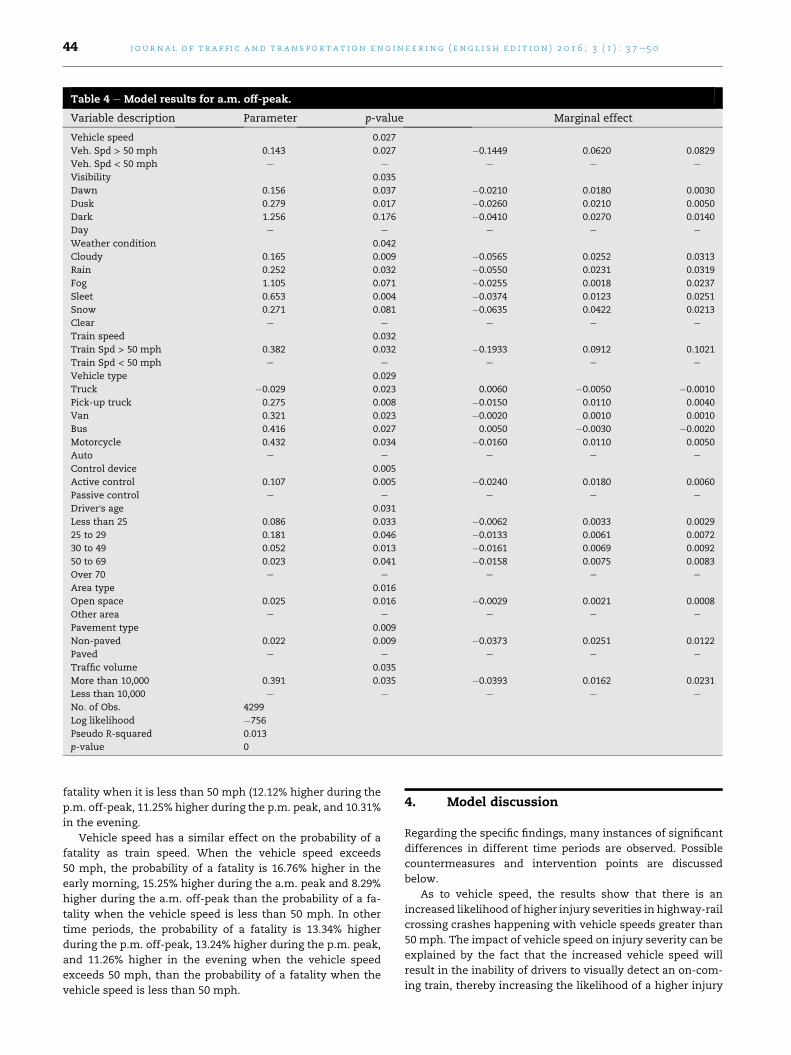
Table 4 e Model results for a.m. off-peak.
Variable description Parameter p-value Marginal effect
Vehicle speed 0.027
Veh. Spd > 50 mph 0.143 0.027 �0.1449 0.0620 0.0829
Veh. Spd < 50 mph e e e e e
Visibility 0.035
Dawn 0.156 0.037 �0.0210 0.0180 0.0030
Dusk 0.279 0.017 �0.0260 0.0210 0.0050
Dark 1.256 0.176 �0.0410 0.0270 0.0140
Day e e e e e
Weather condition 0.042
Cloudy 0.165 0.009 �0.0565 0.0252 0.0313
Rain 0.252 0.032 �0.0550 0.0231 0.0319
Fog 1.105 0.071 �0.0255 0.0018 0.0237
Sleet 0.653 0.004 �0.0374 0.0123 0.0251
Snow 0.271 0.081 �0.0635 0.0422 0.0213
Clear e e e e e
Train speed 0.032
Train Spd > 50 mph 0.382 0.032 �0.1933 0.0912 0.1021
Train Spd < 50 mph e e e e e
Vehicle type 0.029
Truck �0.029 0.023 0.0060 �0.0050 �0.0010
Pick-up truck 0.275 0.008 �0.0150 0.0110 0.0040
Van 0.321 0.023 �0.0020 0.0010 0.0010
Bus 0.416 0.027 0.0050 �0.0030 �0.0020
Motorcycle 0.432 0.034 �0.0160 0.0110 0.0050
Auto e e e e e
Control device 0.005
Active control 0.107 0.005 �0.0240 0.0180 0.0060
Passive control e e e e e
Driver's age 0.031
Less than 25 0.086 0.033 �0.0062 0.0033 0.0029
25 to 29 0.181 0.046 �0.0133 0.0061 0.0072
30 to 49 0.052 0.013 �0.0161 0.0069 0.0092
50 to 69 0.023 0.041 �0.0158 0.0075 0.0083
Over 70 e e e e e
Area type 0.016
Open space 0.025 0.016 �0.0029 0.0021 0.0008
Other area e e e e e
Pavement type 0.009
Non-paved 0.022 0.009 �0.0373 0.0251 0.0122
Paved e e e e e
Traffic volume 0.035
More than 10,000 0.391 0.035 �0.0393 0.0162 0.0231
Less than 10,000 e e e e e
No. of Obs. 4299
Log likelihood �756
Pseudo R-squared 0.013
p-value 0
j o u r n a l o f t r a ffi c and t r an s p o r t a t i o n e n g i n e e r i n g ( e n g l i s h e d i t i o n ) 2 0 1 6 ; 3 ( 1 ) : 3 7e5 044
fatality when it is less than 50 mph (12.12% higher during the
p.m. off-peak, 11.25% higher during the p.m. peak, and 10.31%
in the evening.
Vehicle speed has a similar effect on the probability of a
fatality as train speed. When the vehicle speed exceeds
50 mph, the probability of a fatality is 16.76% higher in the
early morning, 15.25% higher during the a.m. peak and 8.29%
higher during the a.m. off-peak than the probability of a fa-
tality when the vehicle speed is less than 50 mph. In other
time periods, the probability of a fatality is 13.34% higher
during the p.m. off-peak, 13.24% higher during the p.m. peak,
and 11.26% higher in the evening when the vehicle speed
exceeds 50 mph, than the probability of a fatality when the
vehicle speed is less than 50 mph.
4. Model discussion
Regarding the specific findings, many instances of significant
differences in different time periods are observed. Possible
countermeasures and intervention points are discussed
below.
As to vehicle speed, the results show that there is an
increased likelihood of higher injury severities in highway-rail
crossing crashes happening with vehicle speeds greater than
50 mph. The impact of vehicle speed on injury severity can be
explained by the fact that the increased vehicle speed will
result in the inability of drivers to visually detect an on-com-
ing train, thereby increasing the likelihood of a higher injury

Table 5 e Model results for p.m. off-peak.
Variable description Parameter p-value Marginal effect
Vehicle speed 0.032
Veh. Spd > 50 mph 0.312 0.032 �0.2187 0.0853 0.1334
Veh. Spd < 50 mph e e e e e
Visibility 0.035
Dawn 0.259 0.028 �0.0190 0.0150 0.0040
Dusk 1.783 0.037 �0.0330 0.0280 0.0050
Dark 0.918 0.047 �0.0630 0.0350 0.0280
Day e e e e e
Weather condition 0.039
Cloudy 0.288 0.037 �0.0443 0.0125 0.0318
Rain 0.159 0.031 �0.0395 0.0213 0.0182
Fog 0.213 0.042 �0.0365 0.0213 0.0152
Sleet 0.215 0.032 �0.0385 0.0172 0.0213
Snow 0.432 0.015 �0.0535 0.0322 0.0213
Clear e e e e e
Train speed 0.041
Train Spd > 50 mph 0.383 0.041 �0.2083 0.0871 0.1212
Train Spd < 50 mph e e e e e
Vehicle type 0.025
Truck �0.025 0.017 0.0060 �0.0050 �0.0010
Pick-up truck 0.216 0.013 �0.0110 0.0090 0.0020
Van 0.307 0.021 �0.0030 0.0020 0.0010
Bus 0.352 0.023 0.0070 �0.0050 �0.0020
Motorcycle 0.427 0.031 �0.0140 0.0090 0.0050
Auto e e e e e
Control device 0.003
Active control 0.115 0.003 �0.0230 0.0170 0.0060
Passive control e e e e e
Driver's age 0.035
Less than 25 0.082 0.029 �0.0102 0.0015 0.0087
25 to 29 0.171 0.062 �0.0088 0.0031 0.0057
30 to 49 0.076 0.027 �0.0111 0.0019 0.0092
50 to 69 0.031 0.017 �0.0049 0.0028 0.0021
Over 70 e e e e e
Area type 0.029
Open space 0.081 0.029 �0.0036 0.0027 0.0009
Other area e e e e e
Pavement type 0.019
Non-paved 0.031 0.019 �0.0432 0.0281 0.0151
Paved e e e e e
Traffic volume 0.001
More than 10,000 0.293 0.001 �0.0412 0.0284 0.0128
Less than 10,000 e e e e e
No. of Obs. 6056
Log likelihood �827
Pseudo R-squared 0.038
p-value 0
j o u rn a l o f t r a ffi c a nd t r an s p o r t a t i o n e n g i n e e r i n g ( e n g l i s h e d i t i o n ) 2 0 1 6 ; 3 ( 1 ) : 3 7e5 0 45
severity when they collide with a train. For crashes occurring
in the early morning, drivers tend to drive faster and their
reaction times are slower due to lack of enough sleep in this
situation. During the a.m. peak, drivers aremore likely to drive
faster to avoid being late to work. Similarly, during the p.m.
peak, drivers tend to drive faster to get home sooner and they
may be tired andwith slower reaction times after a long day at
work. During the p.m. off-peak, drivers may feel tired with
slower reaction times after lunch. All in all, there is a strong
association between high vehicle speed and higher crash se-
verities (Haleem and Abdel-Aty, 2010; Hao and Daniel, 2014).
Train speed has a similar affection on injury severity. A
higher train speedmeans less reaction times formotor vehicle
drivers. Crashes occurring in the early morning have the
highest injury severity, as shown in Table 2, followed by a.m.
peak, p.m. peak, p.m. off-peak, evening, and a.m. off-peak. In
the early morning, drivers tend to drive faster without
stopping when they go through highway-rail grade crossing
intersections due to the low traffic volume at that time. If
the train speed is higher at this time, motor vehicle drivers
are less likely to detect a train entering the crossing. For
peak hour crashes, drivers are most likely to pass through
highway-rail grade crossing intersections without stopping
due to their hurry to go to work during the a.m. peak or go
home during the p.m. peak. There is an increased likelihood
of higher injury severities in highway-rail crossing crashes
when the train speed is more than 50 mph (Hao and Daniel,
2013; Milton et al., 2008). As a consequence, a reduction in

Table 6 e Model results for p.m. peak.
Variable description Parameter p-value Marginal effect
Vehicle speed 0.022
Veh. Spd > 50 mph 0.521 0.022 �0.1747 0.0423 0.1324
Veh. Spd < 50 mph e e e e e
Visibility 0.038
Dawn 0.321 0.042 �0.0140 0.0130 0.0010
Dusk 0.186 0.031 �0.0220 0.0190 0.0030
Dark 1.112 0.035 �0.0380 0.0210 0.0170
Day e e e e e
Weather condition 0.027
Cloudy 0.505 0.021 �0.0553 0.0126 0.0427
Rain 0.213 0.031 �0.0404 0.0185 0.0219
Fog 0.276 0.025 �0.0261 0.0152 0.0109
Sleet 0.388 0.132 �0.0338 0.0121 0.0217
Snow 0.321 0.009 �0.0433 0.0271 0.0162
Clear e e e e e
Train speed 0.036
Train Spd > 50 mph 0.614 0.036 �0.2101 0.0976 0.1125
Train Spd < 50 mph e e e e e
Vehicle type 0.028
Truck �0.049 0.018 0.0110 �0.0080 �0.0030
Pick-up truck 0.287 0.013 �0.0110 0.0090 0.0020
Van 0.338 0.018 �0.0030 0.0020 0.0010
Bus 0.452 0.025 0.0110 �0.0080 �0.0030
Motorcycle 0.621 0.032 �0.0210 0.0140 0.0070
Auto e e e e e
Control device 0.005
Active control 0.136 0.005 �0.0240 0.0150 0.0090
Passive control e e e e e
Driver's age 0.028
Less than 25 0.217 0.041 �0.0402 0.0181 0.0221
25 to 29 0.317 0.021 �0.0278 0.0216 0.0062
30 to 49 0.348 0.003 �0.0066 0.0013 0.0053
50 to 69 0.058 0.034 �0.0191 0.0077 0.0114
Over 70 e e e e e
Area type 0.033
Open space 0.081 0.033 �0.0048 0.0019 0.0029
Other area e e e e e
Pavement type 0.002
Non-paved 0.059 0.002 �0.0549 0.0152 0.0397
Paved e e e e e
Traffic volume 0.032
More than 10,000 0.391 0.032 �0.1038 0.0381 0.0657
Less than 10,000 e e e e e
No. of Obs. 3298
Log likelihood �931
Pseudo R-squared 0.025
p-value 0
j o u r n a l o f t r a ffi c and t r an s p o r t a t i o n e n g i n e e r i n g ( e n g l i s h e d i t i o n ) 2 0 1 6 ; 3 ( 1 ) : 3 7e5 046
vehicle speed and train speed at highway-rail grade crossings
is a policy that can be particularly effective in moderating
injury severity, as it allows more reaction times for last-
minute maneuvering and braking.
As to the visibility, there is an increased likelihood of higher
injury severities in highway-rail crossing crashes when the
visibility is poor. During the a.m. peak, drivers are 1.3% more
likely to be killed and aremore likely to suffer severe injuries in
a crash at dawn than during the day as shown in Table 3.
During the p.m. peak, drivers are 1.7% more likely to be killed
and are more likely to have severe injuries in a crash
occurring in the dark than during the day. Drivers will sustain
higher severity injuries during evening and early morning as
a result of darkness as well. Bad visibility conditions
influence driver's injury severity while good light conditions
decrease the probability of severe injury (Abdel-Aty et al.,
2011; McCollister and Pflaum, 2007; Zhang et al., 2011).
The modeling results suggest that bad weather conditions
(sleet, snow, fog, rain, and cloudy) are deadly formotor vehicle
drivers. Cloudiness, snow, and rain have a considerable in-
fluence on crashes occurring in the earlymorning and evening,
and fog has a similar influence on crashes occurring during
peak hours (a.m. peak or p.m. peak). In the early morning,
cloudiness snow, and rain increase the probability of a fatality
by 4.29%, 1.69% and 3.29%, respectively. As shown in Table 2,
drivers tend to drive faster (over 50 mph) in the morning
most likely due to the low traffic volumes. In addition, it is
harder for drivers to stop under sleet, snow, and rain

Table 7 e Model results for evening.
Variable description Parameter p-value Marginal effect
Vehicle speed 0.016
Veh. Spd > 50 mph 0.267 0.016 �0.1687 0.0561 0.1126
Veh. Spd < 50 mph e e e e e
Visibility 0.025
Dawn 0.198 0.019 �0.0273 0.0252 0.0021
Dusk 1.123 0.039 �0.0383 0.0251 0.0132
Dark 0.726 0.021 �0.0665 0.0393 0.0272
Day e e e e e
Weather condition 0.028
Cloudy 0.221 0.022 �0.0339 0.0212 0.0127
Rain 0.328 0.031 �0.0455 0.0127 0.0328
Fog 0.305 0.044 �0.0396 0.0233 0.0163
Sleet 0.287 0.031 �0.0636 0.0321 0.0315
Snow 0.399 0.042 �0.0653 0.0392 0.0261
Clear e e e e e
Train speed 0.046
Train Spd > 50 mph 0.478 0.046 �0.1909 0.0878 0.1031
Train Spd < 50 mph e e e e e
Vehicle type 0.023
Truck �0.026 0.018 0.0070 �0.0050 �0.0020
Pick-up truck 0.224 0.015 �0.0090 0.0080 0.0010
Van 0.287 0.021 �0.0030 0.0010 0.0020
Bus 0.356 0.025 0.0060 �0.0050 �0.0010
Motorcycle 0.521 0.035 �0.0160 0.0110 0.0050
Auto e e e e e
Control device 0.006
Active control 0.116 0.006 �0.0230 0.0170 0.0060
Passive control e e e e e
Driver's age 0.029
Less than 25 0.021 0.038 �0.0272 0.0181 0.0091
25 to 29 0.502 0.031 �0.0092 0.0038 0.0054
30 to 49 0.261 0.003 �0.0051 0.0028 0.0023
50 to 69 0.168 0.517 �0.0035 0.0017 0.0018
Over 70 e e e e e
Area type 0.029
Open space 0.043 0.029 �0.0049 0.0041 0.0008
Other area e e e e e
Pavement type 0.032
Non-paved 0.012 0.032 �0.0429 0.0138 0.0291
Paved e e e e e
Traffic volume 0.035
More than 10,000 0.294 0.035 �0.0459 0.0321 0.0138
Less than 10,000 e e e e e
No. of Obs. 4558
Log likelihood �871
Pseudo R-squared 0.015
p-value 0
j o u rn a l o f t r a ffi c a nd t r an s p o r t a t i o n e n g i n e e r i n g ( e n g l i s h e d i t i o n ) 2 0 1 6 ; 3 ( 1 ) : 3 7e5 0 47
conditions due to the lower friction forces when a crash
occurs, which is more likely to result in high level injury
severity. During the peak hours, as shown in Tables 3 and 6,
vehicle speed is higher due to drivers hurry to work during
the a.m. peak and rushing home during the p.m. peak. If fog
occurs during the peak hours, drivers will sustain higher
level injury severities in crashes due to bad visibility. Bad
weather makes roads less skid resistant, resulting in
reducing the drivers' braking and steering capabilities, and
worse collision angles, which lead to more severe injuries
(Kilpelainen and Summala, 2007; Kim et al., 2007). The
limitations in visibility and the ability for drivers to slow or
stop before the rail crossings as a result of bad weather
cause high level injury severity.
Regarding to traffic control device, there is an increased
likelihood of higher injury severity crashes occurring at
highway-rail crossing with passive control. During the a.m.
peak, drivers have a probability of being killed of 0.7% and are
more likely to suffer severe injuries at crossings with passive
controls compared with crossings with active control, as
shown in Table 3. Similarly, during the p.m. peak, drivers have
a probability of being killed of 0.9% and are more likely to
suffer severe injuries at a crossing with passive control
compared with crossings with active control. An explanation
from Pai and Saleh (2007) for this interesting result is that,
while passive control might act as a deterrent to speed,
vehicle drivers might drive more recklessly at passive
control highway-rail grade crossings.

j o u r n a l o f t r a ffi c and t r an s p o r t a t i o n e n g i n e e r i n g ( e n g l i s h e d i t i o n ) 2 0 1 6 ; 3 ( 1 ) : 3 7e5 048
As expected, driver's injury severity by time of day differs
in different age groups. Typically, drivers involved in early
morning crashes are in the “less than 25” and “25 to 29” age
groups and those involved in peak hour crashes are in the “25
to 29” and “30 to 49” age groups. Drivers who sustain severe
injuries in crashes during the a.m. and p.m. off-peaks tend to
be older, while drivers involved in crashes in the evening tend
to be in the “30 to 49” age group. In the early morning, drivers
involved in crashes tend to young people leaving bars or clubs.
The increased probability of being killed in crashes occurring
in this time period may be due to slow reaction times as a
result of sleepiness. Young drivers seem to be more suscep-
tible to sleepiness and more often involved in sleep-related
crashes (Otmani et al., 2005; Raub, 2006). During the peak
hours, they are typically workers in the “25 to 29” and “30 to
49” age groups. Asmentioned above, drivers aremore likely to
drive faster to avoid being late to work in the a.m. peak.
Similarly, during the p.m. peak, they tend to drive faster to get
home sooner and they may be tired after a long day at work
and have slower reaction times.
The results also suggest that the area type is an important
factor on driver's injury severity level. Drivers in open space
areas are more likely to have severe injuries with a probability
of being killed of 0.18% in the early morning, 1.28% during the
a.m. peak and 0.29% during the p.m. peak compared with
other time periods. This can be explained by the fact that, in
the early morning, vehicle drivers may drive more recklessly
through highway-rail grade crossings in open space areas
compared with other areas. During the peak hours, they are
more likely to drive without reducing speed in open space
areas. Open space areas are associated with higher crash
severity levels due to higher speed and lack of medical facil-
ities (Tay et al., 2011; Theofilatos and Yannis, 2014).
The increased probability of being killed in accidents on
non-paved roadways is highest during the peak hours, fol-
lowed by the early morning, the p.m. off-peak, the a.m. off-
peak, and the evening. As mentioned above, drivers tend to
drive faster to work during a.m. peak and get back home
sooner after work. In the early morning, drivers tend to drive
faster due to low traffic volumes. Non-paved roadways have a
lower friction force, therefore drivers needmuchmore time to
stop. As a result, paving unpaved roadways can be particularly
effective in moderating injury severity.
High traffic volumes are strongly associated with “a.m.
peak”, “p.m. off-peak” and “p.m. peak” crashes. High traffic
volumes during peak hours can result in traffic jams, which
make drivers feel anxious and lose their temper. Crashes
occurring during the p.m. off-peakmay to be due to sleepiness
after lunch and slower reaction times. High traffic volumes are
associated with higher crash severity due to anxiety, sleepi-
ness, and lack of patience (Hao and Daniel, 2013; Ulfarsson
and Mannering, 2004).
5. Conclusions
This paper examines the driver's injury severity at highway-
rail grade crossings in different time of day periods. The study
is motivated by the fact that vehicle driver's injury level at
highway-rail grade crossings during the a.m. peak, p.m. peak,
and p.m. off-peak is considerably higher than other time pe-
riods. In addition, there is no published time of day model
analysis of driver's injury level at highway-rail grade cross-
ings. In this study, a model estimation is conducted to eval-
uate the differences in different times of day and the
estimation results for the different models are compared.
From these findings, it can be found that it is inappropriate to
estimate a single model for the entire day. The estimation
results show there are significant differences in different time
periods with regard to how various factors affect injury
severity at highway-rail grade crossings. The findings offer
insights into measures which can be undertaken to reduce
driver's injury level in specific time periods. The conclusions
for six time periods are summarized as below.
(1) Early morning
The typical drivers involved in crashes in the earlymorning
are in the “less than 25” and “25 to 29” age groups. “Sleet” is the
most dangerousweather condition.Motor vehicle drivers tend
to drive faster in the early morning. Therefore, speed control
for both vehicles and trains will significantly reduce driver'sinjury level. In addition, fatal and sever injuries tend to occur
in crashes at highway-rail grade crossings located in open
space areas with non-paved roadways. These conditions tend
to result in lower traffic volumes which may encourage
drivers to drive faster, which means they need more time to
stop.
(2) a.m. peak
The typical drivers involved in crashes during the a.m.
peak are in the “25 to 29” and “30 to 49” age groups. The most
dangerous weather condition is fog. High traffic volumes can
result in traffic jams, which make vehicle drivers anxious and
impatient. Therefore, strict traffic laws that prohibit motor
vehicle drivers from passing through highway-rail grade
crossings without stopping will significantly reduce driver'sinjury severity.
(3) a.m. off-peak
The typical drivers involved in crashes in the a.m. off-peak
are in the “50 to 69” and “70 and above” age groups. Crashes
are associated with physiological factors associated with
advanced age. Human factors represent the cause of high level
injury severity in crashes occurring in this time period. Paving
unpaved roadways will greatly help to reduce driver's injury
level.
(4) p.m. off-peak
p.m. off-peak is a dangerous period for every age group.
Crashes occurring in this time period are mainly caused by
sleepiness after lunch time. Drivers tend to feel tired after
lunch with slower reaction times. Besides, higher driving
speed increases the danger of a crash. Therefore, greater
speed control for motor vehicle and education to help them
realize the danger of crashes in this time period will signifi-
cantly reduce driver's injury level.

j o u rn a l o f t r a ffi c a nd t r an s p o r t a t i o n e n g i n e e r i n g ( e n g l i s h e d i t i o n ) 2 0 1 6 ; 3 ( 1 ) : 3 7e5 0 49
(5) p.m. peak
The crash characteristics during the p.m. peak are similar
to those during the a.m. peak. The typical drivers involved in
crashes in the p.m. peak are in the “25 to 29” and “30 to 49” age
groups. Human factors are often causes of crashes. Drivers
tend to feel tired and have slower reaction times after a long
day at work. The high traffic volumes during this period tend
to make them feel anxious and impatient which increases the
level of injury severity.
(6) Evening
The typical drivers in evening crashes are also in the “25 to
29” and “30 to 49” age groups. They are mainly professional
drivers who work overtime or are engaged in social activities
after work, which means that they tend to be very tired and
sleepy. As a result, their reaction times are slower and thus
crashes occurring during this time period tend to result in
high level injury severity.
The ultimate goal of this study is to provide a scientific
basis for analyzing driver injury severity in different times of
day and to develop measures that can potentially reduce
driver's injury severity. Future studies should overcome the
data limitations in this study. The primary data source used in
this study is the FRA database data file from 2002 to 2011
which covers a total of 10 years of highway-rail grade crossing
crash data. The characteristics of drivers included in this
database are only the drivers' age and gender but the vehicles'age and crashworthiness are not included. To better capture
impacts of drivers' behaviors on the injury severity, future
studies can includemore driver related factors such as driver'sheight, weight, body structure, alcohol use, and education
level. In general, a comprehensive analysis of driver's biome-
chanics and behavioral responses is strongly recommended
for future researches. In addition, comprehensive geometric
information (i.e., crossing angle) of crash sites and vegetation
clearance in the driving safety triangle are also strongly rec-
ommended to be considered for future researches. For the
model choice, the ordered probit model addresses the prob-
lem of independence of irrelevant alternatives (IIA) and or-
dered discrete data and as a result this model choice was
included in this study. However, this model also suffers from
the assumption of a normal distribution for all unobserved
components of utility. Therefore, a more flexible model,
such as an ordered mixed model, is suggested for the future
studies.
r e f e r e n c e s
Abdel-Aty, M., Ekram, A.A., Huang, H., et al., 2011. A study oncrashes related to visibility obstruction due to fog andsmoke. Accident Analysis and Prevention 43 (5), 1730e1737.
Bougard, C., Moussay, S., Davenne, D., 2008. An assessment of therelevance of laboratory and motorcycling tests forinvestigating time of day and sleep deprivation influenceson motorcycling performance. Accident Analysis andPrevention 40 (2), 635e643.
Clarke, D.D., Ward, P., Bartle, C., et al., 2006. Young driveraccidents in the UK: the influence of age, experience, andtime of day. Accident Analysis and Prevention 38 (5), 871e878.
Haleem, K., Abdel-Aty, M., 2010. Examining traffic crash injuryseverity at unsignalized intersections. Journal of SafetyResearch 41 (4), 347e357.
Hao, W., Daniel, J.R., 2014. Motor vehicle driver injury severitystudy under various traffic control at highway-rail gradecrossings in the United States. Journal of Safety Research 51(1), 41e48.
Hao, W., Daniel, J.R., 2013. Severity of injuries to motor vehicledrivers at highway-rail grade crossings in the United States.Transportation Research Record (2384), 102e108.
Islam, S., Mannering, F., 2006. Driver aging and its effect on maleand female single-vehicle accident injuries: some additionalevidence. Journal of Safety Research 37 (3), 267e276.
Kilpelainen, M., Summala, H., 2007. Effects of weather andweather forecast on driver behaviour. TransportationResearch Part F: Traffic Psychology and Behaviour 10 (4),288e299.
Kim, J.K., Kim, S., Ulfarsson, G.F., et al., 2007. Bicyclist injuryseverities in bicycle-motor vehicle accidents. AccidentAnalysis and Prevention 39 (2), 238e251.
Kockelman, K., Kweon, Y.J., 2002. Driver injury severity: anapplication of ordered probit models. Accident Analysis andPrevention 34 (3), 313e321.
Lee, C., Abdel-Aty, M., 2005. Comprehensive analysis of vehicle-pedestrian crashes at intersections in Florida. AccidentAnalysis and Prevention 37 (4), 775e786.
Lenne, M.G., Triggs, T.J., Redman, J.R., 1997. Time of dayvariations in driving performance. Accident Analysis andPrevention 29 (4), 431e437.
McCollister, G.M., Pflaum, C.C., 2007. A model to predict theprobability of highway rail crossing accidents. Journal of Railand Rapid Transit 221 (3), 321e329.
Milton, J.C., Shankar, V.N., Mannering, F.L., 2008. Highwayaccident severities and the mixed logit model: anexploratory empirical analysis. Accident Analysis andPrevention 40 (1), 260e266.
Morgan, A., Mannering, F.L., 2011. The effects of road-surfaceconditions, age, and gender on driver-injury severities.Accident Analysis and Prevention 43 (5), 1852e1863.
Okola, A., 2003. Departure time choice for recreational activitiesby elderly non-workers. Transportation Research Record(1848), 86e93.
Otmani, S., Roge, J., Muzet, A., 2005. Sleepiness in professionaldrivers: effect of age and time of day. Accident Analysis andPrevention 37 (5), 930e937.
Pai, C.W., Saleh, W., 2007. An analysis of motorcyclistinjury severity under various traffic control measures atthree-legged junctions in the UK. Safety Science 45 (8),832e847.
Qin, X., Ivan, J.N., Ravishanker, N., et al., 2006. Bayesian estimationof hourly exposure functions by crash type and time of day.Accident Analysis and Prevention 38 (6), 1071e1080.
Raub, R.A., 2006. Examination of highway-rail grade crossingcollisions over 10 years in seven midwestern states. ITEJournal 76 (4), 16e22.
Reimer, B., D'Ambrosio, L.A., Coughlin, J.F., 2007. Secondaryanalysis of time of day on simulated driving performance.Journal of Safety Research 38 (5), 563e570.
Siddiqui, N.A., Chu, X.H., Guttenplan, M., 2006. Crossing locations,light conditions, and pedestrian injury severity.Transportation Research Record (1982), 141e149.
Savolainen, P.T., Mannering, F.L., Lord, D., et al., 2011. Thestatistical analysis of highway crash-injury severities: areview and assessment of methodological alternatives.Accident Analysis and Prevention 43 (5), 1666e1676.

j o u r n a l o f t r a ffi c and t r an s p o r t a t i o n e n g i n e e r i n g ( e n g l i s h e d i t i o n ) 2 0 1 6 ; 3 ( 1 ) : 3 7e5 050
Steed, J.L., Bhat, C.R., 2000. On modeling departure-time choicefor home-based social/recreational and shopping trips.Transportation Research Record (1706), 152e159.
Tay, R., Choi, J., Kattan, L., et al., 2011. A multinomial logit modelof pedestrian-vehicle crash severity. International Journal ofSustainable Transportation 5 (4), 233e249.
Theofilatos, A., Yannis, G.A., 2014. A review of the effect of trafficand weather characteristics on road safety. Accident Analysisand Prevention 72 (1), 244e256.
Ulfarsson, G.F., Mannering, F.L., 2004. Differences in male andfemale injury severities in sport-utility vehicle, minivan,
pickup and passenger car accidents. Accident Analysis andPrevention 36 (2), 135e147.
Yan, X.D., Han, L.D., Richards, S., et al., 2010. Train-vehicle crash riskcomparison between before and after stop signs installed athighway-rail grade crossings. Traffic Injury Prevention 11 (5),535e542.
Zhang, Y., Li, Z.B., Liu, P., et al., 2011. Exploring contributingfactors to crash injury severity at freeway diverge areasusing ordered probit model. Procedia Engineering 21 (1),178e185.