the effect of taxes and social programs on competitiveness
TRANSCRIPT
The Effect of Taxes and Social Programson Competitiveness inInternational Agriculture:A Case Study of the Wheat Industry
Agricultural Experiment StationOregon State University
Station Bulletin 679 LL!April 1994
Op,
O4-c, i&V
For additional copies of this publication, write:
Publications OrdersAgricultural CommunicationsOregon State UniversityAdministrative Services A422Corvallis, OR 97331-21 19

THE EFFECT OF TAXES AND SOCIAL PROGRAMS ONCOMPETITIVENESS IN INTERNATIONAL AGRICULTURE:
A CASE STUDY OF THE WHEAT INDUSTRY
Gregory M. PerryAgricultural and Resource Economics
Oregon State UniversityCorvallis, Oregon
Clair J. NixonDepartment of Accounting
Texas A&M UniversityCollege Station, Texas
Juan J. ActisDepartment of Social and Economic Studies
Instituto Nacional de Tecnologfa Agropecuaria (INTA)Pergamino, Argentina
Ken BunnageAlberta AgricultureLethbridge, Alberta
Robert BatterhamDepartment of Agricultural Economics
University of SydneySydney, Australia
THE EFFECT OF TAXES AND SOCIAL PROGRAMS ONCOMPETITIVENESS IN INTERNATIONAL AGRICULTURE:
A CASE STUDY OF THE WHEAT INDUSTRY
Perceptions of competitiveness of U.S. products in world markets, or the lack thereof,continues to receive attention among both policymakers and the general public. As evidenceof a decline in U.S. competitiveness, the U.S. international trade balance fell from a surplusof $2.7 billion in 1970 to a deficit of $119.8 billion in 1988 (Bureau of the Census). U.S.citizens are concerned about a balance of trade deficit because it may represent lost jobs anda lower standard of living.
During this same 1970-88 period, however, agriculture has gone against this negative trend byregistering significant surpluses in trade. Perhaps as a result, farm groups and otheragricultural interests have been among the most vocal in pressing for more open markets inJapan, Europe and elsewhere (Moore). Many within the agricultural sector feel the UnitedStates has a comparative advantage' in food production and that its market share will bemaintained or continue to grow if trade barriers are reduced or eliminated (Yates). A recentstudy by the USDA, for example, suggests that liberalizing trade between the United Statesand Mexico would increase U.S. farm income by $1.7 billion in the 15 years after theagreement takes effect (USDA).
On the other hand, there is concern that free trade benefits to agriculture and related sectorswill be more than offset by losses in other production sectors. There is the prediction, forexample, that in the case of the North American Free Trade Agreement (NAFTA), greaterpoverty will emerge in Mexico and the United States, with only the upper 30 percent ofpopulations in both countries benefitting from lower consumer prices (Yates). In addition,differences in enviromnental regulations may provide farmers in third-world countries, such asMexico, with a competitive advantage in trade with the United States and world markets(Hofferber).
As the debate over the costs and benefits of the NAFTA and other free trade agreementscontinues, domestic tax policies represent an important, but often overlooked variable inassessing the competitive position of trading countries. In fact, tax policies can be just assignificant as some subsidies in influencing competitiveness. To allow a country's natural, orcomparative, advantage to determine trade flows, all government interaction with producers(e.g., subsidies, taxes, and environmental regulations) must impose the same total net cost.To ifiustrate, farmers who receive substantial subsidies, but also pay high taxes, would be in
'Comparative advantage refers to activities in which a group performs better relative to others. As used inthis document, comparative advantage performance is based on soils, climate, and other resources. Competitiveadvantage represents the actual trade advantage a country has, including all comparative advantage items plusthose artificially created by government (e.g., direct subsidies, bathers to trade).
1
the same competitive position as farmers in another country who receive no subsidies, butincur much smaller tax obligations. In addition, focusing on direct subsidy measures, such asthe Producer Subsidy Equivalent, as a gauge of government intervention may not result in atrue reduction in subsidies. Rather, some governments that fmd it desirable to subsidize theirfarmers may choose to switch to tax policy as an alternative subsidy vehicle. The effect ofsuch a government policy on producers' competitive position can be addressed adequatelyonly through the consideration of domestic and international taxation policies in tradenegotiations.
Although tax revenues are used to provide governmental services to all sectors of theeconomy, including agriculture, the relative benefits of government intervention in eachproduction sector are unevenly distributed. Many of these services or lack thereof contributesignificantly to individual production sectors' competitive advantage or disadvantage in trade.Ultimately, however, the cost of production per unit of output, rate of technological change,and the rate of return acceptable to farmers will be the deciding factors determiningcompetitive advantage in the production of wheat and other commodities. Any governmentprogram that subsidizes the farmer's standard of living allows these producers to lower theiracceptable rate of return, thereby enhancing trade competitiveness. These other governmentalservices (i.e., national health care, pensions, etc.) also should be considered in any comparisonof tax burdens between countries.2
There is, fortunately, increased recognition among economists concerning the importance oftaxation policy on competitiveness. Sharples, for example, argues that reducing tax burdenson farmers is one way government can make commodities more competitive in internationalmarkets. In addition, a recent study of the U.S. - Canada Free Trade Agreement by Canadianresearchers recognizes the role of tax policy in affecting trade outcomes, and suggests thatmore research is needed to quantify the tax burden faced by farmers in both countries(Growing Together). Further, using a case fann situation, Perry, Nixon and Bunnage (1992)demonstrated that differences in taxation policies can be more important than directgovernment subsidies in determining overall competitive advantage between U.S. andCanadian wheat farmers.
In this study, we report the results of a firm-level investigation into tax policies for wheatfarmers in the world's major wheat-exporting countries, specifically, Argentina, Australia,Canada, France (representing the Economic Community) and the United States. Thepresentation of this research begins with development of a theoretical basis for the researchapproach. Next, a detailed overview of the taxation policies in each of these five countries ispresented, along with a description of major social program benefits. A simulation model isthen used to illustrate how taxes and social programs fit together to determine an overall levelof net return in each country. Initially, farms with approximately equal returns in threedifferent countries are compared under alternative taxation policies to determine how taxes
2This approach is not without its flaws. Some services, such as national defense, are difficult to measure.
2

and social programs influence competitiveness. The analysis is then expanded to other farmsizes to explore how government policies aid or hinder the international competitiveness ofeach country.
Theoretical Framework for Analytical Approach
Following the work of Chambers and Lopez, it is assumed farm households seek to maximizeutility based on choices between consumption (c), leisure (1), and saving(s). The basicbehavioral model is
(1) Max U(C,H-L1-L2,)C,L1,4
subject to
(i) AE = O[]{(L1,K,P4e) -r[K-[] [l-).(w)]WL2ST} - a[c]C
where H is total time available to the farm household, L1 and L2 are time spent in on-farmand off-farm work, and leisure is implicitly defmed as 1EH-L1-L2. Savings is represented bychange in farm equity (i±E). The term O[it] represents one minus the proportion of federal,state, and local income taxes, all dependent on farm profit and government tax schedules.Farm profit , is a function of on-farm labor, capital employed in the operation3 (K), pricesof both inputs and outputs (P), debt level (d), and a random component (e). Taxable farmprofits can be reduced by taxes on capital and labor. Capital (or property) taxes are based onthe schedule r[K}, with different rates depending on the types of farm capital being taxed.Payroll taxes for on-farm returns to labor X[] are based on farm profits, whereas off-farmpayroll taxes are tied to off-farm labor.4The term ST represents government social transfers,some of which may be tax-exempt. The term C represents family withdrawals needed to coverliving expenses, which are subject to a sales tax schedule cz[C].
To understand how alternative tax policies would affect farm profits, we elected to use anapproach akin to the Laspeyres measure of welfare change. Initially, we assume that the farmhousehold has made consumption, leisure, and saving decisions in such a manner as tomaximize utility. By gathering current information on prices, quantities used, andmanagement decisions made, we can describe the farm's financial position. Suppose wesimplify (l,i) above to be
Capital as used here includes land, and physical and fmancial capital.
Payroll taxes for farmers often are poorly related to farm labor hours, but are linked to farm income. Theydiffer in the income base used to calculate tax.
3

AE= t[7tA] [(C,H-L,-L2)]
such that t[7rA1 represents all tax schedules and it. represents the farmers net return incountry A. The welfare effect of a change in tax policy can be obtained by
EWA = (t[7tJ -t[7tB]} [(C,H-L1-.L2)]
where t[it1] is the alternative tax plan (e.g., tax policies in country B). Like other measuresusing the Laspeyres index approach, such as the consumer price index, the resulting measureis a short-run, partial equilibrium result. However, the general equilibrium solution can beapproximated by comparing (3) with
AW =
To illustrate, if WA and AWB are both similar in size and direction, then it follows that thegeneral equilibrium solution would also generate these results.
Overview of Study Areas
A number of representative farms were developed for use in this analysis, representingArgentina, Australia, Canada, and the United States. Insufficient information was available todevelop a farm for France. In this section we provide a brief description of each farmdeveloped. Because the focus of this study is tax policy, no description of the myriad ofgovernment agricultural policies in each country or cost of production differences ispresented.
Argenlina
Argentine wheat production is centered in the rich Pampas area of the Buenos Aires province.In Southern Buenos Aires wheat is produced in rotation with sunflowers and some corn. Amore important wheat producing area is located in the Northern Buenos Aires province wherewheat is double-cropped with soybeans. A representative farm of 450 hectares located in thePergamino area of Buenos Aires was developed for the study. The farm consisted of 55percent soybeans, 20 percent corn, and 25 percent wheat-soybeans double-cropped. Lack ofsupport prices and moderately high marketing costs mean that per hectare wheat productioncosts must be low to remain competitive in international wheat trade. A small debt load is
4

another important characteristic of this farm. The high inflation policies of Argentinegovernments over several decades essentially destroyed credit markets, causing farmers toself-fmance all land and equipment purchases.
Australia
Australian wheat is grown in a narrow crescent known as the wheat belt. The crescentstretches in a curve from central Queensland, through New South Wales, Victoria, andsouthern South Australia. The crescent continues around the southwest of Western Australia.New South Wales has the highest wheat production, providing about 30 percent of country'sproduction. Most wheat in New South Wales is farmed in rotation with pasture. Virtually allAustralian wheat is grown under nonirrigated conditions, with weather variability causingsubstantial yield fluctuations. Australian farmers specialize in soft red and white wheats.
For this study, the Australian case farm was placed in Moree District, a major wheatproducing area of northcentral New South Wales. The farm contained 875 hectares of land,with a 75 percent wheat and 25 percent barley crop mix. Although the rotation differs fromthe traditional grain-pasture rotation, production practices are much the same.
Canada
Canadian wheat production is centered in the prairie provinces of Alberta, Saskatchewan, andManitoba. Canada specializes in spring wheats, specifically hard red and durum varieties.The case study situation selected for Canada was located in Warner County, Alberta, adjacentto the U.S. (Montana) border. The production practices and productivity levels are similar tolow rainfall wheat production areas of the United States. A grain-fallow rotational system isfollowed in the Warner area. Durum and hard red spring wheats dominate in the rotation.For this analysis, the crop mix was assumed to consist of 50 percent fallow, 20 percent hardred spring, 20 percent durum, 5 percent hard red winter, and 5 percent barley. Therepresentative farm size was 1,700 hectares.
The United States
The case farm situation was developed for Morrow County, Oregon. Morrow County islocated in the Columbia Plateau region, a major wheat producing area in Oregon andWashington. The typical cropping system involves a wheat-fallow rotation, with some barleyand other small grains sometimes included. The cropping system is land extensive, with anaverage farm size of about 1,100 hectares. Morrow County yields vary a great deal,depending on rainfall and soil depth, but are typical of the Columbia Plateau region. Yieldsand production practices are similar to those in the low rainfall areas of the Great Plains (e.g.,Montana, North Dakota, and Colorado).
5

Comparison of Tax and Social Program Policies
The five countries analyzed here depend on the same basic set of sources, income, property,and sales, to levy taxes. The proportion raised from each source varies greatly, however.Most of these countries have also experienced major changes in their tax system during thelast decade and will likely see further change in the 1990's. Consequently, what is presentedis a "snapshot" of the tax law in each country for 1991.
Income Taxes
A comparison of 1991 federal and state/provincial income tax laws for each country is givenin Table 1. Argentina, Australia, and Canada provide one tax schedule for individuals and asecond for corporations. In Prance, family incomes are aggregated prior to calculatingincome tax, with the appropriate tax schedule based on the taxpayer's family responsibilities(known as parts). Heads of households and spouses count as one part each, with each childrepresenting one-half.part. The French tax schedule listed in Table 1 is for three parts. TheUnited States, on the other hand, provides four alternative schedules for individuals: (a)married filing jointly, (b) married, filing separately, (c) head of household, and (d) single.Married couples have the option of paying their taxes jointly or married filing separately, withjoint filing providing a small benefit.
A single, progressive tax schedule on each individual (like that in Argentina, Australia, andCanada) encourages husband and wife to earn income separately because total taxes paid willbe less than if only one spouse were to earn the equivalent amount of income. Soleproprietor farms typically assign all income to the husband, resulting in substantial incometaxes. To deal with this issue, farmers in Canada and Australia create husband-wifepartnerships, with each spouse sharing equally in farm proceeds. To qualify as a husband-wife partnership, each partner provides labor, financial capital, or assets in proportion to theirshare of farm income. Argentina does not permit this kind of partnership. As noted in theprevious paragraph, husband-wife partnerships in the United States and France seldom arebeneficial and can result in higher taxes.
Canada and the United States have only three tax rates for individuals, with a top rate of 29percent in Canada, and 31 percent in the United States. Surtaxes are also levied on regularCanadian taxes, resulting in a top effective tax rate of almost 32 percent. Australia andFrance have much more progressive tax systems with higher rates. The federal governmentsin Argentina, Australia, and France also collect essentially all income tax dollars, whereasmost states or provinces in Canada and the United States have substantial state income taxes.Finally, Argentine federal income tax levels are quite modest compared to the othercountries.5
5Historically, the compliance rate for Argentine income taxes was very low, largely because there was nolegal recourse for noncompliance. With recent economic reforms, however, has come a commitment to punishthose who don't pay taxes. Whether the government will carry through on its threats remains to be seen.
6

am addition to the income tax rates listed here, Canada also charges a 5% surtax on tax payable, increasing to 10% for taxes above $10,625. Alberta levies an 8% surtax onprovincial taxes above $2,975.
Table 1. Summary of 1991 Federal and State/Provincial Income Tax Law by Country in 1991
Buenos AiresArgentina
New South WalesAustralia
AlbertaCanadaa
La MarneFrance
OregonUnited States
Federal Personal so. - 1,372. 6% $0. - 4,148. 0% $0. - 24,466. 17% $0. - 10,013. 0% $0. - 34,000. 15%Income Tax 1,372. - 13,725. 10% 4,148. - 13,944. 20% 24,466. - 48,933. 26% 10,013. - 10,466. 5% 34,000. - 82,150. 28%Bracket and Rates 13,725. - 28,822. 15% 13,944. - 16,274. 24% 48,933. and above 29% 10,466. - 12,403. 10% 82,125. and above 31%
28,822. - 57,643. 20% 16,274. - 16,353. 29% 12,403. - 19,607. 14%57,643. - 115,287. 25% 16,353. - 27,650. 38% 19,607. - 25,204. 19%
115,287. and above 30% 27,650. - 28,440. 42% 25,204. - 31,641. 24%28,440. - 39,500. 46% 31,641. - 38,292. 29%39,500. and above 47% 38,292,
44,177.- 44,177.- 73,604.
34%38%
73,604. - 101,237. 43%101,237. -119,751. 49%119,751. -136,217. 54%
Preferred PersonalFiling Status
State/ProvincialPersonal Income TaxBrackets and Rates
household
none
husband-wife partnership husband-wife partnership
none 46.5% of federaltax
136,217. and above 57%
household
none
married filing jointly
a - 4,000. 5%4,000. - 10,000. 7%
10,000. and above 9%
Federal CorporateIncome Tax Bracketsand Rates
20% ofincome
39% of income 38% of income,reduced to 12% if
income below $170,000
24% of incomefrom land or
farming
0. - 50,000. 15%50,000. - 75,000. 25%75,000. -100,000. 34%
100,000. -335,000. 39%335,000. and above 34%
State/ProvincialCorporate Tax
none none 39.5% of federal tax,reduced to 6%
none 6.6% of income

Some countries have special provisions in treatment of corporate taxes. The United States,for example, is the only country in the study with more than one tax rate for corporations.Australia, on the other hand, taxes corporations, or companies as they are referred to there, ata flat 39 percent rate. The standard corporate tax rate in France is 50 percent, but it isreduced to 24 percent for income from land or farming. In Argentina, the corporate tax rateis 20 percent. A distinct disadvantage of incorporation is the double taxation of corporateprofits. The double taxation occurs because corporate profits are taxed at the corporate leveland then again when profits are distributed to shareholders in the form of dividends. InAustralia, dividend imputation allows individual shareholders to avoid this form of doubletaxation. To illustrate, individuals who are in the 47 percent tax bracket would receive a 39percent tax credit on each dollar of dividends received. The net result is an 8 percent taxpayment on dividends received by individuals.
In Canada, corporations are taxed at a 38 percent rate. However, if the corporation has lessthan $170,000 in taxable income it qualifies as a small business. Small business corporationsin Canada receive a federal tax abatement of 10 percent and a small business deduction of 16percent. The net result to these corporations is an effective tax rate of 12 percent.
The United States tax law also provides for two different types of corporations, referred to as"S" and "C" corporations. The S corporation is essentially treated like a partnership for taxpurposes, so it will not be considered in this study. The C corporations are further subdividedinto regular, personal holding companies or personal services corporation. Farming operationstypically qualify as regular C corporations. The progressive tax rates for regular Ccorporations range from 15-34 percent.
A summary of state/provincial income taxes is also outlined in Table 1. Argentina, Australiaand France have no state income taxes. Oregon has no sales tax, so it must depend onincome and property taxes to fund government services. Oregon's income tax is the majorstate government revenue source and basicly consists of a flat tax rate of 9 percent of federaltaxable income.
Canadian provincial taxes are generally collected by the federal government and are based onsome percentage of federal taxes payable. The marginal rates, however, are generally a largerpercentage of the federal rates than in the United States. In Alberta, for example, the baseprovincial income tax is 46.5 percent of the federal income tax.
Deductions and Exemptions
All countries permit deductions from taxes or taxable income based on certain expenses.Several countries also allow for tax exemptions on a part of taxable income based on familysize. Argentina, for example, permits limited deductions for social security funds, medicalplan premiums, life insurance premiums, private retirement insurance premiums, anddonations. The head of the household receives a basic exemption of $4,200, the spouse$2,100, and each dependent $1,050. Australia allows deductions for charitable contributions
8

to nonreligious organizations, contributions to a superannuation (retirement) fund, a spouseearning little or no income, investment in the Australian film industry, or medical expensesover $790. No exemptions are available in Australia.
Self-employed Canadian taxpayers are allowed to deduct 17 percent of contributions topension plans, professional dues, child care expenses, and 50 percent of taxes paid to theCanadian Pension Plan as tax credits. A portion of medical expenses can be treated as a taxcredit if these expenses exceed 3 percent of net income. In addition, taxpayers are alsoallowed to deduct 17 percent of tuition and the first $213 of charitable contributions directlyfrom their federal tax payable. Charitable expenses above $213 are deducted from taxes at 29percent of their value up to 20 percent of net income. Tax exemptions for children in Canadavary by family size, with more generous benefits given to larger families. General sales tax(GST) rebates are provided for lower income families.
France allows deductions from taxable income for the cost of caring for relatives over 75years of age, food costs for children not at home, and investment in the French film industry.Tax credits are also provided for a host of items, including food and lodging costs fordisabled persons, contributions to charitable organizations or political campaigns, lifeinsurance, weatherization expenses, and accounting fees. Taxpayers also may reduce taxableincome by 20 percent when using an accounting firm to calculate income. No exemptions aredirectly given, but the appropriate tax bracket is a function of household size. Tax liabilitiesare substantially reduced as family size increases. For example, a single person with ataxable income of $50,000 would pay $18,924 in taxes whereas a couple with two childrenand the same income would pay only $9,994.
In the United States, taxpayers can choose a standard deduction of $5,700 (for marriedcouples filing a joint return) or they can itemize personal deductible expenses. Thesepersonal expenses include state income and property taxes, interest on homes, excessivemedical expenses, and charitable contributions.6 Farmers can also deduct 50 percent of theirself-employment taxes from gross taxable income. Personal exemptions amount to $2,150 foreach household member.
Treatment of Business Exj,enses and Income
The method for calculating taxable income from a farm is similar in each country. Farmincome is calculated (using cash or accrual accounting) as income less cash expenses anddepreciation. All five countries also permit losses from previous years to be carried over anddeducted from the current year's income. Major differences exist among the countries in thecalculation of annual depreciation and provisions for placing some income in tax-exemptsavings programs.
6Farmers typically are able to deduct home interest and property taxes as part of farm business expenses.
9

Depreciation in Argentina is calculated using straight-line methods, with the depreciable lifebased on the expected life of buildings and equipment. The depreciable life ranges from 8-20years for equipment and from 30-50 years for buildings. Currently, Argentina does not havea capital gains tax for noncorporate businesses, but does subject the sale of real estate to a 1.5percent tax. Corporate capital gains are taxed as regular income.
Australia allows fanners to choose between straight-line and diminishing balance depreciationschedules. Assets are assigned a straight-line, or prime cost, depreciation rate based on theiruse classification. If a diminishing value pattern is chosen, the rate is 50 percent higher thanthe straight-line rate. In addition, 20 percent loading rates apply to assets purchased afterMay 25, 1988. Loading increases the depreciation rates for both prime cost and diminishingvalue depreciation. For example, a 25 percent prime cost depreciation rate would increase to30 percent under a 20 percent loading scheme, with the diminishing value rate increasing to45 percent. Most self-propelled farm equipment purchased in 1991 would be depreciated(with loading and a diminishing value pattern) at a 27 percent rate, with other farm equipmentdepreciated at 18 percent. Farm buildings are depreciated at 5.4 percent annually.
The purchase price for a capital gain item in Australia is indexed upward to the same dollarvalue when the item is sold. Consequently, individuals pay tax only on the real capital gain.Any real capital gains are taxed at the same rate as regular income.
The Income Equalisation Deposit program in Australia allows a farmer to deposit someincome7 in a government-sponsored account, thereby deferring the recognition of the income.The farmer can withdraw the money at any time with no penalty, but must report thewithdrawn money as income. Total deposits in this program cannot exceed $197,500 perperson. This program was created in response to the high level of income variability facedby most Australian farmers. In addition, farmers are allowed to use income averaging for taxpurposes. A better description of the Australian approach is tax rate averaging, if averagingis selected, the fanner calculates the average tax rate for farm income earned in the currentand previous four years. These rates are then averaged and multiplied by the current year'staxable income to obtain taxes payable.
Canada levies tax on capital gains at three-fourths of the regular income rate. Canada alsoallows only one-half the annual depreciation allowance in the year of acquisition. In Canada,deduction of an allowance for the capital cost of depreciable property (capital cost allowanceor CCA) is permitted in lieu of depreciation. Depreciable properties are pooled together inclasses on the basis of their similarity in use. Annual capital costs allowances are deductedfrom the year-end balance of each class at rates that are class specific. In most cases,depreciation rates are applied on a diminishing-balance basis. Taxpayers may also claim lessthan the maximum CCA and even vary the depreciation rate from year to year. There isneither a stipulated minimum nor a requirement that the deduction be related to amounts
7The minimum deposit is $3,950 in any year.
10

claimed for financial reporting purposes. The basic depreciation rate is 30 percent of currentdepreciable basis for motorized farm equipment, 20 percent for non-motorized equipment, and10 percent for buildings.
Canada created the Registered Retirement Savings Plan (RRSP) to function much like tax-exempt retirement accounts in other countries. Because there is no tax penalty onwithdrawal,8 Canadian farmers can use the RRSP much like the Australian incomestabilization program.9 Deposits are limited to 18 percent of taxable income, or $9,350.
The French government separates capital gains into short-term (i.e., less than 2 years) andlong-term categories. Short-term capital gains aie taxed as ordinary income. Long-tenn gainsare taxed at a 16 percent rate. Depreciation is calculated using the double-declining balancemethod, converting to straight-line once the latter produces a greater amount of depreciation.Asset lives vary from 5-10 years for equipment, with a 20-year life established for buildings.First year expensing is also allowed, with a maximum of $1,840 per asset or $3,680 per year.
The United States taxes capital gains at a maximum rate of 28 percent. Depreciable assets inthe United States are pooled by economic life, with most farm machinery being in the 7-yearand general purpose farm strUctures in the 20-year class life. Once a method of depreciation(accelerated versus straight-line) is selected, a change in method is allowable only withapproval from the Internal Revenue Service. The United States also allows for some of theequipment price to be expensed in the year of purchase. Total expensing for all qualifyingassets cannot exceed $10,000 in a given tax year.
The United States also has a number of retirement programs that can be used by self-employed persons. Perhaps the program most commonly used by farmers is the KEOGHaccount. Under this program, farmers can contribute up to 15 percent of their taxable income(maximum of $30,000) to their KEOGH account These funds are not taxable until thefarmer makes a withdrawal. KEOGH accounts can, in theory, be used like the IncomeEqualisation Deposit program to stabilize income. In reality, however, they seldom fill thistype of role because the government assesses a 10 percent tax penalty on premature (prior toretirement age) withdrawals. When combined with normal taxes assessed on the amountwithdrawn, the cost of withdrawal before retirement is generally too high for farmers toconsider.
Social Program Taxes
Social program taxes vary a great deal from country to country. Argentina has programs forretirement, health insurance, and family allowance payments. The retirement programrequires a contribution of 18 percent from the employer and 16 percent from the employee,
8Withdrawals are subject to a 15 percent withholding tax.
91n fact, most farmers do use the RRSP as a retirement tool and do not withdraw funds in low income years.
11

but does not cover self-employed individuals, such as farmers. The health insurance programrequires a 7.5 percent contribution from employers and 3 percent from employees, but againdoes not encompass farm operators. Self-employed persons also cannot participate in thefamily support program. In short, although Argentina has substantial social programs inplace, farm operators neither participate in paying for these programs nor receive any benefits.
The lone social program tax in Australia is for Medicare and represents 1.25 percent ofincome, providing the individual has an income above $8,161. The Canadian Pension Plan isa mandatory retirement program for all Canadian citizens unless they are self-employed. Toparticipate self-employed individuals must contribute 4.6 percent on the first $25,925 ofincome.
France has an extensive set of social programs, with taxes earmarked to cover the programcosts.10 Taxation rates are keyed to two income levels: the minimum level and the platformleveL if income falls below the minimum level ($4,710/year) then social program taxes arecalculated using this minimum leveL If, however, income rises above the platform level($25,039/year), additional income is taxed at a lower rate. Assurance Maladie, Maternité,Invalidité des Non-Salaries Agricoles (AMEXA) covers health, maternity, and disability costs,with a 17.46 percent rate regardless of income. Assurance Vieillesse Agricoles (AVA) is forretirement and accident insurance, with an 11.71 percent rate levied below the platform and1.44 percent thereafter. Other programs (denoted as PFA, AVI, and CSG) account for anadditional 9.5 percent of income below the platform and 6.5 percent thereafter. In addition,the government levies social security (retirement) taxes on grain production of $1.90/metricton.
In the United States, a 12.4 percent tax on the first $53,400 of earned (salaried or self-employed) income is levied to pay for government sponsored retirement programs. Salariedand hourly workers pay tax at 50 percent of these rates, with the other 50 percent paid byemployers. Self-employed workers pay the full 12.4 percent. To cover the cost of Medicare,the United States levies a 2.9 percent tax on self-employed individuals and a 1.45 percent taxon the employer and employee, on the first $125,000 of earned income. Self-employedindividuals are allowed a deduction of 50 percent of these taxes paid.
'°The current method for calculating social program taxes for farmers in France is based on the cadastralsystem and is extremely complicated. Recent changes in law will phase in a social tax system similar to that forother French citizens. The values used in this swdy reflect the planned changes and are anticipated to result in a
somewhat higher taxation level for farmers.
12

Table 2. Sales, Excise, and Value-Added Taxes on Consumer Goods for the Major Wheat-Exporting Countries in 199l.
aUn1S otherwise noted, values are reported as a percent of expenditures."Assumed 25% of purchases are tax-exemptcAssififled 70% of purchases are tax-exempt.4Assumed 90% of purchases are tax-exempt.eAssumed 90% of purchases are tax-exempt.
13
plus 7% plus 18.6%Vehicle Purchase 18. 15. 7. 25. 0.Insurance and Other 7.2e 6.' 4.2e 5.58c 0.
Health Insurance 0. 0. 0. 0. 0.Health Items 1.8" 0 07" 1.86" 0.Personal Care 18. 30. 7. 18.6 0.Recreation 13.5 225b 7. 20.5 0.Charity 0. 0. 0. 0. 0.Tobacco (cigarettes) 70% of 75% of $3.58/pack $0.03/pack $0.524/pack
retail price retail price plus 7% plus 52% ofretail price
Alcohol (beer) $0.56/i $0.22/iplus 20%
$0.14/iplus 7%
$0.039/1plus 18.6%
$0.098/l
Other 7.2 11.25" 5.25" 13.95L 0
Consumption Item
BuenosAires
Argentina
New SouthWales
AustraliaAlbertaCanada
La MarneFrance
OregonUnitedStates
Food:At Home 13.5b 3C Ø7d 55 0Away from Home 18. 3C 5.5 0.
Utilities 22. 0. 7. 18.6 0.Furniture 18. 10. 7. 18.6 0.Clothing 18. 0. 7. 18.6 0.Transportation:
Gasoline and Oil $0.45/i $0.26/i $0. 149/1 $0. 505/1 $0.084/l
Sales and Value-Added Taxes
An important source of government revenue in all five countries is taxation of goods andservices. Sales and excise taxes in all five countries are either waived or rebated on all farminputs. Consequently, taxes on farm inputs were ignored in the analysis. A summary of 1991
sales, excise and value-added taxes for the five countries analyzed here is given in Table 2.Argentina has an 18 percent value-add tax (VAT) that covers a broad range of consumergoods and services. Exempt items include milk, bread, medicines, insurance, readingmaterial, education, health care, admissions to sporting and artistic events, and interest.Telephone services are taxed at a reduced rate of 11 percent and other utilities are taxed at 25percent. Gasoline has an excise tax of $0.45/liter and cigarettes are taxed at 70 percent oftheir retail sales price.
Australia has a multi-level sales tax, with rates of 10 percent, 20 percent and 30 percent.Luxury goods are taxed at the 30 percent rate, including items such as radios, televisions,cameras, cosmetics, watches, high-priced autos, and jewelry. Items taxed at the 20 percentrate include most autos, computers, soft drinks, toys, stationary, and musical instruments. The10 percent rate applies to furniture, appliances, snack foods, ice-cream, fruit juices, andhousehold products. Exempt items include clothing, utilities, gasoline, most food items(including those eaten at a restaurant), reading material, medicines, and most services (CCHAustralia Limited). Excise taxes on gasoline total $0.26/liter ($0.207 federal and $0.053 inNew South Wales). New South Wales levies an excise tax equivalent to 75 percent of thewholesale price for tobacco products. Taxes on beer amount to $0.22/liter plus 10 percent ofwholesale price, plus an additional 20 percent for sales tax.
Canada has a 7 percent Goods and Services Tax (GST) that was enacted in January 1991.All provinces except Alberta also impose provincial sales taxes. The GST applies to a wide
variety of goods and services including drinks, snack foods, electricity, furniture, appliances,clothing, automobiles, electronic equipment, gasoline, tobacco, and alcohol. Excise taxes ongasoline amount to $0.l49Iliter ($0.077 provincial and $0.072 federal). A $0.14/liter ($0.118
federal and $0.022 provincial) excise tax is levied on beer and an exceptionally high$3.58/pack ($2.23/pack provincial and $1.35 federal) excise tax is placed on cigarettes.Vehicle registration fees are $42.50/year.
The highest consumption taxes are in France, with an average VAT rate of 18.6 percent onmost consumer goods and services. The VAT on most food products and books is 5.5percent, with a 25 percent rate levied on cars, and a 33 percent rate on "luxury" items such astape recorders and cameras. Tax-exempt items include insurance, education, medicine, andbanldng costs. The excise tax on gasoline is $0.SO5Iliter. Tobacco has a $0.03/pack excisetax plus an ad valorem duty equivalent to 52 percent of the retail price. The beer excise taxis $0.039/liter.
Neither the United States nor Oregon have a sales tax, but excise taxes exist on gasoline,alcohol, and tobacco. Unleaded gasoline has an excise tax of $0.084/liter ($0.058 state plus
14

$0.026 federal), beer an excise tax of $0.O98Iliter ($0.022 state plus $0.076 federal), andcigarettes a tax of $0.524/pack ($0.28/pack state plus $0.244/pack federal). Oregon vehicleregistration costs are $25/year.
Property Taxes
Argentina has long relied on property taxes to generate significant government revenuebecause agriculture has been viewed as a major holder of the country's wealth. Further,property taxes are often easier to determine than income taxes because the owners are easilyidentified. For these reasons property taxes in Argentina are much higher than in othercountries.
The most important Argentine property tax is the impuesto inmobiliario, which is levied bythe provinces on land. The tax rate is progressive and is based on total land value. InBuenos Aires province the rates begin at 1.38 percent of value and increase to 3.95 percent ofvalue for acreages worth over $549,277.
Property taxes in the other four countries are levied by local governments. In Australiaproperty taxes are a minor source of government revenue, with corresponding low rates.Farm land in both Alberta, Canada, and Oregon, United States is valued for tax purposesbased on productive use rather than market value. Productive use is less than half that ofmarket value, resulting in a substantial break on property taxes. Oregon also levies asignificant tax on the farm home and outbuildings. On the other hand, Alberta farmersgenerally do not pay tax on homes, farm buildings, or machinery (McKeltine). Frenchproperty taxes are levied based on market value. Although the tax rate on land for Frenchfarmers is similar to that in Alberta and Oregon, the use of a fair market value base greatlyincreases the amount of taxes owed.
Social Program Benefits
All five countries provide special aid to lower income families with children. As was alreadynoted, Argentine farm families do not participate in this program, either as a taxpayer orrecipient. Family allowance payments are made monthly to Australian families based on theirincome level, number of children, and ages of the children. Regular allowance payments are$34/month/child for up to three children, and then $45.70/month for each additional child.This program is phased out if the previous year's taxable income for the family exceeds$50,000 and the family has one-child. Somewhat higher income levels apply for largerfamilies. Only children under 18 qualify for this benefit. Australia also provides asupplement to the family allowance payment if income for a one child family is $16,400 orless. The supplement provides $90/month/child for children less than 13 years of age and$132/month for children aged 13-15. All Australian family allowance payments are tax-free.
Canada's family allowance payments are also limited to children under 18 years of age. Thepayments range from $40.63/month/child for 16-17 year-old children to $22.35/month/child
15
for children under 7 years. Canadians are required to repay two-thirds of their allowance iftaxable income exceeds $43,223. These payments are subject to tax.
The French government provides an extensive set of social programs for its citizens. Allfamily allowance payments revolve around .a base de calcul (or calculation base) of$350.56/month. Families receive 32 percent of the base ($112) per month for their first childand 41 percent of the base ($144) for each additional child. Parents also receive 45.95percent of the base ($161) from 5 months before to three months alter the birth of a child. Ifthe spouse works, the government provides $368/month to offset the cost of a nanny. Thispayment is cut in half if the family receives an education allocation.
Families with three or more children receive a number of additional benefits. If three ormore children are over 3 years of age, an additional payment of 41.65 percent of the base($146) per child is also received. If the spouse is not currently working, but worked 2 yearsin the last 10, the family normally receives an education allocation of 50 percent of the base($17 1) per child, with special circumstances warranting a payment of 142.57 percent of thebase ($500) per child. At the beginning of each school year, the family receives 20 percentof the base ($71) payment for each child to cover the cost of school supplies.
Housing rent is another major subsidy provided by the French government. A formula is
used to determine the level of subsidy. The formula is based on the number of familymembers, monthly rent, family income, and a minimum rent set by the government. Mostfamilies qualify for some level of rent subsidy.
The United States provides an Earned Income Credit (EIC) program for low income familieswith children. The EIC is a refundable tax credit which either reduces the federal income taxliability or may result in a direct payment if the tax liability is small. The credit is at itsmaximum ($999) when adjusted gross income is $7,100-$11,263. The credit is phased out for
income above $21,232 or below $7,100. The EIC increases by up to $43 if the family hastwo or more children, and up to $357 if the family purchases health insurance for theirchildren. The credit cannot be claimed if a couple files their income taxes separately.
Methodology, Data and Assumptions
A farm-level simulation model developed at Oregon State University was used to estimate theeffects of agricultural policy, costs of production, and tax policy on farm profitability. Themodel attempts to replicate the fmancial behavior of a farm over time, calculating monthlycash flow statements, income statements, and balance sheets for each year simulated. Cropyields and prices of inputs and outputs can be randomized in a Monte-Carlo framework basedon distributions provided by the user. A key part of the model output is the incomestatement, an example of which is given in Figure 1. The income statement uses cashvariable costs from the cash flow statement in combination with changes in asset values
16

Figure 1. Example Income Statement from Farm Management Simulation Model (FAMS).
Less: Repayment of Government Loans 0.Other Farm Income 0.Savings Interest 136.TOTAL CASH RECEIPTS 144,035.
CASH FARM EXPENSESPer Unit 0.Materials 4,080.Chemicals 44,800.Fuel 6,013.Labor o.Insurance Premiums 16,987.Equipment Repair 10,949.Equipment Lease o.Cash Rent o.Interest:
Operating Loan 3,144.Equipment and Livestock 0.Land and Buildings 2,250.Other 0.
Property Taxes 3,947.Misc. Crop Expenses 1,575.TOTAL CASH EXPENSES 93,745.
NET CASH FARM INCOME 50,290.
+ Ending crop inventories 0.+ Change in value of
crops in ground 0.- Economic depreciation
Equipment 18,438.Long term assets 356.
NET FARM INCOME 31,497.
- All federal taxes- All government pension- State corporate income tax
4,556.1,182.2,094.3,665.NET INCOME AFTER TAXES (NIATJ2
+ Land capital gains 0.NIAT AND CAPITAL GAINS 23,665.
- Net family withdrawals 24,612.+ Change in nonfarm net worth 0.
CHANGE IN TOTAL NET WORTH -947.
17
1991
CASH FARM INCOMECrop Receipts $119,392.Direct Government Payments 0.Crop Insurance Indemnities 24,508.Direct Government Loans 0.

18
provided on the balance sheet to calculate the change in farm net worth." An abbreviated(and slightly modified) form of the income statement is used in presenting the simulationresults.
The advantage of a simulation approach is the ability to analyze extremely complex situationsand identify those factors that are important to the decisionmaker. In each of these countries,tax policy is highly complex and often contradictory. The simulation methodology enablesthe user to more accurately determine those individual variables that influence the fmancialwell-being of farmers in each country. Nonetheless, it is still difficult to assess whichcountry's policies favor farm operators as compared to other countries. The disadvantage of asimulation approach is the difficulty in providing decisionmaking ability as part of themodelling process. For example, if barley price is expected to be low over the next fewyears, the farmer may opt to plant fewer acres of barley. To model this behavior in asimulation framework would require a set of rules that determine when to shift away frombarley acreage, how much to move into other crops, and identification of substitute crops.Because many thousands of similar decisions are made by farm operators, the use of decisionmaking rules in this simulation model is generally avoided. Instead, the model reflects themost likely set of decisions the farmer would make in the next year, recognizing that muchless decision-making flexibility exists in the first year. It is important, however, that thereader understand the major behavioral assumptions utilized for each farm in each country.
Assumptions specific to a set of analyses are discussed in the analysis section of the report.The simulation analysis was for the 1991 tax year. Farmers in Canada, France, and theUnited States participated in government programs, including, in Canada and the UnitedStates, the purchase of crop insurance. U.S. target prices and loan rates were consistent withvalues defmed in the 1991 Farm Bill. Set-aside rates were 7.5 percent for barley and 15
percent for wheat. The 1991 target prices for Canada's GRIP program were based on actualvalues for Warner County, Alberta.
Conswnption Expenditures
The farmer was assumed to be married, with two children ages 16 and 8. Living expenseswere treated as normal, long-run expenditures that do not respond to year-to-year fluctuationsin income. A breakdown of living expenses is given in Table 3 for the farms in eachcountry.'2 For consumption in Australia, Canada, and the United States, regressionequations were estimated linking expenditures in each consumer category to total income.Consumption was then estimated based on the income level appropriate to the farm beinganalyzed. The U.S. equations were estimated based on 1990 data from the Consumer
"To simplify the analysis and pisentation of results, it was assumed that no changes occurred in land valuesor value of crops in the ground for the year of analysis.
'2Subsequent analyses of Alberta wheat farms smaller and larger than that used in the base analysis showedconsumption levels consistent with income generated by those farms.

Table 3. Annual Living Expenses (in Dollars) for Farm Scenarios Analyzed in Study(Excluding Taxes) in 1991
¶uel use (liters) is: Argentina, 1,029; Australia, 3,268; Canada, 4,933; U.S., 4,905.bTobacco use (packs) is: Argentina, 96; Australia, 45; Canada, 140; U.S., 240.cMhO1 use (liters) is: Argentina, 134; Australia, 895; Canada, 309; U.S., 281.
19
Consumption Item
BuenosAires
Argentina
New SouthWales
AustraliaAlbertaCanada
OregonUnitedStates
Farm Size (hectais) 450. 700. 1,700. 1,100.Food:
At Home $4,900. $5,930. $5,080. $3,420.Away from Home 630. 2,820. 3,190. 2,120.
Utilities 410. 940. 1,760. 2,180.Furniture 850. 2,490. 2,490. 1,180.Clothing 1,250. 3,170. 4,540. 2,010.Transportation:
Gasoline and Oils 240. 960. 1,154. 1,203.Vehicle Purchase 2,200. 3,440. 4,380. 3,115.Insurance and Other 650. 2,864. 3,650. 2,810.
Health Insurance 2,400. 580. 760. 3,000.Health Items 190. 500. 550. 800.Personal Care 200. 670. 750. 500.Recreation 900. 4,300. 5,230. 2,190.Charity 280. 250. 470. 1,210.Tobacco (cigarettes)b 90. 58. 230. 164.Alcohol (beer)c 300. 1,173. 1,085. 298.Other 2,600. 3,030. 10,320. 3,180.Total 18,090. 33,375. 45,639. 29,380.

Expenditure Survey (Bureau of Labor Statistics). Canadian consumption data disaggregatedby income were obtained from a household survey of expenditures for 1990 (StatisticsCanada). The Australian consumption data were obtained from a 1988-89 survey ofexpenditures for New South Wales, Australia. Consumption data for Argentina were poorrelative to that available in Australia, Canada, and the United States. The consumptionpattern was estimated based on a basket of goods used in calculating the Argentine consumerprice index, adjusted using other data and opinions of agricultural economists. Noconsumption pattern was estimated for France because the study did not include a Frenchfarm. In doing an analysis for a particular country, it was assumed that the basket of goodspurchased by the representative farm family did not change as consumption taxes changed.To illustrate, a family of four operating a 1,700 hectare farm in Oregon was estimated torequire about $30,000 per year for living expenses. After an investigation of current taxationpolicies in Oregon, it was estimated that about $29,400 of this amount was for goods andservices and $600 was for taxes. When considering how this farm would fare under theCanadian tax system, the base quantity of goods and services purchased was left unchangedand taxes were calculated for that amount. By holding the basket of goods constant, thefamily utility is left unchanged. In reality, the family would substitute goods and servicesbased on their after-tax cost. The result would be lower sales taxes and higher utility. Thestudy, therefore, overestimates what total sales, excise, and value-added taxes would be if achange in the taxing scheme were to occur.
Farm Cost Data
Equipment complements for each farm were identified based on actual farming operations inthe study areas, supplemented by expert advice of extension agents and specialists. Noequipment was replaced in any complement during the year analyzed. Functions provided in
the ASAE Yearbook were used to calculate repair costs. Depreciation estimates reflectedactual changes in market values during the year and were made using functions estimated by
Cross.
Prices and yields were assumed the major sources of uncertainty and were treated as randomvariables. Both sets of random variables were assumed to exhibit multivariate normaldistributions. Data for the yield distributions were based on actual farm level yieldinformation, when available, or county data. A special effort was made to ensure the pricedata .from each country reflected the time period 198 1-90 and, when possible the samemarketing year. Prices in each country were converted to their U.S. dollar equivalent usingthe exchange rate in effect each year.
Means and standard deviations for Canadian wheat prices were calculated using the CanadianWheat Board (CWB) wheat prices for 198 1-90 time period. Barley prices were calculatedusing prices registered in the Lethbridge, Alberta feed market. Because the CWB market year(August-July) does not coincide with that used in USDA calculations (June-May), monthlyaverage prices for wheat and barley at Portland, Oregon were averaged for August throughJuly. The Australian price was based on the Australian Wheat Board price for the 198 1-90
20

period. The Argentine price was calculated for the August-July time period using BuenosAires port prices. Canadian farmers were assumed to participate in the Canadian PensionPlan!3 Participation in Canada's RRSP program and Australia's Income StabilisationProgram was based on a breakpoint income level. The assumption was that if taxable incomewas above this breakpoint income the farmer would put money in these funds, subject to therules of each program; if below the breakpoint income, withdrawals would be made. Thebreakpoint income levels varied from scenario to scenario, but were set so that the expectedending fund balance was within $100 of the beginning fund balance.
Results, Analysis and Implications
The analysis centered on developing a representative wheat farm for a particular country andthen estimating the effect of taxes and government social programs on this farm's incomestatement for each country analyzed. The cost structure, government farm programs, crop mix,and other factors were left unchanged in each scenario. As an example, the analysis of theOregon farm was conducted as if the farm had been physically moved from Oregon toArgentina, Australia, Canada, and France, except that all U.S. government farm programs andsubsidies were left in place. The results, therefore, highlight the tax and social programdifferences between the five countries. Taxes paid represent all forms of taxes incurred bythe farm business and farm family.
Base Results
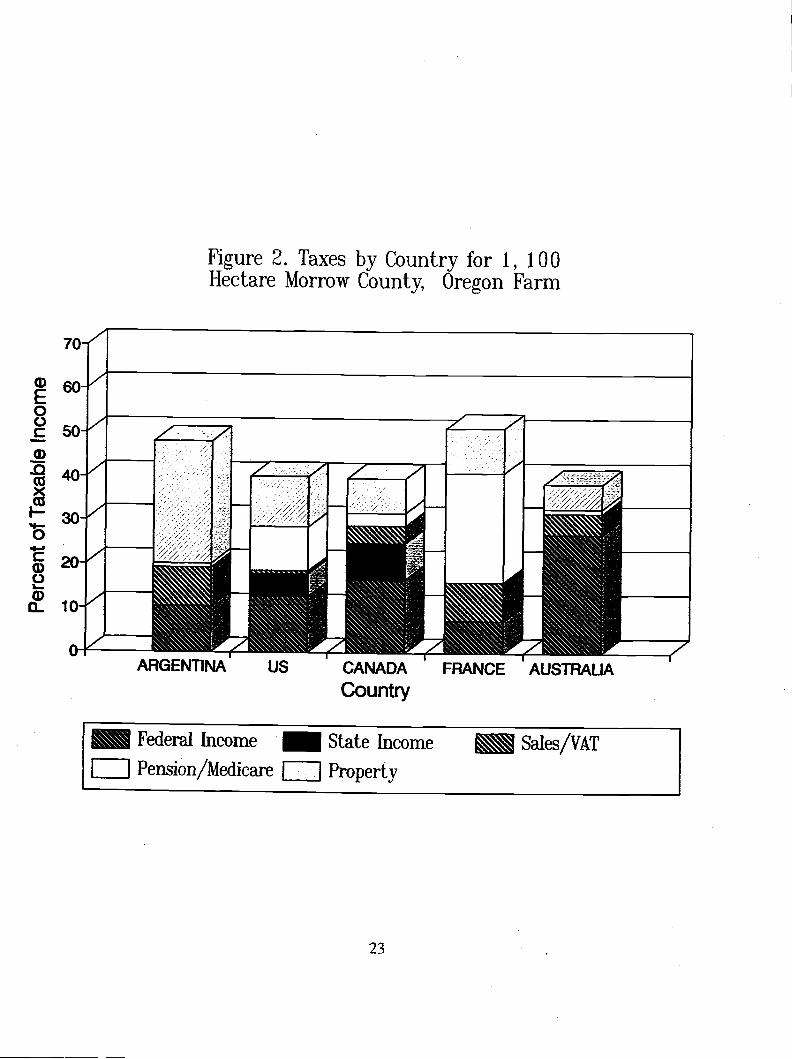
Results for the Oregon farm are presented in Table 4. Income taxes were highest inAustralia, followed by Canada and the United States. Income taxes were lowest under theFrench tax system. Social program taxes in France, however, were over twice those of thenext highest country (United States). Social program taxes in Argentina and Australia wereminimal. Sales and excise taxes were also highest in France, closely followed by Argentina.The lack of a sales tax in Oregon accounted for the low sales and excise taxes in the UnitedStates. As expected, Argentina had the highest property tax burden. Nonetheless, the Frenchhad the highest overall tax burden ($38,329). The four other countries had overall taxliabilities of about $30,000. Figure 2 provides a graphical comparison of results for theOregon farm, indicating the share of taxable income captured by different taxes in eachcountry.
The Argentine and U.S. social program benefits, such as family allowance payments andreduced health insurance, were the smallest among the five countries, whereas the Frenchsocial programs provided the greatest benefit. By netting the tax law and the social programbenefits, the country with the most advantageous impact on farm net worth was determined.
'3Payments into the CPP are reported as a tax in the results to make comparisons consistent with othercountries.
21

Table 4. Comparison of 1,100 Hectare Morrow County, Oregon, U.S. Farm UnderAlternative Tax Policies and Social Programs in 1991.
'Taxable income is calculated as net cash farm income plus off-farm income, less tax depreciation, deductibleliving expenses, and miscellaneous deductions.2Does not include an average exemption of $18,500 for using an accountant to calëulate returns.
22
Federal Income 7,175. 21,194. 12,337. 5,543. 9,738.
State Income 0. 0. 6,152. 0. 3,975.
Sales, Excise, VAT 5,926. 3,747. 3,074. 6,582. 580.
Pension/Medicare 672. 897. 2,206. 18,571. 7,804.
Property 18,724. 4,490. 5,921. 7,633. 8,871.
Health Insurance 2,400. 580. 760. 0. 3,000.Other Living Expenses 26,380. 26,380. 26,380. 26,380. 26,380.
Add:Family Allowance 0. 0. 753. 3,071. 0.Off-Farm Income 4,200. 4,200. 4,200. 4,200. 4,200.
Equals:Change in Net Worth 6,778. 12,648. 13,184. 6,565. 8,426.Difference from
U.S. Solution -1,648. 4,222. 4,758. -1,861.
Taxable Income' 66,991. 77,835. 73,999. 74,2382. 76,694.
Buenos Aires New South Wales AlbertaArgentina Australia Canada
La Marne OregonFrance United States
Cash Receipts $193,121. $193,307. $193,201. $193,162. $193,237.Cash Expenses 111,738. 110,043. 110,612. 111,631. 111,135.
Net Cash Income 81,383. 83,264. 82,589. 81,531. 82,102.
Noncash Costs 17,528. 17,528. 17,528. 17,528. 17,528.
Net Farm Income 63,855. 65,736. 65,061. 64,003. 64,574.
Less:Tax Payments 32,497. 30,328. 29,690. 38,329. 30,968.
70
cD6oE0C.)c50ci)-Q
o_ 10
40
30
20
0
Figure 2. Taxes by Country for 1, 100Hectare Morrow County, Oregon Farm
23
ARGENTINA US CANADA FRANCE AUSTRALiACountry
Federal Income State Income Sales/VAT
Pension/Medicare Property

For the Oregon farm, the combination of social programs and the tax law system in Canadaprovided the largest gain in net worth, $13,184. Canada was followed in order by Australia,$12,648, the United States, $8,426, Argentina, $6,778 and France, $6,565.
Table 5 contains a summary of the tax comparisons for the New South Wales, Australia farm.Here, the somewhat different asset mix, consumption mix, and debt structure producedunequal taxable income levels. Nevertheless, the relative rankings remained roughly the samebetween countries. The exception was Australia and Canada, which reversed positions as thelow tax country. The Australian system also realized the greatest increase in net worthposition.
The results for the 1,700 hectare Alberta, Canada farm are found in Table 6. Again, taxableincomes were somewhat different because of changes in asset mix, consumer goodspurchases, and debt load. Yet, the relative rankings between the countries were much thesame. In this scenario, the U.S. had the lowest tax burden, followed by Canada andAustralia. The change in net worth favored the Canadian system and was lowest for theArgentine system.
Estimation of Competitive Advantage
Using the theoretical approach described earlier in this report, we can make comparisonsbetween these results to identify which country's taxation policy provides an overallcompetitive advantage. Although farms of similar size were not developed for Argentina andFrance, their position relative to the other countries can be estimated using comparisonsbetween Australian, Canadian, and U.S. farms. The values in Table 7 were calculated usingequation'3 (p. 5), where is net farm income for the country in which the farm is locatedand t[0] is one minus the net average tax rate. The average tax rate is total tax paymentsplus health care costs, less family allowance payments, all of which is then divided by netfarm income. The results underscore the competitive advantage enjoyed by Australian andCanadian farmers vis-à-vis their U.S. counterpart. For example, the tax advantage, asreflected in the change in equity, for the U.S. farm under Canadian tax system favors Canadaby $4,49314 The Canadian farm under the U.S. tax system favors Canada by $2,675. Wecan conclude from this result that, even if either farm were allowed to adapt their productionand management practices so as to best take advantage of the tax law in the other country,Canadian tax law would be preferred over U.S. tax law. A similar statement can be maderegarding Australian tax law vis-à-vis the United States. Canadian tax law also enjoys asmall advantage over Australia.
'4A11 results were calculated using equation 3. When making comparisons for general equilibrium purposes,however, one value must be calculated using equation 4, which meily means a sign change in the result. Hencefor this example $-4,493 from Table 7 was changed to a positive value.
24

Table 5. Comparison of 875 Hectare Moree, New South Wales, Australia Farm UnderAlternative Tax Policies and Social Programs in 1991.
'Taxable income is calculated as net cash farm income plus off-farm income, less tax depreciation, deductibleliving expenses, and miscellaneous deductions.
2Does not include an average deduction of $21,000 for using an accountant to calculate returns.
25
Federal Income 16,116. 27,426. 18,385. 15,768. 19,628.State Income 0. 0. 9,477. 0. 5362.Sales, Excise, VAT 6,320. 4,057. 2,553. 6,558. 390.Pension/Medicare 0. 1,007. 1,499. 23,326. 5,926.Property 16,561. 2,950. 4,688. 5,035. 4,845.
Health Insurance 2,400. 580. 760. 0. 3,000.Other Living Expenses 32,795. 32,795. 32,795. 32,795. 32,795.
Add:Family Allowance 0. 0. 596. 3,071. 0.Off-Farm Income 0. 0. 0. 0. 0.
Equals:Change in Net Worth -9,227. -1,924. -2,244. -13,156. -4,114.Difference from
Australian Solution -7,303. --- -320. -11,232. -2,190.
Taxable Income' 75,445. 76,709. 80,084. 86,4722. 86,982.
Buenos Aires New South Wales AlbertaArgentina Australia Canada
La Marne OregonFrance United States
Cash Receipts $185,047. $184,702. $184,738. $185,103. $185,165.Cash Expenses 96,326. 94,055. 93,665. 94,092. 93,577.Net Cash Income 88,721. 90,647. 91,073. 91,011. 91,588.
Noncash Costs 23,756. 23,756. 23,756. 23,756. 23,756.
Net Farm Income 64,965. 66,891. 67,317. 67,255. 67,832.
Less:Tax Payments 38,997. 35,440. 36,602. 50,687. 36,151.

Table 6. Comparison of 1700 Hectare Warner, Alberta, Canada Farm Under Alternative TaxPolicies and Social Programs in 1991.
'Taxable income is calculated as net cash farm income plus off-farm income, less tax depreciation, deductibleliving expenses and miscellaneous deductions.
2Does not include an average deduction of $13,600 for using an accountant to calculate returns.
26
Federal Income 18,267. 23,742. 13,309. 6,427. 10,331.
State Income 0. 0. 6,598. 0. 4,032.
Sales, Excise, VAT 5,631. 3,921. 2,481. 5,776. 339.
Pension/Medicare 0. 971. 2,238. 20,296. 7,805.
Property 17,980. 7,375. 11,163. 12,538. 12,800.
Health Insurance 2,400. 580. 760. 0. 3,000.Other Living Expenses 29,294. 29,294. 29,294. 29,294. 29,294.
Add:Family Allowance 0. 0. 663. 3,071. 0.Off-Farm Income 0. 0. 0. 0. 0.
Equals:Change in Net Worth -5,307. 4,220. 5,005. -2,739. 2,113.Difference from
Canadian Solution -10,312. -785. -7,744. -2,892.
Taxable Income' 68,653. 80,462. 79,124. 79,5272. 82,042.
Buenos Aires New South Wales AlbertaArgentina Australia Canada
La Marne OregonFrance United States
Cash Receipts $217,924. $217,768. $217,778. $217,965. $217,980.Cash Expenses 127,911. 125,917. 125,872. 127,696. 126,518.
Net Cash Income 90,013. 91,851. 91,906. 90,269. 91,462.
Noncash Costs 21,748. 21,748. 21,748. 21,748. 21,748.
Net Farm Income 68,265. 70,103. 70,158. 68,521. 69,714.
Less:Tax Payments 41,878. 36,009. 35,762. 45,037. 35,307.
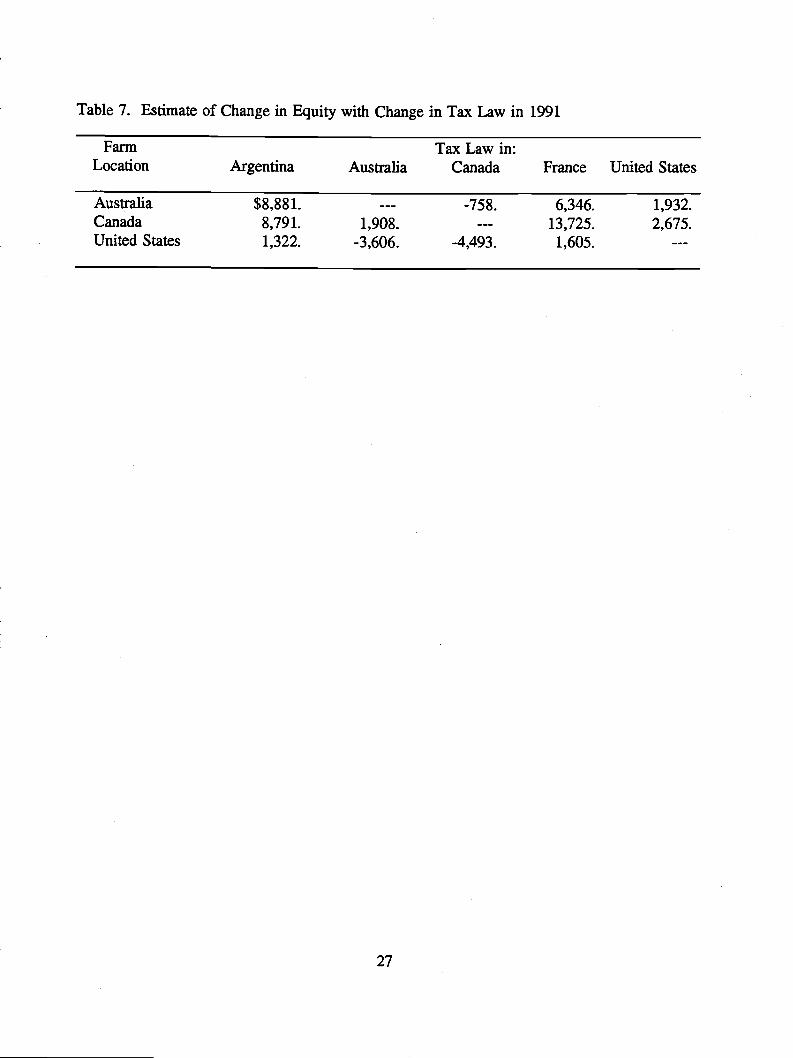
Table 7. Estimate of Change in Equity with Change in Tax Law in 1991
Farm Tax Law in:Location Argentina Australia Canada France United States
27
Australia $8,881. -758. 6,346. 1,932.Canada 8,791. 1,908. 13,725. 2,675.United States 1,322. -3,606. -4,493. 1,605.

The change in net worth values can be difficult to interpret because they are so dependent onthe scale of the farms analyzed. Another approach is to find the change in per metric tonnecost for the U.S. farm that would generate a change in net worth reflecting the samedifferences as reported in Table 7. Using this approach, the Canadian system provides a$4.94ltonne advantage. In other words, production costs for wheat and barley on the Oregonfarm would have to fall by $4.94/tonne to offset the advantage the Canadian farm has intaxation and social programs. The other per tonne values for the Oregon farm are: Argentina,-$6.30; Australia, $4.14; and France, -$6.68.
Comparison by Farm Size
The results presented in Tables 4-6 represent the impact of taxation and social programspolicy on one particular farm size in Australia, Canada, and the United States. An equallyimportant question relates to tax incidence. That is, how is the burden of taxes sharedbetween farms with different income levels.
Insufficient resources were available to develop several representative farm situations for eachcountry in the analysis. As an alternative, two additional hypothetical farm situations fromAlberta, Canada, developed for a previous study (Perry et. al) were combined with the U.S.farm and Argentine farm to represent a wide spectrum of income levels. A weakness in thisanalysis is the inclusion of farms from three different countries, rather than having all farmscome from one country. For example, it is expected that government policies, climate, soils,and so forth will cause farm asset mixes and production practices to differ substantiallybetween countries. In fact, practices in the United States and Canada are sufficiently similarthat this issue should not cause a large bias in results. Comparisons between the Argentinefarm and those in Canada and the United States should be treated with more caution,however.
Table 8 summarizes results for a small (380 hectare) farm located in Alberta, Canada. Again,the Canadian and Australian systems were preferred. France's system offered the next bestalternative for the small farm. In this scenario, the value of social programs relative to farmreturns and living expenses was much larger than in previous analyses. By comparison, thelack of social programs in the U.S. caused a downward shift in its net worth rankings. TheArgentine system continued to offer the worst combination of tax and social programs.
Results for a larger 850 hectare farm in Alberta, Canada are contained in Table 9. In thisscenario, the Australian system has the highest change in net worth, followed by Canada,France, the United States, and Argentina. Table 10 provides a summary of the results for theArgentine farm. In comparison to the other farms, the Argentine farm reflects a low inputcost production approach. The Argentine farm also has virtually no debt. The result is ahighly profitable operation with a large taxable income. The results were quite differentunder this scenario, with the systems in the United States and France registering the largestchange in net worth, followed by Argentina, Australia, and Canada. The progressive incometax schedules of Canada and Australia were largely responsible for their poor performance.
28
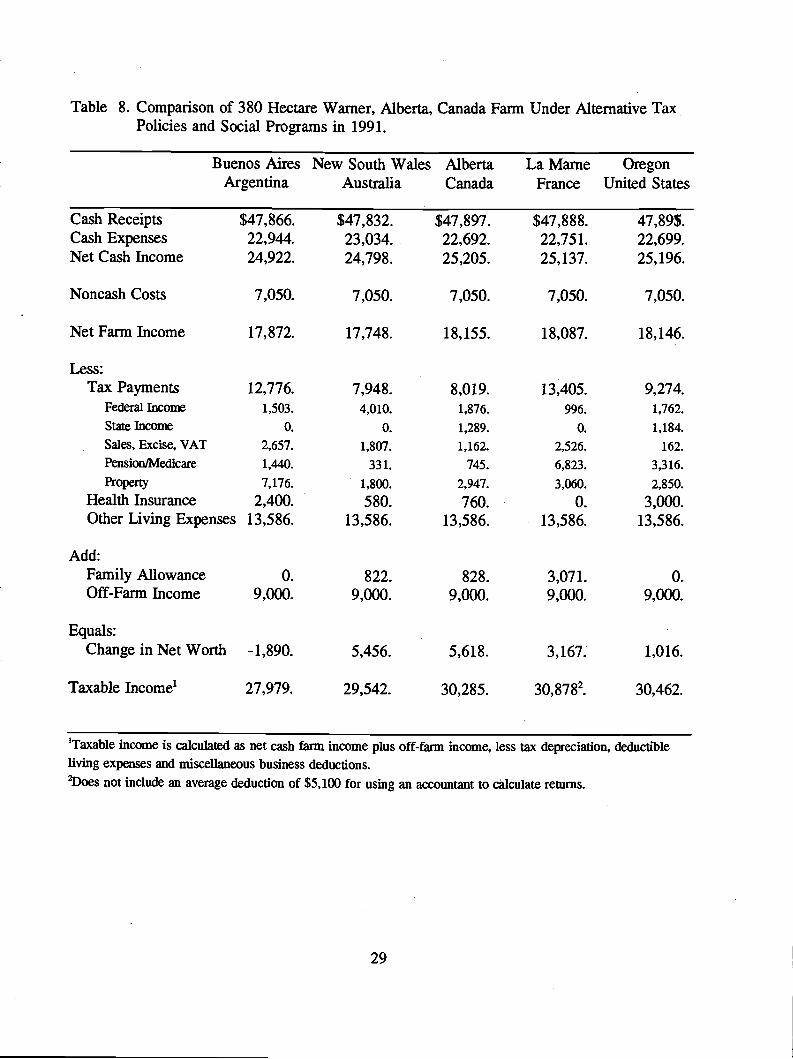
Table 8. Comparison of 380 Hectare Warner, Alberta, Canada Farm Under Alternative TaxPolicies and Social Programs in 1991.
'Taxable income is calculated as net cash farm income plus off-farm income, less tax depreciation, deductibleliving expenses and miscellaneous business deductions.
2Does not include an average deduction of $5,100 for using an accountant to calculate returns.
29
Federal Income 1,503.
State Income 0.
Sales, Excise, VAT 2,657.
Pension/Medicaie 1,440.
Property 7,176.
Health Insurance 2,400.Other Living Expenses 13,586.
4,010.
0.
1,807.
331.
1,800.
580.13,586.
1,876.
1,289.
1,162.
745.
2,947.
760.13,586.
996.
0.
2,526.
6,823.
3,060.
0.13,586.
1,762.
1,184.
162.
3,316.
2,850.
3,000.13,586.
Add:Family Allowance 0. 822. 828. 3,071. 0.Off-Farm Income 9,000. 9,000. 9,000. 9,000. 9,000.
Equals:Change inNetWorth -1,890. 5,456. 5,618. 3,167. 1,016.
Taxable Income' 27,979. 29,542. 30,285. 30,8782. 30,462.
Buenos Aires New South Wales AlbertaArgentina Australia Canada
La Marne OregonFrance United States
Cash Receipts $47,866. $47,832. $47,897. $47,888. 47,89$.Cash Expenses 22,944. 23,034. 22,692. 22,751. 22,699.Net Cash Income 24,922. 24,798. 25,205. 25,137. 25,196.
Noncash Costs 7,050. 7,050. 7,050. 7,050. 7,050.
Net Farm Income 17,872. 17,748. 18,155. 18,087. 18,146.
Less:Tax Payments 12,776. 7,948. 8,019. 13,405. 9,274.
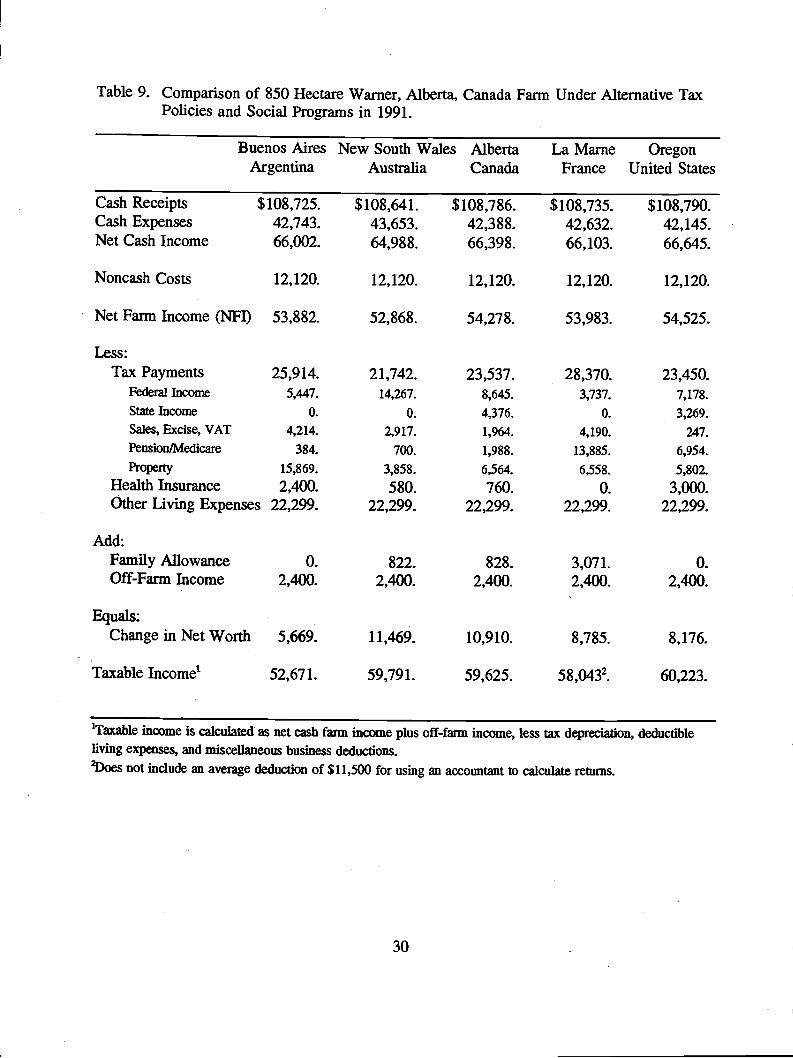
Table 9. Comparison of 850 Hectare Warner, Alberta, Canada Farm Under Alternative TaxPolicies and Social Programs in 1991.
'Taxable income is calculated as net cash fann income plus off-fann income, less tax depreciation, deductibleliving expenses, and miscellaneous business deductions.
2Does not include an average deduction of $11,500 for using an accountant to calculate returns.
30
Federal Income 5,447. 14,267. 8,645. 3,737. 7,178.State Income 0. 0. 4,376. 0. 3,269.Sales, Excise, VAT 4,214. 2,917. 1,964. 4,190. 247.Pension/Medicare 384. 700. 1,988. 13,885. 6,954.Property 15,869. 3,858. 6,564. 6,558. 5,802.
Health Insurance 2,400. 580. 760. 0. 3,000.Other Living Expenses 22,299. 22,299. 22,299. 22,299. 22,299.
Add:Family Allowance 0. 822. 828. 3,071. 0.Off-Farm Income 2,400. 2,400. 2,400. 2,400. 2,400.
Equals:Change in Net Worth 5,669. 11,469. 10,910. 8,785. 8,176.
Taxable Income' 52,671. 59,791. 59,625. 58,0432. 60,223.
Buenos Aires New South Wales AlbertaArgentina Australia Canada
La Marne OregonFrance United States
Cash Receipts $108,725. $108,641. $108,786. $108,735. $108,790.Cash Expenses 42,743. 43,653. 42,388. 42,632. 42,145.Net Cash Income 66,002. 64,988. 66,398. 66,103. 66,645.
Noncash Costs 12,120. 12,120. 12,120. 12,120. 12,120.
Net Farm Income (NFl) 53,882. 52,868. 54,278. 53,983. 54,525.
Less:Tax Payments 25,914. 21,742. 23,537. 28,370. 23,450.
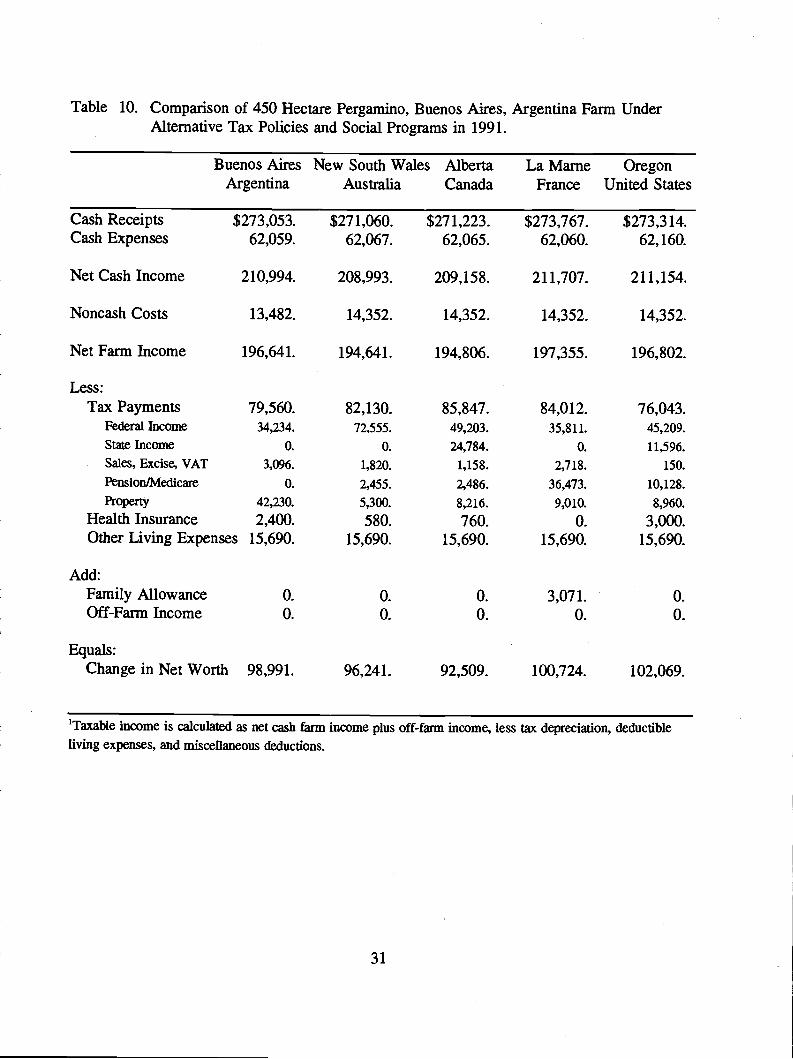
'Taxable income is calculated as net cash farm income plus off-farm income, less tax depreciation, deductibleliving expenses, and miscellaneous deductions.
31
Table 10. Comparison of 450 Hectare Pergamino, Buenos Aires, Argentina Farm UnderAlternative Tax Policies and Social Programs in 1991.
Buenos Aires New South Wales AlbertaArgentina Australia Canada
La Marne OregonFrance United States
Cash Receipts $273,053. $271,060. $271,223. $273,767. $273,314.Cash Expenses 62,059. 62,067. 62,065. 62,060. 62,160.
Net Cash Income 210,994. 208,993. 209,158. 211,707. 211,154.
Noncash Costs 13,482. 14,352. 14,352. 14,352. 14,352.
Net Farm Income 196,641. 194,641. 194,806. 197,355. 196,802.
Less:Tax Payments 79,560. 82,130. 85,847. 84,012. 76,043.
Federal Income 34,234.
State Income 0.
Sales, Excise, VAT 3,096.
Pension/Medicare 0.
Property 42,230.
72,555.
0.
1,820.
2,455.
5,300.
49,203.
24,784.
1,158.
2,486.
8,216.
35,811.
0.
2,718.
36,473.
9,010.
45,209.
11,596.
150.
10,128.
8,960.Health Insurance 2,400. 580. 760. 0. 3,000.Other Living Expenses 15,690. 15,690. 15,690. 15,690. 15,690.
Add:Family Allowance 0. 0. 0. 3,071. 0.Off-Farm Income 0. 0. 0. 0. 0.
Equals:Change in Net Worth 98,991. 96,241. 92,509. 100,724. 102,069.

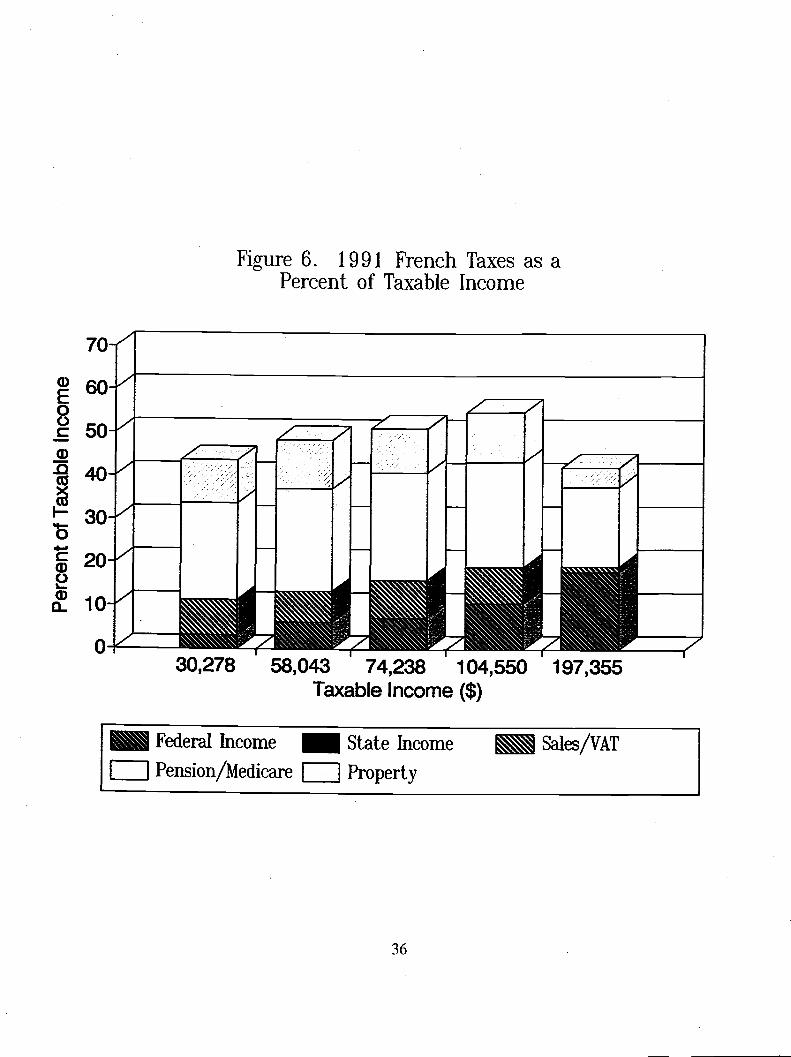
Figures 3-7 summarize tax incidence for the five countries analyzed. Tax policy in Canadaand Australia distributes most of the tax burden on the higher income farmers, particularlywhen the social program benefits are netted out. For example, taxes, net of social programbenefits in Australia and Canada, constitute only 16 percent of taxable income. On the otherhand, the French tax provisions provide a higher, more even, tax burden across income levels.Substantial social programs also reduce the net tax burden for French farmers earning lowerincome. At the lowest income level, French taxes, net of social program benefits, represent24 percent of taxable income. Similarly, Argentine tax burdens tend to be more or lessconstant across all income levels, but with no social programs to ease the burden for smallerfarms. Finally, taxes, net of social programs, begin at a higher level, 30 percent, in theUnited States than in all countries but Argentina. The overall effective tax rate rises slowlywith income, suggesting that U.S. tax incidence tends to fall more on the middle income levelrelative to other countries.
Corporate Organizational Form
The final analysis in the study focused on the corporate organizational form. Corporationsare treated as a separate entity for taxation purposes, making a comparison betweencorporations and other business forms potentially misleading. The Oregon, U.S. farm wasrestructured to reflect a regular corporation business organizational form, with the farmer andspouse as sole shareholders. To assure a fair comparison between corporate and noncorporateorganizations, it was assumed that the farmer and spouse received a salary from thecorporation equivalent to the withdrawals they were making from the farm under a soleproprietorship. In other words, the salary was equal to net family withdrawals for livingexpenses plus federal, state and local income taxes withheld by the corporation as part oftheir salary. Results for the corporate farm are summarized in Table 11. Incorporation wasvery costly under the Argentine tax system, largely because the corporation was now forcedto participate in the government's social programs. The Australian farm realized a small($2,100) increase in net worth relative to the unincorporated farm, the result of lower federalincome taxes and the ability to qualify for family allowance payments. The change in networth increased substantially ($5,800) for the Canadian farm, mostly the result of lowerfederal and state income taxes. The corporate organizational form made the farmer worse offunder French tax law, with higher social program taxes contributing to most of the higher taxburden. The U.S. tax provisions had an effect on the farm similar to that under the Canadiantaxation structure. Significant tax savings for income and social program taxes all contributedto a more favorable U.S. tax situation than was the case under a sole proprietorship. Overall,the Canadian farm was in the best net worth position under the corporate scenario, withAustralia and the United States in the middle. France and Argentina were much farther backin the rankings than was the case under the sole proprietorship analysis.
32

70
cD
E00c5040
30
0
Figure 3. 1991 Argentine Taxes as aPercent of Taxable Income
I.. 'rI"2>1 I;1'- - - - X'2-- -://'Ill !
27,979 52,671 66,991 94,459 210994Taxable Income ($)
33
Federal Income State Income Sales/VAT
Pension/Medicare Property

70
CD
E00c50U)
-°40
20
cilO
30
0
Figure 4. Australian Taxes as aPercent of Taxable Income
29,542 59,791 77,835 105,669 194641Taxable Income
34
Federal Income State Income Sales/VAT
Pension/Medicare Property

70
ci)
E0C-)c50ci)
-o('Sx('S
F-
0
ci)
2ci)a10
0
Figure 5. 1991 Canadian Taxes as aPercent of Taxable Income
I__________
1111
30,285 59,791 73,999 104,565 194,806Taxable Income ($)
35
Federal Income State Income Sales/VAT
Pension/Medicare Property
70-"a)
050"
CD.0 iA"(T130-vA..V
0a'!
Figure 6. 1991 French Taxes as aPercent of Taxable Income
30,278 58,043 74,238 104,550 197,355Taxable Income ($)
36
Federal Income State Income Sales/VAT
Pension/Medicare Property

70-"
60-"
50-"
40-"
30
20-"
10-"
0
Figure 7. 1991 U.S. Taxes as a Percentof Taxable Income
30,462 60,223 76,694 108,226 196,802Taxable Income ($)
37
Federal Income State Income Sales/VAT
Pension/Medicare Property

Table 11. Comparison of 1,100 Hectare Morrow County, Oregon, United States Farm UnderAlternative Tax Policies and Social Programs-Corporate Business Organization 1991
38
Buenos Aires New South Wales AlbertaArgentina Australia Canada
La Marne OregonFrance United States
Cash Receipts $193,094. $193,308. $193,248. $192,667. $193,222.Cash Expenses 111,803. 127,566. 110,531. 112,540. 111,161.
Net Cash Income 81,291. 83,267. 82,717. 80,124. 82,061.
Noncash Costs 17,906. 17,525. 17,525. 17,525. 17,525.
Net Farm Income 63,385. 65,742. 65,192. 62,599. 64,536.
Less:Tax Payments 56,858. 29,088. 24,153. 41,674. 25,739.
Federal Income 5,749. 11,180. 5,504. 5,194. 3,683.
Federal Corporate 2,025. 9,062. 3,460. 602. 3,742.
State Income o. 0. 2,770. 0. 2,236.
State Corporate 0. 0. 1,617. 0. 1,245.
Sales, Excise, VAT 5,926. 3,747. 3,074. 6,582. 339.
Pension/Medicare 17,629. 609. 1,807. 21,663. 5,623.
Property 25,529. 4,490. 5,921. 7,633. 8,871.
Health Insurance 0. 580. 760. 0. 3,000.Other Living Expenses 26,380. 26,380. 26,380. 26,380. 26,380.
Add:Family Allowance 4,053. 822. 828. 3,071. 0.Off-Farm Income 4,200. 4,200. 4,200. 4,200. 4,200.
Equals:Change in Net Worth -11,600. 14,716. 18,927. 1,816. 13,617.

Summary and Conclusions
The objective in this study was to investigate how tax and social programs influence thecompetitive position of wheat farmers in world export trade. Particular focus was on the fivecountries that dominate the world wheat trade, Argentina, Australia, Canada, the EuropeanCommunity (France) and the United States. Representative farms were developed forArgentina, Australia, Canada, and the United States. A Monte Carlo simulation model wasthen used to analyze the impact of tax and social programs in these countries plus France.The results suggest that, in most cases, tax and social programs provide an overallcompetitive advantage to Canadian wheat farmers. The tax situation for small and mediumsized Australian wheat farms enables them to be generally competitive with the Canadian taxsituation. The Argentine and U.S. tax laws seem to favor larger farm operations. Medium-sized Canadian and U.S. farms substantially benefit from incorporation, with Argentine andFrench farms left worse off from a tax standpoint.
Tax incidence also varies substantially from country to country. Argentine taxes tend to fallheavier on lower income farmers when compared to other countries. The Australian tax lawclearly shifts most of the tax burden to higher income families, with social programs aimed atfurther reducing the tax impact on lower income families. Canadian tax incidence mirrorsthat in Australia, although incorporation clearly can reduce taxes for high income farmers.The tax burden overall appears to fall most heavily on the medium income farmers. The U.S.tax system tends to shift more tax responsibility onto the lower income farmer, particularlywhen the benefit of incorporation is included.
A number of simplifying assumptions in the study are critical in analyzing the results. Costof living estimates were tied to the farm, rather than the country being analyzed for taxpurposes. Family living expenses were not influenced by farm income within a particularyear. Farms under both Australian and Canadian tax laws were assumed to manage their tax-exempt retirement funds to maintain a relatively level expected fund balance. Thisassumption was particularly important for the Australian tax scenarios because the beginningfund balance was so low relative to the limits placed by the government on the fund balance.Australian farmers, for example, can substantially increase their after-tax financial position byallowing their tax-exempt fund to grow over time and then withdraw it at retirement. Also,tax benefits would increase if the beginning fund balance were larger, even if the fund weremanaged to maintain the same expected balance over time.
The farm situations considered in this study were typical of the state or province in whichthey were located. For some countries, such as Canada, these farms may also be a reasonableapproximation of average wheat farms nationally. In other countries, such as the UnitedStates, farm size and production practices vary substantially from region to region. Inaddition, state and local taxes also vary from location to location. Consequently, these resultsmust be interpreted with some caution. On the other hand, the approach outlined here couldbe extended across the major wheat producing areas in each country to determine howcompetitive each area is relative to the international market.
39

No attempt has been made to separate tax subsidies from the natural competitive positionafforded by tax policy. For example, virtually all U.S. states allow for farm land to beassessed at less than market value, resulting in lower property taxes than would be paid onthe same land in a non-agricultural use. This property tax break is as much a subsidy as anyfarm program payment and thus should be included in GATT negotiations. Other tax andsocial program benefits clearly do not belong in trade negotiations, although they will have animpact on trade. For example, the structure of Australian medicare taxes provides Australianswith a competitive advantage relative to France and the United States. Yet, this is a benefitenjoyed by all Australians. Other tax advantages fall into a grey area where their inclusion insubsidy measures is questionable. For example, the ability of Canadians to create husband-wife partnerships as a tax avoidance scheme is not limited to agriculture, but is restricted tofamily business situations where some sharing of work and (or) assets is feasible.Consequently, only a small percent of the Canadian population overall can qualify for this taxbenefit.
The analyses reported here are for a single year. Tax depreciation and treatment of capitalgains are best analyzed in a multiple-year framework. Such an approach is beyond the scopeof this study, however.
Government debt positions also significantly influence how tax policies are likely to changeover time. For example, the Argentine, Canadian, and U.S. governments hold a substantialquantity of public debt. Argentina recently began restructuring its government expendituresand revenue collections to reduce this debt, whereas the United States and Canada continue toexpand their public debt obligations. Australia and France are at the other extreme, withrelatively low public debt obligations. Given that tax increases in the United States andCanada will likely be used to address the public debt situation, this analysis suggests that theFrench and Australian governments are well-positioned from a tax perspective to compete ininternational markets with Argentina, Canada, and the United States.
The role of government intervention in international trade is generally viewed from a subsidystandpoint. This study focused on types of government intervention (tax and social programs)typically not addressed in trade talks. This study demonstrates that the impact of tax anddomestic social programs on the ability of farmers to compete in international markets shouldbe considered. The amount and form of subsidies to farmers are important in determiningtheir overall economic well-being in an increasingly competitive international environment.The significant differences in tax provisions and social programs among the study countriesand their relative impact on wheat producers suggests that ignoring these factors could lead toincomplete trade agreements.
40
References
Bureau of the Census. Statistical Abstract of the United States: 1990. (110th edition).Washington: Government Printing Office. January 1990.
CCH Australia Limited. Australian Sales Tax Legislation. 6th edition, January 1988.
Chambers, Robert G. and Ramon E. Lopez. "Tax Policies and the Financially ConstrainedFarm Household." American Journal of Agricultural Economics 69(1987):369-377.
Cross, T. Estimation of Agricultural Machinery and Equipment Depreciation Using FlexibleFunctional Forms. Unpublished Ph.D. Dissertation, Oregon State University, Corvallis.June 1991.
Growing Together. A Report to Ministers of Agriculture Task Force on Competitiveness inthe Agri-Food Industry, Lany J. Martin (Task Force Chairperson). Working GroupReports, June 1990.
Hofferber, Michael. "Olson: Environmental inequities favor Mexico", Capital Press, October2, 1992, p. 9.
McKeltine, Wayne. Assessor, Warner Municipal District, Warner AL. Telephoneconversation, January 1990.
Moore, Tam. "Farm Bureau Economist Urges Support for GATF," Capitol Press, 6 March1992, p. 3.
Perry, G.M., C.J. Nixon and K.J. Bunnage. "Taxes, Farm Programs, and CompetitiveAdvantage for U.S. and Canadian Farmers: A Case Study." American Journal ofAgricultural Economics 74(1992):299-309.
Perry, G.M., C.J. Nixon, K. Bunnage and R. Batterham. An Analysis of CompetitiveAdvantage Between the United States, Canada, and Australia for Wheat Production.Special Report 884, Agricultural Experiment Station, Oregon State University,Corvallis. September 1991.
Prentice-Hall, Inc. Prentice-Hall Federal Taxes. Report Bulletin, V67, No. 21. InglewoodCliffs, N.J. May 1, 1986.
Sharples, J. "Cost of Production and Productivity in Analyzing Trade and Competitiveness."American Journal of Agricultural Economics. 72(1990): 1278-82.
Statistics Canada. Survey of Consumer Expenditures. 1990.
41

U.S. Department of Labor, Bureau of Labor Statistics. Consumer Expenditure Survey:Quarterly Data from the Interview Survey. Fourth Quarter, 1990, Report 818.
Yates, Scott A. "WSU economists debate pros, cons of free trade agreement", Capital Press,October 2, 1992, p. 9.
42