the effect of tailings characteristics on cover system success (or: what have we learned in 40...
TRANSCRIPT

The Effect of Tailings Characteristics on Cover System Success
(or: What have we learned in 40 years?)
Monisha Banerjee Michael Milczarek
Jason KellerTzung-mow Yao Meg Buchanan
Thanks to Freeport McMoRan, BHP Billiton, ASARCO
Physical, Geochemical and Spatial Tailings Characteristics

Physical Characteristics• Tailings are poorly graded
– Mostly silt size– No soil structure
• Highly erosive (high intensity precipitation/wind)• Impoundment construction results in additional sorting
and layering– beach (sands)– slimes (silts)– mixed areas
• Moisture retention and permeability varies by material types
• Variable saturation and drainage

Tailings Segregation and Structure
Slimes (silt)
Beach (sand)
MixedZone
(sand & silt)
Geochemical Characteristics
• Can be moderately saline to hyper-saline• Ore body mineralogy can result in:
– High acid generation potential (and acidity) with high plant available metals (i.e. arsenic)
– Moderate salts with no/ low plant-available metal content
• Typically low plant nutrient content • Lack of organic matter and microbiota

To Cap or Not To Cap?

Reclamation Goals and Methods
Goals:• Establish vegetation• Minimize erosion and stabilize tailings• Minimize deep percolation
Methods:• Soil covers • Direct revegetation w/
tailings amendments

• ASARCO Mission Tailings No. 6 (1983: 12-inch cover)• ASARCO Mission San Xavier Tailings 1,2, 3 (2011: 12 inch cover)• Eagle Pitcher Mill site (1960s, 1989-92: 12-inch cover)• Twin Buttes Tailing No. 2 (1986: 12-inch cover)• Phelps Dodge Sierrita Esperanza Tailings (1986: 12-inch cover)• San Manuel PS Tailings Impoundment 1/2 (1991-92: 6 to 8 inches
cover)• San Manuel Tailing Impoundments 1-6 (2008: 12-inch cover)• San Manuel PS experimental biosolid plots (1998: no cover)• McCabe Mine Tailings (1996: 24 inch cover)• Phelps Dodge Morenci Tailings 4W experimental test plots (1997:
12 to 24-inch of cover)• Freeport McMoran Copper Queen CTSA Tailings (2012: 24 inch
cover)
Previously Reclaimed Tailings Surfaces (in AZ)
AcidPotentially Acid Generating
Circumneutral

Matrix Approach
Cover Depth

Vegetation on Reclaimed Tailings

ASARCO Mission Tailings


Vegetation in 2005No cover. Biosolid/green waste amended
San Manuel Circum-neutral
Mixed zone/ Slimes TailingsReclaimed in 1999

Vegetation in 200530-cm cover, reseeding/mulching,
hand planting
San ManuelCircum-neutral Tailings,
Beach/Mixed Reclaimed in 1999

Vegetation in 2007 30-cm cover, reseeded, 21 ton/acre biosolids,
MorenciAcid tailings, Side-slope
Reclaimed in 1998

30 cm Cover vs. 60 cm Cover
1999 2002 2005 20080.0
0.1
0.2
0.3
0.4
0.5
0.6
0.7
0.8
0.9
1.0
30 cm Cover
60 cm Cover
Year
To
tal V
eg
eta
tion
Gro
un
dco
ver A
AA
AAAA
A
Different letters indicate significant differences

Rooting Characteristics


Vegetation Considerations• Rooting characteristics:
– Actively root into circum-neutral tailings– Minor rooting into moderately acid tailings, primarily limited to
cover and upper one foot of tailings – Form dense root mat above cover/acid tailings contact– Affected by tailings permeability
• Vegetative success generally greater in mixed zone than in beach areas and slime areas
• Vegetation characteristics varies with location (e.g. slimes vs. sands)

Vegetation Considerations (cont’d)
• Effect of cover depth– Nominal differences in vegetative covers > 30 cm thick– BUT native species perform better on thicker covers
• Effect of organic amendments:– Can successfully reclaim raw tailings with a biosolids/green waste
(compost) mix– Results in significantly greater mean vegetation cover; however,
less species diversity – In some cases, observed effects sustained for over 10 years
• Side slopes may require rock armoring; only seeded cover material may not adequately stabilize slopes
Low-pH and Saline Solution Migration into Monolayer
Covers?
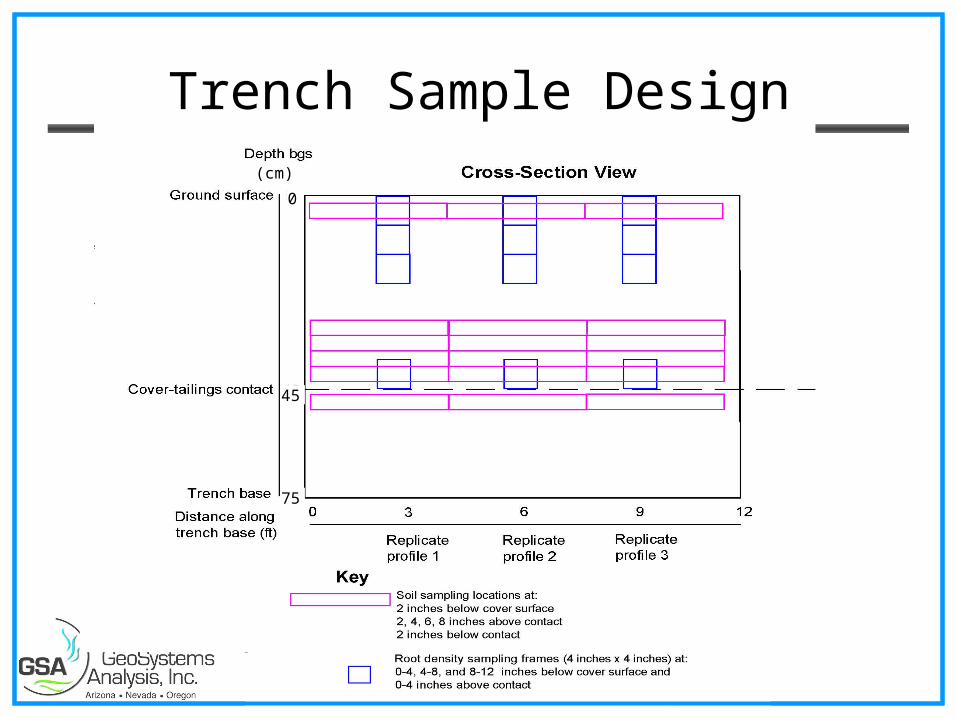
0
45
75
(cm)
Trench Sample Design

pH Profiles
-15
-10
-5
0
5
10
15
20
25
30
35
40
45
50
55
60
65
0 1 2 3 4 5 6 7 8 9
pH
Avg
Sa
mp
le E
leva
tion
Re
lativ
e to
Co
nta
ct (
cm)
SW2 (1% pyrite tailing, 15% ANP Cover, 10 years)
CTSA Demonstration (8% pyrite tailing, 14% ANP Cover, 7years)CTSA South Slope (8% pyrite tailing, 5% ANP cover, 19years)4W - 60 cm (5% pyrite tailing, 3.5% ANP cover, 10 years)
Cover-Tailings Contact
TypicallyPhytoxic
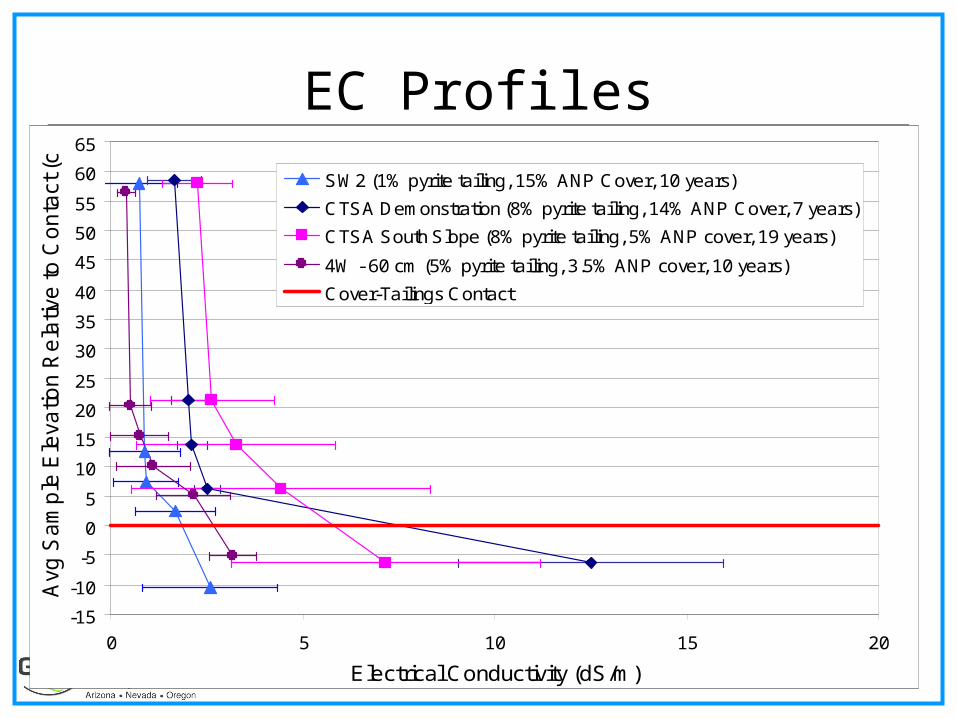
EC Profiles
-15
-10
-5
0
5
10
15
20
25
30
35
40
45
50
55
60
65
0 5 10 15 20
Electrical Conductivity (dS/m)
Avg
Sa
mp
le E
leva
tion
Re
lativ
e to
Co
nta
ct (
cm)
SW2 (1% pyrite tailing, 15% ANP Cover, 10 years)
CTSA Demonstration (8% pyrite tailing, 14% ANP Cover, 7 years)
CTSA South Slope (8% pyrite tailing, 5% ANP cover, 19 years)
4W - 60 cm (5% pyrite tailing, 3.5% ANP cover, 10 years)
Cover-Tailings Contact

Tailing/Cover Contact

Acid and Salinity Migration Considerations
• In a semi-arid environment salinity and acid migration observed in Southwest US environment to be limited to ≈ 15 cm above contact
• Phytotoxic levels of pH and salinity in cover material generally absent ≈ 5 cm above contact
• Increased migration above contact with decreased cover thickness (30 vs. 60 cm)
• Acidity and salinity migration may be limited due to:– Unsaturated hydraulic conductivities and upward flux rates
greatly diminish with distance above the contact– High calcium carbonate contents in the cover material can
neutralize low-pH solution

Infiltration/Net Percolation
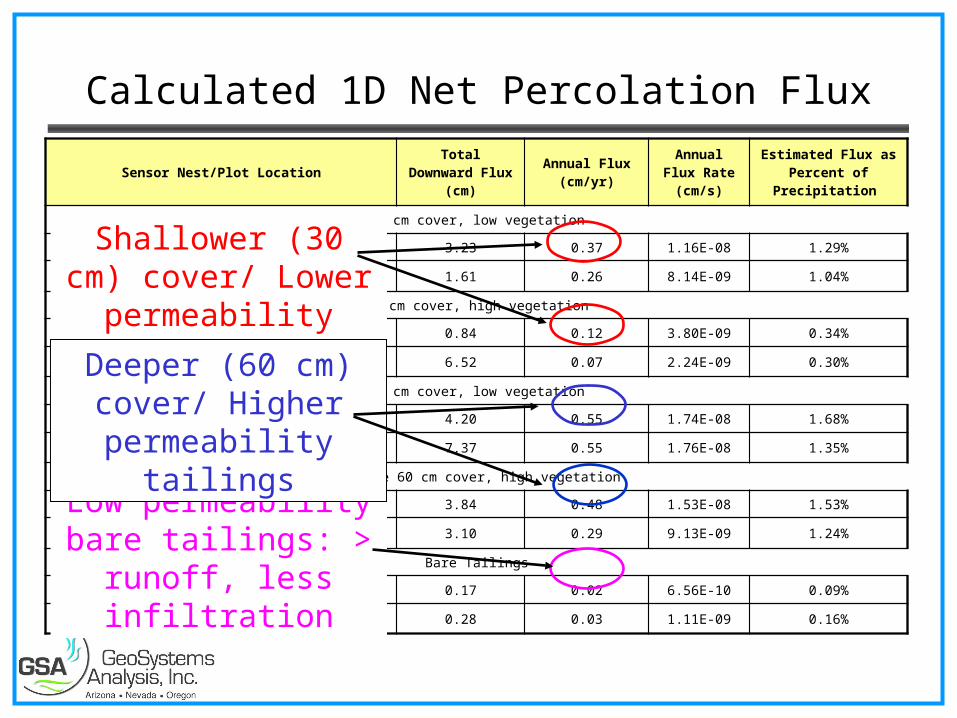
Calculated 1D Net Percolation Flux
Sensor Nest/Plot LocationTotal Downward
Flux (cm)Annual Flux
(cm/yr)Annual Flux Rate (cm/s)
Estimated Flux as Percent of
Precipitation
30 cm cover, low vegetation
Average (3 to 2 nests) 3.23 0.37 1.16E-08 1.29%
Standard Deviation 1.61 0.26 8.14E-09 1.04%
30 cm cover, high vegetation
Average (3 to 2 nests) 0.84 0.12 3.80E-09 0.34%
Standard Deviation 6.52 0.07 2.24E-09 0.30%
60 cm cover, low vegetation
Average (3 to 1 nest) 4.20 0.55 1.74E-08 1.68%
Standard Deviation 7.37 0.55 1.76E-08 1.35%
Average 60 cm cover, high vegetation
Average (3 to 2 nests) 3.84 0.48 1.53E-08 1.53%
Standard Deviation 3.10 0.29 9.13E-09 1.24%
Bare Tailings
Average (3 nests) 0.17 0.02 6.56E-10 0.09%
Standard Deviation 0.28 0.03 1.11E-09 0.16%
Shallower (30 cm) cover/ Lower
permeability tailings
Low permeability bare tailings: > runoff, less
infiltration
Deeper (60 cm) cover/ Higher
permeability tailings

Predicted Effect of Increasing Cover Thickness
0.0
1.0
2.0
3.0
4.0
5.0
6.0
7.0
8.0
30 40 50 60 70 80 90 100
Cover Depth (cm)
Avera
ge A
nn
ual N
et
Perc
ola
tio
n (
mm
/yr) Tailings Ksat = 3.2E-4 cm/s
Tailings Ksat = 2.2E-5 cm/s
Tailings Ksat = 2.2E-6 cm/s
Tailings Ksat = 2.2E-7 cm/s
Tailing sideslope
Tailing beach
Tailing slimes

Net Percolation Considerations• Lower permeability tailings reduce net percolation• Increasing cover thickness can have less influence on
net percolation than tailings characteristics • Shallow covers or direct reclaimed tailings can have
less net percolation than deeper covers • Tailings are an integral part of store and release
cover systems and their influence should be considered during cover design

Conclusions
• Circumneutral tailings can be revegetated with organic amendments (if available); net percolation may actually decrease because of low permeability material at surface
• Low permeability tailings serve to slow down infiltration and retain water in cover; can have greater effect on net percolation than cover depth
• Revegetation seed mixes should consider differences between sand and slimes area; deeper covers are better for native seed mixes
• Cover system modeling should acknowledge ET depth into tailings
• Upward acidity and salinity migration into monolayer covers may be limited
