the effect of surface geometry on soccer ball trajectorieseprints.whiterose.ac.uk/98036/1/j_2010_the...
TRANSCRIPT

This is a repository copy of The effect of surface geometry on soccer ball trajectories.
White Rose Research Online URL for this paper:http://eprints.whiterose.ac.uk/98036/
Version: Accepted Version
Article:
Barber, S. and Carré, M.J. (2010) The effect of surface geometry on soccer ball trajectories. Sports Engineering, 13 (1). pp. 47-55. ISSN 1369-7072
https://doi.org/10.1007/s12283-010-0048-x
[email protected]://eprints.whiterose.ac.uk/
Reuse
Unless indicated otherwise, fulltext items are protected by copyright with all rights reserved. The copyright exception in section 29 of the Copyright, Designs and Patents Act 1988 allows the making of a single copy solely for the purpose of non-commercial research or private study within the limits of fair dealing. The publisher or other rights-holder may allow further reproduction and re-use of this version - refer to the White Rose Research Online record for this item. Where records identify the publisher as the copyright holder, users can verify any specific terms of use on the publisher’s website.
Takedown
If you consider content in White Rose Research Online to be in breach of UK law, please notify us by emailing [email protected] including the URL of the record and the reason for the withdrawal request.

Editorial Manager(tm) for Sports Engineering
Manuscript Draft
Manuscript Number: SPEN15R2
Title: The effect of surface geometry on soccer ball trajectories
Article Type: Research Paper
Keywords: Soccer; sports balls; aerodynamics; trajectory; surface roughness.
Corresponding Author: Dr Sarah Barber,
Corresponding Author's Institution:
First Author: Sarah Barber, PhD
Order of Authors: Sarah Barber, PhD; Matt J Carré, PhD
Abstract: Two different measurement techniques are used to examine the effect of surface geometry on
soccer ball trajectories. Five professional players are observed using high speed video when taking
curling free-kicks with four different soccer balls. The input conditions are measured and the average
launch velocity and spin are found to be approximately 24 m/s and 106 rad/s. It is found that the
players can apply more spin (~50%) on average to one ball, which has a slightly rougher surface than
the other balls. The trajectories for the same four balls fired at various velocities and spin rates across
a sports hall using a bespoke firing device are captured using high-speed video cameras, and their drag
and lift coefficients estimated. Balls with more panels are found to experience a higher lift coefficient.
The drag coefficient results show a large amount of scatter and it is difficult to distinguish between the
balls. Using the results in a trajectory prediction programme it is found that increasing the number of
panels from 14 to 32 can significantly alter the final position of a 20m-curling free-kick, by up to 1 m.
Response to Reviewers: These have been discussed and emailed to Dr Strangwood.

The effect of surface geometry on soccer ball
trajectories
S. Barber1
and M.J. Carré2
[1] ETH Zürich, MLJ24, Sonneggstrasse, Zürich 8092, Switzerland.
Phone: +41(0)446326834; Fax: +41(0)446321100; Email: [email protected]
[2] Deparment of Mechanical Engineering, University of Sheffield, Mappin Street, Sheffield, S1 3JD,
UK.
* Page with Personal Information
The effect of surface geometry on soccer ball trajectories
Abstract
Two different measurement techniques are used to examine the effect of surface geometry on
soccer ball trajectories. Five professional players are observed using high speed video when
taking curling free-kicks with four different soccer balls. The input conditions are measured
and the average launch velocity and spin are found to be approximately 24 m/s and 106 rad/s.
It is found that the players can apply more spin (~50%) on average to one ball, which has a
slightly rougher surface than the other balls. The trajectories for the same four balls fired at
various velocities and spin rates across a sports hall using a bespoke firing device are captured
using high-speed video cameras, and their drag and lift coefficients estimated. Balls with
more panels are found to experience a higher lift coefficient. The drag coefficient results
show a large amount of scatter and it is difficult to distinguish between the balls. Using the
results in a trajectory prediction programme it is found that increasing the number of panels
from 14 to 32 can significantly alter the final position of a 20m-curling free-kick, by up to 1
m.
Keywords: Soccer, sports balls, aerodynamics, trajectory, surface roughness
Manuscript (excluding authors' names and affiliations)

1. Introduction
The flight of a ball through the air is a key part of many popular sports, and sports
balls have been studied aerodynamically since Isaac Newton commented on the
deviation of a tennis ball [1]. Soccer is widely regarded as the most popular sport in
the world, and the exact speed, swerve or dip of a soccer ball can be match-deciding.
Recent developments in soccer ball manufacturing technology have led to the
possibility of radical changes in surface geometry and seam configurations. The two
key physical interactions in soccer that can be significantly affected by ball design are
the impact with the foot and flight through the air. The impact performance of a
soccer ball is a stringent criterion for the testing and approval to “International
Matchball Standard” by the governing body, FIFA [2]. All balls have to fall within
certain limits for size, mass and sphericity as well as passing a standard bounce test.
However, neither the surface texture or the panel design are controlled and there are
no official tests for aerodynamic behaviour. Therefore different ball designs can
behave very differently aerodynamically, which can have a significant impact on the
game.
The fundamental aerodynamic phenomena relating specifically to spinning soccer
balls have not been studied previously in great detail. This is mainly because they are
difficult to mount and fit in wind tunnels and because the combination of topspin and
sidespin, which is frequently applied to them, produces swerving and dipping
trajectories that are difficult to measure accurately. Recent wind tunnel experiments
and CFD studies have revealed some interesting phenomena relating to the unsteady
flight of soccer balls launched with low or zero spin [3, 4]. It was found that such
trajectories could swerve significantly several times in the air due to the asymmetry of
the seam patterns. Although these studies provide useful information, wind tunnel
testing is always limited by the fact that the ball has to be held firmly in place to avoid
vibrations being set up, usually by a rear-mounted sting, which will affect the
aerodynamics. Spinning a ball in a wind tunnel raises further challenges in terms of
reducing effects on the air flow. CFD studies, by their very nature, require
simplifications and assumptions to be made which limit the usefulness of the findings
for real-world applications.

Video analysis has previously been carried out for various types of sports ball. Several
estimates were made for baseballs by videoing trajectories from both pitching
machines and real pitches [5, 6], and for volleyballs fired from a machine [7] and real
serves [8]. Trajectory measurements were only used very early on to estimate the drag
coefficient (CD) and lift coefficient (CL) for golf [9] and tennis [10]; today, wind
tunnel tests for these balls are accurate and well established. High-speed video
trajectory measurements have been made of soccer balls fired from a cannon [11, 12,
13, 14], launched from a direct free-kick [15] and thrown [16, 17]. These studies have
not directly compared different ball designs.
The work here involves the direct comparison of the trajectories of different soccer
ball designs in order to understand their aerodynamic behaviour. The two methods
used are player testing and controlled trajectory measurements from a machine.
2. Experimental Methods
2.1 Player Testing
2.1.1 Set-Up
Five youth-team players from an English Premiership club kicked four different balls
from approximately 20 m away from goal and 7.3 m to the left of centre, as shown
schematically in Figure 1. Each ball was kicked once by each player and the players
were not given any opportunity to practise with the balls before testing. The tests took
place on the soccer pitch of a Premiership football club during a training session and
all players had carried out a standard warm-up. The main difference between the four
balls was in the number and shape of the panels (Figure 2). The four balls were all
measured for mass and size and their moments of inertia were calculated using the
bifilar suspension method. The depth of the seams was also measured using a depth
gauge and was found to vary for all the balls. These data are summarised in Table 1,
along with the acceptable ranges for “International Matchball Standard” [2]. All the
balls were inflated to a pressure of 0.9 bar, which was within the recommended range
specified by the manufacturers for each ball.
The players were instructed to curl each ball from the same location every time into a
target net that was draped over the front of the far part of the goal. Camera 1, a

Phantom Photosonics camera (1000 fps), measured the initial direction, velocity and
spin imparted to the balls, and Camera 2, a Phantom Photosonics camera (500 fps),
recorded the position of the balls when they hit the net. The data obtained from
Camera 1 was calibrated using the diameter of the ball as a reference, and the initial
conditions were calculated from positional data taken from specialist in-house
software formed from manual selection of both the centre of the ball and various
markers on the ball surface, for each frame. It was initially thought that ball
deformation and vibration may be a contributing factor in the aerodynamic
performance of footballs. However, in observing the videos it was noted that all the
ball returned to its original shape very soon after being kicked and that no
deformation or structural vibrations were visible in the ball after the first metre of
trajectory. This issue was examined further in some later video testing carried out
under more controlled conditions in a laboratory with the same conclusions drawn.
Deformation and vibration effects were therefore assumed to be negligible and have
no measurable effect on the balls’ trajectories in this study.
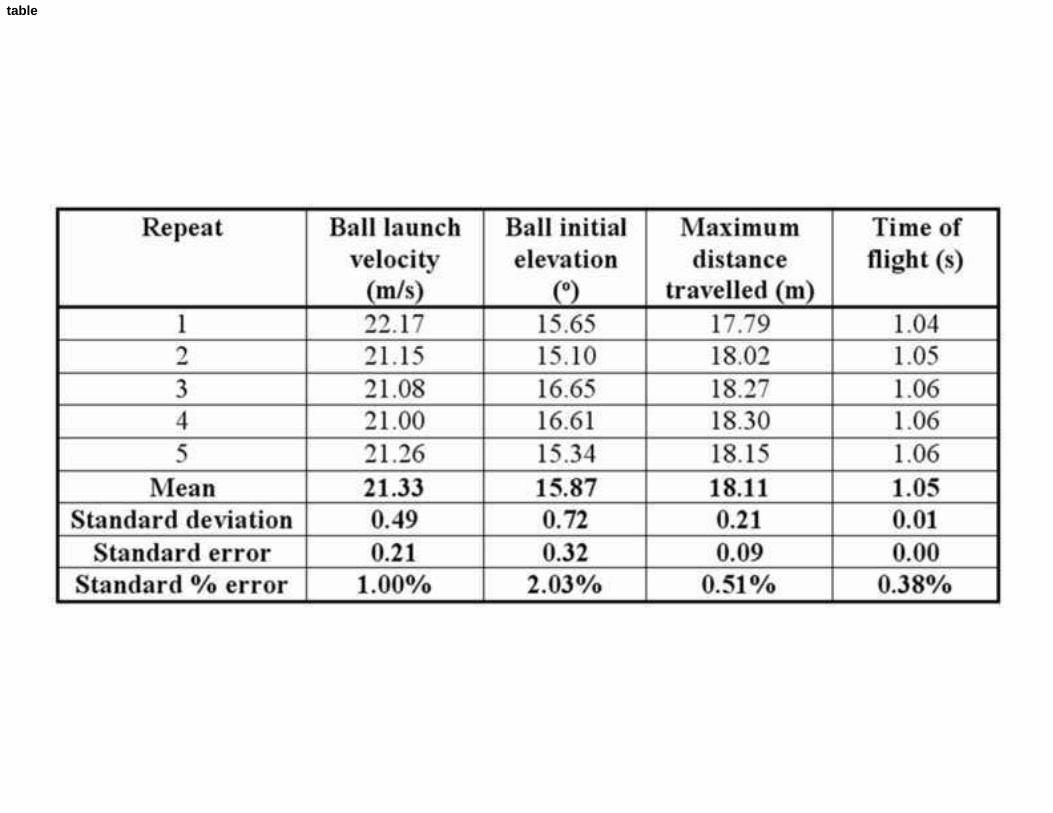
2.1.2 Error Analysis
The main errors in this method were measurement errors, arising primarily from
assuming the ball moved in a plane perpendicular to Camera 1 and from the manual
data selection process. These errors were estimated by repeating the manual process
five times for one player’s data (typical to that measured for all players). This gave
approximate errors as displayed in Table 2, where the standard error is given by the
standard deviation divided by the square root of the number of samples. The angular
velocity was particularly difficult to capture accurately due to the need to track two
separate points that remain visible for at least 10 frames.
2.2 Trajectory Measurements
2.2.1 Set-Up
Trajectory measurements were made on the same four balls that were used in the
player testing, and. a schematic of the set-up is shown in Figure 3. The tests took
place in a sports hall to minimise external effects such as rain and wind. Markers were
placed on the floor at 1 m intervals in line with the ball flight, for calibration
purposes. A ball firing device was used to launch soccer balls in a trajectory within a
vertical plane at various velocities and spin rates. The device, pictured in Figure 4,

can be used to fire a soccer ball with top/back and side spin, but for these
measurements only topspin was used.
A digital video camera was set up behind the ball firing device to check that the
trajectories did not deviate significantly from the vertical plane. The few that did were
disregarded and re-tested. Three high-speed video cameras were used to record the
trajectory of the balls. Camera 1, a Kodak Motion Corder Analyzer Model 1000, was
set up to record the launch conditions at 240 frames per second. Camera 2 and
Camera 3, Phantom Photosonics cameras, recorded portions of the trajectory at 1000
frames per second.
Ideally the cameras should have been perpendicular to the ball (in both horizontal and
vertical directions) so that planar movement related to a linear scale when projected
onto a camera image. This is not possible unless the camera follows the motion of the
ball, which was not feasible in this case. The offset from perpendicular is marked as
in Figure 3; a corresponding angle, , existed in the vertical plane. In order to
minimise , Camera 2 and Camera 3 were positioned as far away from the trajectory
plane as possible; in this case next to the opposite wall of the sports hall. was
minimised by positioning the cameras at heights approximately at the centre of the
ball’s trajectory.
Each ball was fired six times with launch velocities ranging from approximately 14 to
23 m/s and topspins ranging from 3 to 147 rad/s, and the trajectory details recorded.
The initial spin and velocity were obtained from Camera 1 as in the player testing, and
the data from Camera 2 and Camera 3 were calibrated using the markers that were
placed at 1 m intervals on the floor.
For each launch, the positional data obtained from each camera were combined to
produce the complete trajectory by applying a third-order polynomial approximation
using the sum of least squares method; examples are shown in Figure 5. CD and CL
were then estimated by comparison with a mathematical trajectory model, which uses
an iterative method to solve the equations of motion and assumes that CD and CL vary
with the Reynolds Number (Re) and spin ratio (Sp) as found in wind tunnel tests [19].

Note: In this study a scale model of a football was used, but the relationships between
the aerodynamic parameters are assumed to be similar. The spin ratio is given as
shown in Equation 1:
v
rSp
(1)
where r is the ball radius (m), the rotational velocity (rad/s) and v the ball’s velocity
(m/s). The sum of the squares of the differences between the simulated and measured
x and y co-ordinates was calculated, and the sum of these two values minimised by
altering CD and CL iteratively until a converged solution was reached. It was not
possible to repeat this process for every time step and therefore CD and CL were
assumed to be constant throughout the flight.
2.2.2 Error Analysis
Measurement errors arose from assuming the ball moved in a vertical plane with only
one axis of spin, from parallax from the cameras and from human error from the
manual selection process. These errors were estimated by repeating the manual
process five times for one case, as can be seen in Figure 6, giving errors as shown in
Table 3.
The main source of error was thought to be in the assumption of constant CD and CL
and the resulting sum of the squares of the differences approximation method. An
example that demonstrates this procedure is shown in Figure 7, which compares a
fitted trajectory based on measurement data to a simulated trajectory based on
constant CD and CL. All the other predictions showed similar deviations from the
measured data. For this case, the average of the differences in x was 0.03 m (0.18% of
the maximum x) and the average of the differences in y was 0.09 m (3.54% of the
maximum y). The sensitivity of the trajectory to the estimated constant CD and CL
values assigned to a ball was tested by altering CD and CL in turn and observing their
effect on the trajectory. For the example trajectory given in Figure 7, CD and CL were
altered ± 10%, and the resulting trajectories are shown in Figure 8. The x-position at
the end of the trajectory varied from the original trajectory by an average of 1.9%.

3. Results and Discussion
3.1 Player Testing Results
Wind tunnel results presented in a previous study [4] show that there is a certain ball
velocity, above which the drag coefficient suddenly decreases from approximately 0.5
to 0.2 due to laminar-to-turbulent boundary layer transition. The measured launch
conditions for each of the five players tested show comparatively low average
velocities. This means that the ball may well spend some of its flight in the transition
or laminar regime and may suddenly slow down or drop in the air as the CD rises
suddenly. This behaviour is simulated in a parallel study in which the effects of
changing CD on the trajectory were investigated [4].
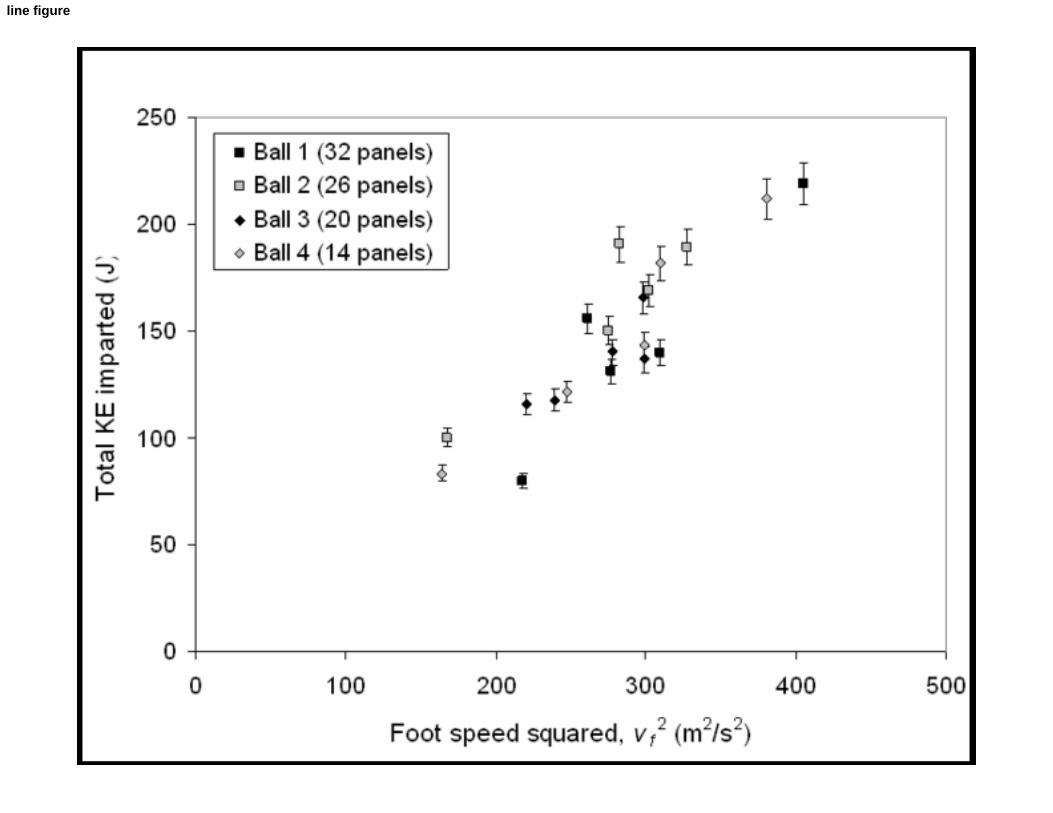
Due to the fact that each player kicked the balls slightly differently and consequently
there was a variation in the velocity and orientation of the foot for each kick, the
overall effectiveness of each kick was compared by calculating the total Kinetic
Energy (K.E.) imparted to each ball, using Equation 2:
22 2121.. ImvEK b (2)
where m = mass of ball (kg), vb = launch velocity of ball (m/s), I = moment inertia of
ball (kg/m2) and = angular launch velocity of ball (rad/s).
It was not possible to come up with an estimate of the K.E. of the foot before impact,
due to difficulties in estimating the effective mass of the foot and the error due to
variation between the players. Therefore the total K.E. imparted to the ball was
plotted against foot velocity squared (vf2) (Figure 9), showing that in general K.E.
increased linearly with vf2.
The error bars were calculated as follows, where the error in the mass measurement
was given by ± 0.23% (calculated by weighing all the balls used during testing with
scales that were accurate to 0.001 kg), the error in the calculation of I was estimated
as ± 5% using repeat measurements for various different balls, the errors in vb and

were taken from Table 2, and the final % error was calculated using worst-case (i.e.
lowest) values of 1/2mvb2 and 1/2I2. The equations are given in Kirkup [18].
All the balls showed a similar trend of increasing K.E. with foot velocity squared, but
it was difficult to distinguish between the balls. This is probably due to the combined
effects of varying ball mass (up to 20 g) and imparted spin. In order to distinguish
between the balls better, Figure 10 shows a bar chart of the average spin rate imparted
to the balls during the testing. The error bars used were those of the standard % error
calculated for (Table 2).
The range of average angular velocity imparted to the balls was 94.7-146.0 rad/s. It
can be seen that, on average, significantly more spin (~50% more) was imparted to
Ball 2 than to the other balls, which all have similar average spin rates (within about
5%). The reasons for this could be due to differences in surface finish, in the
coefficient of restitution of the ball at high velocity or in its moment of inertia. Each
ball had passed the same FIFA bounce test [2], suggesting that the normal impact
behaviour of the balls was similar. However, Ball 2 was noted to have a different,
rougher surface to the other balls, which would explain why more spin could be
imparted by the foot. Further studies regarding surface finish would be instructive in
understanding this phenomenon in more detail. Ball 2 was also found to have a
slightly higher moment of inertia than the other balls, but it is thought that this
difference was not significant, compared to the surface finish.
3.2 Trajectory Results
3.2.1 Drag results
The CD values that were extracted from the testing are shown in Figure 11, together
with the corresponding wind tunnel measurements [4] and CFD simulations [3]. The
results showed a large amount of scatter and it was difficult to distinguish between the
balls, and therefore for clarity not all the results are displayed. It can be seen that Re
varied from 2.15×10⁵ to 3.18×10⁵ (2.67×10⁵ ± 19%), compared to the average
measured Re of 3.56×10⁵ in the player testing.

The CD values were of the expected order of magnitude, but increase sharply with Re,
contrary to results from the other studies [3, 4] and the expected trend. Previous wind
tunnel tests on a spinning scale-model soccer ball [19] showed a drop in CD in this
Reynolds number regime. A plot of CD vs. Sp shows no convincing trend, which is
expected from previous wind tunnel tests on a spinning scale-model soccer ball [19].
It is difficult to draw any further conclusions due to the high scatter, which was
probably mainly caused by the assumption of constant CD, where in reality the flow
could be in transition and therefore CD would vary. This confirmed that wind tunnel
testing is a preferred method for gaining accurate CD values for non-spinning balls,
where the effect of transition can be measured.
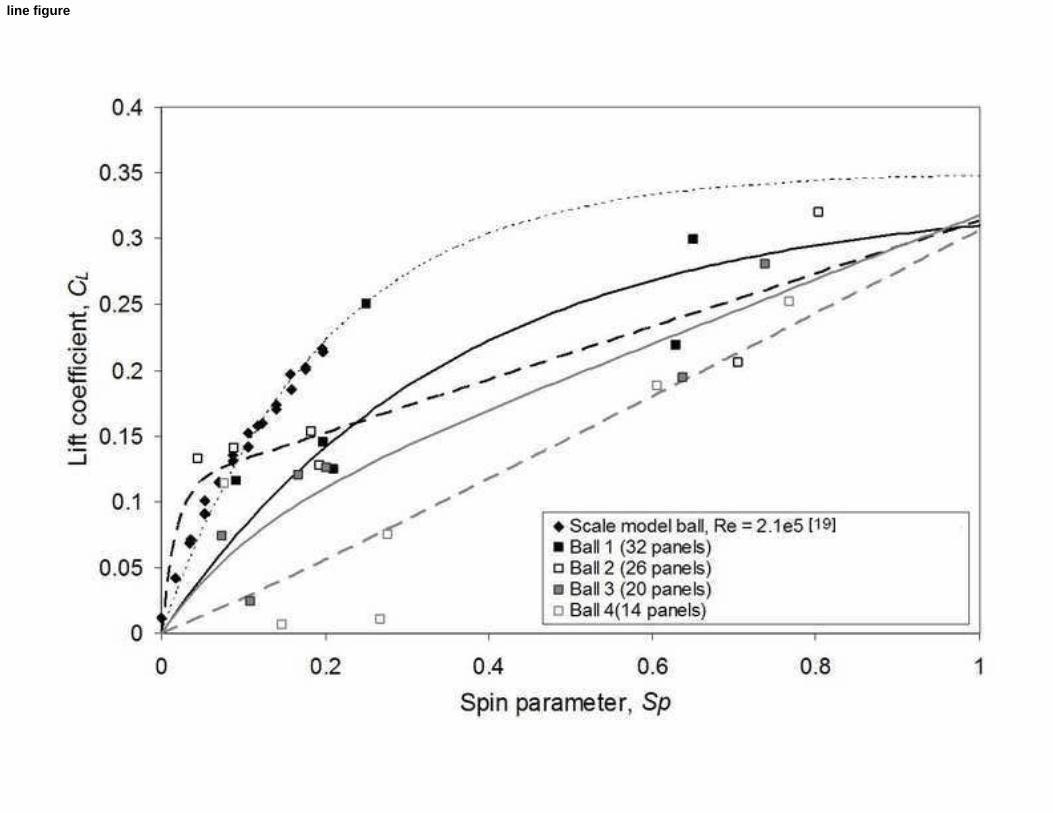
3.3.2 Lift results
The results for CL magnitude at various Sp values are shown in Figure 12, with
approximate fits, compared to wind tunnel results for a spinning scale model soccer
ball (which had exaggerated seams) [19]. Sp varied from 0.044 to 0.804 (0.424 ±
90%), compared to the average measured values for curling kicks in the player testing
of Sp = 0.49. The CL values were of the expected order of magnitude, and they
increased with Sp from zero at Sp = 0 to a maximum as the Magnus Effect became
larger. CL flattened off to a maximum because there was a limit to both the latest and
earliest separation points on the ball, and therefore to the asymmetry of the wake. The
curves for each ball show that more panels resulted in higher CL, probably because the
greater number of seams encouraged later separation and caused the wake to be
deflected more. This has an upper limit, where an increase in panel number results in
no change in CL. These results confirmed that trajectory testing can be a powerful
method for assessing differences in spinning ball behaviour.
3.3.3 Effects on trajectory
For a high-spin curling kick, the aerodynamic behaviour of each ball type was
compared by entering the results into a trajectory prediction model [19] and keeping
the initial conditions otherwise the same, which corresponded to a typical curving
kick, with a ball launch velocity of 21.1 m/s, an initial angle of elevation 26.2o and a
launch spin rate of 100 rad/s.

The three-dimensional trajectory simulation model calculates the forces experienced
by the ball at discrete time intervals during its flight using the following Equations 3
and 4 (using a time step of 2.5 ms). The coefficients CD and CL are calculated at each
time interval based on the mathematical fits of the wind tunnel data, as the velocity,
Re and Sp of the ball changes. The spin is assumed to remain in the horizontal plane
throughout the flight with no significant degradation.
2
2
1AvCF DD (3}
2
2
1AvCF LS (4)
The measured CL values were entered in as CS values, corresponding to sidespin
rather than topspin, in order to simulate a kick that bent to the side. The variation of
CD with Re was taken as that of Ball 1 from previous wind tunnel results [4]. The
resulting trajectories are shown in Figure 13.
The comparison of these trajectories to the non-spinning trajectory highlights the
large effect of spin on the flight, and it can be seen that the more panels the ball had,
the more swerve it achieved. The difference in the final horizontal position between
Ball 1 and Ball 4 was 1.04 m. The choice of ball from the current selection could
therefore be the difference between whether a goal is scored or missed.
For each of these trajectories, the change in CD and CS with time is shown in Figure
14. It can be seen that, for this type of kick, each ball slowed down enough to enter
the critical region, and therefore CD increased with time. CD began to drop off again
towards the end of flight as the velocity actually increased slightly due to gravitational
acceleration. CS increased with time as the ball slowed down and Sp correspondingly
increased, and CS was significantly higher for Ball 1 than for the other balls.
4. Conclusions
Four different balls were curled into the corner of the goal by five Premiership youth-
team players, and the launch conditions of the kicks were successfully measured using
a high-speed video camera. It was found that the players could apply more spin

(~50%) on average to Ball 2, which had a slightly rougher surface than the other balls.
The balls were launched at an average of 23.7 m/s, and with an average spin of 106
rad/s, which gave an average spin ratio, Sp, of 0.49. It was therefore thought that the
balls probably spent some of their flight in the transition or laminar regime and
therefore may have suddenly slowed down or dropped in the air.
The trajectories for four different balls fired at various velocities and spin rates across
a sports hall were captured using high-speed video cameras, and their CD and CL
values estimated. For each ball, CL increased to a maximum and compared well to
previous experimental results. Balls with more panels experienced a higher CL, and
increasing the number of panels from 14 to 32 could alter the final position of a
curling free-kick significantly, by up to 1 m.

Acknowledgements
The authors would like to thank the EPSRC for funding this study, along with Terry
Senior (Sheffield Hallam University) for technical assistance and Gemma Evans,
Simon Choppin and Bob Kirk for help during testing.

References
[1] Newton I (1672) New theory of light and colours. Phil Trans 80: 3075-3087
[2] FIFA (2006) Testing and certification of footballs – International Matchball
Standard.
http://www.fifa.com/mm/document/afdeveloping/pitchequip/ims_sales_doc_0
5_2006_13411.pdf. Accessed 5 April 2010.
[3] Barber, S., Chin, S. B. & Carré, M.J. (2009) Sports ball aerodynamics: a
numerical study of the erratic motion of soccer balls. J. Computers and Fluids,
38, 1091-1100
[4] Barber S, Seo K, Asai T, Carré MJ (2007) Experimental investigation of the
effects of surface geometry on the flight of non-spinning soccer balls. In: Fuss
FK, Subic A, Ujihashi S (eds) The impact of technology on sport II, Taylor &
Francis / Balkema, The Netherlands, pp 397-402
[5] Alaways LW, Hubbard M (2001) Experimental determination of baseball spin and
lift. J Sports Sci 19: 349-358
[6] Taniguchi T, Miyakazi T, Shimizu T, Himeno R(2005) Measurement of
aerodynamic forces exerted on baseballs using a high-speed video camera. In:
Subic A, Ujihashi S (eds) The Impact of Technology on Sport, Australasian
Sports Technology Alliance, pp 23-26
[7] Cairns, TW (2004) Modelling lift and drag forces on a volleyball. In: Hubbard M,
Mehta RD, Pallis JM (eds) The Engineering of Sport 5: Proceedings of the 5th
International Conference on the Engineering of Sport, ISEA, UK, pp. 97-102
[8] Deprá P, Brenzikofer R, Goes M (1998) Fluid mechanics analysis in volleyball
services. In: Riehle HJ, Vieten M (eds) 16 International Symposium on
Biomechanics in Sports, ISB, pp. 101-106
[9] Chikaraishi T, Alaki Y, Maehara K, Shimosaka H, Fukazawa F (1990) A new
method on measurement of trajectories of a golf ball. In: Cochran AJ (ed)
Science and Golf: Proceedings of the World Scientific Congress of Golf,
SPON product, pp. 193-198
[10] Zayas JM (1985) Experimental determination of Cd of a tennis ball. Amer J
Phys: 622-625

[11] Asai T, Carré MJ, Akatsuka T, Haake SJ (2002) The curve kick of a football I:
impact with the foot. Sports Eng 5: 183-192
[12] Carré MJ, Asai T, Akatsuka T, Haake SJ (2002) The curve kick of a football II:
flight through the air. Sports Eng 5: 193-200
[13] Goff, E.J., Carré, M.J. (2009) Trajectory analysis of a soccer ball. Am J Phys 77
(11): 1021-1027
[14] Goff, E.J. & Carré, M.J. (2010) Soccer ball lift coefficients via trajectory
analysis. Eur J Phys 31: 775–784
[15] Bray K, Kerwin DG (2003) Modelling the flight of a soccer ball in a direct free
kick. J Sports Sci 21: 75-85
[16] Bray K, Kerwin DG (2004) Modelling the long throw in soccer using
aerodynamic drag and lift. In: Hubbard M, Mehta RD, Pallis JM (eds) The
Engineering of Sport 5, ISEA, UK, pp. 56-61
[17] Kerwin DG, Bray K (2004) Quantifying the trajectory of the long soccer throw.
In: Hubbard M, Mehta RD, Pallis JM (eds) The Engineering of Sport 5,
International Sports Engineering Association, pp. 63-68
[18] Kirkup L (1994) Experimental methods. John Wiley and Sons, Brisbane
[19] Carré MJ, Goodwill SR, Haake SJ (2005) Understanding the effect of seams on
the aerodynamics of an association football. J Mech Eng Sci 219 (7): 657-666

Table 1 Balls used throughout testing, along with the range of characteristics for a
FIFA approved size 5 according to “International Matchball Standard” [2]
Table 2 Ball data measured from player testing
Table 3 Ball data measured from trajectory testing
Fig. 1 Apparatus used for player testing
Fig. 2 Ball used throughout testing
Fig. 3 Apparatus used for trajectory testing
Fig. 4 Machine used to launch balls for trajectory testing
Fig. 5 Example of trajectory fitting to camera data
Fig. 6 Repetition of trajectory fitting, used to estimate errors
Fig. 7 Comparison of a fitted trajectory based on measurement data to a simulated
trajectory based on constant CD and CL
Fig. 8 Comparison of trajectories to evaluate the sensitivity of the trajectory to the
constant CD and CL values assigned
Fig. 9 Kinetic energy analysis of player testing
Fig. 10 Spin imparted during player testing
Fig. 11 Drag coefficient data obtained from trajectory testing, compared to previous
studies
Fig. 12 Lift coefficient data obtained from trajectory testing, compared to previous
studies

Fig. 13 Free-kick simulations for the four ball types

Table 1 Balls used throughout testing, along with the range of characteristics for a FIFA approved size 5 according to “International Matchball Standard” [2] Ball 1 Ball 2 Ball 3 Ball 4 IMS range Construction 32 panels,
stitched 26 panels, stitched
20 panels, stitched
14 panels, bonded
Not specified
Mass (g) 417 434 425 440 410 to 450 Diameter (mm)
219 220 219 220 216 to 223
Moment of Inertia (kgm2)
3.00 x 10⁻³ 3.29 x 10⁻³ 3.15 x 10⁻³ 3.23 x 10⁻³
Not specified
Seam depth (mm)
1.0 to 1.6 1.0 to 1.6 1.0 to 1.6 1.4 to 1.7 Not specified
table

table
table

line figure

line figure

line figure

line figure

line figure

line figure

line figure

line figure
line figure

line figure

line figure
line figure

line figure