the effect of state certificate-of-need laws on hospital costs: an
TRANSCRIPT
FEDEltAL TRADE COMMisSION
DANIEL OLIVER , Chairman
, '
PATRICIA P. BAILEY . CommissionerTE:RRY CALVANI, Commissioner
, MARY L. AZCUENAGA, CommissionerANDREW J. STRENIO. JR., Commissioner
BUREAU OF ECONOMICS
DA VlD T. SCHEFFMAN , Director
. "
JOHN L. PETERMAN, Associate Director for Policy
JOHN WOO DB U R Y. Acting Associate Director for Special Projects. RONALD S. BOND. Deputy Directorfor Operation!iand Consumer. Protection MARK W. FRANKENA, Deputy Oirector for Antitrust
JAMES A. LANGENFELD , Acting Deputy Director for Economic
. ,
Policy An~lysis
D~NNISBREEN, Assistant Direct()f for AntitrustROB' ERTD. BROGAN , Assistant Director for AntitrustGER~RD R. BUTTERS. Assistant Dir~Gtor for Consumer ProtectionPAUL A. PAUTLER. Assistant Direct()t: for Economic PolicyAnalysis
. ;
This, report has been prepared by. a staff member of theBureau of Economics of the Federal Trade Commission. It has.not been reviewed by, nor does it necessarily. reflect the views
, the Commission or any of i,ts members.

ACKNOWLEDGEMENTS
This report has benefitted from the comments an4~uggestionsof many individuals both inside alld outside the Federal TradeCommission. Within the Commission I would like to thankDennis Breen, Mark Frankena. Alan Mar ios, Paul Pautler, DavidScheffman , MikeVita Bill Doying, Collot Guerard , JohnLopatkaToby Singer, and Oscar Voss for their comments on earlier draftsof this report. John Hamilton ably assisted in' the c~mputerwork , and Betsy Zichterman helped with ,the word processing.
I would like to thank Dick Merrit, Director of theIntergovernmental Health Policy Proj~ct at " the GeorgeWashington University. and Samuel Stiles, Associate Director of
. the Alpha Center for Health Policy and Planning. for providing.detailed information on state regulations affecting hospitals. Ialso wish to thank Joyce Kelly of the National Center for HealthServices Research for sharing her knowledge of both healtheconomics and hospital capital policy during the early stages ofmy research. I would also like to thank outside reviewers fortheir comments.
The form and substance of the report have been greatlyimproved as a result of the comments of the individualsmentioned above; any blame for whatever shortcomings the reportmay have must necessarily remain sole: .. with the author.
111
Executive Summary
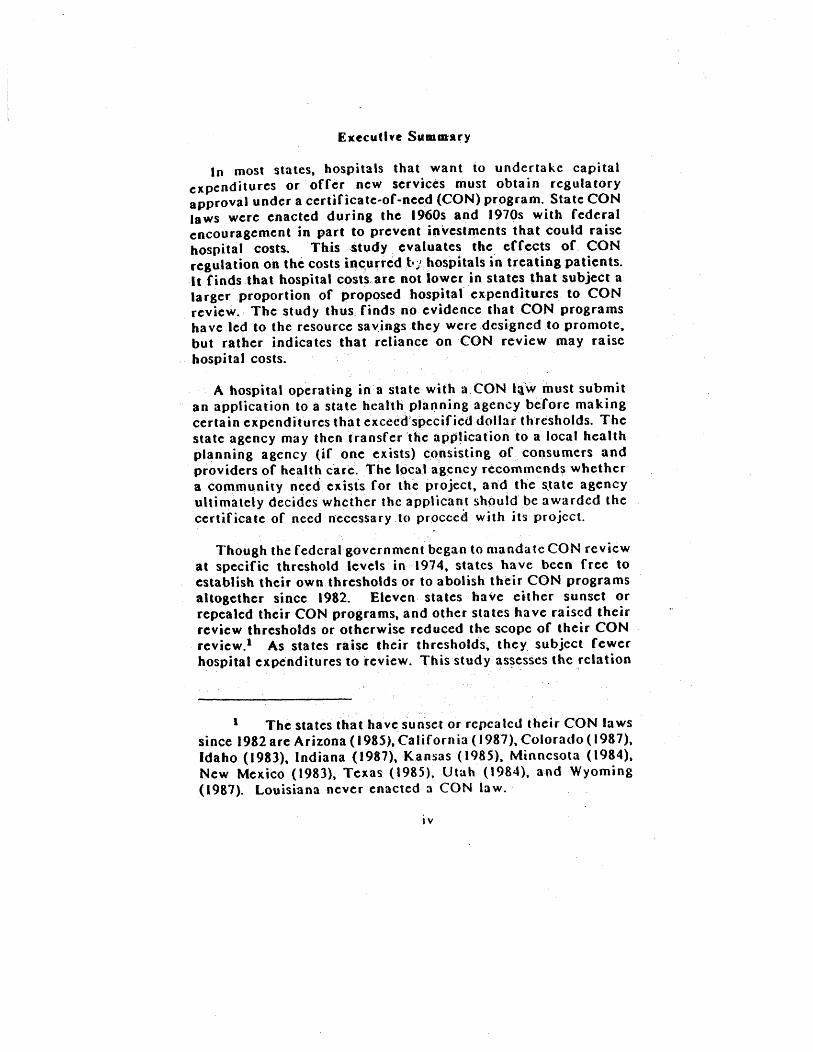
In most states, hospitals that want to undertake capitalexpenditures or offer new services must obtain regulatoryapproval under a certjncate~of-need (CON) program. State CONlaws were enacted during the 1960s and 19705 with federalencouragement in part to prevent investments that could raisehospital costs. This study '. evaluates the effects of CONregulation on the costs in~urredb
j.
ho~pitals in treating patients.
It finds that hospital costs, are not lower in states tha t subject alarger proportion of proposed hospital expenditures to CONreview. The study thus finds no evidence that CON programshave led to the resou rce sa vingsthey were ,designed to promotebut rather indicates that reliance on CON review may raisehospital costs.
A hospital operating in a state with a, CON I~:w must submitan application to a statehcahh planning agency before makingcertain expenditures that excc~d"specificddollarthtcsholds. Thestate agency may then Iransferthe application to a local healthplanning agency (if one exists) consisting of COl)sumers andproviders of healt~ care. the local agency recommend~ whethera coO\ffiunity need exists for the project . a n , the s.tate agencyultimately decides whether the applicant shpuld be awarded thecertificate of need necessary to proceed with its project.
Though the federal government began to mandate CON reviewat specific threshold levels in 1974, states ha ve becn free toestablish their own thresholds or to abolish their CON programsaltogether since 1982. Eleven states have either sunset orrepealed their CON programs, and other states have raised theirreview thresholds or otherwise reduced the scope of their CONreview.1 As states raise their thresholds. they subject fewerhospital expenditures to review. This study as~esscs the ,relation
The states that have sunset or repealed their CON lawssince 1982 are Arizona (1985), Californ ia (1987), Colorado (1987),Idaho (1983), Indiana (1987), Kansas ( 1985). Minnesota (1984),New Mexico (1983), Texas (1985), Utah (1984). a'nd Wyoming
(1987). Louisiana never enacted a CON law.
I V

between hospital costs and the dollar thresholds th3t trigger CONreview.
CON laws could raise hospital costs in two ways. First , CONreview may serve as a barrier to the entry of new pf(fviders ofhealth care who must demonstrate that a need exists for .theirservices. A challenge by an txisting hospital to a new CONapplication may lead to substantial administrative arid judicialdebys in issuance of a certificate of need or denial of theapplication: This regulatory impedi.r'hcnt. which applies 'expa' nsion as well as' new entry, reduces competition ar hospitals, and may lessen the incentive;of hospitats to rcducecosts. A second way in which CON la ws could raise hospitalcosts is by encouraging hospitals to avoid use of regulated capitaland equipment inputs by using larger amounts of unregulatedinputs such as nursing services ' and ' laboratory tests to treatpatients. a sub~tituti()nthat could raise costs if hospitals wouldefficiently use resources absent the regula tion.
CON regulation has been justified in the past primarily by thetheory that unregulated hospital competition would lead to theprovisi~n of unnecessary facilities and services in order to
. attract patients and physicians, with the costs of underlttilized
facilities being passed along to patients. The basis for thisrationale for CON regulation has been weakened as patients andinsurers have beco,me increasingly sensitive to the price hospital services since the 1970s , timiting the ability of hospitalsto ' paSS alQngunju~tified cost increases. Given tbatCON lawsinherently restrict competition , they may now harm consumers.
Thee(fects of regulation on hospital costs were evaluated bystatistically estimating a cost function for a sample of 3708hospitals using data for 1983-84. This methodology relates the
total costs of individual hospitals to the volume of services theyproduce along with other factors thought to influence hospitalcosts, including certain state regulations.
Separate thresholds generatly are set for capitalexpenditures to build new facilities or expand existing ones. fornew services, and for major medical equipment.
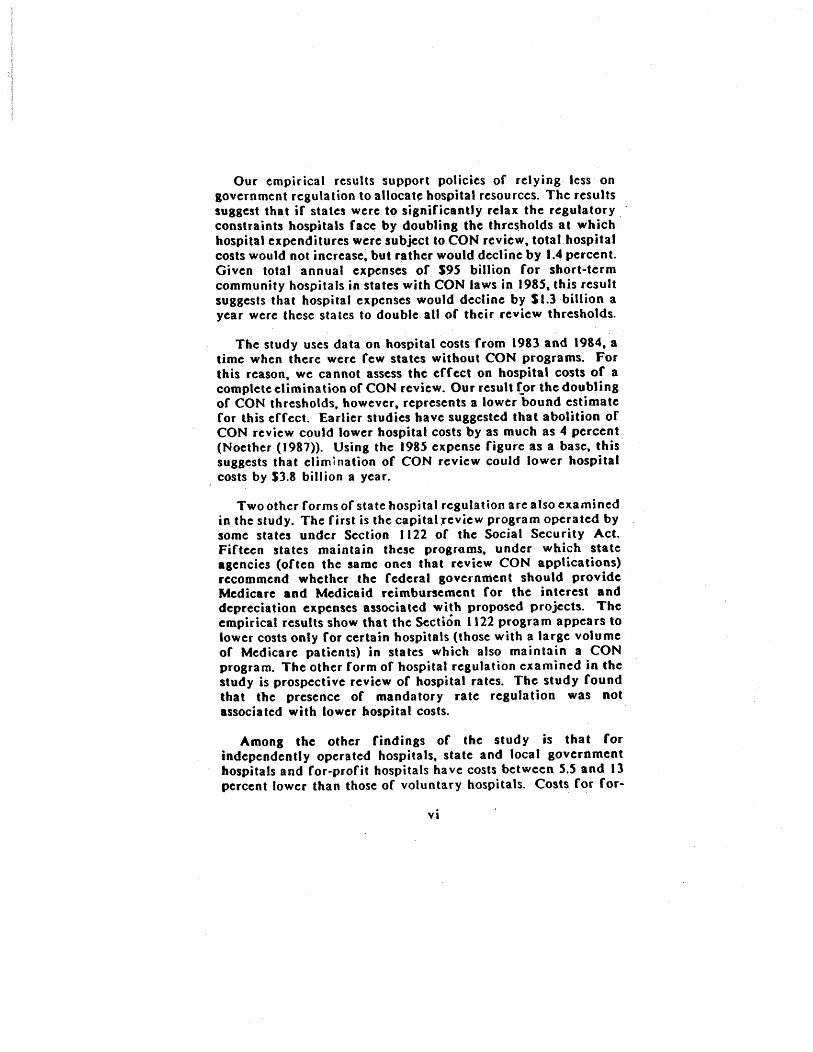
Our empirical results support policies of relying less ongovernment regulation to allocate hospital resources. The resultssuggest that if states were to significantly relax the regulatory
, -
constraints hospitals face by doubling thethresholds at whichhospital expenditures were subject to CON review. tota1hospitalcosts would not increase, but rather would decline by 1.4 percent.Given total annual expenses of S9S billion Jor short-termcommunity hospitals in states with CON laws in 1985, this resultsuggests that hospital expenses would decline by $1.3 billion ayear were these states to double, all of their review thresholds.
The study uses data on hospital costs from 1983 and 1984 , atime when there were few states without CON programs. Forthis reason . we cannot assess the effett on hospital costs of complete elimination of CON review. Our result tor the doublingof CON thresholds . however , represents a lower bound estimatefor this effect. Earlier studies have suggested that abolition ofCON review could lower hospital costs by as much as 4 percent(Noether (1987)). Using the 1985 expense figure as a base. thissuggests that elimination of CON review could lower hospital
. costs by SJ.8 billion a year.
Twoother forms of state hospital regulation are also examinedin the study. The first is the capital :review program operated by some states under Section 1122 of the Social Security Act.Fifteen states maintain ' these programs . under which stateagencies (often the same ones that review CON applications)recommend whether the federal government should provideMedicare and Medicaid reimbursement for the interest anddepreciation expenses associated with proposed projects. Theempirical results show that the Section 1122 program appears tolower costs only for certain hospitals (those with a large volumeof Medicare patients) in states which also maintain a CONprogram. The other form of hospital regulation examined in thestudy is prospective review of hospital rates. The study foundthat the presence of mandatory rate regulation was notassociated with lower hospital costs.
Among the other findings of the study is that forindependently operated hospitals, state and local governmenthospitals and for-profit hospitals have costs between and 13
percent lower than those of voluntary hospitals. Costs for for-
proCit and governrnent hospitals appear to be higher when thesehospitals are either owned, leased, or managed as part oC ahospital system. The observation that Cor-profit hospitals thatare parlor a larger system have higher costs !han independentlyoperated for-profit hospitals (and also voluntary hospitals thatare part of a larger system) may not reflect any systematicinefficiency on the part of for-profit hospital chains. but ratherthe Cactthat for-profit hospital chains often expand by acquh~ :18inefficient . high-cost hospitals. It is also possible that thesedifrerf.: .=:5 in costs reCiect differences in the quality of serviceand in ' case mix not otherwise captured by the variables in theempirical model.
VII
Table or Co.teats
I. Introduction
. . . . . . . . . . . . . . . .
II. The Potential Effect of CON Laws on Hospital Costs. .
A. The Rationale for and Effect of CON Laws. .
. .
B. Literature Review
. . . . . . . . .
C. Concl usio
. . . . . . . .
III. The Model and Data. . . .
. . . . . .. ,
A.- General Models of Hospital Costs
. . . .
B. Cost Function Specification
. . . .
C. Cost and" Output Variables. .
. . . . . .
D. The Input Price Variable
. . . .
E. Organizational Forms of Hospitals.
. . . . . .
F. Case-mix Variables
. . . . . .
G. The Resulation Variables
. . . . . . . .
. Concl us ion
. . . . . . . .
IV. Resu1ts
. . . . .' . .
A. The Regulation Variables
. . . .
B. , Other Variables
. . . .
. 63C. Economies of Scale and Scope in Hospital Production
V. Conclusions
. . . . . . . .
Bibliography
. ~ . .
viii

Lilt or Tables
I. State Certificate of Need Review Thresholds (July I , 1986)
II. State Certificate or Need Review Thresholds (December 1983) 41
III. Variable List and Descriptive Statistics
. . . .
IV. Regression Estimates of Hospital Cost Functions.
. .
V. EstimatedCQsts ($) and Economies of Scale for Hospital.Outputs with All Outputs Set to Their Mean Level
VI. Product-Specific Scope Economies, Various Output Levels

I. Introduction
State ccrtificatc~of~need '(CON)' laws inhererit1y restrictcompetition among hospitals by' requiring that th\ j' obtainregulatory approval to b~ild or expand faciHties, to purchase newequipment, or to provide new services.! CON laws generallyapply both to existing hospitals and to new entrants into hospitalmarkets. They were established in part to control hospital costsby regulating the supply of hospital facilities and services. CONlaws are intended to prevent ' competing, hospitals fromunnecessarily duplicating one another s facilities and services andtherefore to save consumers the costs of underutiHzed facilities. This study attempts to determine what , if any, effects state CONregulation , along with other forms or hospital relulation" havehad on the ' operating costs of short-term, general hospitals. Thestudy also examines the relationship between total hospital costsand the volume and mix of services they provide.
The major impetus, for the establishment of state CONprograms was the passage by Congress of the National Health
Planning and Resources Develop~ent Act (NHPRDA) of 1974.This Act provided standards of review for hospitals' acquisitionof capital assets. States with exi~ting programs were obligatedtocompty with the standards set~ytbe law. whi1c remainingstates were required to establish CON programs. States failing to,comply with the standards set by the Act stood to lose federalfunding for a broad set of state and local health programs. Withthe 1979 amendments to the Act , states were also required toreview hospitals' acquisition of major medical equipment andentry into new services. By 1980, all but one state (Louisiana)maintained a CON program.
Other institutional providers often covered by CON lawsinclude skilled nursing fadlities, intermediate care facilitieskidney dialysis centers, psychiatric hospitals, and home healthcare services. Only Beneral hospitals are covered in this study.
Public Law 93-641. Simpson (1 986) provides a history of
the development and coverage of state and federal CON programs.

Section
Since 1980 , there has been a general trend toward eliminationof CON regulation both at the federal and state level.' Federalfunding for state CON programs decreased t~rough the 1980s andended in 1981. ' The federal government never penaHzed thestates for noncompliance with the NHPRDAstandards , and in1982 was expressl,y forbidden by Congress to do so. Elevenstates had sunset or repealed their CON laws by January 1988
, '
and others reduced the scope of coverage ,of their laws andincreased the expenditure level that would trigger a review oftheproject.c Table I presents information on state CON laws asof July 1986;
The primary rationale for CON regulation is thebetief thatcompetition among hospitals takes place -primarily - ~ndexcessively - in terms of the quality of facilities and servicesoffered to patients and physicians , rather than on the price ofhospital serviCes, and that this quality competition inefficientlyraises the cost of health care to the consumer. Price
Sec , for example , Alpha Center (1985).
.. The states that have repealed or sunset their CON lawssince 1980 are Arizona (1985), California (1987), Colorado (1981),Idaho (1983), Kansas (1985), Minnesota (1984), New Mexico (1983),Texas (1985), and, Utah (1984), and Wyoming (1981)~ Indianasunset its CON law in 1981 , but continued to review long-termcare proposals through its Board of Health and new psychiatricbeds and facilities by the Commissioner of Mental Health.
CON review thresholds are given in thousands ofdollars. Capital and major ,medical equipment thresholds indicatethe level of capital expenditure under which capital orequipmentpurchases are reviewed. Service thresholds indicate the level ofannual operating expenses at which a service comes under review.
Quality competition is used here to refe~ to the non-price dimensions of competition among h()spitals. Thiscompetition need not enhance consumer welfare. For example
(con tin ued...
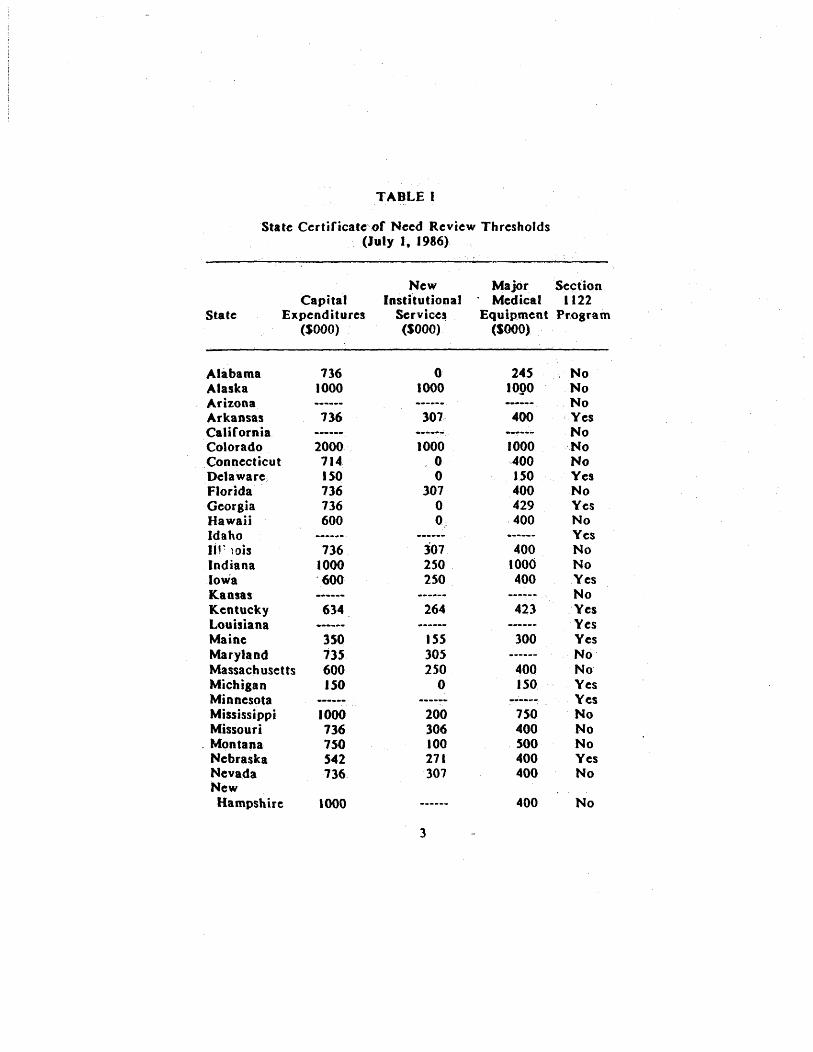
TABLE I
State Certificate of Need Review Thresholds(July I , 1986)
StateCapital
Expenditures(SOOO)
New Major SectionInstitutional ' Medical 1122
Services Equipment Pr.ogram(SOOO) (SooO)
AlabamaAlaskaArizonaArkansasCaliforniaColoradoConnecticutDelawareFloridaGeorgiaHa waii
IdahoIIr )Db
IndianaIowaKansasKentuckyLouisianaMaineMarylandMassachusettsMichiganMinnesotaMississippiMissouri
. MontanaNebraskaNevadaNewHampshire
7361000
736
2000714150736736600
736.1000600
634
350735600150
1000736750542736
1000
1000245
logo
------
301. 400
------
1000- 0
307
3072S0250
1000400150400429400
4001000400
264 423
15S30S2S0
300
400ISO
200306100271307
7S0400500400400
400
Yes
Yes
Yes
Yes
Yes
YesYesYes
YesYes
, No
Yes
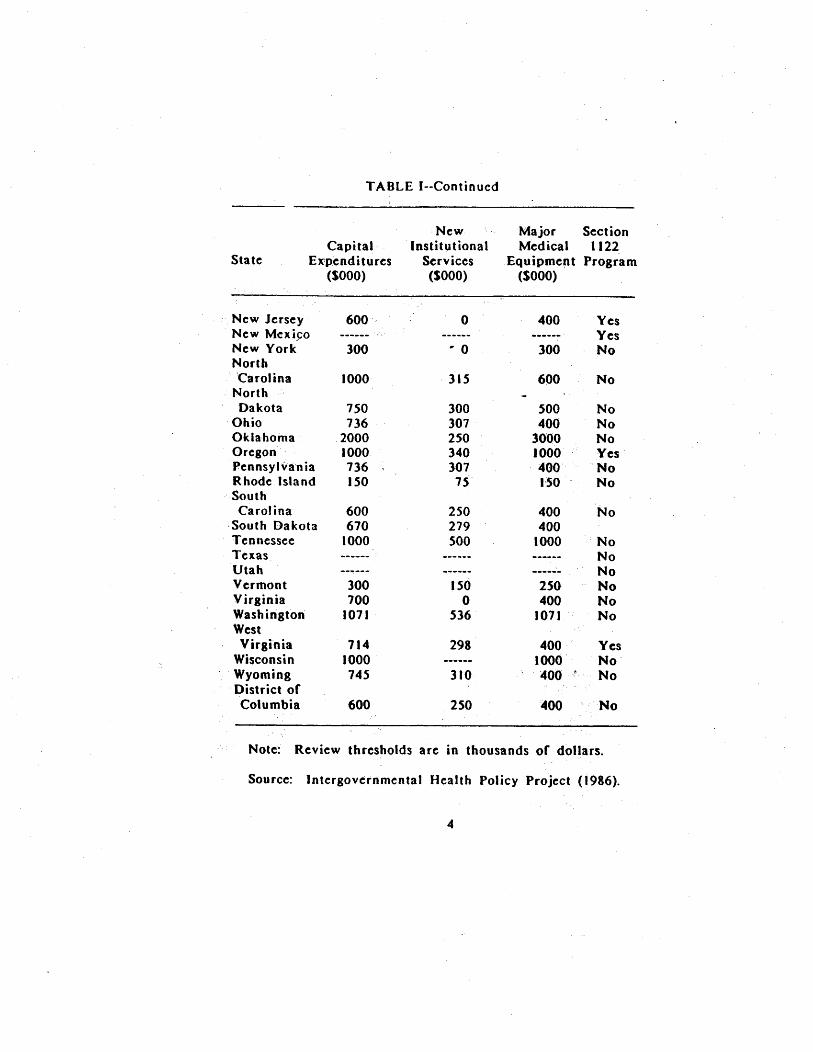
TABLE (--Continued
Sta te
CapitalEX'penditures
(SooO)
NewInstih,ltional
Services(SOOO)
Major Sect ionMedical 1122
Equipment Program($000)
New Jersey 600 400 YesNew Mcxj~o
...---
YesNew York 300 .. 0 300NorthCarolina 1000 ' 315 600
NorthDakota 150 300 500
Ohio 136 301 400Oklahoma 2000 250 3000Oregon 1000 340 1000 YesPennsyl-va' n ia 136 301 400Rhode Isla 150 I'SOSouthCarolina 600 250 400South Dakota 610 279 400Tennessee 1000 500 1000Texas
------
Utah
------
Verrnont 300 150 250Virginia 100 400Washington 1011 536 1011WestVirginia 114 298 400 Yes
Wisconsin 1000 1000Wyoming 145 310 400
District ofColumbia 600 250 400
Note: Review thresholds are in thousands of dollars.
Source: Intergov~rnmental Health Policy Project (1986).
swwucompetition bas longbeen considered to be weak in the hospitalindustry because most patients are insured a,nd face a relativelylow out-of-pocket cost for, theservice$ theyconsume.1 Perhapsmore importantly, hospitals traditionally have been reimbursed
. retrospectively for whatever costs they incurred in providingservices. a mechanism that may weaken theii incentive to containcosts. Absent a strong incentive to compete over pdces andcontain, costs, quality competition is alleged to lead to the
construction of facilitics and provision of services that arcduplicative ~nd therefore underutilized. By reviewing the capitalexpenditures of hospitals, CON regulation attempts toassure thatfacilities and services are not' established unless they areneeded.
(oo.continued)hospitals may purchase capital equipment that either is not fullyutilized or produces incremental benefits to patients' healthvalued at less than the cost of the equipment.
l' , Noether (1987) studied hospital ' markets using 1977data, and found that hospitals al:that time were not immune toprice competition. Noetber also presents evidence that hospitalsincentives to compete on prices and to contain costs haveincreased since the 1970s.
States usc a wide range of criteria in evaluating, community -need" Cor a project (Simpson (1986)). Assessment of this' need may include the evaluation of thequality of service anew facility could provide relative to that offered by incumbentproviders and the accessibility of new facilities to the userpopulation. To the extent, CON laws reduce the quality ofservices that would be provided to consumers or increase thettavel or waiting time necessary to ' use health care services, theywould make consumers worse off even if the laws had no directefrect on the costs incurred ' by covered hospitals. In ourempirical work we do not attempt to measure the quality orconvenience effects or CON laws which (~ilong with any price
, effects) would be needed to conduct a full cost-benefit analysisof CON laws.
Sect ion I
, Whether or not CON regulation actuaHy reduce$ hospital costsis an empirical Question. To the extent that CON laws reduceexpenditures on capital and equipment, they l11ightreduce hospitalcosts, albeit at the, cost of some sacrifice , in quality orconven ience of $erv ice. CONlawscou Id, howe"e , also increasecosts if hospitals subjeCt to CON review su\)stitute away fromregulated capital and' equipment inputs to higher cost butunregulated labor and material inputs. CON laws could also raisethe cost of hospital care if they retard competition that leads tomore efficient resource use. including competition from newhospitals and other covered providers of health care serviceswhich could compete with exis~ing hospitals.
Past studies of the effects of CON regulations on hospitalcosts (discussed in the next section) have used data from the1970s. CON programs at this time were primarily restricted toreviewing 'only hospitals. major capital exp,enditure proposals.The general consensus of these studies was that CON laws didnot lower hospital costs, but rather may have been associatedwith higher costs.
" The use of 1984 data in this study allows us to account forthe changed environment among CON programs in which statesmaintain different review thresholds for each of three types ofexpenditures. tO The data allow us to measure what, if any,
If CON la ws served to foster cartelizing behavior the part of hospitals, outpJ.lt would be restricted below thecompetitive le.veL' Though the total expense of providing thissmaller volume of services would be less thari the expense ofproviding services at the competitive level, consumer welfarewould decrease as a result of this output restriction."
, 10 The primary data source usedinthe empirical analysisis the Annual Survey of HosoitalS conducted by theAmerican Hospital ' Association (AHA). The survey containsinformation on the components of hospital expenses along withother characteristics of hospitals. Data on state regulations were.
, (continued...
Section'
, :
effccts different typcs of CON Jaws have on hospital costs~U IfCON laws do serve to reduce costs, we would expec~tofind thatstates tbat set low review thresholds. and tl1ereby subject a
treater proportion of projects to revicw would ,have lowerhospi tal costs.
" ' , '
The data are used to estimate cost functions that relate thetotal expefises of an individU111 hospital to: thelcycls of different
, outputs it prodtices, the prices inputs, and Jhe generalcharacteristics or the hospiui1. " Regression methods allow us tomeasure thc effect of CON rcgulatio.rl on hospital expenses,taking into account other factors which may be related tohospi' tal tosts. This enables us tp test whether more stringentCON laws ate associated with lower hospital costs.
' '
The ernpirical results provide no evidence that subjecting moreof a hospital.s projects to reBulat~)ryrevie'Wserves to decrease
hospital costs. The results indicate that~tatesthatprovide lessregulation of hospitals by setting higher review thresholdsacross.the-board appear to have lQ.~ costs than those stateswhich review more of a ho!pitat.s expenditures by setting lowerthresholds for aU types of hospital ~xpenditurcs. This suggeststhat the rec'eot general1ifting of CON thresholds in many statesmaylowerhospit~1 costs and thcreforc: ben~fit conS\1mers.
The study also examines the effect on costs of two otherforms of state, regulation of hospitals. The first is the capitalreviewprogralJl operated bysome statesunder Section t 122 or
" lo
(...
continue~) "
, '
obtained ' from other source' and matched to the AHA data.Approximately 3100 hospitaL were included in the analysis.
11 In addition to chaRles in CON laws, health caremarkets have changed since the 19705 with the development orpreferred provider arranBements and the Browth of healthmaintenance organizations, which may lead to greater pricecompetition among hospital!.

Section t
the Social Security Act Amendments. Fifteen states currentlymainta in Section 1122 p~o8rams under which state planningagenCies review hospitals cxpenditure plans todetermi~e whetherthe federal government sholild reimburse hospitals depreciationand interest costs under tb ftderal Med icare and Medicaidprograms forindividual capita(projects: CON leglshiJion . whichcan disallow a project , is a stronger form of hospital regulationthan 1122 review , which only limits public reimbursement .of aportion ora project's cost. Because CpN review more broadlycovers hospital eJCpenditures~ most states ga ve up participation inthc: 1122 progra~: when they enacted 'CON' laws
The empiric~1 results show that reliance on . a Section 1122agreement alone without a CON law has no di;cernible effect onhospital costs. A Section 1122 agreement appears to lower costsonly for certain hospitals (ones with a large volume of Medicarepatients) in those states that also. have a CON program.
The other form of regulation examined i'n the study is thesetting of hospital rates through the process of prospective ratereview . This form of regulationgeneratly estabHshcs in advancethe maximum rates hospita1s can charge. Because a hospital ispaid a fixed rate irrespective of the cost it actually incurs. rateregulation may reduce the incentive hospitals may have toincrease costs in their efforts . to attract patients. The studyfound that the presence of mandatory rate regulation did nothave a significant effect in lowering hospital costs.
Section II of this report discusses the ratior:aale for CONregulation of hospitals and discusses previous studies of theeffects of this regulation on hospital costs. Section 111 describeshow the theoretical model of a firm s cost func~ ..)n can beapplied to hospitals and discusses the data and . variables used inthis study to measure empirically the effects ofCONrC:8ulation
Public Law 92-603 (1972).
Lewin and Associa tes (1985).

Section I
OR tot~' hospital costs. Section IV presents the empiricalresults , ' the study, and Section V concludes the report with summary or results and a discussion or directions ror future
research.
II. The Potential Effect of CON Laws 00 Hospital Costs
To motivate this study, it is helpful to outline the potentialeffect~ of CON programs on hospital costs. The first part of
, this section reviews the rationale for CON laws and theirpotential impacts on hospital costs. The net direction of theseeffects is theoretically ambiguous and thereforc cannot beestablished without empirical analysis. The second part of thissection selectively reviews the empirical literature examining theeffects of CON regulation on hospital costs. The conclusion ofthis sec.tion explains why additional research is needed to betterunderstand the effects of three types Df CON review, whichcurrently operate in an economic environment different from theone that ex isted during the period covered by previous studies ofCON I a ws.
A. The Rati
State CON programs provide review and approval of capitalinvestment and expansion of facilities and services by hospitals.CON laws were first established by the states l4 and ultimately
, '
mandated by the federal government. One theory underlying CONlaws is that unregulated competition among hospitals leads tocostly overinv. . tment in hospital resources.l~ CON regulationattempts to correct for the effects of this competition regulating the supply of hospital services through the requirementthat a hospital receive a certificate of need from a state agencybefore it can undert~ke a covered project.
14 New York established the first CON program in thenation in 1964.
II Congress, in amending the National Health PlanningResource Development Act in 1979, found that "(T)he effect ofcompetition on decisions of providers respecting the supply ofhealth services and facilities is diminished....As a result, there isduplication and excess supply of certain health services andfacilities . particularly in the case of inpatient health services'-See 42 V. C. section 300k-2(b)(I )-(3) (1982).
Section IJ
By controlling the entry and eipansion plans of h()spitals~ertificate-or.,need law:sattempt tocompensatefort~e p~rceivedtendency for hospitals to overinvest. There are several reasonswhy unregulated competition among hospitals might not lead toan optimal allocation of resources. , Most hospital patients areinsured aod da not ,have to pay the full ~ost of thc hospitalresources thcy consume. Patients (or their physiCian, Bgcnts)have the incentive to consume hospital services as iong as thebenefit of doing so exceeds, the subsidized out.,of-pockctcost. Ifinsurers pay, for, all (or most) services patients a"d theirphysicians demand on the bads of costs incurred hospitals willhave the incentive to compete: for patients and their doctors byincreasing the quality ofCacilities and services at the hospital.Quality here refers to theameni ties available to the patient andto the diversity and availability of hospital cquipmeiu, services,and personnel to the patient and his or her physician.
, Hospitals may also cQmpetefor the phy~icians who admitpatients to the hospital by sinHlarly providing them with anenvironment in which awide range,of sophist~cate~ services canbe provided. ProV'iding such services may io itself bring prestigeto a hQspital aRCI bea source: of utiH,y toitsadministrators.
CON laws seek to coritrolhospital costs, by reducing qualitycompetition ' and limiting the .unnecessary" expansion andduplication of services and facilities that might occur i,n anunregulated market. Such, duplication not only could lead tounderutHization of equipment and facilities but also prevent
18 .' Congress, in amending the NHPRDA in 1979~ citedthe prevailing methods oLpaying for health services by public
and private insurers" as the primary source or the lessening of,the beneficial effect of competition on the allocation of resources.
1'1 Lee (l971)presents a conspicuous production model ofhospitals that argues that hospitals compete for physicians andfor prestige by acquiring sophisticated equipment.
I I
Sect ion u...
hospitals from fully realizing economies of scale.18 (fthere arediseconomies of scope in the joint production of different typesof hospital services, costs could be reduced if hospitalsspecialized in fewer services rather than competing to provide abroad a range of services.IQ
: ,
CON regulationimpHcitly assumesthat by reducing the amountof capital and equipment available to hospitals , the total cost ofresources used to trea t a given volu me of patients will c!' ~fease.This assumes' that ~tber inputs, ~uch as labor cal:' p)t substituted ' for the restricted inputs. JIospitals are notparticularly capital intensive; for thC: sample used in this study,interest a.nd depredation expenses are less than tenpercerit oftotalexpenditutes for most hospitals. By restricting the use ofcapital and equipment, CON laws may encourage" bospitals toswitch to less capital-intensive but more expensive ways oftreating patients.2o
' ,
CON laws may wea'ken competition among hospitals if theyserve asa barrier to expansion by existing hospitals or the entryof new providers of health care~ ln states with CON laws, apotential entr~ntmust submitanappHcation toaheahh planningagcn cy if it wants to provide new facilities or services within thestate. ' The burdcn is placed' upon ' the ' potential entrant todemonstrate that the need for s~rvice is not currently being metin thc market. A CON application may be challenged by cxisting
18 , Economics of scale exist . in the production of anoutput if unit costs decline' as more output is produced.Economics of scale are fully realized when unit costs are as lowas possible and additional production would increase unit costs.
IQ Economics of scoptexist i'nthe p. roduction of two ormore outputs if the costs or sepaitttely producing tbe outputs aremorc than the costs or jointly producing the 'outP1.lJs.
' "
20 Empirical studies or CON laws (discussed below) havefound evidenc~ofincreased ~seof non-capital inputs in hospitalscovered by CON la ws.
~ction II
hospitals. and entry or. competitor may be delayed or evendefeated because of the CON proce$s.2I If incumbent , hospitalsknowthatitwill b~ difficult for new and innovative providers ofhealth care ' to ' enler the tnaricet., the potential Cor pricecompetition , which would put downward p,ressure on costs, wouldbe lowercd.
, The theoretical effect of CON laws on hospital coststhercforeis ambiguous.2~ The laws may lower costs if they reduce qualitycompetition and the wastefulduplication of facilities. Of ~heymayraise costs if they lead toa more costly mix of inputs thanwould be determined ~ymarket forc:es orto reduced competitivepressure to conta in costs or adopt cost-reducing innovations.The issue of whether CON laws affect hospital costs is anempirical one. The ne,xt pa,rtof th,issection selectively discussesseveral of the previous empirical analyses of the effects of CONlaws on hospital costs.
B. Literature Review
There is a large empir\cal1iteraturetbat evaluates the effects, of regutationon the costs of instit~tional health care. primarily
11 The Federal Trade Commission found evidence thathospitals in the Chattanooga , Tennessee area had agreed to usethe CON process both to challenge the entry of new competitorsand to divide markets. Hospital Corpora tion of America , 106
C. 361 , - (1985), a/I'd 807 F.2d 1381 (7th Cir. 1986),
~,
107 S.Ct. 1975 (1987).
n , Posner (1974) has suggested tha in add ition to
preventingne", entr.y into health care markets (and thereforefostering cartelizing behavior on tJu: part of incumbent.hospitals).CON laws may a1so limit the dissipation of rents through qualityompetition among incumbents that woulddestabilize a cartel.
2S Theoretical models of hospital behavior. generallyprovide ambig~ous results for the effects of regulationsrestricting input usage. See . for example , Sloan a nd Stein wald (1980).
Sect ion IJ
in hospitals. A number of these studies have examined theeffects of CON laws on hospital costs, and some have takenaccount of other regulations ill evaluating the 'effector CONprograms. The consensus or these studies is that CON laws havenot been successful in ' restraining hospital costs, regardless ofthe way in which costs are measured. This part of the study,selectively reviews several of the major empirical studies of CON
, laws.24 Early studies of CON laws by Salk~ver and Bice (I976, 1979)
used data from the 1969-72 period to e'xamine the effects of stateCON laws on hospital investment and ~osts.16 The aut-hors usedhospital data aggregated to the state level , and used twovariables to describe a state s .CON program. - The first was adummy variable that indicated whether thestatehada CON lawfor at le2st six months of a given year. ' The second variablemeasured the fraction of the four-year period during which aCON law was in efrect; This latter variable was created toaccount for the possibility that CON laws: take time Cromtheirenactment to have an effect on hospital investment and costs.
Salkever and Bicc estimated the effects of CON laws onchanges in hospitals' total investment, bed supply, and' plantassets per bed. They found that CON laws were not significantlyassociated with any change in total hospital investment, butrather with a transfer of investmc:ntaway fromnew beds toward
24 Sloan and Steinwald (1981) provide a general reviewof the empirical literature measuring the effects of CON aridother forms of hospital regulation on hospital costs.
15 The time period covered by thiS' study was after somestates began to adopt CON programs on their own init~ative, butbefore Congress required that states esta'blish CON programs
. under the NHPRDA of 1974.

Section U
uncovered, non-bed assets.1e The ;authors found that thepresence of a CON law was associated with an increase inaverage per day inpatient cos ts of about 3 percent.
Sloan and Steinwald (1980) analyzed the effect of CON lawsand other forms of regulatianon hospital costs and investmentsusing a sample or over 1 200 hospitals for the 1969-75 period.They created severaivariablestocharacteri'ze (e. , in terms ofage and comprehensiveness) a state s' CON' progtam. CONprograms that were more than 2 years old wered:istinguishedfrom, those which had operated for less tha'n two years. AlsoCON programs which reviewed se,rvicesand had a low capitalreview threshold were distinguished from' other programs. Thestudy also included variables on states. Section 1122 programsand. rate regulation.
Sloan andSteinwald found that comprehensive CON programsappeared to have noerfect on average hospital costs (per day orper admission). and that less comprehensive programs (focusingprimarily on bed expansion) wereas$ociatcd with higher coststhan hospitals in states without CON laws. The age of the CONprograms was not related to hospital' costs. Jn examining theinput use of hospitacls, the authors found no evidence thatuncovered assets were substituted by hospitals for beds as hadSalkeverand Dice; t~ey did find that hos:pitals covered by CONprograms iricreased their' useof labor input's.
Sloan (1981) used along time-series (1963 through 1978) ofstate cross-sections to examine the errectsL or CON programsSection 1122 agreements. and rate regula tions on'average hospitalcosts (per day and peradmission)within states. Sloan concludedthat over this time. neither CON laws nor the Se~tion 1122
coefficient of an independent variable in aregression is described in this literature review as statisticallysignificant if the null hypothesis that the independent variablehas nO errect on the dependent variable cannot be rejected usingthe conventional two-tailed (-test at the 9S percent standard ofconfidence.
1 S
iOI!
program had an impact on the level of hospital' costs or th~irrate of increase. , Of the regulatory programs examined in thestudy, only mandatory prospective rate regulntionappeared tolower costs significantly.
Joskow (1981) used an annual time-series of total hospitalexpenditures by state over the period 1973- to' evaluate theerr cct of the presencepfa CON law and of mandatory state rateregulation on the level and growth' of hospHal expenditures.
, Though the presence of rate regulatiDnwas associated with lowertotal hospital expenditures and with lower growth of thesec,xpenditures, Joskow found no significant; erfect for CONregu la lion.
Eastaugh (1982) used an annual" time-series on severalmeasures of hospital investment by state def'ined over the period1974..78 to assess the effects of CON programs and Section 1122itgreemcnts on hospital investment. Eastaugh concluded thatneither CON nor Section II 22 programs appeared to be effectivein constraining plant assets , beds , or 'assets per bed in hospitals.His regression results were statisticaHy insignificant (using thestandard discussed in our footnore26), but they suggested that
CON programs were associated with increased hospital investment.
Kelly and Farley (1985) used a national sample of over 400hospitals to model the financial performance of hospitals over theperiod 1970-78. Embedded within their structural model is anequation that relates the average cost per adjusted hospitaladmission to a set of variables . including anindicator of whethera CON law was present or not in a state. :Evaluating theirmodel at the 1975 mean level of hospital costs , the coefficient ofthe CON variable implies that the presence of a CqN law wasassoCiated with a statistically significant increase in average costof 3.5 percent.
27 Adjusted admission in both this and in Noether(1987) study means that the admission figure is a revenue-
. hted average of inpatient and outpatient admissions.
Section II
Noether (1987) obtained a similar result in her study orhospital competition within Standard Metropolitan StatisticalAreas (SMSAs). sing 1977 data both forindiv~dual hospitals andaggregated to the level of the SMSA , Noether found that CONlaws that h-adbcen in effect for three years were associated 'witha 3.3 percent increase in average costs per adjusted admission attheSMSAlevcl . and a 4.0 percent i~creasein average costs peradjustect admission for individ,ual hospitats.28 Noether s study isintercs!ing in that it also assessed , the impact of CQN laws on
the prices of different services provided to Medicare patients.Her empirical evidence indicated that CON laws may be associatedwith price increases that ,;ue larger , than the correspondingincrease in costs. This suggests that CON J!'ws may lead tohigher profit margins. a" outcome consistent with the theory thatCQNlaws may serve as barriers to new competition.
~oncJusion
The existing ' studies of the effects of CON laws on hospitalcosts have used data from the 19705 , a lime when CON regulationcovered only the capitalacQu i~itions of hospitals and were fairlyuniform in their coverage across s~3tes. Since this time . therthave been substantial changes both in theoperatioo of CON lawsand in the hospital markets they re&",Iatc.
28 The coefficient of the CON variable in the SMSA-level regression barely missed meeting the 95 n~rcent level ofsignificance. The coefficient in the hospital- level rcgrcs~inn wassignificant; a misprint in the published report (werslates its t-ratio above its actual value of 2.4 (conversation wilh,author).
Noether also found that prospective rate regulation wasassociated with lower hospital prices. but that this (ormregulation was not associated with any effect on hospitalexpenditures. Noether did findthat~hcpresc:nce of a Section1122 agreement was associated with a s ignificant decrease inexpenditures at the level of the individual hospital . but not atthe SMSA level.
III. The Model and nata
This study attempts to measure the Impact of state CONlaws and other forms of regulation on individualhospitals ' costs.T~is analysis involves the empirical specification of costfunction in which the total expenses of individual hospitals arerelated to otherfac,ors, inc1uding state (ON regulations, ,which arc thought to infiucncc these costs. This section firstdiscussesthe rrsethodology used in modclling h9spital costs, ' andsubsequently dis('usseslhe empirical specification and data usedin this study.
A. Gcneral MoJi 1s of Uosoital Costs
Hospital costs maybe arialyzedusing the neoclassical economictheory of the firm. Within this framework . the problemfacing afirm in producing any level of output is to use inputs in such a way that total costs are at a minimum. A ' cost functionmathematically relates total costs to the output levels and inputprices for the firm. Measures of the average "and marginal costsof producing output may be obtained from total cost functic;mestima tes. Under the assumption that firms min imi7.e costs, acost function can be used to estimate not only cconomies ofscale, but also economics of scope: and input substitutability,along with other elements of production technology. Theregeneral1y exists a "duality" betw~ , the production and costfunctions of a firm; i.e., information on one can be u!ied ~oretrieve information on the other.32
The cost function of a firm can be expressed as
(I) Cost =~PiXi = CtY
p),
hi where Cost is the total cost of producing output Y . and the are the prices of each of the n inputs. X i. used in production.The firm optimaUy chooses levels of inputs to minimize costliven that Yunits of output are produced. In estimating a costfunction~the distinction must be made between long- and short-run costs. In the long-run , all inputs may be .varied to produce
McFadden (1918) genera 11 y discusses th is dua lity.

Sect ion
With the 1979 amendments to the NH PR OA , Congress expandedCON programs to include review of entry intoricw services , andthe purchases of majorrnedicalequipment. Congress subsequentlygave states authority to deviate from federal guidelines and setthe threshold levels for CON review' ':'Iahout the risk of losingfederal funds~ Asa resultithere is now variation in' CON reviewthresholds across states', while several other states haveahandonedCON review altogtthe,f.
There have also been substantial changes in the way healthcare markets operate. Price competition among hospitals hasincreased as consumers, employers who pay health insurancepremi' ums , and third~partypayers have become mere sensitive tothe priceofhcahh care~so Hospitals may have greater incentivesin the face of changes in health care markets to use resourcesmore efficient! y.
This study assesses the effects oCeON laws on hospital costs'in, this:newenvironment by using data, from the 1983-84 period.The ensuing section discusses the multiproduct cost functionframework and data that are used in the empirical work. The,use of a cost funclion that accounts for the multiproduct natureof hospital output is more consistent,with recent theoretical andempirical work involving multiproduct firms than are previous
studies of hospital regulation that have used single-productmodels of the firm.
, ,
so See for example, Noether (1987) for a fuUer discussion, of these and other change in health care markets since the late
1970s.
Cowing, Holtmann, and Powers (1983).

J!J
a level of output. The implicit. assumptionin equation (I) is thatall inputs havc been chosen tQ minimizc cost, .n assumptionwhich defines the meaning of 10n.gTrun.
In a short-run cost function , certain. inputs (such as capital)may he fixed during the decision period. and the firm will chooseamong Icvelsor those inputs that can be varied to minimize itsvariable costs of treating a given, volume and mix of' patients.rhc short-run costs of a firm , Cost ... can be written as
, '
(2) Cost.=~PiX i = C(Y, K )
..~
where K represents the level of inputs (such- as building size orhcd('apacity) that are fi~ed inthe short-run , but which may bechanRcd in thc lonR.run.
Thc above equations present very general theoreticalframeworks within which hospital costs maybe analyzed. Theexact specifica,tion of these cQuationsin any particular context isdetermined both, hy the nature of the fescarch problem beingad(1ressed , and \1y thc availability of data. Studies of hospitalcosts typically have used measures of either (I) total costs , (2)the average cost or a service (or set or services), or (3) theaverage cost of eithcranadmission into ora day inthc hospital.The uni,t of observation in cost studies has included bothindividual hospitals and averages for hospitals located within astate or locality. In addition to including measures of hospitaloutputs and input prices, cost studies often include other fa,ctorsthat are believed to influence hospital costs. These variablesmay include the ownership status (Le., for-profit or not- for-profit) of hospitals , the teaching status of hospitals. the sourceof payment~ hospitals receive , and the market and' regulatoryenvironments in which hospitals operate.
There arc several ways in which a given specification of acost function may be interpreted. One interpretation is that ,the
S! A comprehensive general surveyor empirical analysesof hospital costs is Cowing, tfoltmann . and Powers (1983).
Section III
cost function is derived from an exact model of the firmsproduction technology such as the Cobb-Douglas productionfunction. An empirical cost functidnmay also be thought of asan approxim3tion to a true cost function derived from aproduction process of unknown functional form (e. . the translogfunction); Such cost' funetioDs are typically specified to be
, flexible enough to be able to approximate a wide variety ofunderlying cost functions derived from different productiontechnologies.34 Fina1ly, a statistical cost function may thought or as a simple description of the distdbution of costsgiven the levels or factors tha t influence costs. Such a costrelationship need not explicitly be derived_from a behavioralmodel of a cost-minimizing firm;
One of the most important features of hospitals is that theydo not produce a sing1ehomogenousoutput. but instead producedistinct output!;
, '
stich as outpatient care and intensive' care unitservices, which may differ greatly in the resources required toproduce them. Early modcts of hospital costs typically used asingle measure tJf hospitalout' put, such as tota' number of bedsor total inp~Hient days~ without taking account of variation inhospitals mix of cases~
Many empirical models of hoc;pita 1 costs ha vc a (tempted toaccount for the" heterogeneous nature of hospital services byweighting the various servicesproduccd by hospitalsi nto a singleindex that measures the diversity of an individual hospital'output. A simple example or such an index combines the totalnumber of inpa tientdays and outpa tient \' i~it'\ hy wright i ng eachby the share of overall hospit:11 ,revenue it ~cneratcs. Morecomplicated indiCes compare the mix of ca~cc; ~(' ro~;~ different
S4 The concept of flexibility in production economics isdiscussed along with other aspects of functional form ineconometric model building by Lau (1986).
SI Cowing ('lal. (1983) note that many studies of hospital
costs are nol well motivated by economic theory a nd tend to bead hoc in nature.

Section ill
The general cost framework outlin,ed above may readily bemodified to account for the multidimensional nature of hospitaloutput by defining the element Y in '(I) ~nd (2) ,as a vector ofoutputs rather than scalar. ' Each of a hospital's outputsseparately enters the cost function. The theory of the firmproducing multiple outputs fromcommon inputs has been recentlydeveloped in the economic literature and implemented ineconomctdc models of the firm.
Each service produced by hospitals could , in theory, enter anestimated hospital cost function. Hospitals, however. typicallyproduce hundreds of separate services. II!. order to makeestimation of a cost function. manageable, it is necessary toaggregate these services into a much smaller ' number ofoutputs.so Aggregation of a set of services into a compositeoutput implicitly assumes that there are ,no economies ordiseconomies of scope among the outputs included in thecomposite.
Several recent empir.ical studies have estimated multiproductcost functions for hospitals~ primarily to assess economies ofscale and of scope in the production of hospital outputs.40 They
38 Bailey and Friedlaender (1982) provide a goodintroduction to the economics of the multiproduct firm.
so A highly disaggregated approach woulclgrcatly increac;cthe number of coefficients to be estimated in a coo;( function andlikely lead to collinearity among variables, particularly amongthose services provided by a small number of hospitals. Collinearity among variables in a regression makes it more likelythat the hypothesis that there is no relation between anexplanatory variable andthe dependent variable will be rejected.
40 In addition to the study by Grannemann et al. (1986),
discussed in the next part of this section , two other multiproductanalyses of hospitals should be noted. Cowing and Holtmann(1983) analyzed cross-section data from 1915 for 138 hospitals in, (continued...
Sect ion W
d iag,nQst ic ca tegories a t a Rind iv idua haspi tal to t he a \'c rage mixof cases across hospitals.
' '" .
Though the introduction of a case~rnix index into a costfunctionmay control for variation in casem.x acrOS$ hospitals, is not clear how use of an indexthataggregateshospital outputsinto a ' single inde~ can be ' used to , et.ricve the unc1"dyingclements of the structure of costs. such as economiCs or scale
- and scope for individual, outputs.s7 ~ This suggests that analternat ive tousing case-mix indices is to estilTlate cost functionsinto which ,the scparate,outputs orhospital~ arc directly entered.
';"
" '6 1~ornbrook and Mo~heit (1985) create a I.aspeyresindex of case-mix pr.oportionsusingsample average length-of:-stayweights to compare differences in th~ nui;11ber of longer-stayingcases admitted among.~ospitals. Another inde that could be
, used to conttol for case mix differences among hospitals is theResource Necd Index (R Nt) devclopcc:l by the c:ommission onProfcssional and Hospital Activities. Th is index compa f es the mixof discharges and 'their sevcrityacross hospitals~sing a set ofweights obta incd fr a sample of hospitals. An outside reviewerof this report has noted that this index is , however, currentlyavailable for onty 600-100 hospitals.
Sf A second problem in usingcase~mixindices is noted bySloan c/ at. (1983) who use the Resource Nced Index (RNI) inestimating a cost function, Two hospitals may have the samevalueofa case-mix index yettl'eat 4ifferentmixes of cases. Theauthors give the hypothetical ex;imple Qf a hospital that treatsonly,. one type of case and a second th~t treais,a. wide range of cases. Each hospital may have the same value of the RNI butthe second hospital may havc:. higher costs if, for example, itmaintains excess capacity across departments. tQ treat this morediverse mix of cases. Sioanelal. usetbe e~ample to motivatethe inClusion of teaching variabl~s into. an empirical costfunction, arguing that these variables may pick up systematicdiversity i,n case-mix diversity not captured by the R Nt
~ .,

lli!i9n HI
, have ndt, however, included information on state CON laws orother hospital regulations as factors influencing hospital costs.
The basic behavioral assumption necessary to derive aneoclassical cost function for a hospital istbat hospitals taketheir output Ic:vels asgivenand usetbeir inputs to minimize thecosts of producing these oUtput levelS. The assumption thathospitahminimize costs is a more general assumption than onethat they maximize profits; a firm can minimize its costs withoutmaximizing its profits. Most hospitals are not operated forprofit, and there arc ma'ny competing theories of wbat objectivesthey pursue.4t Cost minimization is, however. arguablyconsistent. with many theories of nonprofithospitals.
Given tlie assumption that hospitals minimize costs, theclements of the underlying production technology, such asec(lnomiesof stale and scope, mayberetrievedfrom an estimatedcost function. Absenl this assumption , itis notclear that a costfunction can be u~ed to " retrieve parameters of the dual
production technology., An estima~ed cost function can , in anycasc , be used to assess the relationship between co~ts and agiven variable conditioned on the other variables included in tbecost rel~ ttonsb ip.
(...
continucd) New York state to estimate a " translog cost function invo1vingfour categories or inpatient days and 'outpatient visits. Changand Tuckerman (1986)used:198Idata on r5) Tcnncssee hospitalsto estimate , 3 tr~ns1og CQsf function with tota~~ adult~ children.and' MccHcarc ' inprtticnt days~s the threeoutpui measures.
41 See forexample, NeWl1ous~(197())~Pauly and Rediseh(191l). Harristi978), Pauly (l98()) al1dGoldnnb. Hornbrook, andRafferty (1980) for (fifret.ent models offhegoais and constraintsunder whichtJospitals operate.
Cowing et at. (1983) discuss this point in some detail.
~ction III
B. 'OS( function'Soccification
The cost function used in this study is similar to the onerecently used by Grannem~nn el aL(1986) to asscss economies ofs(:ate and of scope in the production of five hospital services.The authors used data on 861 hospilalsfrom the 1981 AmericanHospital Association (AHA) ,survey. 'an e. arHer version of, tbesurvey tbat provides the data for the prescnt study. These datawere matched to other data sources to estimatc ;I, cost functionthat can be gcnerally specified in its estimating form for anindividual hospital as:
(3) InCost = A + B InP +C fey) + 0 Z + e
The dependent variable is the natural logarithm of the totalannual costs of the; , .vital. P is a v~ctor :of input prices, while
is a vecto'roffactors which influt: r;tce the level of costs (butnotthe shape of the cost function with resp~ct.. to outPuts). Theexpressipn f(\');s3 comple)( funct ion oftheindividual outputs.
. C. 0 are coefficients to be estimated. An error term e is
43 The authors write fey) to include the level of eachoutput. the square of each output, andtht cube of each output;cert~in interactions among th~ outputs are also included. ' In
, order to 'evaluate changes in the length ofastay in a hospitalthat is to examine the additional cost ofi)roviding additionaldays of treatment to a fixed number of patients, thcy alsoinclude the: number of discharges for each category of inpatientcare in their specification. This approach is not followed in thisstudy. , Such a specification does not allow calculation of thecost of pr-oducing either ' hospital discharges or patient dayswithout the other because neither exists without the other. Thiscalculationis necessary forca1cula tion of economics both of scaleand Scope for these outputs.
~ili2!LllL~__. --
.----. . ----
ch is estimated by the:uhlctt to the egression equat Ion . W ,method of ,or d I na ry least ~quares.
This cost function is quite flexible wi!h respect to ~utputs;e., the function fey) is:. writteo that It can ~pproxlma
;:hwide rangc tclationships between costs ~o4. outpU!s. spccifkationof fCY)canrcadily accommodaleJt()spltals ~~ Wh~~h~omc , output~ are not 'produced. This featuf~ consl ~ra ysimplifies cstirna tionof parameters
, ,
, '1Vcll as calculation of
--------,. -. ---..
The .err~ lcrm is ;lssurned 10 he identically andindcpcndcnily normally disHibilted. A spccification of thedistrihutibna i form or the errOr term is nccc$sary , in order tomake stat ist iea j in f ("rences c()nccrn ingthc cst i ma fed regressioncoefficients Thc use of the nor ilIa I , distribution permitssymmetric random variation away
f,C\m the hospitals' true cost-minimi7.ing positif)Os and captures the effe~..~t of random shocksoutside ' a hospital's control nn costs.
A onc.sidcd error term could be atlded both to the costequation to capture systt"matic technical inefficiency on the partof h()~pitals and tn the accomn~nying input share equations(which could he c'\t;mated if inJHlt price data were available) capture systemati~allocative inefficiency in their utilization ofinputs. The econometric mc thods of stochastic- frontiercstimatiim (fevelopedtJy Aigncr, Lovcll and Schmidt (1978) havenot been :ippljecJ tn hf)spitaJs.
Wilson and Joidlow (1982) used a deterministic model of frontier estimation to,assess the extentto.which hospitals failedto produce the max imum possible output of nuclear medicineservices. Registerand Rruiling(19871used a deterministic modelof frontier estimation to asscss differences
, ,
in the technicalefficiency of hospitals acro')s different forms of ownership.

Section LIT-
-.--
scope economics , when thecDst funcliol1 must be evaluated whensome outputs arc not produced.
The. regulation variables in our study enter the cost functionas part of , the veclor Z. By using the metho(i or multipleregression , we can assess the effect or. regulations ,on the levelof hospital costs, controlling roroutp~tJevelsand,other variablesentere~ into the equation , by examining the estimated coefficientsof the regulation variables.46 The vector Z, also containsvariables which measure hospital characteristics, such ownership and teaching status, along with variables on th'patient mixtrealed by hospit;ib. Thesevar-iables enter the costfunction inpart tocapturedifferencesin case, mix and method oftreatment not reflected in ,he distribution of o~tputs.
45 , , One difficulty in using,the traoslog cost function isthat it is not pos~dhle 1,0 evaluate dir:ectlycostsif any output isnolproduced. The function can , however , be modified by a 80x-Cox transformation of the output variab'e$toapproximatc theirnatural log'"rithmic (ransfoi' : !i,'lt ion whilestill accommodating zerooutput levels (see Caves el at. (IQ80)).
The specification of a cost functionineQualion (3) does notinclude any, interactions among input prices and ,outputs. Thislack of interaction implies that changes in input prices affect theoverall level, of costs by a scale factor and do nOl affectmarginal or average incremental costs; input proporl ions arctherefore independent of scale. Formally, this assumes tha t IheprO(Juctiori function dual to the cost function is homothctic(Varian 1978). Thoughoutp.~ts could of co~rse be interactedwith the different input prices, Grannemann el ale (1986) chosenol tod() so, citing the relalively:poorquality of the input datacompared)Nith the output
data. We follow this strategy in ourestimation for the same reason.
di 48 .The inte~pretation of individ~al coefficients
SCussed 10 the section that presents results.

Sect ion JIt____-
C. ~L~Jl'l Outout V-AIiables
The primary source of data used in this study is the Annual rvcY of II2.mitiliconducted by theAmerlc~n Hospital
, Association CAlf A). This national database provides detailedinformation on hospital outputs and expenses along with generalcharacteristics or hospitals, such as ow-nershipstatus. For mosth~spitals in the sample . the data cover a 12-month period cndingin September 1984.47 Approximately 6,300 short-term , gener'atacute-care hospitals were included in (he survey.48
The sample was restricted to those general medical andsurgical hospitals located within the fiftystates'and the Districtof Columbia that reported data for a full'-year. Specialtyinst it ut iOIl!;, such :t~ psych int rie a nd children s hospita Is , wereexCluded from the ~3m"lc . 3'\ were hospitals maintained by thefederal govcrnmrnt.4V The ~ample was further restricted toinclude only hospitals that reported information on all of the
,variahlcs used in the analysis. A total of -J 708hospitals wereused in the analysis~ :rhe data file gave the state in which thehospital was located; infqrm:.tion or. rcgulntions was matched tothe hospital file hy sf:.
The AliA file break!\ down the total expenses of hospitals intoseveral categories that may be aggregated to form two differentdependent variables measuring (in logarithmicform) the total
47 About 50 percent' of the hospitals in the sampleprovided information for the year ending in September 1984; 27percent of hoSl)itals reported for the yearendil1gin June 1984and II percent for the year ending in ' Decern~c'f 1984.
48 The AHA defines a short-term hospitatas one in whichthe average length or stay is less than~O days.
49 Federal hospitals are primarily military, VeteransAdmi~istration .. and prison hospitals with restricted clientele.
Section II
operating costs of hospitals.1() The first variable. LNfTCOSTincludes all expenses hospitals incur net of depreciation andinterest costs. The variable represents the short-run variablecos.tsoC keeping a hospital open. We assume tbatiC a hospit~1were to close ,briefly, interest and depreciation expenses wouldunavoidably be incurred.11 The second variable, L TOTCOST,includes all expenseslncurred by hospita1s. Since this variableimplicitly contains the cost of capital, it is usually presented as along-run cost variable~ The two cost variables are closelycorrelated (r= 99); theshareoCdepreciation and interest in totalcost is close to seven percent for roost hospitals in the sample.
Most studies of hospital costs have used overall hospitalexpenses at a point in time as a measure oCthelong-run costsof hospitals to estimate equation (I).bove. This assumes thathospitals are operating along their long-runcostcurves. and thatthe measured scale and other production effects reflect levels ofall inputs chosen to minimize costs. These assumptions arenecessary ' if cost estimates are used to assess economies of scaleand issues of optimal hospital size andprlcing in the long-run.
The assumption that hospitals are i~ l(Jng-run cquilibrium at apoint in time may not be valid.52 Several studies suggest that ittakes a period of several years for hospitals to adjust their
10 Though the AHA survey gathers information on thecapital expenditures of hospitals, these data are not released inthe public version of the tape. Thcsc c~penditllrcs arc theinvestments hospitals make and should not be included in a costfunction.
11 The AHA does not break out , information that wouldallow us to assess the costs of maintaining a hospital were it toclose.
Cowing el at. (1983) discuss this pornt at some length.

Section ill
capital inputs to an optimal ' leveLls The implicalion of thisresult is that hospitals art not lik~ly to be minimizing long-runcosts at a point at time. The input usage and costs observedover a one-year' sample period may be those ora firm adjustinginputs to an optimum level over a longer time period.
An alternative Ito combining all hospital expenses into ameasure of, cost is to use only short-run costs to estimateequation (2). Other than their different dependentvariab'es, thetwo equations are the same except that A measure of fixed inputsmust be added to the short-run cost equation. The AHA data donot contain a direct measure of capita' stock; the variable1.8EOTOT. the natural logarithm of the number of beds in thehospital , is entered into the regression as a measure of capacity.Changes in total CO!\ts associated with changes in outputs can bethought ofac; purClyshort-run scale effects in which non-capitalinputs arc adjusted to minimize costs given the fixed bedcapacity; They do not represent the changes in costs hospitalswould experience in the long-run as all inputs were adjusted toaccommodate different patient volumes and case mixes.
This study uses botb the short- and long-run specification
the hospital cost function. Our primary interest is in the effectsof regulation on the overall hospital costs rather than scaleeconomies. The use or both types of cost functions allows us toassess the relationship between regulation variables and measuresof hospital costs which first include and then exclude' theinterest and dep,reciation costs associated with past capitalinvestment. CON laws regulate hospitals. use of capital andequipment inputs . andthis regulation may affect both the level
investment and the wa y in wh ich , regulated and unregulatedinputs arc used. 13 KeUy (1985) provides a review of empirical models
hospital investment that measure the speed with which hospitalsadjust existing capital stocks to their optimal levels. Theconsistent finding of these studies (wh~ch use partial adjustmentmodels of investment) is that at least three years is required forcapital inputs to adjust to optimal levels.
Sectiol) '
The AHA survey contains information on 30 separatecategories of hospital care that make up the output of hospitals.Though each categOry could be entered into a regression (alongwith squared , cubed , and cross.output interactions), the strategy
. herc is to aggregate the outputs into rivecatcgories on the basisof the intensity of care hospitals provide to patients~ ' The fiveoutput variables are denoted as Y 1 through Y,.
' ,
The first variable, V l' measures the total number of inpatient,days spent in acute care, which represents the: largest share patienfdays spent in hospitals. Most acute care days representscneral medica1 andd surgical care; the variable also includes,
obstetric' and acute psychiatric care. The variable)', ineasuresthe total number 'of patient days spent in intensive care units.These 'days include medical and surgical care, cardiac intensivecare neonatalcare, and burn and other special care~ The thirdvariable Ys, includes patient days spent in.subacutecare andother units within the hospital. The variable inCludes long-term
, nursing care, sheltered C8re~ rehabilitation care, and ' hospiceCare.54 The variables V. arid V 5 measure the outpatient careprovided :by hospitals. Y 4 includes all visits ' to hospita1emergency rooms and VI the clinic and other outpatient visitsmade to hospitals.
; Eacb output variable (V i) is entered into the regression in itslevelrormatong~ith ' its square (Yi ) and its cube (Vi ). Thisspecification of,tbecdstfunction allows thepercentagc change inthe: total cost to vary with the level of any single output,holding the other outputs constant. If marginal costs arepositive, then a pattern of positive, negative, and positivecoeffiCients on an output variable, its squarc . and its, cube,respectively, would mean that thc marginal costs of prod ltci ng
, that output decline up to some point, at which scale economies, "re;.el.baust~d, and thet.' turn upward. Each output variable is" alSo sep;trately muhipliedtiy each otlier outPut~ariablc:to createinteraction variables of the form Y iY j' These interaction
14 Long-term nursing care days provided in nursing homessepatatelymaintained by hospitals are not included in Ys.
Section .III
variables add to the flexibility of the model by allowing themarginal cost of an Qutput to vary ~ith the level of all otheroutputs. Economies of scope between t-~o outputs in aproduction process exist if themarginat costof produciog extraoutput from a gi"en level is lowered If it is produced with thesecond output.
D. The In..t!.ut PriceVariabl
In order to estimate a cost function , it is necessary to havemeasures of the prices of the inpq,1s that hospitals use inproviding services. The AHA data are very limited in. providingthese prices. They separate the annual total expcnses ofhospitals into several broad categories., The largest portion these expenses consists of payroll expenses. The AHA fileprovides a breakdown of ann~al payroll expenses, for differentcategories of labor alo~g with the , fun-time equivalentemployment in each of the categories.16 By dividing payrollexpenses for each type of employee by the number ofemployeesan annual salary can becalculatedt~:atis the average price ofemploying an extra unit of each type of labor.
Separate salary measures can be calculated from the data forphysicians and dentists. nurse~. residents. trainees. and all other,hospital perso.nncl.Each of thecalcula ted salary figures could beincluded in the regressio.n. One pro.blem . howeverw i~ that manyhospitals do. not ha ve physicians and dentists, residents. or other
&5 For economies of scope to exist between two outputsthe derivative of the marginalcostof one outputwilh respect tothe other ,must be negativ For theg~n~ral ~ost fuf1ction used
" here which has O)ore than lwo outputs. a nec:e~sary but not, s~fficient condition for thi~ . outcome to exist is that thecoefficient or ' the interaction variable betw:een two outputvariables be negative.
56 Full-time-equivalent employment is calculated by addingthe number of full-t.me personnel to one-half the number ofpart-time personnel.
Section llJ
trainees on their payrolls. To include variables forthesalariesof these employees in the regression would substantially reducethe number of observations used in the estimation. One salarymeasure which can, be calculated for nearly all hospitals in thesample is the average salary of ' nurses. ' O~hersalary measuresare quite closely correlated witb tbe salaries of nurses~ andratber tban entering each salary into the equation , the naturallogtlrithm of nurses' wages , LNURSEWG is entered into theregression as a single measure of, the price of hospital labor.
The AHA data do not include the information necessary
further calculate prices for items outside of the payroll cat~gory.Therefore, only the nursing cost variable is entered in1 ' tberegression as a meaSUl:e of the prices of hospital inputs.Omitting variables for nonpayroU costs can be justified on two,rounds. The first is that two components of nonpayrall costs,employee benefits and contracted nursing services, are closely
, correlated With the labor cost variable.58 A third expense,professional fees , is itself a cost of labor, anditspricei$likelyto be correlated withLNURSEWG. Other expenses included inthc nonpayrolt category are interest and depredation , energycosts~ and wall other" expenses. Price variables for these expensecategories are excluded frolD the r~gression on the assumptionthat they do not vary across hospitals an assumption that maybe valid for capital costS.
"~
IT Grannemann et al. (1986) used the nursing wage along
with several other wage variables to measure input prices; onlythe coefficient of the nursing wage variable approached thestandard 95 percent level of statistical confidence.
Measures of average employee benefit and averageyearly expense per contracted nurse ar~highly correlated withthe nursing wage variable.
10 An implicit assumption in using input cost variables isthat hospitals are price takers in factor markets and do notexhibit any monopsonistic control over the factors of production.

Section Il.I
E. OrganizationaLforms o Hosoitals
One difference among hospitals th,at could potentially affecttheir expenses is their organizational form. The AHAdataaliowus to distinguish among three: categories of hospital ownership:voluntary (i. , private not-for-profit). fo-r-profit . and non-federalgovernment (federally operated hospitals ha ve been excluded fromthe sample). Nationally, voluntary hospitals maintain about percent of all short-term hospital beds in the country, while for-profit hospitals maintain 9 percent of.the nation s hospital beds.Hospitals maintained by state and local governments contain 20percent of short-term beds.
There are several reasons why different ownership structuresmight affect the le"eloLhospital costs. In a for-profit hospitalmanagers have an incentive to maximize net return for thebenefit of shareholders who have a claim to the hospital'profits. Managers arc unlikely to be rewarded if they fail toproduce an adequate return to shareholders. In a nonprofitsetting, there arc no direct claimants to the residuals created inproviding hospital serviec:s;61 The goals of nonprofit hospitalmanagers may be to produce a net return less than the m. . :11um
and to generate non~pecuniary henefits for themselves. Unlessn:tanagers are compc:nsatedby hospital trustees for maximizing netreturns. they may use resources to enhance their own utility,perhaps by increasing the prestige of their institutions byundertaking costly research p~ojects. Such behavior may lead to
American lIospital Association (1985).
61 Nonprofit is used here to refer to both voluntary andgovernment hospitals.
82 Somc hospital models (C.g. Pauly and Redisch (1973))focus on the role of physicians in hospital decision making.Within the context of these models, a hospital is viewed as a cooperative among attendingphysicianswhocooperate in order tomaximize their collective incomes and therefore , scrve claimants to residuals produced in a nonprofit setting.
5.cct ion III
inefficiencies that would raise tbe costs of providing hospitalservices relative to for-profifhospitals.
. .
Costs may differ between nonprofitandfor-pr,ofit hospitalsbecause of differencesintbepatients they,;tir:cat and the servicesthey offer. Nonprofit, hospitals 'may, attempt to subsidize theprices charged to indigent (orpoorlyinsured)patientsby' raisingprices to wealthier (or morei completdyinsured)patients. For-
profits may specialize an treating patients who arc more,ful1y able to pay their hospital bills, either by attracting thesepatients by orfering high quality servicesanda' menlties or bytreating fewer indigent , patients. : If they donolsubsidi.ze asmany indigent patients, for-profithospitaJsmay find it feasibleto offer higher-cost , higherquality;care to those who desire itand can pay for it.83
Empirical evidence on the effects of ' ownc' rship status on
hospital costs ' is mixed. , Becker and Sloan (1985) found thatownership did not significantly affect the total cost of either anadjusted (for outpatient volume) patient day or an adjusted
admission. Two studies that estimatedmultiproduct,hospitalcostfunctions came to different conc1usionswith respect to the effectof ownership str"cture. Cowing~nd HoUmann(l983)found thatcos,ts were ab() ~ 15 percent lower in for-profit hospitals than inoth~r hospitals. whereas GraoRemann el al. ( 1986) found costswere about IS percent higher in for..profit hospitals thanvoluntary hospitals.64 These la uer authors conclude that the
IS , The availableempiricalevidencegeneraHy' suggests thatfor-profit hospitals ,and onprofit hospitats " provide simita r amou nts or uncompensated carc' (Sloanelnt (t986)) and treatsimilar patient:and payor rnixes(Watt et al. (1986)).
' ,, ,
i'
84 The study by Granneinanri el al. (1986) reports a
statistically significant coefficient that indicates that hospitalcos~s are 0.8 percent lowerrornon~federal gover'nmenrltospitalsthan for voluntary hospitals. Their text, however . states (p. 118)that these costs are 8 percent low~r.
35
partic;:ularly for-profit ones, tend to raise the cost or care.-81
Becker and Sloan (l98S) found that affiliation, with a chain hadno statistically significant effect on costs for either government
, or voluntary hospitals b\itwasassocia led with higher costs forfor-profit 11 ospj ta Is. Ermann and Gable suggestthatsysteanstendto grow by purchasing inefficient , high-cost hospitals, and Beckerand Sloan present evidence that it may take time for chains toachic,:ve cost-savings once inefficient hospita1s have beenacquired~88 '
, Three dummy variables denoledGUVMUL T~ VOLMULT and, PROFMULTare added to the regressio,nto indicate whether ahospital is affiliated with other hospitals. All take the value ofzero if the hospital is Jndepcndent., If the individual hospital is
, part of a multi-hospital system, the variables respectively takethe value of one if hospital is a government hospital, avoluntary hospital , or a for-profit hospital. The use of these
;' "
Ermannand Gable (l98S). p. 415.
88 An alternative explanation of why hospitals that arepart of a multi:-hospital system may have higher costs thanindependent hospitals is that they provide a, higher.quality of services, the dimensions of which are not fully captured empirical cost relationships. Noether (1987) rejects thishYPolhesis aftcr finding that managed and system hospitalslenerany, do ;not charge higherpricestha nindcpenden thospi talseveit l~ough they ,appear to have higher costs. Becker:and'Sloan(1985), however, prescot e"idencethat ror-p~ofitch.inhospitalshave revenue-cost ratios that are similar to independent for-
" profit hospitals e eo though the former 8rOUP of hospitalS werefound tohave"higher costs.: This suggests that for-profit chainhospitals may provide higher-cost services at a higher price than
, their independent counterparts, an outcome consistent with theprovision or higher-quality services.
Section W
higher costs of for-profit hospitals may be related to style oramen ities in ca re not captured ,in the outputmcasurcs.
Two variables accounting for ownership status are used in theregression equations estimated in this study. The first,FORPROFIT" takes the value of one if a hospital is operated forprofit and zero otherwise. The second varlable GOVERNMNTtakes the value of one if a hospital is operated by a state orlocal government and zero otherwise. These variables will allowus to,assesscthc p,crcentage effect tfu:se two forms of ownershiphaveon total hospital costs compared to the excluded category voluntary hospitals.85
A second set of variables ,is added to the regression equationsto measure whether the association ofa hospital with a multi-hospital system has an effect on hospital costs.86 It is possiblethat the greater volume of a chain could lower input costsincluding~apital, and that economies of scale collld exist in themanagement and operations (e.g., data-processing) of a chain hospitals.
The empirical literature generally indicates that affilia ttonwith other hospitals is associated with higher costs. A literaturereview by Ermann and Gabel (1985) examined 21 studies of therelationship between chain ownership and hospital costs andconcluded that "the consc:nsus of these studies is that systems~
85 Thesevariablc:s may also reflect differences in the costof capital across ownership categories; many states issue tax-exempt revenue bonds onbehatr of voluntary and governmenthospitals.
88 The coding of the AHAdataset does not allow us todistinguish, between hospitals that are owned by chains versusthose that are managed by chains. Differences in the incentivesthe 1wo types of hospitals may have in operating have been anissue in calcuhiting market ~hare statistics in antitrust cases.
Section UJ
variables allows the measured effect of affiliation with otherhospitals to vary with ownership status.
F. Case~mix Varia12!a
Several additional variablc$ enter the regression equations toreflect differences io hOSpit81s~ case ,mix that may not bereflected in varia tioain the included output measures. The firstvariable. SMSA . t.akesa value of one if a hospital is located in aStandard Metropolitan StatisticaIArea.a'nd~istaken from the AHAfilc. This variable is included to capture differences betweenurban and rural areas in the case mix and ttu:.,severity of casetreated. Urban hospitals are more likely than rural hospitals tohave facUities, provide hi&h,ly specialized. services, such asorganJransplants and advanced radiation therapy. 'IO
Another factor that may affect a hospital.s case mix is itsteaching status, Teaching hospitals may;attract ,patients whorcQuire unu$ual carc , and these hospitals may also undertakeresearch , functions that affect resource use. , Three dummyvariables that measure a hospitars commitment to teaching areentered into the regressions to compare costs between teachingand non~teachinghospilals. 'I1 . The variable TEACH! takes thevalue of one if a hospital has an approvcd residency program butis not associated with amedicalschooL., The variabieTEACH2takes the value of one if a hospital is affiHatedwith a medicalschool but is not a member of the Co~ncil of Teaching Hospitals
eQ' , If the cost of capital varies by ownership status oraffiliation with a multi~hospital system , the dummy variablesFORPROFIT throughPROFMULT will' in part capture thisvariation.
TO The coeffic,ient of the SMSA variable may also measuredifferences in resource costs , across urban and rural areas notfully captured in the labor cost variable.
11 This follows the construction of tcaching variables inSloan . Feldman , and Steinwald (1983).
~ect ion ill
(COT"). The variabieTEACH3 t~kes the value ,of one if ahospital is a COTHmc.inber. COT" hospita! '. typicaUya.re verylarge. research"'oriented in~litutions. Previdus researcb: has foundthem to have higher costs than other hospitals.72
Two variables. MCARESHR and' MCAIDSIIR . respectivelymeasure the portion of total inpatient days accounted CorMedicare and Medicaid patients. In October 1983 (tbe beginningof tbe ye.ar for which the AHA data were collected Jor mosthospitals in'- tbe sample) Medicare began to rehnburse theexpenses of Medicare patients On the basis ofa.DiagnosisRelated
, Group (ORGl system which classified patients if'lto 468 ORGs.Under DRG,reimbursement;hosp'itals are paid a fixed 'al11ount p-erpatic:' nt admissioflon the basis of the ORG to which tHe patientbelongs. ' Hospitals have an incentive to" keep expenses forMedicare patients' beneath the DRG reimbursement level. expect that under aORG system. a hospital's expenses will belower as the share of Medicare patients increases, relative toother patients.
Hospitals in most states at the time the AHA survey wasconducted were . however. still f..';mbursed for treating Medica idpatients on the basis of the cost or treatment rather aprospective paymentsystem.TS Earlier research T. has found thatthe proportion of hospital patients covered by Medicaid isPositively related' to ' the average number of tests andconsultations pet patient. Medicaid requires nocopaymcnt on thepart of ,patients, and the empirical evidence indicates that the
12 See, for example, Granncmann et al. (1986). and Sloan.
Feidman. and. Steinwald (1983). Laudicina (198S) reviews state hospital reimbursement
pQliciesacrossdiffercnt categories oCpayers for the years 1980through 1985. From Jan:uary 1980 to lune 1985. the number ofstates using traditional cost-based retrospective reimbursementsystems to cover Medicaid eJl:penses declined from 40 to 14.
Sloan and Becker (1983).
~i2!L III
cost.,based reimbursement of these patients is associated withhigher expenses.76 We therefore exp~~t that a higher share ofMedicaid patients in a hospital is associated with higher costs inour sample.
G. The RcgyJation Variablg
, State CON laws require that hospitalsobtainapprovat to bui1d. or expand faci"tie~, to purchase new equipment, and/or to
pr()vide new services. States control thecapita)investment of
, "
hospitals not only through their CON programs, but alspthroughparticipation in the Section 1122 program , .under which theyrecommend whether federal Medicare and Medicaid reimbursementof depreciation and interest expenses assocJated' with specificeapitnl project~ of hospitals sho~ld be withheld. ,In the timeper iod~1 ud ied here , all stn fc regulated the capital investment ofhospi lal~, Ih rough CON programs. nd/orthrough Jhe Section 1122program. All but three states maint~ined a CON',program , and atotal of 1'6 slates (including the three without' CON laws)participated in the 1122 program.
State CON laws specify the dollar threshold bove which
proposed capital and equipment expenditurcs by hospitals arcreviewed by state and tocal health planningagencies. CON lawsalso specify that a hosphal must receive approval to provide anew service if the annual operating co5tsofproviding the serviceexceed some threshold. The dollar amount5 of the review
thresholds as of December 1983 5e\lc:ral monthsiaftcr the surv~yperiod began , are given in Table 11.
Gra n nema n n ('I, ah( 1986 )~ Beckc,r '3.ndSloan ( 1985).
16 Most states in the sample maintained their reviewthresholds at these levels over the sample. pcriod~ , MinnesotaCON program expired in June 1984 and was replttced by amoratorium,on new construction. Coloradosubstantial1y increasedits thrc:sholds (to 2 minion , I million , and 1 minion dollars forcapital , service, and equipment). Because CON laws do change
(continued...
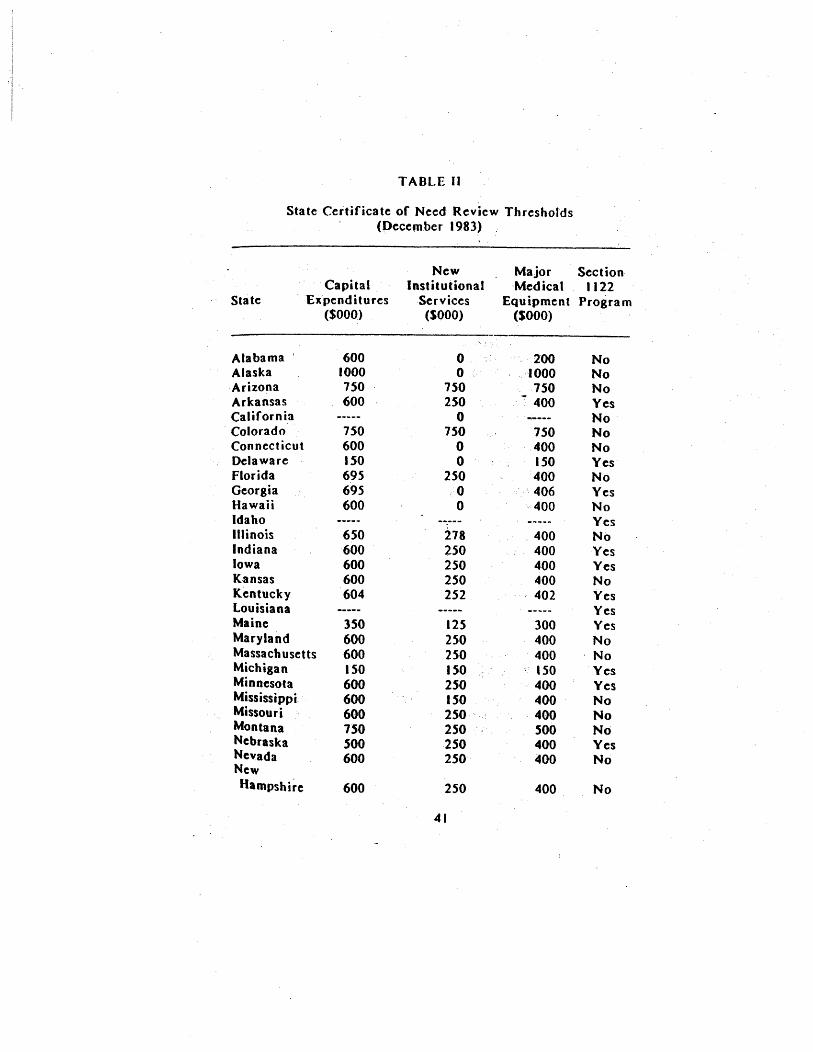
TABLE II
State Certificate of Need Review Thresholds(Pecember 1983)
Sta te
CapitalExpenditures
($000)
NewInstitutional
Services(SOOO)
Major Sect ionMedical , 1122
Equipment Program(S.oOO)
Alabama 600 2.00Alaska 1000 1000Arizona 150 150 750
600 250 400Arkansas YesCalifornia
-----
Colorado 150 750 750Connecticut 600 400Delaware ISO ISO YesFlorida 695 250 400Georgia 695 406 YesHawaii 600 400Idaho YesIllinois 650 278 400Indiana 600 250 400 YesIowa 600 250 4.00 YesKansas 600 250 400Kentucky 604 252 - 402 YesLouisiana YesMaine 350 125 300 YesMaryland 600 250 400Massachusetts 600 250 400 ' NoMichigan ISO ISO 'SO YesMinnesota 600 250 400 YesMississippi' 600 150 400Missouri 600 250 400Montana 750 250 500Nebraska SOO 2S0 400 YesNevada 600 250 400NewHampshire 600 250 400
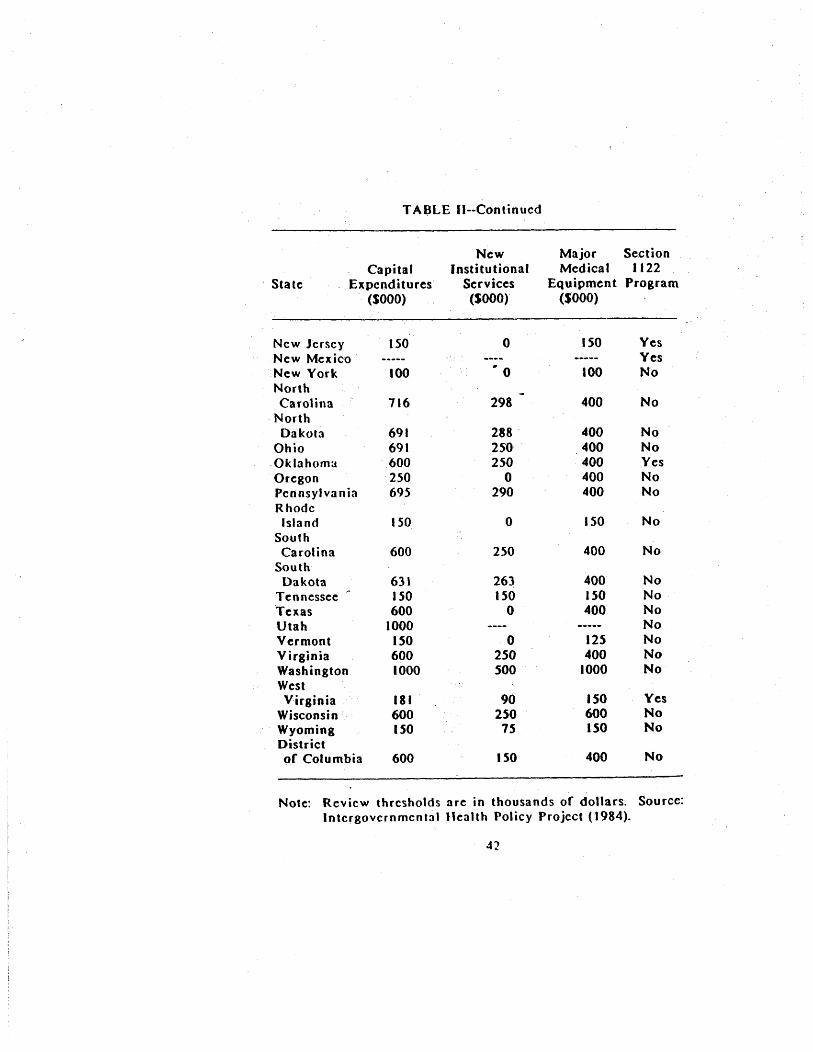
TABLE II--Continucd
StateCapital
E~penditures(SOOO)
NewInstitutional
Services(SOOOr
Major SectionMedical 1122
Equipment Program($000)
New JerseyNew MexicoNew YorkNorthCarolina
, NorthDa kola
OhioOklahomaOregonPennsylva n iaRhodeIsland
SouthCarolina
SouthDakota
Tennessee
TexasUtahVermontVirginiaWashingtonWestVirginia
WisconsinWyomingDistrictof Columbia
ISO
100
116
691691600250695
ISO
600
63 ,150600
1000ISO6001000
181600ISO
600
.. 0
298
288 '25'02.50
290
250
263150
2.50500
250
ISO
ISO
100
400
400400400400400
ISO
400
400ISO400
125400
1000
ISO600ISO
400
YesYes
Yes
No
Yes
Note: Review thresholds are in thousands of dollars. Source:Intcrgovcrnmcnta1 Health Policy Project (1984).
~ction III
The threshold level above which projects are reviewed underCON programs provides one measure of the,stringency of programreview;" Under a higher threshold~, rewer projects arc reviewedand CON laws affect fewer of the resourc:e aHocationdecisionshospitals make. The trend toward' relaxation of CON coveragesince 1980 has included not only repeal of CON laws but, motecommonly, increases in review thresholds.
(~..
continued) ,somewhat 'Over time , the regressions presented in this report alsowere run using, CON thresholds from March 1983 and June 1984.Results from these regressions were' quite similar to thoseobtained using the December 1983 data.
, ,
Data onthe December 1981thresholds were compiled by theIntergov' ernmental Health Policy Project (1984) at George
, Washington Universiry~which serves as a clearinghouse on statehealth lcgislation , and were gathered through surveys ofsta tehealth planning agencies. Data for the earlier and later periodswere taken from the annual StatusRcoort .QIl~il~~tific.!lt~..2fNeed PrOJnams prepared by the U~S. Department of Health andHuman Services.
Given the evidence that hospitals may take several years tofully adjust capital stocks to their desired levels, it might more appropriate to 'use the CON thresholds in effect duringearlier periods inexplainingcosis in 1983-84. The time neededfor changes in CON laws to affect hospitals ' decisions cou1d vary,however, with the type of threshold under consideration. Aninteresting way to extend the present research 'might be experiment with different combinations oCearlicr thresholds inthe regression(~erhaps first on asubsample oflhe data)to seewhich would 'b~stexp1a'indifferences in hospital costs.
, ,
TT: Anothet(perhaps immeasurable) indicator of stringencyof CON review would be the likelihood that a project above thereview threshold is approved. Two states could have identicalthresholds. but one could more stringently review projects byrejecting a larger portion of similar projects.
Section U
The natural logarithms of the capital , service , and e'quipmentreview thresholds (in thousands of dollars) arc entered in to theregression as LCAPIT AI.. , LSERVICE~ and LEQUIP.78 The use
the double-logarithmic specification allows us, to assess thepercentage change in hospital expenses associated with a givenpercentage change in a threshold for states that have a, full-blown CON progra m 7g One problem in using the logarithm ofthe service thresJ"wld is that twelve states review aU newservices, i.e., they have a review threshold of zero dollars, andLSERVICE thcrefore is undefined. For these states, theval~e of
, LSERVICE was set to zero and a new-variable , ZEROSE~V, was'set equal to one., Qtherwise the latter was~et equal to ,zero.
Three states, Louisiana , Idaho, and New Mexico, did not haveCON la ws during the survey year.80 For . these states, threedummy variables, I.OlJlSNA IDAHO, and NEWMEX.~e'reset equalto oneror those hospitals located within them: otherwise, thesevariables were set to zero. The variables LCAPIT AL throughZEROSERV were set to zero for observations in these states.
. The coefricients on these state-specific dummies allow us tomeasure the differences in hospital costs in these states relativeto states that have CON laws.
78 The threshold levels are expressed in thousands of,dollars before lheyare converted to logarithms~
7g Were these variables entered in their linear ' formrather than their logarithmic form, the assumption underlyingtheir functional form would, be that a dollar increase in athreshold had the same percentage effect on cost wh,ateverthebase threshold. The use of the dQuble- logarithmicspecificationallows the effect of (say) a SIOO,OOO increase in a threshold tohave a different percentage effect on cost if the base thresholdis $100 000 rather than SI OOOOOO.
80 Louisiana never enacted a CON law, and Idaho andNew Mexico sunset their CON laws in June 1983.

~ction III
Two states in the sample, California and Utah , had CON lawsbut' did not review all three types of , hospital projects.California reviewed only entry into new services, and Utahreviewed only the capital expenditures of hospitals. Since it not possible to take logarithms of missing variables, two dummy-variables CALIFO,RN and UTAH, were , entered into , the
regression. They took the vaiue of one ,(otherwise zero) forhospitals' that were , respective1y, in California or Utah. Forhpspitals in these states, all other CON variables were set tozero.
The Section, 1122 program afrects , reimbursement Cor theexpenses of,Medicare and Medicaid patients. We expect that anyeffect of this program becomes more important as the share ofMedicare and Medicaid patients in a hospital increases. If ahospital treafed no Medicare or Medicaid patients, we would notexpecttbe Section 1122 program to have any effect. For thisreason , the variable measuring state participation in the Section1122 progra~ should be interacted with the variables measuringthe share of patient days accounted for by Medicare and
Medicaid patients. We aha want to allow for the possibility thatthe effect of the 1122program on costs may va ry wi th whether aCON law is in effect.
Four variables are therefore created to measure the effect the Section 1122 program. The first two MCARl122 and
81 The state-specific dummy variables shift the interceptterm in the regression equations and therefore permit comparisonof the average level of hospital costs in each of these states toother states that maintain full CON programs. The use of dummyvariables to account " for missing values in a regression issummarized in..Maddala (l977)discussionof the modified zero-order regression method of handHngmissing values. The method
. al$o applies to our use:, of the v,riable ZEROSERV to account forthe fact tbat some states review provision of all new services. anoutcome that would force us to take the logarithm of zero in ourspecification , therefore creating missing values for the variableLSERVICE.

Section III
MCADI122 are respectively the portions of Medicare andMedicaid patient days for hospitals instates which do not have aCON program but do ltavea Section I I 22program. The variablesMCARBOTH and MCADBOTH are respectively the portions ofMedicare and Medicaid patient days in hospitals that have CONlaws and participate in the 1122 program. All four of thesevariablest:\ke the value of zero if a state does not participate inthe 1122 program. Holding the level of Medicare and Medkaidpatients constant , the coefficients of these variables allow us tocompare hospital costs in states which participate in the 1122program (either with or without a CON pr()gram) to hDspital costsin those states which maintain only a CaN program.
The final regulation variable entered into the regression isRA TEREG, which takes the value one (otherwise zero) for thosestates in which the rates charged (for at least some non-Medicaidpatients) andlor the budget of each hospital are reviewed by astate authority.12 Four of these states (Maryland , MassachusettsNew Jersey. and New York) reviewed the rates charged to allpayers. Washington state and Connecticut reviewed the chargesto all payers except Medicaid , and Rhode Island reviewed thecharges to both Medicaid and Blue Cross. Empirical studies ofmandatory rate setting have genera1ty found that the level ofhospital costs on a per-day or per-admission basis are lower instates with mandatory rate setting, and also that the rate of
increase of these costs over time is less in these states than inother states.
82 Other states reviewed the rates paid to Medicaidpatients on a prospective basis. These states are assigned thevalue of zero for the rate regulation variable , which indicatesonly whether states set rateS for either commercial payers orBlue Cross.
8S Eby and Cohodes (1985) provide a recent summary ofthese studies.

Section III
This section has disc'u~sed the empirical specification of thecost function used to estimate the effects of state regulation ontotal costs(or individual hospitals. Table IIlpresentsdcscriptivestatistics for the variablcs uscd in the analysis. Empirical resultsare presented and discussed in the next section.

TABLE III
Variable List and Descriptive Statistics
Name Std-. Dev
LN ETCOST
, . L TOTCOST
LNURSEWG
, LBEDTOT
FORPROFIT
DescriptiQn
Logarithm of tota1hospital costs ($)
net of interest anddepreciation
Logarithm of totalhospital costs ($)
Total acute care
inpatient da ys (OOOs)
Total intensive care
inpatient days (OOOs)
Tota1 subacute care
inpatient days (OOOs)
Total emerg(:ncy roomvisits (ODDs)
Total non-emergencyoutpatient visits (OOOs)
Logarithm of nursesaverage salary ($)
Logarithm or totalinpatient beds
Dummy I if proprietaryhospital
Mean
16.
16.
40.
1.20
14. J 0
21.
10.20 '
GOVERNMNT Dummy = I if operated by 0.state or local government
1.31
1.31
45.
16.
55.
0.44

TABLE III--Continucd
Name Description Mean Std. Dev.
GUVMULT Dummy ~ I, ifgovernment 0..hospital part of multi.
hospital system
VOLMULT Dummy - I if voluntary 0:22 0.41hospital part of muiti-
hospital system
PROFMUL T Dummy - I if proprieta ry 09 -hospital part of multi..hospital system
SMSA Dummy - I if hospitallocated in SMSA
TEACH 1 Dummy. I if hospitalhas approved residencyprogram but is not:affiliated withmedical school
TEACH2 Dummy - I if hospitalassociated with medicalbut not a COT" member
TEACH3 Dummy - I if hospitalmember of Council ofTeaching Hospitals
MCARISHR Percentage of total 48.44 , 12.inpatient days coveredby Medicare
MCAIDSHR Percentage of totalinpatient days coveredby Medicaid
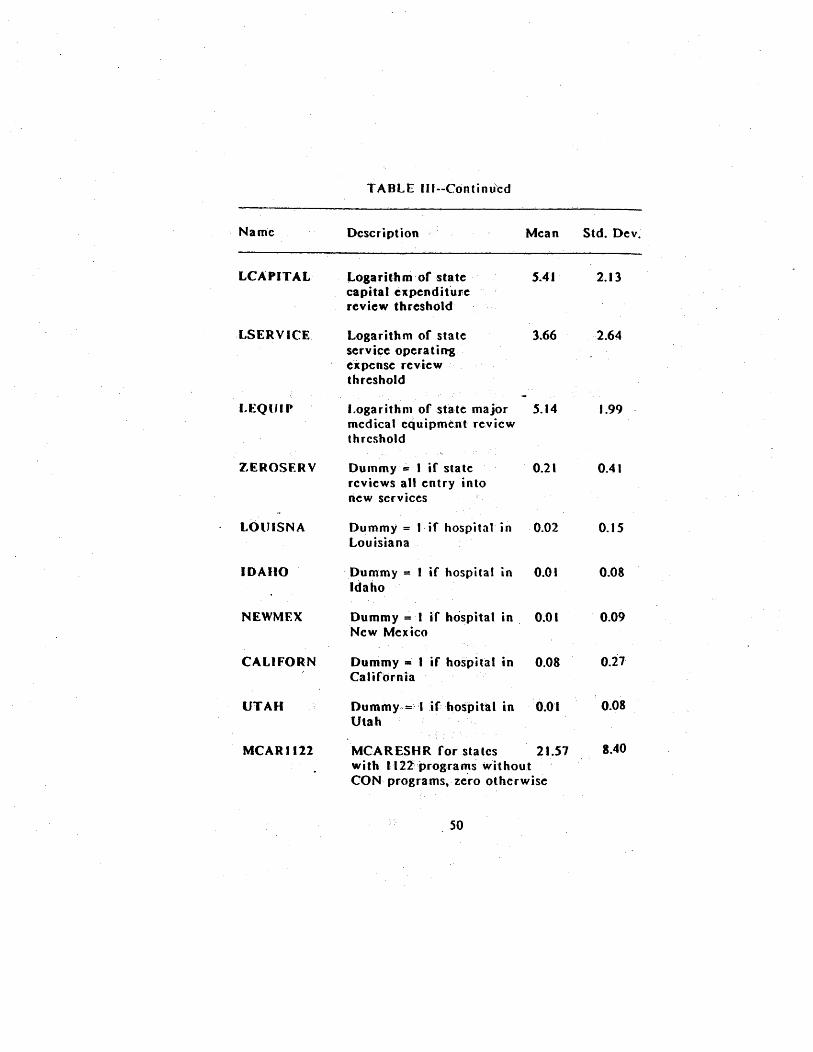
TABLE III--Continu'cd
Name Std. DevDescription Mean
LCA PIT AL
LSERVICE
EQUIP
EROSER V
LOUISNA
IDAIIO
NEWMF.X
CALIFORN
UTAH
MCARJl22
J..ogarit' h rri of statecapita Ie x pen d i tu rereview threshold'
Logarithm of stateservice operatingexpense reviewthreshold
Logarithm of state majormedical equipment reviewthrcshold
Dummy" ;;,. I if statereviews all entry intonew services
Dummy = I, if hospital Louisiana
Dummy = I if hospital inIdaho
SAI
2 I
Dummy = I if hospital in , 0.0 INew Mexico
Dummy = I if hospital inCalifornia
Dummy,,= '1 if hospital in
Utah
MCARESHR for states 21.51with I' 22prog:ra".'s withoutCON programs, zero otherwise
1.99
4 I
, 0.
8.40

TABLE IU--Continued
Name Std. DevDescription Mean
MCADI122
MCARBOTH
MACDBOTh
RATEREG
MCAIDSHR for states with 0.1122 programs without CONprogra rris, zero otherwise
' ,
MCARESHR for staieswith both 1122 and CONprograms, otherwise zero
11. 22.03
" '
MCAIDSHR, for ' stateswith both 1122 a'ndCONprograms, otherwise zerO
Dummy - I if state sets
mandatory hospital rates

IV. Results
Empirical estimates of the cost functions discussed in theprevious section are presented in this section. The discussion these resu1t~ is broken down into , three parts. The first partgeneral1y discusses the measured effects of the regulationvariables, and the second part- discusses the effects of theremaining variables other thanthe output variables~ The thirdpart of the section focuses on the coefficients of tlie outputvariables. The latter coefficients can be used to calculate botheconomies of scope and scale for hospitals, aspects of theproduction of hospital services that arc ~r intr!ns,i~interest.
Table IV presents re8r~ssion results from tbe twospecifications of the cost function used in this study. Thefirst uses the variable LNETCOST which exclud~s interest anddepreciation costs
, '
as the dependent variable and is a measureof a hospital's short-run variable costs: The second specificationuses the variable I..TOTCOST as the dependent variable. This is ameasure of long-run cost because ,itinc.ludes all~ospital costsincluding capital costs. ' The two specifications differ in theirassumptions of how firms adjust input U':iage to treat patientsover the one-year period of the sample. ' T:l:tough there evidence, cited in the previous section, that hospitals take longerthan a year to fully adjust capital stocks, there also is evidence
8.c The discussion of economies of scale and scope
, hospital production is somewhat technical in nature:, and it maybe skipped by less technically oriented rcaders~
85 The regression results presented here are the: finalspecifications used in fitting the cost function to the full dataset.In another specification . we used CON thresholds from differenttime periods as noted in footnote 76. The model initiallyexcluded the Section 1122 interaction variables, which were addedin the final equations. A different speciric~tion . which excludedthe interactions among the output variables. was used to fit themodel to a 20 percent sample of the data. Addition of theseterms improved the fit of the model for the subsample, and theywere used in fitting to the full dataset. No other specificationsearches were undertaken.

TABLE IV
Regression EstimatesoC Hospital Cost Functions
Dcocndent ,VariB.b.kLNETCOST
peoen4ent VarUihk;.TOTCOST
Variable Coefficient (-statistic Coefficient t-statistic
CONSTANT 99S, S9. 14. 176 63.
008 ' 8.4 050 48.
018 049
-0.003 032
010 022 11.2
002 002
068. -0.296.. 35.
61 -1.651.
062. 0.4 507.
148. -0.340.
007. 009.
13S.. 10. 551.. 33.
667.. 21.939..
-0.396.. 362..
0.4 J 6.. 942
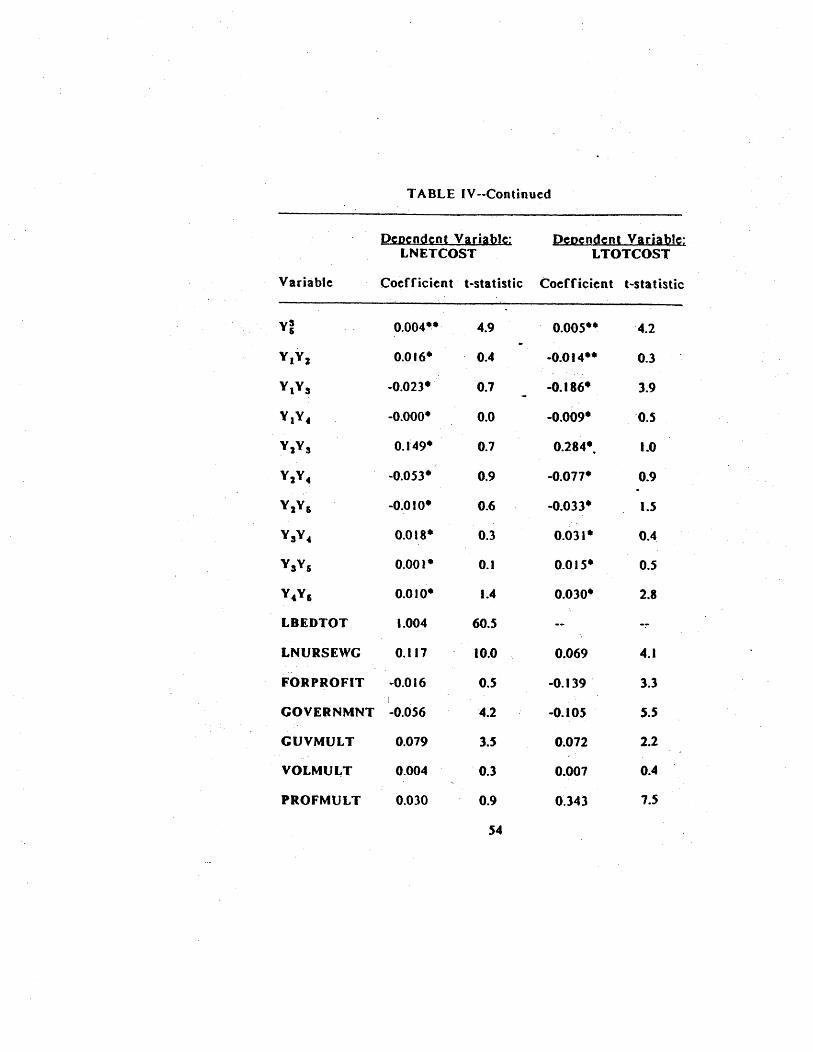
T A OLE IV --Continued
J)cDcndcntVariahk;LNETCOST
))eoendent Varia~TOTCOST
Varia hie Coefficient' t-statistic Coefficient t-statistic
,y'
004~- OOS-~
016- -0.014--
023- 186.
Y 4 000- 009-
1: 49- 284- 1.0
053- 077-
0 I 033- 1.5
018- 031-
00.- 015- 0.5
0 1 030.
LBEDTOT 004 60.
LNURSEWG 117 10. 069
FORPROFIT 016 139
GOVERNMNT 056 105
GUVMUL T 079 072
VOLMUL T 004 007
PROFMULT 030 O~ 343
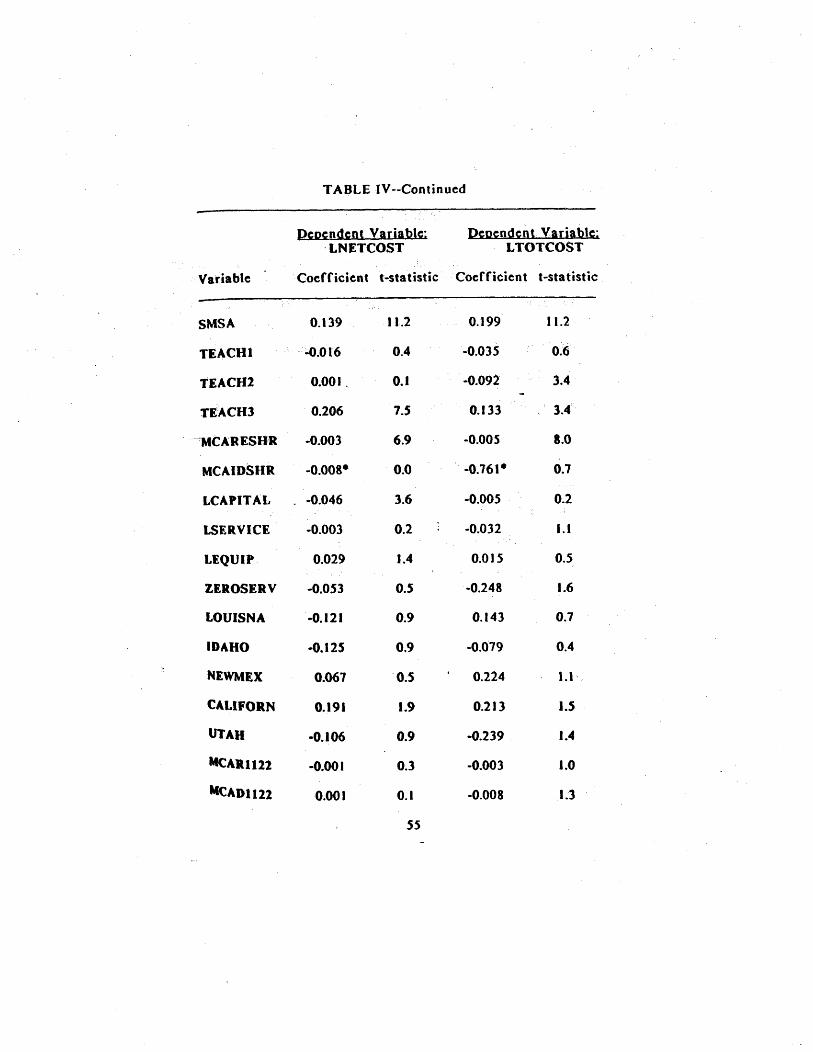
TABLE IV--Continued
p~Dendent Variahk;.LNETCOST
peDend~nt Variab~TOTCOST
Variable Coefficient t-statistic, Coefficient I-statistic
SMSA 139 11. 199 11.2
TEACH1 016 035
TEACH2 00 I . 092
TE~ACH3 206 133 . 3.
MCARESUR 003 OOS
MCAIO811R OOS. ' 0. 16'.
LCAPIT AL 046 005
LSERVICE 003 032 1.1
LEQUIP, 029 1.4 015
ZEROSER V 053 248 1.6
LOUISNA ...0. 121 143
IDAHO ...0. 125 019
NEWMEX 061 224 1.1 '
CALIFORN 191 213 1.5
UTAH -0. 106 -0.239 ' 1.4
MCAIU 122 00 I 003 1.0
McAD1122 00 I 008 1.3
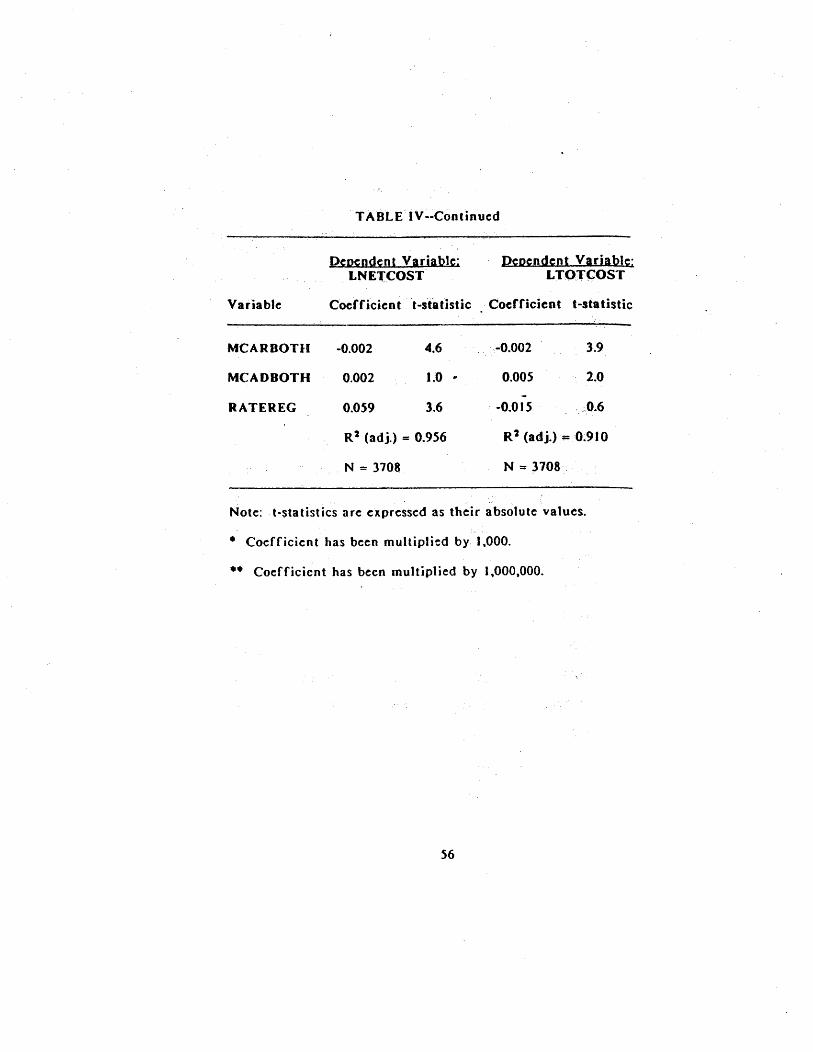
T AOLE IV --Continue:d
peoend.ent Var~LNE'(COST
j)eoendent Var~TOT(:OST
Variable: Coerficien t t-sta tistic Coefficient testa tistic
MCARBOTH 002 002
MCADBOTH 002 1.0 005
RATEREG 059
' -
0 I 5
R 2 (adj.) = 0.956
N = 3708
R 2 (adj.) = 0.9 J 0
N = 3708
Note:: t-statistics are expressed as their absolute: values.
Coefficient has been multiplied by 1,000.
..
Coefficicn t has be:en multiplied by 1 000 000.

tion IV
that capital inputs are not entirely fixed within a one-yearperiod~ TOTCOST is the variable used in most studies ofhospital costs, and we bel~eve that for this study it represents apreferred specification even if hospitals may not operate in long-run equilibrium. The separation of short..run costs from long-runcosts is typically not easy, and the aggregated AHA cost data donot aUow , us to break down costs other than interest anddepreciation that' should be excluded from total costs to define ashort-run cost variable such as LNETCOST.
The results for the two, specifications arc generally similarwith respect to, the signs and statistical signifi-cance of theestimated coefficients. Both models fit the data closely (asmeasured by the adjusted R-squared statistic), whicb is notsurprising given the high degree of partial correlation betweenoutputs and hospital costs.
A~ The ReRulatiorl Variables
The influence of CON programs is measured by thecoefficients of the variables LCAPIT AI. through CALIFORN.Coefficients on tbe variables LCAPITAL , LSKRVICE, and LEQUIPallow us to assess changes in hospital costs associated, withchanges in the dollar thresholds for the three different types ofCON reviews. CON programs cover fewer expenditures as thesethresholds increase, and tbe coefficients of tbese variables thusprovide a measure of the effect of changing the stringency of
Ie The adjustment of hospital inputs is borne out by thefact that about 25 percent of all hospitals changed their numberof beds within the sample period of the AHA data. GrannemannII QI. (1986) note this continuous ':adjustment of hospital capitalstocks, and argue that to include a measure of capital stock~hich is not fixed within a year s cross-section of data is to~nclude an endogenous variable. These authors argue that'Dclusion of a capital variable into a model fit on cross-sectional
~a would bias results. and that cost-functions should beestimated which include capital costs in the cost variable but-hich exclude measures of capital stock as explanatory variables.

Section I
CON review. The coefficient ,of ZEROSERV measures thedifference in hospital costs in states that review all additions ofnew services in hospitah relative to those states with CONprograms with service review thresholds greater than ' zero.Coefficients on the five state dummy variables measure thedifferences in costs for hospitals in states that either do nothave a CON program at all or do not review all three categoriesof expenditure normally covered by CON laws, compared tohospitals in states with full-blown CON programs.
The regression results do not support the hypothesis thatsubjecting more of a hospital's expenditures to CON review byestablishing lower thresholds helps to contain hospital costs.With one exception that is discussed below , the coefficients ofthe threshold variables are statistically insignificant at thestandard of 95 percent confidence: the hypothesis that theindividual coefficients are equal to zero cannot be rejected.
87 The specific null hypothesis being tested is whetherthe coefficient of an individual variable included in thespecificationequa Is zero; that is, whether a change in the reviewthreshold is associated with any change in hospital costs. Atwo-tailed t-testis used to assess statistical significance of the
individual coefficients at the standard of 95 percent significanceunder classical hypothesI's testing. Failure to reject the nullhypothesis occurs if the calculated t-statistic is less than 1.96
and implies that the variable has no measurable effect on thedependent variable.
Leamer (1978) makes the interesting point that rejection ofthis nun hypothesis (i. , some effect, however small , is detected)becomes more likely as the sample size increases. Using 8Bayesian interpretation of hypothesis testing, he suggests thecritical I-value needed to reject this nuU hypothesis ' also
increases with sample size. For the large numbers of degrees offreedom in used in this study, the critical value derived byLeamer for the t-statistic is 2.85, which corresponds to the 99.level of confidence in classical hypothesis testing.
Section
States that have lower review thresholds do not have measurablylower levels of hospital costs.
. Moreover , the coefficient of the capital review variable,LCAPIT AL , has astatisticaHy significant negativ~ coefficient in
the first equation. This implies that as states review more of hospitals' capital expenditures by lowering the, threshold forreview, hospital costs increase. The point, estimate of thevariable s coefficicntsuggeststhM a ten percent increase in thecapital:, threshold is associated :with a decline ofA6percent inoverall hospital costS.
88 In 1984 , the federal standard for capitalreview, was $600 000. Several states subsequently raised theirreview limits to $1 ,000 000 , an increase that this-result suggestswould beassociate~ with ad. :Iinein total hospital costs of 2.4iJercent.
One potential problem in assessing the effects of changes , different reviewthrcsholdson costs is that -the levels 'of reviewmove together across states. States that lend to have a higher-
, than';averag ethrcshold for capitalrev-iew , for insta nec , tend alsotohave ahighcr- thari-averageequipment review thresh(o i. Thismay lead to a problem ofcol1inearity, whic'h makes it difficult toassess the erfect'of. a change in a stogie thrcsholdon hospitalcosts. Analysis of the data shows that strongcol1inearity existsamong the threshold variables.89
Beca~sethe threshold reviews tend to move together , it ma y
be more appropriate to examine the effect of moving all three,t~reshold variables together rather than trying to' exainine the
88 , In discussing coefficients, pointestimates rather thanthe 9S percent confidence ;regions are used~ The latter wouldindicate the uncertainty in a parameter estimate.
19 The collinearity diagnostics developed by Belsley,Kuh, and Welsch (1980) indicate that the threshold variables areprimarily collinear among themselves rather than with the othervariables in the regression. The threshold variable which showstbe most independent variation is LCAPIT AL.
~ ..

Section I
effect of increasing one while holding the others constant. the first specification, the effect of increasing all reviewthresholds by 10 percent is to decrease hospital costs by 0.percent. Asa furt~herextrapolation , a doubling of all thresholdsis associated with a percent declioe in costs. The pointcstiolate of this 'cffcct differs from zero atthe9S percent levelof ;statistical confidence. In the, second , specification, the
estimated effectof increasing all review thresholds by 10percentis also' estimated to be associated with a decrease in costs of 0.2 'percent , though this estimate is not statistically significant.
The above results are for sta,testhat provide for the CONreview of an three types of projects. The coefficients of thefive sta,te dummy variabl es I.OUISNA through UTAH, easure thedifferences in costs for states that either did not have a CONlaw (Louisiana , Idaho , and New Mexico) or did not review alltype5 of projects (California and Utah) relative to states thatmaintaincdfuH-blownCON programs~ ln 1983i Utah reviewedonly capital expenditu res above Sl OOO OOOandCa Jiforn ia reviewedonly: hospitals' entryintonew services. None ,of the coefficientsof these variables differed from zero by a statistically significantamoun-t. This indicates that , controlling for the other factors inth' e regression , costs in these states were neither higher norlower 'than in states which maintained full CON programs.
80 The estimated percentage change in total costsassociated with a small, percenta.8e change in all reviewthresholds is Qbtaincd by summing together the coefficients ofthe three review threshold variables. A test of, whether aproportionate increase in these variables has a measurable effect
costs can be obtained by dividing the sum of thesecoerficients by the square root or the estimated samplingvariance or this sum.
01 One problem in comparing hospital costs in these fivestates to other states is that, with the exception of California,they have small populations and contain a small portion percent) of the nation s hospitals. Of the 3708 hospitals in t
, (!=ontinued...
S-ection IV
The second regulatory program examined is the Section 1122program or the SodalSecurity Act, under which participatingstatesrecommend tolhe federal government whether .t shouldprovide Medicare andMedicaidreimburseRu:ntto hO,spitals forparticular capital expenditures. The effect of the 1122 programon costs is measured' by en~tring var'iables that allow the effectof the program to "-tary wi'th whether the sta te also has a CONlaw ~or nota'ong with the 1122 ' prO~i Jm.O2
" ,
The coefficients of MCARJ 122 and ~ICADI122 measure the. differences int1ospitalcosfs in the three states that maintain an
1122 program without a CON program 'comparedt~them~jorityof states which mainta in
' "
CON program without , an ' 1122
progtam~ The fact that the coefficients of these variables are
statistically insignificant indicates that a state s choice betweenreliance onan 1122 agreementalorteand reliance on a CON lawalone does nota ffecthospitalcosts.
The coefficientsof MCAR B()THandMCADBOTHmeasure thedifferences in hospital costs between the majority or states which
(...
continued) present sample, Louisiana has 85 hospi tals, Idaho 22 hospitalsNew Mexico 29 hospHals. andUtah 2.5 hospitals. Furthermore,Idaho and New Mexico sunset their CON laws during the periodcovered by the sample. 'We would prefer to have a larger sampleof hospitals not covered by CON laws for a longer period of timeagainst which costs could be corripared.
82 The e~f eel of the Section 1122 pros fa m is a Iso, expected to vary with w~et~er the hospital has a large share ofpatients v.:hoseeJ(pens(:s ar~ rtimbursed byc' ither Medic~re orMedicaid , and thh sfJecificatiorftakesthis into account.
8S MotepredsCly. these, results indicate 'that the effectsor changes inthe share of either Medicare or Medicaid patientson hospitals' costs are not measurablydirferent in states withonly an 1122 program frorothe effects of these changes in states-hich have only a CON law.
Section IV
ma inta in a CON program only and those. 13 states whichma inta inboth. a CON program that reviews capital expenditures and an1127 program. The results indicate that, for a given volume of~~dicare patic;nts~ hospital costs are lower in states- whichmaintain both programs tbanin those states which maintain onlya CON program. They also indicate that the costs of treating agiven volume of Medicaid patients are ' higher in those stateswhich mainta in both programs than in statc;s which rely only onCON review.Q4
, It is somewhat surprising that , the 1122 program has aneffect on costs in those states with CON cap!\al reviews. TheCON program is a more stringent program in that it can preventa project from being' undertaken , whit'e IJ22disapprqvai leadsonly to withholding of interest and depredation reil11bursementprovided by the federal governmcnt. Previous studie~ of hospitalcosts have. however. provided some evidence (though notconsistently) that the presence of an 1122 agreement may beassociated with lower hospital costs ' even though CON programsappear~o have dther no effect or a positive effect on costS.One possible explanati~n that because 1122 disapproval (incontrast to CON disapproval) does not prohibit a project, the1122 program may reduce costly use of hospital inputs withoutestablishing the barriers to entry and expansion that decreasecompetitive pressure to reduce costs.
94 The coef(icient of MCADBOTH is positive in bothequations but statistically significant only in the second equation.
95 Noether (1987), for c.J(ample, found that the presence9.f ani 172 agreement wasa~sociated with a 7perpent decrease inihc Yeragecostspcr admission at the level of the individualhospital. In their review of earlier studies of the effects regulation on hospital costs, Steinwald and Sloan (t981) concludethat thQugh the Section 1122 program app~ars to have m?refavorable effects on costs than do CON programs, this conclusionis based on much -less empirical evidence.
Sect ion
The final regulation variable in the regressions. RATEREGwhich indicates whether a hospital i~, covered by a man'7latory rate setting, program. provides mixed results across the twosp~cifications. The coefficient of this variable is p()$~tive:l,~dstatistically significant iq the LNET(:OST equat ion an(J~e8ativeand statistically insign ifi~ant in the L 1"O"rCQST equ~Hon. 1;bepositive coefficient in the first equation ,indIcate! ' that thepresel1ce of mandatory rate regulation is associated withho$pitalcost~ that are about 6 percent higher than hospital costs ' instateS which do not regulate rates.96 The result that rateregulation is associated with ~igherhospital costs iscontr=:t,r:ytothe general findings of other researchers. This suggests Hiepossibility that this finding may be an artifact of thepartieularsample and specification used here and shpuldtheref' ore only be
, ",
accepted with cau,ion. ,
, The variable LNURSEWC has a' positive and statisticallysignificant coefficient in both equations. Given tfae pointestimates of the coefficients, a ten-percent increaseJh the Iaborcosts captured by this variable would be associated with 8 12.4percent in'crease in, short-run hospital: costs and a 1 percentincrease in long-run hospital costS.G7
D6 The coefficient of a dummy variable in the semi-logarithmic specification used here is exponentiated to the base to give an estimate of one plus the percentage impact of thedummy variable on the level of hospital costs. There is a~ias inthis estimator which can be reduced by the .transfornlationsuggested by Kennedy (1983). This bias is a smalr.sample onewhich' is negligible for most of the coefficients presented in thisUud~
01 The lower end of the 9S percent confidence intervalrorthiscoefncient inthe short-run equation includes values thatSUlgest that a 10 percent increase in these input costs would beassociated with an increase in hospital costs of less than 1
(con t i o ued.
, '
Sect ion
The CoeffiCients of the form-or -ownership variables suggestthat both government and for-ptofithospitals have lower coststhan voluntary hospitals.o8 The coefficient of GOYERNMNT issigniric~nt in both eqQations and indicates costs are between S~S
and 10 percent lower in state and 10cal' government hospHalsthan' in voluntary hospitals. Thecoefric'ientofFORPROFIT~thevariable indicating whether a hospital is managed .for profit, isnega tive in both cqUations butinsignificant in the first. Ignoringthe insignificar1t coefficient i~the first equation the results
indicatclhat for-profit hospitals bav(6.cxpenseswhichare about13 percent lower than voluntary hospitals.
The inclusion orthevariables~UVMULT through "ROFMUL Tallows th ~ eff~ct of the ownJrship variables to
vary with ~hetherthe hospital IS part of a ' system or not. The coefficient ofGUVMtJL T is statistically significant in both equations andsuggcststhat costs of governm~nt system hospitals are between 7and 8 percent h,ighcrthantheco$ts of government hospitals thatare not part of a system. The coefficient of ' the variableVOLMUL T is insignificant in both equations , which suggestsaffiliation with asystcm has no measurable effect on the costs ofvoluntary hospitats.
(...
continued) percent. One reviewer of this 'report suggested that thecoefficient of this variable could be bias~4 ifcapjtal restrictidnslead to the hospital using inputs , inefficiently. " Since thecoefficient of this variable is not of direct i nterest in itself forour study, ~e have not attempted to g~uge the c=xtent of the
bias, if any, of the input price variable. Such an evaluationwould require that we estimate equations for thedem;.! ;:\d for eachinput into the ho~pital production process. and that we alsoaccount for, the systematic, irfefficiencies ' in input u~age thatregulation might induce.
08 These compar isons are for those hospitals not affiliatedwith a system.

Section IV
The evidence , of the effect of system affiliation on hospitalcosts is rnixed for for-profit hospitals. The coefficient of
, PROFMUL T is positive and insignificant in the first equation~andis positive and very significant in the second equation, with acoefficient or 0.34. Combined with thetoefficient of- 14forthe variable FORPROFIT, the result from the second equationindicates (as it point estimate) that for-profithospitah whiCh arepart of a system have costs which are about ' 22 percent higherthan costs of voluntary hospitals. Thislatter result is con5istentwith previous empirical finding,s of thc cffects of systemaffiliation on the costs of for-profit hospitals.
The regression results indicate that hospital j:osts are
significanUyhighcr in urban areas; Thecoefficicntof SMSA ispositive a.nd significant in both equations; therc5uHs indicatethat hospital costs are between 15 and 22 percent higher inStandard Metropolitan Statistical Areas,
Hospital teaching and resea rch activities would appear to ha an influence on costs, The variable;TEACHJ, which, indicateswhether a hospital is a member of the Council of TeachingHospitals (COTH)~ has a positive and significant coefficient in
, both equations; costs appear to be 14 to 23 percent higher atthese hospitals. . The variable TE1\CHl indicates that hospitalswbichhave a residency program , but are not affiliated with amedical school . appear to have: costs which do not differ fromthose of hospitals without any teaching activity. The statisticalevidence of the association between medical school affiliation andhospital costs is mixed. The var.iable. TEACH2 is positive andinsignificant in the first equation and negative and significant inthe second equation. The latter coefficient suggests total costsare 9 percent' lower for these hospitals.Q9
OQ These results are generally similar to those of ,Sloan
ale (1983), who examined the effect or medical education onhospital costs using a national sample of367 hospitals from 1974and 1977. These authors found however that the costs of nonC?TH teaching hospitals (variableTEACH2 = I )were significantlyhigher than tbose 'of non-teach ing hospitals.

Section IV
The coefficients for MCARESHR the share of total inpatientdays covered by Medicare, are negative and statisticatlysignificant in both equations, indicating that an increase in theshare or Medicare patients is associated with low~ hospitexpenditures. Anincrc3se in this share from 45 percent (roughlythe variable mean in the data)t055 percent or total inpatientdays is associated with a decline oLbetween land 6 percent intotal costs. ,This negative effect on costs may, flow from theinceotivcs of Medicare s prospective payment system to reducecosts of treatir-g, Mcdicarepatients, Dr from olderpatienls takinglonger times to recuperate in the hospital , a factor which , foragiven treatment would lead to fewer resources being used on aper day basis. The coerncient of MCAIDSlIR, the share, of
Medicaid inpatient days, is statistically' insignificant in bothequations.
C. J:conomics of Scale a 4 Sc in H
The inclusion af output variables in the cost function allowsus to exal\1ine how (predicted) hosp,ital costs vary as outputs areset at different levels. , (n a cost function with a single output.average and marginal costs can be calculated for a given level ofoutput and used to compute a measure or scale economies. lOo
For a multi-product firm. however . care must be ' laken inderining themarginaland average costs of individual outputs.These costs must be defined to take account of the levels of theother outputs in the production process. IOI
In this, study, we have estimated two cost functions forhospitals, one a short-run cost function , the second a long-runcost function. As discussed above. there arc certain problemswith defining either a short- or long-run cost function.Estimates of production parameters derived from the cost
100 For a single product cost function , economies or scaleala given output level can be measured by the ratio or averageto marginal costs.
101 Da iley and Freidlaender (1982).

S~ction I
functions, such as economies of scale and scope, should beinterpreted with caution if questions exist concerning cost-minimimization by hospitalS over the sample period. TheeStimates obtained from the long-run specification are generallymore believable in several respects. Though these resuhsmaynot represent true long-run production parameters under whichhospitals plan and develop their optimal use of inputs they may,describe the relationship bet wee n costs and outputs in ailintermediate time frame.
With respect to the output variables , both equations generallyshow a pattern of positive , negative. and positive cosfficients foreach output. its square, and its cube. This pattern is consistentwith total costs which first decline and then increase with eachoutput. The exception to this pattern is for Y" the numbersubacute inpatient days, in the nrst equation, where thecoefficients of all terms of the cubic expression for this variablearc statistically insignificanttOI
One way in which economics of scale may be evaluated forhospitals is by examining how hospital costs increase if outputs are increased by the sat: .: propor"tion. This keeps the
~ mix of hospital outputs constant to: create a composite output.Overall economics of scale exist if the proportionate increase incosts is less than the proportion by" which all outputs are,increased. A natural candidate for a composite output of hospitalservices is the mean level of services observed in the data. setting all other variables at their means , each output multipliedby a scale factor (along with its square, etc.) may ,be enteredinto the equation to predict costs for a larger or smaller bundleor outputs.
Results from the first specification suggest that there arestrong overall economies of scale in producing hospital services;increasing all outputs in a hospital by 10 percent above theirmean values is associated with an increase of only 3.3 percent in
102 Grannemann et al. (1986) obtained a similar resu Jt in
their study of hospital costs.
Section IV
short-run costs as measured by LNETCOST.I03 Cowing and-Holtmann (1983) similarly found overall economies of scale estimating a shor t-run cost function. Their estimates impliedthat hospital costs would increase by 8.6 percent for a tenpercent increase in aU outputs.
The cost-function estimates for the second specification leadto a different conclusion , however. Here a 10 ' percent increasein all outputs is associated with a 15.7 percent increase inhospital costs. This indicates th,t there are fairly strongdiseconomies of scale to expansion of hospitals if they keep theirmix of outputs constant.
The alternative to measuring , cost changes forequiproportionate increases in all services is to calculate marginaland averag~ costs for changes in one output at a time holdingother outputs constant. Marginal eost for an output can rc:adilybe calculated by assessing the increase in total costs ofproducing an extra unit of that output holding other outputsconsta n t.
In the multiproduct context , the average cost of producing anoutput cannot be calculated by dividing total costs by the levelof that output as it can be for the single product case. Themultiproduct analogue to average cost is average incrementalcost. The incremental cost of producing a given output is thedifference between the costs of producing all outputs and alloutpu,ts but the one of interest. Dividing this incremental costby the level of the output gives its average incremental cost(AIC )' For example, to calculate the AIC of producing VI, wecalculate
(I) AICI = (C(Y Y .,
) -
C(O Yi, V.' )) / VI
10' Short-run scale effects may also be thought of economies of capacity uti~ization; they represent the changes incosts associated with changes in output , holding the capacity of ahospital (measured by number of beds) constant. ,

Section IV
where C( ) is the cost function evaluated at a set of outputlevels.
"" Dividing the average incremental costs of output i by itsmarginal cost yields a measure (EOSi) of the product-specificeconomies of scale for that output. tO4 Economies of scale e,dstin producing an output if EOSieltceeds one. Estimates of themarginal and average costs of producing each output at its meanlevel are given in Table V.
The estima les of short-term marginal and average incrementalcosts for each of the five services are lower than their long-runcounterparts. tO6 The most striking difference bet\\1een the twosets of results is that the estimated costs of acute care are muchlower in the short-run specification than in the long-runspecification.
The reasonableness of the two sets of cost estimates can beassessed by comparing costs to the average revenue figures forinpatient and outpatient services provided by the AHA in itsvolume l!Q1~1 Stati5ti
~.
This volume provides summarytabulations for 1984 hospital revenue data not available on thepublicly released ABA tape. The AHA data provide an estimateof average revenue of $520 per inpatient day and $105 peroutpatient visit for all community hospitals.J06 To compare theserevenue figures to our estimated cost figures, it is necessary to
UN The assumption necessary to retrieve the economies ofscale parameters of the production function that is dual to a cost,function is that the costs of producing the outputs arc indeed minimi~ed.
106 The negative values for the subacute care variableshould be ignored in the first specification; the coefficients ofthe own , square, and cube values of this variable are statisticallyinsigniricant.
108 Neither the public AHA cost data nor the publishedsummaries of hospital costs provide the information needed toallocate costs among individual hospitals or groups of hospitals.

TABLE V
Estimated Costs (S)and Economies of Scale forHospital Outputs with All Outputs Set to their Mean Level
Dcocndcnt Varia~, L NETCOST
Deocnc1ent VariahlhL TOTCOST" I
AIC
" "'.
, Acutc caredays 39. 59.
Intensivecarc days 152. 171.98
Subacu ICcare days -35. 36.
EOS AIC EOS
1.48 509. 14'- 348.
1.13 626.38 674~68
" ,
1.08
1.03 459.69 462.96, 1.01
Emcrgencyroomvisits 75; 13 91.44 1.22 235.65 278. . 1.
Otheroutpat ientvisits 21.80 23. 1.07 37. 39. 1.08
Section I
weight the number of each of ~he three types of inpatie~t daysby its ntlf
- ~
nal cost toobt_in an overall estimate of the costs ofan inp~ticat day.107 The two types or outpatient, vis.ts mustsimilariy be weigbted by tbeir marginal costs to obt$in anestimate .of. tbe costar an .outpatient visit.
The weighted cost estimates .obtained fram the ruU-cost, spec i fie 8 t,i.o n arc much clQ,ser to the revenue figures.provided bythe AHA", J~an those ca)culated from , the purely sbort-runspecification " For inpatient days the full-eost specificationlenerates an estimate .of the epst .of an inpatient day of SS 17;
" the: correspandingestimate afth~cast .of an outpatient visit is$IOS. l08 ' The estimates of bath casts .obtained from the short-run specification are much lower at about $40 per npatient dayandSSOper outpatient visit. IOO
Other than , for acute ' care inpatient days, the twaspecifications provide similar evidence that there arc modest
107 The AHA volume docs riot allocate costs betweeninpatientand outpatient services in its tabulatians .of hospital expenses.
, ,
108 Or.nnemann ~t al. (1986) evaluate their $82 tstimate
or the margin_I cost of a nan-em~r,ency autpatient visit bycomparinait tathe S3S 1981 cost .of visi ting a private phys icianoffice. Infl.ting tbe latter figure by the physician feecompon en~ of the Cansu~er Price Index. we can ,see ("at ourestimate of a marginal cost of 537 is close to the inftatcdfigure
, of $44. '
lOG II should be noted that since shart~run averageincremental costs are lower than their long-run counterparts. theassociated short-run incremental costs .of producing each output(.sed to" calclihi'te scope economics) are also lower than the
, COrresponding long-run costs.
, , \,
Section I
economies of scale to expanding individual hospital services.Economies of scale ar~ greatest in the provision of emergencyroom ser-vices and lowest in the provision of suhacutecare days.Bothspecifications provide similar measures of economies of scalefor intensive care treatmentand for b()th categories of outpatientvisits. With respect to licute care days. the long-runspecification indicates that there are diseconomies of scale expanding these services; the sh()tt-run cost estimates indicatingscale economies are too low to be credible. There also appear tobe economies of scale in expanding subacute care in hospitals'the seale measure obtained from the .short-run specification based on negative marginal and ' average cdsts and should beignordt. ,
Relying on the second specification , these resullsindicate thatfor the average hospital . the expansion of a single hospitaloutput other than acute patient days leads to a lowering of themarginal cost of that output This suggests that a regulation
. that restricts provision of these services may prevent hospitalsfrom rea1izin~ product-specific scale economies and thereforeunnecessarily .Iise hospital costs.
Measures of product~specific economics of scale reflect ontythe change in the costs of supplying a given output as more ofthat output is provided. These measures do not take account ofhow ~hanges in the level of one output ~ay affect the costs ofprovidingother services. These effects are measured byeconomies of scope . a concept which doesnothave a counterpart in single-product cost functions. EconoOt ieS'ot scope arise fromthe joint utilization of inputs in producing difr~rentoutputs.Managerial scope economics may also arise if it is easier tomanage diverse hospital services jointly rather than separately.
110 The; measures of product-specific economies of scaleobtained from either specification for the five outputs changelittle if all outputs are simultaneously increased or decreased bySO percent from their mean values and therefore are notpresented here.
Section IV
Far the twa-praduct case, ecanamies .of scape exist in praductian pracess irthe tatal casts .of producing twa servicesjaintly arc less than the sum .of the cast~ .of separatelypraducing
e same volume ,.of services. FarmaUy, ccano,miesaf sc.ope.existbetwecn the twa .outputs Y 1 and Y J if the fallowing conditionholds:
(2) C(Y I' V 2 c: (C(Y 1,0) + C(O,Y 2
where C( ) i~ tbe cast function evaluated at levels .of the twa.outputs.
Econamies .of scope can be measured as tbe dirferenc.e betweenthe casts .of separately praducing each .output and praducing themtGgether,. d i v ided the. tata I .casts af prad Dei ng lhe two
praduetstagcther. i.
(3) ,~COPE 8: (C(Y 1,0) + C(O, l- C(Y l,y,lllC(Y l'Y 2
The expre-ssionSCOT " measures the perce.,tagccast saving injointly praducing th' . NO .outputs, rather than praviding' themseparately.
One way ta measure ecanomies of scope in haspitals is tacampare the tatal cast .of producing e~ch hospital, .output insep.rate faciHties ta the cost .of pro4ucing the.se . erviccs at a
single Cacility. A measure .of .overall economies .of scape far thecase .of five .outputs is Cormally given in (4):
(4) SCOPE~. (C(Y .. O)+. C(O.YJ. O) + C(O, O) +, C(O, p~ V O) + C(O O, V C( V l' V " Ys. V 4' V,
))
C(V I'V 2'V " V t;V I
",h~re C( 1 is _he
; ,
ost runc~Jqn evaluatedror: e~c~ autputcombinatian. Far. each Q,utput. the costs of pr()ducingth~,.ta.utputaloQei~ calculat~d bysettinl the le"t:tQr)oth~r , au.tp...ts, to zera.Th~ costs or ' P'foducinge chautputsc:parately 'are then .addedand the casts at jointlypraducing aU outputs are s...b f;~~ted fromthis sum. These incrente. tal hcasts of separate production are
Secti9n IV
then divided by the costs of joint production to calculate overalleconomies of scope.
Economies of scope can also be evaluated for each individualoutput. We compare the combined cost of producing one outputoutside of the hospital and producing all other outputs togetherto the cost of producing all outputs together. This measure ofeconomies of scope is formally given for the first output in (5):
(5) SCOPE - (C(Y 1, 0.9) + C(O, Y 2- Y 3- V .' Y ,C(Y I' v 2' V 3' .' Y ,)J C(Y I' V 2- Y 3' 4' V
Product-specific economies of scope may similnly be calculatedfor the otheroutputs.Ul
Table VI provides estim.ates of overall and product-specificeconomies of scope calculated, from . the second (long-run)
, specification of the cost function.ln Outputs are set to, theirmean levels to calculate these measures, and then the outputlevels are equiproportionately decreased and increased by 50percent to assess how scope economies change as the volume of ahospital' s services chan8es~ holding the mix of outputs constant.
Our results indicate that product-specific economies of scOPeexist for all outputs at low levels of output, but that these
ecODomies of scope decline as outputs increase. For smaller-
than'-average hospitals~ the savings to' producing individual
111 Given the specification of the cost function , it is notpossible to calculate tractable standard errors for our estimatesof overall or prod,uct-specific economies of scope.
lit Estimates of product-specific economies of scopeobtained from the first (short-run) specification indicated thatover the three levels ofout'pufpresented in Table VI , producingany single output sepa' rately ftom the four others would lead toan increase in total costs of between SO and 70 percent. These
timales of the sav~ngs from joint production seem too high tobe plausible and are not presented here.
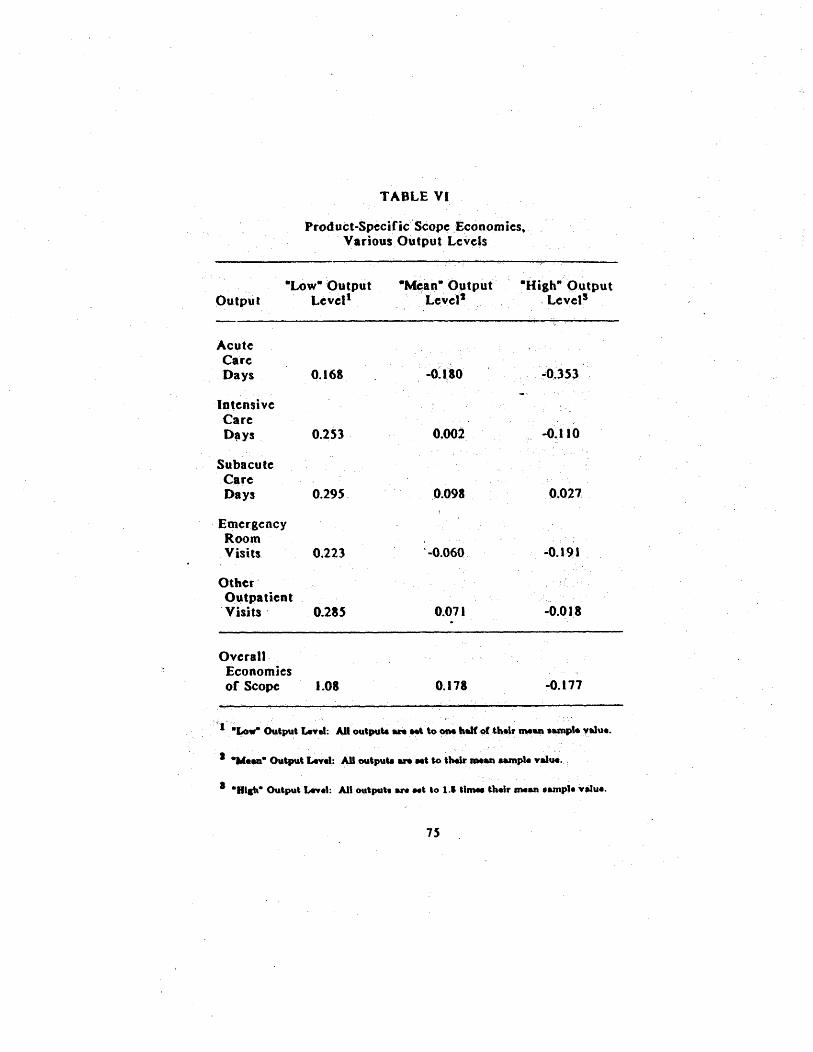
TABLE VI
Product-Specific Scope .Economies.Various Output Levels
OutputLow Output
LevellM~an- Optput
, " , "
LevelHigh- Output
" Level$
AcuteCareDays 168 O~ 180 35,
IntensiveCareD~ys 253 ' 002
'..
110
SubacuteCareDays 295, 098 027
EmergencyRoomVisits 223
. -
060 191
OtherOutpatientVisits' , 0.285 07 I 018
Overall Economiesof Scope 1.08 178 177
, '
I .Low. Output Lrt~t: AU outpute an M\ to' ".af~th.'nnean .~'.yalu..
J -W...' Output IA.,.I:AJI outpute an Nt &0 ,beII'lIM... tamp'. value.
. .
B&ah8 Output IAY.I: All out pub ~ Nt to 1.1 &Imee th.lr mean .ampl.v.Ju..

Section I
outputs within the hO5pitai rather than producing anyone outputoutside the ho~p,ital are substantial. Overall hospital costsdecrease between 16.8 and 29.S percent if the 'individual servicesare produced along with the remaining services for - low. levels
of outputs. The overall level of economies of scope in producingthese .Iow. levels of output~ are quite large: iti$ estimated thatcosts would mbre than double if all outptlts produced at thislow~leve1 were produced separately rather than together withina hospital.
Evaluated for the average hospital; economies of scope cxistin providing intensive c~re, subacute care.. and ,non-emergencyoutpatient services. The savings associated with producing theseservices within hospitals rather than outside- hospitals are,respectively, 0. , 9~ . and 7. 1 percent. The results indiCate thatdiseconomies of scopc cxist in the provision of acute clue andemergency outpatient visits. If acutc care or emergency carewere produced scparatc.ly outside of hospitals , the overall"costsof providing all five services arc estimated to be respectively18. 1 and 6. 1 percent lower than the total cost of providing aUfive services within a hospital.lts
The result ,that there arc diseconomies of scope for the,average hospital in providing these two services, which 'make upa major part of hospital output , is somewhat surprising, thoughother researchers have come to sim"ilar conclusions.114 Thefiodin. that scope diseconomies exist for acute care days andemerlency outpatient visit! implies that the costs ()f other
113 The estimated savings to producing all outputs withinhospitals rather than producing aU outputs separately are 11.percen t.
lie Cowing and Hohmann (1983) observed diseconomies ofscope between emcraency room visits and al1 o~her' hospital
services a'ndbctwecn medica1/surgicalinpatien t days and an otherservices. Grannemann el al. (1986) observed diseconomies ofscope between all inpatient days and both emergency room visitsand other outpatient visits.
Section JV
hospital services increase as the volume of either of theseservices increases. It could be the case that th~se results reflectIreater complexity in the case mix or treatment costs for largerhospitalS not, fully captured in the variables inCluded in ourregression.
Finally. at the -high- level of output, there are product-specific diseconomies of scope for aUoutpu.ts e,xcept subacutecare inpatient days. At these levels ofoutpu, . there are also
overall diseconomies of scope. Care should be t_ken ininterpreting these results (along with the 810w8 output levelresults), whlchare calculated under the assumption that hospitalsproduce the same mix of outputs whateverth~ir size.
, 17

V. Co.~I..loDI
" The primary regulatory mechanism used by most states tomonitor the expenditures of hospitals is a certificate-of -need
, (CON)program. CON lawsinherenUyrestrict competition amonghospitals by partially supplanting the market mechanism by aregulatory process that constrains the supply of hospital facilitiesand services. The evidence provided by this study suggests thatasstates revi.ew fewer hospital expenditures through the CONprocess
. ,
hospital costs 'do not increasc. Rather our study
suggests tha.t hospital costs are lower in those states which sethigher review thresboldsCorall type)ofhospit8:1 expenditures.
Since the 1983-84 time per.iodcoveredby tbis study, severalstates have either raised tbe thresholds at which proposedhospital expenditures must be reviewed or eliminated their CONprograms. ' Our resuhs suggest tbat such increases in CON reviewthresholds and repeals of CON programs would not lead toincreased hospital costs and sbouldtherefore be supported. Thisconclusion is similar to that obtained by other researchers usingdata from the 1960s and 1970s; CON laws do not appear to havebecome more effective in reducing the levels of hospital costs inthe 19805 tht they were in earlier years.
We have examined tbe relationship between hospital costs andCON regulation using a multiproduct cost function that relates
, total hospital costs to five categories of hospital services, alongwith other factors, includin! the presence of various forms
hospital regulation , thought to be related to these costs. We'Cound that the presence of mandatory rate regulation within astate was not associated with lower hospital costs, but that thereview of capital expenditures under the 1122 program whencombined with a CON program was associated with lower costs
, for hospi~als than when exclusive reliance was placed on a CONprogram.
This study examined the relationship between a hospital.s Cormof ownership and its level of costs. The evidence S\ilgcsts thatamong independently operated hospitals, both for-profit and stateand local government hospitals ha ve lower costs than voluntaryhospitals. The results indicate that costs of for-profit andgovernment hospitals may be higher when such h(jspitals are
Section V
affiliated with other hospitals rather than when they are operatedindependently~ Theesthnated coefficients of the cost function were used to
measure economies of scale and scope in the production ofhospital services. ' Thoulh both short- arid long-run costfunctions were estimated, theestimates of marginal and averaleincrementa! costs were more believable when obtained froJ'ltthelong-run cost function. The results indicated that 'mod~stproduct-specific economies of scale exist in the provision of mosthospital servic~s, with the exception of acute inpatient care. amajor output of hospitals. For the average hospital, economicsof scope wcreCoundto exist in producing all hospital servicestogether rather than separately, but diseconomies of scope werefound to exist between the production of either acute inpatientcare or emergency room services and all other hospital services.Both overall and product-specific econ'omies of scope wercc foundto decline ashospitals increased their levels of output (keepingoutput mix constant).
There are sevcral ways in which this p researcb could beextended. Fi. and foremost . as they beco,'. - vailable , morerec~nt data ~d bc used to rc.plicate the s~ ;1. Thcre havcbccnsignificant changes in state CON laws since 1983, includingthe sun3et or repeal of CON laws in nine states, several of whichare among the most populous states in the nation.tli Use ofmore recent data would providc information on the costs of alarger number ofunrelulatcd hospitals, and this would provide abetter basis for comparisons with the costs of regulated hospitals.Changes in CON laws may take time to affect costs as hospitalsadjust their input usage to a different regulatory environment,and the usc of later data would allow comparison of hospitalcosts involving states which ..had longer experience withderegulation.
111 Thesc states are Arizona (1985), California (1987),Colorado(1987), lndiana(1987), Kansas (1985). Minnesota (1984),Texas (1985), Utah (1984), a~d Wyoming (1987).
,!)
Sect ion V
One difficulty in evaluating the effect oC resulationshosphal costs is that states with high hospital costs may be theones mos,t likely to attempt to contain costs through resulatorymechanisms. An observed relation between higher costs ,ndregulation could indicate that higher costs cause regulation ratherthan the other way around.lle We have followed the approachof other stu4ies of the effects of regulation on hospital costs
and have assumed that hospital costs do not influence a stateregulatory c1imate.
The possibility that costs and ' flos pital regulation aresimultaneously determined could be formally P1odelledtJy usingsimultaneous equations estimators. Specifying such a model wouldrequire as arirst step that we model the process-by which stateschoose to regulate hospitals and the methods they cltoose toaccomplish this regulation. There has, however, been very littleresearch on the deter minants of hospital regulation.
The fundamental problem in simul~aneously modelling hospitalcosts and regulations is that costs are determine(j at the level ofthe hospital while regulations are established at the level of thestate. The two levels of observation could be combined only we aggregated data on individual hospital costs and
, 116 If this is " true, our estimates of the . effects ofregulation on costs would likely have a bias away from findingthat tighter regulation (as captured by lower leve1sof the CONreview threshold variables) was associated with lower costs.
117 Two studies have examined the determinants of stateregulation of hospitals. Wendling and Werner (1980) present amodel of the political economy of the passage (or defeat) of stateCON laws prior to tbe enactment of tbe National Health Planningand Resources Act in 1974. The authors found no evidence thatthe passage of CON laws was related to growth of' hospitalexpenditures within the state. In their study or hospital rate-setting laws, Cone and Dranove (1986) round that hospital costswere not a determinant of the likelihood that states would adoptthese la ws.

Section V
characteristics to the level of the state, a situation that wouldpresent ' several problems in itself. Thougb in principle itwould be preferable to model simultaneously 'the determinants ofcnsts and regulation , we believe that' the estimation approachused in this re-port most likely provides an accurate assessment ofthe effects of regulation on hospital cost~.110
118 First. given that therewoutdbe only S' observations,
there would be few (if any) degrees of freedom a\'ailable were amultiproduct cost equation estimated along with 'several fullyidentified structural equations to explain different regulations.
Second, simultaneous equations estimators are themselves biasedin small samples; it is not clear from the available Monte Carloevidence that these estimators provide superior results to theordinary least squares (OLS) estimator in small samples (Johnston(1972)).
110 The size of the bias of the regulation variables in acost function estimated using the OLS estimator rather than asimultaneous equations estimator depends both on the true (but,unknown) values of the coefficients of the regulation variables inthe cost equation and the coefficients of the cost variable inequations determining the rcgulatory climate. If hospital costs donot have a significant e~fect on a state s regulations, then therewill be no bias in using the OLS estimator to assess ~he effectsof regulation on hospital costs. The studies of the 'determinantsof hospital regulation cited in foothote J 17 so' ggcsl that thiscondition may hold , for they fou~dthat passage of state hospitalregulations wer~, not influenced by hospital costs.
The bias will also depend 011 the errorvaria nee of the costequation relative to that of the regulation equations. Just as data on the price and quantity ofa good may be used to identifyeitberasupply or'dcmand curve if one function shifts less thanthe other. so wiUthe cost function be relativetyweU identifiedif there is much more variation in the regulation (unctions than
' the cost 'function. The hospital cost functions we haveestimated maybe similarly identified if costs can be predicted
(continued...

Section V
, A final direction for the analysis of, hospital, costs ' and the,effects of regulation on these costs is the development ofdynamic empirical models, which would measure bow hospitalschoose and modify theirinput ' usage over time. Regulation ofhospital inputs may affect these cho_ces. which ..Itimately mayaffect the levels of hospital costs.120 Modc:ls of tbis kind arecomplex and demanding in their data requirements; they wouldlikely serve, however to increase our understanding of thedetermin~nts or hospital costs and the effects of regulatioJl onhospital costs.
. ...
conhnue more acc~rately than can state regulations. We believe thatstate regulations are determined by many elements such aspolitical factors that ,are difficult to precisely measure, and as aresult, a state s regulation climate is likely to be : less well-predicted than the costs ()f individual hospitals operating within astate.
120 Kelly (1985) used ~ata 0042 M;aryland~,ospitalsrrom1910-81 to assess how changes in hospital regulation over an 11-year period affected the speed with which hospitals adjusted theircapital stocks to desired levels. Since there were no changes inMaryland' s CONprogr,am over tbe time perJod , she was not ableto assess the impact of the CON program on investment.

Blblloaraphy
Ailner, D. J, K. Lovell and P. Schmidt. "Formulation andEstimation of Stochastic Frontier Production Models. Jourllalof Ec.8...etrlcl, (1978): 21..38. Alpha Center Health P('1icy and Planning, The DerelulaU08 ofSerylcel froM CON Reflew. , Washington, D. : Alpha Center'Htalth Policy and Planning, 198S.
American Hospital Association. Holpllal StatlitlcI198S Edltloll.Chicago, IL:American Hospital Association, 1985. Bailey, Elizabeth E. and AnnF. Friedlacoder. ~.Markct Structureand Multiproduct Industries.. Joun.al or Eco.omlt Llterature, 20(September 1982): 1024-1048. Becker, Edmund R. and Frank A. Sloan. "Hospital Ownership andPerformance." Ec~.olllic I.q.llr)' 23 (1985): 21-36.
..
Belsley, David, Edwin Kuh and Roy Welsch. IdeallfY'BIl.nu~ftU..1 Da ta aad Sources of CoIUD.earlty, New York , NY: JohnWHey' and Sons, 1980.
Caves, D. W., " , L. ' R. Christen~en, and J. A. Swanson.Productivity ' in U. Ra ilroads, 1951-1974. Bell Journal of
Keo.o.lcl, 1 1 (Spring 1980): 166- 181.
Chana. Cyrii F~andHoward P. Tuckman. "EcooometricAnalysisortbe Hospital Size/patient Load Relation." Applied Economics,18 (19&6): 793-&05.
Cone, KennethR. and David Dranove. .WhyDid States EnactHospital Rate-setting Laws?- Journal of Law alJ~conomlcs(Octobe~ 1986): 287-302.
' ,
0 ,
, -
Cowioa, t:W., G. Holtmann andS. Powers.
, "
Hospital Cost
Analysis: A Survey and Evaluation of Re~tntStudjes." Ad....cesHealth Eco.olDlcRe~e.rch . 4 , (1983): 257-303.
!!ThJ iORra Dft V
Cowing, Thomas G. and AlphonseG. Holtmann. wMultiproductShort-run Hospital Cost Functions: Empirical Evidence and PolicyImplications from Cross-section Data" Southern EcoDomlcJour.al , 49 (Ianuary 1983): 637-653.
Eastaugh , Steven. -The Effectiveness or Community~basedHospital Planning: Some Recent Evidence.w .Applied Eco..omlcs
, 14
(October 1982): 475-490.
Eby, Charles and Doqald Cohodes. 8What Do We Know aboutHospital Rate-S~tting?" Jour..1 of H,.Uh Politics, Policy andLaw; 10 (Summer 1985): 299-3~4.
Ermann, Dan and Jon Gabel. wThe Changing Face of AmericanHealth Care: Multihospital Systems , Emergency Centers, andSurgery Centers. Medical Care 23 (May 1985): 401-421. '
Farley, Dean E. and Joyce V. Kelly. The DeterlDln.ilts ofHospHals' FIB.odal Posltlool. Rockville, MD: National Center forHealth Services Research , 1985.
Goldfarb, MG. , M. C. Hornbrook, and J. A. Rafferty. -Behaviorof the Multiproduct Firm: A Model of the Nonprofit Hospital~ystem." Medical Care 18 (February 1980): 185.,201.
Grannemann, Thomas, Randall Brown and Mark Pauly.:Estimating Hospital Costs: A Multiplc-Output Analysis.- Jour.alof Health Economlcs 5 (Summer 19~6): IO7-127. Harris, Jeffrey. -The Internal Organization of Hospitals: SomeE~onomic Implications.- Bell Journal.f EcoBomlcs 10 (Autumn1978): 4,6J~82. , Hornbrook , Mark C. and Alan C. Monheit. "The Contribution of
, Cas~mix Severity to the Hospital Cost-Output Relation." Inquiry~2 (Fall 1985): 259-271. Intergovernmental Health Policy Project. "CON Changes TaperOfr." State Health Notes, Number 67 (October , 1986),

1lil2JioRraohv
Intergov~rnmental Health PolicyPrQjcct. The StatuI of ~aJor, $tale Pondel AfJectia. HolpltaICapltallayest.e.t. Washington
: Intergovernmental Health PoHcy Pr6ject, the GeorgeWashington University, 1984.
' ,
Johnston , John. Ecoaometrlc Methofis. ~ew York, NY: McGraw-Hill
, '
1972.
Josko . Paul. CoDtroIUaa Ho$pUA1 Costl: The , Role ofGoyerameat Relulatloa. Cambridge, MA: MIT Press, 1981.
Kelly. Joyce V. Determl.allltiof Caplhll ~cqu"ltloD by NoDprofltHospitals., Rockville. MD: National Center (orneajth ServicesResearch. 1984. Kennedy, '-eter E. -Estimation with CorrecUylnterpretedDummy
, Variables in Semilogarithmic Equations.- America. EcoDomlcRedew , 71 (Septembe( 198J ):. 801.
Lau Lawrence J. -Functional Forms in Econometric ModelBuilding. ln The U..dbGok or Ecoaometr!cl. Volume 3, edited by
~ Griliches and M.D. IntrHigator. Amsterdam: North-Holtand198~
Laudicina. S~san S. A Co.p~..athe Suney of M~.~lcald HolpUalRel.b.rse.eat S'lte.. for I.patleat Serylcel, State by State,1980-1985. ' Washington, D. : Th~ Intergo;v:ernmental HealthPolicy Pro~ct, the Georle Washi.,gton University. 1986.
, , ' " , ', ,
Leamer, Edward E. Speclflcatloa Searches. New York . NY: JohnWiley and Sons, 1978.
, ,
Lee, Maw Lin. wA ConspicuQusProduction TheoryorJf9~pitalBehavior.- Southera Ecoao.lc Jour.al 38 (July 1971): 48-59.
L~wiDandAssoCi~.tes. f"eEJCP~rle.ce \y'lthTh~ Sectlet.1122Capital Expead It.re JeYle" trol,a... Washington , D. :Lew ~ n
and Associates, 1985. ,

lihJiOJUaD"V
McFadden , Daniel L. "Co~t, Reve"ue, and Production FUDctions.ProdiactioD Eco..:onilcl: ; A Dual' Approach" to yheory aDd
ApplicatioDs, edited by MFuss. and D. McFadden. , Amsterdam:North-Holland, 1978. "Maddala , George S. Ecoliometrlcs. New York: McGraw Hill 1977.
Ncwhpuse, Joseph. "Toward a Theory of Nonprofit Institutions:An Economic Model of a Hospita1." American Economic Review 60(1970):' 64-74.
, Noether, Monica. Co.pet" .~ Aaaolll'HospUals. Federal TradeCoinmission , Dureau of Economics Staff Report-. 1987.
Pauly, Mark. Doctors and Their Work.hops: Economic Models ofPhysicIan Behaylor. Chicago: University of Chicago Press. 1980.
Pauly, Mark and Michael Redisch. "The Not-for-profit Hospitalas a Physicians' Cooperative. " America. Economic Review , 63(1973): 87-99. Posner, Richard A. "Certifica tes of Need for HeaHb CareFacilities: A Dissenting View." In Regulatlnl lIealth CareFacilities Construction , edited by Clark Havighurst. Washington
: American Enterprise Institute. 1974;
Register ~Charles and Edward' Bruning. "Profit Incentives andTechnical Efficiency in the ProductiOn of, ' Hospital' Care.SoutherD EcoDomlc ReTlew , S3 (April 1987):899-914.
Salkever. David S. and T. W. Dice. "The Impact of Certificate ofNeed Controls on Hospital Investment." Mllbank Memorial FundQ"8rterl' y, S4 (Sprins 1976): 185.-214. Salkever, David and T. W. Dice. HospUalCertlflcateof NeedCoDtrols: " .a.pactoIl18yestmeat, Costs, aDdU$e. ' Washi~gton
: American EnterlKise' lnstitute , 1979.
IlihJ i 0 a r ;uili v
Simpson, James B. "Full Circle: The Return orCertiCicate ofNeed Regulation or Health. Facilities to State ControL- ladla.aLaw Reflew, 19 (1986): IOZS-1127. Sloan, Frank A. 8Resulation and the Ri. i t\g Cost of HospitalCare.- Re,lew of Economics aad StatisUci 63 (November 1981):479-487.
Sloan , Frank, Roger Feldman ,and BruceSteinwald. 8Effects of Teaching on Hospital Costs, Journal of Health Economics. 1
(1983): 1-28,
Sloan , Frank and Bruce Steinwald. I..araace. ReaulaUoa. and,Hospital Costs. Lexington , MA.: Lexington Books, 1980.
Sloan , Frank , J. Valvona and R. Muller. 81dentifying the Issues:A Statistical Profile! In U.colllpe..ated HospUal Care: Rlihts.nd Responsibilities, edited by Frank Sloan, J. Blumstein and Perrin. Baltimore , MD: Johns Hopkins, , 1986. Steinwald , Bruce and Frank Sloan. -Regulatory Approa'cbestoHospital Cost Containment: Synthesis or the EmpiricalEvidence,lI In A New Approach to the Econom'cs or Health Careedited by MancurOlson. WasHington , D. : American EnterpriseInst~tute, 1981. Vadan , Hal R., Mlcroeconomlc Anal)'sls. New York, NY:W. W.Norton and Co., 1978,
Watt, J. M. et ale The Effects of Ownership on MultihospitalSystem Membership ,on Hospital Functional, Strategies andEconomic Performance.- In For~Pront Enterprise In Health Care.Washington , DC: National Academy Press, 1986,
Wendlina, Wayne and Jack Werner. -Nonprofit Firms and theEconomic Theory of ReBulation.8 Quarterly Review or IcoDo.lel..4 Bulhlell, 20 (1980): 1- 18.
IlihJ iORra oil y
Wilson, George and Joseph J~dlow. .Competition. ProfitIncentives and TechnicalEfficiency in the Provision of NuclearMedicine Services,- Bell Jour.al of ECODomtcs 13(AUtumn 1982):472-482,
88