the effect of shrinkage of epoxy and polyurethane ... on automotive composites, ... delamination,...
TRANSCRIPT

Seite 1 von 12
The effect of shrinkage of Epoxy and Polyurethane thermosetting resins on composite parts surfaces
EIKE LANGKABEL, SEBASTIAN DE NARDO, JENS BOCKHOFF
Evonik Resource Efficiency GmbH, Paul-Baumann-Str.1, 45764 Marl, Germany
SUMMARY
Automotive OEMs today strive increasingly to use fiber-reinforced polymer composite materials in automotive structural parts as well as for body panels. Process and process parameters, as well as matrix systems and their components used, significantly affect the quality and performance of the resulting composite parts.
By using tailor-made amines as curatives in liquid epoxy resin formulations designed for RTM-Technology, as well as dedicated polyurethanes in the manufacture of prepregs, it is possible to achieve unique solutions for top-class surface quality combined with all required functional specifications.
1. INTRODUCTION
One of the most significant problems in the processing of composite parts is residual stress.
The understanding of residual stress in thermoset composites requires comprehensive consideration of all the phenomena contributing to its formation. These include: chemical shrinkage of matrix due to crosslinking of molecules, mismatch of thermal expansion or contraction among fibers and matrix and viscoelastic relaxation during the fabrication.
Thermo-physical and thermomechanical properties are changed during the curing process due to an exothermic chemical reaction. Since all the phenomena causing residual stress are strongly coupled, the solution procedure is a complex task [1].
Focusing on automotive composites, resin systems are subject to diverging demands. Cycle times need to be as short as possible, which is not a good basis for low stress curing. At the same time there is a demand for Class-A surface quality – a feature that is strongly associated with the shrinkage behavior of the resin matrix. However, there is a strong connection between curing stress and resin shrinkage behavior. Furthermore, outstanding mechanical properties are also needed for automotive composite applications.
All of this makes it a challenge to find the right formulation. Our aim is, to determine a material tool box, which means to determine material constants and the way of action. Fabricating a composite part always includes the interaction of material properties and process parameters.
Thermoset shrinkage occurs with volume reduction. And the mismatch between the thermal expansion coefficient (CTE) of resin matrix and that of the reinforcing fibers leads to fiber print-through (the resin matrix shrinks onto the fibers after demolding).

Seite 2 von 12
A typical cure profile involves an initial heating ramp during which the uncured resin is liquid and expands thermally without significant curing. There follows an isothermal dwell stage accompanied by reaction shrinkage. Finally thermal contraction occurs as the now solid composite is cooled down to room temperature. This leads to frozen-in free volume on the resin side [2].
Pressure is always involved with production processes. This leads to frozen-in stresses (e.g. shear, tensile, compressive) caused by shear forces, fiber displacement or as a result of hindered thermal expansion of the material.
All these phenomena can lead to defects in the finished part like shape distortion, micro cracking, delamination, reduced mechanical strength, aging and wavy surfaces.
Thermoset shrinkage mechanism
Figure 1 shows the response of volume of a given resin formulation during curing.
Figure 1: Thermoset shrinkage mechanism [3]
It clearly illustrates the mechanisms of volumetric change of epoxy resins during the cure cycle and the need for separating chemical shrinkage from thermal expansion/contraction effects [3].
The liquid resin formulation shows in the beginning its characteristical thermal expansion (a-b). The pure chemical shrinkage of an epoxy resin is the shrinkage during cure between b and c. c-d represents the thermal shrinkage of the polymer network above Tg and d-e the sub-Tg thermal shrinkage of the cured thermoset. The distance between point a and e shows the overall volumetric change, which is generally far less than the isothermal chemical shrinkage (b-c).
2. METHODS
We used selected methods to acquire our data:
• Volume Dilatometry Method according to InnoMat GmbH, Teltow; a spin-off of Fraunhofer PYCO, Teltow, Germany
• Thermomechanical Analysis (TMA) Netzsch TMA 202, Hysteresis measurements with ramp 1K/min RT to 200°C
Seite 3 von 12
• Differential Scanning Calorimetry (DSC); Mettler DSC 1, scan rate 10K/min
• Determination of overall shrinkage according to DIN EN ISO 3521 (Pyknometer/Buoyancy Scale)
• Determination of overall shrinkage by pVT method according to RWTH Aachen, Germany (similar to volume dilatometrie, but the changes in specific volume is determined dependent on temperature under a constant pressure; special method for powders)
• Finished CFRP-Parts: Long wave and short wave measurement by means of diffuse light (wave-scan dual, Byk-Gardner GmbH)
• Finished CFRP-Parts: White light interference analysis (MicroGlider®, FRT)
3. RESULTS
3.1. SHRINKAGE BEHAVIOUR OF EPOXY SYSTEMS
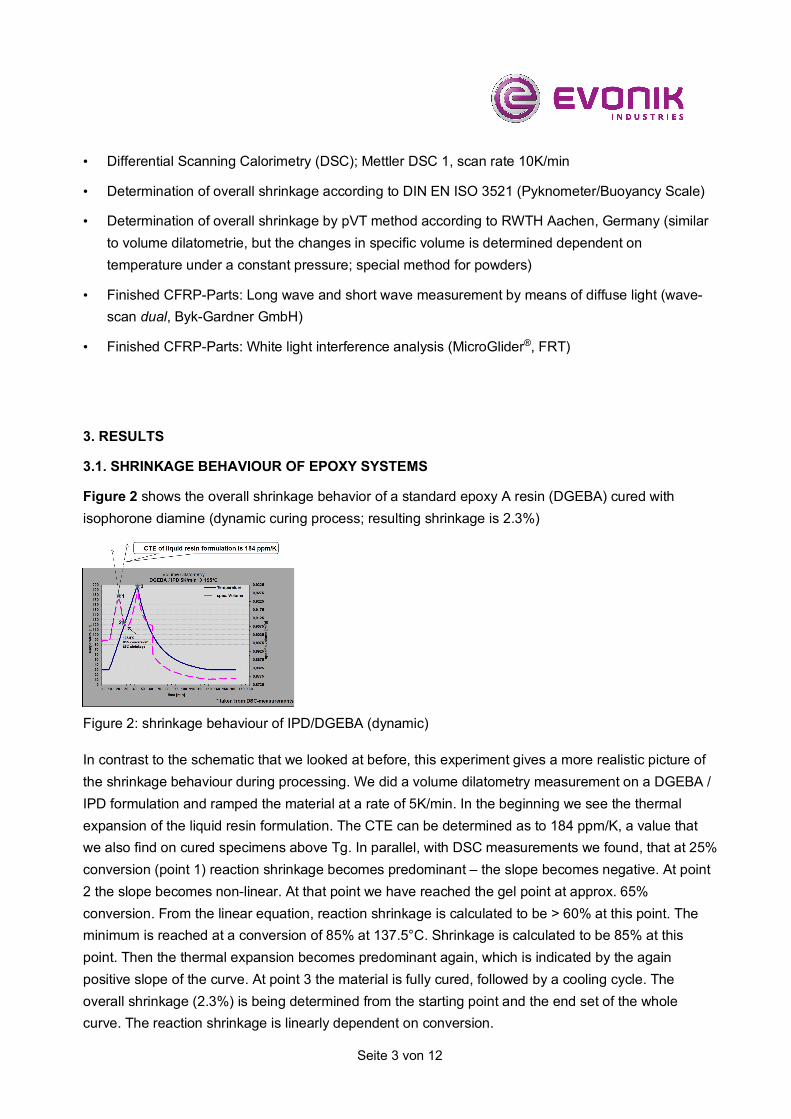
Figure 2 shows the overall shrinkage behavior of a standard epoxy A resin (DGEBA) cured with isophorone diamine (dynamic curing process; resulting shrinkage is 2.3%)
Figure 2: shrinkage behaviour of IPD/DGEBA (dynamic)
In contrast to the schematic that we looked at before, this experiment gives a more realistic picture of the shrinkage behaviour during processing. We did a volume dilatometry measurement on a DGEBA / IPD formulation and ramped the material at a rate of 5K/min. In the beginning we see the thermal expansion of the liquid resin formulation. The CTE can be determined as to 184 ppm/K, a value that we also find on cured specimens above Tg. In parallel, with DSC measurements we found, that at 25% conversion (point 1) reaction shrinkage becomes predominant – the slope becomes negative. At point 2 the slope becomes non-linear. At that point we have reached the gel point at approx. 65% conversion. From the linear equation, reaction shrinkage is calculated to be > 60% at this point. The minimum is reached at a conversion of 85% at 137.5°C. Shrinkage is calculated to be 85% at this point. Then the thermal expansion becomes predominant again, which is indicated by the again positive slope of the curve. At point 3 the material is fully cured, followed by a cooling cycle. The overall shrinkage (2.3%) is being determined from the starting point and the end set of the whole curve. The reaction shrinkage is linearly dependent on conversion.

Seite 4 von 12
In addition we did an isothermal run on the same system. Figure 3 shows the overall shrinkage behavior of a standard epoxy A resin cured with isophorone diamine (isotherm curing process; resulting shrinkage: 2.3%).
Figure 3: Shrinkage behaviour IPD/DGEBA (isothermal)
This is again a volume dilatometry plot, but isothermally cured. In the beginning the slope reveals a CTE of 190 ppm/K which is roughly the same result as in the previous measurement. The material was ramped up to 120°C and cured isothermally. After reaching 120°C the material has nearly already reached its plateau condition at 100% conversion and final shrinkage (discontinuities in the curve due to artefacts that are non-relevant). From these measurements we draw the conclusion that the reaction shrinkage behavior is almost independent of curing cycles.
Table 1 shows the comparison of the DGEBA / IPD system determined by different methods. All methods yield similar results.
Table 1: Overall shrinkage behaviour: comparison of methods
3.2. RELAXATION PHENOMENA IN THE CURED THERMOSET
After cooling to below its glass-transition temperature (Tg), a polymer is not in thermodynamic equilibrium, regardless of the cure process. In other words, internal or residual stresses develop in the polymer bulk that induce physical aging of the material, in which the frozen-in structure tends to relax towards its equilibrium state. Moreover, internal stresses are superimposed on stresses from external forces or environmental effects (pressure, chemical attack, etc.). As a consequence, the thermal history of a thermoset polymer is very important because it affects its mechanical properties in the glassy state, properties such as hardness and stress-cracking resistance [4].
Some degree of relaxation occurs below Tg, and with the time the molecular system does approach the true equilibrium state. The physical aging consists of relaxation processes and changes in volume caused by collapse of frozen-in volumes.

Seite 5 von 12
Several experimental techniques can be used to measure residual stresses. We used for our evaluations the TMA method.
Thermal expansion behavior in Y direction of oriented samples
Due to a special sample preparation, our samples showed a certain anisotropy. The flow direction is shown in our pictures as the Y direction. For sample preparation we used closed molds.
Figure 4 and Figure 5 show the behavior of DGEBA cured with isophorone diamine (Figure 4) and a polyetheramine (PEA; molecular weight 230 g/mol; Figure 5). We cured the matrix for 30 minutes at 120°C.
Figure 4: Thermal expansion behaviour of IPD/DGEBA
Figure 5: Thermal expansion behaviour of PEA/DGEBA
At the heat-up TMA run, the samples were heated from room temperature, and the dimension increased with temperature at first. However, a sudden drop occurred at around Tg. The sharp drop of dimension is considered to be related to relaxation of the frozen-in free volume and internal stress in the oriented samples [5]. After reaching the Tg, the frozen-in excess free volume is basically released. At this time, the network of the sample is in an approximate equilibrium state. The dimension then begins to increase linearly again. Because frozen-in free volume is released during the heat-up run, a relaxation phenomenon cannot be observed during the cooling step.
Linear aliphatic chains are more mobile and relax a lot easier, thus generating higher physical aging shrinkage. Due to this, the polyetheramines provide much higher shrinkage than the cycloaliphatic and rigid isophorone diamine. These physical observations could also be found for polyurethanes.
Thermal expansion behavior in Z direction of oriented samples
In a second measurement, we determined the expansion behavior in Z direction (which was perpendicular to the flow direction during sample preparation). It can be regarded, that in Z direction

Seite 6 von 12
stress-strain is induced in the molecular structure [5]. It is known that strain-induced dilatation brings about an increase in free volume in the glassy polymer [5]. As shown in Figure 6 and Figure 7, the heat-up TMA run on the strained sample shows a “bump” in the expansion trace.
Figure 6: Thermal expansion behaviour of IPD/DGEBA cured for 30 min at 120°C
Figure 7: Thermal expansion behaviour of IPD/DGEBA cured for 2 hours at 150°C
The epoxy system is DGEBA / IPD cured for 30 minutes at 120°C respectively 2 hours at 150°C. When the sample is heated, the linear expansion coefficient abruptly goes up, and the dimension increases quickly. As the temperature increases towards the Tg, the sample begins to expand linearly with temperature. There is no “bump” at the cooling run. It can be seen, that with higher curing temperature the resulting dilatation significantly increases (0.3% versus 1.0%).
As a consequence for composite applications it must be considered, that due to the production process the expansion behavior maybe anisotropic. The changes in length / volume during aging are caused by relaxation / dilatation processes and releasing of frozen-in free volumes.
3.3. INFLUENCE OF COMPONENTS IN LIQIUD EPOXY FORMULATIONS ON SHRINKAGE
For our investigations we used different linear, cycloaliphatic and araliphatic amines. Additionally we evaluated the influence of different reactive diluents on the overall shrinkage. The results are shown in Figure 8.

Seite 7 von 12
Figure 8: Influence of different amines on the overall shrinkage (Pyknometer method; curing conditions: 30 min at 120°C)
At the same functionality, cycloaliphatic structures show the lowest and aliphatic structures show higher shrinkage. The longer the aliphatic chain length, the higher the shrinkage. With increasing functionality, shrinkage increases as well.
Figure 9 shows the influence of different reactive thinners. The longer the aliphatic chain length (higher mobility), the higher the shrinkage observed.
Figure 9: Influence of different reactive thinners on the overall shrinkage (Pyknometer method; Resin system: IPD/DGEBA + reactive diluent; curing conditions: 30 min at 120°C).
3.4. INFLUENCE OF COMPONENTS IN POLYURETHANE FORMULATIONS ON SHRINKAGE
For our investigations we used different linear, cycloaliphatic and araliphatic isocyanates. The results are shown in Figure 10.

Seite 8 von 12
Figure 10: Influence of different isocyanates on the overall shrinkage (Pyknometer method; curing
conditions: 30 min at 100°C)
Isocyanurates (ICU) show the lowest shrinkage due to their high molecular weight. Nevertheless, cycloaliphatic ICU structures show the lowest shrinkage. Monomeric isocyanates show a higher shrinkage than ICU due to a lower molecular weight, but a lower shrinkage in comparison to aromatic and aliphatic isocyanates due to the cyclic structure.
3.5. SHRINKAGE OF A LIQUID EPOXY RESIN FORMULATION IN COMPARISON TO A NEW DEVELOPED POLYURETHANE-PREPREG SYSTEM
Polyurethanes are becoming currently more important to the composite industry. They offer fast curing cycles combined with very good mechanical properties and excellent toughness. EVONIK developed a new PU system based on aliphatic diisocyanates. Its uretdione structure provides excellent storage stability, doesn’t contain any free isocyanate groups and achieves excellent mechanical properties (high ductility, superior toughness). Figure 11 provides some information concerning its structure.
Figure 11: Structure and curing principle of VESTANAT PP
VESTANAT® PP enables a completely different way of processing, because before curing it behaves like a thermoplastic matrix, which leads to an easy preforming and results in a thermoset with excellent mechanical properties after curing.
We determined the overall shrinkage of VESTANAT® PP in comparison to the IPD / DEGEBA system with the pVT method. Because VESTANAT® PP is solid, regular volume dilatometry cannot be used. The uncured samples were heated up to 200°C with 5K/min and kept under 200 bar pressure. The results can be seen in Table 2.

Seite 9 von 12
Table 2: Comparison of the shrinkage of a PU-Prepreg system to IPD/DGEBA
Due to the differences in chemistry (e.g. structure) and process (e.g. liquid / prepolymer status, conversion before curing), the resulting shrinkage of the PU prepreg is significant lower than the IPD / DGEBA system.
4. FABRICATION OF COMPOSITE PARTS
In addition to our analytical lab work on shrinkage and relaxation behaviour of resin systems, we moved over to the shop floor in order to verify our results under mass production conditions. Besides formulations and cure schedule we included further factors like resin content and construction of the fibre reinforcement into those trials.
From our toolbox of resins and hardeners we selected some representative formulations and produced composite parts via the RTM process. All parts are based on the same build-up, where we choose multiaxial layers of Non Crimp Fabric. Two out of 4 resin formulations were optimised low-shrink formulations. In addition, we partly employed Low-shrink In Mold Coatings and Glass Fiber Nonwovens as a surface layer. We also choose a tool that had a combined matte and polished surface. Table 3 shows the fiber reinforcement build-up of manufactured CFRP-RTM-parts.
Table 3: fiber reinforcement build-up of manufactured CFRP-RTM-parts
Surface waviness is caused by thermal and chemical shrinkage of the matrix. Where there is a high local fiber volume fraction we have only little shrinkage, whereas where we have locally high matrix volume fraction, we see a high amount of resin shrinkage. In addition, the thermal expansion coefficients of resin and fiber are different, which leads to a mismatched thermal shrinkage behaviour. For this reason, the topography of composite parts surfaces never is completely flat but always wavy.
Table 4 shows the experimental matrix, completed by the results of surface measurements.
Build-up of CFRP-RTM Parts: 0/90° NCF 240 g/m² ± 45° NCF 300 g/m² 0/90° NCF 300 g/m² ± 45° NCF 300 g/m² 0/90° NCF 240 g/m² All parts cured 10 min at 120 °C

Seite 10 von 12
Table 4: Experimental matrix and results of surface measurement.
Results are highlighted in a green-yellow-red colour scheme in order to depict results more evident. Part 3 showed the worst surface waviness; this was the only part that did not carry IMC. So we clearly see the effect of In Mould Coating is most significant, whereas the effect of non-wovens as a surface layer is not clear. Part 4, where we employed the low-shrink resin matrix from our tool box, along with an additional IMC made from the same resin formulation, yielded the best results. Part 4 compares directly to part 2 and shows that an optimized formulation containing cycloaliphatic structures is superior over highly formulated resin systems that contain open chain aliphatic components in considerable quantities. In further experiments (not shown in table 4), we found the finding above is also true for part 3 and its comparison, a formulation according to part 2, but without IMC and without any glass nonwovens added to the surface of the reinforcement stack. Such a part showed a wave-scan result of 37, which is clearly weaker when compared to part 3 (28). In still another experiment, we could prove that employing polyurethane prepreg in a simple PCM (Prepreg Compression Molding) -process yields parts with surface qualities in the same range as the optimized epoxy formulations described above.
5. E-coating simulation
To make composite parts manufacturing for automotive applications more effective there are ideas to use traditional processes like e-coating. In order to withstand such high temperatures of up to 190°C matrix systems are expected to have a Tg which is in the same temperature range.
To avoid high curing temperatures there arose some ideas to pre-cure composite parts in a tool followed by a post-curing step during the e-coating process.
To investigate the behaviour of thermoset resins in an e-coating process two polyurethane samples with a maximum Tg of 165°C were cured in two different ways. The first sample was pre-cured at 100°C for 30min. The Tg after curing was in the range of 100°C. The second sample was cured at 180°C for 30min, which was enough to reach the final Tg of 165°C. Afterwards both samples were placed in an oven at 200°C for another 30min to simulate the e-coating. The results are shown in figures 12 and 13.

Seite 11 von 12
Figure 12: 100°C/30min + 200°C/30min Figure 13: 180°C/30min + 200°C/30min
As shown in figure 12 a pre-curing at a temperature, which is much lower than the max. Tg, followed by a post-curing at 200°C leads to formation of a rough surface with sink marks. On the other side, when curing the system directly at a temperature which is near the max. Tg followed by a post-curing, the surface stays flat.
These results show that it is not recommended to post-cure a composite part during an e-coating process.
6. CONCLUSION
On the material’s side on molecular level we can conclude that components based on cycloaliphatic structures offer the best performance in terms of shrinkage: (a) good Tg (glass transition temperature) development at moderate curing temperatures (Tg ~ Tcure) and (b) low CTE (Coefficient of Thermal Expansion) below Tg lead to low overall shrinkage, thus to low internal stress in the cured part and a favourable physical aging behaviour. However, when we go for fiber reinforced parts we find multiple effects that determine the surface quality of a part. We see a strong response of surface property development to process parameters, fiber reinforcement construction and build-up as well as resin content.

Seite 12 von 12
REFERENCES
(1) Y. Nawab et al, Macromol. Symp., 340 (2014) 59-64. (2) M. Zarrelli et al, Plastics, Rubber and Composites 31 (2002) 377-384. (3) C. Li et al, Composites Science and Technology 64 (2004) 55-64.
(4) V. Nassiet et al, Journal of Applied Polymer Science 99 (2006) 679-690. (5) S. Li et al, J. Macromol. Sci.-Phys., B36 (1997) 357-366.