the effect of relationship marketing dimension …digilib.unila.ac.id/24150/17/undergraduate thesis...
TRANSCRIPT

THE EFFECT OF RELATIONSHIP MARKETING DIMENSION ONCUSTOMER RETENTION AT PT ASTRA INTERNATIONAL TBK.
TOYOTA (AUTO 2000) LAMPUNG
(Undergraduate Thesis)
By
KEMAS RAHMAT ZEN VANI
FACULTY OF ECONOMICS AND BUSINESSUNIVERSITY OF LAMPUNG
BANDAR LAMPUNG2016
ABSTRACT
THE EFFECT OF RELATIONSHIP MARKETING DIMENSION ON
CUSTOMER RETENTION AT PT ASTRA INTERNATIONAL TBK.
TOYOTA (AUTO 2000) LAMPUNG
By
KEMAS RAHMAT ZEN VANI
Relationship marketing has become one of the important strategy for acompany to retain consumer and build good and long lasting relationship withconsumers. Relationship marketing formed by the existence of severaldimensions, such as trust, commitment, equity and empathy and is one ofmarketing strategies utilized to compete in global business. Therefore, theobjective of this research is to analyze whether the dimensions of trust,commitment, equity and empathy has effect on consumer retention. Byapplying descriptive research design, PT. Astra International Tbk. Toyota(Auto 2000) Lampung as object research, multiple regression analysis, andthe result showed that the relationship marketing dimension (trust,commitment, equity and empathy) affect consumer retention. The researchsuggestion for management of PT. Astra International Tbk. Toyota (Auto2000) Lampung is to improve commitment variable in terms of quality ofservice regarding to body repair services and spare part service, in order tokeep consumer satisfaction and retention.
Keywords: relationship marketing, trust, commitment, equity, empathy, customerretention
THE EFFECT OF RELATIONSHIP MARKETING DIMENSION ONCUSTOMER RETENTION AT PT ASTRA INTERNATIONAL TBK.
TOYOTA (AUTO 2000) LAMPUNG
Researcher
KEMAS RAHMAT ZEN VANI
Undergraduate Thesis
As One of Requirements to AchieveBACHELOR OF ECONOMICS
In
Management DepartmentFaculty of Economics and Business University of Lampung
FACULTY OF ECONOMICS AND BUSINESSUNIVERSITY OF LAMPUNG
BANDAR LAMPUNG2016


BIOGRAPHY
The researcher is the second son of three brothers and sister from Kemas Ivan
Rizal and Nyimas Mutiarani. The researcher has an older sister named Nyimas
Tiara Vani and younger Brother named Kemas Rahmat Jonsua Vani. The
researcher was born in Bandar Lampung, at October 19th 2016.
The researcher initial academic stage started on Elementary School Bhakti Ibu,
Bakauheni on 2000, then continued to State Junior High School 1 Bakauheni on
2006 and graduated on 2009. The researcher continued to Senior High School Al-
Kautsar, Bandar Lampung on 2009 and graduated on 2011.
On 2012, the researcher continued his study for undergraduate degree in Faculty
of Economics and Business, Management Major in University of Lampung and
took concentration on Marketing Management.

MOTTO
“Then which of the favours
of your Lord will ye deny?”
- Qur’an: Ar-Rahman -
“The person who will change the
world is the one who stares you
back in the mirror”
-Kemas Rahmat Zen Vani-
DEDICATION
With gratitude of all joy and blessings given by Allah SWT, I hereby dedicate
my undergraduate thesis for my dearest family, My father Kemas Ivan Rizal
My mother Nyimas Mutiarani, and my Brother and Sister, Nyimas Tiara
Vani and Kemas Rahmat Jonsua Vani for the everlasting prayer and all
support given to finish my undergraduate thesis.
And from the innermost part of my heart, I am indebted and truly grateful to
my dearest Father, Kemas Ivan Rizal and my dearest Mother, Nyimas
Mutiarani who always grant me wisdom, virtue, honesty, morality,
guidance, love, and priceless life experiences which drives and hone me
into a better, stronger and wiser man.
For My friends and colleagues, thank you all for your help, suggestion and
motivation given to me. All wonderful memories of us together will always
be remembered. May the odds will always be in your favor.
Dearest Almamater
University of Lampung
i
ACKNOWLEDGEMENT
Praise and gratitude to Allah SWT for its blessings and directions, thus the
researcher may finish this undergraduate thesis entitled “The Effect of
Relationship Marketing Dimension on Customer Retention at PT. Astra
International Tbk. Toyota (Auto 2000) Lampung”. This undergraduate thesis is one
of requirements to achieve Undergraduate Degree in University of Lampung.
On the writing of this undergraduate thesis, the researcher obtain numerous
advices and directions from various parties, thus the researcher would like to
express gratitude to:
1. Dean of Faculty of Economics and Business, University of Lampung. Mr. Prof.
Dr, Satria Bangsawan, S.E., M.Si.
2. Mrs. Dr. Rr Erlina S.E., M.Si. as Chief of Management Major.
3. Mrs. Dr. Mahrinasari, S.E., M.Sc. As Chief Advisor who always have time to
provide suggestions and advices, motivates the researcher to finish this
undergraduate thesis.
4. Mr. Mudji Rachmat Ramelan, S.E., M.B.A. as Co-Advisor who had guided,
motivated and always give advices during the researcher time on campus.
5. Mrs. Hj. Aida Sari, S.E., M.Si. as Main Examiner who had gave numerous
advices and input which is essential for the thesis written by the researcher.
6. All lecturers and academic staffs of Faculty of Economics and Business,
Management Major, University of Lampung.
ii
7. My dearest father and mother, who gave everlasting prayers for me, motivation,
suggestion, advices and support for the researcher, which made the researcher
able to complete college and finish this undergraduate thesis. Thank you for
everything.
8. My dearest big sister and little brother who always gave the researcher moral
support and unyielding spirit for all effort done by the researcher.
9. Siska Meilanda Sari, thank you for all your effort, support and motivation which
drives me into a better version of myself and a better, wiser man.
10. Bilingku, Amrie, Ayu, Brenda, Bogel, Saput, Donna, Elidun, Fadil, Keke,
Ucang, Laras, Lele, Reja, Marlia, Ines, Winy and Abe thank you for all sweet
memories together from the beginning until the end of my college life.
11. Krakatoa 1516, Priska, Jupe, Dirga, Iin, Novita, Baok, Bude, Bela and The
Thunderbolt 1516, Nabila, Aby, Futra, Cindy, thank you for all the experience
and supports which had shaped me to be a better leader for the future.
12. All colleagues and friend on Marketing Management Class, Chris, Takur, Ardi,
Cutpi, Bajur, Finko, Malik, Puput, Oca, Bulek, Sonny, Yafie, Dibul, thank you
for all your support and cheerfulness inside the class.
13. All member and Alumni of AIESEC who cannot be mentioned one by one, thank
you and see you all on top.
14. All management student batch 12 who cannot be mentioned one by one, thank
you and I hope that we can be success in the future.
15. All parties who gave support for the researcher during the writing of this
undergraduate thesis. May Allah grant mercy and blessings and may this
undergraduate thesis become useful and meaningful.
16. For my beloved Almamater, University of Lampung.
iii
The researcher realized that the writing of this undergraduate thesis is still far from
perfection. However, the researcher hoped that this humble thesis will be useful for us
all.
Bandar Lampung, 17th October 2016
Researcher
iv
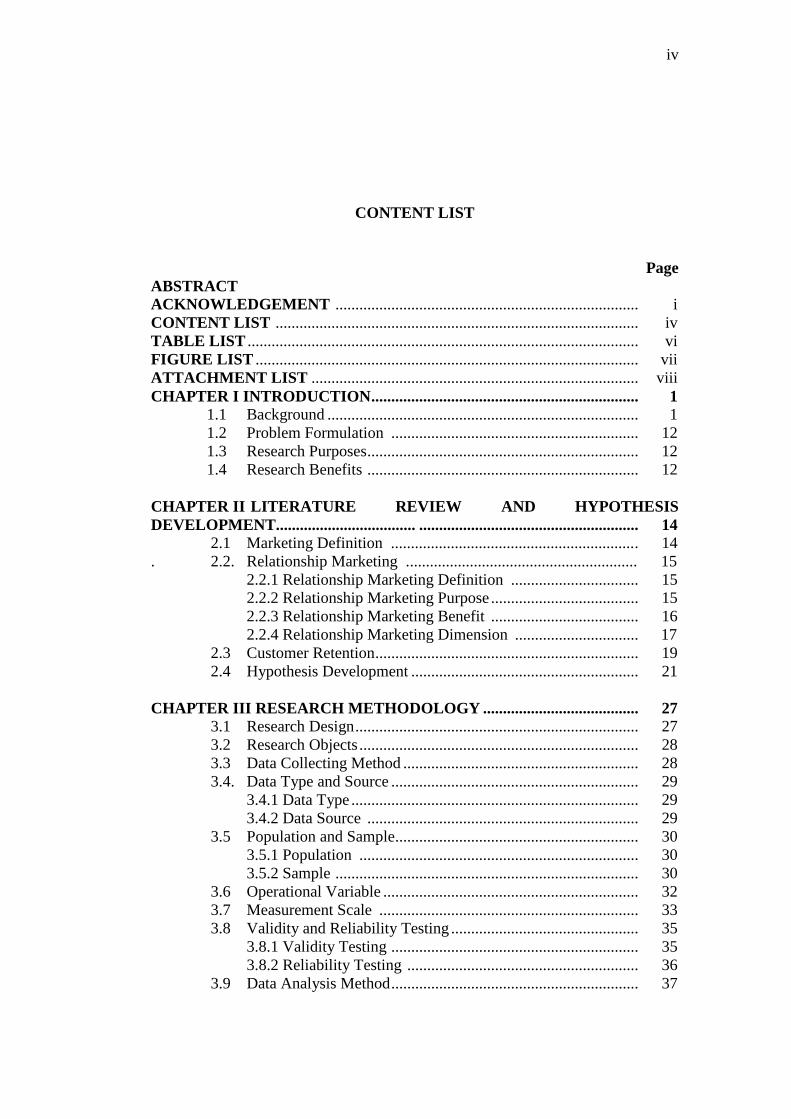
CONTENT LIST
Page
ABSTRACT
ACKNOWLEDGEMENT ............................................................................ i
CONTENT LIST ........................................................................................... iv
TABLE LIST .................................................................................................. vi
FIGURE LIST ................................................................................................ vii
ATTACHMENT LIST .................................................................................. viii
CHAPTER I INTRODUCTION ................................................................... 1
1.1 Background .............................................................................. 1
1.2 Problem Formulation .............................................................. 12
1.3 Research Purposes .................................................................... 12
1.4 Research Benefits .................................................................... 12
CHAPTER II LITERATURE REVIEW AND HYPOTHESIS
DEVELOPMENT................................... ....................................................... 14
2.1 Marketing Definition ............................................................. . 14
. 2.2. Relationship Marketing .......................................................... 15
2.2.1 Relationship Marketing Definition ................................ 15
2.2.2 Relationship Marketing Purpose ..................................... 15
2.2.3 Relationship Marketing Benefit ..................................... 16
2.2.4 Relationship Marketing Dimension ............................... 17
2.3 Customer Retention .................................................................. 19
2.4 Hypothesis Development ......................................................... 21
CHAPTER III RESEARCH METHODOLOGY ....................................... 27
3.1 Research Design ....................................................................... 27
3.2 Research Objects ...................................................................... 28
3.3 Data Collecting Method ........................................................... 28
3.4. Data Type and Source .............................................................. 29
3.4.1 Data Type ........................................................................ 29
3.4.2 Data Source .................................................................... 29
3.5 Population and Sample ............................................................. 30
3.5.1 Population ...................................................................... 30
3.5.2 Sample ............................................................................ 30
3.6 Operational Variable ................................................................ 32
3.7 Measurement Scale ................................................................. 33
3.8 Validity and Reliability Testing ............................................... 35
3.8.1 Validity Testing .............................................................. 35
3.8.2 Reliability Testing .......................................................... 36
3.9 Data Analysis Method .............................................................. 37

v
3.9.1 Qualitative Data Analysis .............................................. 37
3.9.2 Quantitative Data Analysis ............................................. 38
3.10 Normality Testing ................................................................... 38
3.11 Hypothesis Testing .................................................................. 39
3.11.1 Partial Significance Testing (t-Test) ............................ 39
3.11.2 Simultaneous Variable Testing ..................................... 40
3.11.3 Determination Coefficient (R2) .................................... 40
CHAPTER IV RESULT AND DISCUSSION ............................................. 41
4.1 Company General Description ................................................. 41
4.2 Respondents Characteristic Description ................................. 41
4.3 Validity and Reliability Testing Result .................................... 47
4.3.1 Validity Testing Result .................................................. 48
4.3.2 Reliability Testing Result ............................................... 49
4.4. Qualitative Data Analysis Result ............................................. 51
4.4.1 Respondents Answers Result of Trust (X1) .................... 51
4.4.2 Respondents Answers Result of Commitment (X2) ....... 52
4.4.3 Respondents Answers Result of Equity (X3) ................. 53
4.4.4 Respondents Answers Result of Empathy (X4) .............. 54
4.4.5 Respondents Answers Result of Customer Retention (Y) 56
4.5 Quantitative Data Analysis Result ........................................... 57
4.5.1 Regression Analysis ........................................................ 57
4.6. Normality Testing ................................................................... 59
4.7. Hypothesis Testing ................................................................... 61
4.7.1 Partially Significance Testing (t-Testing) ....................... 61
4.7.2 Simultaneous Variable Testing (F-Testing) .................... 64
4.7.3 Determination Coefficient (R2) ......................................... 65
4.8. Discussion ................................................................................ 66
CHAPTER V CONCLUSION AND SUGGESTION ................................. 68 5.1 Conclusion .............................................................................. 68
5.2 Suggestions ............................................................................. 69
REFERENCE LIST
ATTACHMENT LIST
vi
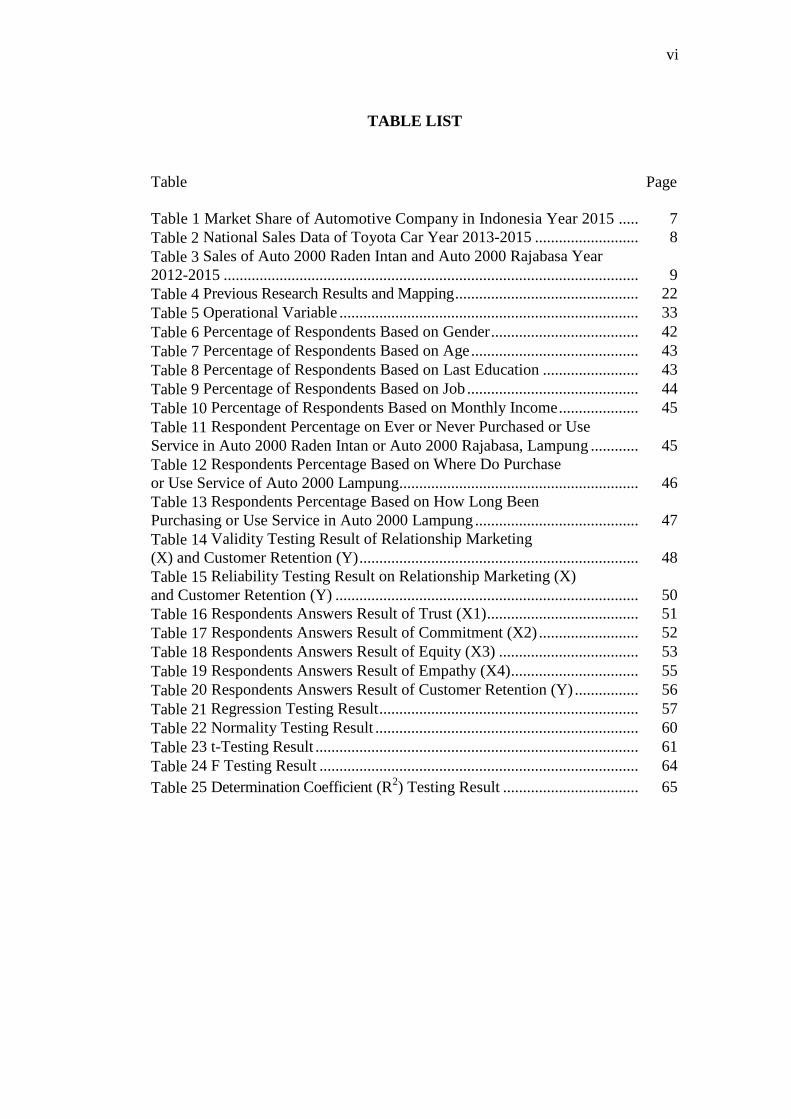
TABLE LIST
Table Page
Table 1 Market Share of Automotive Company in Indonesia Year 2015 ..... 7
Table 2 National Sales Data of Toyota Car Year 2013-2015 .......................... 8
Table 3 Sales of Auto 2000 Raden Intan and Auto 2000 Rajabasa Year
2012-2015 ........................................................................................................ 9
Table 4 Previous Research Results and Mapping .............................................. 22
Table 5 Operational Variable ........................................................................... 33
Table 6 Percentage of Respondents Based on Gender ..................................... 42
Table 7 Percentage of Respondents Based on Age .......................................... 43
Table 8 Percentage of Respondents Based on Last Education ........................ 43
Table 9 Percentage of Respondents Based on Job ........................................... 44
Table 10 Percentage of Respondents Based on Monthly Income .................... 45
Table 11 Respondent Percentage on Ever or Never Purchased or Use
Service in Auto 2000 Raden Intan or Auto 2000 Rajabasa, Lampung ............ 45
Table 12 Respondents Percentage Based on Where Do Purchase
or Use Service of Auto 2000 Lampung............................................................ 46
Table 13 Respondents Percentage Based on How Long Been
Purchasing or Use Service in Auto 2000 Lampung ......................................... 47
Table 14 Validity Testing Result of Relationship Marketing
(X) and Customer Retention (Y) ...................................................................... 48
Table 15 Reliability Testing Result on Relationship Marketing (X)
and Customer Retention (Y) ............................................................................ 50
Table 16 Respondents Answers Result of Trust (X1) ...................................... 51
Table 17 Respondents Answers Result of Commitment (X2) ......................... 52
Table 18 Respondents Answers Result of Equity (X3) ................................... 53
Table 19 Respondents Answers Result of Empathy (X4) ................................ 55
Table 20 Respondents Answers Result of Customer Retention (Y) ................ 56
Table 21 Regression Testing Result ................................................................. 57
Table 22 Normality Testing Result .................................................................. 60
Table 23 t-Testing Result ................................................................................. 61
Table 24 F Testing Result ................................................................................ 64
Table 25 Determination Coefficient (R2) Testing Result .................................. 65
vii
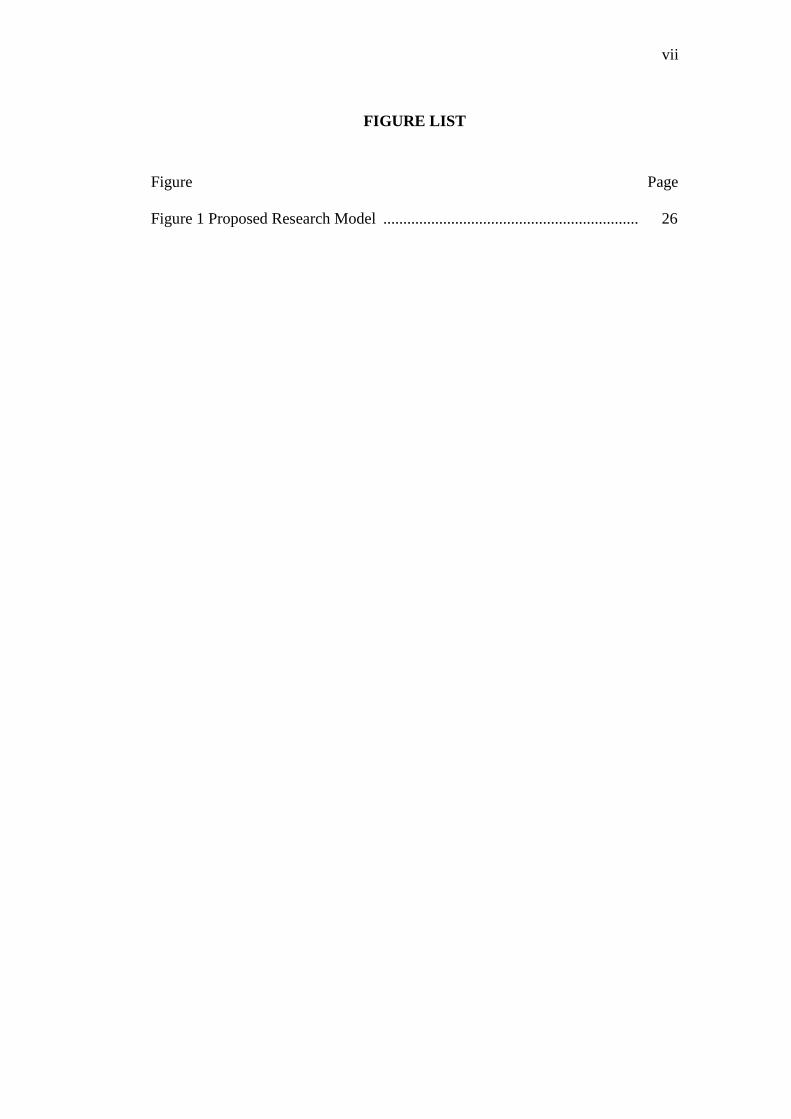
FIGURE LIST
Figure Page
Figure 1 Proposed Research Model ................................................................ 26
viii
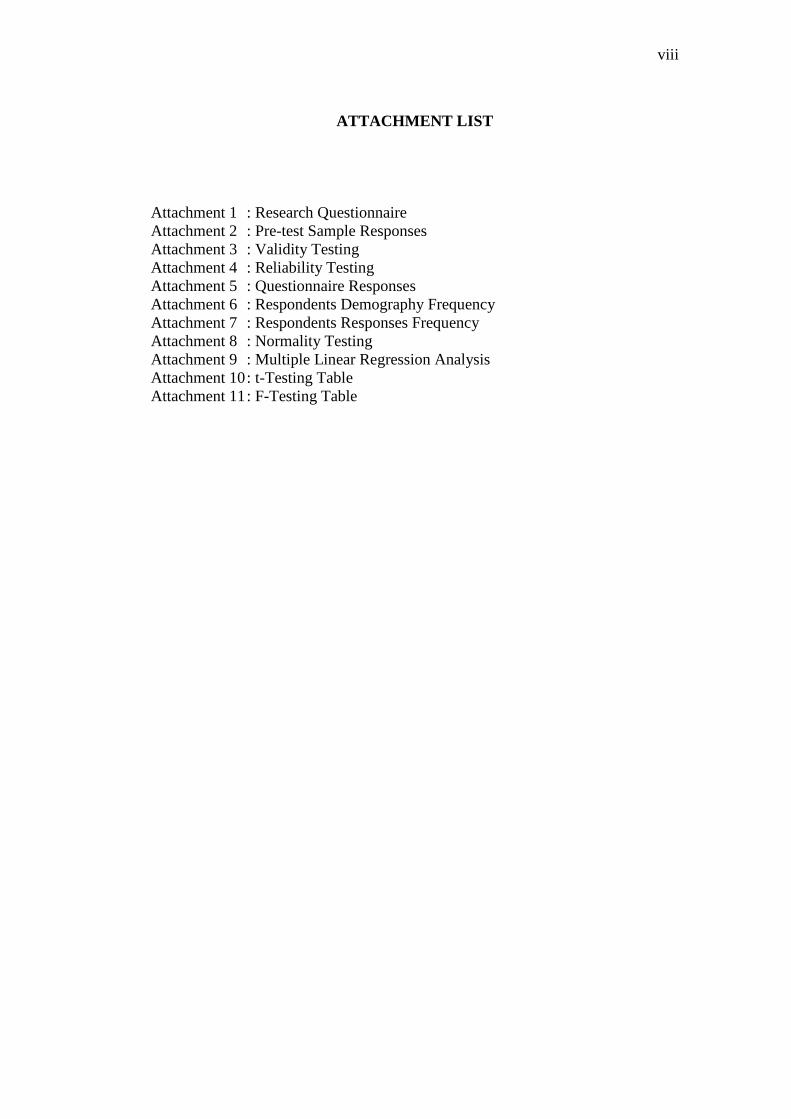
ATTACHMENT LIST
Attachment 1 : Research Questionnaire
Attachment 2 : Pre-test Sample Responses
Attachment 3 : Validity Testing
Attachment 4 : Reliability Testing
Attachment 5 : Questionnaire Responses
Attachment 6 : Respondents Demography Frequency
Attachment 7 : Respondents Responses Frequency
Attachment 8 : Normality Testing
Attachment 9 : Multiple Linear Regression Analysis
Attachment 10 : t-Testing Table
Attachment 11 : F-Testing Table
1
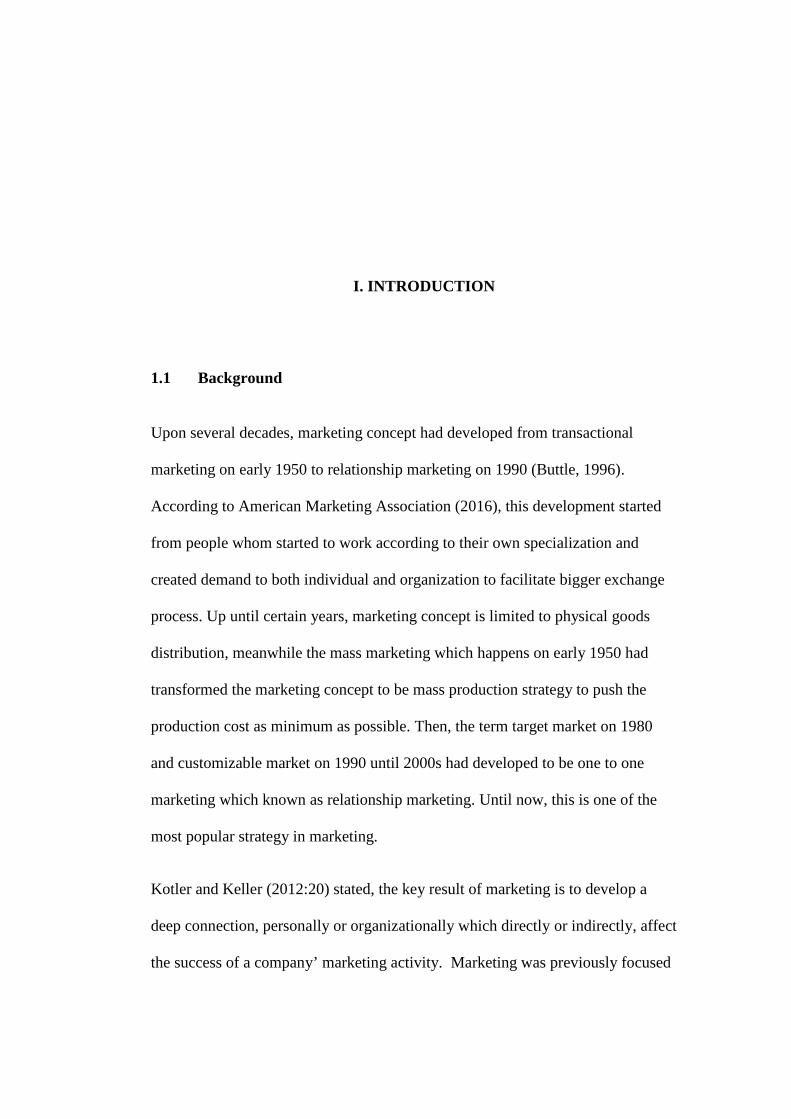
I. INTRODUCTION
1.1 Background
Upon several decades, marketing concept had developed from transactional
marketing on early 1950 to relationship marketing on 1990 (Buttle, 1996).
According to American Marketing Association (2016), this development started
from people whom started to work according to their own specialization and
created demand to both individual and organization to facilitate bigger exchange
process. Up until certain years, marketing concept is limited to physical goods
distribution, meanwhile the mass marketing which happens on early 1950 had
transformed the marketing concept to be mass production strategy to push the
production cost as minimum as possible. Then, the term target market on 1980
and customizable market on 1990 until 2000s had developed to be one to one
marketing which known as relationship marketing. Until now, this is one of the
most popular strategy in marketing.
Kotler and Keller (2012:20) stated, the key result of marketing is to develop a
deep connection, personally or organizationally which directly or indirectly, affect
the success of a company’ marketing activity. Marketing was previously focused

2
on selling and buying in a narrow scope as a transaction, then it later changed into
focus on building a relationship based on value and changes for fulfilling the
consumer needs, which known as relationship marketing. Relationship marketing
is a concept about shaping connection in order to make a good relationship with
consumer. Along with the development of varieties marketing concept, numerous
company had start to implement strategy on attracting consumer, preserving
consumer and managing consumer. One of those marketing concept is relationship
marketing. In the beginning, relationship marketing was started by companies in
United States. Then, the same phenomenon were also happen in Indonesia which
made companies in Indonesia started to implement relationship marketing.
Saputra and Ariningsih (2014:70) stated that relationship marketing is a marketing
strategy concept which attempt to build long term relationship with consumer to
preserve solid and beneficial relation among service or product providers and
consumers which able to build repetitive transaction and create consumer loyalty.
For conclusion, it could be considered that relationship marketing is focus on long
term sustainability on company. Relationship marketing is a process which
connect the company with consumers, meanwhile customer retention is a behavior
which appear as a respond to company’ environment.
According to Alma (2007:130) customer retention is a customer decision to stay
or repurchase a product or service on the latter. Customer retention is a form of
loyalty which related with purchasing behavior of a consumer that shown with
how high the frequency of consumer on purchasing a product (Ang and Buttel,
2006:1). In the other word, customer retention sees on how many consumer who

3
return on purchasing the same product or utilizing the same service times after
times.
PT Astra International Tbk or usually called as Auto 2000 or Toyota is one of a
company which operates on automotive sector and had officially acknowledged
by Indonesian government as a sole agent on selling Toyota brand car to all over
Indonesia. Moreover, PT. Astra International Tbk. Toyota (Auto 2000) moves on
spare parts importing for Toyota brand car and also includes handling and
repairing services for Toyota brand car.
PT. Astra International Tbk. Toyota (Auto 2000) is one of a company which
possess various strategy in attracting and increasing their customer retention level.
Various strategy may be implemented by a company in the middle of tight
competition on an effort to attract consumer such as; product with varieties
models, interesting design, good quality and low prices.
In Lampung itself, there are two Auto 2000 outlets, yet the strategy implemented
by PT. Astra International Tbk. Toyota (Auto 2000) Raden Intan and Auto 2000
Rajabasa were just the same with strategy which PT. Astra International Tbk.
Toyota (Auto 2000) generally implemented, as one of the attempt to create good
and continuous relationship between consumer and company in the form of
relationship marketing, with a sole purpose to offer the best service with various
convenience and advantages which offered to consumer or consumer candidates
through:
4
Trust
o Consistency
In a company which implement consistency, keeping the quality in all
aspects is not easy. In this matter, PT. Astra International Tbk. Toyota
(Auto 2000) shows consistency in increasing service quality through
training and Aftersales Service Skill Contest or a competition for
mechanic on conducting after sales service
o Respect
PT. Astra International Tbk. Toyota (Auto 2000) shows respect by
implementing Kaizen principal as base strategy which highly consider
respect for every consumer on every service process whether it is
before sales or after sales
o Consumer belief
Consumer belief components obtained through the availability of
Toyota Recall or calling back purchased vehicles to be repaired or
installation of auxiliary components if there are security issues inside
produced vehicle
Commitment
o Personal service
PT. Astra International Tbk. Toyota (Auto 2000) provides personal
service to consumer with the availability of Toyota easy care which
give service to consumer in car repair in location of where the
consumer is, like at home, office, on the road or parking lot

5
o Flexibility
On flexibility, PT. Astra International Tbk. Toyota (Auto 2000)
involves employee and service system on customer service
department which have the principal to adjust their service in
fulfilling consumer needs
o Obligation fulfilling
PT. Astra International Tbk. Toyota (Auto 2000) have obligation to
fulfill consumer needs which will later become customer. This
obligation materialized in the form of warranty or purchasing and
service warranty align with warranty card or service card possessed
by consumer
Equity
o Same treatment
Providing the same treatment for every customer with the existing
service architecture or building and service standard possessed PT.
Astra International Tbk. Toyota (Auto 2000) in building an outlet and
on service system for every consumer
o Information easiness
Easiness in obtaining accurate information for every consumer about
Toyota Auto 2000 through mobile apps and company website, this
matter is related with company commitment to provide accurate
information on product purchasing and consumer service
6
o Promise fulfillment
Easiness in obtaining vehicle in the form of purchasing promise
appropriate with the deal and on time, appropriate with consumer
request and adjusted with the company capability to fulfill the request
Empathy
o Solution for consumer
Easiness in obtaining total solution service for every consumer during
vehicle ownership such as: after sales service in the form of insurance
service, vehicle resell worth calculation and paperwork extension
o Listen to complaints and consumer request
Booking service and 24/7 call center to provide easiness in listening to
consumer complaints and adjusting with consumer needs which
sometimes have tight schedule
o Two ways communication
Maintenance reminder system which is a reminding service system as
two ways communication tool appointed to consumer in a form of
phone call and text messages to do checkup, handing and periodic
repairs in make sure Toyota vehicle condition stays at its prime.
PT. Astra International Tbk. Toyota (Auto 2000) had implemented the
relationship marketing strategy to create good and continuous relationship
between consumer and company with prioritizing the easiness to find information,
convenience and consumer safety, fulfilling responsibility and company’
promises, equal treatment for every consumer, respect and appreciation for

7
consumer, giving solution, two-way communication and service adjustable to
consumer needs. Not only that, various strategy implemented by PT. Astra
International Tbk. (Auto 2000) were done to keep competing with competitors in
Indonesia.
These are the competition data of automotive companies in Indonesia:
Table 1 Market Share of Automotive Company in Indonesia Year 2013-
2015
Source: Processed data from GAIKINDO, 2016
According to table 1, it can be concluded that Toyota is the market leader of car
selling on automotive company in Indonesia by controlling majority of market
share from 2013-2015, followed by Daihatsu in second position and Suzuki in
third position. 34% of control in market share shows that Toyota is a brand
favored by Indonesian consumer, a quite large margin between Toyota and
Daihatsu has clearly shown the superiority of PT. Astra International Tbk. Toyota
No Company NameMarket Share
(2013)
Market Share
(2014)
Market Share
(2015)
1. Toyota 36% 35% 34%
2. Daihatsu 14% 15% 15%
3 Suzuki 13% 14% 14%
4. Mitsubishi 11% 12% 12%
5. Honda 10% 11% 11%
6. Nissan 4% 3% 4%
7. Isuzu 2% 2% 2%
8. Mazda 2% 1% 1%
9. Other 8% 7% 6%

8
(Auto 2000) in Indonesia. However there is yearly declining tendency of the
Toyota market share from 2013-2015, resulting in percentage shift lower by one
percent each year. Furthermore, the following is the table of national sales data of
Toyota year 2013 - 2015:
Table 2 National Sales Data of Toyota Car Year 2013-2015
National Sales of Toyota Cars 2013-2015 (Units)
2013 2014 2015
Month Volume Month Volume Month Volume
January 32680 January 35923 January 35888
February 31520 February 35318 February 38632
March 33558 March 32726 March 36960
April 33306 April 39668 April 39327
May 34264 May 36282 May 31649
June 34737 June 35125 June 37107
July 37176 July 39210 July 28757
August 36353 August 24899 August 30273
September 25848 September 40235 September 29250
October 35855 October 39246 October 30540
November 36996 November 40781 November 27986
December 34427 December 34819 December 27123
Total 406.270 Total 393.997 Total 384.462
Source: Processed data from GAIKINDO, 2016
Table 2 shows the fluctuation in sales level which happen every month and affect
the variation of yearly sales. The total sales which is previously 406.270 units
decreased by 12.273 units to be 393.997 units on 2014. As well as the total sales
on the next year which decreased by 9.535 units to be 384.462 units on 2015.
9
High level of sales on 2013 were decreasing every year and even PT. Astra
International Tbk. Toyota (Auto 2000) is one of the market leader, the emerging
problem is on the capability of the company to preserve the consumer.
PT. Astra International Tbk. Toyota (Auto 2000) had owned 96 outlet which
distributed on 37 cities in Indonesia, including Bandar Lampung with 2 outlets
which are Auto 2000 Raden Intan and Auto 2000 Rajabasa. Both outlets
contributes on increasing the total sales volume of PT. Astra International Tbk.
Toyota (Auto 2000) in Bandar Lampung as the only trusted selling outlet of
Toyota automotive product. These are the sales data of Auto 2000 Raden Intan
and Auto 2000 Rajabasa year 2012-2014:
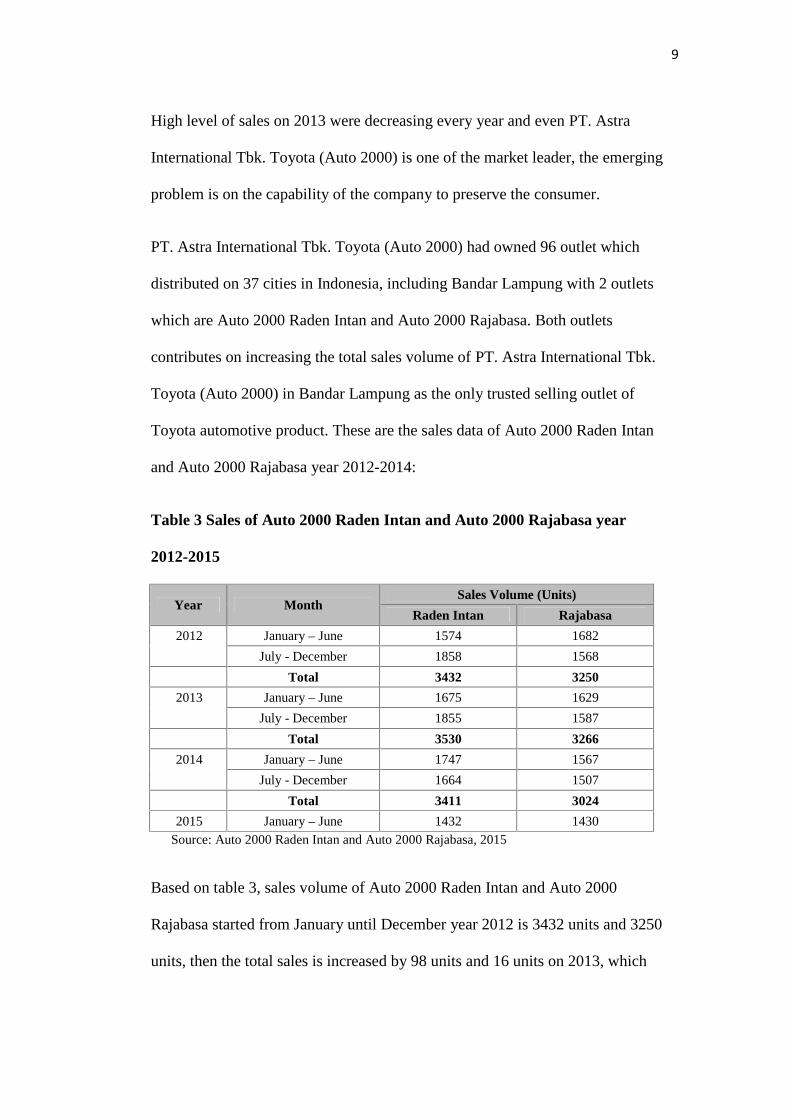
Table 3 Sales of Auto 2000 Raden Intan and Auto 2000 Rajabasa year
2012-2015
Year MonthSales Volume (Units)
Raden Intan Rajabasa
2012 January – June 1574 1682
July - December 1858 1568
Total 3432 3250
2013 January – June 1675 1629
July - December 1855 1587
Total 3530 3266
2014 January – June 1747 1567
July - December 1664 1507
Total 3411 3024
2015 January – June 1432 1430Source: Auto 2000 Raden Intan and Auto 2000 Rajabasa, 2015
Based on table 3, sales volume of Auto 2000 Raden Intan and Auto 2000
Rajabasa started from January until December year 2012 is 3432 units and 3250
units, then the total sales is increased by 98 units and 16 units on 2013, which
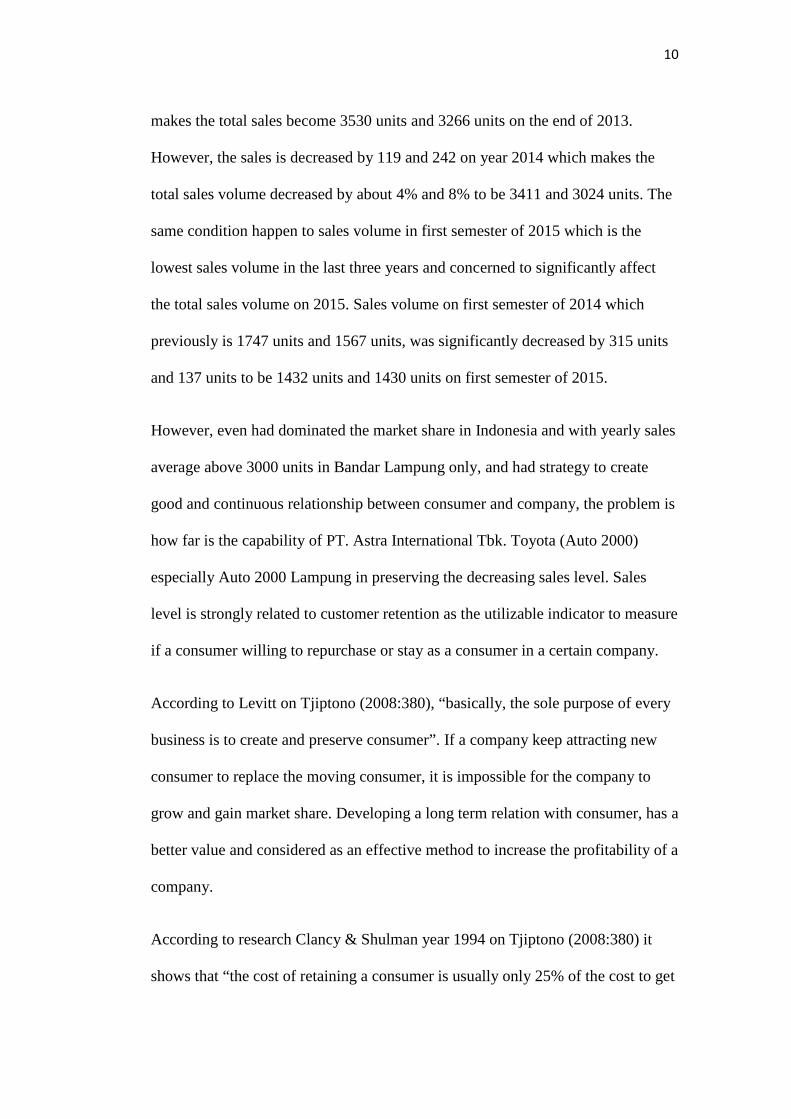
10
makes the total sales become 3530 units and 3266 units on the end of 2013.
However, the sales is decreased by 119 and 242 on year 2014 which makes the
total sales volume decreased by about 4% and 8% to be 3411 and 3024 units. The
same condition happen to sales volume in first semester of 2015 which is the
lowest sales volume in the last three years and concerned to significantly affect
the total sales volume on 2015. Sales volume on first semester of 2014 which
previously is 1747 units and 1567 units, was significantly decreased by 315 units
and 137 units to be 1432 units and 1430 units on first semester of 2015.
However, even had dominated the market share in Indonesia and with yearly sales
average above 3000 units in Bandar Lampung only, and had strategy to create
good and continuous relationship between consumer and company, the problem is
how far is the capability of PT. Astra International Tbk. Toyota (Auto 2000)
especially Auto 2000 Lampung in preserving the decreasing sales level. Sales
level is strongly related to customer retention as the utilizable indicator to measure
if a consumer willing to repurchase or stay as a consumer in a certain company.
According to Levitt on Tjiptono (2008:380), “basically, the sole purpose of every
business is to create and preserve consumer”. If a company keep attracting new
consumer to replace the moving consumer, it is impossible for the company to
grow and gain market share. Developing a long term relation with consumer, has a
better value and considered as an effective method to increase the profitability of a
company.
According to research Clancy & Shulman year 1994 on Tjiptono (2008:380) it
shows that “the cost of retaining a consumer is usually only 25% of the cost to get
11
a new consumer. Other than that, with the available marketing program, the
possibility to retain a consumer now is more than 60%, meanwhile the probability
to get a new consumer is less than 30%”. According to Richeld & Sasser on
Tjiptono (2008:380) “the 5% increase in customer retention may increase a long
term profit increase of 25% until 95% on several industries”. The same matter
were also stated by Tjiptono (2008:381), “customer retention which based on
capability to construct consumer orientation which gives several benefits, like
increasing productivity and income growth”.
Companies oriented on consumer will not allow their consumer to switch into
competitors. Companies will attempt to give their best on prioritizing the
consumer, not only to repair the product or service quality but also to make
consumer do repurchasing. Before consumer become loyal, the consumer will stay
first, and the duration of how long the consumer stays is known as customer
retention, which is the capability of a company to retain the consumer until they
become loyal. There is less available research which studies about the relation
between relationship marketing with customer retention, yet relationship
marketing has a role in the successful customer retention. PT. Astra International
Tbk. Toyota (Auto 2000) Lampung, were chosen as the research object because
these companies already implemented relationship marketing when treating the
consumer and gave contribution to the sales output of PT. Astra International Tbk.
Toyota (Auto 2000). Based on the described background, researcher had shown
interest to do a research entitled “THE EFFECT OF RELATIONSHIP
MARKETING DIMENSION ON CUSTOMER RETENTION AT PT
ASTRA INTERNATIONAL TBK. TOYOTA (AUTO 2000) LAMPUNG”.
12
1.2 Problem Formulation
In this research, there will be discussion about relationship marketing dimension
which affect customer retention which are trust, commitment, equality and
empathy. Based on the problem formulation, several questions comes up as
follows:
1. Do trust have effect toward customer retention?
2. Do commitment have effect toward customer retention?
3. Do equity have effect toward customer retention?
4. Do empathy have effect toward customer retention?
1.3 Research Purposes
The purpose of this research are:
1. To know the effect of trust toward customer retention
2. To know the effect of commitment toward customer retention
3. To know the effect of equity toward customer retention
4. To know the effect of empathy toward customer retention.
1.4 Research Benefits
There are several benefits which can be obtained on the writing of this research,
which are:
1. For researcher, this research is one of the scientific works to fulfill the
requirements for Bachelor Degree (S-1) and used to apply knowledge

13
obtained during study to see the comparison between theory and practices in
society
2. For the researched companies, especially PT. Astra International Tbk. Toyota
(Auto 2000) Lampung, both to be a beneficial input to increase the quality of
service provided
3. For society especially PT. Astra International Tbk. Toyota (Auto 2000)
Lampung consumer, the result of this research will be beneficial as a media to
give input, advices and perspective to company for increasing the quality of
service and attaining consumer satisfaction
4. For other parties, this research is expected to be beneficial in the development
of science in management sector, especially in service quality and satisfaction
then give information to next researcher who take the same topic of research.
II. LITERATURE REVIEW AND HYPOTHESIS DEVELOPMENT
2.1 Marketing Definition
Marketing is an effort to deliver value of a product or service from company to
consumer. However, the definition had broadly developed to also include
various activities in an effort to deliver products to consumer. Starting from
product pricing, distribution activities or product delivery and promotion which
conducted by a company to deliver its product to consumer. Deeper
understanding about marketing definition may be achieved by doing several
approach toward several marketing formulation from experts in marketing
sector such as:
Kotler and Keller (2012:27) define marketing as an identification process and
the crossing between human needs and society needs or it may be simply
defined as fulfillment of beneficial needs. Marketing definition according to
American Marketing Association on Kotler and Keller (2012:27) is activities, a
number of institution and process of creating, communicating, delivering and
supply excha`nging with its own value for customer, client, partner and society
as a whole.

15
Chandra (2001:29) stated that marketing started from the emerging needs from
customer. Something that customer wants which is vary and challenging in
marketing world. Marketing is actually broader than selling.
According to several definition by marketing experts, we may conclude that
marketing is a process of value delivering from a created product of a
company in exchange of profit and fulfillment of consumer needs.
2.2 Relationship Marketing
2.2.1 Relationship Marketing Definition
Relationship marketing explains that customer loyalty and retention needs to
be built by hard effort where customer is the core of marketing activities, then
with the existing relationship marketing strategy, it tries to stretch the
customer lifetime as an individual who do transaction and able to keep
customer loyalty and retention (Chan, 2003:4).
2.2.2 Relationship Marketing Purpose
Relationship marketing provide added value and applicable value on a long
term for service provider (Lerman, 2013:60). Stone (2001:2) explains that
relationship marketing is a form of marketing, selling, communication,
service and consumer care which aimed to:
a. Identify the identity of every individual who become a customer
in a company

16
b. Build a good relationship between consumer and company as a
result of every transaction
c. Build a mutualistic relation between consumer and company.
2.2.3 Relationship Marketing Benefit
According to Kotler and Keller (2012: 20), relationship marketing will be
useful to establish a beneficial relation on a long term toward four
components, as an effort to protect the owned company as follows:
1. Customer
The most essential component required by a company, they are the
primary target of a company in a product marketing
2. Employee
Employee have their own interest in doing their job, they have the drive to
make a product favored by consumer and increasing company income,
which in the end will lead to increase in their own wage
3. Marketing partner
Distributor, supplier, agent and marketing channel is the third party
outside company who will get the benefits from relationship marketing
4. Financial community
Investor, analyst and stock holder are people who will obtain humongous
benefits if the company is successful in implementing relationship
marketing strategy. This is because the amount of investment they provide
will increase along with the increase in company’ income.
17
2.2.4 Relationship Marketing Dimension
Relationship marketing according to Gronroos (1994) on Velnampy and
Sivesan (2012:2), is affected by four variables which are:
a. Trust
Trust is the base of partnership strategy, when a lot of parties have desire
to committed or bond their self to a certain relation. Trust is a factor of
commitment building because commitment includes trust and sacrifice
factors. Commitment will not be formed without trust (Gronroos, 1994:8).
Trust significantly affect commitment in a relationship. Trust is also an
owned belief inside a relationship with co-workers related to honesty and
cooperation of one another. Trust could be created when a side is
comfortable in doing exchange with the other side, with full of honesty
and also trustworthy. To acquire trust from customer, then a company
needs to do communication effectively, adopting norms which is believed
by customer and keep away from negative appraisal (Gronroos, 1994:8).
The biggest failure on a relationship between consumer and a marketer is
lack of trust. Relationship between consumer and company needs trust to
make it become long lasting. Customer may recommend the company to
other customer because trust is based on experiences in the past and
become the prediction for the future, trust and commitment have effect in
creating a value for customer (Gronroos, 1994:9).
18
b. Commitment
Commitment is a belief between involved parties who wants a continuous
relation, and considered as important in preserving the certain relation.
Commitment of a company is the core of relationship marketing, company
commitment may be obtained by considering customer as the prime
priority, long term, and based on beneficial relation. Company commitment
could also be defined as promise or creed of a company to preserve relation
which already been well, because the relation is essential (Gronroos,
1994:10).
c. Equity
Equity theory refer to a state where a person feels equally the same with
the feel of others, proper to the sacrifice given. According to Gronroos
(1994:11), when a person feels difference, they will try to do change or
even left the relation with service provider which in this matter is
company itself. Company must consider equity in their treatment to
consumer, because if an individual feels on an unequal relation, they will
feel troubled.
d. Empathy
Empathy from relationship marketing perspective related to process in
understanding customer expectation and other essential matters to achieve
success. A company that unable to understand its customer will not able to
successfully serve the needs of its customer. Consumer needs to be

19
comprehended, leaded and being listened (Gronroos, 1994:12). The
importance of two ways communication between consumer and company
is illustrated in two ways communication of relationship marketing.
2.3 Customer Retention
Griffin (2005:13) explains that, “customer retention is the duration of
relation with customer with the percentage of customer who had fulfilled a
number of repurchasing on a limited period of time”.
According to Stanley on Hurriyati (2005:140) “customer retention is
retaining the existing customer by building a long term relationship”.
According to Engel, F James; Roger D. Blackwell and Paul W. Miniard
(2006:50), “the effort to retain customer is essential in marketing strategy”.
This matter is strengthened by statement from Richeld and Sasser on
Tjiptono (2008:380), “increases in customer retention by 5% will increase
the long term profit between 25% until 95% on several industries”.
According to Kotler and Keller (2012:35) there are several important facts
which support customer retention which are:
a. Acquisition on new customer will need five times bigger cost rather
than satisfying and retain old customer. Acquisition on new customer
needs effort in persuading satisfied customer to left their previous
distributor
20
b. Averagely, a company loses 10% of their customer every year
c. Decrease in 5% of customer switch level will increase the profit from
25% until 85%, depends on the industry
d. The level of customer profit will tend to increase along with retained
customer lifetime because the existing purchase, retention and
premium, and decrease in operational cost to serve
According to Hasan (2009:73) to retain the consumer, these strategies may
be implemented:
a. Conducting research to measure, assess and define needs, mannerism
and behavior
b. Involves active-cross functional participation in managing
satisfaction and retaining customer
c. Drive the consumer to wants and easily address their needs,
expectation, perception and even complaint to company
d. Information benefits (database) of needs, preference, purchasing
frequency and customer satisfaction to a product
e. Decide the primary needs of a buyer which will be served and
fulfilled
f. Create a product with superior value for the served target market
g. Provide high level of satisfaction to create barrier for customer to
switch product with low cost, more discount than other distributor
and satisfying service
h. Choose a buyer group as sales target
21
i. Execute the most different strategy by choosing high quality or low
price or combining both.
According to Ahmad and Buttle on Tjiptono (2008:205), customer retention
strategy for consumer market consist of:
a. Focus on creating both economics and non-economic benefits
b. Focus on an attempt to develop and preserve social bonds with
individual customer
c. Focus on perfecting the service quality
This matter is strengthened with argument from Tjiptono (2008:381) who
stated that customer orientation in building customer retention have benefit
which one of them is “acquiring positive respond from customer who is
satisfied and loyal towards a product or service of a company, and that
matter is very precious and may be potential to spread their experience to
another person”.
2.4 Hypothesis Development
In relationship marketing, good relationship between consumer and company
will lead to good quality and good consumer satisfaction (Gummeson, 1999).
Consumer is an essential subject for every company, because without
consumer the process of company will not run well. However, it is not
limited only to product purchasing, but on how a company create a good
relationship with consumer to make them become a loyal purchaser of a
product (Weitz and Bradford, 1999).
22
This type of marketing implies the development of long term relationships
with each customer in order to better understand that customer’s needs and
better deliver the ‘service’ that meets the individual requirements which in
the end will increase company profits (Chaffey et. al, 2000). Good
communication between company and consumer will make consumer feel
more appreciated and comfortable, yet makes them undoubtfully willing to
do repurchasing which will create consumer who do repurchasing in the
certain company. According to Chan (2003:14) relationship marketing is an
introduction in detail to every consumer by creating two-way
communication and managing a beneficial relationship between consumer
and a company, resulting in make the company to have long term thinking
framework.
The X variable of this research were adapted from research framework on
Gronroos (1994:8) theory entitled “From Marketing Mix to Relationship
Marketing: Towards a Paradigm Shift in Marketing”, which stated that there
are four variables which create relationship marketing, which are:
1. Trust as X1, which is how far a company able to convince consumer toward
the precision of offered promises in building a relationship. The level of trust
is measured by consumer purchasing capability in conducting transaction
with only one company
2. Commitment as X2, which is the capability of company to fulfill their
promises and responsibility to maintain the relation with consumer.
23
Commitment is measured by the willingness to accept and support values
implemented by company
3. Equity as X3, which is the capability of company to do information exchange
and service to every consumer with equally fair way. The achievement is
measured by the easiness to get information regarding to company and
equality in satisfaction level on every consumer
4. Empathy as X4, which is the capability of company to understand, realize and
sensitive to feelings, thoughts and experiences which is communicated by
consumer to company.
Y variable customer retention is the duration of relation with customer and
the level of consumer percentage who already do repurchasing on a certain
period of time (Griffin, 2005:13). Customer retention concept implement
process to preserve available consumer by increase the good relationship with
every sides by utilizing products/service from company. Company
successfulness is measured by its capability to retain or preserve consumer on
a long term. The research result from previous research which is proposed to
support this research are stated in the following table 4 of Previous Research
Result and Mapping.
24
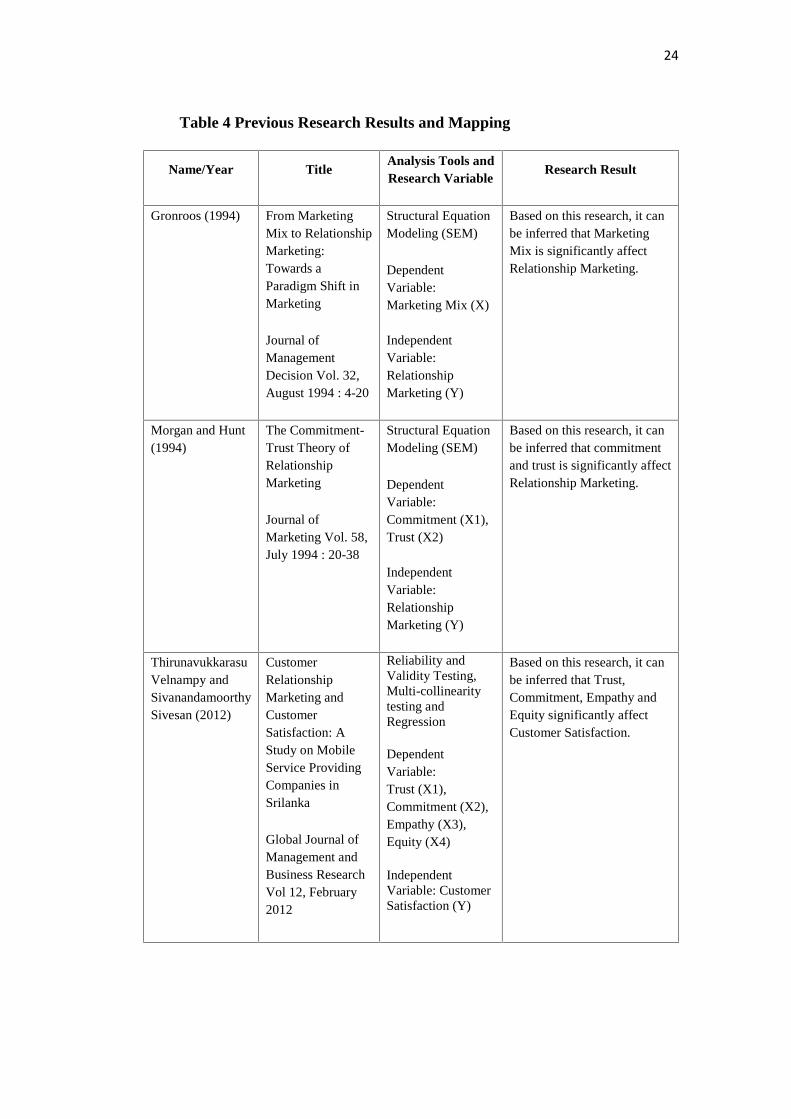
Table 4 Previous Research Results and Mapping
Name/Year TitleAnalysis Tools andResearch Variable
Research Result
Gronroos (1994) From MarketingMix to RelationshipMarketing:Towards aParadigm Shift inMarketing
Journal ofManagementDecision Vol. 32,August 1994 : 4-20
Structural EquationModeling (SEM)
DependentVariable:Marketing Mix (X)
IndependentVariable:RelationshipMarketing (Y)
Based on this research, it canbe inferred that MarketingMix is significantly affectRelationship Marketing.
Morgan and Hunt(1994)
The Commitment-Trust Theory ofRelationshipMarketing
Journal ofMarketing Vol. 58,July 1994 : 20-38
Structural EquationModeling (SEM)
DependentVariable:Commitment (X1),Trust (X2)
IndependentVariable:RelationshipMarketing (Y)
Based on this research, it canbe inferred that commitmentand trust is significantly affectRelationship Marketing.
ThirunavukkarasuVelnampy andSivanandamoorthySivesan (2012)
CustomerRelationshipMarketing andCustomerSatisfaction: AStudy on MobileService ProvidingCompanies inSrilanka
Global Journal ofManagement andBusiness ResearchVol 12, February2012
Reliability andValidity Testing,Multi-collinearitytesting andRegression
DependentVariable:Trust (X1),Commitment (X2),Empathy (X3),Equity (X4)
IndependentVariable: CustomerSatisfaction (Y)
Based on this research, it canbe inferred that Trust,Commitment, Empathy andEquity significantly affectCustomer Satisfaction.
25
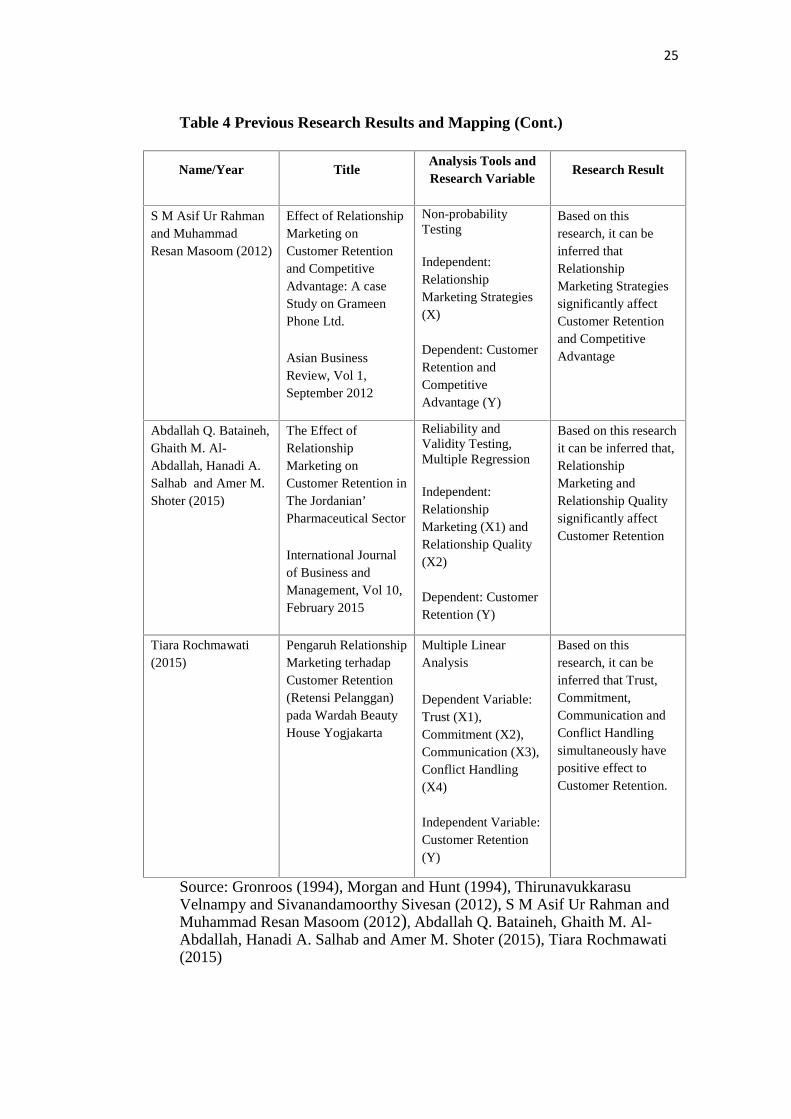
Table 4 Previous Research Results and Mapping (Cont.)
Source: Gronroos (1994), Morgan and Hunt (1994), ThirunavukkarasuVelnampy and Sivanandamoorthy Sivesan (2012), S M Asif Ur Rahman andMuhammad Resan Masoom (2012), Abdallah Q. Bataineh, Ghaith M. Al-Abdallah, Hanadi A. Salhab and Amer M. Shoter (2015), Tiara Rochmawati(2015)
Name/Year TitleAnalysis Tools andResearch Variable
Research Result
S M Asif Ur Rahmanand MuhammadResan Masoom (2012)
Effect of RelationshipMarketing onCustomer Retentionand CompetitiveAdvantage: A caseStudy on GrameenPhone Ltd.
Asian BusinessReview, Vol 1,September 2012
Non-probabilityTesting
Independent:RelationshipMarketing Strategies(X)
Dependent: CustomerRetention andCompetitiveAdvantage (Y)
Based on thisresearch, it can beinferred thatRelationshipMarketing Strategiessignificantly affectCustomer Retentionand CompetitiveAdvantage
Abdallah Q. Bataineh,Ghaith M. Al-Abdallah, Hanadi A.Salhab and Amer M.Shoter (2015)
The Effect ofRelationshipMarketing onCustomer Retention inThe Jordanian’Pharmaceutical Sector
International Journalof Business andManagement, Vol 10,February 2015
Reliability andValidity Testing,Multiple Regression
Independent:RelationshipMarketing (X1) andRelationship Quality(X2)
Dependent: CustomerRetention (Y)
Based on this researchit can be inferred that,RelationshipMarketing andRelationship Qualitysignificantly affectCustomer Retention
Tiara Rochmawati(2015)
Pengaruh RelationshipMarketing terhadapCustomer Retention(Retensi Pelanggan)pada Wardah BeautyHouse Yogjakarta
Multiple LinearAnalysis
Dependent Variable:Trust (X1),Commitment (X2),Communication (X3),Conflict Handling(X4)
Independent Variable:Customer Retention(Y)
Based on thisresearch, it can beinferred that Trust,Commitment,Communication andConflict Handlingsimultaneously havepositive effect toCustomer Retention.
26
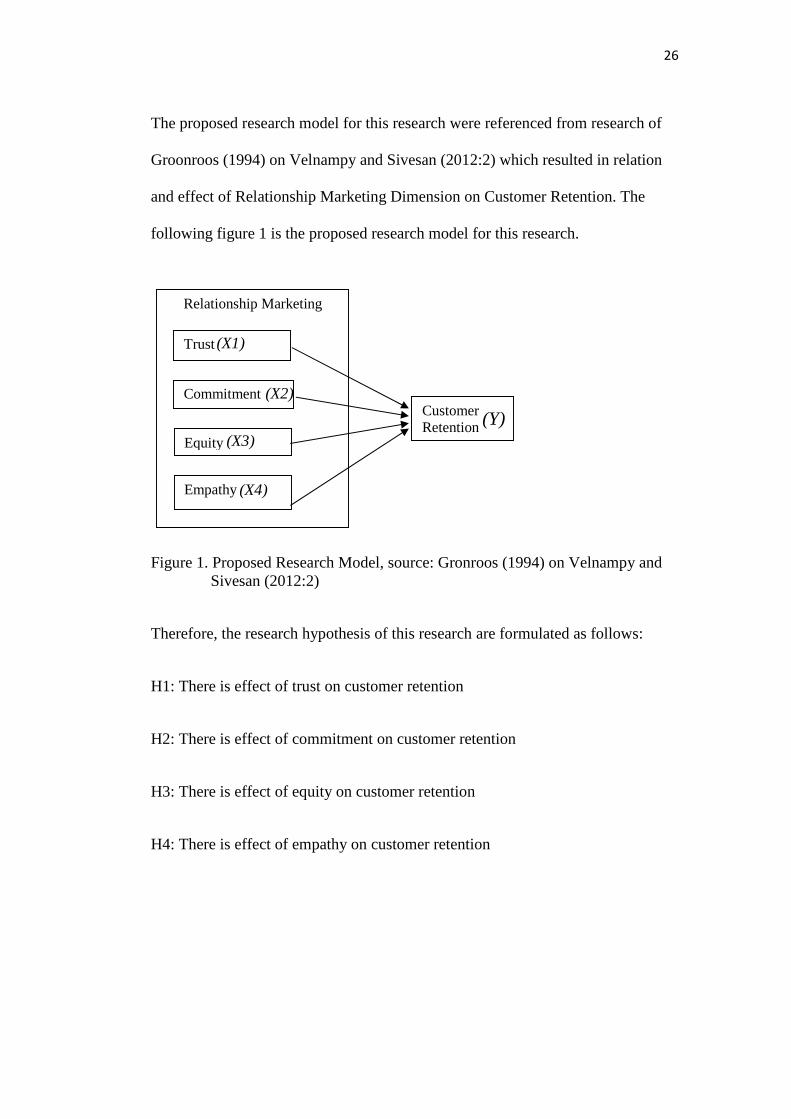
The proposed research model for this research were referenced from research of
Groonroos (1994) on Velnampy and Sivesan (2012:2) which resulted in relation
and effect of Relationship Marketing Dimension on Customer Retention. The
following figure 1 is the proposed research model for this research.
Figure 1. Proposed Research Model, source: Gronroos (1994) on Velnampy andSivesan (2012:2)
Therefore, the research hypothesis of this research are formulated as follows:
H1: There is effect of trust on customer retention
H2: There is effect of commitment on customer retention
H3: There is effect of equity on customer retention
H4: There is effect of empathy on customer retention
Relationship Marketing
Trust
Commitment
Equity
Empathy
(X1)
(X2)
(X3)
(X4)
CustomerRetention (Y)
27
III. RESEARCH METHODOLOGY
3.1 Research Design
This research uses descriptive verification with ex post facto and survey approach.
Descriptive research is a research with purpose to describe or show the current
condition of the research object or subject (person, institution, society, etc.)
according to the existing facts as it is. Meanwhile, verification shows which finds
the relation between independent variable towards dependent variable. Ex post
facto approach is one of the approach utilized to obtain direct data from research
field which able to describe data from the past and field condition before further
research. Thus, survey approach is an approach utilized to obtain data from certain
natural place (not artificial) and data collecting by questionnaire, test, structured
interview and so on (Sugiyono, 2011:12).
This research consist of X variable which is relationship marketing Dimension
towards Y variable which is customer retention. Analyzed data obtained from
spreading questionnaire to respondents who bought or use products or service
from PT. Astra International Tbk. Toyota (Auto 2000) Lampung (Auto 2000
Raden Intan or Auto 2000 Rajabasa) for more than 3 years and purchase Toyota
car more than once.
28
3.2 Research Objects
This research analyze the relation between the effects of relationship marketing
dimension on customer retention at PT. Astra International Tbk. Toyota (Auto
2000) Lampung. Research object which will be the independent variable (X) is
relationship marketing dimension and the dependent variable (Y) is customer
retention. The research object of this research is PT. Astra International Tbk.
Toyota (Auto 2000) Lampung, which is Auto 2000 Raden Intan and Auto 2000
Rajabasa.
3.3 Data Collecting Method
The data collecting method utilized on this research are:
1. Surveys
a) Questionnaire
Data collection not always need the presence of the researcher, but
represented by questionnaire which already systematically sorted
first (Sanusi, 2011:109). Questionnaire for respondents will be
directly distributed by researcher and researcher will collect it after
data filling is done.
2. Observation
Observation is a way to collect data through recording subject behavior,
objects or events which systemically done without questions or
communication with investigated subject or object. Observation involves
the observation on activities or condition either behavioral or non-

29
behavioral (Sanusi, 2011:111). Researcher conducted observation as pre-
research by visiting PT. Astra International Tbk. Toyota (Auto 2000)
Lampung, which is Auto 2000 Raden Intan and Auto 2000 Rajabasa and
watch how the interaction between consumer and company.
3. Documentation
Documentation is conducted by collecting secondary data from various
sources, both individually or institutionally (Sanusi, 2011:111).
Researcher collects data from various sources such as; scientific journals,
literature, previous research, thesis and collected data from institution or
body related to the research conducted by the researcher.
3.4 Data Type and Source
3.4.1 Data type
The data type utilized on this research are:
a. Qualitative data which is data that not in a form of number, this data
can be collected from both verbal or written information
b. Quantitative data is data in the form of number which obtained from
researched object.
3.4.2 Data source
The data source utilized on this research are:
30
a. Primary data is data which directly collected from researched object
and the result of questionnaire and observation conducted by
researcher
b. Secondary data is data obtained from previous study such as scientific
journals, literature, previous research, thesis and collected data from
institution or body related to the research conducted by the researcher.
3.5 Population and Sample
3.5.1 Population
According to Sugiyono (2011:61), generalized region population consists of
object or subject with certain quality and characteristic which categorized by
researcher to be studied and concluded. Population on this research is all
consumer who purchase and use products or service on PT. Astra International
Tbk. Toyota (Auto 2000) Lampung (Auto 2000 Raden Intan or Auto 2000
Rajabasa) for more than 3 years and purchase Toyota car more than once.
Because the researcher only possess half of the data which caused by the
limited time, cost and difficulties in accessing the data, the existing
population become unknown population. The matter is happen because the
available data cannot represent the data as a whole. Because of that matter,
researcher do sampling on this research.
3.5.2 Sample
Sample according to Sugiyono (2011:64) is part of amount and characteristic
possessed by the population. Because on this research it is hard to obtain
31
information in detail and implied to the sample criteria required by
researcher. Thus, the limited time and cost which make researcher categorize
the population of this research as unknown population and chose to use
sampling method. Method utilized on this research is Non Probability
Sampling, which is sampling technique that not giving equal chances to every
element (member) of the population to be chosen as sample member
(Sugiyono, 2011: 66). Researcher uses Non Probability Sampling because
this method is faster and cheaper rather than Probability Sampling.
Non Probability Sampling method used in this research use purposive
sampling technique. Purposive Sampling is technique with certain
consideration (Sugiyono, 2011:68). The technique is used by researcher
because it is difficult to access the whole population of this research, because
there is certain characteristic needs to be fulfilled to make the population able
to be categorized as sample in this research, which is purchasing and use
product or service on PT. Astra International Tbk. Toyota (Auto 2000)
Lampung (Auto 2000 Raden Intan or Auto 2000 Rajabasa) for more than
three years and purchase Toyota car for more than once. Because of that, it is
necessary for researcher to decide which sample to be studied.
Researcher not use Quota Sampling which is usually used to study population
with the similar proportion or comparing two population (Sugiyono, 2011:71)
because this research is not purposed to find differences between consumer in
Auto 2000 Raden Intan with consumer in Auto 2000 Rajabasa, but to see
whether there is positive effect of Relationship Marketing Dimension (X) on
Customer Retention (Y) on the research object.

32
Indrawan and Yaniawati (2014:104) explains for unknown population, the
guidance for collected sample size can be measured by:
N = Z2P(1-P)/d2
Z = 1,96
P = maximum estimation 0,5
d = alpha (0,098)
Which makes
n = 1,96^2 . 0,5 (1-0,5) /0,098 ^2 =100.
Sample used will be 100 respondents.
3.6 Operational Variable
According to Sugiyono (2011:60), operational variable is basically everything in
any form which is determined by the researcher to be studied so there will be
information about the matter, which will later be concluded. The researcher use
two variables in this research which are:
1. Independent variable (X)
Independent variable is the variable that affect the dependent variable.
The independent variable of this research is relationship marketing
dimension.
Four dimension of relationship marketing which are:
Trust as X1
Commitment as X2
Equity as X3
Empathy as X4

33
2. Dependent variable (Y)
Dependent variable is the effect of the existing independent variable
or the variable that is affected by the independent variable. Customer
retention is the dependent variable of this research.
3.7 Measurement Scale
Questionnaire filling of this research will use Likert scale to measure the respond
of respondents as follow:
a. Scored 5, with category of very agree (SS)
b. Scored 4, with category agree (S)
c. Scored 3, with category neutral (N)
d. Scored 2, with category disagree (TS)
e. Scored 1, with category very disagree (STS)
Table 5 Operational Variable
Variable Variable Dimension Question Indicators Scale
RelationshipMarketingRelationshipMarketing iseffort fromcompany toextend the lifeon consumerlifetime asindividual whotransact andpreservingconsumerloyalty
Gronroos(1994)
Trust (X1), trust is theestablishing factor ofcommitment becausecommitment includes trustand sacrifice. Commitmentcannot be established withouttrust.
Gronroos (1994)
1. Companyconsistently giveservice to consumer
2. Company showsrespect to consumer
3. Consumer belieftowards company
Likert

34
Table 5 Operational Variable (Cont.)
Variable Variable Dimension Question Indicators ScaleCommitment (X2), canbe described as promiseor vow to maintain goodrelationship because it isessential.
Gronroos (1994)
1. Personal service fromcompany for consumer
2. Company flexibility infulfilling consumerneeds
3. Company fulfill itsresponsibility toconsumer
Likert
Equity (X3), Equity inrelationship marketingrelated to equal feeling ofconsumer correspond togiven sacrifices betweenone consumer andanother
Gronroos (1994)
1. Company give thesame service for everyconsumer
2. Company givesaccurate informationfor every consumer
3. Company makes andfulfill its promises forevery consumer
Empathy (X4),empathy on relationshipmarketing related withprocess ofunderstanding consumerexpectation and otheressentials tocomprehend itsconsumer. If a companyunable to understand itsconsumer, then thecompany will not ableto fulfill their demandsuccessfully.
Gronroos (1994)
1. Company offerssolution to consumer
2. Company listen andhear to complaints andconsumer demands
3. Company do two waycommunication withconsumer
35
Table 5 Operational Variable (Cont.)
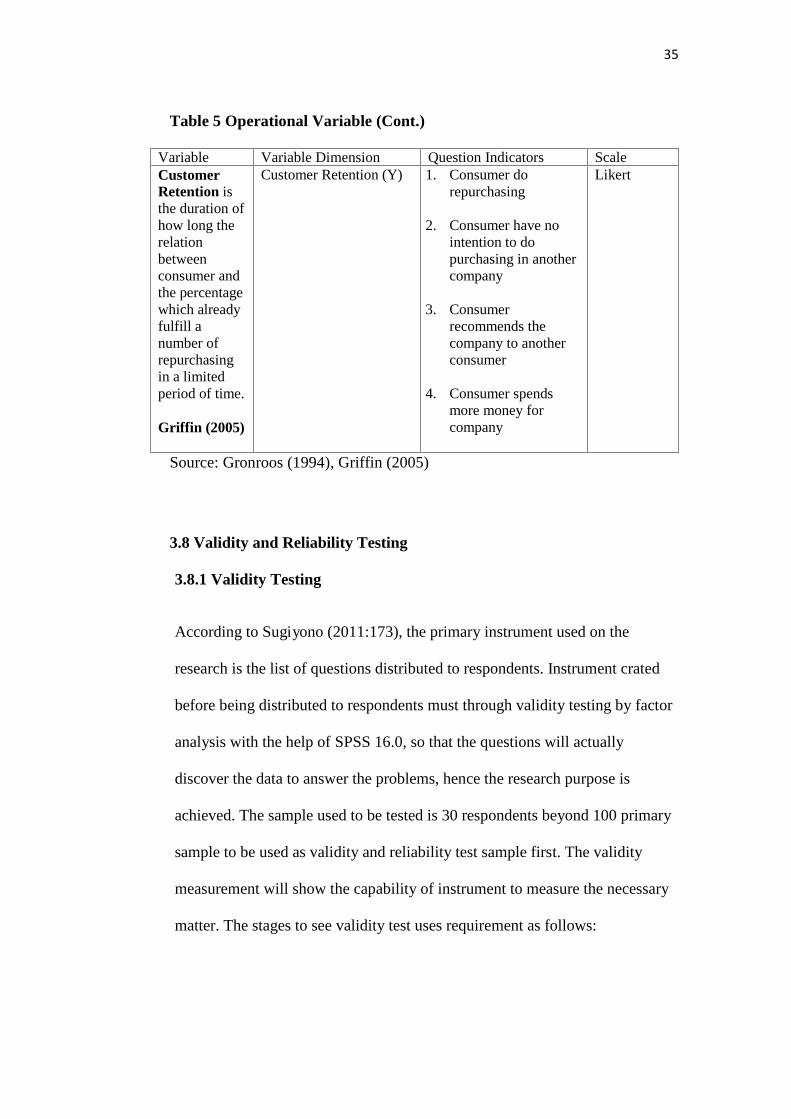
Variable Variable Dimension Question Indicators ScaleCustomerRetention isthe duration ofhow long therelationbetweenconsumer andthe percentagewhich alreadyfulfill anumber ofrepurchasingin a limitedperiod of time.
Griffin (2005)
Customer Retention (Y) 1. Consumer dorepurchasing
2. Consumer have nointention to dopurchasing in anothercompany
3. Consumerrecommends thecompany to anotherconsumer
4. Consumer spendsmore money forcompany
Likert
Source: Gronroos (1994), Griffin (2005)
3.8 Validity and Reliability Testing
3.8.1 Validity Testing
According to Sugiyono (2011:173), the primary instrument used on the
research is the list of questions distributed to respondents. Instrument crated
before being distributed to respondents must through validity testing by factor
analysis with the help of SPSS 16.0, so that the questions will actually
discover the data to answer the problems, hence the research purpose is
achieved. The sample used to be tested is 30 respondents beyond 100 primary
sample to be used as validity and reliability test sample first. The validity
measurement will show the capability of instrument to measure the necessary
matter. The stages to see validity test uses requirement as follows:
36
a. KMO value, the adequacy sampling KMO is index which utilized to test
the compatibility of analysis factor. KMO values is between 0,5 until 1 to
identify if the factor is adequate already
b. Index Measure of Sampling Adequacy (MSA), used to see correlation
between variable from analysis factor. MSA Index is between 0 until 1,
MSA value which is close to one means that the predicted variable is
perfect without error (Hair, 2006)
c. Communalities value, is the estimation from share or common variance
between variables. Index communalities is more or equal with 0,5 (≥0,5),
then variable is able to be predicted and further analyzed
d. Factor loading, is the magnitude of an indicator with formed factor
(Malhotra, 2010). Validity criteria of an indicator could be categorized as
valid to form a factor if factor loading is bigger or equal to 0,5 (≥0,5) or
better if factor loading bigger or equal to 0,7 (≥0,7).
3.8.2 Reliability Testing
Reliability testing according to Arikunto (2010) means to “know the
consistency of measurement tools on its utilization, or in the other word, tools
like questionnaire have consistent result if repetitively used on different times.
The test will use Alpha Cronbach technique, where an instrument could be
categorized as reliable if the alpha of reliability coefficient is 0,6 or more. The
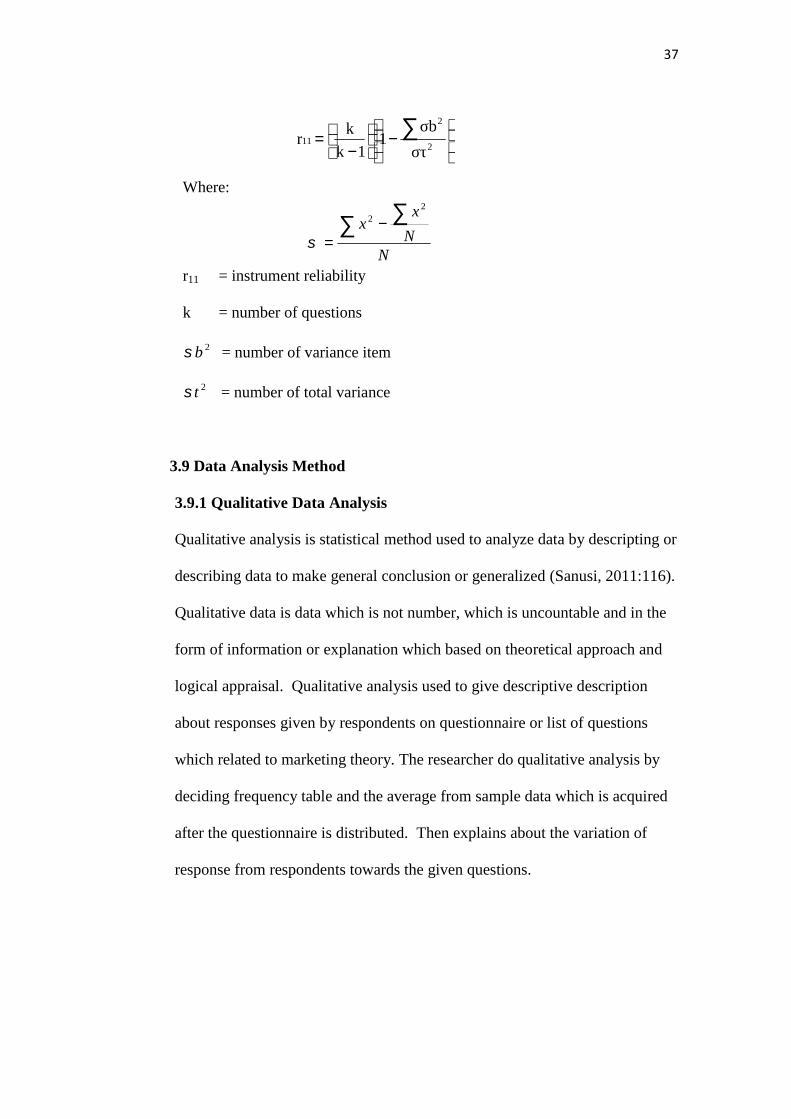
alpha formula used (Arikunto, 2010) on this research is:
37
2
2
11στ
σb1
1k
kr
Where:
NN
xx
22
r11 = instrument reliability
k = number of questions
2b = number of variance item
2t = number of total variance
3.9 Data Analysis Method
3.9.1 Qualitative Data Analysis
Qualitative analysis is statistical method used to analyze data by descripting or
describing data to make general conclusion or generalized (Sanusi, 2011:116).
Qualitative data is data which is not number, which is uncountable and in the
form of information or explanation which based on theoretical approach and
logical appraisal. Qualitative analysis used to give descriptive description
about responses given by respondents on questionnaire or list of questions
which related to marketing theory. The researcher do qualitative analysis by
deciding frequency table and the average from sample data which is acquired
after the questionnaire is distributed. Then explains about the variation of
response from respondents towards the given questions.
38
3.9.2 Quantitative Data Analysis
Quantitative analysis is analysis which use systematic analysis in processing
the data. This research use quantitative analysis by using multiple regression
analysis. Multiple regression analysis method were based on obtained sample
data to see the magnitude of relation between relationship marketing
dimension (X) on customer retention (Y) at PT. Astra International Tbk.
Toyota (Auto 2000) Lampung. According to Sarwono (2009), data is
statistically processed for the sake of analysis and hypothesis testing with
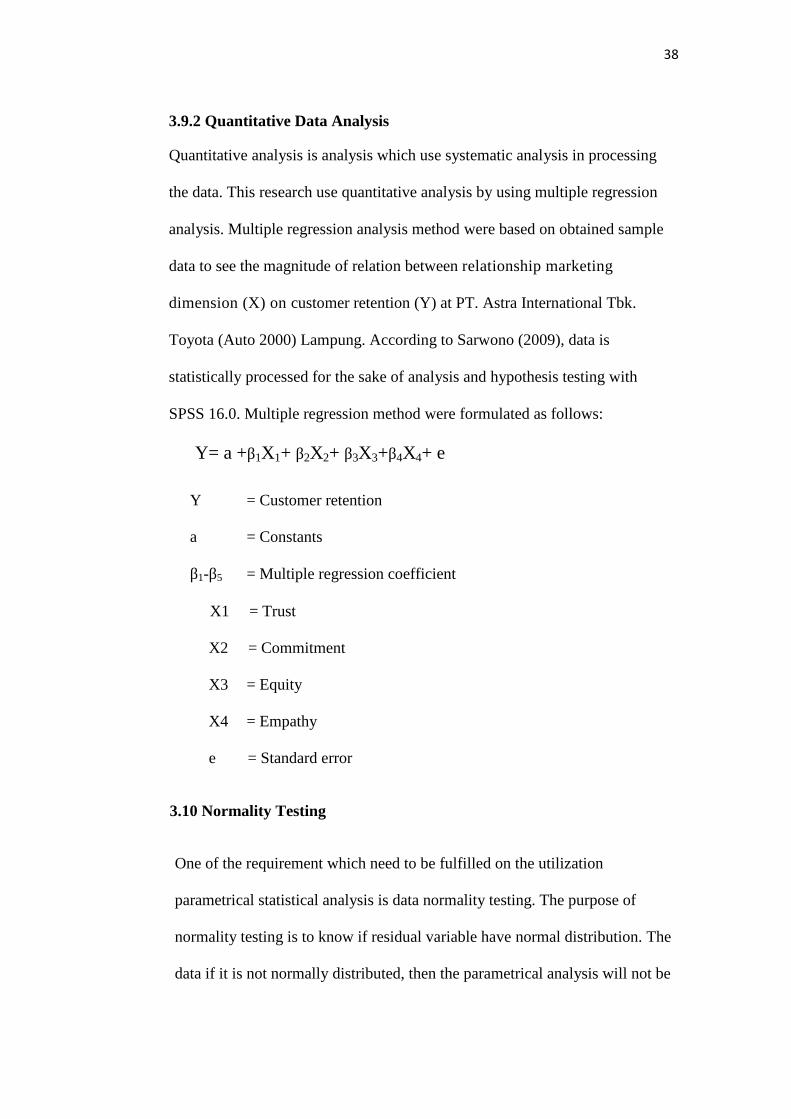
SPSS 16.0. Multiple regression method were formulated as follows:
Y= a +β1X1+ β2X2+ β3X3+β4X4+ e
Y = Customer retention
a = Constants
β1-β5 = Multiple regression coefficient
X1 = Trust
X2 = Commitment
X3 = Equity
X4 = Empathy
e = Standard error
3.10 Normality Testing
One of the requirement which need to be fulfilled on the utilization
parametrical statistical analysis is data normality testing. The purpose of
normality testing is to know if residual variable have normal distribution. The
data if it is not normally distributed, then the parametrical analysis will not be

39
able to be used because the statistical data on parametrical analysis is derived
from normal distribution (Sugiyono, 2011:239). According to Santoso
(2002:393) distribution from population is categorized as normal if the
probability value is > 0, 05 and population is not normally distributed when
the probability is < 0, 05. Normality testing method used on this research is
Kolmogrov-Smirnov. Researcher choose the method because it is the most
simple and commonly used method and will not cause different perception
between one observers to another.
3.11 Hypothesis Testing
Statistical counting may be considered as statistically significant if the value
of statistic test lies on critical area (where Ho is rejected). Conversely, it is not
significant if the statistical value lies on the area where Ho is accepted.
There are three kind of exactness which needs to be done in regression
analysis:
3.11.1 Partial Significance Testing (t-Test)
According to Sugiyono (2011:215) t-test measure how big is the
effect of independent variable on dependent variable.
Ho: b1=b2=b3=b4=0
Means that partially, there is no positive relation between relationship
marketing dimension variable (X) on customer retention (Y).
Ha: b1, b2, b3, b4, ≠0
Means that partially, there is positive relation between relationship

40
marketing dimension variable (X) on customer retention (Y).
Criteria:
Ho accepted and Ha rejected if counted significance is > 0, 05
Ho rejected and Ha accepted if counted significance is < 0, 05
3.11.2 Simultaneous Variable Testing (F-Test)
According to Sugiyono (2011:215) F-testing is basically shows if all
independent variable on the model have the effect to dependent variable.
Ho: b1=b2=b3=b4=0
Means that altogether, there is no positive and significant relation
between relationship marketing dimension variable (X) on customer
retention (Y).
Ha: b1≠b2≠b3≠b4≠0
Means that together, there is positive relation between relationship
marketing dimension variable (X) on customer retention (Y).
Criteria:Ho accepted and Ha rejected if counted significance is > 0, 05
Ho rejected and Ha accepted if counted significance is < 0, 05
3.11.3 Determination Coefficient (R2)
Determination coefficient (R2) is basically how big the capability of a
model to describe dependent variable (Sugiyono 2011:257). The higher
number of R2, the more important the variable is.
V. CONCLUSION AND SUGGESTION
5.1 Conclusion
Based on analysis result and explained discussion, thus a conclusion can be made
which support hypothesis proposed by researcher, based on:
1. Result from hypothesis 1 testing shows that trust variable is positively and
significantly affect customer retention or meaning that hypothesis 1 is
accepted. This is shown by t count value which is 2,189 bigger than 1,985
and significance 0,023 lower than 0,05.
2. Result from hypothesis 2 testing shows that commitment variable is
positively and significantly affect customer retention or meaning that
hypothesis 2 is accepted. This is shown by t count value which is 1,997
bigger than 1,985 and significance 0,042 lower than 0,05.

69
3. Result from hypothesis 3 testing shows that equity variable is positively
and significantly affect customer retention or meaning that hypothesis 3 is
accepted. This is shown by t count value which is 7,016 bigger than 1,985
and significance 0,000 lower than 0,05.
4. Result from hypothesis 4 testing shows that empathy variable is positively
and significantly affect customer retention or meaning that hypothesis 4 is
accepted. This is shown by t count value which is 2,798 bigger than 1,985
and significance 0,006 lower than 0,05.
5.2 Suggestion
Suggestion created which related to the result of this research are:
a. For Company:
It is advised for PT. Astra International Tbk. Toyota (Auto 2000) Lampung, to
increase its commitment toward consumer because based on research result,
this is a variable with the least effect and significance towards customer
retention. Improving the quality of services regarding to better technician
performances on body repair services and better spare part provided from the
company. This can be achieved by communicating with Toyota Auto 2000
Headquarter in Jakarta because PT. Astra International Tbk. Toyota (Auto
2000) Lampung are the branch of the company in Lampung. Communicating
the result of this research and formulate the most adequate strategy in tackling

70
commitment issues found. The researcher believe that the suggestion will be
helpful in increasing customer retention in the future.
b. For Further Research
1. For further research by other researcher, it is advised to add more
variables into account. In this research the least coefficient value counted
is commitment with 0,151 and the highest value counted is equity with
0,553. Thus resulting in more variable to be added in which affect
customer retention which not added on this research.
2. Adding more research samples to help contribute in producing better
research results.
REFERENCE LIST
Ali, Hasan. 2009. Marketing Edisi Terbaru. Yogjakarta: Media Presindo.
American Marketing Association. 2016. Fundamentals of Marketing. Chicago:AMA Printing.
Ang, Lawrence and Buttle, Francis. 2005. Customer Retention ManagementProcesses: A Quantitative Study. European Journal of Marketing, Vol. 40.Page 83 – 99.
Arikunto, Suharsimi. 2010. Prosedur Penelitian: Suatu Pendekatan Praktik.Jakarta: Rineka Cipta.
Arli, D. and Tjiptono, F. 2014. The End of Religion? Examining the Role ofReligiousness, Materialism, and Long-term Orientation on ConsumerEthics in Indonesia. Journal of Business Ethics, 123, 385-400.
Bataineh, Abdallah Q, Ghaith M. Al-Abdallah, Hanadi A. Salhab and Amer M.Shoter. 2015. The Effect of Relationship Marketing on Customer Retentionin The Jorandian’ Pharmaceutical Sector. International Journal ofBusiness and Management, Vol 10. February 2015. Page 117 – 131.
Blackwell, Roger D, Paul W. Miniard and James F. Engel. 2006. ConsumerBehavior, 10th Edition. Ohio: Thomson Business and Economics.
Buchari, Alma. 2007. Manajemen Pemasaran dan Pemasaran Jasa. Bandung:CV Alfabeta.
Buttle, Francis. 2006. Relationship Marketing: Theory and Practice. California:SAGE Publications.
Chan, S. 2003. Relationship Marketing: Inovasi Pemasaran yang MembuatPelanggan Bertekuk Lutut. Jakarta: PT. Gramedia Pustaka Utama.
Chaffey D, Mayer R, Johnston K and Ellis Chadwick F. 2000. InternetMarketing. Harlow: Pearson Education.
Chandra, Gregorius. 2001. Strategi Program Pemasaran. Yogyakarta: Andi.
Griffin, Jiil. 2005. Customer Loyalty Menumbuhkan dan MempertahankanKesetiaan Pelanggan. Jakarta: Erlangga.
Gronroos, Christian. 1994. From Marketing Mix to Relationship Marketing:Towards a Paradigm Shift in Marketing. Management Decision. Vol. 32.Agustus 1994. Page 4 – 20.
Gummesson, E. 1999. Total Relationship Marketing: Rethinking MarketingManagement from 4Ps to 30Rs. Oxford: Butterworth Heinemann.
Hair, et al. 2006. Multivariate Data Analysis, 6th Edition. New Jersey: PearsonEducation.
Hurriyati, Ratih. 2005. Bauran Pemasaran dan Loyalitas Konsumen. Bandung:Alfabeta
Indrawan, Rully and Raden Poppy Yaniawati. 2014. Metodologi Penelitian.Bandung: PT. Refika Aditama.
Kotler, Philip and Kevin L. Keller 2012. Marketing Management, 14th Edition.New Jersey: Prentice Hall International, Inc.
Kotler, Philip. 2003. Marketing Management, Twelfth Edition. New Jersey:Prentice Hall International, Inc.
Lerman, Luke K. 2013. Bridging Marketing Intentions and ConsumerPerceptions. Journal of Consumer Marketing Vol. 30, March 2013: 544-552.
Malhotra, Naresh K. 2010. Marketing Research an Applied Orientation. NewJersey: Pearson.
Morgan, Robert M and Shelby D. Hunt. 1994. The Commitment-trust Theory ofRelationship Marketing. Journal of Marketing Vol. 58, July 1994: 20-38.
Mowen, John, C and M. Minor. 2002. Perilaku Konsumen Jilid 1, Edisi Kelima.Jakarta: Erlangga.
Nwakanma, Hudson, Annette S. Jackson and Janee N. Burkhalter. 2007.Relationship Marketing: An Important Tool for Success in theMarketplace. Journal of Business and Economic Research Vol. 5,February 2007: 55-64.
Rochmawati, Tiara. 2015. Pemgaruh Relationship Marketing TerhadapCustomer Retention (Retensi Pelanggan) Pada Wardah Beauty HouseYogjakarta. Skripsi. Universitas Islam Negeri Sunan Kalijaga, Yogjakarta.
Rahman, S M Asif Ur and Muhammad Resan Masoom 2012. Effect ofRelationship Marketing on Customer Retention and CompetitiveAdvantage: A case Study on Grameen Phone Ltd. Asian Business ReviewVol.1, September 2012: 97-102.
Santoso, Singgih. 2002. Statistik Parametrik. Cetakan Ketiga. Jakarta: PTGramedia Pustaka Utama.
Sanusi, Anwar. 2011. Metedologi Penelitian Bisnis. Jakarta: SalembaEmpat.
Saputra, Murry Harmawan and Endah Pri. Ariningsih. 2014. Masa DepanPenerapan Strategi Relationship Marketing pada Industri JasaPerbankan. Jurnal Manajemen and Bisnis. Volume 1, Januari 2014.
Sarwono, Jonathan. 2009. Statistik Itu Mudah: Panduan Lengkap untukMelakukan Komputasi Statistik Menggunakan SPSS 16. Yogjakarta:Andi.
Stone, Marlin. 2001. The Art of Marketing Vol. 8 Customer RelationshipMarketing. New Delhi: Crest Publishing House.
Sugiyono. 2011. Metode Penelitian Kuantitatif, Kualitatif dan R&D. Bandung:CV. Alfabeta
Szmigin, Isabelle and Humprey Bourne. 1998. Consumer Equity in RelationshipMarketing. Journal of Consumer Marketing Vol. 15, March 1998: 544-557.
Tjiptono, Fandy. 2008. Strategi Pemasaran. Yogjakarta: Andi.
Velnampy, Thirunavukkarasu and Sivandamoorthy Sivesan. 2012. CustomerRelationship Marketing and Customer Satisfaction: A Study on MobileService Providing Companies in Sri Lanka. Global Journal of Managementand Business. Vol. 12. January 2012.
Weitz, Barton A and Kevin D Bradford. 1999. Personal Selling and SalesManagement: A Relationship Marketing Perspective. Journal of theAcademy of Marketing Science. Vol. 27. Spring 1999: 241-254.
Zikmund, William G. 2012. Business Research Method. California: South-Western College.
www.gaikindo.or.id accessed on 19 March 2016