the effect of protandim supplementation on oxidative
TRANSCRIPT

University of LouisvilleThinkIR: The University of Louisville's Institutional Repository
Electronic Theses and Dissertations
8-2015
The effect of Protandim supplementation onoxidative damage and athletic performance.Seteena Leigh UeberschlagUniversity of Louisville
Follow this and additional works at: https://ir.library.louisville.edu/etd
Part of the Sports Sciences Commons
This Master's Thesis is brought to you for free and open access by ThinkIR: The University of Louisville's Institutional Repository. It has been acceptedfor inclusion in Electronic Theses and Dissertations by an authorized administrator of ThinkIR: The University of Louisville's Institutional Repository.This title appears here courtesy of the author, who has retained all other copyrights. For more information, please contact [email protected].
Recommended CitationUeberschlag, Seteena Leigh, "The effect of Protandim supplementation on oxidative damage and athletic performance." (2015).Electronic Theses and Dissertations. Paper 2209.https://doi.org/10.18297/etd/2209

THE EFFECT OF PROTANDIM SUPPLEMENTATION ON OXIDATIVE DAMAGE
AND ATHLETIC PERFORMANCE
By
Seteena Leigh Ueberschlag B.A., Wilfrid Laurier University, 2010
B.Ed., University of Western Ontario, 2011
A Thesis Submitted to the Faculty of the
College of Education and Human Development of the University of Louisville in Partial Fulfillment of the Requirements
for the Degree of
Master of Science in Exercise Physiology
Department of Health and Sports Science University of Louisville
Louisville, Kentucky
August 2015


ii
THE EFFECT OF PROTANDIM SUPPLEMENTATION ON OXIDATIVE DAMAGE
AND ATHLETIC PERFORMANCE
By
Seteena Leigh Ueberschlag B.A., Wilfrid Laurier University, 2010
B.Ed., University of Western Ontario, 2011
A Thesis Approved on
June 25, 2015
By the Following Thesis Committee
______________________________ Gerald Zavorsky, Ph.D. (Thesis Director)
______________________________ Kathy Carter Ph.D., R.D.
______________________________ Edward Weiss, Ph.D.
______________________________ Rodney Folz, M.D., Ph.D.

iii
ACKNOWLEDGEMENTS
I would like to thank my thesis director, Dr. Gerald Zavorsky: you have helped
me to grow as a professional researcher and scientist. Thank you for all the time and
effort you have put into making this opportunity possible. I would like to thank my thesis
committee for their time and effort in reviewing my work and providing me with
excellent feedback. Thank you to all the participants who participated in the study. I
appreciate your time and effort throughout the entire length of the study. Without you,
this study would not have been possible. I would like to thank all the members of the
research team: James Seay, Alexandra Roberts, Crissie De Spirito, and Jeremy Stith. I
couldn't have asked for a more committed, and fun group of people to work with every
day. Finally, I would like to thank LifeVantage Corporation, who funded this research
study.
iv
ABSTRACT
THE EFFECT OF PROTANDIM SUPPLEMENTATION ON OXIDATIVE DAMAGE
AND ATHLETIC PERFORMANCE
Seteena L. Ueberschlag
June 25, 2015
A double-blind placebo-controlled trial determined the long term effects of Protandim®
supplementation on 5-km running performance, as well as on acute and long-term
oxidative damage assessed by serum lipid peroxides (Thiobarbituric acid-reacting
substances: TBARS). Thirty-eight subjects were placed into one of two groups: an
experimental (675 mg/day Protandim®) or control group (675 mg/day corn starch). 5-km
runs were performed at baseline and 88 (SD 4) days post-supplementation with samples
taken immediately pre- and 10-min post 5-km run, as well as at rest ∼30 and ∼60 days
during the supplementation period. There was ~25% week-to-week coefficient of
variation of TBARS at baseline (rested, fasted). The runs did not acutely increase mean
TBARS, nor was there a change in 5-km time or in mean serum TBARS (at rest, fasted)
in either group after supplementation. In conclusion, it is unlikely that Protandim®
improves 5-km performance, or that it reduces serum TBARS at rest.

v
TABLE OF CONTENTS
ACKNOWLEDGEMENTS ............................................................................................... iii
ABSTRACT ....................................................................................................................... iv
LIST OF TABLES ........................................................................................................... viii
LIST OF FIGURES ............................................................................................................ x
INTRODUCTION .............................................................................................................. 1
Significance of the Study ............................................................................................... 5
Purpose of the Study ....................................................................................................... 6
Research Questions & Hypotheses ................................................................................. 7
Definition of Terms ........................................................................................................ 8
Delimitations ................................................................................................................ 10
Assumptions ................................................................................................................. 10
LITERATURE REVIEW ................................................................................................. 12
Background on Oxidative Stress Testing ..................................................................... 12
Blood Measurements of Oxidative Stress .................................................................... 13
Earliest Research on Oxidative Stress and Exercise .................................................... 17
Exercise Frequency, Intensity, and Duration Effecting Free-Radical Production ....... 18
Chronic Training and its Effects on Oxidative Stress .................................................. 21
Acute and Long Term Effects of Lipid Peroxidation, TAC, GPX, and SOD. ............. 21
Sources of Antioxidants in Food .................................................................................. 24
The Effects of Antioxidant Supplements on Health ..................................................... 25
Antioxidant Supplementation and Athletes .................................................................. 26
Sex Differences and Inter-Individual Differences ........................................................ 28

vi
Resurgex and its Effects on Oxidative Stress ............................................................... 29
Protandim® Marketed by LifeVantage Corporation ..................................................... 29
Nrf2 Activation is the Future of Cellular Protection .................................................... 32
METHODS ....................................................................................................................... 34
Participants ................................................................................................................... 34
Procedures .................................................................................................................... 34
Diet Records ................................................................................................................. 36
Blood sampling ............................................................................................................. 39
Blood and Serum Sample Analyses ............................................................................. 41
Thiobarbituric acid-reactive substances (TBARS): .................................................. 41
Total antioxidant capacity (TAC): ............................................................................ 41
Glutathione (GSH): ................................................................................................... 42
Superoxide Dismutase (SOD): .................................................................................. 43
Glutathione Peroxides (GPX): .................................................................................. 43
Sulphate: ................................................................................................................... 43
Cysteine/Cystine: ...................................................................................................... 44
Sample size calculation ................................................................................................ 44
Protection of Human Subjects ...................................................................................... 47
Data Management and Storage ..................................................................................... 48
RESULTS ......................................................................................................................... 49
Intervention Data .......................................................................................................... 49
5-km Time Trial Performance ...................................................................................... 50
Aerobic Training Index ................................................................................................ 51
Environmental Conditions ............................................................................................ 51
Baseline Blood Parameters ........................................................................................... 52
Chronic Effects of Supplementation on Blood Parameters Measured at Rest ............. 52
Acute Effects of Exercise on Blood Parameters .......................................................... 53

vii
Dietary Recall Analyses ............................................................................................... 53
Quality of Life Analyses .............................................................................................. 54
Signs and Symptoms .................................................................................................... 54
DISCUSSION ................................................................................................................... 55
Limitations .................................................................................................................... 59
Conclusion .................................................................................................................... 63
Future Research Directions .......................................................................................... 63
REFERENCES ................................................................................................................. 64
CURRICULUM VITAE..................................................................................................112

viii
LIST OF TABLES
Table 1. Blood parameters measured by Genova Diagnostics ......................................... 77
Table 2. Baseline anthropometric characteristics, baseline 5-km time-trial results, and
baseline fasting blood glucose results ............................................................................... 78
Table 3. Baseline blood results......................................................................................... 79
Table 4. The week to week coefficient of variation in the blood variables. All blood
variables were measured by Genova Diagnostics (n = 38). .............................................. 80
Table 5. Genova Diagnostic’s intra and inter-assay coefficient of variation for most
parameters in the oxidative stress panel. ........................................................................... 81
Table 6. The aerobic training index between groups. This is the total amount of physical
activity in minutes over a two week period multiplied by the average rating of perceived
exertion value. ................................................................................................................... 82
Table 7. Environmental conditions for all three 5-km time trials held at the University of
Louisville outdoor track. ................................................................................................... 83
Table 8. Summary probabilities for all blood parameters at rest. .................................... 84
Table 9. The number of individuals in each group that ate the same food 24 hrs prior to
the blood draw for each of the five blood draw days. ....................................................... 85
Table 10. Pre and post exercise blood values from both baseline sessions and at 88 days
post-supplementation ........................................................................................................ 86

ix
Table 11. Pre and post exercise blood values at both baseline sessions and at 88 days
post-supplementation ........................................................................................................ 87
Table 12. The total number of participants and events of a given sign / symptom over the
supplementation period of 88 days. .................................................................................. 88
Table 13. The stability of the responses for the WHOQOL-BREF Questionnaire over a
one week baseline period (n= 38). .................................................................................... 89

x
LIST OF FIGURES
Figure 1: A meta-analysis of the effect of intense exercise on oxidative damage as
assessed by lipid peroxides from serum blood samples.................................................... 91
Figure 2: A meta-analysis of the effect of intense exercise on superoxide dismutase
concentration from serum blood samples ......................................................................... 92
Figure 3: A meta-analysis of the effect of intense exercise on glutathione peroxidase
concentration from serum blood samples ......................................................................... 93
Figure 4: A meta-analysis of the effect of intense exercise on total antioxidant capacity
from serum blood samples ................................................................................................ 94
Figure 5: A meta-analysis of the effect of long term chronic training on oxidative
damage as assessed lipid peroxides from serum blood samples ....................................... 95
Figure 6: A meta-analysis of the effect of long term training on superoxide dismutase
concentration from serum blood samples ......................................................................... 96
Figure 7: A meta-analysis of the effect of long term training on glutathione peroxidase
concentration from serum blood samples ......................................................................... 97
Figure 8: A meta-analysis of the effect of long term training on total antioxidant capacity
from serum blood samples ................................................................................................ 98
Figure 9: Normal subjects before supplementation with Protandim® ............................ 99

xi
Figure 10: Group 1 subjects supplemented with Protandim® for 120 days showed a
significant increase (*) in erythrocyte SOD ...................................................................... 99
Figure 11: Group 2 subjects supplemented with Protandim® at 338 mg/day for 30 day
showed a substantial decline in TBARS ......................................................................... 101
Figure 12: The 5-km time trial performance times between the post-supplementation
period and baseline (minutes) ......................................................................................... 102
Figure 13: Figure 13: Box-and-whisker plots of the change in 5-km time trial
performance between post-supplementation period and baseline (post – pre) ............... 103
Figure 14: The long terms effects of supplementation on lipid peroxides and superoxide
dismutase in the blood (rest, fasted state) ....................................................................... 104
Figure 15: The long terms effects of supplementation on glutathione peroxidase and
whole blood glutathione in the blood (rest, fasted state) ................................................ 105
Figure 16: The long terms effects of supplementation on total antioxidant capacity and
sulphate levels in the blood (rest, fasted state) ............................................................... 106
Figure 17: The long terms effects of supplementation on cysteine and cystine levels in
the blood (rest, fasted state) ............................................................................................ 107
Figure 18: The long terms effects of supplementation the cysteine to cystine ratio and the
cysteine to sulphate ratio in the blood (rest, fasted state) ............................................... 108
Figure 19: The acute changes in lipid peroxides, superoxide dismutase, and glutathione
peroxidase in the blood pre to 10 minutes post-exercise ................................................ 109

xii
Figure 20: The acute changes in whoel blood glutathione, total antioxidant capacity, and
sulphate levles in the blood pre to 10 minutes post-exercise .......................................... 110
Figure 21: The acute changes in cysteine, cystine, and the custeine to cystine ratio in the
blood pre to 10 minutes post-exercise ............................................................................ 110
Figure 22: World Health Organization Quality of Life raw scores ............................... 111

1
INTRODUCTION
For many years scientists have connected the process of aging with reactive
oxygen molecules produced during a human’s normal metabolism. Reactive oxygen
molecules are often used interchangeably with "free radicals" or "reactive oxygen species
(ROS)" and cause damage to cellular structures throughout the human body. Cellular
structures that are most susceptible to cellular damage causing the cell to function
improperly are cell membranes, DNA, the mitochondria (energy production), and
immune function (neutrophilic phagocytosis)1. Oxidative stress occurs when the
production of ROS outweighs the body's ability to remove them1. Therefore, the
generation of reactive oxygen species causes oxidative stress1.
The human body produces these damaging ROS every day during normal living
and breathing, but ROS are also in the environment in the form of car exhaust, air
pollution, sunlight, cigarette smoking, alcohol consumption, a poor diet, as well as other
sources1. As a result of free radicals being all around us in the environment, our bodies
are constantly at risk of cellular damage unless the necessary precautions are made to
protect ourselves.
Antioxidants are the bodies defense against free radical damage. Antioxidants
have the ability to help protect every cell in our body from free radicals through reducing
agents such as dietary antioxidants (such as Vitamin C, Vitamin E, and beta carotene),
2
antioxidant enzymes, and nutritional supplements3. When free radicals are produced in
the body, antioxidants donate their electrons to stabilize and counteract the free radicals
damage1. The body's main cellular antioxidant defenses are superoxide dismutase (SOD)
and glutathione peroxides (GPX) 2. SOD is the body's first line of enzymatic defense
against intracellular free radical production through removal of one-electron dismutation
of oxygen (O2-) to hydrogen peroxide (H2O2) 3. Glutathione (GSH) acts as a substrate for
GPX to remove hydrogen and organic peroxides (eg. lipid peroxides) within the body3.
When glutathione levels are reduced in the blood it reflects the redox status of skeletal
muscle and the heart4.
There is a growing amount of evidence that supports the involvement of oxidative
stress in many pathological processes, including rheumatoid arthritis, arthritis, asthma,
diabetes mellitus, cancer, atherosclerosis, macular degeneration, chronic fatigue
syndrome, inflammatory bowel disease, environmental sensitivity, fibromyalgia, and
neurodegenerative diseases such as Parkinson’s and Alzheimer’s1. Oxidative stress is not
a disease entity, but rather a state in which the body's antioxidant defenses cannot
adequately neutralize reactive oxygen species (ROS)1.
While the generation of reactive oxygen species (ROS) is a by-product of cellular
respiration, ROS does increase with increasing intensity of exercise5. As well, physical
overtraining can also increase oxidative stress5. According to a study by Margonis et al.,
three weeks of six days per week of high intensity resistance training increased TBARS
by 56% while reducing GSH by 31%, and total antioxidant capacity (TAC) by 20%6. As
a result of increasing oxidative stress levels, athletes can experience greater fatigue,
muscle damage, and increased recovery time5. When an athlete experiences any of these

3
symptoms they may not be able to perform to their fullest potential. However, individuals
whom perform endurance training on a regular basis can increase enzymatic SOD and
GPX by 25-35% within the muscle7, and 45% in blood6. Endogenous antioxidants
catalase (CAT), and glutathione (GSSH) can also be activated along with SOD and GPX
by an acute bout of exercise at sufficient intensity1,8. The results of previous studies have
demonstrated that the combined response of an antioxidant-rich diet plus antioxidant
supplementation may provide a synergistic effect together5.
As previously mentioned, nutritional supplementation with antioxidants has been
recognized as a way to provide faster recovery, reduce injuries, improve performance,
and further enhance overall well-being of athletes9. One study was conducted to
determine if supplementation with Resurgex Plus would reduce oxidative stress and
muscle damage in 24 college soccer players5. Resurgex Plus is made from 500 U of an
oral form of SOD and 1.5 grams of fruit polyphenols. Following twenty days of
supplementation with Resurgex Plus twice per day, there were no significant
improvements in performance compared to a placebo group5. Further results showed a
one marker of oxidative stress, lipid hydroperoxide, decreased slightly post-exercise with
Resurgex Plus supplementation (2.3 fold increase pre-workout before supplementation
vs. 1.9 fold increase post-exercise with supplementation, p = 0.067)5. Another significant
finding of the study was a decrease in muscle damage as seen by a smaller rise in creatine
kinase (p = 0.044) post-workout compared to pre-workout supplementation5.
In order to advance the scientific evidence supporting the beneficial value of
antioxidants for athletes, further research needs to be done. A number of studies have
evaluated the effects of antioxidant supplementation, such as Vitamin C and Vitamin E 9-

4
15. According to a study by Poljsak15, evidence suggests that supplementation of
antioxidants no not provide adequate protection against oxidative stress, oxidative
damage, or increased lifespan. Therefore, more research needs to be performed in the
area of antioxidant supplementation.
Protandim® marketed by LifeVantage Corporation, is a nutritional supplement
comprised of five phytochemicals components supposedly activates the Nuclear factor
(erythroid-derived 2)-like 2, (called Nrf2) transcription factor pathway that is integral to
several antioxidant enzymes, including γ-glutamyl cysteine synthase (an enzyme that
catalyzes the committed step in glutathione synthesis)74. Nrf2 is a basic leucine zipper
protein that regulates the expression of antioxidant proteins that protect against oxidative
damage triggered by injury and inflammation. Protandim® may induce other endogenous
antioxidant enzymes, such as SOD and catalase, while decreasing lipid peroxidation16.
In the past 10 years, there have been some studies published using
Protandim®16,20-24,73 but only three were assessed in human subjects16,20,73. Two of those
studies examined long-term oxidative damage assessed by serum lipid peroxides
(Thiobarbituric acid-reacting substances: TBARS) and found a 20 to 40% decrease in
plasma TBARS after 30 days of Protandim® supplementation16,73. However, the Nelson
study was not randomized and not placebo controlled16. The third study, a double-
blinded, randomized, placebo-controlled trial published in 2012, examined the effect of
Protandim® on pulmonary oxidative stress and alveolar permeability in 30 recovering
alcoholics20. Protandim® was supplemented in 14 subjects at a dose of 1350 mg/day;
double the daily dose recommended by the manufacturer) or placebo (in 16 subjects)
were administered for 7 days. Relative to placebo-treatment, Protandim® had no

5
significant effects on alveolar epithelial permeability or on oxidative stress (TBARS),
epithelial growth factor, fibroblast growth factor, interlukin 1β, and interlukin-10 levels
in bronchoalveolar lavage fluid. Treatment with placebo, however, produced a significant
reduction in plasma levels of TBARS by ~28%20. Thus, there is only ~47 subjects to date
that has been given Protandim® in humans in scientific research studies.
As such, due to the limited research on Protandim® in humans, it is necessary to
add to the scientific literature on this supplement. There are no studies evaluating the
effects of Protandim® supplementation on endurance performance or subjective measures
of quality of life according to the WHOQOL-BREF17. This study will address these
issues.
Significance of the Study
A nutritional supplement is a product taken orally that contains a dietary
ingredient intended to supplement the diet18. These include vitamins, minerals, herbs, or
other botanicals, amino acids, and substances18. These include nutritional supplements
that may help a recreational exerciser, elite athlete, or every day person improve their
overall health and well-being18.
The results of this proposed study are important because it may provide an easy,
practical, and scientifically proven antioxidant supplement regime for athletes to reduce
their resting and post- 5-km oxidative stress levels as well and improve performance
outcome. If the research hypothesis is correct and oxidative damage is reduced at rest and
post 5-km race, athletes may have improved athletic performance during competitions.
Also, as a result of the frequency, intensity, and time demanded for a varsity cross-
country or track athlete to train for their sport, it is very important for athletes to practice

6
the best known nutritional practices based on scientific evidence in order to continually
improve their performance (running time) and overall health and well-being.
Not only could this study examine the effect of Protandim® on running
performance, but this study could also assess either the physical or mental components of
quality of life according to the WHOQOL-BREF questionnaire17. Therefore, the results
of this study are advantageous for athletes looking to improve their personal performance
by decreasing oxidative stress level, while simultaneously improving quality of life.
The results of this study are important for sports practitioners so they can
determine each athletes antioxidant needs to perform a specific sport. Protandim®
supplementation may also impact the overall well-being of the athlete allowing for faster
recovery, and a reduced number of injuries9. Finally, assessing blood markers of
oxidative stress allows evaluation of one's reduction/oxidation ("redox") balance which
can identify imbalances and prevent chronic illnesses19.
Purpose of the Study
The main objective of Protandim® supplementation is to reduce oxidative stress
created in the body16. Since oxidative damage is connected to many diseases endpoints,
determining the effectiveness of Protandim® at reducing oxidative stress produced
following endurance performance may provide reliable and beneficial answers.
Currently there are no studies that have examined the effects of Protandim®
supplementation on oxidative stress and endurance performance, although a similar study
was conducted supplementing with a proprietary antioxidant and nutraceutical blend5.

7
The purpose of the present study was to evaluate the effect of ~90 day
Protandim® supplementation on 5-km running performance on acute and long term
oxidative damage as assessed by serum lipid peroxides (Thiobarbituric acid-reacting
substances: TBARS). Secondarily, another purpose of this study was to evaluate the
effect of Protandim® supplementation on measures of quality of life. The experiment
was a double-blind, placebo controlled study.
Research Questions & Hypotheses
The study will address four specific research questions:
1. Does regular supplementation of Protandim® (675 mg/day for 90 days) reduce oxidative
damage at rest as assessed by lipid peroxides (TBARS) in well-trained runners?
Hypothesis: Based on the data by Nelson et al., oxidative damaged will be reduced by
40% (effect size = 4.8)16 .
2. Does regular supplementation of Protandim® in well-trained runners reduce the increase
in oxidative damage post-race compared to pre-race as assessed by lipid peroxides
(TBARS)? Hypothesis: Based on the data by Kyparos et al., we expect a 45% increase in
TBARS post-exercise compared to pre-exercise (effect size of 3.6)25. However, we
expect that those that are on Protandim® for 90 days will only have 31% increase in
TBARS post-race (effect size = 2.5) [based on changes in pre-post lipid peroxides from
Arent et al.5]
3. Does regular supplementation of Protandim® improve 5-km running times in well-trained
runners? Hypothesis: Protandim® will improve 5-km running time by 0.5 min (SD 1-
min). This is equivalent to an effect size of 0.5. The placebo group will have no change in
performance.

8
4. Does regular supplementation of Protandim® improve any one of the four domains of
quality of life according to the WHOQOL- BREF17. Hypothesis: There will be a
statistical improvement in the quality of life post- Protandim® supplementation which a
small effect size improvement of 0.33.
Definition of Terms
For the purpose of this study, the following terms and their associated abbreviations
are defined.
1. Antioxidant – any compound that protects biological systems against the potential
harmful effect of processes or reactions that can cause excessive oxidation26.
2. Cysteine – is the rate-limiting amino acid for GSH, but also functions as an
extracellular antioxidant and is a precursor for taurine, inorganic sulfate, acetyl-
Coenzyme A, and protein synthesis. A water-soluble antioxidant27.
3. Cystine – is the oxidized disulfide form of cysteine (Cys) and is the predominant
form of cysteine in the blood due to its greater relative stability. High cystine
compared to cysteine, however, suggests a shifted redox balance and oxidative
stress27.
4. Cysteine/Cystine Ratio – is a reliable indicator of extracellular redox potential in
the body. A low ratio can indicate a redox imbalance in the body, i.e., oxidative
stress (noted in many chronic diseases)27.
5. Dietary Supplement – a product taken orally that contains a dietary ingredient
intended to supplement the diet. These include vitamins, minerals, herbs, or other
botanicals, amino acids, and substances18.

9
6. Endurance – is defined as the time limit of a person’s or animal’s ability to
maintain a specific power level during a running protocol11.
7. Free Radicals – any chemical species that has one or more unpaired electrons25.
8. Glutathione (GSH) – a tripeptide made up of Glutamine, Glycine, and Cysteine
and is the body’s most potent endogenous antioxidant. GSH has a central role in
preventing oxidative stress, functioning as an intracellular antioxidant, as well as
a detoxifying agent. Oxidative stress results when there is low GSH levels in the
body27.
9. Lipid Peroxides – When prolonged or severe, oxidative stress eventually results in
tissue damage and increased risk of disease, as indicated by an elevated lipid
peroxides (reflecting oxidative damage to lipids in the body)27.
10. Overtraining Syndrome (OTS) – is characterized by declining performance
despite an extended rest period, accompanied by physiological, biochemical,
immunological, and psychological symptoms6.
11. Oxidative Stress – Oxidative stress results when pro-oxidants are insufficiently
balanced by antioxidants, resulting in cellular damage. It is thus possible for
antioxidant levels to be normal yet still inadequate in the face of excessive ROS
production29.
12. Reactive Oxygen Species – is a general term for molecular oxygen-derived
molecules that are reactive species or that are converted to reactive species.
Reactive oxygen species causes oxidative stress1.
10
13. Redox State (or Redox Balance) – The continuous interaction between reactive
oxygen species and the cellular environment. Determines the level of oxidative
stress, which has been linked to many diseases30.
14. Superoxide Dismutase (SOD) – Are endogenous antioxidant enzymes that protect
against oxidative stress. SOD is critical for preventing the superoxide radical from
generating other highly reactive species through its interactions with iron29.
15. Total Antioxidant Capacity (TAC) – reflects the collective power of reducing
agents to neutralize free radicals for each individual29.
16. Sulphate – is produced from cysteine via sulfoxidation. Sulphate is a critical
factor as part of Phase II detoxification reactions27.
Delimitations
The participants in the study were recruited from running clubs across the local
community of Louisville. This group of participants was chosen based on the close
proximity to University of Louisville for exercise testing. The average 5-km running
times placed these runners as local or regional class runners, thus, extrapolating the
results to a higher caliber athlete may be tenuous.
Assumptions
This study will use self-reporting for data collection. Participants will adhere to
the supplement regime as directed (1 pill a day for 90 days). We also expect the runners
to provide accurate information to the research team regarding their running logs,
including the intensity, duration, and frequency of their running regime. Another
assumption we must make is that athletes will provide a best effort during each of 5-km
11
trials throughout the entire study. We must also assume the participants are not taking
any other supplements throughout the course of the study. Furthermore, we are assuming
that the runners will discontinue the use of any other supplement prior to the start of the
study and not take any other supplement throughout the course of this study. Lastly, we
assume the athletes are maintaining their fitness level throughout the duration of the
study.

12
LITERATURE REVIEW
Background on Oxidative Stress Testing
As previously stated, through normal human activity every day- detoxification of
pollutants, immune defense, and energy production, free radicals are produced in the
body. Continual free radical production can be damaging to the human body causing
greater risk of disease and aging. However, free radical production can be controlled and
counter-balanced by antioxidants present in our body and from supplementation. Therein
lies the importance and benefits of oxidative stress testing.
Oxidative stress testing is used to assess equilibrium between oxidative damage
and antioxidant reserve in the body. The first measure of oxidative stress testing
addresses antioxidant reserve, which provides protection against free radical damage and
is necessary for healthy functioning of neural, immune, endocrine, and detoxification
systems in the body29. Our body’s antioxidant reserve includes glutathione, total
antioxidant capacity (TAC), cysteine, sulphate, cysteine/sulphate, cystine, and
cysteine/cystine ratio29. The second measure of oxidative stress testing in the blood is
enzyme protection29. The components of enzyme protection, superoxide dismutase
(SOD) and glutathione peroxides (GPx), provide essential defense against oxidative
damage29. The last measure of oxidative stress testing is tissue damage. Tissue damage is
measured by lipid peroxides in the blood and can determine the amount of imbalance

13
between free radical production and antioxidants. However, the measured amount of lipid
peroxides is far to general and lacks specificity of the location of the oxidative stress
within the body. When lipid peroxides in the blood are high, oxidative damage occurs.
Table 1 shows the reference ranges for each measure of protection, enzymes, and damage
from blood samples29.
Blood Measurements of Oxidative Stress
ANTIOXIDANT RESERVE
The strongest most powerful endogenous antioxidant produced by the body is
glutathione (GSH). Glutathione has many roles as an antioxidant such as detoxification of
xenobiotics, which are found in pesticides and plastic, as well as prevention of many
disorders and chronic diseases4. When glutathione levels are deficient, individuals are at a
higher risk for heart disease, AIDS, stroke, diabetes, Parkinson's and Alzheimer's disease,
cancer, and inflammatory bowel disease4. Glutathione is a tripeptide composed of amino
acids cysteine, glutamic acid and glycine, which synergistically work to prevent oxidative
stress4.
When free radicals are produced in the body GSH synthesis is upregulated to
reduce inflammation and protect the body from harmful damage. GSH concentrations are
not unlimited and when stores in the blood and tissues become depleted they need to
become replenished27. According to the Interpretive Guidelines by Genova Diagnostics27,
low GSH is associated with reduced antioxidant capacity, reduced ability to detoxify
environmental toxins and byproducts of metabolism, compromised gut lining, decreased
immunity, reduced exercise endurance, and lastly, reduced SAMe synthesis and
14
methylation. S-Adenosyl-L-methionine (SAMe) is synthesized from L-methionine and
ATP in a 2-step reaction where the complete tripolyphosphate moiety is cleaved from
ATP as SAMe is being formed27.
There are a number of treatment options to increase glutathione levels in the
blood. These include: 1) consuming a diet rich in antioxidants (which will be discussed
later), 2) supplementation (e.g. digestion support, GSH and/or its building blocks and
cofactors, B2, B6, B12, and folic acid), 3) additional supportive nutrients (e.g. vitamins C
& E, plant-based antioxidants, B5, selenium, zinc, and bioflavonoids)27.
Total Antioxidant Capacity (TAC) is defined as the total amount of all
antioxidants in a person’s blood27. TAC is the overall cumulative effect of all
antioxidants to neutralize free radical damage and prevent oxidative stress to tissues27.
Similar to GSH, low TAC has been observed in individuals with heart disease, metabolic
syndrome, major depression, sepsis, fibromyalgia inflammatory bowel disease, cancer,
sulfite excess, and hypertension27.
In order to neutralize ROS in the blood it is important to first identify the cause of
oxidative stress such as from infection, inflammation, toxic metal exposure etc27. Once
the cause of oxidative stress is known, treatment options include a diet rich in
antioxidants, as well as a combination of fat-soluble and water-soluble antioxidants
including vitamins C, E, and A, GSH and precursors and cofactors, beta-carotene,
Coenzyme Q10, and epigallocatechin gallate (ESCG- green tea extract) to name a few27.
Increasing TAC is most effectively done when more than one treatment option is
performed since TAC encompasses the whole antioxidant levels in the body27. TAC
measurement is the best indicator of antioxidant levels in the blood and tissue27.
15
A third antioxidant reserve measured in the blood is Cysteine. Cysteine is a semi-
essential amino acid and functions as a rate-limiting amino acid in GSH synthesis27.
Cysteine also serves as a precursor for the amino acid taurine, inorganic sulfate
(important for detoxification), acetyl-Coenzyme A, and protein synthesis27. When low
levels of Cysteine are observed in the blood there is reduced antioxidant capacity as well
as a reduced ability for the body to form GSH27. Individuals with low GSH are at a higher
risk for oxidative stress and many chronic diseases27.
A fourth blood measurement of oxidative stress is the Cystine and the
Cysteine/Cystine Ratio27. Cystine is the oxidized form of cysteine (Cys), and when levels
of cystine are high, oxidative stress is present27. A low cysteine/cystine ratio is also
associated with a redox balance in the direction of oxidative stress27. Low ratios are
linked to aging, smoking, and chronic conditions such as atherosclerosis, amyotrophic
lateral sclerosis (ALS), Parkinson's and Alzheimer's disease, diabetes, cancer, persistent
atrial fibrillation, and cataract formation in the eyes27.
A fifth measurement of oxidative stress in the blood is the Sulfate and the
Cysteine/Sulfate Ratio27. Sulfate is produced from Cysteine by means of sulfoxidation.
Sulfates role in the body is detoxification27. Therefore, when individuals have a low
cysteine/sulfate ratio and/or low sulfate in the blood, they are at a greater risk of leaky
gut, environmental illness, food sensitivities, rheumatoid arthritis, motor neuron disease,
Alzheimer's and Parkinson's disease, and gastrointestinal tract problems27. When high
concentrations of sulfate are observed in the blood it can directly lower total antioxidant
capacity (TAC) as well as increase lipid peroxides as a result of oxidative stress27.

16
ENZYME PROTECTION
The human body classifies cellular antioxidant defenses into two categories:
enzymatic and nonenzymatic antioxidants27. The main antioxidant enzymes that provide
a vital defense against oxidative stress are superoxide dismutase (SOD), glutathione
peroxides (GPX), and catalase (CAT)27. Both SOD and GPX are endogenous
antioxidants, meaning they are produced by the body and therefore provide the greatest
protection against oxidative stress4. Superoxide dismutase is the first line of enzyme
defense against free radical production by removing one-electron dismutation of oxygen
(O2) to hydrogen peroxide (H2O2) 4. Glutathione peroxides catalyses the reduction of
H2O2 and organic hydroperoxide to water and alcohol, respectively, using GSH as the
electron donor4. Glutathione serves as a substrate for GPX to remove hydrogen and
organic peroxides (e.g. Lipid peroxides)4. GSH is then oxidized to oxidized glutathione
(GSSH) by donating a pair of hydrogen ions3. Reduced glutathione measured in the blood
can adequately reflect the redox status (oxidative stress) of skeletal muscle and the heart4.
Imbalances in SOD levels have been linked to Parkinson's and Alzheimer's disease, ALS,
neurological diseases, Down's syndrome, impaired glucose tolerance, diabetes, dengue
fever, and cataracts27. GPX is considered an irreplaceable antioxidant in the mitochondria
of the cell because mitochondria do not contain catalase for protection against
peroxides27. Imbalances in GPX are linked with accelerated aging, as well as chronic
disorders such as cardiovascular disease, cancer, diabetes, Alzheimer's disease, alcohol-
induced oxidative stress, cholecystitis (inflammation of the gallbladder), and urticaria (a
rash of round, red welts on the skin that itch intensely, sometimes with dangerous
swelling, caused by an allergic reaction)27.

17
DAMAGE
The final measurement included in oxidative stress testing is lipid peroxidation.
The oxidation of lipids, also known as lipid peroxidation, is a marker of injury caused by
free radical damage to polyunsaturated fatty acids (PUFAs), suggesting that production of
ROS has been inadequately imbalanced by antioxidants27. In the face of excessive ROS it
is possible for antioxidant levels to be normal, however still inadequate due to high levels
of ROS production27. Lipid peroxidation in cell membranes can result in cellular
dysfunction and is associated with increased risk of disease27. Normal lipid peroxide
values demonstrate the ability of antioxidants to prevent oxidative stress, and therefore
oxidative damage has not occurred27.
Earliest Research on Oxidative Stress and Exercise
The earliest research conducted in the area of oxidative stress and exercise was
performed in the fifties and showed evidence of free radicals present in muscles with
exercise31. Further studies conducted in 1980 by Koren et al.,32 showed that when limb
muscles are stimulated to contract repeatedly, free radical content in the muscle tissue
and blood were elevated. Following these findings, research was performed in 1982 by
Davies et al.,33 which demonstrated free radical production in skeletal muscle of rats after
running until exhaustion. Another study performed 10 years later by Vina et al., showed
that a single bout of exhaustive exercise causes oxidative stress but only when the
exercise is exhaustive12. The findings of these three studies were just the beginning of
research on oxidative stress and exercise.

18
Exercise Frequency, Intensity, and Duration Effecting Free-Radical Production
The intensity at which an individual exercises does affect the amount of free
radicals produced. Low-intensity exercise causes lower free radical production and
typically does not exceed antioxidant capacity, therefore it does not result in oxidative
stress34. However, the higher the intensity of exercise an individual performs, the greater
the free radical production and oxidative stress34.
When an individual performs moderate intensity physical activity there is mild
tissue trauma which decreases during recovery6. When moderate physical activity is
performed on a regular basis the human body is able to adapt to the stress from exercise
and athletic performance improves6. When exercise volume, intensity, or frequency are
increased too much all together or individually, the body is not able to recover quickly
enough and tissue damage results6. If intense training continues for a prolonged period of
time the individual will experience a decline in performance accompanied by
biochemical, physiological, psychological, and immunological symptoms6. In exercise
and sports, this is called Overtraining Syndrome. Overtraining syndrome has been
reported to produce high levels of free radicals, causing oxidative damage6. According to
a study by Margonis et al., there is a dose response relationship between training load and
oxidative stress biomarkers, were exercise induced overtraining elicits a significant
response of oxidative stress biomarkers6.
The effects of overtraining also have an impact on maximal strength performance.
Overtraining causes prolonged muscular strength deterioration and is associated with
ROS-induced muscle damage. Margonis et al., investigated responses to oxidative stress
biomarkers to a resistance training protocol of progressively increased and decreased
19
volume and intensity6. Twelve males (21 (SD 2) participated in the 12-week resistance
training program consisting of five three-week periods of varying frequency, intensity
and duration for each group, followed by a three week period of rest6. They showed that
when a decline in maximal strength performance was observed, biomarkers of oxidative
stress reduced glutathione/oxidized glutathione (GSH/GSSG) and urinary F2-
isoprostanes (F2-IsoP) increased6. The results of blood samples demonstrated that
TBARS increased following overtraining by ~56%6. A second finding showed exercise-
induced oxidative stress, observed by lipid peroxide levels, may not reach peak levels
immediately post-exercise and may has a delayed response6. This was proven in the
present study when TBARS elevated (40-70%), at 48 hours post-exercise in the strenuous
exercise group6. Higher TBARS concentrations 48 hours post-exercise were likely caused
by lipid peroxidation of low density lipoproteins (LDL) in the blood cause injury to
muscle cell membranes6. Therefore, overtraining results in an increase in oxidative stress
biomarkers that are proportional to the frequency, intensity, and duration of the training
protocol6.
In the same study by Margonis et al., the antioxidant glutathione (GSH) decreased
by ~30% in the blood following overtraining only, and ~20% following intense resistance
exercise, but both returned to normal levels soon after6. Lower training intensities and
volumes did not have a significant effect on participants’ glutathione levels and therefore
adequate levels of GSH were present prior to exercise to counterbalance the small
amount of free radicals produced6. Total antioxidant capacity (TAC) increased following
light and intense training, but decreased following overtraining6. The increase in TAC
levels can be explained by an elevation in uric acid6. Uric acid accounts for

20
approximately one-third of TAC in the body and is elevated post-exercise to
counterbalance free radical production6.
There have been numerous studies showing the effects of oxidative stress
following extreme exercise (indicated by increases in plasma TBARS), but there has only
been one study performed on rats that investigated endurance exercise overtraining35.
However, the results of the study were not significant in showing endurance exercise
overtraining causes an increase in oxidative stress, likely because the training protocol
was not strenuous enough in nature35.
As previously stated, exercise duration does effect the amount of oxidative stress
produced in the body. In a study by Revan et al., short duration high intensity exhaustive
running of ~4 minutes in duration was performed by males approximately 24 years of
age8. They examined lipid peroxidation, antioxidant status and muscle damage post-
exercise8. The results of this study showed a non-significant decrease in GPX levels in
the blood, which demonstrates that there is likely a relationship between exercise
performed to exhaustion (intensity) and the duration of the exercise performed8.
Numerous studies have investigated the effects of short duration exhaustive
exercise and endurance exercise on oxidative stress level but only one has compared the
blood redox status at rest and post-exercise in two groups of rowers, a group that showed
exercise-induced hypoxemia during rowing, and a group that did not25,28. The two groups
of trained rowers showed no significant difference in baseline redox status, however both
groups showed significant increases in oxidative stress levels post-2000-m row, observed
by increases in serum TBARS, protein carbonyls, catalase activity and TAC25,28.
Therefore, despite differences in oxygenation during exercise between the two groups,

21
well-trained rowers showed similar and significant post-exercise increases in oxidative
stress25,28.
Chronic Training and its Effects on Oxidative Stress
There is a lack of research performed on humans regarding whether chronic
exercise training produces less oxidative stress. Recent studies performed on mice have
shown that ROS can exert favorable effects in the process of training adaptation36. With
chronic training there is an up-regulation of endogenous antioxidant enzymes such as
mitochondrial superoxide dismutase (MnSOD), glutathione peroxidase, and γ-
glutamylcysteine synthetase (GCS) 36. The up-regulation of these antioxidants results
from the cumulative effects of repeated exercise bouts36. However, the exercise intensity
must be sufficient enough to stimulate ROS and therefore cause an up-regulation of
endogenous antioxidants36. Not only has chronic training in animals resulted in less
oxidative stress compared to untrained animals, but regular exercise has also shown to
prevent chronic diseases and increase longevity 11,36. In a similar study, when
antioxidants were administered to rats before regular training, these training adaptations
were diminished because the antioxidants interfered with muscle cell adaptation36.
However, when exercise training was exhaustive in trained rats, results showed it was
beneficial to consume an antioxidant supplement since the generation of ROS would
overwhelm endogenous antioxidant defences36.
Acute and Long Term Effects of Lipid Peroxidation, TAC, GPX, and SOD.
Acute exercise training can promote oxidative stress within the blood. One of the
most widely used measurements of oxidative stress is plasma thiobarbituric acid-reactive
22
substances (TBARS)25. TBARS is a strong marker of lipid peroxidation that reflects
oxidative damage to polyunsaturated fatty acids within the cell membranes of our DNA25.
At rest and during exercise, serum TBARS elicits a moderate to strong correlation with
lipid peroxide values within the heart muscle (r= 0.71 and r= 0.99 respectively), and a
strong and moderate correlation (r=1.0 and r= 0.68) at rest and during exercise with the
liver25. In the review of literature on the acute effects of intense exercise on oxidative
damage, as represented by lipid peroxidiation obtained from serum blood samples, there
was a mean increase in oxidative damage with an standardized mean difference (or effect
size) +1.6 using a random effects model (n = 282 subjects, 22 studies, Figure 1 5,8,25,38-56).
The preponderance of data suggests that acute intense exercise increases serum lipid
peroxide from pre- to post exercise. Therefore, it can be stated that an acute bout of
strenuous exercise bout can promote oxidative stress within the blood35.
In the review of literature on the acute effects of intense exercise on superoxide
dismutase concentration from serum blood samples, there was a mean increase in the
concentration of this antioxidant enzyme in the blood with an standardized mean
difference (or effect size) +1.2 using a random effects model (n = 85 subjects, 8 studies,
Figure 2 40,42,45,48,50,51,54,55). The prevalence of data suggests that acute intense exercise
increases serum superoxide dismutase from pre- to post exercise.
Based on the findings of 11 studies investigating the acute effects of intense
exercise on glutathione peroxidase concentration from serum blood samples, there was a
mean increase in concentration of this antioxidant enzyme in the blood with a
standardized mean difference (or effect size) +0.8 using a random effects model (n = 167

23
subjects, Figure 3 8,19,40-42,45,49,50,52,54,55). According to these findings, acute intense
exercise increases serum glutathione peroxidase from pre- to post exercise.
Several studies have analyzed the acute effects of intense exercise on total
antioxidant capacity (TAC) concentrations from serum blood samples. Based on the
results of 9 studies, there was a mean increase in this parameter showing a standardized
mean difference (or effect size) +1.2 using a random effects model (n = 143 subjects,
Figure 4 13,19,25,28,38,39,45,48,49,52). Data taken from Kyparos et al.25,28 seemed to be the same
data published in both articles, therefore nine studies were used in the meta-analysis. The
data suggests that acute intense exercise increases serum total antioxidant capacity from
pre- to post exercise.
Based on a review of literature performed looking at the long term effects of
chronic training on oxidative damage, as represented by lipid peroxides obtained from
serum blood samples in a rested state after a period of long term training, there was no
statistical effect of long term training on serum lipid peroxide using a random effects
model (n = 61 subjects, 5 studies, Figure 5 43,49,52,55,57). The data from these studies
suggests that long term chronic training has no effect on serum lipid peroxides taken at
rest after long term training.
A literature review was performed to determine the long term effects of chronic
training on superoxide dismutase, as obtained from serum blood samples in a rested state
after a period of long term training. There was no statistical effect of long term training
on serum superoxide dismutase values using a random effects model (n = 26 subjects, 2
studies, Figure 6 55,58). Based on these two studies, data suggests that long term chronic

24
training has no effect on serum superoxide dismutase taken at rest after long term
training.
Based on four studies that investigated the long term effects of chronic training on
glutathione peroxidase, as obtained from serum blood samples in a rested state after a
period of long term training, there was no effect of long term training on serum
glutathione peroxides values using a random effects model (n = 53 subjects, Figure 7
49,52,55,58). Based on these results, the data suggests that long term chronic training has no
effect on serum glutathione peroxides taken at rest after long term training.
A review of literature was performed on the long term effects of chronic training
on total antioxidant capacity, as obtained from serum blood samples in a rested state after
a period of long term training. There was no effect of long term training on serum total
antioxidant values using a random effects model (n = 42 subjects, 4 studies, Figure 8
43,49,52,57). The data suggests that long term chronic training has no effect on serum total
antioxidant capacity taken at rest after long term training.
Sources of Antioxidants in Food
At the present time, there is not a recommended daily amount of antioxidants an
individual should consume on a daily basis59. The amount of antioxidants each person
should have will be different depending on activity levels and competition goals59. A diet
high in antioxidants can fend off exercise-induced oxidative stress and promote training
adaptations9.
Reducing exercise-induced oxidative stress takes dietary planning. High amounts
of antioxidants can be found in fruits and vegetables9. The brighter the fruit or vegetable
is, the higher its antioxidant content9. In general, each color group of fruit or vegetable

25
represents a class of antioxidants9. It is recommended that individuals consume a few
servings from each color group every day for optimal health9.
Research has shown that the body's ability to produce its own internal endogenous
antioxidant enzymes (SOD, GPX, and catalase) is more effective in fighting free radicals
than consuming an antioxidant supplement11. In a study by Jacob et al.,60 normal healthy
men (both smokers and non-smokers) with low intakes of fruits and vegetables consumed
a moderate supplement of vitamins E, C, and folic acid to reduce oxidative stress. The
results of the study showed no significant change in normal healthy males oxidative
stress levels with supplementation of vitamins E, C, and folic acid60. A similar study
performed by Van den Berg et al.,61 and Moller et al.,62 showed that supplementation
with a daily intake of 600 grams of fruits and vegetables or supplementation with a
concentrate of fruits and vegetables results in no significant effects on markers of
oxidative stress. Therefore, there appears to be no improvement in reducing oxidative
stress through antioxidant supplementation16.
The Effects of Antioxidant Supplements on Health
Most research conducted using nutritional antioxidants are vitamins E and C63.
The optimal antioxidant intake is one that minimizes the incidences of both deficiency
and toxicity9. For example, when doses of vitamin E are excessively high, it may
interfere with vitamin K metabolism as well as platelet function64. Other antioxidants
such as selenium, vitamin C, and vitamin E in high does can act as pro-oxidants in the
body. Excessive high doses of zinc has also been associated with depressed immune
functioning64.

26
The results of these studies lead us to believe that high-dose antioxidant
supplementation may disrupt our body's natural antioxidant defense against ROS. Since
approximately 70% of the U.S. population uses isolate high-dose antioxidant supplements
at least occasionally and 40% uses them on a regular basis, individuals may be causing
more harm than good to their body every day11.
Currently, there is debate as to whether athletes should consume high doses of
antioxidants to help reduce the increased production of ROS. However, research as early
as 1971 reported that vitamin E supplementation (400 IU daily for 6 weeks) had no
benefits, but did have result in unfavorable effects on the adolescent swimmers endurance
performance65. More recently, a study was performed to determine the effects of vitamin
C supplementation on training-induced increases in aerobic capacity and endurance, and
on skeletal muscle mitochondrial biogenesis in rats and humans11. The results of the
study showed vitamin C supplementation significantly reduced endurance capacity in
rats, and did not improve aerobic capacity in both humans and rats11. Vitamin C
supplementation prevented the activation of antioxidant enzymes in skeletal muscle when
exercise was performed11. Vitamin C supplementation also hindered endurance
swimmers’ mitochondria biogenesis in skeletal muscle, which is directly related to
endurance capacity11. Thus, since endurance capacity may be negatively affected by
vitamin C and E supplementation, athletes should not consume high-dose vitamin C and
E supplements since it could hamper their performance11.
Antioxidant Supplementation and Athletes
Athletes are normally the healthiest and fittest individuals, yet ironically athletes
are among the highest consumers of supplements on the market today59. Athletes are

27
generally those with 1) the healthiest diet that is high in fruits and vegetables, 2) non-
smokers, and 3) have a regular, structured exercise program59. Through regular training
on a daily basis and a progressive training load, an individual's antioxidant reserve adapts
and is able to produce enough antioxidant enzymes to rid the blood and muscle tissue of
ROS more rapidly 41,59. However, the speed at which each individual’s endogenous
antioxidant reserve adapts to a training load differs59. The adaptive response is the
function of individual factors such as the type of exercise performed, the age of the
individual, the training period and level, environmental conditions, and lastly inter-
individual differences59.
Athletes are always seeking out ways to improve their performance and the best
method may require improving their daily nutrition and removing foods and drinks which
cause ROS (e.g. alcohol)59. A healthy diet can play a protective role in reducing ROS
produced throughout the day and during exercise when ROS levels are higher59. The
adequate intakes of antioxidant micronutrients for athletes is unknown because it has
been poorly investigated in the past59.
Traditionally, antioxidant supplements have been prescribed to athletes
undergoing intensified training protocols to aid in the maintenance and balance of
oxidative, inflammatory, and neuro-endocrinological systems2. However, the excessive
nature in which some individuals’ intake antioxidant supplements may suppress redox
signaling processes and reduce the benefits of regular training within the cell2.
Nevertheless, at the present time there are findings reporting the potential of antioxidant
supplements to interfere with the body's ability to adapt to exercise, causing reduced
performance2.

28
Future research should focus on the amount of antioxidant supplementation
athletes require to improve athletic performance without interfering with cellular
signaling processes2,59 .
Sex Differences and Inter-Individual Differences
Research has shown that gender is a determinant of aging and an individuals' life
span, however little is known about free-radical homeostasis differences between males
and females66. Many factors contribute to the aging process, but it is known that free
radicals play a key important role66. Since it has been demonstrated that females have a
longer life span than males, it is believed that females live longer as a result of lower
oxidative stress levels66. Further research has reported gender differences influence the
adaptation to changes in antioxidant capacity66. Studies has shown that males and females
have different ROS production following exercise66.
According to a study by Mullins et al., there were no significant differences in
changes in protein carbonyls (PC), GPX, and TAC between females and males following
a maximal treadmill exercise test to exhaustion19. However, males were found to have a
higher GPX pre-exercise compared to females, as well as higher post-exercise TAC and
GPX values compared to females following a maximal treadmill exercise test19. Although
there were no significant changes in PC, GPX, and TAC levels between males and
females, it is believed there is a large inter-individual difference in exercise-induced
changes in oxidative stress and antioxidant biomarkers, suggesting there may be
responders and non-responders to exercise induced oxidative stress19.
29
Resurgex and its Effects on Oxidative Stress
Nutritional supplementation with antioxidants have been discussed as a way to
further enhance overall well-being for athletes, faster recovery, minimization of injury
time, and overall improved performance9. One study used Resurgex Plus (which includes
500 U of an oral form of SOD and 1.5 grams of fruit polyphenols) in 24 fit male college
division 1 soccer players to determine if supplementation decreased muscle damage and
reduced oxidative stress5. The experimental group consumed Resurgex supplements 2x
per day for 20 days and results showed no improvement in performance compared to the
placebo group5. However, with Resurgex supplementation, lipid hydroperoxide seemed
to be blunted post-exercise compared to pre-exercise (2.3 fold increase in lipid
hydroperoxide before supplementation, to 1.9 fold increase post-supplementation, p =
0.067)5. A second finding of the study was a lower resting CK (creatine kinase)
compared with the control group5. The rise in creatine kinase (a marker of muscle
damage), post-workout compared to pre-workout was smaller with the supplementation5.
Protandim® Marketed by LifeVantage Corporation
A current nutritional antioxidant supplement on the market is Protandim®
marketed by LifeVantage Corporation. Protandim® is comprised phytochemicals,
specifically five botanical sources (675 mg/day containing 225 mg of milk thistle, 150
mg of bacopa extract, 150 mg dose of ashwagandha root, 75 mg of turmeric, and 75 mg
green tea)16. These phytochemicals are thought to help the body to produce its own
antioxidant enzymes and lower oxidative damage in blood/tissues. Protandim®
supplementation has shown to reduce lipid peroxidation in the blood in humans16,73 .

30
In a study by Nelson et al., subjects were assigned to one of two groups16. Twenty
subjects were assigned to Group 1 and received the full supplement of Protandim® (675
mg) in a single daily capsule for 30 days16. Twelve subjects from Group 1 continued
supplementation for a total of 120 days. Group 1 had blood sampling taken at 0, 30 days,
and 120 days16. Group 2 consisted of four subjects who received 338 mg/day of
Protandim® in a single capsule for 30 days16. Blood sampling was taken at 0, 5 days, 12
days, and 30 days. Oxidative stress was measured by serum blood analysis of TBARS16.
Figure 9 shows results of the study16. Figure 9 (A) shows an age-dependent
increase in TBARS in normal subjects before supplementation with Protandim®.
However, supplementation of Protandim® for 30 days caused the age-related increase in
TBARS to disappear16. When subjects were separated by gender there were no significant
differences in plasma TBARS [Figure 9 (B)]. In Figure 9 (C), subjects who self-reported
supplementation with vitamin C and E had significantly higher plasma TBARS as well as
greater age relatedness, compared to subjects who reported taking no vitamin
supplements16. Lastly, Figure 9 (D) shows TBARS levels dropped an average of 40% (n
= 20; p < 0.0001) following 30 days supplementation of Protandim®.
Figure 10 shows the results of subjects supplemented with Protandim® for 120
days on SOD activity16. After 30 days of supplementation, erythrocyte SOD increased by
8% compared to baseline, and increased by 30% compared to baseline after 120 days16.
Since erythrocytes have a circulating lifespan of 120 days, during the 120 days of the
study the red blood cells would have been replaced by maturing reticulocytes from the
bone marrow16. Therefore, it would be expected that after 120 days of supplementation,

31
100% of erythrocytes would have turned over, reflecting new steady state levels of
SOD16.
Figure 11 shows the results of Group 2 subjects who consumed half a pill per day
(338 mg/day) of Protandim® and its effects on plasma TBARS16. There appears to be a
rapid initial decrease in plasma TBARS levels occurring by 5 to 12 days post
supplementation16. Although no significant difference was not seen, these results also
showed that a full dose of Protandim® supplementation (675 mg/day) is more effective at
lowering TBARS to an average of 1.10 (0.05) μM (n = 20) versus of 1.29 (0.14) μM (n =
4)16.
Nelson et al., also concluded from the study that the age-dependent increase in
oxidative stress observed prior to supplementation was almost completely abolished
when subjects consumed the full dose of Protandim® (675 mg/day)16. The overall
reduction in plasma TBARS was 40% with Protandim® supplementation16. In conclusion,
all subjects benefited from Protandim® supplementation by experiencing reduced
oxidative stress levels observed by TBARS16. Individual differences were observed
between subjects with low initial levels of lipid peroxidation and those with higher initial
levels, where lower initial levels saw only modest declines in TBARS16.
However, the Nelson study was not a randomized, placebo-controlled study,
which would limit the study’s findings. In 2012, a double-blinded, randomized, placebo-
controlled trial examined the effect of Protandim® on pulmonary oxidative stress and
alveolar permeability in 30 recovering alcoholics20. Protandim® was supplemented in 14
subjects at a dose of 1350 mg/day; double the daily dose recommended by the
manufacturer) or placebo (in 16 subjects) were administered for 7 days. Relative to

32
placebo-treatment, Protandim® had no significant effects on alveolar epithelial
permeability or on oxidative stress (TBARS), epithelial growth factor, fibroblast growth
factor, interlukin 1β, and interlukin-10 levels in bronchoalveolar lavage fluid. Treatment
with placebo, however, produced a significant reduction in plasma levels of TBARS by
~28%20.
In 2014, an abstract was published in the FASEB journal examining the effects of
30 days of 675 mg/day of Protandim® on serum lipid peroxidation in 13 overweight
and/or obese subjects73. Ashwagandha is a banned medicinal ingredient in some
countries, so the phytochemical piperine was substituted for Ashwagandha in this study.
Serum TBARS decreased from 6.3 (3.3) to 4.9 (1.7) nmol/mL (p < 0.05), or ~28% in the
Protandim® (piperine) group. The placebo group, on the other hand, showed no change in
serum TBARS post-supplementation.
Thus, based on these three human studies to date (~47 subjects), there is still
debate as to whether Protandim® actually reduces oxidative damage as reflected by serum
TBARS.
Nrf2 Activation is the Future of Cellular Protection
Nrf2 is a protein that regulates the body's antioxidant response to oxidative
stress67,68. Nrf2 has been called the 'thermostat' within our cells because it can determine
the level of oxidative stress and initiate an antioxidant protective response to combat the
stress67,68. Nrf2 activation enables our cells to use their own antioxidant reserve from
naturally-occurring and plant-derived activators, such as sulforaphane from broccoli and
curcumin from turmeric67,68. Some Nrf2 activators are synthetic compounds and thus
must be developed by pharmaceutical treatments67,68. New research findings are revealing

33
that the human body's own internal network of antioxidant enzymes is approximately one
million times more protective against oxidative stress versus consumption of antioxidant
supplements on the market, such as vitamins C and E67,68 . Therefore, the future of
cellular protection may lie in Nrf2 activation.
The ingredients in Protandim® by LifeVantage provide a natural option to activate
Nrf2 within the cells. As previously stated, Protandim® is comprised of five botanical
sources: bacopa monniera, silybum marianum (milk thistle), withania somnifera
(ashwagandha), camellia sinensis (green tea), and curcuma longa (turmeric), which have
been shown to change the gene expression in hundreds of genes associated with heart,
brain, and colon health16. Therefore, these research findings suggest that our cells have
the genetic resources and capability of maintaining oxidative balance and slowing the
aging process if Nrf2 can be adequately activated16.
In order to make conclusions about the effectiveness of Protandim® to reduce
oxidative stress and improve endurance performance, extensive research needs to be
conducted. There are currently no studies to date that have measured oxidative stress and
endurance performance with Protandim® supplementation, although a similar study has
been done using another supplement5.

34
METHODS
Participants
A total of 40 community runners between the ages of 18 and 55 years were sought
to participate in this study. Runners were recruited from running clubs across the local
community. Local residents of the Louisville area were targeted due to availability and
close proximity for exercise testing in the study. The runners had to be considered “local
class” or faster for 5-km time, based on USA Track-and-Field age and sex graded
performance categories78. The age- graded score is the ratio of the approximate world-
record time for that age and sex divided by the runner’s actual time. “Local class”
classified as an age and sex-graded score of 60% to 69%, “regional class” is classified as
an age and sex-graded score of 70.0 to 79.9%, “national class” is classified as an age and
sex-graded score of 80.0 to 89.9%, and “world class” is classified as an age and sex-
graded score of 90 to 100% of approximate world record time.
Procedures
This study was a double-blind, randomized, placebo controlled trial where
participants were placed into one of two groups randomly by blocks of two, controlling
for sex and running time (clinicaltrials.gov identifier: NCT02172625). The experimental
group was taking the supplement Protandim® for the entire duration of the study, whereas

35
the control group was taking a placebo (corn starch and food coloring). To control threats
to internal validity the study was a double-blind setup, the subjects’ were selected
through randomly assigned blocks of two, and there was a placebo group. Each subject
underwent six testing sessions, with five different days of blood draws.
Session 1 (Initial Screening Day)
Every subject was provided with an informed consent document explaining their
responsibilities and risks by participating in this study. Subjects were also instructed to
complete a physical activity readiness questionnaire (PARQ) to clear them for physical
activity69. Each participant was asked to list all the nutritional supplements they were
taking, including multivitamins.
Subjects were asked to refrain from taking any multivitamins or nutritional
supplements for the duration of the study due to the previous evidence that Vitamin E and
C supplementation affects plasma TBARS16. A training diary was given to each
participant to fill out for the entire duration of the study. Participants were asked to use
the diary to record their intensity, training duration, and mileage per week of running.
Lastly, each participant was given five quality of life questionnaires (WHOQOL- BREF)
to fill out at home for the duration of the study17. The quality of life assessments are
easily administered and do not require much time to complete. The assessment is scored
in four domains: Domain 1: Physical health, Domain 2: Psychological, Domain 3: Social
relations, and Domain 4: Environment17. The WHOQOL-BREF has a good to excellent
psychometric properties of reliability and performs well on tests of construct validity

36
(The Health and QOL R2 was 0.52 overall, with Physical = 0.32, Psychological= 0.26,
Social= 0.10, and Environment = 0.17)17.
Diet Records
To examine whether dietary changes influences lipid peroxidation and antioxidant
status outcomes, subjects were given instructions to record what they eat during the 24 hr
prior to each session. Subjects were taught how to complete the diet recall and determine
food serving and sizes. Participants were asked by a member of the research team to eat
the same thing and do same activity before the five pre-determined follow up sessions.
Session 2 (Baseline, About 15 days after Session 1)
Subjects were fasted in the morning when they arrived at University of Louisville
for their pre-exercise blood sampling. Each subject brought their 24-hr dietary recall to
the session, as well as their WHOQOL- BREF form17. Approximately three teaspoons of
blood was withdrawn 30 minutes prior to exercise for analysis of several blood
parameters (Table 1).
Following blood samples being taken, participants partook in the first of two
baseline 5-km time trials at the University of Louisville outdoor track. Time trials have
greater logical validity compared to time-to-exhaustion tests, which is the reason time-
trials were selected as the performance measure70.
Approximately 10-minutes post-exercise, another three teaspoons of blood was
taken from each subject. Only after their post-exercise blood draw were subjects able to
eat.
Participants were divided into one of two groups based on their first 5-km time

37
trial results. The participants were randomly assigned in blocks of two so that number of
males and females per group would be similar and the average 5-km performance time
per group would be similar. Based on the first baseline 5-km results, all the women and
men were ranked from fastest to slowest based on their 5-km performance from this
session. Women were ranked amongst themselves, and then the men were ranked
amongst themselves. The first two ranked women were grouped together and then a coin
was flipped. If the coin came up heads, the first ranked woman of the pair was placed in
Group 1, if the coin came up tails, the second ranked woman in that pair would be placed
in Group 1. This would then continue for the next two fastest women, and so on. The
men were then randomly assigned into one of two groups the same way, in groups of two,
with the first two ranked males placed together, and randomized by a coin toss, and then
the next two ranked males were placed together, and then randomized by a coin toss, and
so on.
Session 3 (About 7 days after Session 2)
Subjects were fasted in the morning when they arrived at University of Louisville
for their pre-exercise blood sampling. A member of the research team collected each
participants’ post- 24-hr food diary and their WHOQOL- BREF forms17. Approximately
three teaspoons of blood was withdrawn 30 minutes prior to exercise for analysis of
several blood parameters (Table 1). Following participants blood being drawn, each
subject was required to partake in another baseline 5-km time trial at the University of
Louisville track.
38
At approximately 10-minutes post-exercise, another three teaspoons of blood was
taken from each subject. Only after their post-exercise blood draw were subjects able to
eat.
Then, depending on the group, subjects were given either a ~90 day supply of
Protandim® pills (US Protandim® Lot# X14-0901) or ~90 supply of placebo pills (corn
starch and food coloring). Since the study was double-blinded, neither the researchers nor
the subjects knew which pills they were ingesting. Subjects were instructed to ingest one
pill per day, ideally with breakfast (675 mg per day, for ∼90 days). The subjects were
also given a signs/symptoms form, where they were asked to report any signs/symptoms
they had during the supplementation period, such as diarrhea, stomach aches, nausea
etc…
Session 4 (~30 days post-supplementation)
At session four, participants arrived fasted in the morning at the University of
Louisville for their pre-exercise blood sampling. Each subject brought their 24-hr dietary
recall with them and their WHOQOL- BREF forms17. The forms were collected by a
member of the research team. Participants had approximately three teaspoons of blood
drawn. There was no 5-km running race performed at this session.
Session 5 (~60 days post-supplementation)
At session five, participants arrived fasted in the morning at the University of
Louisville for their pre-exercise blood sampling. Each subject brought their 24-hr dietary
recall with them and their WHOQOL- BREF forms17. The forms were collected by a

39
member of the research team. Participants had approximately three teaspoons of blood
drawn. There was no 5-km running race performed at this session.
Session 6 (~90 days post-supplementation)
At session six, participants arrived fasted in the morning at the University of
Louisville for their pre-exercise blood sampling. They each brought their 24-hr dietary
recall with them and their WHOQOL- BREF forms17, and their running logs. The forms
were collected by a member of the research team. Participants also brought with them
any unused pills for proper documentation. Participants had approximately three
teaspoons of blood drawn 30 minutes prior to exercise. Following participants’ blood
being drawn, each subject was required to partake in a 5-km time trial at the University of
Louisville track.
At approximately 10-minutes post-exercise, another three teaspoons of blood was
withdrawn from each subject. Only after their post-exercise blood draw were subjects
able to eat.
Blood sampling
Blood sampling was completed using a traditional venipuncture method with a
mix of 21 and 23 gauge needles. Both straight and “Butterfly” needles were used to
accommodate the comfort of test subjects. Blood was collected in vacuum-sealed tubes
designed to contain and preserve specimens in a manner appropriate with their respective
analysis. The tubes used were two ten-millimeter tubes designed to promote clotting and
formation of a platelet barrier that permanently separates the serum from the cellular
elements and clotting factors of whole blood, and one six-millimeter tube treated with

40
Potassium Ethylenediaminetetraacetic acid (EDTA). This not only preserves the cellular
element of the whole blood, but allows the coagulation factors to remain suspended in the
plasma. EDTA prevents coagulation in the blood via a removal of ionized calcium from
the blood, which acts as a co-factor in the coagulation cascade. The presence of
potassium in the preservative and the absence of calcium has physiological effects on
enzymatic activity within the blood, thus both samples were necessary for analysis for a
clear view of the oxidative activity within the subjects4.
Once drawn, specimens were separated and the EDTA tubes were put into
immediate refrigeration, whereas the larger gel tubes were allowed to clot for fifteen
minutes, then centrifuged at 3000 RPM (Champion F-33 Series Centrifuge, Ample
Scientific, Norcross, GA) for fifteen minutes. The pre-centrifugation clotting is necessary
to prevent fibrin, a co-factor of coagulation, from forming a gel matrix in the serum,
rendering it unsuitable for analysis. Hemolysis always being a factor in venipuncture
analysis was mitigated by ensuring proper vein selection before the procedure begins,
central placement of the needle within the vein during the procedure, and gentle rocking
of the specimens after the venipuncture to ensure uniform contact with the walls of the
tube4.
After centrifugation, the serum samples were frozen at -20°C for at least 4 hours
and then shipped overnight to Geneva Diagnostics for analyses. Genova Diagnostics is a
global, fully accredited clinical laboratory, located in Ashville, North Carolina [Licensed
by Clinical Laboratory Improvement Amendments (CLIA) Certification number
#34D0655571].

41
Blood and Serum Sample Analyses
Thiobarbituric acid-reactive substances (TBARS): This is a direct marker of oxidative
damage to polyunsaturated fatty acids within cell membranes, otherwise known as lipid
peroxidation. Serum TBARS have been shown to be correlated with oxidative damage to
certain tissues, namely heart and liver tissue at rest (r = 0.71 to 1.0) and exercise (r = 0.68
to 0.99)4. The lipid peroxide assay is designed to measure the lipid peroxidation products
in serum. After acid hydrolysis the lipid peroxidation products are reacted with
thiobarbituric acid resulting in a spectrophotometrically active product. Malondialdehyde
(MDA) is used as the standard for determination of levels of lipid peroxidation products.
The specimen type for this assay is serum obtained from a clot activated serum separator
tube. A TBARS assay kit (Cayman Chemical, U.S.), which allows a rapid photometric
detection of the thiobarbituric acid malondialdehyde (TBAMDA) adduct at 532 nm, was
used. Samples were read by a microplate reader spectrophotometer (Infinite M200,
Tecam, Austria). A linear calibration curve was computed from pure MDA-containing
reactions4.
Total antioxidant capacity (TAC): Plasma TAC, assesses an individual’s blood
specimen to inhibit an oxidation reaction. This test reveals the combination of all anti-
oxidants blood to neutralize free radicals. Plasma TAC was determined from serum using
a proprietary methodology (Genova Diagnostics, Asheville, NC). The basis for this assay
is that it measures the antioxidant capacity of a serum sample via the ability of the
antioxidants within the sample to neutralize a spectrophotometrically active compound
that is optically active when oxidized. The decrease in color intensity of the compound

42
when compared to the standard, Trolox, under the same reaction conditions is equivalent
to the serum antioxidant capacity of the serum sample. The specimen type for this assay
is serum obtained from a clot activated serum separator tube. It was measured by an
enzymatic reaction assay kit (Cayman Chemical, U.S.) using a microplate reader
spectrophotometer (Infinite M200, Tecam, Austria). This enzymatic reaction assay is
based on the ability of antioxidants in the plasma to inhibit the oxidation of 2, 2′-azinobis
(3-ethylbenzithiazoline) sulfonic acid (ABTS, Sigma) to the radical cation ABTS+ by a
peroxides. The amount of the produced ABTS+ has been assessed by measuring the
absorbance signals at 705 nm. The antioxidants concentration is proportional to the
suppression of the absorbance signal. TAC was evaluated by a trolox (6-hydroxy-2,5,7,8-
tetramethylchroman-2-carboxylicacid, Aldrich) standard curve, and was expressed as
trolox-equivalent antioxidant capacity concentration (mM)4.
Glutathione (GSH): Blood Glutathione, the most potent endogenous antioxidant, is
correlated well with muscle and heart tissue at rest (r = 0.93 to 1.0) and at exercise (r =
0.66 to 1.0)4. GSH was determined from whole blood using a proprietary methodology
(Genova Diagnostics, Asheville, NC) and is designed to measure the level of glutathione
in whole blood. The basis for this assay is a follows: The samples is first completely
lysed and proteins are precipitated. The supernatant is then reduced and combined with a
spectrophotometrically reactive compound which generates a detectable absorption peak.
When compared to known concentrations of GSH under the same reaction conditions a
determination of GSH levels in blood is determined. The colorimetric assay is performed
using the Abbott Diagnostics Architect System. The specimen type for this assay is
EDTA preserved whole blood4.

43
Superoxide Dismutase (SOD): Superoxide Dismutase (both cystolic and mitochondrial
SOD), is another protective anti-oxidant enzyme that was measured by a colorimetric
assay. Superoxide Dismutase assay is designed to measure the activity of the SOD
enzyme in red blood cell lysates. The SOD activity is determined spectrophotometrically
based on the ability of the superoxide dismutase compound to reduce reactive oxygen
species in an enzymatic reaction necessary for the production of an optically active
compound. The result is expressed as units of SOD relative to the gram amount of
hemoglobin in the sample. The colorimetric assay is performed using the Abbott
Diagnostics Architect System. The specimen type for this assay is EDTA preserved
whole blood4.
Glutathione Peroxidase (GPX): This was determined from whole blood using a
proprietary methodology (Genova Diagnostics, Asheville, NC). The Glutathione
Peroxidase (GPX) assay is designed to measure the level of glutathione in red blood cell
lysates. The level of GPX in the sample is determined spectrophotometrically based on
the ability of the compound to catalyze a reduction reaction in the presence of
glutathione. The change in the absorption level of the substrate is then utilized to
determine the level of GPX present in the sample. The result is expressed as units of GPX
relative to the gram amount of hemoglobin in the sample. The colorimetric assay is
performed using the Abbott Diagnostics Architect System. The specimen type for this
assay is EDTA preserved whole blood4.
Sulphate: Sulphate was determined from whole blood using a proprietary methodology
(Genova Diagnostics, Asheville, NC). The basis of this assay is as follows: Sulfate was
measured via a Turbidimetric Assay Kit. This assay is designed for determination of

44
sulphate levels in serum utilizing the chemical property of sulfate ions to cause the
formation of precipitates that can be measured by absorbance of light. The use of a
sulphate standard curve under the same reaction conditions facilitates the ability to
determine the level of sulphate in the serum sample. The assay is performed using the
Abbott Diagnostics Architect System. The specimen type for this assay is serum obtained
from a clot activated serum separator tube4.
Cysteine/Cystine: The assay designed for the measurement of serum cysteine is an
adaptation of the Gaitonde procedure developed for the detection of amino acids which
utilizes the colorimetric reaction of amino acids with ninhydrin. The specimen type for
this colorimetric assay is serum obtained from a clot activated serum separator tube4. A
lower cysteine to cystine ratio demonstrates a shift towards increased oxidative stress4.
Throughout the study, information was gathered through self-report at sessions
two through six ensure adherence to the program, as well as the three planned exercise
tests. Participants were responsible for bringing their weekly training log with intensity,
training duration and mileage per week of their runs as well as a food record of what they
ate during the 24 hour period prior to the test day (Session 2). Participants were asked to
eat the same thing and do the same activity before the follow up tests at 7 days and 90
days post supplementation.
Sample size calculation
The independent variable in this study was the two different supplementation
groups. The main dependent variables measured were 5-km finishing time, TBARS,
SOD, GPX, TAC, and the four domains of the WHOQOL- BREF questionnaire17. Based

45
on a 5-km time improvement of 2.5% or about 30 seconds (SD = 1 minute) with
Protandim®, and no improvement in the placebo group, about 34 runners in total were
needed (Effect size ƒ = 0.25, statistical power = 80%, alpha error probability = 5%, two
measurements per group, correlation amongst repeated measures = 0.50, F-test Family,
ANOVA repeated measures, within-between interaction, G*Power 3.1.2, Universität
Kiel, Germany). Accounting for a ~20% attrition rate (8 subjects), a total of 40 subjects
was recruited (20 per group).
Statistical Analyses
A 2 x 4 repeated measures analysis of variance (ANOVA) was chosen to compare
long term, chronic changes in blood parameters (rested, fasted state) over the duration of
the study (2 groups; 4 time-points: average baseline, 30, 60, 90 days post-
supplementation). A 2 x 3 repeated measures ANOVA compare the acute changes in
blood parameters between pre and immediately post exercise (2 groups; 3 time-points:
baseline 1, baseline 2, 90 days post-supplementation). A repeated measures design also
provided the experimenter the opportunity to control for individual differences among
participants. To adjust for multiple comparisons post-hoc, a Bonferroni correction was
used.
To compare groups, baseline subject characteristics (including anthropometric
data, environmental conditions, and resting, fasted, blood variables) were performed
using independent t-tests. If any of the variables were not normally distributed (as
verified by a Shapiro-Wilk test), then a Mann-Whitney t-test was used to compared
groups.
46
It is also important to determine the inter-session variability over time so that one
can distinguish between the inherent variability of the test, from small, real physiological
change caused by an interventional study. To compare the variability in baseline 5-km
time-trials from week-to-week, the coefficient of variation (C.V.) was calculated for each
subject and averaged [(SD ÷ mean)∙100]. To calculate the reproducibility in 5-km times,
the following was done: Reproducibility was calculated by obtaining the square root of
the mean square error obtained from a repeated measures analysis of variance obtained
from the two 5-km baseline time trials that were performed a one week period. Both
groups were placed together in this analyses because neither group as of that point was
under the influence of the supplement. The square root of the mean square error obtained
from the repeated measures ANOVA was reported as the common week-to-week within
subject standard deviation (SDw)74. Reproducibility was defined as 2.77∙SDw74. That is,
the difference between the 5-km times on different weeks for the same subject is
expected to be less than 2.77 times the within-subject standard deviation for 95% of pairs
of observations74. Since the calculation of reproducibility may be considered too
stringent, the smallest measureable change was reported as half of the reproducibility75.
Any 5-km time that was above or below the smallest measureable change was considered
a meaningful change. As well, the C.V. and reproducibility was calculated for each
domain of the WHOQOL- BREF. Furthermore, the baseline C.V. was calculated for all
blood parameters.
The baseline 5-km time was reported as the as the fastest of the two baseline 5-km
time trials. A Fisher’s exact test determined whether there was a difference between the
two groups in the number of subjects that improved by more than the smallest meaningful

47
change in 5-km time post-supplementation. A Fisher’s exact test was also used to
compare groups for the signs and symptoms reported during the supplementation period.
In order to control for differences in the exercise training regimes between the
two groups, an aerobic training index was calculated at baseline, and then again post-
supplementation. The aerobic training index was calculated as the total number of
minutes of aerobic physical activity over the previous 14 days multiplied by the average
rating of perceived exertion score over the previous 14 days (6 = no exertion, 20 =
maximal exertion. A Kruskal-Wallis one-way analysis of variance was used to compare
the training index between groups pre and post supplementation.
A Kruskal-Wallis one-way analysis of variance was also used to compare each
domain of the WHOQOL- BREF between groups during the supplementation period.
Statistical significance was set at 0.05. Statistical analyses was performed using
IBM SPSS for Windows version 21.0, released in 2012 (IBM Corporation, Armonk,
NY).
Protection of Human Subjects
Prior to group assignments, subjects were notified of the benefits and risks
associated with the study through informed consent. The protocol for the study was
discussed in detail to ensure everyone was aware of the expectations involved, and they
were informed of their rights as participants in the study. After providing this
information, an informed consent form were given to the participants to sign. This study
was reviewed and approved by Institutional Review Board (IRB) (Approval Number
14.0614).

48
Data Management and Storage
All documents and data collected was stored in a locked cabinet in a locked lab
(Dr. Zavorsky’s Lab in room 17A, Crawford Gym). This lab was locked at all times with
access granted only to the faculty advisor and three student researchers. Personal
information and data that was on a computer was stored on a locked computer with a
password needed to gain access.

49
RESULTS
Intervention Data
Forty subjects, 20 to 46 years of age were recruited to participate in this clinical
trial. These subjects were recruited through word of mouth, and through the local running
stores. One subject did not make the time-trial standard so she was eliminated from the
study, and the other subject did not continue on with the study after the informal
information session. Thus, 38 subjects were retained. The anthropometric characteristics,
baseline 5-km times, and fasting blood glucose concentration were not different between
groups (Table 2).
In the end, one female subject withdrew from the study two weeks after the
beginning of supplementation due to complaints that the supplement caused her to be
depressed. It was later determined that she was in the Protandim® group. In addition,
another female subject dropped out just before the final 5-km time trial because she was
pregnant. A male subject also did not complete the final 5-km time trial because he was
in a car accident a week earlier. However, he did have his fasted pre-exercise blood
drawn at ~88 days supplementation. Thus, there is some missing data from these 38
subjects due to these unforeseen circumstances.

50
Venous blood samples were obtained at baseline (there were two baseline
sessions one week apart from each other), and at 30 (SD 2), 57 (2), and 88 (4) days post-
supplementation. The subjects returned their pill bottles and the combined average
number of pills not taken by both groups was 3 (4), with a range of 0 to 19 pills missed.
5-km Time Trial Performance
These 38 subjects were randomized into the experimental and control groups by
random blocks of two according to gender and 5-km time trial performance. In the end,
equal number of males and females were in the Protandim® group and the Placebo group,
and both groups had similar 5-km times of ∼20.3 (2.1) minutes (Table 2). The mean
rating of perceived exertion (RPE) for the baseline 5-km time trials was 17.5 (1.7) out of
20 (6 = no exertion, 20 = maximal exertion). This mean value is qualitatively labeled
between “very hard” and “very very hard” for the effort of the 5-km runs. The data
presented in Table 2 is the best performance of both baseline time trials. The mean
coefficient of variation between both baseline 5-km time trials was 1.1% and the
correlation between both these 5-km time trials was 0.99, (p < 0.01). There was no
difference in mean 5-km time trial performance between both baseline sessions. After
removal of outliers, the reproducibility was 23 seconds, and the smallest meaningful
change was 12 seconds (half of the reproducibility). Supplementation did not change 5-
km time trial performance in either group (Figure 12-13, p = 0.91, Group x Time
interaction effect, p = 0.84). There were eight out of 16 subjects that improved by ≥ 12
seconds in the Protandim® group, while nine out of 19 subjects improved by ≥ 12 seconds

51
in the placebo group. Thus, the proportion of subjects that improved by the smallest
measureable change of at least 12 seconds were similar between groups (p > 0.05).
Aerobic Training Index
In order to control for changes in training volume that could affect 5-km time trial
performance, an aerobic training index was calculated at baseline and ~90 days post-
supplementation. The baseline aerobic training index was the summed total number of
minutes of running/physical activity for the 14 days prior to the distribution of the
supplement multiplied by the average rating of perceived exertion for those 14 days (6 =
no exertion, 20 = maximal exertion). The aerobic training index at the ~88 days post
supplementation period was the summed total number of minutes of running/physical
activity for the 14 days prior to the end of the study multiplied by the average rating of
perceived exertion for those 14 days (6 = no exertion, 20 = maximal exertion). While
there was a significant correlation between the aerobic training index between baseline
and post-supplementation (Spearman’s rho = 0.66, p < 0.01), the changes in the aerobic
training index in that period was not different between groups (t = -1.63, p = 0.11, Table
6).
Environmental Conditions
The environmental conditions for all three 5-km time trials are presented in Table
7. There was no statistically significant differences in either temperature, dew point, or
humidity measured between groups within any of the three sessions. However, there was
some adjustment for the final 5-km times for seven subjects. Those subjects experienced

52
unseasonably hot and humid conditions (Temperature = 71°F, Humidity = 71%, Dew
point = 61°F). According to the following source which adjusts for temperature and dew
point79, the final times were adjusted down by 2% for only those seven subjects in that
final session only.
Baseline Blood Parameters
The baseline blood parameters that is listed in the oxidative stress panel provided
by Genova diagnostics are presented in Table 3. These data presented are the average
baseline values measured twice over a period of one week. The mean values for both
groups are within the reference ranges provided by Genova Diagnostics (Table 3). There
was no difference in any parameter between groups at baseline (rested, fasted, Table 3,
Table 8).
The week-to-week coefficient of variation for every blood parameter is presented
in Table 4. As can be seen, the coefficient of variation ranged from as low as 5% (for
fasting blood glucose) to 26% (lipid peroxides, TBARS). This is similar to the acceptable
laboratory coefficient of variation for replicates from the same sample, assayed at a
different time-points (Table 5).
Chronic Effects of Supplementation on Blood Parameters Measured at Rest
Supplementation did not change blood parameters measured at rest (Table 8,
Figures 14-18). However, there were mean differences in glutathione (GSH), total
antioxidant capacity (TAC), cystine, sulphate , cysteine to sulphate ratio, superoxide

53
dismutase (SOD), and glutathione peroxidase (GPX) measured across the four time-
points (all p < 0.05, Table 8, Figures 14 to 18).
Acute Effects of Exercise on Blood Parameters
The 5-km time trials did not affect any blood parameter in the oxidative stress
panel (Figures 19 to 21). However, blood glucose increased by +70 (29) mg/dL from pre-
to 10-minutes post-exercise (Table 10, p < 0.01). Supplementation did not affect these
changes.
However, in a subset of subjects, the mean increase in TBARS in 21
individuals that were “responders to oxidative stress” when both baseline 5-km races
were averaged, was +1.6 (SD 1.4) μmol/L [minimum increase = 0.1, maximum increase
= 4.3 μmol/L]. This represents 11 subjects out of 19 subjects (~58%) in the placebo
group, and 10 subjects out of 19 subjects (~53%) of the subjects in Protandim® group.
After 88 days of supplementation, five out of nine responders in the Protandim® group
(~63%) experienced a reduction in serum TBARS post-race, while eight out of 11
responders in the placebo group (~73%) experienced a reduction in serum TBARS post-
race (Fisher’s exact test, p = 0.64). Thus, Protandim® was ineffective in reducing post-
exercise serum TBARS in responders compared to placebo.
Dietary Recall Analyses
The number of individuals in each group that ate the same food 24 hours prior to
the blood draw for each of the five blood draw days are shown in Table 9. Thirteen
subjects in the Protandim® group ate mostly or completely the same food prior to each

54
session compared to 5 subjects in the placebo group. This was significantly different (p <
0.01, Fisher’s exact test).
Quality of Life Analyses
Figure 22 displays the World Health Organization Quality of Life raw scores.
There was no significant difference between groups in Physical Health, Social
Relationships, and Psychological Health throughout the 88 days of supplementation.
Only at 88 days post-supplementation did the Placebo group have higher environmental
scores compared to the Protandim® group (p = 0.047, Figure 22). Table 13 shows the
stability of responses for the WHOQOL-BREF over a one week period. The week-to-
week coefficient of variation was 4 to 7% for all domains (Table 13).
Signs and Symptoms
Table 12 shows the total number of events of a given sign/symptom over the 88
day supplementation period. The total number of sign/symptoms in the Protandim® group
over 88 days was 233 episodes (51%), compared to 220 episodes (49%) in the placebo
group. The number of subjects that experienced at least one event was similar between
groups (p > 0.05, Fishers exact test).

55
DISCUSSION
The purpose of this study was four-fold: First we wished to assess whether
regular supplementation of Protandim® (675 mg/day for 90 days) reduces oxidative
damage in the blood at rest as assessed by lipid peroxides (TBARS) in runners. The 88
(4) day supplementation period did not change serum peroxides levels in either group.
Second, we wanted to determine whether regular supplementation of Protandim® in
runners reduces the increase in oxidative damage post-race compared to pre-race as
assessed by lipid peroxides. Since acute exercise did not change mean serum lipid
peroxides levels, we were not able to assess whether supplementation had any effect on
this change. However, in a group of responders of oxidative stress caused by 5-km time
trials, Protandim® did not mitigate the increase. Third, we wanted to know whether
regular supplementation of Protandim® improved 5-km running times. The supplement
did not improve running performance, but it did not worsen performance either. Lastly,
we wished to determine whether regular supplementation of Protandim® improved any
one of the four domains of quality of life according to the WHOQOL- BREF17. The
week-to-week coefficient of variation in quality of life scores for both baseline sessions
was small (4% to ~7%, depending on which domain was observed), yet after 88 (4) days
of supplementation, Protandim® did not improve, nor worsen, quality of life17.

56
Quality of life is a subjective measure of health and well-being frequently used by
those in the health fields to assess an individual’s satisfaction with various domains of
their lives17. The full quality of life measure from the World Health Organization
(WHOQOL-100) consists of 100 items throughout six domains, and has been shown to
be highly reliable17. The brief version (WHOQOL-BREF) has been developed to
decrease the burden on subjects completing it to allow for more accurate results in some
clinical trials17. The domains covered in the WHOQOL-BREF are Physical Health,
Social Relationships, Psychological Health and Environmental17. Bergner noted that
during clinical trials, recording and examining quality of life is imperative in order to
understand and quantify all potential side-effects or benefits77.
As mentioned previously, Protandim® marketed by LifeVantage Corporation is a
nutritional supplement comprised of five phytochemicals components supposedly
activates the Nuclear factor (erythroid-derived 2)-like 2, (called Nrf2) transcription factor
pathway that is integral to several antioxidant enzymes, including γ-glutamyl cysteine
synthase (an enzyme that catalyzes the committed step in glutathione synthesis)74. Nrf2 is
a basic leucine zipper protein that regulates the expression of antioxidant proteins that
protect against oxidative damage triggered by injury and inflammation. Protandim® may
induce other endogenous antioxidant enzymes, such as SOD and catalase, while
decreasing lipid peroxidation16.
There are many studies published using Protandim®16,20-24,73 but only three studies
were assessed in human subjects16,20,73. Two of those studies examined long-term
oxidative damage assessed by serum lipid peroxides (Thiobarbituric acid-reacting
substances: TBARS) and found a ~20 to ~40% decrease in plasma TBARS after 30 days

57
of Protandim® supplementation16,73. However, one of these studies was not randomized
and not placebo controlled16. The third study, a double-blinded, randomized, placebo-
controlled trial published in 2012, examined the effect of Protandim® on pulmonary
oxidative stress and alveolar permeability in 30 recovering alcoholics20. Protandim® was
supplemented in 14 subjects at a dose of 1350 mg/day; double the daily dose
recommended by the manufacturer) or placebo (in 16 subjects) were administered for 7
days. Relative to placebo-treatment, Protandim® had no significant effects on alveolar
epithelial permeability or on oxidative stress (TBARS), epithelial growth factor,
fibroblast growth factor, interlukin 1β, and interlukin-10 levels in bronchoalveolar lavage
fluid. Treatment with placebo, however, produced a significant reduction in plasma levels
of TBARS by ~28%20. Furthermore, an abstract was published in 2014 in the FASEB
journal examining the effects of 30 days of 675 mg/day of Protandim® on serum lipid
peroxidation in 13 overweight and/or obese subjects73. Ashwagandha is a banned
medicinal ingredient in some countries, so the phytochemical piperine was substituted for
Ashwagandha in this study. Serum TBARS decreased by ~28% in the Protandim®
(piperine) group. The placebo group, on the other hand, showed no change in serum
TBARS post-supplementation. Thus, to date, there were only ~47 subjects given
Protandim® in humans in scientific research studies.
In this study, 19 subjects were given Protandim® for ~88 days. Serum TBARs
were within normal range before the three exercise sessions. Supplementation with
Protandim® did not increase serum TBARs at rest (Table 10, Figure 14). Furthermore,
acute, strenuous exercise has been shown to increase serum lipid peroxides in humans
(Figure 1). As a whole, there was no increase in serum lipid peroxides caused by

58
strenuous exercise (Table 10, Figure 19). However, the 5-km races did raise serum lipid
peroxides in 21 (~55%) of the subjects, but 88 days of Protandim® supplementation did
not attenuate the increase in these subjects compared to the placebo.
The changes in SOD over the supplementation period was not different between
groups (Table 10, Figure 14). In a different cohort of subjects ranging from 20 to 80 years
of age, SOD has been shown to increase by ~20% after the same period supplementation
(Figure 10), however our runners did not experience a similar increase in SOD while
taking Protandim® compared to placebo. After ~30 and ~88 days post-supplementation,
the increase in SOD was ~25% and ~66%, respectively, compared to baseline (Table 10,
Figure 14), however, this increase was experienced by both groups.
Blood glucose levels taken at rest from baseline to ~88 days supplementation
increased post-exercise in both groups. The average increase post-exercise in blood
glucose levels between the two baseline sessions +70 (29) mg/dL (n=38), which is
similar to the increase in blood glucose levels experienced ~88 days post
supplementation, with an increase of +72 (41) mg/dL (n= 35) (Table 10). The pre and
post exercise glutathione (GSH) values at both baseline sessions decreased by -11 (84)
μmol/L (n= 38), compared to ~88 days post-supplementation which experienced an
increase in GSH of +43 (229) μmol/L (n= 35) (Table 10).
The results of the pre- to post exercise changes in TAC, from baseline to ~88 days
supplementation demonstrated no statistical difference. The average of both baseline
weeks had an increase in TAC post exercise of +0.11 (0.05) mmol/L (n= 38), which is the
same as the increase observed at ~88 days supplementation, +0.11 (0.04) mmol/L (n=35)
(Table 10).
59
Limitations
There were several limitations of this study. First, the standard deviation in 5-km
running times was 2.1 minutes (128 seconds) in this cohort. Thus, to show any small
improvement in performance from supplement use given the large standard deviation
would require many more participants. However, the effect size in the improvement in
performance was small (< 0.2), so that it is unlikely that any meaningful change would
ever be found with supplementation of Protandim®.
Second, the week-to-week variability in oxidative damage as expressed by
serum lipid peroxides (resting values, fasted) was ∼26%. This is a large variability and
includes both biological variability and variability of the assay. According to Mullins and
colleagues, the between subject-variability in oxidative stress biomarkers is large,
suggesting that there may be responders and non-responders to oxidative stress post-
exercise19. The between-individual coefficients of variation were: plasma F2-isoprostanes
(Isop) (152%), PC (240%), GPX (130%) and TAC (243%)19. In the current study, there
were 21 individuals (~55% of the total sample) that experienced increases in oxidative
stress from the 5-km race (when averaged over both baseline 5-km sessions). Those
subjects that has an increase in TBARS post-race could mean that these particular
subjects were unable to regulate redox homeostasis (ie. responders)19. The mean increase
in TBARS in those 21 individuals that were “responders to oxidative stress” when both
baseline 5-km races were averaged, was +1.6 (SD 1.4) μmol/L. As mentioned previously,
this represents 11 subjects (~58%) in the placebo group, and 10 subjects (~53%) of the
subjects in Protandim® group. Thus, approximately the same proportion of subjects in

60
each group did not show increases in serum peroxides levels triggered by the 5-km race.
In a post-hoc analyses, we examined whether those responders had a lower increase in
TBARS post-race after the 88 day supplementation period. In the Protandim® group, 5
out of 8 subjects (~63%) showed lower increases in serum TBARS concentration post-
race, while 8 out of 11 subjects (~73%) in the placebo group showed lower serum
TBARS concentration post-race after the 88 day supplementation period. Thus, 88 days
of Protandim® supplementation was not able to mitigate the increase in oxidative stress
post-race in those responders of oxidative stress.
Third, serum lipid peroxides may have been measured too early post-exercise to
show any meaningful increases in oxidative damage. The results of a study conducted by
Michailidis et al., demonstrated that there is a range of ideal blood sampling time points
after exhaustive aerobic exercise used to assess blood markers of oxidative stress at peak
levels39. Following the cessation of exercise, each biomarker assessed in the blood can
take up to a couple of hours to reach its peak oxidative stress level39. For example, the
time to highest concentration post exercise for TBARS is 1.2 (0.6) hours (95% CI = 0.8
to 1.6 hours post-exercise), and 2.2 (0.9) hours (95% CI = 1.6 to 2.8 hours post-exercise)
for TAC39. Thus, in an oxidative stress panel, each parameter has an ideal post-exercise
sampling time-point, which varies from parameter to parameter. The present study all
blood parameters in the oxidative stress panel were measured at the same time post-
exercise time-point, which was at ~10 minutes post-exercise, instead of the recommended
48 minutes to 96 minutes post-exercise for serum TBARS39. In order to measure serum
levels of oxidative damage following an endurance run, multiple blood draws would also
need to be performed. However, the cost associated with multiple blood draws for each

61
participant at each of the three post-exercise blood sampling time points would be very
expensive28. In this study, every blood sample sent to Genova Diagnostics cost~$150,
thus for approximately 300 blood samples, the total analyses was $45,000. In addition, it
is unlikely that we would have been able to retain subjects if those subjects were asked to
stay around after their race for an additional 48 to 96 minutes for multiple post-exercise
blood draws, especially in a fasted state, hungry, and especially when all these subjects
had to make it to work that morning. Despite this limitation, several studies have
assessed oxidative damage within 10 minutes post-exercise and the preponderance of the
data demonstrate that there should be a measurable increase in serum lipid peroxides
post-exercise (Figure 1). As a whole, we did not see an increase in TBARS caused by all-
out exercise lasting ~20 minutes (Table 10, Figure 19), but again, as discussed earlier,
~50% of the subjects were responders to oxidative damage caused by exercise and
experienced a measureable acute increase in oxidative stress, and ~50% were not
responders to oxidative damage caused by exercise as assessed by serum TBARS.
Fourth, the validity of serum TBARS in detecting lipid peroxidation has been
criticized for a lack of specificity. Serum TBARS is a direct marker of oxidative damage
to polyunsaturated fatty acids within cell membranes, otherwise known as lipid
peroxidation. But, the levels of serum TBARS are very general and do not precisely
pinpoint where the oxidative damage is occurring in the body. However, many human
studies have continued use serum lipid peroxides as a marker of oxidative damage
(Figure 1), and this study is no different. Nonetheless, serum lipid peroxides does reflect
oxidative damage of the heart and liver at rest and immediately post-exercise, as
demonstrated in rats4. Glutathione levels in the blood also reflect muscle and heart

62
glutathione levels at rest and immediately post-exercise4, so we believe that our findings
are specific to those tissues.
Fifth, there were a many forms that the subjects had to fill out diligently and
consistently for ~88 days, which can be considered another limitation. Subjects self-
reported training diary, quality of life questionnaires, food diary recalls, signs-and-
symptoms forms were a burden to the subjects. Thus, their diligence, compliance and
honesty in filling out these forms could be a limitation and thus we are unsure of the
accuracy of their reporting.
Sixth, there may have been compliance issues with the required ingestion of one
pill every day for 90 days. Nonetheless, both groups forgot to similarly ingest only 3% of
their allotted amount during the supplementation period. This indicates good compliance.
Seventh, the weather was an issue for a few subjects during the final session.
Seven subjects experienced unseasonably hot and humid conditions (Temperature =
71°F, Humidity = 71%, Dew point = 61°F). According to the following source which
adjusts for temperature and dew point79, the final times were adjusted down by 2% for
only those seven subjects in that final session only.
The color of the pills could be a final limitation of the study. The inside contents
of the placebo pills and the Protandim® pills was visibly different from one another. If the
subjects got together and compared their pills with each other by opening the capsules of
the individual pills, they may have been able to determine whether they were in the
Protandim® group or the placebo group. However, this is just conjecture, and we have no
idea how many subjects were that keen or that curious as to the contents of the pills. No

63
subject discussed with us that they compared pills with fellow runners, so we are just
speculating that this may have been a limitation.
Conclusions
In conclusion, this study demonstrated these findings:
1. Regular supplementation of Protandim® (675 mg/day for 88 days) did not reduce
oxidative damage at rest in healthy athletes as assessed by serum lipid peroxides.
2. Regular supplementation of Protandim® in runners did not reduce the increase in
oxidative damage post-race compared to pre-race as assessed by lipid peroxides
(TBARS) in runners who were responders to oxidative stress of 5-km running.
3. Regular supplementation of Protandim® did not improve 5-km time trial
performance.
4. Regular supplementation of Protandim® did not improve, nor worsen, quality of life
in runners.
Future Research Directions
Athletes are always seeking new ways to improve their athletic performance and
the best method may require improving their daily nutrition and removing foods and
drinks causing increased oxidative stress59. A healthy diet can play a protective role in
reducing oxidative stress caused by exercise59. However, the adequate intakes of
antioxidant micronutrients for athletes is unknown because of a lack of research59. Future
research should focus on the amount and type of antioxidant supplementation athletes
require to reduce oxidative stress and improve their performance59.

64
REFERENCES
1. Matsuo M, Kaneko T. Chapter 1. The Chemistry of Reactive Oxygen Species and
Related Free Radicals. In: Radak Z, ed. Free Radicals in Exercise and Aging.
Champaign, IL: Human Kinetics; 2000, 1-33.
2. Slattery, K. M., Dascombe, B., Wallace, L. K. Bentley, D. J., & Coutts, A. J.
(2014). Effect of N-acetylcysteine on cycling performance after intensified training. Med
Sci Sports Exerc., 46(6), 1114-1123. doi: 10.1249/MSS.0000000000000222
3. Ji LL, Hollander J. Chapter 2. Antioxidant Defense: Effects of Aging and
Exercise. In: Radak Z, ed. Free Radicals in Exercise and Aging. Champaign, IL: Human
Kinetics; 2000, 35-72.
4. Veskoukis, A. S., Nikolaidis, M. G., Kyparos, A., & Kouretas, D. (2009). Blood
reflects tissue oxidative stress depending on biomarker and tissue studied. Free Radical
Biology & Medicine, 47(10), 1371-1374. doi: 10.1016/j.freeradbiomed.2009.07.014
5. Arent, S. M. Pellegrino, J. K., Williams, C. A., DiFabio, D. A., & Greenwood, J.
C. (2010). Nutritional supplementation, performance, and oxidative stress in college
soccer players. Journal of Strength and Conditioning Research, 24(4), 1117-1124. doi:
10.1519/JSC.0b013e3181cb70b8.
6. Margonis, K., Fatouros, I.G., Jamurtas, A. Z., Nikolaidis, M. G., Douroudos, I.,
Chatzinikolaou, A., Mitrakou, A., Mastorakos, G., Papassotiriou, I., Taxildaris, K., &
Kouretas, D. (2007). Oxidative stress biomarkers responses to physical overtraining:

65
Implications for diagnosis. Free Radical Biology & Medicine, 43(6), 901-910.
doi:10.1016/j.freeradbiomed.2007.05.022
7. Chandwaney, R., Leichtweis, S., Leeuwenburgh, C., & Ji, L. L. (1998). Oxidative
stress and mitochondrial function in skeletal muscle: effects of aging and exercise
training. Age, 21(3), 109-117. doi: 10.1007/s11357-998-0017-5.
8. Revan, S., Balci, S. S., Pepe, H., Kurtoglu, F., Erol, A.E., & Akkus, H. (2010).
Short duration exhaustive running exercise does not modify lipid hydroperoxide,
glutathione peroxides and catalase. Journal of Sports Medicine and Physical Fitness,
50(2), 235-240.
9. Atalay, M., Lappalainen, J., & Sen, C. K. (2006). Dietary antioxidants for the
athlete. Current Sports Medicine Reports, 5, 182-186.
10. Ristow, M., Zarse, K., Oberbach, A., Kloting, N., Birringer, M., Kiehntopf, M.,
Stumvoll, M., Kahn, C. R., & Bluher, M. (2009). Antioxidants prevent health-promoting
effects of physical exercise in humans. Procedings of the National Acadamy of Sciences
USA, 106(21), 8665-8670. doi: 10.1073/pnas.0903485106
11. Gomez-Cabrera, M. C., Domenech, E., Romagnoli, M., Arduini, A., Borras, C.,
Pallardo, F, V., Sastre, J., & Vina, J. (2008). Oral administration of vitamin C decreases
muscle mitochondrial biogenesis and hampers training-induced adaptations in endurance
performance. The American Journal of Clinical Nutrition, 87(1), 142-149. doi:
10.1249/MSS.0b013e318203afa3.
12. Vina, J., Gomez-Cabrera, M. C., Lloret, A., Marquez, R., Minana, J. B., Pallardo,
F. V., & Sastre, J. (2000). Free radicals in exhaustive physical exercise: mechanism of

66
production, and protection by antioxidants. International Union of Biochemistry and
Molecular Biology Life, 50(4-5), 271-277.
13. Finaud, J., Scislowski, V., Lac, G., Durand, D., Vidalin, H., Robert, A., & Filaire,
E. (2006). Antioxidant status and oxidative stress in professional rugby players: evolution
throughout a season. International Journal of Sports Medicine, 27(2), 87-93.
14. Slattery, K. M., Dascombe, B., Wallace, L. K. Bentley, D. J., & Coutts, A. J.
(2014). Effect of N-acetylcysteine on cycling performance after intensified training.
Medicine and Science in Sports and Exercise, 46(6), 1114-1123. doi:
10.1249/MSS.0000000000000222
15. Poljsak, B. (2011). Strategies for reducing or preventing the generation of
oxidative stress. Oxidative Medicine and Cellular Longevity, 1-15. doi:
10.1155/2011/194586.
16. Nelson, S. K., Bose, S. K., Grunwald, G. K., Myhill, P., & McCord, & J. M.
(2006). The induction of human superoxide dismutase and catalase in vivo: a
fundamentally new approach to antioxidant therapy. Free Radical Biology & Medicine,
40(2), 341-347.
17. Skevington, S. M., Lotfy, M., & O'Connell, K. A., (2004). The World Health
Organization’s WHOQOL-BREF quality of life assessment: psychometric properties and
results of the international field trial. A report from the WHOQOL group. Quality of Life
Research, 13(2), 299-310.
18. Kreider, R. B., Wilborn, C. D., Taylor, L., Campbell, B., Almada, A. L., Collins,
R., Cooke, M., Earnest, C. P., Greenwood, M., Kalman, D. S., Kerksick, C. M., Kleiner,

67
S. M., Leutholtz, B., Lopez, H., Lowery, L. M., Mendel, R., Smith, A., Spano, M.,
Wildman, R., Willoughby, D. S., Ziegenfuss, T. Z., & Antonio, J. (2010). ISSN exercise
& sport nutrition review: research and recommendations. Journal of the International
Society of Sports Nutrition, 7(1), 5. doi: 10.1186/1550-2783-7-7.
19. Mullins, A. L., van Rosendal, S. P., Briskey, D. R., Fassett, R. G., Wilson, G. R.,
& Coombes, J. S. (2013). Variability in oxidative stress biomarkers following a maximal
exercise test. Biomarkers, 18(5), 446-454. doi: 10.3109/1354750X.2013.810668.
20. Burnham, E. L., McCord, J. M., Bose, S., Brown, L. A., House, R., Moss, M., &
Gaydos, J. (2012). Protandim® does not influence alveolar epithelial permeability or
intrapulmonary oxidative stress in human subjects with alcohol use disorders. American
Journal of Physiology. Lung Cellular and Molecular Physiology, 302(7), 688-699. doi:
10.1152/ajplung.00297.2011
21. Joddar, B., Reen, R. K., Firstenberg, M. S., Varadharaj, S., McCord, J. M.,
Zweier, J. L., & Gooch, K. J. (2011). Protandim® attenuates intimal hyperplasia in
human saphenous veins cultured ex vivo via a catalase-dependent pathway. Free Radical
Biology & Medicine,50(6), 700-709. doi: 10.1016/j.freeradbiomed.2010.12.008
22. Qureshi, M. M., McClure, W. C., Arevalo, N. L., Rabon, R. E., Mohr, B., Bose, S.
K., McCord, J. M., & Tseng, B. S. (2010). The Dietary Supplement Protandim®
Decreases Plasma Osteopontin and Improves Markers of Oxidative Stress in Muscular
Dystrophy Mdx Mice. Journal of Dietary Supplements, 7(2), 159-178.
doi: 10.3109/19390211.2010.482041
23. Liu, J., Gu, X., Robbins, D., Li, G., Shi, R., McCord, J. M., & Zhao, Y. (2009).
Protandim® , a fundamentally new antioxidant approach in chemoprevention using mouse

68
two-stage skin carcinogenesis as a model. PLoS One, 4(4), e5284. doi:
10.1371/journal.pone.0005284
24. Velmurugan, K., Alam, J., McCord, J. M., & Pugazhenthi, S. (2009). Synergistic
induction of heme oxygenase-1 by the components of the antioxidant supplement
Protandim® . Free Radical Biology & Medicine, 46(3), 430-440. doi:
10.1016/j.freeradbiomed.2008.10.050
25. Kyparos, A., Vrabas, I. S., Nikolaidis, M. G., Riganas, C. S., & Kouretas, D.
(2009). Increased oxidative stress blood markers in well-trained rowers following two
thousand-meter rowing ergometer race. The Journal of Strength and Conditioning
Research, 23(5), 1418-1426. doi: 10.1519/JSC.0b013e3181a3cb97.
26. Carmeli, E., Lavian, G., & Reznick, A. Z. Chapter 3. The Role of Antioxidant
Nutrition in Exercise and Aging. In: Radak Z, ed. Free Radicals in Exercise and Aging.
Champaign, IL: Human Kinetics; 2000, 73-115.
27. (2009). Oxidative Stress Analysis 2.0. Genova Diagnostics.Retrieved from:
http://www.gdx.net/core/interpretive-guides/Oxidative-Stress-Interp-Guide.pdf
28. Kyparos, A., Riganas, C., Nikolaidis, M. G., Sampanis, M., Koskolou, M. D.,
Grivas, G. V., Kouretas, D., & Vrabas, I. S. (2012). The effect of exercise-induced
hypoxemia on blood redox status in well-trained rowers. European Journal of Applied
Physiology, 112(6), 2073-2083. doi: 10.1007/s00421-011-2175-x.
29. (2012). Oxidative Stress Analysis 2.0. Genova diagnostics. Retrieved from:
http://www.gdx.net/core/one-page-test-descriptions/Oxidative-Stress2-Test
Description.pdf

69
30. Andrade, F. H. Chapter 4. Reactive Oxygen Species and Skeletal Muscle
Function. In: Radak Z, ed. Free Radicals in Exercise and Aging. Champaign, IL: Human
Kinetics; 2000, 117-148.
31. Commoner, B., Townsend, J., & Pake, G. E. (1954). Free radicals in biological
materials. Nature, 174(4432), 689-691.
32. Koren, A., Schara, M., & Sentjurc, M. (1980). EPR measurements of free radicals
during tetanic contractions of frog skeletal muscle. Periodicum Biologorum, 82, 399–
401.
33. Davies, K. J., Quintanilha, A. T., Brooks, G. A., Packer, L. (1982). Free radicals
and tissue damage produced by exercise. Biochemical and Biophysical Research
Communications, 107(4), 1198-1205.
34. Pepe, H., Balci, S.S., Revan, S., Akalin, P. P., & Kurtoğlu, K. (2009). Comparison
of oxidative stress and antioxidant capacity before and after running exercises in both
sexes. Gender Medicine, 6(4), 587-595. doi: 10.1016/j.genm.2009.10.001.
35. Ogonovszky, H., Sasvari, M., Dosek, A., Berkes, I., Kaneko, T., Tahara, S.,
Nakamoto, H., Goto, S., & Radak, Z. (2005). The effects of moderate, strenuous, and
overtraining on oxidative stress markers and DNA repair in rat liver. Canadian Journal of
Applied Physiology, 30(2), 186–195.
36. Gomez-Cabrera, M. C., Domenech, E., & Vina, J. (2008). Moderate exercise is an
antioxidant: upregulation of antioxidant genes by training. Free Radical Biology &
Medicine, 44(2), 126-131. doi: 10.1016/j.freeradbiomed.2007.02.001.
37. Chen, H. J. & Chiu, W. L. (2005). Association between cigarette smoking and
urinary excretion of 1,N2-ethenoguanine measured by isotope dilution liquid

70
chromatography-electrospray ionization/tandem mass spectrometry. Chemical Research
in Toxicology, 18(10), 1593-1599.
38. Kabasakalis, A, Kyparos, A., Tsalis, G., Loupos, D., Pavlidou, A., & Kouretas, D.
(2011). Blood oxidative stress markers after ultramarathon swimming. Journal of
Strength and Conditioning Research, 25(3), 805-811. doi:
10.1519/JSC.0b013e3181d0b109.
39. Michailidis, Y., Jamurtas, A. Z., Nikolaidis, M. G., Fatouros, I. G., Koutedakis,
Y., Papassotiriou, I., & Kouretas, D. (2007). Sampling time is crucial for measurement of
aerobic exercise-induced oxidative stress. Medicine and Science in Sports and Exercise,
39(7), 1107-1113. doi: 10.1249/01.mss.0b013e318053e7ba
40. Fisher, G., Schwartz, D. D., Quindry, J., Barberio, M. D., Foster, E. B., Jones, K.
W., & Pascoe, D. D. (2011). Lymphocyte enzymatic antioxidant responses to oxidative
stress following high-intensity interval exercise. Journal of Applied Physiology, 110(3),
730–737. doi: 10.1152/japplphysiol.00575.2010.
41. Rokitzki, L., Logemann, E., Sagredos, A. N., Murphy, M., Wetzel-Roth, W., &
Keul, L. (1994). Lipid peroxidation and antioxidative vitamins under extreme endurance
stress. Acta Physiologica Scandinavica, 151(2), 149-158.
42. Margaritis, I., Tessier, F., Richard, M. J., & Marconnet, P. (1997). No evidence of
oxidative stress after a triathlon race in highly trained competitors. International Journal
of Sports Medicine, 18(3), 186-190.
43. Vezzoli, A., Pugliese, L., Marzorati, M., Serpiello, F. R., La Torre, A., & Porcelli,
S. (2014). Time-course changes of oxidative stress response to high-intensity

71
discontinuous training versus moderate-intensity continuous training in masters runners.
PLoS One, 9(1), doi: 10.1371/journal.pone.0087506
44. Alessio, H. M., Goldfarb, A. H., & Cao, G. (1997). Exercise-induced oxidative
stress before and after vitamin C supplementation. International Journal of Sport
Nutrition, 7(1), 1-9.
45. Vider, J., Lehtmaa, J., Kullisaar, T., Vihalemm, T., Zilmer, K., Kairane, C.,
Landor, A., Karu, T., & Zilmer, M. (2001). Acute immune response in respect to
exercise-induced oxidative stress. Pathophysiology, 7, 263-270.
46. Revan, S. (2011). Effects of acute high-intensity aerobic and anaerobic exercise
on oxidative damage to lipids, proteins and DNA in untrained subjects. African Journal
of Pharmacy and Pharmacology, 5(10), 1321-1326. doi: 10.5897/AJPP11.456
47. Maughan, R. J., Donnelly, A. E., Gleeson, M., Whiting, P. H., Walker, K. A., &
Clough, P. J. (1989). Delayed-onset muscle damage and lipid peroxidation in man after a
downhill run. Muscle & Nerve, 12(4), 332-336.
48. Diaz, K. M., Feairheller, D. L., Sturgeon, K. M., Williamson, S. T., & Brown, M.
D. (2011). Oxidative stress response to short duration bout of submaximal aerobic
exercise in healthy young adults. International Journal of Exercise Science, 4(4), 247-
256. PMCID: PMC3856905
49. Fatouros, I. G., Jamurtas, A. Z., Villiotou, V., Pouliopoulou, S., Fotinakis, P.,
Taxildaris, K., & Deliconstantinos, G. (2004). Oxidative stress responses in older men
during endurance training and detraining. Medicine and Science in Sports and Exercise,
36(12), 2065-2072.

72
50. Duthie, G. G., Robertson, J. D., Maughan, R. J., Morrice, P. C. (1990). Blood
antioxidant status and erythrocyte lipid peroxidation following distance running. Archives
of Biochemistry and Biophysics, 282(1), 78-83.
51. Feairheller, D. L., Diaz, K. M., Sturgeon, K. M., Williamson, S. T., & Brown, M.
D. (2011). Racial differences in the time-course oxidative stress responses to acute
exercise. Journal of Exercise Physiology Online, 14(1), 49-59. PMID: 21691463
52. Bogdanis, G. C., Stavrinou, P., Fatouros, I. G., Philippou, A., Chatzinikolaou, A.,
Draganidis, D., Ermidis, G., & Maridaki, M. (2013). Short-term high-intensity interval
exercise training attenuates oxidative stress responses and improves antioxidant status in
healthy humans. Food Chemical Toxicology, 61, 171-177. doi:10.1016/j.fct.2013.05.046
53. Inayama, T., Kumagai, Y., Sakana, M., Saito, M., & Matsuda, M. (1996). Plasma
protein-bound sulfhydryl group oxidation in humans following a full marathon race. Life
Sciences, 59(7), 573-578.
54. Marzatico, F., Pansarasa, O., Bertorelli, L., Somenzini, L., & Della Valle, G.
(1997). Blood free radical antioxidant enzymes and lipid peroxides following long-
distance and lactacidemic performances in highly trained aerobic and sprint athletes. J
Sports Medicine and Physical Fitness, 37(4), 235-239.
55. Miyazaki, H., Oh-ishi, S., Ookawara, T., Kizaki, T., Toshinai, K., Ha, S., Haga,
S., Ji, L. L., & Ohno, H. (2001). Strenuous endurance training in humans reduces
oxidative stress following exhausting exercise. European Journal of Applied Physiology,
84(1-2), 1-6.

73
56. Bloomer, R. J., Goldfarb, A. H., Wideman, L., McKenzie, M. J., & Consitt, L. A.
(2005). Effects of acute aerobic and anaerobic exercise on blood markers of oxidative
stress. Journal of Strength and Conditioning Research, 19(2), 276-285.
57. Leonardo- Mendonca, R. C., Concepcion-Huertas, M., Guerra-Hernandez, E.,
Zabala, M., Escames, G., Acuna-Castroviejo, D. (2014). Redox status and antioxidant
response in professional cyclists during training. European Journal of Sport Science,
14(8), 830-838. doi: 10.1080/17461391.2014.915345
58. Elosua, R., Molina, L., Fito, M., Arquer, A., Sanchez-Quesada, J. L., Covas, M.
I., Ordonez-Llanos, J., Marrugat, J. (2003). Response of oxidative stress biomarkers to a
16-week aerobic physical activity program, and to acute physical activity, in healthy
young men and women. Atherosclerosis, 167(2), 327-334.
59. Margaritis, I., & Rousseau, A. S. (2008). Does physical exercise modify
antioxidant requirements?. Nutrition Research Reviews, 21, 3-12.
60. Jacob, R. A., Aiello, G. M., Stephensen, C. B., Blumberg, J. B., Milbury, P. E.,
Wallock, L. M., & Ames, B. N. (2003). Moderate antioxidant supplementation has no
effect on biomarkers of oxidant damage in healthy men with low fruit and vegetable
intakes. The Journal of Nutrition, 133(3), 740-743.
61. Van den Berg, R., van Vilet, T., Broekmans, W. M., Cnubben, N. H., Vaes, W.
H., Roza, L., Haenen, G. R., Bast, A., & van den Berg, H. (2001). A vegetable/fruit
concentrate with high antioxidant capacity has no effect on biomarkers of antioxidant
statud in male smokers. The Journal of Nutrition, 131(6), 1712-1722.

74
62. Moller, P., Vogel, U., Pedersen, A., Dragsted, L. O., Sandstrom, B., & Loft, S.
(2003). No effect of 600 grams fruit and vegetables per day on oxidative DNA damage
and repair in healthy nonsmokers. Cancer Epidemiology, Biomarkers & Prevention,
12(10), 1016-1022.
63. Kanter, M. (1998). Free radicals, exercise and antioxidant supplementation.
Proceedings of the Nutritiona Society, 57(1), 9-13.
64. Chandra, R. K., & McBean, L. D. (1994). Zinc and immunity. Nutrition, 10(1),
79-80.
65. Sharman, I. M., Down, M. G., & Sen, R. N. (1971). The effects of vitamin E and
training on physiological function and athletic performance in adolescent swimmers. The
British Journal of Nutrition, 26(2), 265-276.
66. Ali, S. S., Xiong, C., Lucero, J., Behrens, M. M., Dugan, L. L., & Quick, K. L.
(2006). Gender differences in free radical homeostasis during aging: shorter-lived female
C57BL6 mice have increased oxidative stress. Aging Cell, 5(6), 565-574.
67. Chen, B., Lu, Y., Chen, Y., & Cheng, J. (2015). The role of Nrf2 in oxidative
stress-induced endothelial injuries. Journal of Endocrinology, 225(3), R83-R99. pii: JOE-
14-0662.
68. Schafer, M., & Werner, S. (2015). Nrf2-A regulator of keratinoctye redox
signaling. Free Radical Biology & Medicine.
doi.org/10.1016/j.freeradbiomed.2015.04.018
69. Physical Activity Readiness Questinniare (PAR-Q):
http://www.csep.ca/cmfiles/publications/parq/par-q.pdf. Canadian Society for Exercise
Physiology; 2002.

75
70. Jeukendrup, A. E, & Currell, K. (2005). Should time trial performance be
predicted from three serial time-to-exhaustion tests? Medicine and Science in Sports and
Exercise, 37(10):1820; author reply 1821.
71. Nikolaidis, M. G, Paschalis, V., Giakas, G., Fatouros, I. G., Koutedakis, Y.,
Kouretas, D., & Jamurtas, A. Z. (2007). Decreased blood oxidative stress after repeated
muscle-damaging exercise. Medicine and Science in Sports and Exercise, 39(7), 1080–
1089. doi: 10.1249/mss.0b013e31804ca10c
72. Nikolaidis, M. G., Jamurtas, A. Z., Paschalis ,V., Fatouros, I. G., Koutedakis, Y.,
& Kouretas, D. (2008). The effect of muscle-damaging exercise on blood and skeletal
muscle oxidative stress: magnitude and time-course considerations. Sports Medicine,
38(7), 579–606.
73. Scalzo, R., Davis, J., Beals, J., Biela, L., Giordano, G., Paris, H. Miller, B.,
Hamilton, K., Bell, C. (2014). Oxidative stress is decreased with short-term Protandim®
use when piperine is substituted for ashwagandha [abstract]. FASEB Journal, 28: LB399.
74. Tan, X. L, Spivack, S.D (2009). Dietary chemoprevention strategies for induction
of phase II xenobiotic-metabolizing enzymes in lung carcinogenesis: a review. Lung
Cancer 65: 129–137. doi: 10.1016/j.lungcan.2009.01.002
75. Bland, J. M., Altman, D. G. (1996) Measurement error. British Medical Journal.
312(7047), 1654.
76. Hopkins, W. G. (2000). Measures of reliability in sports medicine and science.
Sports Medicine 30(1), 1-15.
77. Bergner, M. (1989). Quality of life, health status, and clinical research. Medical
Care, 27(3 Suppl), S148-S156

76
78. Age Grading. http://www.usatf.org/statistics/calculators/agegrading/. USATF;
2015.
79. Temperature and dew point for pace adjustments.
http://maximumperformancerunning.blogspot.com/2013/07/temperature-dew-point.html.
Maximum Performance Running; 2013.

77
Table 1. Blood parameters measured by Genova Diagnostics29:
Parameter Method of analysis Reference range
Reserve
Glutathione (GSH) Colorimetric assay ≥ 669 μmol/L
Total Antioxidant Capacity
(TAC)
Enzymatic reaction
assay
≥ 0.54 mmol/L
Cysteine (Cys-SH) Colorimetric assay 0.61 to 1.16 mg/dL
Sulfate Turbidimetric assay 3.0 to 5.9 mg/dL
Cysteine to Sulfate ratio - 0.12 to 0.32
Cystine (Cys-S-S-Cys) Colorimetric assay 1.60 to 3.22 mg/dL
Cysteine/Cystine Ratio - 0.23 to 0.53
Protective Enzymes
Glutathione Peroxidase (GPX) Enzymatic reaction
assay
20 to 38 U/g Hb
Superoxide Dismutase (SOD) Colorimetric assay 5275 to 1662 U/g Hb
Damage
Lipid Peroxides Thiobarbituric acid-
reacting substances
(TBARS) assay
< 10 μmol/L

78
Table 2. Baseline anthropometric characteristics, baseline 5-km time-trial results, and baseline fasting blood glucose results
Variables Protantim (n=19)
Placebo (n=19)
p -value
Combined Mean
(n = 38)
Age (yrs) 34 (6)
[23 to 44] 35 (8)
[20 to 46] 0.56 34 (7)
[20 to 46]
Weight (kg) 68.1 (11.4)
[42.6 to 88.6] 64.6 (11.1)
[47.5 to 88.5] 0.34 66.4 (11.2)
[42.6 to 88.6]
Height (cm) 174 (10)
[155 to 191] 171 (11)
[155 to 188]
0.30 172 (11)
[155 to 191]
BMI (kg/m²) 22.3 (2.1) [17.7 to 26.3]
22.1 (2.7) [18.6 to 27.6] 0.82 22.2 (2.4)
[17.7 to 27.6] 5-km time (sec)
1225 (136)
[1047 to 1450]
1210 (121)
[1029 to 1469] 0.72
1217 (128)
[1029 to 1469] 5-km time (min) 20.4 (2.3) 20.2 (2.0) 0.72 20.3 (2.1) [17.5 to 24.2] [17.2 to 24.5] [17.2 to 24.5] % of world record for age and gender
68% (4%) [61% to 76%]
69% (6%) [60% to 81%] 0.34
69% (5%) [60% to 81%]
Fasting blood glucose (mg/dL)
90 (5) [81 to 97]
89 (9) [73 to 104] 0.73
90 (7) [73 to 104]
Mean (SD), [range], 22 subjects (58% of the sample) was classified as Local Class, 15 subjects (40% of the sample) was classified as Regional Class, one subject (3% of the sample) was classified as National Class. Baseline 5-km time trial performance was taken as the best result between two baseline 5-km time trials held one week apart. Baseline fasting blood glucose values was the average fasting blood glucose values for both baseline sessions held one week apart. All variables were normally distributed (Shapiro-Wilk test p > 0.05 for all).

79
Table 3. Baseline blood results.
Variables Protandim® (n=19)
Placebo (n=19)
p -value
Combined Mean
(n = 38)
Reference Range
Reserve
Glutathione (GSH) (μmol/L) ≥ 669
1051 (148) [785 to 1412]
1016 (189) [740 to 1370] 0.54
1033 (169) [740 to 1412]
≥ 669
Total Antioxidant Capacity (TAC) (mmol/L)
0.86 (0.07) [0.73 to 1.05]
0.85 (0.06) [0.52 to 0.79] 0.98
0.86 (0.06) [0.73 to 1.05]
≥ 0.54
Cysteine (mg/dL) 0.67 (0.13)
[0.40 to 0.87] 0.63 (0.07)
[0.52 to 0.79]
0.29
0.65 (0.11) [0.40 to 0.87]
0.46-1.20
Cystine (mg/dL) 2.1 (0.4) [1.4 to 3.0]
2.2 (0.3) [1.6 to 3.0] 0.14 2.1 (0.4)
[1.4 to 3.0] 1.6-3.2
Cysteine to Cystine ratio
0.34 (0.11)
[0.18 to 0.59]
0.29 (0.07)
[0.21 to 0.48] 0.14
0.32 (0.09)
[0.18 to 0.59]
0.17-0.50
Sulphate (mg/dl) 3.8 (0.4) 3.9 (0.9) 3.9 (0.7) 3.0-5.9 [2.9 to 4.7] [2.7 to 5.9] 0.60 [2.7 to 5.9] Cysteine to Sulphate ratio
0.18 (0.05) [0.09 to 0.27]
0.17 (0.04) [0.09 to 0.25] 0.51 0.18 (0.04)
[0.09 to 0.27] 0.12-0.32
Protective enzymes Superoxide dismutase (SOD, U/g Hb x 1000)
11.4 (3.1) [6.0 to 17.9]
11.7 (3.7) [4.0 to 18.5] 0.79
11.5 (3.4) [4.0 to 18.5]
5.3-16.7
Glutathione Peroxidase (GPX, U/g Hb)
28.1 (4.6) [22.1 to 36.6]
28.4 (7.4) [18.7 to 43.2] 0.87
28.2 (6.1) [18.7 to 43.2]
20-38
Damage Lipid Peroxides (TBARs, μmol/L)
8.2 (2.0) [5.1 to 11.6]
7.9 (1.9) [4.8 to 10.8] 0.67
8.0 (1.9) [4.8 to 11.6]
≤ 10
Mean (SD), [range], baseline blood parameters in a fasted state was determined to be the mean of two baseline sessions held one week apart. All variables were normally distributed except for the cysteine to cystine ratio and GSH. For GSH, one extreme outlier was removed. A non-parametric Mann Whitney t-test was use to compare groups for the cysteine to cystine ratio.

80
Table 4. The week to week coefficient of variation in the blood variables. All blood variables were measured by Genova Diagnostics (n = 38).
Blood Profile components Week-to-week coefficient of variation (%)
(at rest, fasted)
Correlation between session
1 at baseline versus session 2 at baseline (r)
Percent of shared variance between
both baseline sessions
(r2 x 100) RESERVE Glutathione (GSH) (μmol/L) 16% 0.52*
[0.24 to 0.72]
27% [6% to 52%]
Total Antioxidant Capacity (TAC) (mmol/L)
7% 0.45* [0.15 to 0.67]
20% [2% to 45%]
Cysteine (mg/dL) 19% 0.24 [-0.08 to 0.52]
6% [1% to 27%]
Cystine (mg/dL) 13% 0.62* [0.37 to 0.78]
38% [14% to 61%]
Cysteine to Cystine ratio 27% 0.41* [0.11 to 0.65]
17% [1% to 42%]
Sulphate (mg/dL) 19% 0.40* [0.10 to 0.64]
16% [1% to 41%]
Cysteine to Sulphate ratio 24% 0.37* [0.06 to 0.62]
14% [0% to 37%]
PROTECTIVE ENZYMES Superoxide Dismutase (SOD) (U/g Hb)
24% 0.52* [0.24 to 0.72]
27% [6% to 52%]
Glutathione Peroxidase (GPX) (U/g Hb)
15% 0.80* [0.64 to 0.89]
64% [41% to 79%]
DAMAGE Lipid peroxides (TBARS, μmol/L)
26% 0.37* [0.06 to 0.62]
14% [0% to 38%]
OTHER Fasting Blood Glucose (mg/dL) 5% 0.64*
[0.40 to 0.80] 41%
[16% to 64%] Brackets signify the 95% confidence interval. * The correlation between baseline week 1 and baseline week 2 is statistically significant p < 0.05
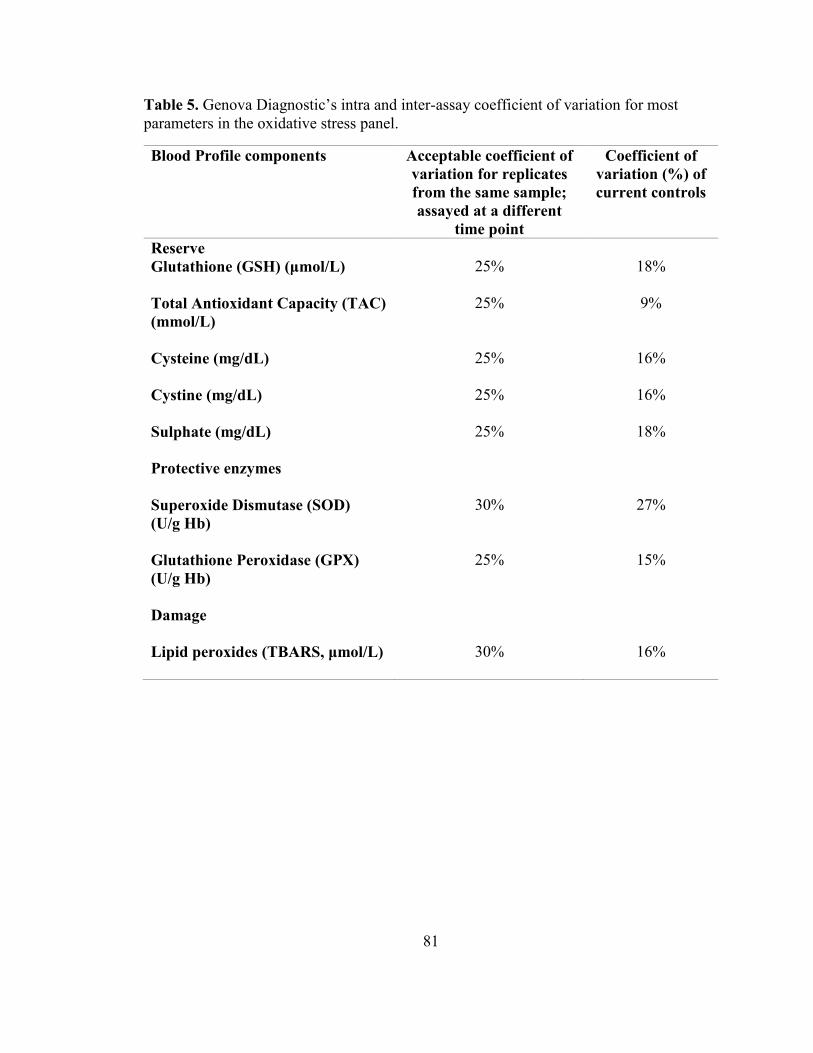
81
Table 5. Genova Diagnostic’s intra and inter-assay coefficient of variation for most parameters in the oxidative stress panel.
Blood Profile components Acceptable coefficient of variation for replicates from the same sample; assayed at a different
time point
Coefficient of variation (%) of current controls
Reserve Glutathione (GSH) (μmol/L) 25% 18%
Total Antioxidant Capacity (TAC) (mmol/L)
25% 9%
Cysteine (mg/dL) 25% 16% Cystine (mg/dL)
25%
16%
Sulphate (mg/dL) 25% 18%
Protective enzymes
Superoxide Dismutase (SOD) (U/g Hb)
30% 27%
Glutathione Peroxidase (GPX) (U/g Hb)
25% 15%
Damage
Lipid peroxides (TBARS, μmol/L)
30% 16%

82
Table 6. The aerobic training index between groups. This is the total amount of physical activity in minutes over a two week period multiplied by the average rating of perceived exertion value.
Variables
Baseline (pre-supplementation)
88 days post-supplementation
Mean Difference
(n = 38)
Protandim® n = 15
6457 (4497) [4901]
5753 (5340) [4474]
-704 (2836)
Placebo n = 19
7982 (5992) [6235]
9184 (5302) [8864]
+1202 (3891)
Mean (SD), [median], Median values are also reported due to non-normal distribution. For the baseline value, the total amount of physical activity in minutes over the previous two week period prior to the issue of the supplement was multiplied by the average rating of perceived exertion value for those two weeks. (6 = no exertion to 20 = maximal exertion). For the post-test period, the total amount of physical activity in minutes over the previous two week period prior to the 88 days post-supplementation period was multiplied by the average the average rating of perceived exertion value for those two weeks. The changes in the aerobic training index was not different between groups (t = -1.63, p = 0.11)
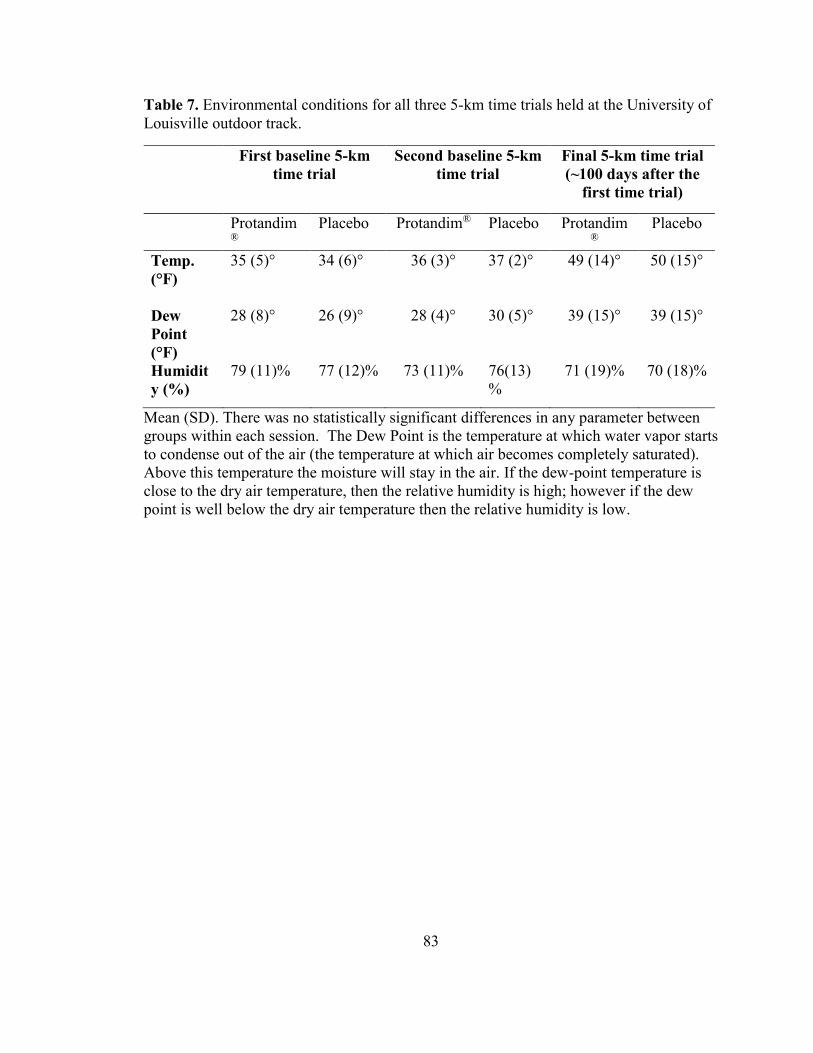
83
Table 7. Environmental conditions for all three 5-km time trials held at the University of Louisville outdoor track.
First baseline 5-km time trial
Second baseline 5-km time trial
Final 5-km time trial (~100 days after the
first time trial)
Protandim®
Placebo Protandim® Placebo Protandim®
Placebo
Temp. (°F)
35 (5)° 34 (6)° 36 (3)° 37 (2)° 49 (14)° 50 (15)°
Dew Point (°F)
28 (8)° 26 (9)° 28 (4)° 30 (5)° 39 (15)° 39 (15)°
Humidity (%)
79 (11)% 77 (12)% 73 (11)% 76(13)%
71 (19)% 70 (18)%
Mean (SD). There was no statistically significant differences in any parameter between groups within each session. The Dew Point is the temperature at which water vapor starts to condense out of the air (the temperature at which air becomes completely saturated). Above this temperature the moisture will stay in the air. If the dew-point temperature is close to the dry air temperature, then the relative humidity is high; however if the dew point is well below the dry air temperature then the relative humidity is low.

84
Table 8. Summary probabilities for all blood parameters at rest using a 2 x 4 repeated measures ANOVA.
Repeated measures ANOVA results
Main effect of group
Main effect of Time
Group x Time
interaction effect
RESERVE Glutathione (GSH) (μmol/L)
0.51 < 0.001* (Partial η2 = 0.26)
0.27
Total Antioxidant Capacity (TAC) (mmol/L)
0.68 < 0.001* (Partial η2 = 0.31)
0.85
Cysteine (mg/dL) 0.60 0.055 (Partial η2 = 0.07)
0.21
Cystine (mg/dL) 0.52 0.038* (Partial η2 = 0.08)
0.23
Cysteine to Cystine ratio 0.30 0.14 (Partial η2 = 0.05)
0.35
Sulphate (mg/dL)
0.66
0.001*
(Partial η2 = 0.15)
0.84
Cysteine to Sulphate ratio 0.69 0.002* (Partial η2 = 0.13)
0.48
PROTECTIVE ENZYMES Superoxide Dismutase (SOD) (U/g Hb)
0.81 < 0.001* (Partial η2 = 0.40)
0.55
Glutathione Peroxidase (GPX) (U/g Hb)
0.66 < 0.001* (Partial η2 = 0.23)
0.851
DAMAGE Lipid Peroxides (TBARS, μmol/L)
0.74 0.31 (Partial η2 = 0.035)
0.38
OTHER Fasting Blood Glucose (mg/dL)
0.67 0.01 (Partial η2 = 0.15)
0.26
*Statistical significance of p < 0.05 or lower. The partial η2 is the partial eta squared.
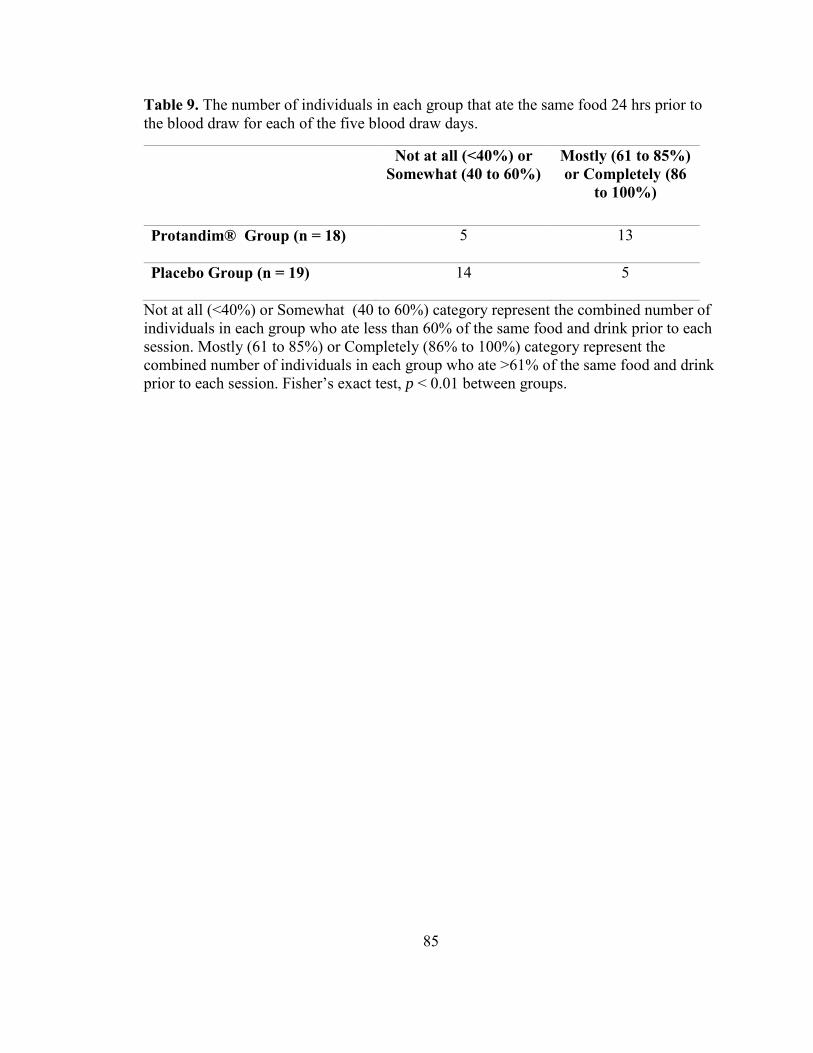
85
Table 9. The number of individuals in each group that ate the same food 24 hrs prior to the blood draw for each of the five blood draw days.
Not at all (<40%) or Somewhat (40 to 60%)
Mostly (61 to 85%) or Completely (86
to 100%)
Protandim® Group (n = 18) 5 13
Placebo Group (n = 19) 14 5
Not at all (<40%) or Somewhat (40 to 60%) category represent the combined number of individuals in each group who ate less than 60% of the same food and drink prior to each session. Mostly (61 to 85%) or Completely (86% to 100%) category represent the combined number of individuals in each group who ate >61% of the same food and drink prior to each session. Fisher’s exact test, p < 0.01 between groups.

86
Table 10. Pre and post exercise blood values from both baseline sessions and at 88 days post-supplementation. Both groups were combined due to lack of a between group effect.
Pre-exercise
10-minutes post exercise
change p value
Damage Lipid Peroxides (TBARs, μmol/L) Baseline week 1 8.7 (3.4) 9.4 (2.4) +0.6 (3.1) 0.21 Baseline week 2 7.4 (2.2)# 7.5 (2.1) +0.1 (1.7) 0.78 Average of both baseline weeks 8.1 (1.9) 8.4 (2.4) +0.4 (1.8) 0.22 88 days post-supplementation 7.6 (3.2) 7.1 (2.5) -0.5 (3.6) 0.47 Protective Enzymes
Superoxide dismutase (SOD, U/g Hb x 1000)
Baseline week 1 11.8 (3.3) 12.2 (3.4) +0.3 (1.5) 0.17 Baseline week 2 11.2 (4.4) 11.1 (4.3) -0.1 (1.7) 0.66 Average of both baseline weeks 11.5 (3.4) 11.6 (3.3) +0.1 (1.1) 0.55 88 days post-supplementation 19.3 (7.1) 19.9 (7.0) +0.5 (3.1) 0.35 Glutathione Peroxidase (GPX, U/g Hb)
Baseline week 1 29.5 (8.1) 29.3 (7.7) -0.2 (2.6) 0.63 Baseline week 2 26.9 (4.6)# 27.0 (4.6) +0.1 (1.9) 0.68 Average of both baseline weeks 28.2 (6.1) 28.2 (5.9) 0.0 (1.6) 0.88 88 days post-supplementation 31.3 (6.4) 31.4 (5.9) +0.1 (3.1) 0.89 Other
Glucose levels (fasted) (mg/dL) Baseline week 1 92 (7) 165 (33) +72 (31) <0.01 Baseline week 2 90 (7) 158 (36) +68 (37) <0.01 Average of both baseline weeks 91 (7) 161 (31) +70 (29) <0.01 88 days post-supplementation 91 (8) 163 (44) +72 (41) <0.01 Reserve
Glutathione (GSH) (μmol/L) Baseline week 1 1087 (252) 1076 (223) -11 (131) 0.61 Baseline week 2 1013(196)# 998 (206) -15 (200) 0.64 Average of both baseline weeks 1033 (169) 1023 (165) -11 (84) 0.45 88 days post-supplementation 999 (235) 1042 (186) +43 (229) 0.27
Mean (SD). Both Protandim® and placebo groups were combined due to the fact that there were no differences between them. Probability values compares post-exercise with pre-exercise within each session. n = 38 for both baseline sessions, n = 35 at 88 days post-supplementation period. # p < 0.05 compared to baseline week 1 . # Baseline week 2 pre-exercise is significantly different compared to Baseline week 1 pre-exercise (p < 0.05).

87
Table 11. Pre and post exercise blood values at both baseline sessions and at 88 days post-supplementation. Both groups were combined due to lack of a between group effect.
Pre-exercise
10-min post exercise
change p-value
Reserve Total Antioxidant Capacity (TAC) (mmol/L)
Baseline week 1 0.86 (0.06) 0.96 (0.08) +0.11 (0.07) < 0.01 Baseline week 2 0.87 (0.08) 0.98 (0.09) +0.11 (0.07) < 0.01 Average of both baseline weeks 0.86 (0.06) 0.97 (0.07) +0.11 (0.05) < 0.01 88 days post-supplementation 0.80 (0.06) 0.91 (0.08) +0.11 (0.04) < 0.01 Cysteine (mg/dL) Baseline week 1 0.62 (0.14) 0.65 (0.13) +0.02 (0.11) 0.18 Baseline week 2 0.68(0.14)# 0.72 (0.17) +0.05 (0.18) 0.13 Average of both baseline weeks 0.65 (0.11) 0.69 (0.12) +0.03 (0.11) 0.06 88 days post-supplementation 0.59 (0.13) 0.64 (0.16) +0.04 (0.12) 0.04 Cystine (mg/dL) Baseline week 1 2.1 (0.4) 2.2 (0.4) +0.1 (0.4) 0.15 Baseline week 2 2.2 (0.5) 2.2 (0.4) +0.1 (0.3) 0.03 Average of both baseline weeks 2.1 (0.4) 2.2 (0.4) +0.1 (0.3) 0.02 88 days post-supplementation 2.1 (0.3) 2.2 (0.5) 0.0 (0.4) 0.63 Cysteine to Cystine ratio Baseline week 1 0.31 (0.10) 0.31 (0.10) 0.0 (0.08) 0.98 Baseline week 2 0.33 (0.12) 0.33 (0.14) 0.0 (0.12) 0.85 Average of both baseline weeks 0.32 (0.10) 0.32 (0.10) 0.0 (0.08) 0.81 88 days post-supplementation 0.29 (0.09) 0.39 (0.56) 0.10 (0.56) 0.28 Sulphate (mg/dL) Baseline week 1 3.6 (0.8) 3.8 (0.9) +0.2 (0.7) 0.08 Baseline week 2 4.1 (0.8)# 4.6 (1.3) +0.5 (1.2) 0.02 Average of both baseline weeks 3.9 (0.7) 4.2 (0.9) +0.3 (0.8) 0.01 88 days post-supplementation 3.8 (0.7) 4.1 (0.8) +0.3 (0.5) < 0.01 Cysteine to Sulphate ratio Baseline week 1 0.18 (0.06) 0.18 (0.06) 0.0 (0.04) 0.69 Baseline week 2 0.17 (0.05) 0.17 (0.06) 0.0 (0.05) 0.72 Average of both baseline weeks 0.18 (0.04) 0.17 (0.05) 0.0 (0.04) 0.67 88 days post-supplementation 0.16 (0.04) 0.16 (0.04) 0.0 (0.04) 0.96
Mean (SD). Both Protandim® and placebo groups were combined due to the fact that there were no differences between them. Probability values compares post-exercise with pre-exercise within each session. n = 38 for both baseline sessions, n = 35 at 88 days post-supplementation period. # Baseline week 2 pre-exercise is significantly different compared to Baseline week 1 pre-exercise (p < 0.05).

88
Table 12. The total number of participants and events of a given sign / symptom over the supplementation period of 88 days.
Signs/ Symptoms Protandim®
(n=19) Placebo (n=19)
Total number of events from both groups over 88
days Stomach Ache 5(18) 2(2) 20
Diarrhea 5(10) 2(12) 22
Vomiting 2(2) (2) 4
Headache 6(40) 3(12) 52
Rash (Hands/Feet) 0 0 0
Gas 1(51) 4(137) 188
Drowsiness 2(3) 4(17) 20
Constipation 2(17) 1(8) 25
Nausea 5(17) 2(7) 24
Dizziness 5(33) 2(5) 38
Insomnia 1(1) (0) 1
Itching 1(8) 0 8
Joint Pain 2(12) 3(6) 18
Low Blood Sugar 2(18) (0) 18
Low Blood Pressure 0 0 0
Head cold / congestion
1(1) 0 1
Increased appetite (0) (1) 1
Total (233) (220) 453

89
The numbers outside of parentheses represents the number of individuals who had the sign or symptom over the supplementation period. The numbers within the parentheses represent the number of events in each group compared to the summed total of both groups.
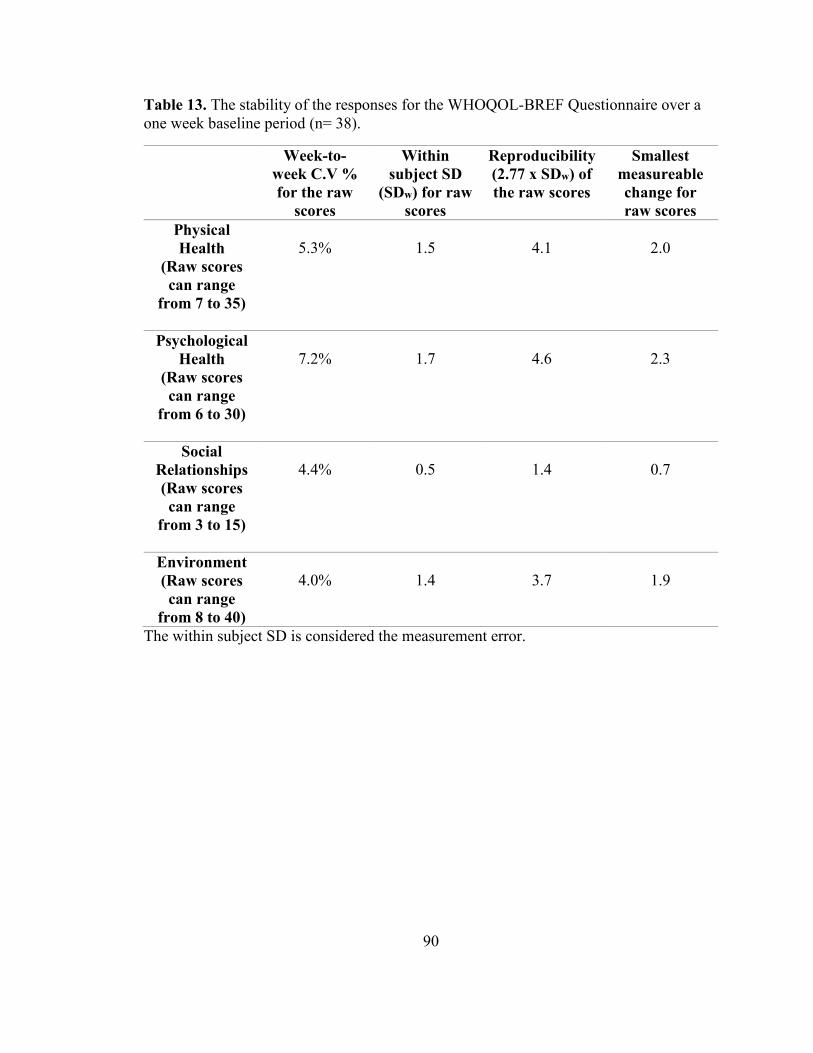
90
Table 13. The stability of the responses for the WHOQOL-BREF Questionnaire over a one week baseline period (n= 38).
Week-to-week C.V % for the raw
scores
Within subject SD
(SDw) for raw scores
Reproducibility (2.77 x SDw) of the raw scores
Smallest measureable change for raw scores
Physical Health
(Raw scores can range
from 7 to 35)
5.3%
1.5
4.1
2.0
Psychological Health
(Raw scores can range
from 6 to 30)
7.2%
1.7
4.6
2.3
Social Relationships (Raw scores can range
from 3 to 15)
4.4%
0.5
1.4
0.7
Environment (Raw scores can range
from 8 to 40)
4.0%
1.4
3.7
1.9
The within subject SD is considered the measurement error.
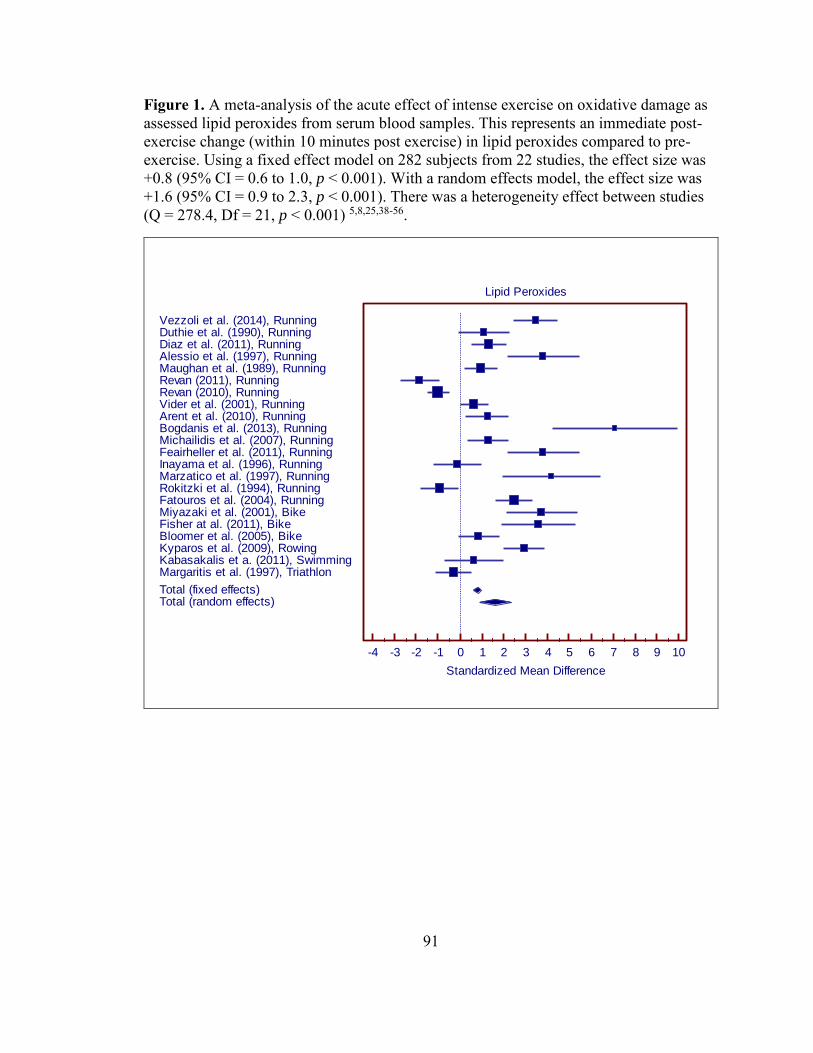
91
Figure 1. A meta-analysis of the acute effect of intense exercise on oxidative damage as assessed lipid peroxides from serum blood samples. This represents an immediate post-exercise change (within 10 minutes post exercise) in lipid peroxides compared to pre-exercise. Using a fixed effect model on 282 subjects from 22 studies, the effect size was +0.8 (95% CI = 0.6 to 1.0, p < 0.001). With a random effects model, the effect size was +1.6 (95% CI = 0.9 to 2.3, p < 0.001). There was a heterogeneity effect between studies (Q = 278.4, Df = 21, p < 0.001) 5,8,25,38-56.
Lipid Peroxides
-4 -3 -2 -1 0 1 2 3 4 5 6 7 8 9 10
Standardized Mean Difference
Vezzoli et al. (2014), RunningDuthie et al. (1990), RunningDiaz et al. (2011), RunningAlessio et al. (1997), RunningMaughan et al. (1989), RunningRevan (2011), RunningRevan (2010), RunningVider et al. (2001), RunningArent et al. (2010), RunningBogdanis et al. (2013), RunningMichailidis et al. (2007), RunningFeairheller et al. (2011), RunningInayama et al. (1996), RunningMarzatico et al. (1997), RunningRokitzki et al. (1994), RunningFatouros et al. (2004), RunningMiyazaki et al. (2001), BikeFisher at al. (2011), BikeBloomer et al. (2005), BikeKyparos et al. (2009), RowingKabasakalis et a. (2011), SwimmingMargaritis et al. (1997), Triathlon
Total (fixed effects)Total (random effects)

92
Figure 2. A meta-analysis of the acute effect of intense exercise on superoxide dismutase concentration from serum blood samples. This represents an immediate post-exercise change (within 10 minutes post exercise) in superoxide dismutase compared to pre-exercise. Using a fixed effect model on 85 subjects from 8 studies, the effect size was +0.7 (95% CI = 0.4 to 1.0, p < 0.001). With a random effects model, the effect size was +1.2 (95% CI = 0.2 to 2.0, p = 0.014). There was a heterogeneity effect between studies (Q = 50.7, Df = 7, p < 0.001) 40,42,45,48,50,51,54,55.
Superoxide Dismutase
-3.0 -2.0 -1.0 0.0 1.0 2.0 3.0 4.0 5.0
Standardized Mean Difference
Miyazaki et al. (2001), Running
Margaritis et al. (1997), Running
Vider et al. (2001), Running
Marzatico et al. (1997), Running
Duthie et al (1990), Running
Diaz et al. (2011), Running
Feairhellar et al. (2011), Running
Fisher et al. (2011), Biking
Total (fixed effects)
Total (random effects)

93
Figure 3. A meta-analysis of the acute effect of intense exercise on glutathione peroxidase concentration from serum blood samples. This represents an immediate post-exercise change (within 10 minutes post exercise) in Glutathione Peroxidase compared to pre-exercise. Using a fixed effect model on 167 subjects from 11 studies, the effect size was +0.5 (95% CI = 0.3 to 0.7, p < 0.001). With a random effects model, the effect size was +0.8 (95% CI = 0.3 to 1.3, p = 0.004). There was a heterogeneity effect between studies (Q = 54.6, Df = 10, p < 0.001) 8,19,40,42,45,49,50,52,54,55.
Glutathione Peroxidase
-2.0 -1.5 -1.0 -0.5 0.0 0.5 1.0 1.5 2.0 2.5 3.0 3.5 4.0 4.5 5.0
Standardized Mean Difference
Fatouros et al. (2004), Running
Revan et al. (2010), Running
Rokitzki et al. (1994), Running
Marzatico et al. (1997), Running
Mullins et al. (2013), Running
Margaritis et al. (1997), Running
Miyazaki et al. (2001), Running
Vider et al. (2001), Running
Duthie et al (1990), Running
Fisher et al. (2011), Biking
Bogdanis et al. (2013), Biking
Total (fixed effects)
Total (random effects)

94
Figure 4. A meta-analysis of the acute effect of intense exercise on total antioxidant capacity from serum blood samples. This represents an immediate post-exercise change (within 10 minutes post exercise) in total antioxidant capacity compared to pre-exercise. Using a fixed effect model on 143 subjects from 9 studies, the effect size was +0.5 (95% CI = 0.2 to 0.7, p < 0.001). With a random effects model, the effect size was +1.2 (95% CI = 0.3 to 2.0, p = 0.007). There was a heterogeneity effect between studies (Q = 81.3, Df = 8, p < 0.001) 13,19,25,28,38,39,45,48,49,52.
Data taken from Kyparos et al. (2009 and 2012) seemed to be the same data published in both articles.
Total Antioxidant Capacity
-2 -1 0 1 2 3 4 5 6 7 8 9 10
Standardized Mean Difference
Diaz et al. (2011), Running
Fatouros et al. (2004), Running
Mullins et al. (2013), Running
Michailidis et al. (2007), Running
Vider et al. (2001), Running
Bogdanis et al. (2013), Biking
Kyparos et al. (2009, 2012), Rowing
Kabaskalis et al. (2011), Swimming
Finaud et al (2006), Rugby
Total (fixed effects)
Total (random effects)

95
Figure 5. A meta-analysis of the effect of long term chronic training on oxidative damage as assessed lipid peroxides from serum blood samples. This represents serum values in a rested state after a period of long term training. Using a fixed effect model on 61 subjects from 5 studies, the effect size was +0.2 (95% CI = -0.2 to +0.7, p = 0.32). With a random effects model, the effect size was +1.6 (95% CI = -1.4 to +4.5, p = 0.30). Thus, no effect of long term training on serum lipid peroxides values. There was a heterogeneity effect between studies (Q = 121.7, Df = 4, p < 0.001) 43,49,52,55,57.
Lipid Peroxides
-4 -3 -2 -1 0 1 2 3 4 5 6 7 8 9 10 11 12
Standardized Mean Difference
Vezzoli et al. (2014), Running
Fatouros et al. (2004), Running
Leonardo-Mendonça et al. (2014), Biking
Bogdanis et al. (2013), Biking
Miyazaki et al (2001), Biking
Total (fixed effects)
Total (random effects)

96
Figure 6. A meta-analysis of the effect of long term training on superoxide dismutase concentration from serum blood samples. This represents serum values in a rested state after a period of long term training. Using a fixed effect model on 26 subjects from 2 studies, the effect size was +0.4 (95% CI = -0.1 to 1.0, p = 0.13). With a random effects model, the effect size was +0.4 (95% CI = 0.1 to 1.0, p = 0.13). There was no heterogeneity effect between studies (Q = 0.30, Df = 1, p = 0.58). There was no long term training effects of superoxide dismutase 55,58.
Superoxide Dismutase
-1.00 -0.75 -0.50 -0.25 0.00 0.25 0.50 0.75 1.00 1.25 1.50
Standardized Mean Difference
Elosua et al. (2003), Running
Miyazaki et al. (2001), Running
Total (f ixed effects)
Total (random effects)

97
Figure 7. A meta-analysis of the effect of long term training on glutathione peroxidase concentration from serum blood samples. This represents serum values in a rested state after a period of long term training. Using a fixed effect model on 53 subjects from 4 studies, the effect size was +1.0 (95% CI = 0.5 to 1.4, p < 0.001). With a random effects model, the effect size was +1.0 (95% CI = -0.7 to +2.6, p = 0.27). There was heterogeneity effect between studies (Q = 42.4, Df = 3, p < 0.001). There was no long term effect of training on glutathione peroxidase concentration from the random effects model 49,52,55,58.
Glutathione Peroxidase
-3.0 -2.5 -2.0 -1.5 -1.0 -0.5 0.0 0.5 1.0 1.5 2.0 2.5 3.0 3.5 4.0 4.5 5.0
Standardized Mean Difference
Fatouros et al. (2004), Running
Miyazaki et al. (2001), Running
Elosua et al. (2003), Running
Bogdanis et al. (2013), Biking
Total (f ixed effects)
Total (random effects)

98
Figure 8. A meta-analysis of the effect of long term training on total antioxidant capacity from serum blood samples. This represents serum values in a rested state after a period of long term training. Using a fixed effect model on 42 subjects from 4 studies, the effect size was +0.5 (95% CI = 0.0 to 0.9, p = 0.065). With a random effects model, the effect size was +0.9 (95% CI = -1.0 to +2.8, p = 0.34). There was heterogeneity effect between studies (Q = 38.7, Df = 3, p < 0.001). There was no long term effect of training on total antioxidant capacity 43,49,52,57.
Total Antioxidant Capacity
-4 -3 -2 -1 0 1 2 3 4 5 6 7 8
Standardized Mean Difference
Vezzoli et al. (2014), Running
Fatouros et al. (2004), Running
Bogdanis et al. (2013), Biking
Leonardo-Mendonça et al. (2014), Biking
Total (f ixed effects)
Total (random effects)

99
Figure 9. Normal subjects before supplementation with Protandim®16.

100
Figure 10. Group 1 subjects supplemented with Protandim® for 120 days showed a significant increase (*) in erythrocyte superoxide dismutase (SOD) of 30% (SD 10%) (n = 10, p < 0.01)16.

101
Figure 11. Group 2 subjects supplemented with Protandim® at 338 mg/day for 30 day showed a substantial decline in TBARS at 5 and 12 days (squares, n = 4). By 30 days, the levels of plasma TBARS dropped an average of 50% (p < 0.03). The closed circle shows the average TBARS of the Group 1 (675 mg/day) subjects after 30 days, which is not significantly different16.

102
Figure 12. The 5-km time trial performance times between the post-supplementation period and baseline (minutes). There was no significant differences between groups (p = 0.91), there was no significant differences between the two time-points (p = 0.19), and there was no interaction effect between group and time (p = 0.84)
5-k
m t
ime
-tri
al p
erf
orm
an
ce
(m
inu
tes
)
0.0
2.5
5.0
7.5
10.0
12.5
15.0
17.5
20.0
22.5
25.0
Protandim
Placebo
Baseline (Day 0) 88 (4) days post-supplmentation

103
Figure 13. Box-and-whisker plots of the change in 5-km time trial performance (minutes) between post-supplementation period and baseline (post – pre). There was no significant differences between groups (p = 0.84, n = 16 in the Protandim® group, n = 19 in the placebo group). The 10th, 25th, 75th, and 90th percentiles are vertical boxes with error bars. The middle horizontal line across each box represents the 50th percentile. The solid circles represent the lowest and highest value in each group, usually the 5th and 95th percentiles for each group. One outlier was present in the Protandim® group (+1.6 minutes). An outlier is defined as larger than the upper quartiles plus 1.5 times the interquartile range)
Dif
fere
nc
e b
etw
ee
n p
os
t-s
up
ple
me
nta
tio
n
5-k
m t
ria
l p
erf
orm
an
ce
an
d b
as
elin
e (
min
ute
s)
-1.25
-1.00
-0.75
-0.50
-0.25
0.00
0.25
0.50
0.75
1.00
1.25
1.50
1.75
Protandim Placebo

104
Figure 14. The long term effects of supplementation on various blood parameters (rest, fasted state). There was no difference between groups for either variable. (*p < 0.05 compared to baseline). Mean values represented by circles, error bars represent SD.
Lip
id P
ero
xid
es
(U
/g H
b)
0
1
2
3
4
5
6
7
8
9
10
11
12
13
14
15
Protandim
Placebo
Su
pe
rox
ide
Dis
mu
tas
e (
U/g
Hb
)
0
5000
10000
15000
20000
25000
30000
35000
Number of days post-supplementation
Baseline
(Day 0)30 (2) 57 (2) 88(4)
*
*

105
Figure 15. The long terms effects of supplementation on various blood parameters (rest, fasted state). There was no difference between groups for either variable. (*p < 0.05 compared to baseline). Mean values represented by circles, error bars represent SD.
Glu
tath
ion
e P
ero
xid
as
e (
U/g
Hb
)
0
5
10
15
20
25
30
35
40
Protandim
Placebo
*W
ho
le B
loo
d G
luta
thio
ne
(U
mo
l/L
)
0
200
400
600
800
1000
1200
1400
1600
1800
Number of days post-supplementation
Baseline
(Day 0)
30 (2) 57 (2) 88 (4)
*

106
Figure 16. The long terms effects of supplementation on various blood parameters (rest, fasted state). There was no difference between groups for either variable. (*p < 0.05 compared to baseline). Mean values represented by circles, error bars represent SD.
To
tal A
nti
ox
ida
nt
Ca
pa
cit
y (
mm
ol/L
)
0.0
0.1
0.2
0.3
0.4
0.5
0.6
0.7
0.8
0.9
1.0
1.1Protandim
Placebo
* *
Su
lph
ate
(m
g/d
L)
0.0
0.5
1.0
1.5
2.0
2.5
3.0
3.5
4.0
4.5
5.0
Number of days post-supplementation
Baseline
(Day 0)
30 (2) 57 (2) 88 (4)
*

107
Figure 17. The long terms effects of supplementation on various blood parameters (rest, fasted state). There was no difference between groups for either variable, and there was no difference in these variables at any time point (p > 0.05). Mean values represented by circles, error bars represent SD.
Cy
ste
ine
(m
g/d
L)
0.0
0.1
0.2
0.3
0.4
0.5
0.6
0.7
0.8
0.9
1.0
Protandim
Placebo
Cy
sti
ne
(m
g/d
L)
0.00
0.25
0.50
0.75
1.00
1.25
1.50
1.75
2.00
2.25
2.50
2.75
Number of days post-supplementation
Baseline
(Day 0)
30 (2) 57 (2) 88 (4)

108
Figure 18. The long terms effects of supplementation on various blood parameters (rest, fasted state). There was no difference between groups for either variable. (*p < 0.05 compared to baseline). Mean values represented by circles, error bars represent SD.
Cy
ste
ine
to
Cy
sti
ne
Ra
tio
0.00
0.05
0.10
0.15
0.20
0.25
0.30
0.35
0.40
0.45
0.50
0.55
0.60
Protandim
Placebo
Cy
ste
ine
to
Su
lph
ate
Ra
tio
0.000
0.025
0.050
0.075
0.100
0.125
0.150
0.175
0.200
0.225
0.250
Number of days post-supplementation
Baseline
(Day 0)
30 (2) 57 (2) 88 (4)
*

109
Figure 19. Acute changes in blood parameters of oxidative stress between rest and 10-minutes post exercise at baseline and 88 days post-supplementation. There was no difference between groups nor was there any difference between baseline and post supplementation periods. Mean values represented by circles, error bars represent SD.
Ch
an
ge
in
Lip
id P
ero
xid
es,
po
st -
pre
e
xe
rcis
e (
TB
AR
S,
um
ol/
L)
-6
-4
-2
0
2
4
6
Ch
an
ge
in
Su
pe
rox
ide
Dis
mu
tase
,
po
st -
pre
ex
erc
ise
(U
/g H
b)
-4000
-3000
-2000
-1000
0
1000
2000
3000
4000
Ch
an
ge
in
Glu
tath
ion
e P
ero
xid
ase
,
po
st -
pre
ex
erc
ise
(U
/g H
b)
-4
-3
-2
-1
0
1
2
3
4
5
6
Protandim
Placebo
Baseline
(Day 0)88 (4)
Days post-supplementation

110
Figure 20. Acute changes in blood parameters of oxidative stress between rest and 10-minutes post exercise at baseline and 88 days post-supplementation. There was no difference between groups nor was there any difference between baseline and post supplementation periods. Mean values represented by circles, error bars represent SD.
Ch
an
ge
in
wh
ole
blo
od
Glu
tath
ion
e,
po
st -
pre
e
xe
rcis
e (
um
ol/
L)
-300
-200
-100
0
100
200
300
400
500
Ch
an
ge
in
To
tal
An
tio
xid
an
t C
ap
acit
y,
po
st -
pre
ex
erc
ise
(m
mo
l/L
)
-0.03
0.00
0.03
0.06
0.09
0.12
0.15
0.18
Ch
an
ge
in
Su
lph
ate
le
ve
ls,
po
st -
pre
ex
erc
ise
(m
g/d
L)
-1.0
-0.5
0.0
0.5
1.0
1.5
2.0
Protandim
Placebo
Baseline
(Day 0)88 (4)
Days post-supplementation
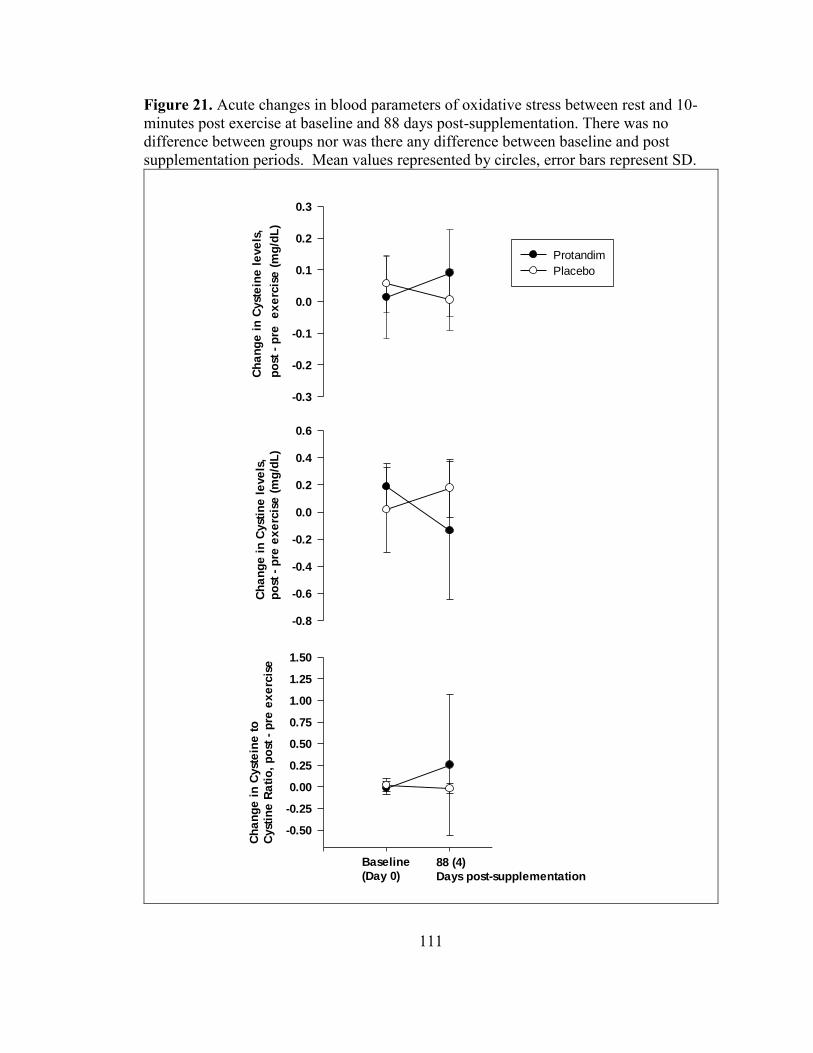
111
Figure 21. Acute changes in blood parameters of oxidative stress between rest and 10-minutes post exercise at baseline and 88 days post-supplementation. There was no difference between groups nor was there any difference between baseline and post supplementation periods. Mean values represented by circles, error bars represent SD.
Ch
an
ge
in
Cyst
ein
e l
eve
ls,
po
st -
pre
e
xe
rcis
e (
mg
/dL
)
-0.3
-0.2
-0.1
0.0
0.1
0.2
0.3
Ch
an
ge
in
Cyst
ine
le
ve
ls,
po
st -
pre
ex
erc
ise
(m
g/d
L)
-0.8
-0.6
-0.4
-0.2
0.0
0.2
0.4
0.6
Ch
an
ge
in
Cyst
ein
e t
o
Cyst
ine
Ra
tio
, p
ost
- p
re e
xe
rcis
e
-0.50
-0.25
0.00
0.25
0.50
0.75
1.00
1.25
1.50
Protandim
Placebo
Baseline
(Day 0)88 (4)
Days post-supplementation

112
Figure 22. World Health Organization Quality of life (BREF) raw scores. Upper panel A, circles, represent Physical Health scores, triangles represent Social Relationship scores. Lower panel B, circles, represent Psychological Health scores, triangles represent Environment scores. (Black = Protandim®, White = Placebo). Only at 88 days post-supplementation did the placebo group have higher “environment scores” compared to Protandim® (* p = 0.047). Mean values represented by circles and triangles, error bars represent SD.
Ra
w S
co
res
0
5
10
15
20
25
30
35
40
Ra
w S
co
res
5
10
15
20
25
30
35
40
45
Number of days post-supplementation
Baseline
(Day 0)30 (2) 57 (2) 88 (4)
*
A
B

113
CURRICULUM VITAE Seteena Leigh Ueberschlag
Key Qualifications
Certified Kinesiologist with the OKA (Ontario Kinesiology Association)
Ontario Certified Teacher (OCT# 619894) - Intermediate/ Senior teaching qualification - Physical Education and Geography
Professional Certification - Completed Special Education Part 1 - Ontario College of Teachers Certification
Played varsity basketball for the Wilfrid Laurier Golden Hawks (2006- 2009)
Owner and Head Trainer of ‘KinX Functional Training’ (2010-2012)
OFSAA (Ontario Federation of School Athletic Associations) Coaching Certification, March 2011
Certified Sports Nutritionist with the International Society of Sports Nutrition (CISSN)
CPR and First Aid Certified (American Red Cross), 2015 Currently working towards being a Certified Strength & Conditioning
Specialist (NSCA)
Education Currently (January 2014 to August 2015) University of Louisville, Louisville, Kentucky M.S Exercise Physiology- Concentration in Strength and Conditioning
Thesis: “The effect of Protandim supplementation on oxidative damage and athletic performance"
Sept. 2010 to April 2011 University of Western Ontario, London, Ontario, Canada. Bachelor of Education
Deans honor roll Sept. 2006 to April 2010 Wilfrid Laurier University, Waterloo, Ontario, Canada. Honors Bachelor of Arts Kinesiology and Physical Education
Deans honor roll

114
Sept. 2001 to June 2005 Preston High School, Cambridge, Ontario, Canada.
Ontario Secondary School Diploma (Ontario Scholar) Health and Fitness Specific Training August to December 2014, & January 2015 to April 2015 University of Louisville, Kentucky. Course: Strength and Conditioning I & II Knowledge gained from this class includes:
The skills and ability to conduct effective needs analyses, performance testing batteries, create effective, and sport-specific exercise/movement menus.
The ability to design effective age, ability, sport and position-specific training programs (macro, meso, micro) based on desired outcomes.
The ability to teach/coach/program Olympic lifting progressions, and foundational strength movements
The ability to teach/coach speed development skills (determine needed progressions/regressions), create effective bioenergetics programs (macro, meso, micro) based upon target outcomes, and the ability to lead/coach workouts with small and medium-sized groups
August 2014 to December 2014 University of Louisville, Kentucky.
Course: Applied Exercise Physiology & Advanced Exercise Physiology
Knowledge gained from this class includes: Knowledge of how the organ systems of the body work to help to
maintain homeostasis during exercise by: biological control systems, exercise metabolism, and endocrine function.
Performing and applying techniques for measurement of work, power and energy expenditure
Knowledge of how performance can be enhanced by: A. identifying factors involved in fatigue
B. using work test to evaluate performance C. using training techniques D. preparing for and adjusting to environmental influences E. use and misuse of nutritional supplements
August 2014 to December 2014 University of Louisville, Kentucky. Course: Laboratory Methods in Exercise Physiology Knowledge gained from this class includes:

115
Pre-participation Screening & Pre-participation Physical Exam How to perform hydrostatic weighing, skin fold measurements,
and calculations involves to obtain body composition measures. Submaximal aerobic capacity testing Aerobic capacity testing & calibration techniques Maximal aerobic capacity testing – protocol evaluation Electrocardiography & stress testing Lactate threshold testing Anaerobic power & capacity testing/agility Muscular strength & endurance Mobility & stability measures
January 2014 to April 2014 University of Louisville, Kentucky. Course: Principles of Exercise Testing and Prescription
Knowledge gained from this class includes: Effects of exercise to prevent coronary heart disease and
atherosclerosis. Specific effects of exercise on the established risk factors. Exercise as a rehabilitative measure in heart attack recovery. Exercise testing and prescription for special populations (other than cardiac).
January 2010 to April 2010
Wilfrid Laurier University, Waterloo, Ontario Course: Advanced Fitness Assessment, Training and Exercise
Prescription Knowledge gained from these courses includes:
Knowledge about the legal and business aspects of personal training
Conducted counseling (confidence and conviction intervention), where I gained tools for coaching weight management
Designed plyometric training, complex training, strength training, balance & stability training, and speed training for athletes and non-athletes.
September 2009 to December 2009 Wilfrid Laurier University, Waterloo, Ontario Course: Fitness Assessment and Exercise Prescription
Health and Fitness Experience February 2013 to December 2013 The Athletic Club- Waterloo, Ontario, Canada Position: Personal Trainer
116
Designed, implemented, and coached individuals through personalized fitness programs to meet their specific goals
Responsible for consistently monitoring flexibility, strength, blood pressure, heart rate, muscular endurance, tracking total body measurements, body composition analysis, and a cardio-vascular assessment.
March 2010 to September 2012 Owner and Head Trainer of ‘KinX Functional Training’ Personal Training
Designed and implemented group fitness classes outdoors for individuals of all ages and abilities
Conducted fitness assessments and evaluations Prescribed personalized nutrition plans and fitness
programs for in home and gym training January 2010 to August 2012
Grand River Collegiate, Kitchener, Ontario Women’s and Men’s High School Basketball Assistant Coach & Strength and Conditioning Coach
Prepared pre season strength and conditioning workouts for athletes
Independently coached and implemented team strength and conditioning workouts
Conducted team fitness assessments, testing and evaluation Provides safe, effective training methods for students
varying from grade 9-12 and of different skill levels Created and implemented sport-specific training for
basketball
September 2010 to December 2010 Preston High School, Cambridge, Ontario Woman’s Basketball, Assistant Coach
Taught technical skills to athletes through demonstration and correction
Attended to injuries of players September 2009 to April 2011 Special Olympics Canada

117
Basketball Coach Trained athletes with special needs and varying skill levels Adapted physical activities to meet the needs of each
athlete Developed relationships with athletes
2007 to 2008 Top 60 Basketball Camp, Wilfrid Laurier University 2006 to 2008 Wilfrid Laurier Summer Sports Camp, Wilfrid Laurier University 2005 to 2007 Naismith Basketball Camp, Wilfrid Laurier University
Supervised and coordinated a variety of activities for girls and boys of all ages and levels of athleticism.
Provided guidance and reinforced instructions to boys and girls aged 7 to 17.
Encourage participation and the practice of safety in a variety of activities.
Related Experience (Physical Education Teacher) October 2010 Preston High School, Cambridge, ON
Physical Education Teacher
December 2012 Grand River High School, Kitchener, ON Physical Education Teacher
March 2011 Kitchener Waterloo Collegiate and Vocational School
Geography and Physical Education Teacher Additional Certificates/Award
Bachelor of Education, University of Western Ontario, London, ON, Canada. - Deans honor roll
Honors B.A in Physical Education and Kinesiology, Wilfrid Laurier University - Deans honor roll
Teaching Promise Award, Preston High School, Cambridge, ON, Canada. Graduating Athlete of the Year, Preston High School Senior Athlete of the Year, Preston High School Senior Girls Basketball Most Valuable Player, Preston High School