the effect of precipitation on river … 61_2/mita, matreata.pdf · the effect of precipitation on...
TRANSCRIPT

Rev. Roum. Géogr./Rom. Journ. Geogr., 61, (2), p. 193–205, 2017, Bucureşti.
THE EFFECT OF PRECIPITATION ON RIVER RUNOFF
IN ROMANIA’S REPRESENTATIVE BASINS
POMPILIU MIŢĂ, SIMONA MĂTREAŢĂ
Key-words: representative basins, runoff coefficient, natural background: geology, soil texture, slopes, forest-cover coefficient.
L’effet des précipitations sur l’écoulement de rivières dans les bassins représentatifs en Roumanie. Le document présente les principales réalisations dans le domaine du débit de l’eau, dans les petits bassins – dessous 50 km2, montrant les résultats concernant l’influence des principaux facteurs de l’environnement naturel: géologie, relief (le versant du bassin), boisement, le type de sol, sur les caractéristiques de l’écoulement de l’eau de la rivière. Ces résultats ont été obtenus par des méthodes spécifiques: dans le cas de l’influence de la structure géologique, l’on a utilisé la méthode des marquages avec traceurs, la méthode hydrométrique et la méthode hydrologique. L’influence sur l’écoulement de surface d’autres facteurs (la topographie, la texture du sol, le boisement) a été mise en évidence par des relations de synthèse du coefficient de ruissellement dans les différentes conditions sur les précipitations qui ont généré l’écoulement, P(mm), et des précipitations précédentes, API10(mm). Pour d’autres facteurs (la topographie, la texture du sol, le boisement) leur influence sur l’écoulement de surface, a été mis en évidence par des relations de synthèse du coefficient de ruissellement dans les différentes conditions sur les précipitations qui ont généré l’écoulement, P(mm), et des précipitations précédentes, API10(mm). La dernière partie de cet article présente le rôle du coefficient de ruissellement dans la practique hydrologique, en particulier dans le calcul maximal du débit d’écoulement par de recommandations des méthodes appropriées: la méthode “rationnelle” et la méthode “q5”.
1. INTRODUCTION
The river runoff is the result of some complex influences exerted by several factors, among which the most important ones are precipitation generating factors and air temperature. Also, an important influence on the runoff process have the conditioning factors: the nature of the geological subsoil, the area’s relief, the soil and vegetation, which represent runoff conditions of the basin.
The formation process of runoff in small catchments is different from that in medium-sized and large ones. In the case of small river basins, the role of the physical-geographical factors, conditioning factors, on river runoff increases to a great extent.
The main objective of this paper is to present synthesis relations and tables containing runoff coefficient values under different conditions (rainfall, soil humidity, forest-cover coefficient, basin slope and soil texture), and to show how the results obtained could be used for practical applications and maximum discharge estimation in small basins by means of the genetic methods approach.
The results yielded by studies in Romania on small representative basins highlight their influence on the surface runoff of the main natural factors: topography, soil, vegetation, and geology (Miţă et al., 2005; Miţă and Mătreaţă, 2003, 2005).
The representative basins (R.B.) are small river basins, with a surface of 40–50 km2, in which
the characteristics of the natural background – geology, relief, soil, and vegetation – including precipitation, can be found in other large river basins, too.
Being located in all the physical and geographical areas of Romania (Fig. 1), representative basins show a great diversity of geological, soil, relief, and vegetation conditions, and can therefore be used to determine surface-water runoff characteristics.
Senior researcher, National Institute of Hydrology and Water Management, Bucharest, Șos. București-Ploiești 97E,
sector 1, Bucharest, 013686 Romania, [email protected], [email protected]

Pompiliu Miţă, Simona Mătreaţă 2
194
Obtaining some correct values of runoff elements in small basins is also favoured by the fact that in such basins, not only natural background factors are determined with great accuracy, but also the triggering factor, that is precipitation.
Fig. 1 – The map of representative basins in Romania (1988).
This aspect is important because the main syntheses of hydrological elements were made in the conditions of various characteristics of precipitation – quantity, intensity (Miţă and Mătreaţă, 2016).
2. THE INFLUENCE OF THE NATURAL BACKGROUND ON RUNOFF
2.1. The influence of geological structure
Studying the influence of geological structure on surface runoff became necessary especially in some areas where it was significantly reduced, or would completely disappear in the underground. In these areas it is mostly the water supply to localities and irrigation that are negatively affected.
The anomalies observed in the runoff regime are important also for the hydrological activity, due especially to the influence of the ecological structure on the hydric balance of those basins. A more detailed study was carried out on 10 representative basins.
The influence of karst on surface runoff in the Moneasa R.B.
In this paper, the geological structure of karst is taken into consideration, because it has occasionally a strong influence on the regime of some river surface runoff.
In what follows, the analysis focusses on the influence of karst on surface runoff in the Moneasa representative basin. The approach is similar also for their representative basins (Miţă and Mătreaţă, 2010).

3 The effect of precipitation on river runoff in Romania
195
The following methods underlie our analysis:
research of the area to establish karst characteristics;
hydrometrical measurements of discharges upstream and downstream of the obvious karst
areas;
tracer-marking to establish groundwater direction;
hydrological synthesis relations.
Figure 2 presents the map of the Moneasa Basin, a tributary of the Crişul Alb river basin, as well
as the Brătcoaia River, a tributary of the Crişul Negru river basin.
Tracer-markings with (fluorescein, rhodamine, etc.) and hydrometric measurements indicated
that the losses reported in the Izoi Depression (Crişul Alb river basin), and in the Brătcoaia Depression
(Crişul Negru river basin), alongside other losses (Fig. 2), are connected mainly with the Grota Ursului
Spring (Fig. 3) (Miţă et al., 2005).
Fig. 2 – The Moneasa – Brătcoaia karst area. Underground
trails from the Megheş – Moneasa hydrographic area (the
Crişul Alb) – Brătcoaia (the Crişul Negru).
Fig. 3 – The Grota Ursului Spring –Moneasa R.B., where
infiltrations from the Izoi and Brătcoaia depressions outflow.
In this way, the main areas of water infiltration in the underground and the trails of underground
runoff were identified (Fig. 2).
At the same time, the synthesis relation between specific multiannual average discharge, qmed(l/s
km2) and basin average altitude, Hmed(m), yielded the natural runoff regime, anomalies being
quantitatively assessed in terms of a diminishing runoff for the karst-influenced sub-basins (eg.
Megheş r.–Sonda h.s.), or the share of discharges (eg. r. Moneasa–Moneasa h.s.) (Fig. 4).
At the same time, the synthesis relation, detailed out for the Megheş sub-basin (Fig. 5), emphasizes
the following:
in the case of Sonda h.s., qmed value in the sythesis relation corresponding to Hmed=681 m,
results in qmed=18 l/skm2. Thus Qmed=qmed x F = 18x10=180 l/s.
The real value of discharge, resulting from the measurements made over a period of 33 years
(1975–2008), is Qmed=84 l/s.

Pompiliu Miţă, Simona Mătreaţă 4
196
Fig. 4 – Relation qmed – Hmed for the Moneasa – Dezna hydrographic space.
Thus, there is a deviation of 96 l/s of the recorded discharge value, that would have existed in
normal runoff conditions (i.e. in the absence of karst):
ΔQ=Qmed synthesis relation – Qmed true = 180–84 =96 l/s
in the case of the Izoi Depression (surface F=4.2km2; average altitude Hmed=800 m), the value
in relation qmed (l/s km2), corresponding to Hmed=800 m, results in qmed=24.5 l/s km
2;
consequently, Qmed = 103 l/s (Qmed=24.5 x 4.20).
The real value is zero, because the Izoi Depression is an endorheic karst region, the runoff being
totally drained underground. The difference of current discharge versus the discharge that should
correspond to the surface, is of 103 l/s, a discharge that would have been recorded, had the karst not
existed.
Fig. 5 – Water balance in Moneasa R.B., the Megheş sub-basin.

5 The effect of precipitation on river runoff in Romania
197
The discharge of 96 l/s, which is lower to what should have been under normal runoff
conditions, recorded at Sonda h.s. can be explained by the absence of the share of discharge from the
Izoi Depression, which is totally drained underground by various characteristic karst formations. This
fact is also confirmed by establishing the discharge corresponding to surface F=5.80km2, meaning
Sonda h.s without the share of the Izoi Depression (F=4.20km2). The value of 5.80 km
2 corresponding
to this surface is Hmed=575 m, the respective discharge being Q=q x F = 15 x 5.80= 87 l/s.
This value corresponding to what was recorded at Sonda h.s, confirms that the Izoi Depression
was not involved in runoff.
2.2. The influence of relief on surface runoff
The influence of basin slope on the runoff coefficient. Relations highlighting this influence
The modality to demonstrate the influence of basin slope on runoff involved comparing the
values of the runoff coefficient, α, recorded in basins that were differentiated in this respect.
Normally, values were compared by some rainfall quantities equal in all the basins. Also, the
basins were considered to be similar in terms of soil texture, and vegetation, only the slope was
different.
The basic relations obtained at all hydrometric stations within the representative basins, is
α = f(P, API10)
where:
α – runoff coefficient;
P – the rainfall that generated the runoff (mm);
API10 – the rain fallen in the previous 10 days, calculated by the API model (the previous rain
index) – that replaces soil humidity before runoff occurs (mm).
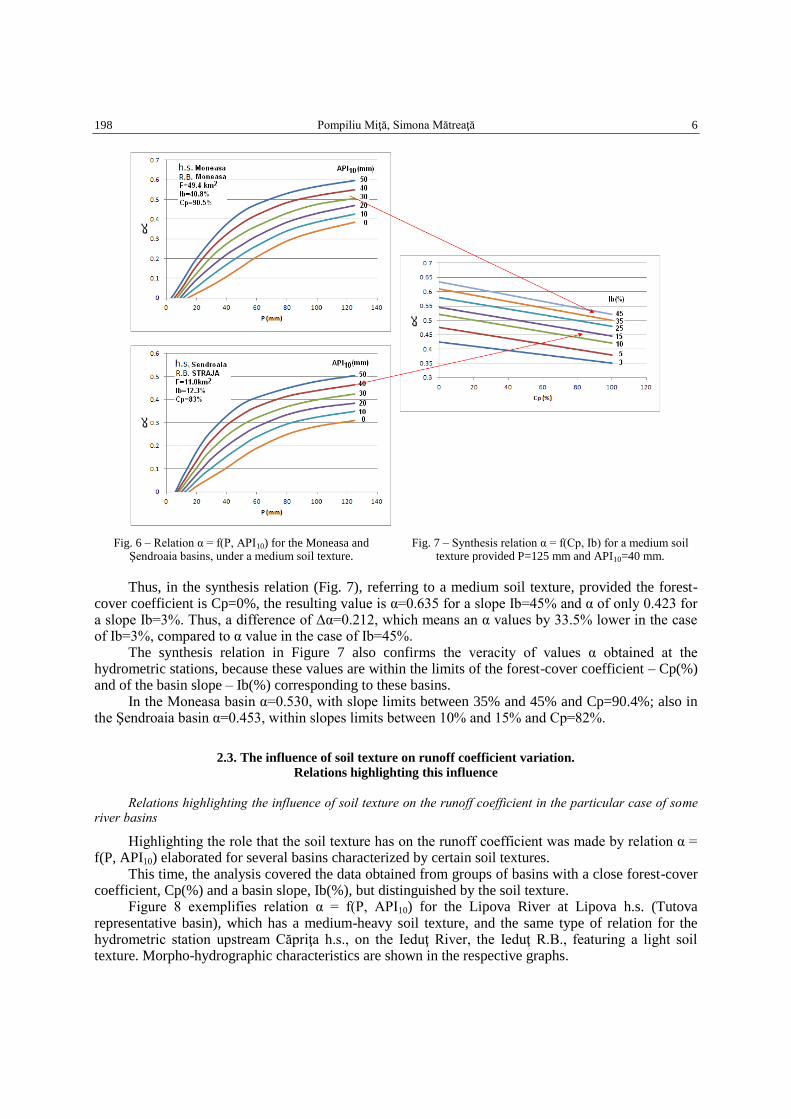
This type of relation (Fig. 6), highlights the influence of basin slope on the runoff coefficient, in
the case of some basins with a different basin slope, but similar according to other natural background
factors e.g. the soil texture and forest-cover coefficient.
The exemples refer to two hydrometric stations: Şendroaia (the Straja representative basin), and
Moneasa (Moneasa representative basin).
The river basins corresponding to the two hydrometric stations are characterized by close forest-
cover coefficient values, Cp (%): Cp=82% in the case of Şendroaia h.s and Cp=90.5% in the case of
Moneasa, but also by a similar soil texture (medium texture).
The basin slope, Ib (%) is significantly different for the two basins (Ib=40.9% for the Moneasa
river basin and only 12.9% for the Şendroaia one).
This difference represented also the reason for analysing its role in the variation of the runoff
coefficient.
In Figure 6, the difference is noted of the two stations, and the basic relation α = f (P, API10).
In the case of some equal rainfall quantities (P=120 mm) that generated the flash-flood, for
example, in the case of both basins, and of some rainfall quantities previously fallen (API10=40 mm),
value α=0.552 for the Moneasa h.s., with a basin slope Ib=40.9%; and of only 0.460 for the Şendroaia h.s.,
value α=0.460 with a basin slope Ib=12.9%. Thus, there is a difference of Δα=0.092.
Synthesis relation α = f(Cp, Ib)
This relation was obtained based on the data yielded by the representative basins; it holds for the
main soil textures – heavy, medium, and light – provided P=125 mm and API10=40 mm (Fig. 7).
In the case of such relations, even greater differences between values α occur due to the
differences between basin slope values.
Pompiliu Miţă, Simona Mătreaţă 6
198
Fig. 6 – Relation α = f(P, API10) for the Moneasa and Şendroaia basins, under a medium soil texture.
Fig. 7 – Synthesis relation α = f(Cp, Ib) for a medium soil texture provided P=125 mm and API10=40 mm.
Thus, in the synthesis relation (Fig. 7), referring to a medium soil texture, provided the forest-cover coefficient is Cp=0%, the resulting value is α=0.635 for a slope Ib=45% and α of only 0.423 for a slope Ib=3%. Thus, a difference of Δα=0.212, which means an α values by 33.5% lower in the case of Ib=3%, compared to α value in the case of Ib=45%.
The synthesis relation in Figure 7 also confirms the veracity of values α obtained at the hydrometric stations, because these values are within the limits of the forest-cover coefficient – Cp(%) and of the basin slope – Ib(%) corresponding to these basins.
In the Moneasa basin α=0.530, with slope limits between 35% and 45% and Cp=90.4%; also in the Şendroaia basin α=0.453, within slopes limits between 10% and 15% and Cp=82%.
2.3. The influence of soil texture on runoff coefficient variation.
Relations highlighting this influence
Relations highlighting the influence of soil texture on the runoff coefficient in the particular case of some river basins
Highlighting the role that the soil texture has on the runoff coefficient was made by relation α = f(P, API10) elaborated for several basins characterized by certain soil textures.
This time, the analysis covered the data obtained from groups of basins with a close forest-cover coefficient, Cp(%) and a basin slope, Ib(%), but distinguished by the soil texture.
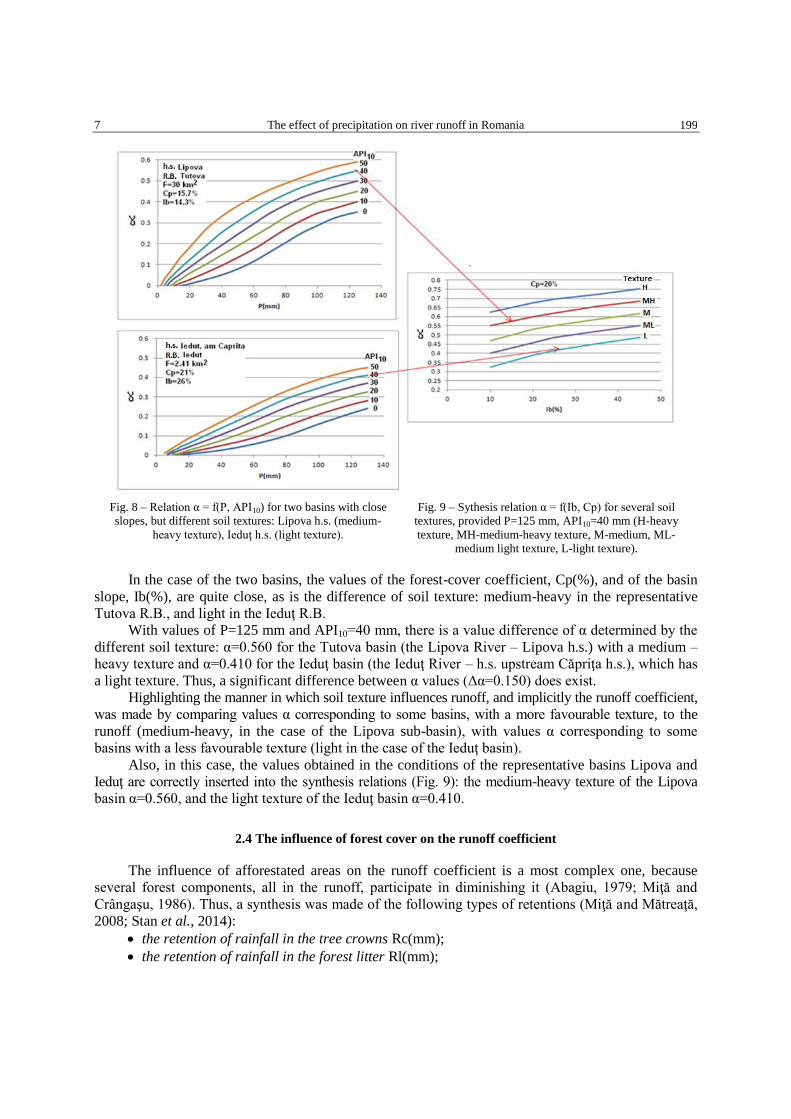
Figure 8 exemplifies relation α = f(P, API10) for the Lipova River at Lipova h.s. (Tutova representative basin), which has a medium-heavy soil texture, and the same type of relation for the hydrometric station upstream Căpriţa h.s., on the Ieduţ River, the Ieduţ R.B., featuring a light soil texture. Morpho-hydrographic characteristics are shown in the respective graphs.
7 The effect of precipitation on river runoff in Romania
199
Fig. 8 – Relation α = f(P, API10) for two basins with close
slopes, but different soil textures: Lipova h.s. (medium-
heavy texture), Ieduţ h.s. (light texture).
Fig. 9 – Sythesis relation α = f(Ib, Cp) for several soil
textures, provided P=125 mm, API10=40 mm (H-heavy
texture, MH-medium-heavy texture, M-medium, ML-
medium light texture, L-light texture).
In the case of the two basins, the values of the forest-cover coefficient, Cp(%), and of the basin
slope, Ib(%), are quite close, as is the difference of soil texture: medium-heavy in the representative
Tutova R.B., and light in the Ieduţ R.B.
With values of P=125 mm and API10=40 mm, there is a value difference of α determined by the
different soil texture: α=0.560 for the Tutova basin (the Lipova River – Lipova h.s.) with a medium –
heavy texture and α=0.410 for the Ieduţ basin (the Ieduţ River – h.s. upstream Căpriţa h.s.), which has
a light texture. Thus, a significant difference between α values (Δα=0.150) does exist.
Highlighting the manner in which soil texture influences runoff, and implicitly the runoff coefficient,
was made by comparing values α corresponding to some basins, with a more favourable texture, to the
runoff (medium-heavy, in the case of the Lipova sub-basin), with values α corresponding to some
basins with a less favourable texture (light in the case of the Ieduţ basin).
Also, in this case, the values obtained in the conditions of the representative basins Lipova and
Ieduţ are correctly inserted into the synthesis relations (Fig. 9): the medium-heavy texture of the Lipova
basin α=0.560, and the light texture of the Ieduţ basin α=0.410.
2.4 The influence of forest cover on the runoff coefficient
The influence of afforestated areas on the runoff coefficient is a most complex one, because
several forest components, all in the runoff, participate in diminishing it (Abagiu, 1979; Miţă and
Crângaşu, 1986). Thus, a synthesis was made of the following types of retentions (Miţă and Mătreaţă,
2008; Stan et al., 2014):
the retention of rainfall in the tree crowns Rc(mm);
the retention of rainfall in the forest litter Rl(mm);

Pompiliu Miţă, Simona Mătreaţă 8
200
the retention of rainfall in the process of vegetation development;
the retention of rainfall in forest soil Rs(mm).
In the conditions in which the other characteristics of the natural background – soil type and
basin slope – are very close, the values of the runoff coefficient, α, are clearly hightlighted in the case
of some equal rainfall values, hc(mm) (Fig. 10). Thus, very high values of α are observed for the
Bolovani sub-basin, completely deforested, while in the Humǎria sub-basin, the higher forest-cover
coefficient, Cp=95.4%, lowest runoff coefficient values are recorded.
Bolovani sub-basin Tinoasa sub-basin Humăria sub-basin
Fig. 10 – Relations α = f(P, API10) in the Tinoasa – Ciurea representative basin.
But, the runoff coefficient, determined for these flash-floods, indicates the global influence of
forest components on the runoff, that is, the influence of rainfall retention in the tree crowns –
Rc(mm), and in the forest litter – Rl(mm), including infiltration in the forest soil which has a great
water storage capacity – Rs(mm) (Fig. 10).
A detailed analysis of the forest components water retention capacity is given in Figure 11, the
results showing that forest soil retention is the most important interception recorded in the afforestated
areas (Miţă and Mătreaţă, 2004).
Fig. 11 – Interception (mm%)in the crown, litter, soil and the drained layer (hs)
in the case of a 50 mm rainfall (API10=0mm) – Humăria h.b. (Cp=95.4%).
It is worth-mentioning that the interception role of rainfall by the forest is maintained for a
period of several years, even after the forest had been cut.

9 The effect of precipitation on river runoff in Romania
201
This is due to the main interception factors (the soil and the radicular systems), which favour
infiltration, preserve their influence in deforested areas. At the same time, it must be underlined that
maintaining deforestation lasts for a long period of time, repeated flash-floods, may produce soil
washing, ravines occurring that may lead to soil degradation as the forest loses its protective role.
Synthesis relations highlighting the influence of the forest on the runoff coefficient α = f(Cp, Ib)
This type of relations (Fig. 12), obtained from representative basins in Romania, underscore
lower runoff coefficient values, as the forest-cover coefficient increases.
a) b)
Fig. 12 – Relations α = f(Cp, Ib) provided P=125mm, API10=40mm for basins with medium-heavy texture
a) and basins with light texture b).
Noteworthy, the values of the runoff coefficient corresponding to average-heavy texture basins
(Humăria α=0.610 and Bolovani α=0.480) are in the Ib=10–20% slope category (Fig. 12a), while
values corresponding to light-texture basins (Ieduţ am. Căpriţa α=0.410 and Fântâna Galbenă
α=0.325) are in the Ib=20–25% slope category (Fig. 12b).
3. COAXIAL RELATIONS AND SYNTHESIS TABLES TO DETERMINE
THE RUNOFF COEFFICIENT
As shown in the previous chapters, the basic relations obtained in the particular case of a river
basin of α = f(P, API10) (Fig. 13), helped obtaining synthesis relations similar to those given in the
analysis of the main natural background factors that influence surface runoff.
Fig. 13 – Relations α = f(P, API10) for the representative basins:
Ciurea (medium-heavy texture) and Ieduţ (light texture).
Pompiliu Miţă, Simona Mătreaţă 10
202
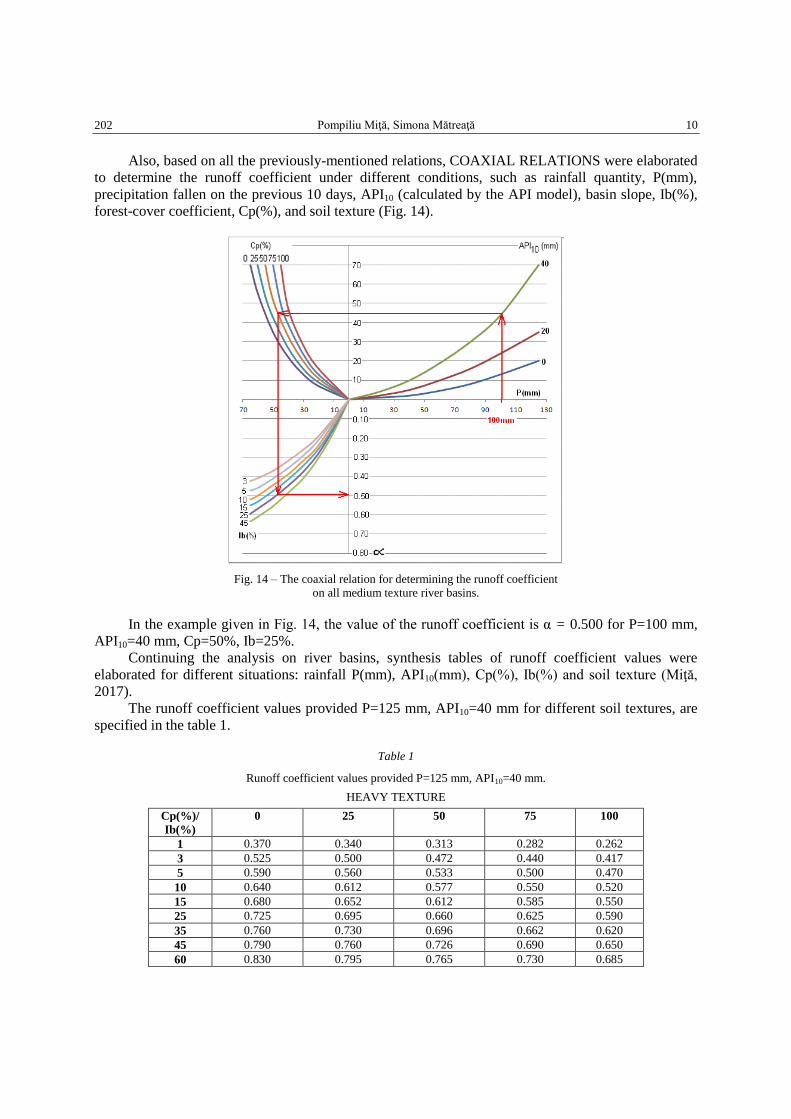
Also, based on all the previously-mentioned relations, COAXIAL RELATIONS were elaborated
to determine the runoff coefficient under different conditions, such as rainfall quantity, P(mm),
precipitation fallen on the previous 10 days, API10 (calculated by the API model), basin slope, Ib(%),
forest-cover coefficient, Cp(%), and soil texture (Fig. 14).
Fig. 14 – The coaxial relation for determining the runoff coefficient
on all medium texture river basins.
In the example given in Fig. 14, the value of the runoff coefficient is α = 0.500 for P=100 mm,
API10=40 mm, Cp=50%, Ib=25%.
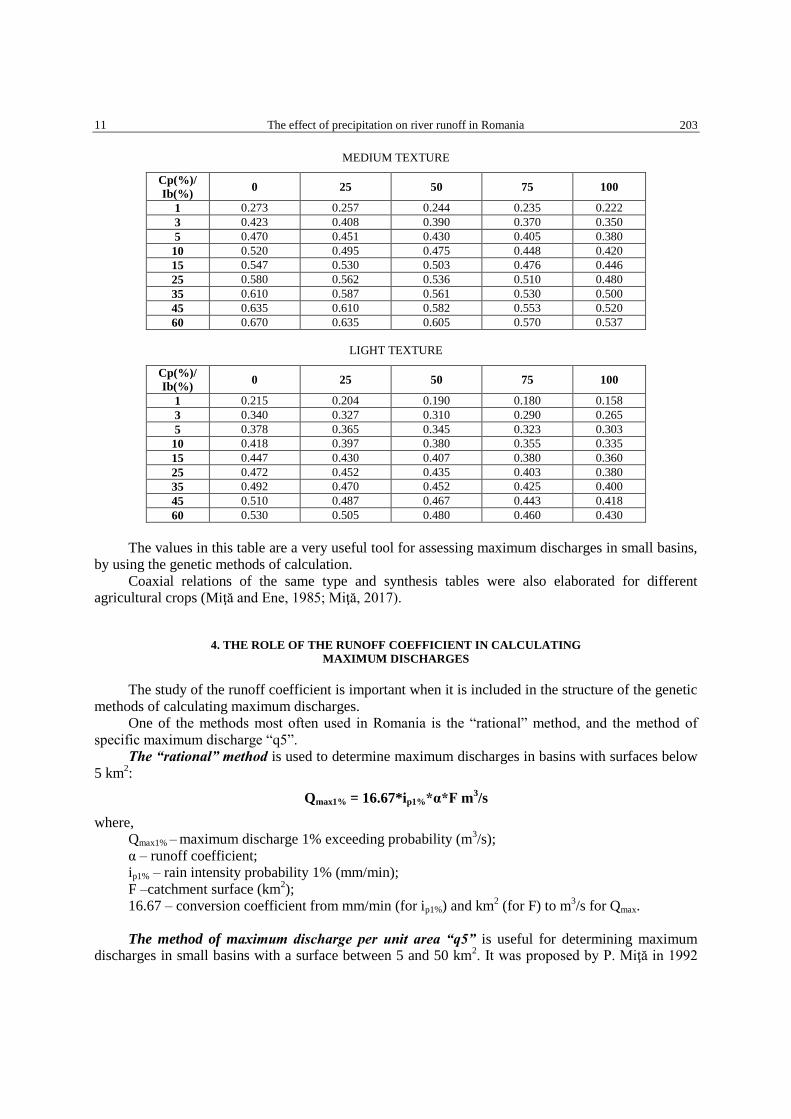
Continuing the analysis on river basins, synthesis tables of runoff coefficient values were
elaborated for different situations: rainfall P(mm), API10(mm), Cp(%), Ib(%) and soil texture (Miţă,
2017).
The runoff coefficient values provided P=125 mm, API10=40 mm for different soil textures, are
specified in the table 1.
Table 1
Runoff coefficient values provided P=125 mm, API10=40 mm.
HEAVY TEXTURE
Cp(%)/
Ib(%)
0 25 50 75 100
1 0.370 0.340 0.313 0.282 0.262
3 0.525 0.500 0.472 0.440 0.417
5 0.590 0.560 0.533 0.500 0.470
10 0.640 0.612 0.577 0.550 0.520
15 0.680 0.652 0.612 0.585 0.550
25 0.725 0.695 0.660 0.625 0.590
35 0.760 0.730 0.696 0.662 0.620
45 0.790 0.760 0.726 0.690 0.650
60 0.830 0.795 0.765 0.730 0.685
11 The effect of precipitation on river runoff in Romania
203
MEDIUM TEXTURE
Cp(%)/
Ib(%) 0 25 50 75 100
1 0.273 0.257 0.244 0.235 0.222
3 0.423 0.408 0.390 0.370 0.350
5 0.470 0.451 0.430 0.405 0.380
10 0.520 0.495 0.475 0.448 0.420
15 0.547 0.530 0.503 0.476 0.446
25 0.580 0.562 0.536 0.510 0.480
35 0.610 0.587 0.561 0.530 0.500
45 0.635 0.610 0.582 0.553 0.520
60 0.670 0.635 0.605 0.570 0.537
LIGHT TEXTURE
Cp(%)/
Ib(%) 0 25 50 75 100
1 0.215 0.204 0.190 0.180 0.158
3 0.340 0.327 0.310 0.290 0.265
5 0.378 0.365 0.345 0.323 0.303
10 0.418 0.397 0.380 0.355 0.335
15 0.447 0.430 0.407 0.380 0.360
25 0.472 0.452 0.435 0.403 0.380
35 0.492 0.470 0.452 0.425 0.400
45 0.510 0.487 0.467 0.443 0.418
60 0.530 0.505 0.480 0.460 0.430
The values in this table are a very useful tool for assessing maximum discharges in small basins, by using the genetic methods of calculation.
Coaxial relations of the same type and synthesis tables were also elaborated for different agricultural crops (Miţă and Ene, 1985; Miţă, 2017).
4. THE ROLE OF THE RUNOFF COEFFICIENT IN CALCULATING
MAXIMUM DISCHARGES
The study of the runoff coefficient is important when it is included in the structure of the genetic
methods of calculating maximum discharges. One of the methods most often used in Romania is the “rational” method, and the method of
specific maximum discharge “q5”. The “rational” method is used to determine maximum discharges in basins with surfaces below
5 km2:
Qmax1% = 16.67*ip1%*α*F m3/s
where, Qmax1% – maximum discharge 1% exceeding probability (m
3/s);
α – runoff coefficient; ip1% – rain intensity probability 1% (mm/min);
F –catchment surface (km2);
16.67 – conversion coefficient from mm/min (for ip1%) and km2 (for F) to m
3/s for Qmax.
The method of maximum discharge per unit area “q5” is useful for determining maximum
discharges in small basins with a surface between 5 and 50 km2. It was proposed by P. Miţă in 1992

Pompiliu Miţă, Simona Mătreaţă 12
204
and included in the paper “Instructions for the calculation of the maximum runoff in small basins” (Miţă, 1997):
Qmax1% = q5max1%*Fn*10
3 m
3/s
where,
Qmax1% – maximum discharge 1% exceeding probability (m3/s);
q5max1% – is the specific maximum discharge 1% exceeding probability, corresponding to a 5 km2
area (l/s km2);
F –surface catchment (km2);
n –reduction coefficient of the maximum discharge in terms of basin surface.
This method starts by using the “rational” approach.
The method is especially recommended for homogeneous areas in terms of facies, and is useful
when, within a hydrographic area, determining discharges in several basins with the surfaces between
5 and 50 km2 is required.
Using this method is quite simple. First, Qmax1% (implicitly qmax1%) is determined for a reference
basin surface of 5 km2, or a value close to it. This is normally done by the “rational” method.
According to the rational method, once q5max1% obtained (which corresponds to a 5–km2 surface,
Qmax1% is determined for any basin with a surface between 5 and 50 km2, using for F reduction
coefficient n values (Table 2).
Table 2
The values of reduction coefficient “n”.
F(km2) 0 1 2 3 4 5 6 7 8 9
5 1.00 0.994 0.989 0.984 0.979 0.974 0.970 0.968 0.965 0.963
6 0.959 0.957 0.954 0.952 0.950 0.948 0.946 0.944 0.942 0.940
7 0.939 0.937 0.935 0.933 0.929 0.927 0.925 0.923 0.921 0.919
8 0.917 0.916 0.915 0.914 0.913 0.912 0.910 0.908 0.906 0.904
9 0.902 0.901 0.900 0.898 0.897 0.896 0.894 0.893 0.892 0.890
10 0.886 0.881 0.874 0.864 0.854 0.844 0.838 0.834 0.829 0.824
20 0.818 0.815 0.811 0.807 0.803 0.800 0.796 0.793 0.790 0.786
30 0.782 0.780 0.778 0.776 0.773 0.771 0.768 0.766 0.764 0.761
40 0.760 0.759 0.758 0.757 0.756 0.755 0.753 0.751 0.749 0.747
50 0.746 0.745 0.744 0.743 0.742 0.740 0.739 0.738 0.737 0.735
It is worth-mentioning that reduction coefficient values of maximum discharge, in terms of basin
surface “n”, were determined such that they are continually decreasing from value 1 (of F with Qmax1% =
16.7*α*i*F), as basin surface increases.
Choosing the reference surface is also very important, so as to correspond as much as possible to
the fascies throughout the study area.
5. CONCLUSIONS
The variation of water runoff was determined in a multitude of conditions, regarding both the
characteristic rainfall and the physical and geographical factors.
The analysis of runoff formations in terms of different characteristic values was made by using
historical monitoring data from the representative river basins situated in various particular conditions.
The results obtained were also due to the methods used, which were the most adequate for this
kind of study.
13 The effect of precipitation on river runoff in Romania
205
The influence of geology was emphasised by analysing the influence of karst on the runoff
processes within the Moneasa river basin, the results showing both reduced discharge in some river
sectors, but also significant increase of discharge in other sectors.
Estimating the runoff coefficient under different conditions (basin slope, forest cover coefficient,
soil type), for a certain precipitation amount and initial soil humidity, important variations of this
parameter were obtained:
– In case of basins with a medium soil texture and no forest cover, the runoff coefficient is by
33.5% smaller for a basin slope of 3%, than the values obtained for a basin slope of 45%.
– In case of a medium soil texture and 25% basin slope, the runoff coefficient is by 17% smaller
if the basin is fully forest-covered, compared to a no-forest-cover basin.
– In case of basins with a slope of 25% and forest cover coefficient of 50%, the runoff
coefficient is by 34% smaller for a light soil texture than for a heavy soil texture.
The practical importance of runoff characteristics, especially of the runoff coefficient, results
from using it in the computation of maximum runoff in small basins, being found in all genetic
methods of assessing the runoff variable parameters.
REFERENCES
Abagiu, P. (1979), Cu privire la capacitatea de retenţie a pǎdurii, Buletinul informativ al ASAS, Bucureşti.
Miţă, P. (1997), Instrucţiuni pentru calculul scurgerii maxime în bazine mici, INHGA, Bucureşti.
Miţă, P. (2017), Coeficientul de scurgere, INHGA, Bucureşti.
Miţǎ, P., Ene, Al. (1985), În problema scurgerii în cazul suprafeţelor acoperite cu diverse culturi agricole, Sesiunea Anuală
de Comunicări Ştiinţifice a INMH, Bucureşti.
Miţǎ, P., Crângaşu, Ştefania (1986), Runoff modifications in forested areas, Zeitcliff fur Geomorphologie supl. Bd. 59,
Stuttgard.
Miţă, P., Mătreaţă, Simona (2003), Rolul zonelor împădurite asupra variaţiei scurgerii de suprafaţă, Analele Universităţii
Spiru Haret, No. 6, pp. 17–24.
Miţă, P., Mătreaţă, Simona (2004), Aspecte privind rolul hidrologic al pădurii, Revista Pădurilor, No. 1, pp. 36–40.
Miţă, P., Mătreaţă, Simona (2005), Rezultate privind influenţa principalilor factori ai cadrului natural asupra scurgerii de
suprafaţă. Comunicări de Geografie, vol. IX, Edit. Universităţii, Bucureşti, pp. 293–297.
Miţă, P., Mătreaţă, Simona (2008), Rolul diferit pe care-l are pădurea în cazul diverselor faze de regim ale scurgerii apei,
Silvologie, Vol. VI, Edit. Academiei Române, Bucureşti, pp. 239–264, ISBN 978-973-27-1702-8.
Miţă, P., Mătreaţă, Simona (2010), Modificări semnificative ale scurgerii de suprafaţă semnalate în areale cu structuri
geologice deosebite, Revista Geografică, T. XVII. pp. 10–15, ISSN 1224-256 X.
Miţă, P., Mătreaţă, Simona (2016), Representative basins in Romania. Synthesis of research results, Edit. Didactică şi
Pedagogică, Bucureşti, România, ISBN 978-606-31-0296-7.
Miţă, P., Orăşeanu, I., Corbuş, C. (2005), Modalităţi de stabilire a influenţei cantitative a carstului asupra variaţiei scurgerii
de suprafaţă în bazinul reprezentativ Moneasa, Hidrotehnica, vol. 50, No. 6, Bucureşti, pp. 7–14.
Stan, F., Neculau, G., Zaharia, L., Toroimac, Ioana G. (2014), Evapotranspiration variability of different plant types at
Romanian experimental evapometric measurement station. Climatologie, vol. 11., pp. 85–90.
Received April 13, 2017

Pompiliu Miţă, Simona Mătreaţă 14
206