the effect of potassium depletion on the initial kinetics of glycolysis in ascites tumor cells
TRANSCRIPT

Biochimica et Biophysica Acta, 329 (1973) 183-195 ~CD Elsevier Scientific Publishing Company, Amsterdam - Printed in The Netherlands
BBA 27271
T H E EFFECT OF POTASSIUM D E P L E T I O N ON T H E I N I T I A L K I N E T I C S
OF GLYCOLYSIS IN ASCITES T U M O R CELLS
WALTER V. V. GREENHOUSE and ELMON k. COE
Gerontology Research Center, N.I.H., N.I.C.H.D. Baltimore City Hospitals, Baltimore, Md. 21224 (U.S.A.) and Northwestern University Medical School, Department of Biochemistry, Chicago, IlL 60611 (U.S.A.)
(Received May 21st, 1973)
SUMMARY
Ehrlich ascites carcinoma cells depleted of K + and provided with 5.5 mM K + in isosmotic 50 mM tris(hydroxymethyl)methylglycine buffer at pH 7.4 and 38 °C take up K + from the medium at a rate of 6/~moles/ml intracellular fluid per min. Depleted cells exposed to K + for 2 rain prior to glucose addition exhibit a higher initial rate of glycolysis, a lower glycose-6-P accumulation, and a higher fructose-l,6-P2 accumulation than depleted cells incubated in a K+-free medium. Both the K + transport and the effect of K + on glycolysis are blocked by 2 mM ouabain.
Calculation of the in vivo velocities of glycolytic enzymes from the rates of accumulation of lactate and glycolytic intermediates shows that the presence of K + accelerates the velocities of fructose-6-phosphate kinase and lactate dehydrogenase about 2-fold and the velocity of hexokinase about 1.5-fold during the first 15 s. In either the presence or absence of K +, the hexokinase velocity is highest immediately after glucose addition and declines sharply with time; this decline is greater than would be predicted by product inhibition by the accumulated glucose-6-P. The maximal stimulation of fructose-6-phosphate kinase attributable to the increasing intracellular K + concentration is only 1.25-fold. These observations indicate that the initial acceleration in glycolysis is not simply mediated through a direct K + activation of fructose-6-phosphate kinase.
The calculated theoretical rate of ATP generation by glycolysis shows that gly- colysis is an ATP-utilizing system for the first 5-10 s both in the presence and in the absence of K +. Hence, the initial stimulation of glycolysis by K + is not a consequence of an increased rate of ATP hydrolysis associated with K + transport, although this mechanism may be responsible for the stimulation of steady-state glycolysis.
The initial rate of phosphate ester (hexose and triose phosphates) accumulation corresponds to be rate of ATP generation by the "tail-end" of glycolysis, or twice the rate of lactate accumulation, in either the absence or presence of K +, but both the rate and the maximal level of ester accumulated are higher in the presence of K +. This implies that the oxidatively generated pool of ATP which is diverted from endogenous reactions to hexokinase and fructose-6-phosphate kinase on the introduction of glucose is larger in the presence of K +.

184 W.V.V. GREENHOUSE, E. L. COE
Valinomycin (0.27/~lM) under certain conditions can produce effects on the glycolysis of non-depleted cells which superfically resemble the effects of K + on depleted cells. However, unlike K +, valinomycin stimulates the initial rate of glycolytic ATP generation, and abolishes the initial correspondence between the ATP generation by the "tail-end" of glycolysis and phosphate ester accumulation. These observations are interpreted to mean that valinomycin introduces an ATPase activity effective on glycolytically generated ATP.
Comparison of the theoretical ATP generation in the presence and absence of K + indicates that approximately one ATP is hydrolyzed for each K + transported.
INTRODUCTION
In 1958, Maizels e t al. 1.2 demonstrated that when Ehrlich ascites carcinoma cells are cooled, Na + and K + flow with the concentration gradients, leading to a loss of intracellular K + and an increase in intracellular Na +. This flow is reversed when the cells are warmed. Cells depleted of K + by washing in a cold K+-free medium exhibited a decreased rate of glycolysis. Gordon and De Hartog 3 observed a low rate of acid production by K+-depleted cells incubated in the presence of glucose and the absence of K+; addition of K + to the medium stimulated this rate, indicating that either K + or Na + transport accelerated glycolysis. Valinomycin accentuated this stimulation by K + but had little effect in the absence of K +.
Recently Poole e t al. 4 extended the studies of the effects of K + depletion and valinomycin on glycolysis to include measurements of glycolytic intermediates and intra- and extracellular pH. Addition of K + to K+-depleted cells or addition of valinomycin to either depleted or non-depleted cells stimulated utilization of glucose; the increased glucose consumption was entirely accounted for by increased lactate accumulation. Along with the decreased rate of glycolysis in K+-depleted cells, there was an increase in the accumulation of certain glycolytic intermediates, most notably dihydroxyacetone phosphate. Ouabain blocked the stimulatory effect of added K + on the glycolysis of K+-depleted cells and decreased but did not abolish the stimulatory effect of valinomycin.
A pronounced dependence of respiration on the availability o f K + was described by Levinson and Hempling 5. The rate of respiration declined to a low level when cells were depleted of K+; addition of K + to the medium produced an immediate increase in the rate, and the magnitude of the increase was dependent on concentration of added K +.
Levinson ~ also reported that while ouabain simply blocked movement of K + and Na +, the effect of valinomycin was more complex. In the absence of glucose, the latter agent inhibited the ion movement and depressed the ATP level, but on addition of glucose, the ATP level was restored and the inhibition was released.
All of these observations suggest that monovalent cation transport is a signifi- cant ATP-utilizing system which can measurably effect the rates of the ATP generating systems, glycolysis and respiration. Ouabain appears to exert its effect by directly blocking the transport itself, whereas valinomycin appears to uncouple the transport from the ATPase activity, since it can stimulate glycolysis 4 and respiration 7 in the presence of K + and simultaneously lead to a loss of K + from the cells. It therefore

EFFECT OF K + ON GLYCOLYSIS 185
became of interest to examine the effect of K + depletion and valinomycin on the kinetics of glycolysis immediately after glucose addition. Previous studies had all been performed over periods of minutes or even hours and therefore determined effects on steady-state glycolysis. The kinetics of glycolysis during the first minute after glucose addition reflect the rearrangement of control systems to accomodate the newly activated glycolytic system and may therefore provide some insight into the effects of both K ÷ depletion and valinomycin. The previous paper 8 presented a hypo- thetical picture of the regulation of glycolysis during the first 30 s; the present paper proposes the nature of modifications introduced into the regulation by K+depletion and valinomycin.
METHODS
Tumor preparation and incubation procedures Growth, preparation, and incubation of the cells were essentially as
described in the preceding paper 8. Preincubation time between dilution of the tumor and addition of glucose was decreased from 3 to 2 rain, and the incubation medium was varied to suit the object of the experiment.
Preparation of K+-depleted eells Cells were depleted of K + by the general method described by Levinson and
Hempling 5. Once-washed cells were incubated at a concentration of about 5 ~o (v/v) in K+-free buffer for 1 h at 4 °C. Cells were sedimented by centrifugation at 400 × 9 for l0 min and then resuspended in fresh K+-free buffer for a second hour at 4 °C. The cells were then sedimented again and resuspended to a concentration of 20-30 o/ O
(v/v) in the K+-free buffer and left on ice until use in the experiment. In some experiments a portion of once-washed cells was incubated at 4 °C in
K+-containing buffer in parallel with the cells being depleted of K +. The K+-free buffer contained: 50 mM tris(hydroxymethyl)methylglycine, pH
7.4; 1.7 mM sodium phosphate, pH 7.4; 0.47 mM MgCI2; 0.58 mM CaCIz; 0.02 mM MnCI2; and 100mM NaCI. The usual K+-containing buffer used in standard meta- bolic experiments was identical except for replacement of the 100 mM NaCI with 94.4 mM NaC1 plus 5.5 mM KCI. Both buffers were slightly hypotonic.
Ouabain and valinomyein experiments In experiments testing the effect of ouabain, the ouabain was included in the
buffer with which the cells were diluted prior to the addition of glucose; hence, ouabain-treated cells were exposed to the inhibitor for 2 or 3 min before glucose was added. The final concentration of glucose was 1.64 mM; the final concentration of ouabain 2.05 mM.
Valinomycin was added with the glucose. Cells were diluted in buffer, incubated for 2 min, and then 0.1 ml of a solution containing 25~o ethanol, 12.5 tLg/ml valinomycin, and 21 /~moles/ml glucose was added to 6.0 ml tumor suspension to give final concentrations of 0.2 #g/ml valinomycin and 0.35 mM glucose. In controls, 0.1 ml of 20 mM glucose in 25 ~o ethanol was added. All incubations were carried out at 37-38 °C.

186 W.V.V. GREENHOUSE, E. L. COE
K + uptake Cells were suspended in the K+-containing buffer and after a timed exposure
were separated by centrifugation. Specifically, 1.0 ml of a 35 % (v/v) concentration of cells was blown into 4.0 or 5.0 ml of buffer; at a predetermined time, the suspension was rapidly transferred to a centrifuge tube and centrifuged in a small clinical centrifuge at maximum speed for 30 s; this was sufficient to firmly pack the cells (approx. 0.35 ml). The supernatant was quickly removed by aspiration and 4.0 ml 5 o/, trichloroacetic acid was added to the cell pellet. Both supernatants and acid extracts of cells were analyzed for K + by means of a Technicon automated flame photo- meter. Intracellular K + was calculated from the amount extracted from the packed cells after correction for 25 o/,, contamination with extracellular fluid 9. The period of centrifugation was included in estimating the interval of incubation.
Assay of fructose-6-phosphate kinase Extracts of K+-depleted ascites tumor cells were prepared by sudden de-
compression from an 820 PSI nitrogen bomb (Artesian Industries Pressure Rupturing Device), as described by Hunter and Commerford l°. The homogenate was centri- fuged at 40000 × 9 for 15 min, and the resultant supernatant was assayed for activity.
Assays were performed spectrophotometrically. Limiting amounts of fructose- 6-phosphate kinase activity were incubated in the presence of fructose-6-P, ATP, aldolase, triose-phosphate isomerase, ~-glycerophosphate dehydrogenase and NADH, and oxidation of N A D H was followed at 340 nm with a Beckman DU spectro- photometer equipped with an ERA adaptor and a Sargent SRLG recorder. The reaction mixture contained 40 mM tris (hydroxymethyl)methylglycine buffer, pH 7.5, 10 mM MgCI 2, 2 mM fructose-6-P, 0.3 mM NADH, and 1.5 mM ATP. KC1 and NH4CI were varied as indicated in specific experiments.
Materials Ouabain octahydrate was obtained from Sigma Chemical Co., St. Louis, Mo.
Valinomycin was A grade from Calbiochem., Los Angeles, Calif. Other biochemicals and enzymes were from the sources described in the preceeding paper s.
RES U LTS
Uptake of K + by ascites tumor cells The increase in intracellular K +, [K + ]i, after suspension of K+-depleted cells
in isotonic buffer containing 5.5 mM K +, is shown in Fig. IA. The [K+]i is calculated in terms of intracellular water and includes a correction for trapped extracellular water (see Methods). It will be noted that the "depleted" cells retain a substantial concentration of K + (approx. 13 raM), although it is much less than the 130-140 mM accumulated with prolonged incubation 4. In the particular experiment illustrated, the measured extracellular K + declined from 5.3 to 4.3 mM over the 5-min period of incubation, while the intracellular K + rose to 33 raM; 2.0 mM ouabain prevented this movement of K +. The momentary lag before K + accumulation began was observed in other experiments and may reflect the time required for warming and activating the ion transport system. The rate of K + transport can be estimated by assuming that the uptake from the medium is constant while the diffusion out is proportional

EFFECT OF K + ON GLYCOLYSIS 187
4 [K3 i mM
0 I jx - o_
10 l~x ........ -" ~/ . ................. F i I I I I 0 5 o 5 10
Time (min)
Fig. I. Uptake of K + by ascites tumor cells. Ordinate: intracellular concentration of K +. Conditions: 6-7 ° o cells (v/v) suspended in isotonic medium containing 5.5 mM K + at 37 °C. O - @ , control; x - - - 4 , in presence of 2 mM ouabain. (A) cells depleted of K +. (B) non-depleted cells.
to intracellular concentration. These assumptions are reasonable since Levinson and Hempling s have shown that the K s for the activating effect of extracellular K + on respiration is only 0.4 mM, or well below the extracellular concentration, and the loss of K + from cooled cells is known to follow the concentration gradient. The approxi- mating equation for intracellular K + is then:
[ K + ] i = vl/c 0 [ l - - e - c ° ' ]
where vi is the constant rate of transport into the cells in pmoles/ml intracellular fluid per rain, and Co is equivalent to a diffusion constant for the rate of flow out of the cells and is given in min-1. The experimental points in Fig. I A are fit approximately by ~'i/Co 100 mM and Co = 0.064/min, which gives v i = 6.4 pmoles/ml ICF per min; these values were used to calculate the curve shown in Fig. 1A. (Zero time in Fig. 1A is equivalent to t = 1.7 min, in the equation.)
Fig. 1B illustrates that cells washed in cold K+-containing buffer have lost some of their K + and begin to regain it on incubation. Ouabain prevents the recovery of intracellular K + but does not produce the decline which might be expected if blockage of transport were complete. The approximate value for vi is somewhat higher, being near 9 pmoles/ml intracellular fluid per min, which indicates a higher energy expenditure on ion transport in the non-depleted cells. Extensive com- parisons of the vi values of depleted and non-depleted cells were not undertaken, how- ever.
Effect o f added K + on the glycolytic intermediates o f K+-depleted cells To ascertain the effect of K + on glycolysis, a suspension of K+-depleted cells
was divided into two portions; aliquots of one portion were diluted in K+-free buffer and after 2 min incubation, glucose was added to a concentration of 1.6 mM; aliquots of the other portion were diluted in K+-containing buffer (5.5 mM) and processed in the same manner. Extracts of the cells were made with HC10 4 at various intervals after glucose addition for analysis (see ref. 8). Fig. 2 illustrates that the presence of K + in the medium decreases glucose-6-P accumulation and increases fructose-i,6-P2,

188 W.V.V. GREENHOUSE, E. k. COE
0.4 i~ Y G
0.2 __m
0 ~ , t i
~ 0.4[- T
/ 0.2~/x,.- ~x--~
o; , ' ~ b
0.4 ~- 0.4 F }- o FD
f f \o\ o.2 ×_.~ o.21_ / o ¢ V,, O ~ i i --~ Oe__l I t
o
x ~. J x r - x j , - -
2 . 6 o / / ° I
• 2.4; I f 3~3 Time (s)
Fig. 2. Accumulation of glycolytic intermediates in K+-depleted cells in the presence and absence ofextracellular K +. Conditions: 1.6 mM glucose added at zero time, 2 rain after cells diluted in 37 C buffer solution. O - - O , in presence of 5.5 mM K÷; x - - - x, in absence of K+; G, glucose-6-P; F, fructose-6-P; FD, fructose-1,6-P2; T, triose-P; L, lactate; A, ATP. Average of two experiments.
t r iose-P, and lactate accumula t ion dur ing the first 10-30 s after glucose addi t ion. In this par t icu la r i l lustrat ion, f ructose-6-P was also increased, but this effect was not always observed, since in some instances f ructose-6-P was unaffected and in others it r emained so low as to be vir tual ly undetectable. In contrast , the effect of K + on the f ruc tose- l ,6 -P2, glucose-6-P, tr iose and lactate were highly reproducible .
Effects oJ ouabain and valinomycin on glycolytie intermediates Al though specific da t a are not shown (to avoid extensive mul t ip l ica t ion o f
figures) the fol lowing observat ions were also made. First , compar i son of cells washed in K+-con ta in ing buffer and then incubated in the same buffer yielded nearly the same pat terns as K+-dep le t ed cells incubated in the K+-con ta in ing buffer. That is, if the buffer used for incubat ion conta ined K +, the pat tern was the same regardless o f whether the ceils had been previously deple ted o f K + or not. Second, inclusion of 2 m M ouaba in in the K+-con t a in ing med ium comple te ly prevented the effect of K + on the K+-dep le t ed cells. Tha t is, the pat terns ob ta ined in the presence of K + and ouaba in with depleted cells were vir tual ly identical to the pa t te rns ob ta ined with deple ted cells in K+-f ree medium. I f cells were rich in K + (non-deple ted) , ouaba in had much less effect on the glycolysis, a l though it r eproduc ib ly decreased fructose- 1,6-P2 and lacta te accumula t ion and increased glucose-6-P to some extent. In K +- deple ted cells, the initial rate of lactate accumula t ion was 40-50 ~o lower if ouaba in were present with K +, whereas in non-deple ted cells it was only 15-20 o~ lower in the presence of ouabain .
Final ly , under cer tain condi t ions va l inomycin was observed to p roduce effects superf icial ly resembl ing the effects of K + on K+-dep le t ed ceils, i.e. the e levat ion of f ructose- l ,6-P2 levels and the increase in lactate accumula t ion . Such effects were evident when val inomycin was added with glucose to yield a final concent ra t ion of

E F F E C T OF K + O N G L Y C O L Y S I S 189
0.27 FM inhibitor in a 3-4 % (v/v) suspension of non-depleted cells. Higher concentrations of valinomycin or addition prior to glucose tended to depress the rate of lactate accumulation.
Effect of added K + on the velocity of glycolysis in K+-depleted cells A comparison of the calculated velocities of hexokinase, fructose-6-phosphate
kinase, and lactate dehydrogenase in K+-depleted cells in the presence and absence of K + is shown in Fig. 3. The ratios of the rates in the presence of K + (vp) to those in the absence of K + (vA) demonstrate that the presence of K + in the medium has the least effect on the velocity of hexokinase (Fig. 4A). The accelerating effect of K + on fructose-6-phosphate kinase is probably not attributable to the increase in intracellular K +, since the maximal effect on the kinase by the increased K +, even in the complete absence of NH4 + (Line K, Fig. 4A) is much less than the observed effect (see below, for the effect of K + on fructose-6-phosphate kinase).
The difference between the velocities in the presence and absence of K*
15F H
10°! '~o
!
O~ 0 I I 1~
15 F
10 ~ ' ~
5: :-".x~O~o ~ ' x ~ x
Time (s)
6 L
4 (' " ~ 0---~.0_.._ 0
2' "x'--x.~. x
O( I i ~J5
Fig. 3. Velocities o f hexokinase (I-D, f ructose-6-phosphate kinase (F), and lactate dehydrogenase (L) in K+-deple ted cells in the presence and absence o f K ÷. Velocities in glucose equivalents /ml cells per rain calculated by s u m m i n g rates o f accumula t ion derived f rom Fig. 2. Symbols as in Fig. 2.
! ~ L
2.D- ' . . .~
6
1 . 6 ~ o \
°~oH . . . . . . . . . . K
l ;
B
4 : - ~ H,F
0 | , I_ _ _ J 0 15 Time (s)
Fig. 4. Effect o f extracellular K ÷ on the velocities o f enzymes in K+-deple ted cells, vp, velocity in presence o f K +. vA, velocity in absence o f K ÷. (A) Ratio. (B) Difference. O - - O , hexokinase: × - - , f ructose-6-phosphate kinase; ~ - - - A, lactate dehydrogenase; . . . . , K, ratio a t t r ibutable
to K ÷ activation o f f ructose-6-phosphate kinase.

190 W . V . V. G R E E N H O U S E , E. L. C O E
(Ve--VA, Fig. 4B)indicates that K + in the medium elevates both kinases to the same extent; both increases in velocity begin well above that for lactate dehydrogenase and decline into the dehydrogenase difference curve by 10 s.
ATP 9eneration by glycolysis The net ATP generation by glycolysis in K+-depleted cells in the presence and
absence of K + in the medium was estimated from the velocities of hexokinase (v~), fructose-6-phosphate kinase (vv), and lactate dehydrogenase (%):
4UL--/;H--/J F
where velocities are given in glucose equivalents (Fig. 5). After I0 s, glycolysis is an ATP-generating system both in the presence absence of K +, although the rate of generation is substantially lower in the absence of K +. This difference between the curves is consistent with the idea that K + transport requires ATP and therefore accelerates glycolysis by increasing the demand for ATP. However, it is also clear from the negative values in Fig. 5 that glycolysis is an ATP-utilizing system for the first 8-10 s regardless of whether K + is present in the medium or not, and therefore the acceleration in glycolysis by K + in the very earliest period cannot be simply attributed to an increased ATP demand.
8 r / lO I . . . . . . . L ~ ~ ~x~
~ - - ' - O ~ o c ~ ° ~
S4 o ~ s x~ f, ,p ° ' - - - ' - - - o /,'~- ~ .............. S 5 o,~
~ - ~ --- 3 / - - 13- X r I," /
_8 [ _ 4 l i ~ ~ 5 L J I 0 10 20 3 0 O 10 2 0
T ime (s; T ime (s/
Fig. 5. N e t r a t e o f A T P g e n e r a t i o n b y g lyco lys i s in K + - d e p l e t e d cells. O O , in p r e s e n c e o f K + ; x - - - • , in a b s e n c e o f K +.
F ig . 6. N e t r a t e o f A T P g e n e r a t i o n b y g lyco lys i s in the p r e s e n c e a n d a b s e n c e o f v a l i n o m y c i n . ~ O , in a b s e n c e o f v a l i n o m y c i n ; × - - - × , in p r e s e n c e o f v a l i n o m y c i n .
Fig. 6 illustrates a significant difference between the stimulation of glycolysis by K ÷ in depleted cells and the stimulation of glycolysis produced by valinomycin in non-depleted cells. The latter velocities were calculated from one experiment in which valinomycin was observed to elicit a substantial acceleration of lactate accumu- lation. Contrary to K ÷ stimulation, valinomycin accelerates glycolytic ATP genera- tion even at the earliest time, which suggests the activation of an ATPase activity effective on the glycolytic generating system.
Relationship between phosphate esterified and ATP 9eneration by the tail-end o[" glyeolysis
The correspondence between the theoretical yield of ATP from the tail-end of glycolysis (2AL) and the phosphate esterified into hexose and triose phosphates

EFFECT OF K + ON GLYCOLYSIS 191
*K
I ' I t 2,JL
Z 2 / 2 i / //+-K
tl~ L I I / / q~
I / o ~ O ~ ; a t ' / , ̀ " Pest -~ _ IF o ! t , V , f
!* ' fo ' ~ o Time (s)
I 2zlL st I + i
' /
I / / P est i i
,/
I i _ I
10 20. Time (s)
Fig. 7. Comparison of phosphate ester accumulation with ATP generation by tail-end or glycolysis in K+-depleted cells. O - - O , A - - A , phosphate ester or sum of hexose and triose phosphates; × - - - ×, + - - - + , ATP generation or 2alL; O and ×, in presence ofextracellular K+; A and + , in absence of K +.
Fig. 8. Comparison of phosphate ester accumulation with ATP generation by tail-end of glycolysis in the presence and absence of valinomycin. 0 - - 0 , A--zS, phosphate ester; × - - - x, + . . . . . , ATP generation; O and ×, in absence of valinomycin; A and + , in presence of valinomycin.
gave rise to the idea tha t the A D P p roduced dur ing accumula t ion o f these p h o s p h a t e esters regula ted the rate o f lac ta te p roduc t ion dur ing the first few seconds af ter glucose add i t ion 8. Fig. 7 shows tha t this cor respondence holds, a t least approx imate ly , for abou t 5 s for K+-dep l e t ed cells bo th in the presence and absence of K + in the medium. The m a x i m u m level o f esterified phospha te is significantly higher in the presence o f K +, as is the initial rate o f accumula t ion . A n o t h e r dis t inct ion between the effect of K + and the effect o f va l inomycin is evident in Fig. 8, where it may be seen tha t va l i nomy- cin has no influence on the esterified phospha te accumula ted but abol ishes the initial cor respondence between phospha te esterified and A T P generated by the ta i l -end of glycolysis. Thus, it appears tha t the init ial lacta te p roduc t ion no longer depends on the A D P released dur ing accumula t ion o f the phospha te esters when the inhib i tor is present.
Relationship between glucose-6-P level and the velocity of hexokinase U y e d a and Racke r ~ demons t r a t ed tha t the hexokinase o f Ehrl ich ascites
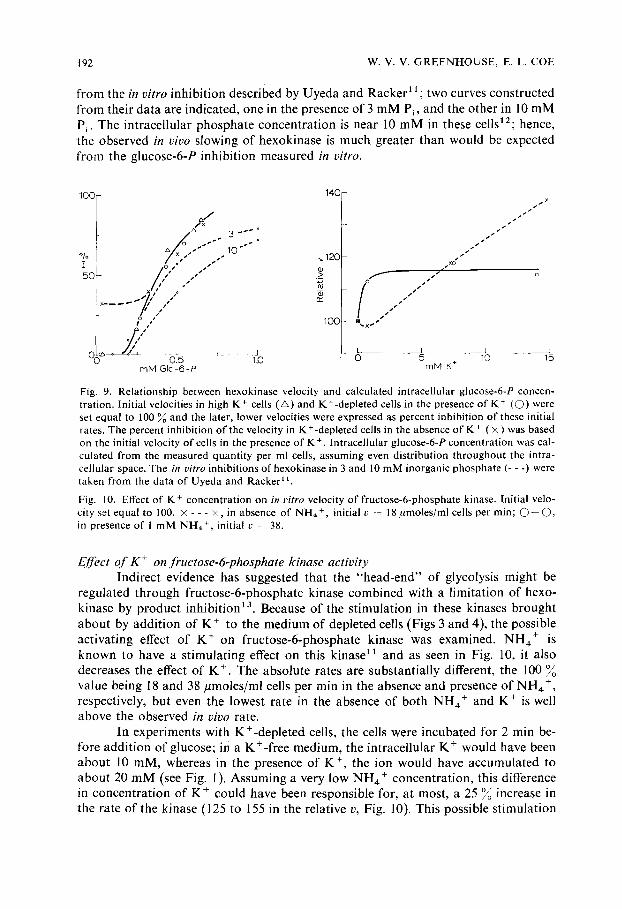
t u m o r was subject to p roduc t inhib i t ion by glucose-6-P and that the inhib i t ion was par t ia l ly reversible by inorganic phosphate . I na smuch as the hexokinase velocity s lowed as the glucose-6-P level increased (compare Figs 2 and 3), it was of interest to de te rmine whether the accumula t ion o f g lucose-6-P could account for the s lowing o f the enzyme. The ini t ial veloci ty was defined as 100 ~ act ivi ty and the later, lower velocities were expressed as percent inhibi t ions o f this ini t ial velocity for values o b - ta ined with K+- r i ch ceils and K+-dep l e t ed cells in the presence of K + (Fig. 9). The two sets o f values, as funct ions o f glucose-6-P, are in reasonable agreement . The values for K+-dep l e t ed cells in the absence o f K + are also in agreement if the " i n h i b i t i o n " is ca lcula ted f rom the init ial veloci ty of cells in the presence of K + ; tha t is, the initial velocity in the absence o f K + a l ready appears to be inhibi ted by abou t 30 %.
The in vivo re la t ionship fol lows a curve s imilar to but significantly different
192 W.V.V. GREENHOUSE, E. L. COE
from the in vitro inhibi t ion described by Uyeda and Racker 11 ; two curves constructed from their data are indicated, one in the presence of 3 m M Pi, and the other in 10 m M P~. The intracellular phosphate concent ra t ion is near 10 m M in these cells12; hence, the observed in vivo slowing of hexokinase is much greater than would be expected from the glucose-6-P inhibi t ion measured in vitro.
100[-
50P /, " , " I s , • 1 ×,/'/ o 1 t i I S _× . . . . ~/ / /
+2 I /
• t s
_ /" L ~ . . . . . r
0.5 1.0 mM GIc-6-P
14C
~120
©
100
f
p x
$ I s s I ~ I S s ~
s s s
i
s j J~ o s
S j S j i SS ~
x s S S
o 5 lO 15 mM K ÷
Fig. 9. Relationship between hexokinase velocity and calculated intracellular glucose-6-P concen- tration. Initial velocities in high K + cells (~) and K+-depleted cells in the presence of K + (©) were :set equal to 100 ~ and the later, lower velocities were expressed as percent inhibition of these initial rates. The percent inhibition of the velocity in K+-depleted cells in the absence of K + ( × ) was based on the initial velocity of cells in the presence of K +. Intracellular glucose-6-P concentration was cal- culated from the measured quantity per ml cells, assuming even distribution throughout the intra- cellular space. The in vitro inhibitions of hexokinase in 3 and 10 mM inorganic phosphate (- - -) were taken from the data of Uyeda and Racker t 1.
Fig. 10. Effect of K + concentration on in vitro velocity of fructose-6-phosphate kinase. Initial velo- city set equal to I00. × - - - ×, in absence of NH4 +, initial v = 18 #moles/ml cells per min; G - C ) , in presence of 1 mM NH~ +, initial v = 38.
Eff'ect o f K + on fructose-6-phosphate kinase activity Indirect evidence has suggested that the "head-end" of glycolysis might be
regulated through fructose-6-phosphate kinase combined with a l imitation of hexo- kinase by product inhib i t ion ~3. Because of the s t imulat ion in these kinases brought a b o u t by addi t ion of K + to the medium of depleted cells (Figs 3 and 4), the possible activating effect of K + on fructose-6-phosphate kinase was examined. NH4 + is known to have a s t imulat ing effect on this kinase 11 and as seen in Fig. 10, it also decreases the effect of K +. The absolute rates are substantial ly different, the 100 value being 18 and 38/~moles/ml cells per min in the absence and presence of NH4 +, respectively, but even the lowest rate in the absence of both NH4 + and K + is well above the observed in vivo rate.
In experiments with K+-depleted cells, the cells were incubated for 2 min be- fore addi t ion of glucose; in a K+-free medium, the intracellular K + would have been abou t 10 mM, whereas in the presence of K +, the ion would have accumulated to abou t 20 m M (see Fig. 1). Assuming a very low NH4 + concentra t ion, this difference in concent ra t ion of K + could have been responsible for, at most, a 25 O//o increase in the rate of the kinase (125 to 155 in the relative v, Fig. 10). This possible s t imulat ion

EFFECT OF K + ON GLYCOLYSIS 193
of fructose-6-phosphate kinase by a simple increase in K + concentration is indicated by line K in Fig. 4A which is much lower than the observed in vivo stimulation. Some caution must be exercised in such comparisons, however, since it is never certain that the in vitro conditions reflect the true in vivo situation, particularly with an enzyme as complex as fructose-6-phosphate kinase. Under somewhat different in vitro con- ditions, Sumi and Ui 14 see a pronounced K + effect, for example (see Discussion).
DISCUSSION
Interpretation of the interaction between K + transport and glycolysis In interpreting the effects of K + transport, the following observations must be
taken into account. (a) Although the rates of hexokinase, fructose-6-phosphate kinase, and lactate
dehydrogenase are all elevated by the presence of K + in the medium (Fig. 4), glycolysis is an ATP-utilizing system in both the presence and absence of K + for the first 5-10 s (Fig. 5). Hence, the stimulation of glycolysis by K + cannot be attributed simply to a higher rate of ATP hydrolysis in this initial period.
(b) The corrrespondence between ATP generated by the "tail-end" of gly- colysis (2AL) and the phosphate esterified in hexose and triose phosphate (PEST) over the first 5 s is observed both in the presence and absence of K +, (Fig. 7), but the rates and the total PEST accumulated are higher in the presence of K +. Therefore, this coordination is maintained in the presence of K +, but the capacity of the system for phosphorylating glucose is greater.
These observations can be rationalized in terms of the model for glycolytic regulation presented previously (see ref. 8, Fig. 8). Briefly, the model assumes that prior to glucose addition, an oxidatively generated pool of ATP (Pool I) is used to drive the cytoplasmic reactions; on addition of glucose, this pool is diverted to phos- phorylating glucose and accumulating phosphate esters; the ADP released by hexo- kinase and fructose-6-phosphate kinase is reconverted to ATP by the tail-end of glycolysis to form a second pool (ATP Pool II). Thus, the high initial rates of the two head-end kinases of glycolysis are attributable to the rapid consumption of Pool I, and once this is exhausted, phosphate ester accumulation ceases, the kinases slow drastically, and the coordination between phosphate esterified and ATP generated by the tail-end of glycolysis ceases. In terms of this model, the presence o f K + simply increases the size of ATP Pool I. Since the initial rate of glucose phosphor- ylation would depend mainly on the availability of ATP in Pool I, a substantial in- crease in velocity would be associated with an increase in total phosphate ester accumulation (Fig. 7) and could be consistent with the initial net negative ATP generation (Fig. 5). In this context, the stimulation produced by valinomycin is attri- butable to an ATPase activity directed mainly toward the glycolytically generated ATP Pool II; in this case, ATP Pool I and phosphate ester accumulation are not altered, but the initial lactate accumulation is no longer restricted by the A D P released during the ester formation (Fig. 8).
The foregoing hypothesis is meant to explain the effects of K + on the initial, activated period of glycolysis and does not rule out the possibility that the later stimulation of steady-state glycolysis is a direct consequence of the increased ATP hydrolysis engendered by the transport. The possibility that there is a direct stimul-

194 w . v . v . GREENHOUSE, E. L. COE
ation of glycolysis in general and fructose-6-phosphate kinase in particular by in- creasing intracellular K + concentration must also be considered, although there are several arguments against it being a major factor.
For one, the magnitude of the K + stimulation of the fructose-6-phosphate kinase observed in vitro seems insufficient to account for the observed in vivo stim- ulation (Figs 4A and 10); for another, the in vivo slowing of hexokinase is greater than would be predicted by the in vitro measurements of glucose-6-P inhibition (Fig. 9). Neither argument is conclusive, though, because of the uncertainty in the exact environment of the enzymes in vivo, and the effect of K + on the kinetics of fructose-6- phosphate kinase is known to be highly complex x4, varying not only with NH4 + concentration but also ATP concentration. The indirect arguments against direct K + stimulation are perhaps more compelling. Depleted cells with added K + show the same patterns of intermediate accumulation and the same high rate of glycolysis as non-depleted cells, even though the intracellular K + is still much lower in the former cells (20 mM instead of 60 mM; compare A and B at 2 rain in Fig. 1). This would suggest either that the total stimulation was achieved on increasing the con- centration from 10 to 20 mM and any further increase was ineffective or that transport rather than concentration was the determining factor. The fact that valinomycin under the right conditions can cause a stimulation of glycolysis as well as a loss of K + (ref. 4) indicates a relationship between glycolysis and transport rather than between glycolysis and K + concentration.
The stoichiometry between K + transport and A T P hydrolysis An exact value for the relationship between K + transported and ATP utilized
is not possible, particularly in view of the uncertainty in the relationships among K + transport in and Na + transport out 5 and the movement of H + 4, but an approximate value can be established. First, it is known that the total rate of ATP generation in non-depleted cells is about 12 t, moles/ml cells per rain (ref. 8, Fig. 5); the estimated rate of K + transport in cells under equivalent conditions is about 9/~moles/ml intra- cellular fluid (Fig. 1B), or converting to packed-cell volume, which includes 25 ~o entrapped extracellular fluid 9, 6-7/ tmoles/ml cells per rain. From this, it is apparent that the ratio of ATP to K + is 2 or less. A comparison of glycolytically and oxidatively generated ATP in non-depleted cells also indicates that between 10 and 25 s after glucose addition, the total rate of ATP generation in the cell may be approximated by the ATP generated by the "tail-end" of glycolysis, the ATP utilized in the "head end" being nearly compensated by oxidative phosphorylation (ref. 8, Fig. 6). The increase in ATP generation by the tail end brought about by K + addition to depleted cells can be calculated from the increase in the lactate accumulation rate (Fig. 2), and in the 10-25-s period, this increase is equivalent to 5-6/~moles ATP/ml cells per min. Under comparable conditions, the K + transport is 6.4/~moles/ml intra- cellular fluid (Fig. IA) or about 5/amoles/ml cells per rain. Hence, it is apparent that approximately one ATP is hydrolyzed for each K + transported.
ACKNOWLEDGEMENTS
The research described was supported by a grant (No. CA-10723) from the National Cancer Institute of the National Institutes of Health, U.S.A.

EFFECT OF K ÷ O N G L Y C O L Y S I S 195
The authors wish to thank Dr Robert T. Marshall of Northwestern Memorial Hospital, Wesley Pavillion, for the potassium determinations.
REFERENCES
1 Maizels, M., Remington, M. and Truscoe, R. (1958) J. Physiol. 140, 48-60 2 Maizels, M., Remington, M. and Truscoe, R. (1958) J. Physiol. 140, 61-79 3 Gordon, E. E. and De Hartog, M. (1968) Biochim. Biophys. Acta 162, 220-229 8 Poole, D. T. Butler, T. C. and Williams, M. E. (1971) J. Membrane Biol. 5,261-276 5 Levinson, C. and Hempling, H. G. (1967) Biochim. Biophys. Acta 135, 306-318 6 Levinson, C. (1967) Nature 216, 74-75 7 Gordon, E. E., Nordenbrand, K. and Ernster, L. (1967) Nature 213, 82-85 8 Coe, E. L. and Greenhouse, W. V. V. (1973) Biochim. Biophys. Acta 329, 171-182 9 Coe, E. L. and Saha, .I. (1966) Arch. Biochem. Biophys. 114, 282-287
10 Hunter, M. and Commerford, S. (1961) Biochim. Biophys. Acta 47, 580-586 11 Uyeda, K. and Racker, E. (1965) J. Biol. Chem. 240, 4682-4688 12 Coe, E. L. and Lee, I.-Y. (1969) Biochemistry 8,685-693 13 Coe, E. L. (1966) Biochim. Biophys. Acta 118,495-511 14 Sumi, T. and Ui, M. (1972) Biochim. Biophys. Acta 268,354-363