the effect of periodic operation on biofilters for removal
TRANSCRIPT

Louisiana State UniversityLSU Digital Commons
LSU Master's Theses Graduate School
2002
The effect of periodic operation on biofilters forremoval of methyl ethyl ketone from contaminatedairCharles William NormanLouisiana State University and Agricultural and Mechanical College, [email protected]
Follow this and additional works at: https://digitalcommons.lsu.edu/gradschool_theses
Part of the Engineering Science and Materials Commons
This Thesis is brought to you for free and open access by the Graduate School at LSU Digital Commons. It has been accepted for inclusion in LSUMaster's Theses by an authorized graduate school editor of LSU Digital Commons. For more information, please contact [email protected].
Recommended CitationNorman, Charles William, "The effect of periodic operation on biofilters for removal of methyl ethyl ketone from contaminated air"(2002). LSU Master's Theses. 3545.https://digitalcommons.lsu.edu/gradschool_theses/3545

THE EFFECT OF PERIODIC OPERATION ON BIOFILTERS FOR REMOVAL OF METHYL ETHYL KETONE FROM CONTAMINATED AIR
A Thesis
Submitted to the Graduate Faculty of the Louisiana State University and
Agricultural and Mechanical College in partial fulfillment of the
requirements for the degree of Master of Science in Engineering Science
in
The Interdepartmental Program in Engineering Science
By Charles William Norman
B.S., Louisiana Sate University, 1997 May, 2002
ii
TABLE OF CONTENTS LIST OF TABLES………………………………………………………………………iv
LIST OF FIGURES………………………………………………………………………v
ABSTRACT ………………………………………………………………….…….…vii
CHAPTER 1 INTRODUCTION ……………………………………………………1 1.1 Selection and Enrichment of Initial Microbial Population ……………………2 1.2 Normal Loading Experiments……………………………………………………2 1.3 Shock Loading Experiments ……………………………………………………3 1.4 Fixed-Bed Adsorption and Desorption Experiments ……………………………4
CHAPTER 2 LITERATURE REVIEW ……………………………………………5 2.1 Overview of Processes for the Control of Waste Gas Streams ……………5
2.1.1 Biological Processes……………………………………….………..……6 2.1.2 Biofilters……….……………………………………….……………..….7
2.1.3 Biotrickling Filters…………….……….…………………………………7 2.1.4 Bioscrubbers…………………………………………………..…….……8 2.1.5 Sparged Gas Reactors…………………………………….………………8 2.1.6 Terminology……………………………………………….……………..9
2.2 Problems In Conventional Biofilter Operation ……………………….…..10 2.3 Periodic and Other Operating Strategies ……………………………….…..11 2.4 Methyl Ethyl Ketone Biodegradation ……………..………………….………16
2.4.1 MEK Biodegradation Pathway…………………………………………..18 2.4.2 Biological Treatment of MEK Contaminated Waste gas Streams….…...19 2.4.3 Degradation of Mixtures Including MEK…………………………...…..21
2.5 Salinity Effects on MEK removal …………………………………….……..23
CHAPTER 3 MATERIALS AND METHODS …………………………….….….25 3.1 Packing Medium ……………………………………………….……….….25
3.1.1 Polyurethane Foam Manufacture ………………………………..….25 3.1.2 Packing Medium Rinsing Procedure ……………………………..…….26
3.2 Experimental Apparatus ……………………………………………..…….26 3.3 Culture of Enrichment Culture and Biofilter Inoculation Process …….….….29 3.4 Normal Loading Experiments ………………………………………………..….32 3.5 Shock Loading Experiments ………………………………………………..….34 3.6 Fixed-Bed Adsorption and Desorption Experiments ………………………..….37 3.7 Analytical Techniques ………………………………………………..….40
3.7.1 TOC Measurement ………………………………………………...…40 3.7.2 CO2 Analysis ………………………………………………………..….40 3.7.3 Gas-phase MEK Analysis ……………………………………..…….41
3.8 Nutrient Addition ……………………………………………………..…….41 3.9 Nitrate Analysis ……………………………………………………..…….42
CHAPTER 4 RESULTS …………………………………………………..……….43 4.1 Fixed-Bed Adsorption and Desorption Experiments ……………………..…….43 4.2 Normal Loading ……………………………………………………..…….46
4.2.1 Discussion …………………………………………………….….….49

iii
4.3 Shock Loading I …………………………………………………….……..51 4.3.1 Discussion …………………………………………………….….….58
4.4 Shock Loading II ……………………………………………………..…….59 4.4.1 Discussion ………………………………………………….….…….66
4.5 Shock Load III …………….……………………………………………….…….66 4.5.1 Discussion ………………………………………………….….…….74
CHAPTER 5 DISCUSSION AND CONCLUSIONS ………………….….…….76 5.1 Conclusions ………………………………………………………….….…….76
BIBLIOGRAPHY………………………………………………………...….…….……82
VITA…………………………………...…………………………...………..…….……88
iv
LIST OF TABLES Table 2.1: Previous research reported in the literature on biological treatment of gas contaminated with MEK ………………………………………………………….22
Table 3.1: Comparison of biofilters during “normal” operation ………………….35
Table 3.2: Comparison of biofilters during Shock Load I. ………………………….38
Table 3.3: Comparison of biofilters during Shock Load II ………………………….38
Table 3.4: Comparison of biofilters during Shock Load III ………………………….39
Table 4.1: Summary of Shock Load I. ………………………………………….58
Table 4.2: Summary of Shock Load II. ………………………………………….66
Table 4.3: Summary of Shock Load III. ………………………………………….75

v
LIST OF FIGURES Figure 2.1: Schematic of six biofilters loaded periodically with FEED for one-sixth of the operating cycle during normal (I to VI) and transient (VII) time periods…………..16
Figure 2.2: Schematic of a six biofilter system loaded periodically during normal (I to III) and transient (IV) time periods …………………………………………..17
Figure 2.3: Schematic of a six biofilter system loaded continuously …………..18
Figure 3.1: Schematic Diagram of Laboratory biofilter apparatus……………………..28
Figure 3.2: Schematic diagram of the sparged-gas bioreactor use to culture MEK degrading organisms used to inoculate biofilters.……………………………………....29
Figure 3.3: Step input of MEK over two cycles of normal loading…………..………..35
Figure 3.4: Influent MEK flow rate over two cycles of normal loading…………….....35
Figure 4.1: Sorption of MEK to foam packing medium with influent concentrations of 106 and 530 ppmv for EBRTs of 120 seconds (top), 40 seconds (middle), and 20 seconds (bottom)………………………………………………………………..………………..45
Figure 4.2: Desorption of MEK from foam packing medium following loading with influent concentrations of 106 and 530 ppmv for EBRTs of 120 seconds (top), 40 seconds (middle), and 20 seconds (bottom)…………………………………….……………….47
Figure 4.3: MEK removal efficiency for the biofilters during normal loading periods. Arrows indicate dates of nutrient addition………………………………………….…...50
Figure 4.4: MEK elimination capacity for each biofilter averaged over the entire cycle. Arrows indicate dates of nutrient addition………………………………………………50
Figure 4.5: MEK elimination capacity for each biofilter during the FEED period…….50
Figure 4.6: Influent MEK concentration for BF1 (top), BF2 (middle), and BF3 (bottom) during Shock Load I…………………………………………………………………….54
Figure 4.7: Effluent MEK and CO2 concentrations for BF1 during Shock Load I performed on Days 114 (top), 133 (middle), and 153 (bottom)………………………...55
Figure 4.8: Effluent MEK concentrations for BF2 during Shock Load I performed on Days 115 (top), 132 (middle), and 143 (bottom)………………………………………..56
Figure 4.9: Effluent MEK and CO2 concentrations for BF3 during Shock Load I performed on Days 124 (top), 132 (middle), and 140 (bottom)…………………..…….57
Figure 4.10: Influent MEK concentrations for BF1 (top), BF2 (middle), and BF3 (bottom) during Shock Load II………………………………………………………….62
Figure 4.11: Effluent MEK and CO2 concentrations during Shock Load II on BF1 performed on Days 159 (top), 165 (middle), and 167 (bottom)………………………...63
Figure 4.12: Effluent MEK and CO2 concentrations during Shock Load II on BF2 performed on Days 158 (top), 160 (middle), and 167 (bottom)………………………...64
Figure 4.13: Effluent MEK and CO2 concentrations during Shock Load II on BF3 performed on Days 160 (top), 165 (middle), and 169( bottom)………………………...65

vi
Figure 4.14: Effluent MEK concentrations for BF1 during Shock Load III performed on Days 229 (top), 231 (middle), and 233 (bottom)……………………………………,….71
Figure 4.15: Effluent MEK concentrations for BF2 during Shock Load III performed on Days 229 (top), 231 (middle), and 233 (bottom)…………………………………….….72
Figure 4.16: Effluent MEK concentrations for BF3 during Shock Load III performed on Days 230 (top), 232 (middle), and 234 (bottom)…………………………………….….73
Figure 4.17: Summary of BF1 performance over all three Shock Loads relative to the start-up of the Biofilter………………………………………………………………….74
Figure 4.18: Summary of BF1 performance over all three Shock Loads relative to the time since nutrient addition……………………………………………………………..75

vii
ABSTRACT In recent years, biofiltration technology has been used at numerous locations
worldwide as an air pollution control technology for treating gases contaminated with
low concentrations of biodegradable volatile organic compounds (VOCs). At the same
time, there have been many reports in the literature of contaminant emissions from
biofilters during transient loading conditions. There is currently a need to develop
methods for controlling such emissions. Periodically operated bioreactors have been
used successfully in treatment of wastewater and soils for several decades to mitigate the
effects of uncontrolled unsteady-state loading on waste treatment systems. Such
operating strategies have only recently been applied to biofilters treating gas-phase
contaminants.
Research described herein compared contaminant removal efficiency in biofilters
subjected to periodic operating strategies to that of a conventional continuously loaded
biofilter. Methy ethyl ketone (MEK), a compound that is regulated as a hazardous air
pollutant (HAP) under the 1990 Clean Air Act amendments, was used as a model
compound. Experiments were conducted to assess the ability of biofilters to remove
MEK during quasi-steady state conditions (i.e., “normal” operation) as well as during
transient periods of elevated contaminant loading (i.e., “shock loading” conditions). An
influent MEK concentration of 106 ppmv was used for normal loading experiments while
a concentration of five times that (530 ppmv) was applied during one-hour shock loading
experiments. Shock loading experiments were conducted to evaluate both active and
passive control techniques.

viii
Results reported herein demonstrate that controlled periodic operating strategies
can enhance contaminant removal of MEK during transient periods of elevated
contaminant load. Shock loading experiments testing active control strategies resulted in
MEK removal efficiencies greater than 95% for the periodic systems, while ranging from
55 to 70% for the continuously loaded biofilter. Removal efficiencies for the periodically
operated systems dropped to less than 30% during experiments conducted to assess
biofilter response to uncontrolled contaminant loading in the absence of an active control
strategy. Thus, while periodic operation coupled with an active control strategy can
improve biofilter performance during at least some transient loading conditions, there is a
clear need for adequate control systems if such an operating strategy is adopted.
1
CHAPTER 1 INTRODUCTION In recent years, biofiltration has been applied to treat gases contaminated by low
concentrations of biodegradable volatile organic compounds (VOCs). Conventional
biofilters are designed and operated in a manner that limits implementation of
engineering decisions that could result in improved performance during relatively steady
state conditions (i.e. normal loading) or during transient periods of elevated contaminant
loading (i.e., shock loads). These shock loads produce the relatively uncontrolled,
unsteady-state conditions commonly encountered in industrial systems.
In general, methods which could improve overall biofilter performance by
increasing an operator’s ability to control the spatial distribution or robustness of the
biofilter’s microbial consortium have received only limited attention in the literature.
Periodically operated bioreactors have been used successfully in treatment of wastewater
and soils for several decades to mitigate the effects of uncontrolled unsteady-state
loading. Such operating strategies have only recently been applied to biofilters.
Research reported herein evaluated periodic operating strategies for biofiltration
of a methyl ethyl ketone (MEK) contaminated air stream. A biofilter operated under a
continuous VOC load and two biofilters operated with periodic strategies were evaluated.
Experiments were first conducted to evaluate the removal efficiencies under normal
loading conditions, defined as an influent MEK concentration of 106 ppmv. The second
objective was to evaluate the biofilters response to a shock or transient load. A shock
load was defined as five times that of the normal load MEK concentration (i.e.
approximately 530 ppmv. The efficiency with which the continuously and periodically
2
loaded biofilters treated the transient elevated contaminant load was compared and
reported.
To achieve the objectives listed above, the research was divided into several tasks,
which are summarized below.
1.1 Selection and Enrichment of Initial Microbial Population A laboratory-scale sparged gas bioreactor was operated to select and enrich for a
microbial population for use as a seed culture in subsequent biofilter experiments. The
enrichment reactor consisted of a 4.0 L glass reactor inoculated with 100 mL of activated
sludge from a recently completed MEK biodegradation experiment and 2.9 L of a high-
strength nutrient solution. MEK was continuously added to the reactor by bubbling MEK
contaminated air through the reactor. Oxygen uptake rate (OUR), total suspended solids
(TSS), and volatile suspended solids (VSS) were monitored over time until a culture of
MEK degrading organisms was enriched.
1.2 Normal Loading Experiments An initial phase of biofilter experiments was performed to assess the ability of
biofilters to remove MEK during “normal” steady loading conditions consisting of an
influent MEK concentration of 106 parts per million by volume (ppmv). Three biofilters
were operated under different strategies, and arbitrarily designated as BF1, BF2, and
BF3. BF1 served as a control and was operated under continuous loading with an empty
bed residence time (EBRT) of 120 seconds. The two periodically operated biofilters
were operated on 12 hour cycles. One biofilter (BF2) was operated with a 40 second
EBRT and received contaminant addition during only one third of the twelve hour
operating cycle. Another biofilter (BF3) was operated with a 20 second EBRT received

3
contaminant addition during only one sixth of the twelve hour operating cycle. Each
biofilter received the same influent MEK concentration (106 ppmv) and mass of MEK
during each 12 hour period, but the biofilters differed in the time period during which
contaminants were added (all of the time, one-third of the time, or one-sixth of the time in
BF1, BF2, and BF3, respectively). Influent and effluent MEK concentrations were
measured to assess the ability of the biofilters to remove contaminants during steady
loading conditions.
1.3 Shock Loading Experiments A second phase of experiments was conducted to assess the ability of the three
different biofilters to remove MEK during transient periods of elevated contaminant
concentration (i.e., “shock loading” conditions). Three transient loading experiments
(arbitrarily named Shock Load I, II, and III) were conducted to assess the ability of the
biofilters to remove contaminants during various stages of the operating cycle. During
shock loading, the MEK concentration was increased to 530 ppmv (approximately five
times the concentration during normal loading) for a period lasting one hour. Two
transient loading experiments (Shock Load I and II) were conducted to test the biofilters’
responses under conditions in which an operator has on-line monitoring and/or process
knowledge of the transient loading condition so that the biofilter operating strategy could
be modified to maximize contaminant removal during the transient period of elevated
loading. A third shock loading experiment (Shock Load III) was conducted to assess
biofilter performance under conditions in which an operator does not modify the
operating strategy during the transient period of elevated loading.
4
1.4 Fixed-Bed Adsorption and Desorption Experiments Dynamic, fixed-bed sorption experiments were conducted to determine the
adsorption and desorption characteristics of the polyurethane foam packing material
under various loading conditions. Experiments were conducted at EBRTs of 120, 40, and
20 seconds using MEK concentrations of 106 ppmv and 530 ppmv. Each combination of
EBRT and MEK concentration was tested in duplicate.
Chapter 2 of this thesis contains a literature review summarizing previous
research in the field of biological treatment of gas-phase pollutants with an emphasis on
treatment of MEK. Chapter 3 contains a description of the materials and methods used in
the experiments. Chapter 4 contains results and discussion. Chapter 5 presents an overall
discussion and conclusions as well as recommendations for future research.
5
CHAPTER 2 LITERATURE REVIEW
2.1 Overview of Processes for the Control of Waste Gas Streams
Passage of stringent air pollution laws and regulations has increased the need for
cost effective treatment for many gaseous waste streams contaminated by VOC’s.
Biofiltration is an emerging technology for control of VOCs emissions from a variety of
contaminated air streams (Ottengraff et al., 1986; Leson and Winer, 1991; Deshusses and
Johnson, 2000). Biofiltration is well suited for treatment of waste gas streams
characterized by high flow rates with low concentrations of biodegradable pollutants
(Deshusses and Johnson, 2000).
As early as the 1920’s, biological techniques were applied for removal of H2S
emissions in air streams emitted from wastewater treatment facilities (Leson and Winer,
1991). As early as the late 1970’s, in both Germany and the Netherlands, biofiltration
was viewed as the best available control technology for off-gas treatment for odor control
(Leson and Winer, 1991). Until the early 1980’s biological treatment focused mainly on
control of noxious odors (Van Groenestijn and Hasselink, 1993). In recent years,
biological treatment has expanded to applications in control of volatile organic
compounds (VOC) in gas streams originating from a variety of industrial facilities and
environmental remediation activities.
Various non-biological methods exist for treatment of air contaminated by low
concentrations of VOCs, and these are usually described as secondary treatment
technologies. Economic and regulatory constraints usually dictate the choice of
technology used, and process selection is normally based on the nature, flow, and mode
of emission. While several methods of contaminant removal are technically feasible for

6
dilute VOC concentrations, most of the currently used methods have disadvantages. For
example, thermal incineration is one of the most widely used secondary treatment
technologies (Deshusses, 1994). During thermal incineration, pollutants are combusted
at temperatures between 700 and 1400 oC. While the process is capable of high removal
efficiencies, supplemental fuel is required, thus adding to the process cost, and secondary
pollutants are generated (e.g., CO, CO2, and NOx). Adsorption using activated carbon
allows for high VOC removal efficiencies particularly when low pollutant concentrations
are involved. However, pollutants are transferred to the adsorbent rather than being
destroyed, and the adsorbent must be regenerated or disposed of. Adsorbent regeneration
or disposal can lead to high investment costs, while at the same time producing secondary
pollutants. Biological treatment of VOC contaminated gases may meet treatment goals
for many waste gas streams while at the same time minimize the disadvantages
encountered with other treatment technologies.
2.1.1 Biological Processes
Although all biological gas treatment technologies involve biodegradation of
contaminants by a microbial population, several different process configurations may be
employed. These include biofilters, biotrickling filters, bioscrubbers, and sparged gas
reactors. Although the research described herein deals only with biofiltration, each
process configuration is described in the following sections to provide a background for
the reader.

7
2.1.2 Biofilters
Biofiltration is the oldest biological method for removing undesired off-gas
components (Van Groenestijn and Hasselink, 1993). In this process, contaminated gas is
passed through a reactor containing an active microbial biofilm attached to a solid
packing medium. Contaminants are transferred from the gas phase to the biofilm where
they are oxidized to carbon dioxide, water, and biomass. Contaminant transfer from the
gas phase directly into the biofilm minimizes the mass transfer from the gas phase to a
large moving aqueous phase and then to the biofilm (Ottengraph, 1987).
The basic components of a biofilter include a packed bed reactor, a system for
maintaining moisture content, and a blower to push or pull contaminated air through the
porous medium. Several process configurations may be used. For example, air flow may
be either up-flow or down-flow and water may be added to maintain moisture content by
humidifying influent air or to the filter bed via a sprinkler or soaker hose. Packing media
may consist of natural materials (e.g., compost) or synthetic media such as porous
ceramic pellets or polyurethane foam cubes (Moe and Irvine, 2000b).
2.1.3 Biotrickling Filters
Biotrickling filters are similar to biofilters except the packing medium is rigid or
semi-rigid and a nutrient containing liquid phase is continuously recirculated through the
system. Microorganisms grow attached to the packing medium, and they may also be
suspended in the recirculating liquid phase. Like biofilters, contaminate mass transfer
and biodegradation takes place in a single reactor. Continuous or periodic
addition/recirculation of liquid allows for control of nutrient concentrations and reaction
8
conditions (Van Groenestijn and Hasselink, 1993). One disadvantage of biotrickling
filters (in comparison to biofilters) is a lower specific surface area of the packing media.
This makes poorly water-soluble compounds difficult to treat (Ottengraph, 1987).
Clogging is another potential problem due to a readily available nutrient supply (Webster
et al., 1998). Management of the liquid stream and possible treatment of any wastewater
generated are other potential problems (Ottengraph, 1987).
2.1.4 Bioscrubbers
Bioscrubbers employ two separate reactors for treatment of undesired VOC
components in off-gasses. In the first reactor, a scrubber, contaminated gas is contacted
with an aqueous solution, with or without suspended microbes, by means of a fine spray
usually onto an inert packing material. This results in contaminant absorption from the
gas phase to the aqueous phase. The aqueous phase is then transferred to an activated
sludge or fixed film bioreactor where contaminants are biologically degraded. The water
may be recycled back to the sprayer (Van Groenestijn and Hasselink, 1993). Advantages
of bioscrubbers include an ability to control nutrients, pH, and separate operational
strategies for the two-reactor system. However, of the three previously described
technologies, bioscrubbers have the lowest gas/liquid surface area for mass transfer (Van
Groenestijn and Hasselink, 1993).
2.1.5 Sparged Gas Reactors
Sparged gas reactors involve passing VOC contaminated air through an aerator
submerged in an aqueous-phase bioreactor. This results in mass transfer from the gas
phase to the aqueous phase where a suspended microbial population degrades the
9
contaminant. Nutrient concentrations, biomass wasting, and hydraulic retention times in
the reactor are controlled in the same manner as activated sludge processes used for
wastewater treatment (Bielefeldt and Stensel, 1999). A disadvantage of this process is
that contaminated gases must be compressed, and the head loss is comparatively high.
2.1.6 Terminology
Researchers in the field of biofiltration frequently report reactor operating
conditions and contaminant removal using terms not often seen in other biological waste
treatment applications. The nomenclature commonly used in the field of biological
treatment of contaminated gas is summarized in the following paragraphs.
Empty bed residence time (EBRT), a relative measure of gas residence time
within the biofilter medium, is commonly used in comparisons of gas residence times in
different biofilters. The actual gas residence time in a biofilter may be calculated by
multiplying the EBRT by the air-filled porosity available to gas flow. The porosity value
is difficult to measure in practice. The gas surface loading rate, the volumetric gas flow
rate applied to a biofilter divided by the biofilter’s cross-sectional area, may also be used
to describe the volumetric loading to the system. Higher surface loading is characteristic
of a higher flow and a shorter EBRT.
Contaminant loading rates to biofilters are commonly reported as either surface
loading rates or mass loading rates. The contaminant surface loading rate, similar to the
gas surface loading rate, is defined as the mass of contaminant supplied per unit time per
unit cross-sectional area. The contaminant mass loading rate is defined as the mass of
contaminant applied to the biofilter per unit volume of packing material per unit time.

10
The contaminant mass loading rate is most often reported as an average over the entire
bed.
Due to the effects of both flow and contaminant concentration, a particular
biofilter can perform differently under identical contaminant mass loading rates. Higher
contaminant concentrations allow for higher contaminant diffusion into the biofilm and
faster biodegradation kinetics, while high EBRT’s permit longer time for diffusion and
degradation to occur.
Elimination capacity (EC) is a normalized measure of contaminant removal rate at
a given mass loading. EC is defined as the mass of contaminant removed per unit
volume per unit time, and is usually averaged over the entire bed. EC is a function of
mass loading rate, EBRT, and experimental or environmental conditions. EC data can be
misleading if the loading rate is not taken into account (i.e., the EC may be high but the
overall contaminant removal in terms of percent removal may be low).
2.2 Problems In Conventional Biofilter Operation
There are a number of common problems encountered in conventional biofilter
operation. Start-up is often problematic, where a slow start-up period equates to an
excessive period of contaminant breakthrough. Maintaining proper moisture and nutrient
content in the packing material is difficult and can lead to system failure. Clogging is
one of the most common problems faced in full-scale implementation of biofilters.
Clogging occurs when excess biomass accumulates in the void space of the packing
material. Clogging usually occurs at the biofilter’s inlet due to biomass concentrations
being greatest in the area of greatest contaminant loading (Ergas et al., 1994). This
11
interferes with the passage of the waste gas stream through the biofilter. Clogging can
cause channeling within the packing material, limiting the amount of contaminated air
being treated (Devinny et al., 1999). Pressure drops, increasing wear and energy demand
on the system, are associated with clogging.
Conventional biofilters are continuous flow processes designed and operated to
receive a relatively constant stream of contaminated air (Irvine and Moe, 2001). Such
systems, normally designed for minimal operator control (often times only allowing
adjustment of the system’s moisture content), provide little opportunity for implementing
engineering decisions which could enhance biofilter performance during relatively
steady-state conditions or transient periods of elevated contaminant loading (i.e., shock
loads). These transient conditions reflect the uncontrolled, unsteady-state conditions
commonly encountered in most industrial processes.
2.3 Periodic and Other Operating Strategies
Other than the research conducted by Moe and Irvine (1998, 2000) and Irvine and
Moe (2001) on controlled, unsteady-state periodically operated biofilters, research on
unsteady-state operating strategies has focused on continuous flow biofilters and the
control of biosolids accumulation and clogging near the inlets (Irvine and Moe, 2001).
Periodic processes allow for the selection, enrichment, and manipulation of the
physiological state of the microbial consortium, which minimizes uncertainties that often
accompany the design and operation of biological systems. Periodic processes have long
been used in wastewater treatment and soil remediation (Moe and Irvine, 2000).

12
Periodic processes have received limited attention in the literature, and most of
this work has focused on control of biomass accumulation near the biofilter inlet to
prevent excess biomass accumulation and subsequent clogging. Farmer (1994),
experimented with switching the first biofilter in a series of three. Results demonstrated
that after a period of operation the first biofilter could be switched to the end and allowed
to undergo endogenous respiration to decrease the accumulated biomass therefore
decreasing clogging. However, this did nothing to address distribution or robustness of
the microbial consortium. Song and Kinney (1999) showed that switching the
contaminant inlet from top to bottom allowed for better performance due to a more even
distribution of biomass and higher toluene-degrading activity across the biofilter. The
frequency with which the directional switching took place had an impact on biofilter
performance. A frequency less than three days did not allow the consortium time to
restore their degradation capacity. Indicating that a frequency of three days or more
allowed for microbial re-generation, along with a small fraction of the inlet concentration
(i.e., slip feed) re-directed to the outlet end to maintain microbial activity.
Weber and Hartmans (1995) described another method for mitigating contaminant
emissions from biofilters during transient periods of elevated contaminant load. In their
system, an activated carbon column was placed before a biofilter packed with compost
and polystyrene. Experiments were first conducted to determine desorption profiles for
several types of activated carbon adsorbents. Buffering capacities for 100 to 1000 mg
toluene/m3 air were determined from the adsorption isotherms. The adsorbent that had
the most advantageous buffering capacity was then used to study the removal of
fluctuating concentrations of toluene from waste gases with a biofilter. Three

13
configurations were tested: a biofilter with no activated carbon (as a control), a biofilter
with carbon mixed with the compost, and a separate activated carbon trap operated in
series before the biofilter. A gas stream containing 900 mg/m3 of toluene was applied to
each system for 8 hours per day. More than 50% toluene breakthrough was reported with
the first two configurations, however 100% removal was achieved in the biofilter with an
activated carbon column in series. Weber and Hartmans concluded that using a
maximum transient load of 1000 mg/m3, the activated carbon bed reduced the transient
load to a maximum concentration of 300 mg/m3 which was then completely degraded in
the biofilter.
A matter of great concern in the development of a periodically operated biofilter
system is how to establish “feast” conditions without contaminant breakthrough. Moe
and Irvine (1998) demonstrated that accumulation was possible without breakthrough,
but did not determine the ability of the selected and enriched for microbial consortium to
sorb the contaminants without degrading them, which would allow for a true feast period
to be established. Such a case would result in the microbes degrading the contaminants
during a period of famine conditions or a period with no inlet contaminant concentration.
Using the system parameters common to periodic processes applied to wastewater
systems, the cycle periods defined by Moe and Irvine (1998) are as follows:
• FEED – period during which contaminated gas flows to one or a grouping
of biofilters in a multiple biofilter system. There is contaminant removal
during feed due to some combination of sorption and biological

14
degradation. At the end of REACT, the gas flow is directed to another
biofilter and the first biofilter enters REACT.
• REACT – period where contaminants are degraded. Clean air may or may
not be circulated through the biofilter at this time, however drying out or
oxygen depletion could result without recalculation during this period.
• IDLE – period between REACT and FEED where the biofilter or grouping
of biofilters awaits the beginning of a new cycle. Uncontaminated air can
be passed through during this time if oxygen is needed as a terminal
electron acceptor.
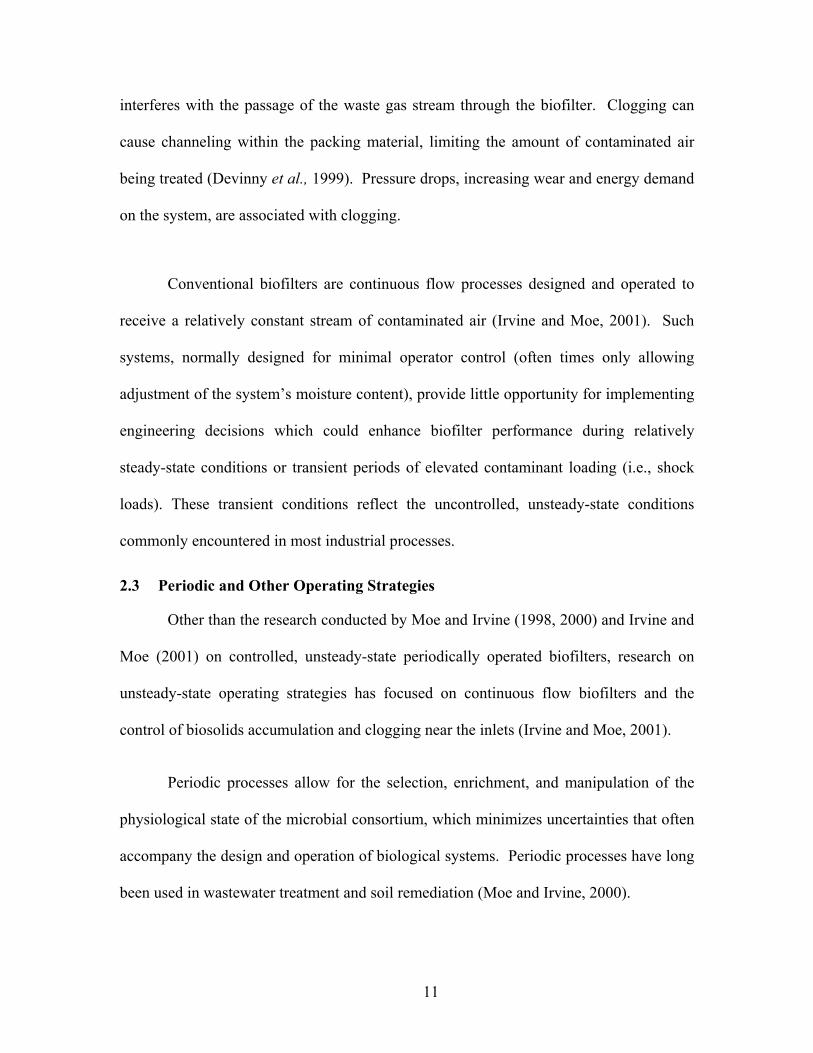
A periodic operating strategy may be implemented using a variety of biofilter
configurations and loading strategies. One method is to use multiple biofilters
constructed in parallel and operated in sequence. Such a system has a tremendous
amount of operational flexibility. For example, a six biofilter system (as shown in Figure
2.1) can be operated in parallel and sequence according to the solid arrows that connect
the time periods I – VI. The empty bed resident time (EBRT) for this system is equal to
that of one “properly” designed conventional biofilter. In this case, biofilter A is
undergoing FEED in time period I, while the other biofilters are in stages REACT or
IDLE. Biofilter A is undergoing REACT and/or IDLE during time periods II – VI. Time
period VII demonstrates a loading condition where gas flow is simultaneously directed to
all of the biofilters. Such a loading strategy could be implemented by an operator during
a transient or “shock load”, resulting in an EBRT that is six times longer than when the
biofilters are loaded one at a time. Irvine and Moe (2001) demonstrated that such an

15
operating strategy was successful for minimizing toluene emissions from a laboratory-
scale biofilter subjected to a transient condition during which the influent toluene
concentration increased from a concentration of 50 ppmv toluene during normal loading
to 500 ppmv during a transient period.
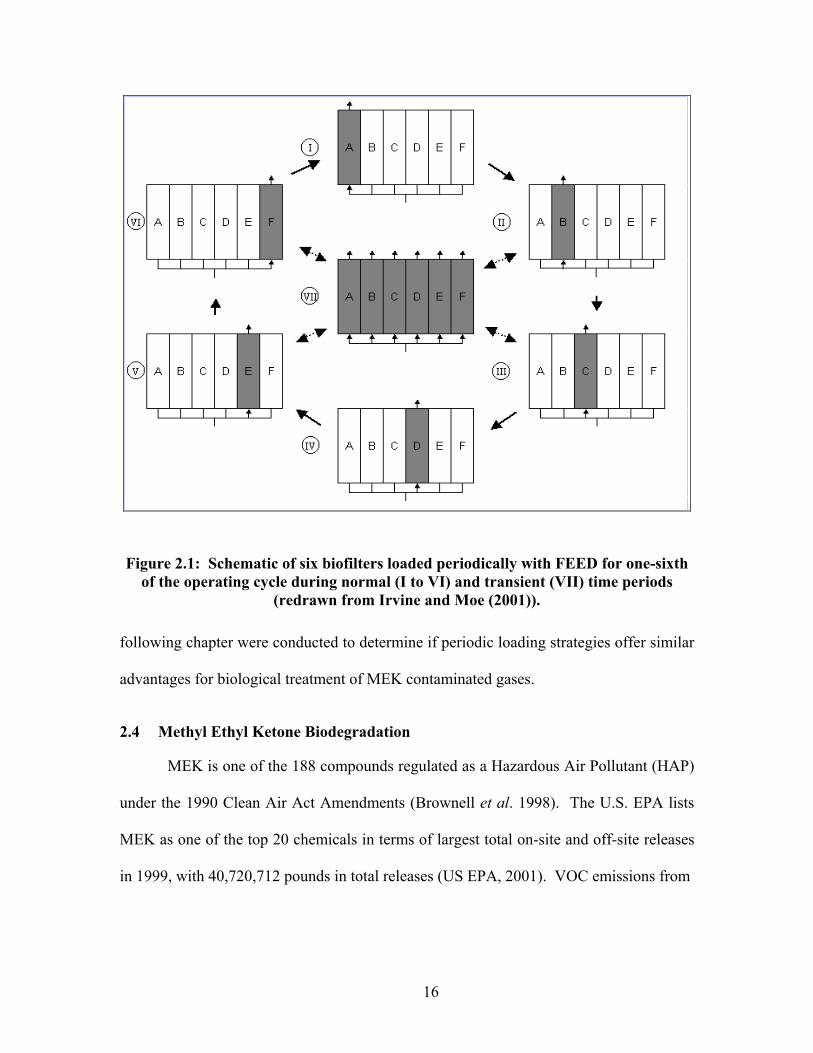
The same system could be operated such that each biofilter receives contaminated
air for only one third of the time as is represented in Figure 2.2. In this case, the EBRT is
twice that of the biofilters undergoing FEED for 1/6 of their cycle (See Figure 2.1). Both
of these periodic loading scenarios are in contrast to conventional continuous operation
which is depicted in Figure 2.3.
Irvine and Moe (2001) reported that a periodically operated biofilter treating a
toluene contaminated gas stream was superior to a conventional (i.e., continuous flow)
biofilter during transient conditions of high loading. They hypothesized that the superior
performance was likely due to two factors. First, that the selected and enriched for
microbes in the periodic systems were able to sorb the contaminants during FEED and
degrade them during REACT. Second, the higher mass flow rate of contaminants
associated with lower EBRT’s caused microbial growth to extend farther up the height of
the column, thereby providing a biomass spatial distribution better suited to handle
transient periods of elevated contaminant concentrations.
Although the studies described by Irvine and Moe (2001) suggest that periodic
loading strategies offered advantages for treatment of toluene contaminated gas streams,
tests with other compounds have not yet been reported. The experiments described in the
16
Figure 2.1: Schematic of six biofilters loaded periodically with FEED for one-sixth of the operating cycle during normal (I to VI) and transient (VII) time periods
(redrawn from Irvine and Moe (2001)).
following chapter were conducted to determine if periodic loading strategies offer similar
advantages for biological treatment of MEK contaminated gases.
2.4 Methyl Ethyl Ketone Biodegradation
MEK is one of the 188 compounds regulated as a Hazardous Air Pollutant (HAP)
under the 1990 Clean Air Act Amendments (Brownell et al. 1998). The U.S. EPA lists
MEK as one of the top 20 chemicals in terms of largest total on-site and off-site releases
in 1999, with 40,720,712 pounds in total releases (US EPA, 2001). VOC emissions from
17
Figure 2.2: Schematic of a six biofilter system loaded periodically during normal (I to III) and transient (IV) time periods (Redrawn from Moe and Irvine (2000)).
painting operations are the largest source of manufacturing emissions for the
automotive industry (Kim et al., 2000a, 2000b). MEK is one of the solvents commonly
found in paint spray booth off-gases (Kazenski and Kinney, 2000; Kim et al., 2000a,
2000b). Aircraft and automotive paint spray operations produce high-flow, low-
concentration waste gas streams that are expensive to treat using conventional methods.
Due to its low operating costs and potentially high removal efficiencies, biofiltration is an
attractive control technology for this purpose.

18
Figure 2.3: Schematic of a six biofilter system loaded continuously
2.4.1 MEK Biodegradation Pathway
Although specific degradation pathways of ketones have not been well
documented, it has been speculated that their metabolism is similar to that of n-alkanes
(Lukins and Foster, 1962; Britton, 1984; Deshusses 1994). The main degradation
pathway of n-alkanes is thought to involve an initial oxidative attack on the terminal
methyl group, possibly by a monooxygenase. This leads to the formation of an alcohol
intermediate, and then to an homologous fatty acid (Lukins and Foster, 1962; Britton
1984). The subsequent metabolism through beta-oxidation is thought to cleave the

19
acetate groups furnishing the cell with the carbon and energy required for cell formation
(Deshusses, 1994).
2.4.2 Biological Treatment of MEK Contaminated Waste Gas Streams
Previous research reported in the literature on biological treatment of gas
contaminated with MEK is summarized in Table 2.1. Treatment processes described in
the table include biofliters, biotrickling filters, and a tubular biofilm reactor. A variety of
filter bed packing materials were used, including compost, polypropylene spheres, and
polyurethane foam tested in laboratory-scale reactors. Reactor volumes (i.e., packing
volume) ranged from 0.007 to 0.141 m3. The reactors were operated under a number of
EBRTs ranging from 20 to 186 seconds (0.33 to 3.1 minutes). Volumetric loading rates
tested ranged from 4.07 to 230 g/m3*hr. Treatment efficiency or percent removal, in
most cases, was directly proportional to volumetric loading rate; with treatment
efficiency diminishing as the loading rate exceeds the treatment capacity of a particular
system. More detailed information about each of the particular studies is presented
below.
Deshusses et al. (1995) studied the behavior of biofilters in the treatment of an air
stream contaminated with MEK. Experiments were conducted using a biofilter packed
with 0.005 m3 of Bioton (ClairTech, Utrecht, The Netherlands). Bioton is a
commercially available packing media composed of an equ-ivolume mixture of compost
and polystyrene spheres. Two EBRT’s, 90 and 45 seconds, were tested over a loading
rate range of 0 – 350 g/m3*hr. Deshusses, et al. reported elimination capacities ranging
from 0 – 120 g/m3*hr.

20
Amanullah et al (2000) performed equilibrium and kinetic studies on MEK
adsorption in compost and granular activated carbon. Reaction rates and selectivity of
microorganisms for MEK biodegradation, and the role of adsorption capacity of the
support medium on biofilter dynamics were also investigated. Experiments were
conducted using a stainless steel column with a treatment volume of 0.008 m3. Two
types of support media, compost and granular activated carbon (GAC), were evaluated.
The compost consisted of soil particles and bark chips ranging from 2 – 20 mm in size.
Commercially available GAC was used. The experimental procedure used EBRT’s
ranging from 25 to 50 seconds and an MEK influent concentration 1.1869 g/m3.
Reported removal efficiencies ranged from 25 to 30% under the conditions tested.
Chou and Huang (1997) reported use of biotrickling filters to study treatment of
MEK contaminated air streams. Two types of packing materials, polypropylene spheres
and wood bars, were tested in reactors with a treatment volume of 0.141 m3. Influent
MEK concentrations ranging from 0.9 to 5 g/m3 were tested. Removal efficiencies
ranging from 40 to greater than 97% were reported.
Farmer (1994) studied treatment of a MEK contaminated gas stream using three
separate reactor columns connected in series. The columns were packed with 13 mm
ceramic Berl saddles as an inert support for the biofilm, and the system had a total
treatment volume of 0.003 m3. Data and results reported here and in Table 2.1 used only
the data Farmer reported to identify steady-state conditions. Influent MEK
concentrations ranged between approximately 60 and 70 g/m3, and removal efficiencies
ranged between 56 and 96%.

21
Agathos et al. (1997) reported a novel type of bioreactor design to treat VOC
contaminated air stream. The reactor design consisted of mixing contaminated gas and a
mist of nutrient solution and microorganisms in order to maximize contact and transfer
between gas, liquid and microorganisms. The bioreactor was void of packing material;
however, a biofilm developed attached to the glass reactor wall. A reactor volume of
0.017 m3 and influent concentrations ranging from 1.17 to 10 g/m3 were used. They
reported removal efficiencies ranging from 0 to 70%.
2.4.3 Degradation of Mixtures Including MEK
Inhibition, induction, and repression are processes that can cause a decrease in
biodegradation rates of specific compounds. Real life conditions dictate that biofilters
will usually receive a complex mixture of VOCs. Ottengraph et al. (1991) reported that
the greater the complexity of a waste stream in terms of number of constituents present,
the lower the biodegradation of compounds achieved. Deshusses (1994) reported an
inhibitory effect on the degradation rate of MEK when a biofilter received a mixture of
MEK and methyl isobutyl ketone (MIBK). Removal efficiencies for MEK and MIBK
when introduced as the sole substrate were 120 g/m3*h and 30 g/m3*h, respectively.
When mixed at equal (mass) influent concentrations, both MEK and MIBK elimination
capacities were reduced to a maximum of 40 and 18 g/m3*h, respectively (Deshusses and
Hamer, 1993).

22
Table 2.1: Previous research reported in the literature on biological treatment of gas contaminated with MEK
Reference EBRT (sec)
Vol (m^3)
Ci (g/m^3)
Mass Flow (g/hr)
Cross Sectional
area (m^2)
Loading Rate (vol)
g/m^3*hr
Loading Rate (cross-area)
g/m^2*hr
Percent Removal
(%)
Elimination Capacity
(g/m^3*hr)Packing Operation
90 0 – 8.75 Deshusses et al.
(1995) 45 0.005
0 – 4.38
0 – 1.75 0.005
0 - 350
0 - 350 0 34.3 0 - 120 Compost and polystyrene
spheres Biofilter
50 1.73 216 216 30 64.8 Amanullah, Md et al (2000) 25
0.008 1.1869 3.47
0.008 432 432 25 108
Compost and GAC Biofilter
88.4 0.9 5.17 36.7 72.8 > 97 35.6
88.4 0.1 - 5 0.574 - 28.7 4.07 - 203.5 8.08 - 404.2 > 97 4 – 197 88.4 0.7, 1.8, 3.7 4.02, 10.33, 21.24 28.51, 73.26, 151 56.6, 145.5, 299.1 >95 27 – 143
Chou and Huang (1997)
186.7
0.141
0.1 - 4.5 0.574 - 25.83
0.071
4.07 - 183.2 8.08 - 363.8 40 - 50 1.6 – 91.6
Polypropylene spheres and Wood Bars
Biotrickling Filter
60 70.6 0.212 70.6 106 56 39.5 Farmer (1994)
180
0.003
63.9 0.064
0.002
21.3 32 96 20.5
Ceramic Berl Saddles Biofilter
10.0000 8.5 500 558.8 0 0
2.0000 2.13 125 140 20 and 50 25, 62.5 1.1780 1.06 62.5 70 67 41.9 2.7685 2.48 145.8 162.9 43 62.7
Agathos et al. (1997) 68.4 0.017
4.3294 3.9
0.017
229.2 255.9 35 80.2
none Tubular Biofilm reactor

23
Biofilter performance and process efficiency is a product of both the
component characteristics and operation of the biofilter, as well as the chemical
properties of the compounds being treated. Differences in biodegradation rates and
inhibition rates can mainly be attributed to differences in packing affinities, Henry
coefficients, intrinsic biodegradation rates, and affinity with the degradation key
enzymes (Deshusses, 1997). This was experimentally shown by the step input of
hexane, acetone, MIBK and 1-propanol, or mixtures of these solvents to a biofilter
degrading MEK. Hexane was neither sorbed nor degraded, due to its high Henry’s
coefficient and low water solubility. Acetone was sorbed and well degraded, as was
1-propanol. Carbon dioxide values peaked 2-5 hours after the step injection of a
transient VOC load, suggesting that pollutants were first sorbed to the packing
material, and subsequently degraded. MIBK showed the greatest inhibitory affect on
MEK.
Kazenski and Kinney (2000) studied the interactions of common VOC’s found
in paint spray booth off-gasses. MEK is a common constituent of this waste stream,
but in their study they used methyl n-propyl ketone, which is molecularly similar to
MEK. Results showed a common order of degradation: n-butyl acetate, ethyl 3-
ethoxypropionate, methyl n-propyl ketone, toluene, and p-xylene. Bottle studies
confirmed this order.
2.5 Salinity Effects on MEK removal
In many biofilter applications, a nutrient solution is periodically added to the
packing medium to provide nutrients (e.g., nitrogen and phosphorous) necessary for

24
microbial growth. Some of the nutrient solutions used in this manner contain
relatively high salt concentrations. Previously reported experimental evidence
suggests that high salinity can greatly effect biodegradation of ketones. For example,
Mahmoud and Davis (1970) reported significant changes in substrate utilization due to
salt concentrations. Batch studies, where cultures were acclimated at certain salt
concentrations and then shocked with markedly greater or lower media solutions
containing ketones, were conducted to test this. They concluded that salinity shocks
on the order of +/- 10,000 mg/L had very little effect on the metabolic response of the
mixed cultures. However, a mixed culture acclimated to fresh water and shocked with
seawater showed a 50% reduction in substrate removal efficiency. Likewise, a mixed
culture acclimated to seawater and shocked with fresh water showed an 86% reduction
in removal efficiency. In general, it was shown that negative shock magnitudes
resulted in greater reduction in substrate removal compared to positive shock
magnitudes. They also reported higher oxygen uptake per unit substrate removed, for
mixed cultures acclimated to higher salinity levels.
25
CHAPTER 3 MATERIALS AND METHODS
3.1 Packing Medium
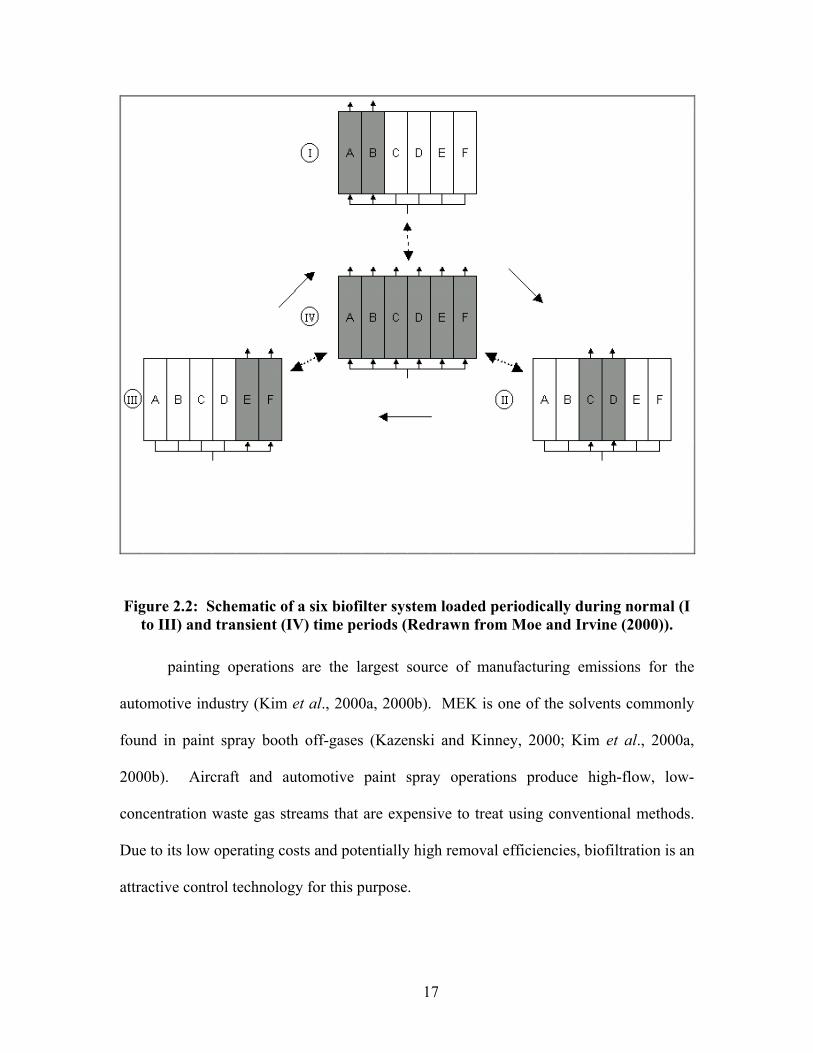
3.1.1 Polyurethane Foam Manufacture
The procedure used to make the polyurethane foam packing medium was
similar to that employed by Moe and Irvine (2000) and Martinez et al. (2000). A
surfactant solution was made by dissolving 30 g PluronicsTM P-65 surfactant (BASF
Corporation, Mount Olive, NY) per 1.0 L of deionized water, and then cooling over
night at 8 oC in a laboratory refrigerator. HypolTM 3000 prepolymer (Hampshire
Chemical Company, Lexington, MA) was heated to 55 oC in a constant temperature
water bath and then maintained at that temperature for at least 2 hours before use.
Molds for the foam cylinders were constructed of poster board. The inside diameter
for the foam molds was calculated by measuring the inside diameter of a section of the
biofilter column and adding 0.5 cm to this measurement. The extra 0.5 cm was to
allow the foam cylinders to be self supporting in the biofilter by exerting pressure on
the glass walls of the column. A finished mold had a circumference of 32.7 cm, an
average height of 22 cm, and a cellophane bottom secured by a rubber band.
Working under a fume hood, 110 g of surfactant solution and 110 g of
prepolymer were measured separately (using an analytical balance) in disposable 470
mL. plastic cups (Solo Cup Co., Highland Park, IL). The surfactant solution was then
poured into the prepolymer, and mixed with a high torque mechanical mixer
(Lightnin, Rochester, NY) at 1000 RPM for approximately 20 seconds. When the
26
foaming mixture began to rise, the mixture was poured into the mold. The foam was
allowed to cure in the fume hood.
3.1.2 Packing Medium Rinsing Procedure
After the foam was allowed to cure for two hours, the cardboard molds were
removed, and the top and the bottom 1.0 cm of each cylinder were sliced off using a
disposable microtome blade. Resulting foam cylinders were dried in a laboratory oven
at 65oC for 24 hours before being weighed and then rinsed to remove excess surfactant
using the following procedure. The foam cylinders were initially rinsed five times
with deionized water to remove excess surfactant. After the initial rinse, the cylinders
were placed in a five gallon plastic bucket filled with 9.0 L of deionized water and
allowed to soak for approximately two hours. Next, the cylinders were removed,
compressed to remove excess water, and then rinsed three times with deionized water
before being placed back into the container with 9.0 L of fresh deionized water. This
process was repeated until there was less than 0.5 mg/L (as soluble TOC) of surfactant
remaining in the foam rinse water After the rinse was completed, cylinders were
dried at 65 oC over night, and then the dry mass of each cylinder was recorded. The
TOC analysis method is described in section 3.7.1.
3.2 Experimental Apparatus
Laboratory experiments described herein employed three identical glass
biofilter columns: (arbitrarily named BF1, BF2, and BF3) as shown in Figure 3.1.
Each biofilter consisted of five sections plus a top and a bottom. Each section had an
inner diameter of 9.9 cm and a height of 22 cm. Each column section was filled with
27
20 cm of polyurethane foam medium providing a total bed depth of one meter and a
total packed bed volume of 7.7 L. Columns were assembled by placing VitonTM O-
rings between each section and securing with a horse-shoe clamp.
Compressed air from a laboratory air tap flowed through tubing to an activated
carbon filter (Calgon type F-300) to remove any unwanted contaminants from that air
supply. A manifold system split the air stream into 3 separate flows that each made up
95% of the total flow to one biofilter. A pressure regulator (series R35, Arrow
Pneumatics, Inc., Broadview, IL) was used to control the air-pressure to each biofilter.
The flow rates were measured and regulated with Cole-Palmer Rotometers (Gilmont
Instruments, 150 mm scale Accucal flow meter Cole-Palmer Instrument Co., Vernon
Hills, IL). Each rotometer was calibrated using an Aalborg GFM37 digital mass
flow meter (Orangeburg, NY).
Each of the airstreams making up 95% of the flow was passed through an
aeration stone submerged in a 20 L glass carboy heated with electrical heating tape.
To insure at least 95% relative humidity in the air entering the bottom of the biofilters,
the relative humidity was measured with an NIST traceable digital hygrometer (Fisher
Scientific, Sewanee, GA) The remaining 5% of the airflow to each biofilter was
directed through a separate rotometer to control the flow rate to an injection port for
MEK volatilization. MEK volatilization into the influent air stream was accomplished
using a KD Scientific model 100 syringe pump (KD Scientific Inc., New Hope, PA)

28
Figure 3.1: Schematic Diagram of Laboratory biofilter apparatus.
with a gas tight syringe (Hamilton Scientific, model 1005TLL, Reno, NV). The
injection port consisted of a glass tube with airtight compression fittings, and a port
where a Thermogreen LB-1 half-hole septum (Supelco, Belefonte, PA) was inserted
for the point of needle insertion. To minimize contaminant sorption to the
experimental apparatus, all surfaces contacting the gas stream after the point of MEK
injection were made of glass, Teflon, or VitonTM tubing.
1. Laboratory air supply
2. Activated carbon filter
3. Pressure Regulator
4. Flow meter 5. Syringe Pump 6. Humidification
chamber 7. Liquid drain 8. Biofilter
Apparatus 9. Foam packing
medium 10. Septum filled
monitoring ports 11. Effluent
9.
10.
6.
1.
2.
3.
5.
4.
7.
8.
11
4.
29
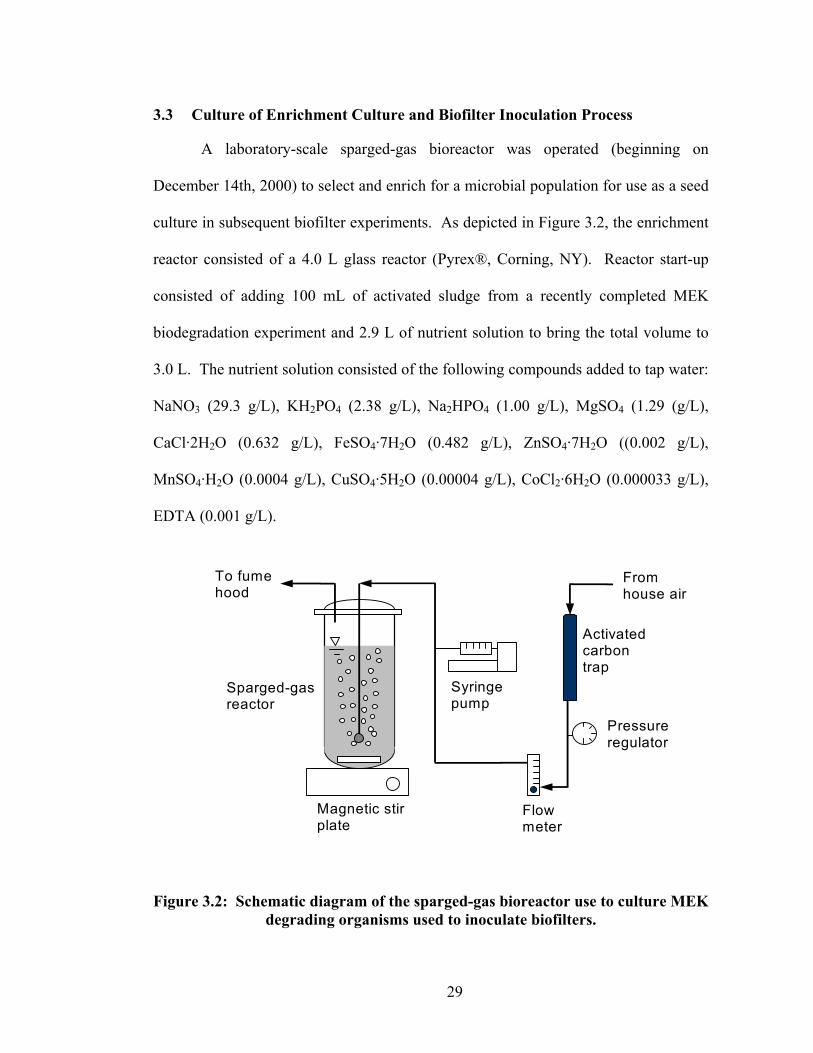
3.3 Culture of Enrichment Culture and Biofilter Inoculation Process
A laboratory-scale sparged-gas bioreactor was operated (beginning on
December 14th, 2000) to select and enrich for a microbial population for use as a seed
culture in subsequent biofilter experiments. As depicted in Figure 3.2, the enrichment
reactor consisted of a 4.0 L glass reactor (Pyrex®, Corning, NY). Reactor start-up
consisted of adding 100 mL of activated sludge from a recently completed MEK
biodegradation experiment and 2.9 L of nutrient solution to bring the total volume to
3.0 L. The nutrient solution consisted of the following compounds added to tap water:
NaNO3 (29.3 g/L), KH2PO4 (2.38 g/L), Na2HPO4 (1.00 g/L), MgSO4 (1.29 (g/L),
CaCl·2H2O (0.632 g/L), FeSO4·7H2O (0.482 g/L), ZnSO4·7H2O ((0.002 g/L),
MnSO4·H2O (0.0004 g/L), CuSO4·5H2O (0.00004 g/L), CoCl2·6H2O (0.000033 g/L),
EDTA (0.001 g/L).
Syringe pump
From house air
Activated carbon trap
Pressure regulator
Flow meter
Sparged-gas reactor
To fume hood
Magnetic stir plate
Figure 3.2: Schematic diagram of the sparged-gas bioreactor use to culture MEK degrading organisms used to inoculate biofilters.

30
House air was used for the air stream, and a carbon trap (type F-300, Calgon
Carbon Corporation, Pittsburgh, PA) was employed to eliminate any oil or other
contaminants from the house air compressor. An Arrow Pneumatics, series R35,
pressure regulator (Arrow Pneumatics, Inc., Broadview, IL) was used to control the air
pressure. A flow rate of 5.0 L/min was achieved with a Cole Palmer Rotometer
(Gilmont Instruments, 150 mm scale Accucal flow meter Cole-Palmer Instrument Co.,
Vernon Hills, IL). MEK volatilization into the influent air stream was accomplished
using a KDScientific, model 100 syringe pump (KD Scientific Inc., New Hope, PA)
with a gas tight syringe (Dynatech Precision Sampling Corp., series A-2, 5.0 mL
Pressure-Lok syringe, Baton Rouge, LA).
The injection port consisted of a glass tube with airtight seals, and an injection
port where a septum (Thermagreen LB-1 septum, Supelco, Bellefonte, PA) was
inserted for the point of needle insertion. All surfaces after the MEK was injected into
the air stream were made of glass, Teflon, or VitonTM tubing. These relatively inert
materials were used to minimize contaminant sorption to the reactor apparatus.
Contaminated air stream was introduced into the reactor using a fine bubble air
diffuser stone (Fisher Scientific, Sewanee, GA) connected to the influent airline by
VitonTM tubing and a 1 mL glass pipette. The reactor was placed on a magnetic stir
plate to allow mixing using a Teflon-coated stir bar.
The sparged-gas reactor was operated with a gas flow rate of 5.0 L/min (0.30
m3/hr) and a syringe pump setting of 0.07 mL/hr for MEK delivery. This corresponds
to an influent gas-phase MEK concentration of 106 ppmv and a MEK mass flow rate

31
of 0.0531 g/hr. On a daily basis, 10% of the reactor volume was removed and
replaced with fresh nutrient solution to produce a sludge age of 10 days. The reactor
was cleaned every two days to minimize biomass accumulation on reactor surfaces.
Oxygen uptake rate (OUR) was measured using a YSI Biological Oxygen
Monitor (Model 100). Total suspended solids (TSS) and volatile suspended solids
(VSS) were measured using Standard Methods for the Examination of Water and
Waste Water (APHA, 1998). For the OUR measurements, conducted in triplicate
using a 4 mL sample volume, dissolved oxygen concentrations were recorded over a
five-minute period. The OUR was determined from a linear regression, and the
average of the three measurements for each day was used in conjunction with the
average TSS to calculate the SOUR.
The sparged gas reactor was operated for a 75 day period (beginning on
December 14th, 2000) prior to inoculation of the biofilters (on February 27th, 2001).
OUR, TSS, and VSS measurements (in triplicate) were taken before and after the
inoculating culture was allowed to settle. On the day of biofilter inoculation, the OUR
of the initial reactor, before settling, was 12.6 mg/L*hr. The endogenous OUR,
measured by aerating a sample for thirty minutes prior to analysis, was 4.8 mg/L*hr.
A spike of 1.5 µL MEK was injected into the oxygraph chamber following completion
of the endogenous experiment to determine the microbes’ ability to degrade MEK
(i.e., use MEK as a source of carbon). The spiked OUR was 181 mg/L*hr. The
average TSS and VSS of the microbial consortium were 2680 mg/L and 1400 mg/L,
respectively.

32
The biomass was allowed to settle for one hour and then 3.5 L was decanted,
0.5 L was re-suspended with 3.5 L of nutrient solution; resulting in 4.0 L of inoculum
consortium. After re-suspension, the OUR was 3.46 mg/L*hr, TSS and VSS were
2560 and 1160 mg/L, respectively. The decrease in OUR of the resuspended
consortium with respect to the initial was probably due to insufficient settling. An
interface did not form during reactor settling, therefore biomass was lost when the
supernatant was drained. With less biomass, a lower OUR would be expected. The
spike experiment described above was repeated for the re-suspension inoculum, and
the OUR was 245 mg/L*hr. These results clearly indicate the microbes’ ability to
degrade MEK.
Once these measurements had been conducted, four liters of inoculum were
pumped from the glass kettle reactor into a five-gallon bucket. The foam cylinders
were then brought to 65% moisture content by evenly squeezing the cylinders while
they were immersed in the inoculum. After the biofilters were packed, 0.49 L of
inoculum consortium remained. The TSS and VSS of the remainder was 3360 and
1480 mg/L respectively. Therefore, the total biomass inoculated was approximately
1300 mg VSS per biofilter.
3.4 Normal Loading Experiments
Following the inoculation procedure, each of the three biofilters (arbitrarily
designated as BF1, BF2, and BF3) was operated using a different loading strategy.
BF1 served as a control and was operated under continuous loading with an EBRT of
120 seconds and an influent MEK concentration of 106 ppmv. This operating strategy

33
is the same as that depicted in Figure 2.3 and corresponds to a biofilter that
continuously receives an influent waste stream.
The periodically operated biofilters (BF2 and BF3) were operated with a
loading strategy that consisted of contaminant addition during only a fraction of a 12
hour cycle. BF2, operated with a 40 second EBRT, received contaminant addition
during a four hour FEED period and then underwent an eight hour REACT period
during which uncontaminated air continuously flowed through the biofilter. BF3,
operated with a 20 second EBRT, received contaminant addition during a two hour
FEED period and then underwent a ten hour REACT period during which
uncontaminated air continuously flowed through the biofilter. BF2 simulated the
loading condition experienced by one biofilter in a three biofilter system as depicted in
Figure 2.2. BF3 simulated the loading condition experienced by one biofilter in a six
biofilter system as depicted in Figure 2.1.
Influent MEK concentrations for the normal loading period are depicted in
Figure 3.3. For the periodically loaded biofilters, uncontaminated air was supplied
throughout the REACT period at the same flow rate as during the FEED period.
Operational parameters are summarized in Table 3.1 below. For each of the biofilters,
the influent MEK concentration was identical and the mass MEK entering the biofilter
during a 12 hour cycle was identical. The biofilter loading differed only in the EBRT
and the time period during which the contaminants were applied. “Normal loading”
refers to all three biofilters receiving an influent MEK concentration of 106 ppmv or
113.28 g/m3 over one cycle of contaminant load.

34
MEK concentration in the influent and effluent was measured to determine
contaminant removal rate in each reactor. Carbon dioxide concentrations were also
monitored to evaluate contaminant degradation rates.
3.5 Shock Loading Experiments
Experiments were conducted to assess the ability of the three different
biofilters to remove MEK during a transient period of elevated contaminant
concentration (i.e., “shock loading” conditions). These experiments were arbitrarily
named Shock Load I, II, and III. During shock loading experiments, the influent MEK
concentration was increased to 530 ppmv (five times the concentration during normal
loading) for a period lasting one hour.
Shock loading experiments took into account that in practice, an uncontrolled
transient load to a biofilter could occur at any time during an operating cycle and an
operator could take various actions in response to the transient loading condition. For
example, with a set of three biofilters constructed in parallel and operated in sequence
(see Figure 2.1, section 2.3), a shock load encountered during period III may have a
different effect than one encountered during period I. As the system switches to
period VII for the shock load, biofilters A and C are the only biofilters in the six
biofilter system that were being operated similarly. Biofilter B in period III had just
entered REACT, however biofilter B in period I had been undergoing REACT for a
substantial fraction of the cycle length. Experiments were designed and conducted to
represent the range of loading conditions that might arise.

35
Table 3.1: Comparison of biofilters during “normal” operation
Parameter BF1 BF2 BF3
Operating policy for biofilter continuous periodic periodic Number of cycles/day --- 2 2 Time for cycle (hr) --- 12 12 Time for FEED (hr) --- 4 2 Time for REACT + IDLE (hr) --- 8 10 FEED Time / Total cycle time (ratio) 1/1 1/3 1/6 EBRT (seconds) 120 40 20 Daily mass flow rate of MEK (g) 1.73 1.73 1.73 MEK mass flow rate during FEED (g/hr) 0.072 0.217 0.434 Equivalent # of biofilters operated in parallel 1 3 6
020406080
100120
0 2 4 6 8 10 12 14 16 18 20 22 24
Time (hour)
Influ
ent M
EK
C
once
ntra
tion
(ppm
v)
BF1BF2BF3
Figure 3.3: Step input of MEK over two cycles of normal loading.
00.10.20.30.40.5
0 2 4 6 8 10 12 14 16 18 20 22 24
Time (hours)
Influ
ent M
EK
Flo
w R
ate
(g/h
r)
BF1BF2BF3
Figure 3.4: Influent MEK flow rate over two cycles of normal loading.

36
Shock Loading experiments I and II were conducted with the assumption that
an operator would have online monitoring and process knowledge so that the EBRTs
of BF2 and BF3 could be adjusted to the 120 second EBRT of BF1 when a transient
period of elevated loading occurred. This corresponds to loading condition VII
depicted in Figure 2.1 and simulates the loading condition where all biofilters installed
in parallel are loaded simultaneously. In such a case, the EBRTs in BF2 and BF3
increase to three and six times as long as during “normal” loading, respectively, while
that of BF1 remains unchanged. Shock Load III tested the systems’ ability to treat a
shock load without operator control (i.e., the EBRTs were not changed in any of the
biofilters).
Effluent MEK concentrations were monitored to evaluate the mass of MEK
breakthrough. Each shock loading experiment was performed in triplicate (with
replicates arbitrarily named A, B, and C) for each of the biofilters. Effluent CO2
concentrations were measured during one Shock Load I experiment, and during all
Shock Load II and III experiments. Influent CO2 concentrations were measured prior
to each experiment so that the CO2 production in each biofilter could be calculated.
For Shock Load I, the shock load was applied one hour into the REACT period
in BF2 and BF3. After the shock load, periodically operated biofilters (BF2 and BF3)
were put into REACT (while the EBRT remained at 120 seconds for a period of 2
hours) before returning to the normal operating cycle. BF1 received a continuous
loading before and after the shock. Table 3.2 summarizes the operational parameters
for shock load experiments IA, IB, and IC.

37
During Shock Load II, the one-hour shock load was applied during the last
hour of FEED for BF2 and BF3. After the shock load, the periodically operated
biofilters were switched to a normal REACT period but with the EBRT remaining at
120 seconds for a two-hour period. Table 3.3 summarizes the operational parameters
for shock load experiments IIA, IIB, and IIC.
During Shock Load III, the one-hour shock load period was applied during the
last hour of FEED in BF2 and BF3. In contrast to Shock Load I and II experiments,
the EBRTs remained at 40 and 20 seconds in BF2 and BF3, respectively, during and
after the shock load period. Table 3.4 summarizes the operational parameters for
Shock Load IIIA, IIIB, and IIIC.
3.6 Fixed-Bed Adsorption and Desorption Experiments
Dynamic, fixed-bed sorption experiments were conducted to determine the
adsorption and desorption characteristics of the polyurethane foam packing material
under various loading conditions. Experiments were conducted at EBRTs of 120, 40,
and 20 seconds using MEK concentrations of 106 ppmv and 530 ppmv. Each
combination of EBRT and MEK concentration was tested in duplicate.
In the adsorption studies, packing media prepared exactly as that used in
subsequent biofilter experiments (see section 3.1) was adjusted to 65% moisture
content using deionized water and then placed into a glass column identical to that
used in biofilter experiments (see section 3.2). The total depth of the packing medium
was 1.0 m and the total packed bed volume was approximately 7.7 L. Adsorption

38
Table 3.2: Comparison of biofilters during Shock Load I.
Parameter BF1 BF2 BF3
EBRT (seconds) 120 120 120 Time for transient (hr) 1 1 1 MEK concentration during transient (ppmv) 530 530 530 Mass flow rate of MEK during transient in g/hr or g/m3*hr [in brackets] 0.363 [51.9] 0.363 [51.9] 0.363
[51.9] 0.072 0.217 0.434 Normal mass flow rate of MEK during FEED
(g/hr) [g/m3*hr] [10.3] [31] [62] Ratio of FEED mass flow rates (transient:normal) 5.01 : 1 1.67 : 1 0.84 : 1 Period prior to transient Normal IDLE IDLE EBRT prior to transient (seconds) 120 40 20 Period after transient Normal REACT REACT EBRT after transient (seconds) 120 120 120
Table 3.3: Comparison of biofilters during Shock Load II
Parameter BF1 BF2 BF3
EBRT (seconds) 120 120 120 Time for transient (hr) 1 1 1 MEK concentration during transient (ppmv) 530 530 530 Mass flow rate of MEK during transient in g/hr or g/m3*hr [in brackets] 0.363 [51.9] 0.363 [51.9] 0.363
[51.9] 0.072 0.217 0.434 Normal mass flow rate of MEK during FEED
(g/hr) [g/m3*hr] [10.3] [31] [62] Ratio of FEED mass flow rates (transient:normal) 5.01 : 1 1.67 : 1 0.84 : 1 Period prior to transient Normal FEED FEED EBRT prior to transient (seconds) 120 40 20 Period after transient Normal REACT REACT EBRT after transient (seconds) 120 120 120
experiments were conducted by setting the syringe pump and influent air flow
rates to the desired levels and then measuring the effluent MEK concentration over
time until complete breakthrough was reached. Breakthrough was defined as the point
where the effluent concentration was equal to the influent concentration within
analytical error.

39
Table 3.4: Comparison of biofilters during Shock Load III
Parameter BF1 BF2 BF3
EBRT (seconds) 120 40 20 Time for transient (hr) 1 1 1 MEK concentration during transient (ppmv) 530 530 530 Mass flow rate of MEK during transient in g/hr or g/m3*hr [in brackets] 0.363 [51.9] 1.089
[155.7] 2.179
[311.4] 0.072 0.217 0.434 Normal mass flow rate of MEK during FEED
(g/hr) [g/m3*hr] [10.3] [31] [62] Ratio of FEED mass flow rates (transient:normal) 5.01 : 1 5.01 : 1 5.01 : 1 Period prior to transient Normal FEED FEED EBRT prior to transient (seconds) 120 40 20 Period after transient Normal REACT REACT EBRT after transient (seconds) 120 40 20
The mass of contaminant adsorbed to the foam packing medium was calculated
giving consideration to the fact that a portion of the contaminant was absorbed in
water associated with the wet packing media. The mass of water present (65%
moisture content) was assumed to be in equilibrium with the influent gas-phase
concentration at the end of each adsorption experiment when the influent and effluent
contaminant concentrations were equal and unchanging over time. The dimensionless
Henry’s Law constant (2.35 x 10⁻³, Deshusses 1994) was used to calculate the
concentration of contaminant in the aqueous phase. The mass of contaminant in the
aqueous phase was calculated by multiplying the concentration by the mass of water
present in the wet foam. The mass of MEK adsorbed to the foam was calculated as
the total mass of contaminant sorbed minus the mass absorbed by water. The same
procedure was applied to obtain the mass of contaminant desorbed from the foam.
40
3.7 Analytical Techniques
3.7.1 TOC Measurement
The foam cylinders were wetted with deionized water to bring the moisture
content to 65%. The wet cylinders were submerged into a plastic bucket containing 9
L of deionized water. After submersion for at least three hours, each cylinder was
squeezed to remove excess water. Using glass microfiber filters GF/F 47mm ∅
(Whatman, England), the 9.0 L of water was filtered with a vacuum pressure station
from Cole-Palmer Instrument Co. (Vernon, IL). One filter was used for every 3.0 L of
water. After the initial filtration, the 9.0 L was mixed and 10.0 mL of filtered water
was filtered into sample vials using a 0.45 µm syringe filter (Millex, Bedford, MA).
The total organic carbon content of each sample was analyzed using a TOC–5050A
from Shimadzu (Kyoto, Japan). This procedure was repeated until the TOC content
was found to be less than 0.5 mg/L.
3.7.2 CO2 Analysis
A Servomex Ir1520 infrared CO2 analyzer (Servomex Company, Inc.,
Norwood, MA) was used to measure effluent CO2 concentrations during shock
loading experiments. Windaq software (Datataq Instruments, Akron, OH) was used
for online data acquisition. Concetrations were measured and recorded at one second
intervals. Average influent CO2 concentrations measured immediately prior to shock
loading experiments were subtracted from effluent concentrations measured during the
shock loading experiments to calculate the CO2 increase across the biofilter height.

41
To avoid damage to the instrument from the humidified air stream, a separate sample
port off of the condensation loop was used for CO2 measurements.
3.7.3 Gas-phase MEK Analysis
Gas-phase MEK concentrations were measured using a MiniRAE 2000
portable photoionization detector (PID) (RAE Systems Inc., Sunnyvale, CA). This
was calibrated using a two point calibration. The zero point was set using N2 (BOC
Gases, Port Allen, LA). The second calibration point was measured using either a 198
ppmv or a 1090 ppmv MEK balance nitrogen certified calibration gas standard (BOC,
Port Allen, LA). The higher calibration gas was used to verify calibration during the
shock loading experiments (where the concentration was higher than the 198 ppmv
calibration point).
The effluent gas stream was passed through a condensation loop to remove
moisture from the gas stream. This was necessary due to the PID’s sensitivity to
condensing moisture present in the gas stream being analyzed. A constant temperature
re-circulating water bath was set at 0oC, and the water was re-circulated through a
glass water jacket.
3.8 Nutrient Addition
Nutrients were added to each biofilter approximately every 40 days. At this
time, 9.0 L of nutrient solution described in section 3.3 was made. Each biofilter was
disassembled and washed with hot tap water. All the packing material for a particular
biofilter was placed in a five gallon bucket containing 3.0 L of the nutrient solution,
and each foam cylinder was brought to approximately 65% moisture content.

42
3.9 Nitrate Analysis
During the nutrient addition procedure described above, a pre-cut and pre-
weighed foam wedge was removed to determine the NO3-N concentration in each
system. The foam wedge was placed in an Erlenmeyer flask containing 250 mL of
deionized water and mixed vigorously. The solution was then diluted as necessary for
the NO3-N concentration to fall into the range of a standard curve. A HACH Nitrate
Test Kit (HACH Company, Loveland CO) was used to prepare the samples for
spectrophotometric analysis at 500 nm. The samples were run against a blank
containing all the reagents in DI water with no sample.

43
CHAPTER 4 RESULTS
4.1 Fixed-Bed Adsorption and Desorption Experiments
Figures 4.1 depicts abiotic adsorption data at all three EBRTs (120, 40, and 20
seconds) for both 106 ppmv and 530 ppmv influent MEK concentrations. Effluent
MEK concentrations were normalized (by dividing by the influent MEK
concentration) so that both 106 and 530 ppmv could be depicted on the same graph.
For the 120 second EBRT (top) 10% of the influent MEK concentration was observed
in the effluent after approximately 100 minutes for both the 106 and 530 ppmv
concentrations. For the 40 second EBRT (middle), 10% of the influent concentration
was observed in the effluent after approximately 40 and 38 minutes for the 106 and
530 ppmv concentrations, respectively. For an EBRT of 20 seconds (bottom), 10% of
the influent MEK was observed in the effluent after 7 and 15 minutes for the 106 and
530 ppmv concentrations, respectively. As expected, the time needed to reach 10%
breakthrough decreased as the EBRT decreased (flow rate increased).
For an influent gas-phase MEK concentration of 106 ppmv, the mass of MEK
sorbed to the packing medium (total absorbed in the water plus adsorbed to the foam)
was calculated to be 138, 325, and 394 mg for EBRTs of 120, 40, and 20 seconds,
respectively, (average of replicate data). Likewise, for an influent gas-phase MEK
concentration of 530 ppmv, the mass of MEK sorbed to the packing medium (total
absorbed in the water plus adsorbed to the foam) was calculated to be 730, 936, and
993 mg for EBRTs of 120, 40, and 20 seconds, respectively, (average of replicate
data). For an influent MEK concentration of 106 ppmv, the mean mass of MEK

44
sorbed to the packing medium (average of all data) was calculated to be 286 mg (37.1
g MEK/m3 wet packing medium). For an influent MEK concentration of 530 ppmv,
the mean mass of MEK sorbed to the packing medium (average of all data) was
calculated to be 886 mg (115.1 g MEK/m3 wet packing medium).
Figure 4.2 presents dimensionless MEK effluent concentrations during
desorption experiments conducted immediately after the adsorption experiments
presented in Figure 4.1. For desorption following equilibration with an influent gas-
phase MEK concentration of 106 ppmv, it took approximately 169, 69, and 86 minutes
for the effluent MEK concentrations to decrease to 10% of the initial influent
concentration for EBRTs of 120, 40, and 20 seconds, respectively. Likewise, for
desorption following equilibration with an influent gas-phase MEK concentration of
530 ppmv, it took approximately 169, 69, and 37 minutes for the effluent MEK
concentrations to decrease to 10% of the initial influent concentration for EBRTs of
120, 40, and 20 seconds, respectively. The time required for the effluent MEK
concentration to decrease to 10% of the initial concentration was proportional to the
EBRT.
For desorption following equilibration with an influent gas-phase MEK
concentration of 106 ppmv, the mass of MEK desorbed from the packing medium
(total absorbed in the water plus adsorbed to the foam) was calculated to be 132, 221,
and 243 mg for EBRTs of 120, 40, and 20 seconds, respectively, (average of replicate
data). Likewise, desorption following equilibration with an influent gas-phase MEK
concentration of 530 ppmv, the mass of MEK desorbed from the packing medium
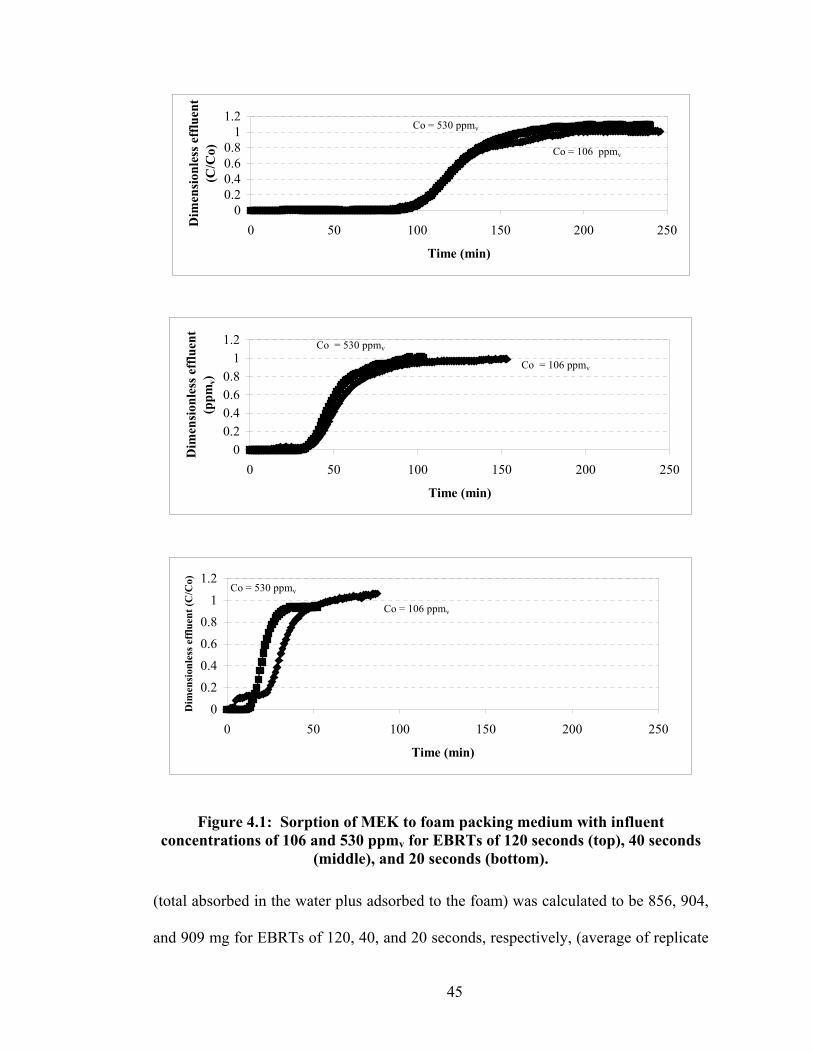
45
00.20.40.60.8
11.2
0 50 100 150 200 250
Time (min)
Dim
ensi
onle
ss e
fflu
ent
(C/C
o)
Co = 530 ppmv
Co = 106 ppmv
00.20.40.60.8
11.2
0 50 100 150 200 250
Time (min)
Dim
ensi
onle
ss e
fflu
ent
(ppm
v)
Co = 530 ppmv
Co = 106 ppmv
0
0.20.4
0.6
0.81
1.2
0 50 100 150 200 250
Time (min)
Dim
ensi
onle
ss e
fflu
ent (
C/C
o) Co = 530 ppmv
Co = 106 ppmv
Figure 4.1: Sorption of MEK to foam packing medium with influent concentrations of 106 and 530 ppmv for EBRTs of 120 seconds (top), 40 seconds
(middle), and 20 seconds (bottom).
(total absorbed in the water plus adsorbed to the foam) was calculated to be 856, 904,
and 909 mg for EBRTs of 120, 40, and 20 seconds, respectively, (average of replicate

46
data). For an initial MEK concentration of 106 ppmv, the mean mass of MEK
desorbed from the wet packing medium (average of all data) was calculated to be 199
mg (25.8 g MEK/m3 wet packing medium). For an initial MEK concentration of 530
ppmv, the mean mass of MEK desorbed from the wet packing medium (average of all
data) was calculated to be 890 mg (115.6 g MEK/m3 wet packing medium).
For an MEK concentration of 106 ppmv, the mean mass of MEK sorbed (37.1
g MEK / m3 wet packing medium) and desorbed (25.8 g MEK / m3 wet packing
medium) are within 30% of one another. For an MEK concentration of 530 ppmv, the
mean mass of MEK sorbed (115.1 g MEK / m3 wet packing medium) and desorbed
(115.6 g MEK / m3 wet packing medium) are within 0.5% of one another.
Concluding that flow (i.e. stripping) is a key factor in the sorption properties of
this medium, or the sorptive properties of this medium are relatively low.
4.2 Normal Loading
Immediately after the biofilters were inoculated, normal loading experiments
(described in Section 3.4) were initiated. Effluent MEK concentrations were
monitored over a period lasting more than 228 days to assess treatment efficiency for
the different biofilters. Results from these experiments are depicted in Figure 4.3. For
the continuously operated biofilter (BF1) removal efficiency was calculated as the
average over a period lasting at least 30 minutes. For the periodically operated

47
00.20.40.60.8
11.2
0 100 200 300 400 500
Time (min)
Dim
ensi
onle
ss e
fflu
ent
(C/C
o)
Co = 530 ppmv
Co = 106 ppmv
00.20.40.60.8
11.2
0 100 200 300 400 500
Time (min)
Dim
ensi
onle
ss e
fflu
ent
(C/C
o)
Co = 530 ppmv
Co = 106 ppmv
00.20.40.60.8
11.2
0 100 200 300 400 500
Time (min)
Dim
ensi
onle
ss e
fflu
ent
(C/C
o)
Co = 530 ppmv
Co = 106 ppmv
Figure 4.2: Desorption of MEK from foam packing medium following loading with influent concentrations of 106 and 530 ppmv for EBRTs of 120 seconds (top),
40 seconds (middle), and 20 seconds (bottom).

48
biofilters (BF2 and BF3), removal efficiency was calculated as one minus the mass of
effluent MEK during the experiment (effluent was monitored until less than 1 ppmv
was detected) divided by the mass of MEK entering the system during the experiment.
As shown in the figure, BF1 removed approximately 96% of the MEK on Day 1 while
removal in BF2 and BF3 was approximately 32% and 40%, respectively. Removal
efficiency in BF1 increased to approximately 99% by Day 2, and remained at that
level throughout the experiment.
Removal efficiency in BF2 increased to approximately 80% by Day 2 and
fluctuated between 77 and 94% during the first 56 days of operation. BF3 removal
efficiency increased from approximately 40% on Day 0 to approximately 84% on Day
18 where it remained relatively stable until Day 26. Removal efficiency in BF3
subsequently declined, reaching a value of approximately 25% on Day 54.
On Day 55, the biofilters’ nutrient content was re-normalized by immersing all
foam cylinders from all biofilters into 9.0 L of freshly prepared nutrient solution.
Following the nutrient addition procedure on Day 56, removal efficiency in BF1
remained at greater than 99%. Removal efficiency in BF2 ranged from 92% to greater
than 99%. Removal efficiency in BF3 increased to 68% on Day 58, the first time
removal efficiency was measured following nutrient addition. BF3 performance
continued to improve, reaching a maximum of approximately 93% on Day 67.
Performance subsequently decreased, reaching a removal efficiency of approximately
42% from Day 71 to Day 81.

49
On Day 84, nutrient addition was conducted with each biofilter’s foam packing
immersed in a 3.0 L volume of the nutrient solution. For this nutrient addition and
subsequent nutrient additions, the contents of each biofilter were kept separate from
the other biofilters during nutrient. BF1 and BF2 performance had stabilized at
greater than 99% removal by Day 68, while BF3 performance stabilized at
approximately 80% removal.
Figure 4.4 depicts the data presented in Figure 4.3 in terms of elimination
capacity for each biofilter averaged over the cycle. Figure 4.5 presents the elimination
capacity data over each biofilters feed cycle. BF3’s greater EC during the FEED
period results from its much higher loading rate during FEED.
4.2.1 Discussion
During the normal loading experiments, BF2 and BF3 showed somewhat
sporadic treatment efficiency. MEK removal efficiency in BF2 remained greater than
90% after the nutrient normalization, and remained close to 100% for the remainder of
the experiment. MEK removal efficiency in BF3 was unstable for the duration of the
normal loading, and only after 100 days did it remain above 75% removal efficiency.
Based on these results it was concluded that BF2 and BF1 showed far superior
treatment over BF3 during the normal loading experiments.
There a number of different phenomena that could have had resulted in BF3’s
unstable treatment. If the biofilters had been operated at the 120 second EBRT for the
first couple of weeks, we might have seen a far better comparison over the first 50
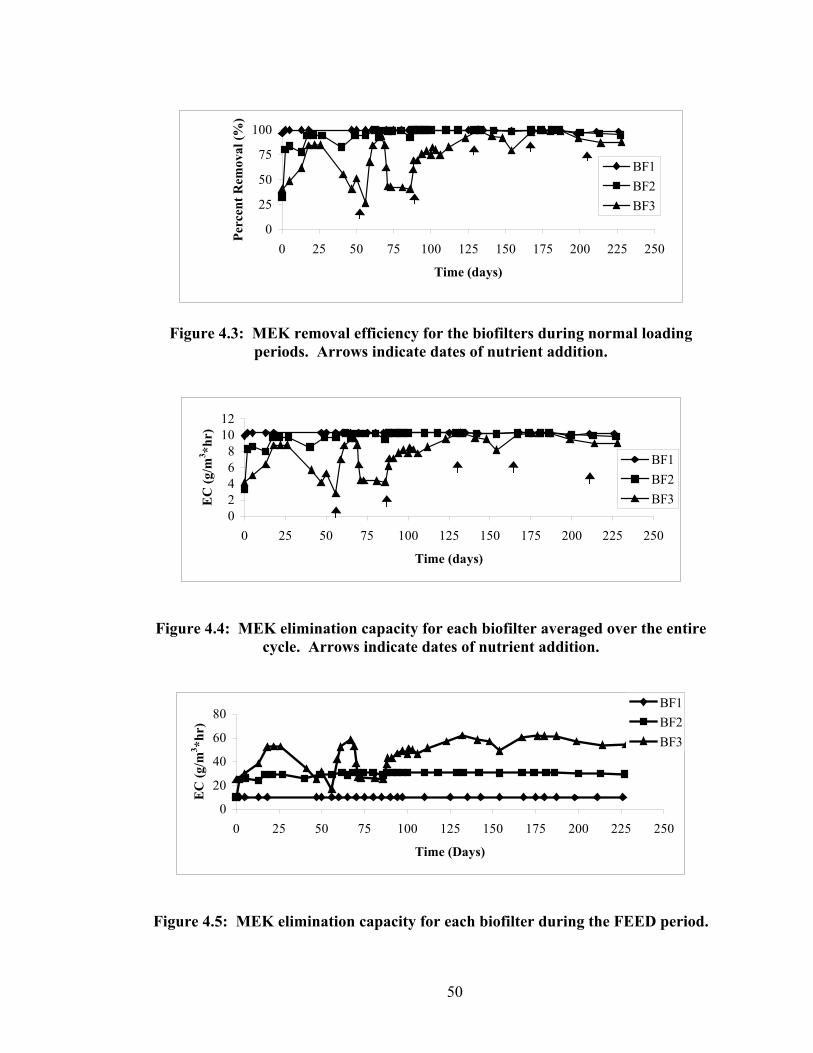
50
0
25
50
75
100
0 25 50 75 100 125 150 175 200 225 250
Time (days)
Perc
ent R
emov
al (%
)
BF1BF2BF3
Figure 4.3: MEK removal efficiency for the biofilters during normal loading periods. Arrows indicate dates of nutrient addition.
02468
1012
0 25 50 75 100 125 150 175 200 225 250
Time (days)
EC
(g/m
3 *hr)
BF1BF2BF3
Figure 4.4: MEK elimination capacity for each biofilter averaged over the entire cycle. Arrows indicate dates of nutrient addition.
0
20
40
60
80
0 25 50 75 100 125 150 175 200 225 250
Time (Days)
EC
(g/m
3 *hr)
BF1BF2BF3
Figure 4.5: MEK elimination capacity for each biofilter during the FEED period.
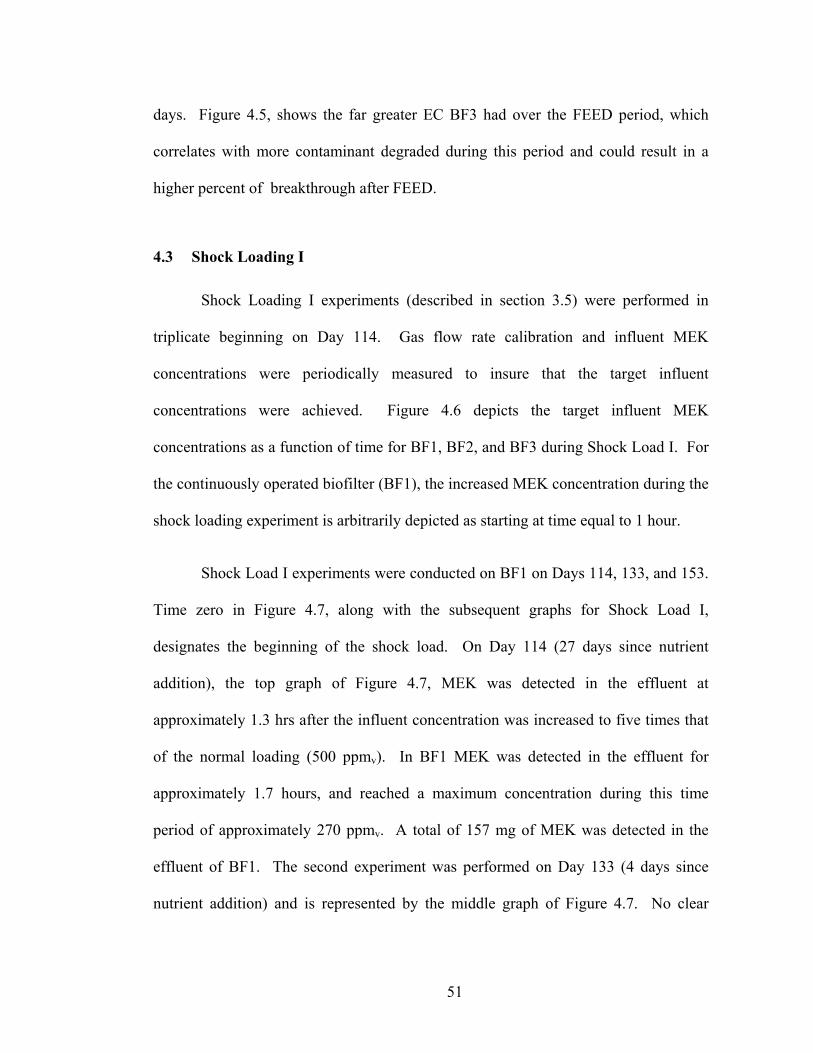
51
days. Figure 4.5, shows the far greater EC BF3 had over the FEED period, which
correlates with more contaminant degraded during this period and could result in a
higher percent of breakthrough after FEED.
4.3 Shock Loading I
Shock Loading I experiments (described in section 3.5) were performed in
triplicate beginning on Day 114. Gas flow rate calibration and influent MEK
concentrations were periodically measured to insure that the target influent
concentrations were achieved. Figure 4.6 depicts the target influent MEK
concentrations as a function of time for BF1, BF2, and BF3 during Shock Load I. For
the continuously operated biofilter (BF1), the increased MEK concentration during the
shock loading experiment is arbitrarily depicted as starting at time equal to 1 hour.
Shock Load I experiments were conducted on BF1 on Days 114, 133, and 153.
Time zero in Figure 4.7, along with the subsequent graphs for Shock Load I,
designates the beginning of the shock load. On Day 114 (27 days since nutrient
addition), the top graph of Figure 4.7, MEK was detected in the effluent at
approximately 1.3 hrs after the influent concentration was increased to five times that
of the normal loading (500 ppmv). In BF1 MEK was detected in the effluent for
approximately 1.7 hours, and reached a maximum concentration during this time
period of approximately 270 ppmv. A total of 157 mg of MEK was detected in the
effluent of BF1. The second experiment was performed on Day 133 (4 days since
nutrient addition) and is represented by the middle graph of Figure 4.7. No clear

52
breakthrough time could be determined for this run. The maximum MEK effluent
concentration detected in BF1 was 110 ppmv, detected 1.5 hours after the shock load.
The third experiment conducted on Day 153 (24 days since nutrient addition),
represented by the bottom graph of Figure 4.7, had a maximum MEK effluent
concentration detected in BF1 was 215 ppmv, detected 2 hours after the shock load.
CO2 production was monitored over this last run. The CO2 production data reached a
maximum value at approximately the end of the shock load (i.e., the first hour). The
drop in CO2 production and the increase in MEK breakthrough were proportional.
Suggesting the system had reached its treatment capacity (i.e. breakthrough).
Shock Load I was conducted on BF2 on Days 115, 132, and 143. Results are
presented in Figure 4.8. Time zero in Figure 4.8 designates the beginning of the shock
load (i.e., one hour into REACT). The effluent MEK concentration during the initial
shock load test on BF2 on Day115 (28 days since nutrient addition) is presented in the
top graph. No obvious pattern for MEK breakthrough could be determined. The
effluent MEK concentration reached a maximum of approximately 13 ppmv, and a
total of 25 mg of MEK was detected in the effluent. The second shock load,
conducted on Day 132 (3 days since nutrient addition), showed a maximum MEK
effluent concentration of 5.5 ppmv detected at 1.3 hours after the shock load ended
(see middle graph of Figure 4.8). MEK was detected in BF2’s effluent 1.07 hours
after the shock load ended and lasted for 1.2 hours, with a total of 2.38 mg of MEK
detected in the effluent. The bottom graph of Figure 4.8 shows the shock load
conducted on Day 143 (14 days since last nutrient addition). A maximum MEK

53
effluent concentration of 4.4 ppmv was detected at 1.5 hours after the shock load
ended. A distinct breakthrough time could not be determined from the data.
Shock Load I was conducted on BF3 on Days 124, 132, and 140. The first
shock load, Day 124 (37 days since nutrient addition), is represented by the top graph
of Figure 4.9. MEK was detected in the effluent approximately 1.8 hours after the
shock load was initiated. MEK was detected for approximately 0.6 hours, and reached
a maximum of 13 ppmv. A total of 5 mg of MEK was detected in the effluent. The
shock load conducted on Day 132 (3 days since nutrient addition), represented by the
middle graph, shows an effluent concentration that remained below 1.0 ppmv
throughout the experiment. A mass of 0.06 mg MEK was detected in the effluent.
Data from the final replicate of Shock Load I for BF3 on Day 140 (11 days since
nutrient addition), is presented in the bottom graph of Figure 4.9. Once again, the
MEK effluent concentration remained below 1.0 ppmv throughout the experiment, and
a total of 0.007 mg of MEK detected in the effluent. CO2 concentrations were
measured during this final replicate for BF3. Greater CO2 production for BF3,
depicted in this bottom graph, compared to BF1 would be a very good indicator of the
superior performance of the periodically operated biofilter to the continuously
operated biofilter for these conditions.
It is interesting to note, that MEK was not detected in the effluent until after
the one-hour shock load was over and the influent concentration had been decreased to
106 ppmv for all three biofilters. This suggests that switching back to the lower EBRT
would likely have caused stripping of the contaminant from the packing medium.
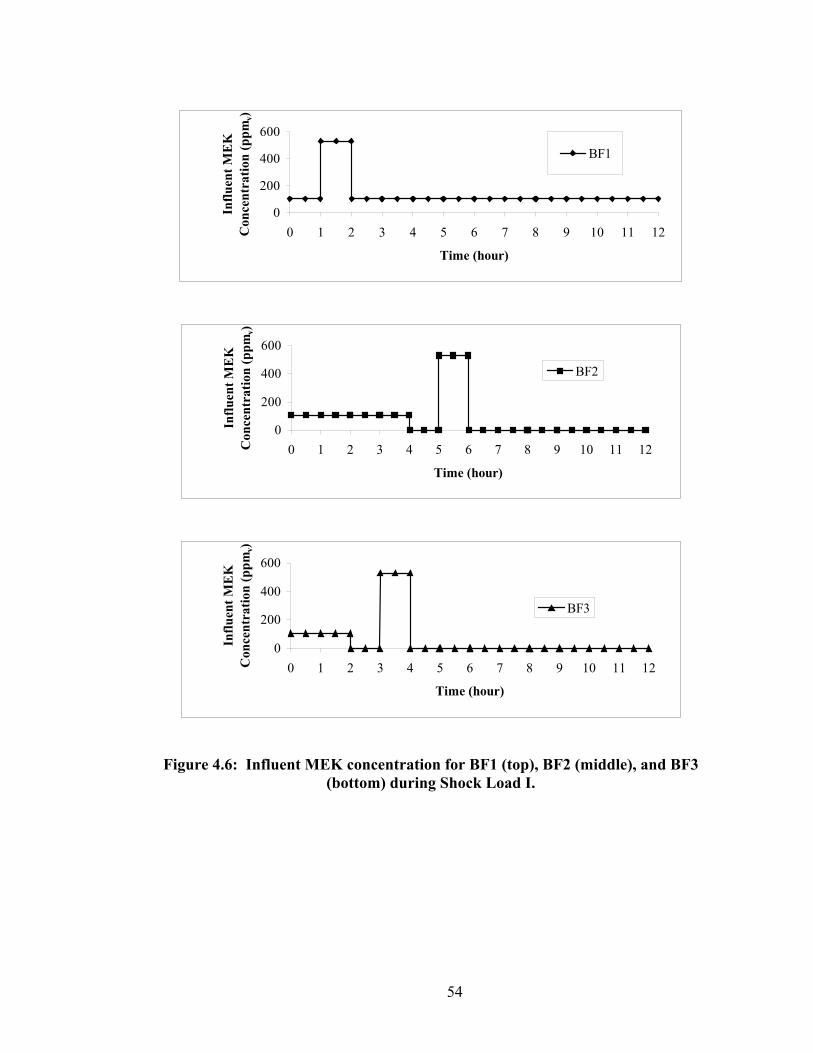
54
0
200
400
600
0 1 2 3 4 5 6 7 8 9 10 11 12
Time (hour)
Influ
ent M
EK
C
once
ntra
tion
(ppm
v)
BF1
0
200
400
600
0 1 2 3 4 5 6 7 8 9 10 11 12
Time (hour)
Influ
ent M
EK
C
once
ntra
tion
(ppm
v)
BF2
0
200
400
600
0 1 2 3 4 5 6 7 8 9 10 11 12
Time (hour)
Influ
ent M
EK
C
once
ntra
tion
(ppm
v)
BF3
Figure 4.6: Influent MEK concentration for BF1 (top), BF2 (middle), and BF3 (bottom) during Shock Load I.

55
050
100150200250300
0 1 2 3 4 5
Time (hours)
Eff
luen
t ME
K
Con
cent
ratio
n (p
pmv)
BF1
050
100150200250300
0 1 2 3 4 5
Time (hours)
Eff
luen
t ME
K
Con
cent
ratio
n (p
pmv)
BF1
050
100150200250300
0 1 2 3 4
Time (hours)
Eff
luen
t ME
K
Con
cent
ratio
n (p
pmv)
0
200
400
600
800
1000
CO
2 Pr
oduc
tion
(ppm
v)
BF1 MEKBF1 CO2
Figure 4.7: Effluent MEK and CO2 concentrations for BF1 during Shock Load I performed on Days 114 (top), 133 (middle), and 153 (bottom).

56
050
100150200250300
0 1 2 3 4 5
Time (Hours)
Eff
luen
t ME
K
Con
cent
ratio
n (p
pmv)
BF2
050
100150200250300
0 1 2 3 4 5
Time (hours)
Eff
luen
t ME
K
Con
cent
ratio
n (p
pmv)
BF2
050
100150
200250
300
0 1 2 3 4 5
Time (hours)
Eff
luen
t ME
K C
once
ntra
tion
(ppm
v)
BF2
Figure 4.8: Effluent MEK concentrations for BF2 during Shock Load I performed on Days 115 (top), 132 (middle), and 143 (bottom).

57
050
100150200250300
0 1 2 3 4 5
Time (Hours)
Eff
luen
t ME
K
Con
cent
ratio
n (p
pmv)
BF3
050
100150200250300
0 1 2 3 4 5
Time (hours)
Eff
luen
t ME
K
Con
cent
ratio
n (p
pmv)
BF3
050
100150200250300
0 1 2 3
Time (hours)
Eff
luen
t ME
K
Con
cent
ratio
n (p
pmv)
0
200
400
600
800
1000
CO
2 Pro
duce
d (p
pmv)BF3 MEK
BF3 CO2
4
Figure 4.9: Effluent MEK and CO2 concentrations for BF3 during Shock Load I performed on Days 124 (top), 132 (middle), and 140 (bottom).
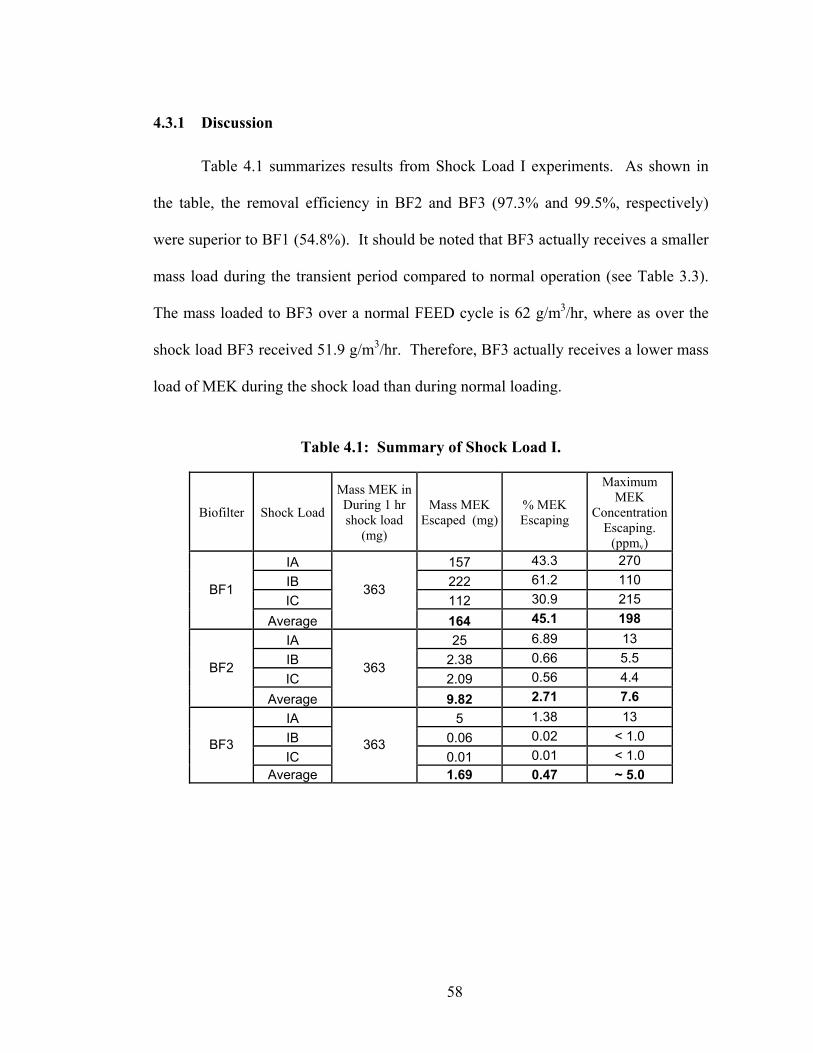
58
4.3.1 Discussion
Table 4.1 summarizes results from Shock Load I experiments. As shown in
the table, the removal efficiency in BF2 and BF3 (97.3% and 99.5%, respectively)
were superior to BF1 (54.8%). It should be noted that BF3 actually receives a smaller
mass load during the transient period compared to normal operation (see Table 3.3).
The mass loaded to BF3 over a normal FEED cycle is 62 g/m3/hr, where as over the
shock load BF3 received 51.9 g/m3/hr. Therefore, BF3 actually receives a lower mass
load of MEK during the shock load than during normal loading.
Table 4.1: Summary of Shock Load I.
Biofilter Shock Load
Mass MEK in During 1 hr shock load
(mg)
Mass MEK Escaped (mg)
% MEK Escaping
Maximum MEK
Concentration Escaping.
(ppmv) IA 157 43.3 270 IB 222 61.2 110 IC 112 30.9 215
BF1
Average
363
164 45.1 198 IA 25 6.89 13 IB 2.38 0.66 5.5 IC 2.09 0.56 4.4
BF2
Average
363
9.82 2.71 7.6 IA 5 1.38 13 IB 0.06 0.02 < 1.0 IC 0.01 0.01 < 1.0
BF3
Average
363
1.69 0.47 ~ 5.0

59
4.4 Shock Loading II
Shock Loading II experiments (described in section 3.6) were begun on Day
158. The experiments were performed in triplicate, with each biofilter being tested
once before the second run was administered. Gas flow rate calibration and influent
MEK concentrations were periodically measured to insure the concentrations were
correct. Figure 4.10 shows the influent MEK concentration as a function of time for
BF1, BF2, and BF3 during Shock Load II. For the continuously operated biofilter
(BF1), the MEK loading imposed on the biofilter was identical to that imposed during
Shock Load I experiments. For comparison purposes, the increased MEK
concentration for BF1 during Shock Load II experiments is arbitrarily depicted as
starting at time equal to 1 hour.
Shock Load II experiments were conducted on BF1 on Days 159, 165, and
167. It should be noted that time zero in Figure 4.11, along with the subsequent
graphs for Shock Load II, designates the beginning of the shock load. On day 159 (30
days since nutrient addition) MEK was detected in the effluent approximately 1.4 hrs
after the influent concentration was increased to 530 ppmv (see top graph of Figure
4.11). MEK was detected in the effluent for approximately 1.6 hours, and reached a
maximum concentration during this time period of approximately 270 ppmv. A total of
209 mg of MEK was detected in the effluent of BF1. The second experiment was
performed on Day 165 (36 days since nutrient addition) and is represented by the
middle graph of Figure 4.11. MEK was detected in the effluent approximately 1.8 hrs
after the influent concentration was increased to 530 ppmv, and reached a maximum

60
concentration during this time period of approximately 140 ppmv A total of 80 mg of
MEK was detected in the effluent of BF1. The third experiment conducted on Day
167 (2 days since nutrient addition), represented by the bottom graph of Figure 4.11.
MEK was detected in the effluent approximately 1.8 hrs after the influent
concentration was increased to 530 ppmv, and reached a maximum concentration
during this time period of approximately 60 ppmv. A total of 22 mg of MEK was
detected in the effluent of BF1.
Shock Load II was performed on BF2 on days 158, 160, and 167. The top
graph of Figure 4.12 represents the shock load data collected on Day 158 (29 days
since nutrient addition). No clear breakthrough time could be determined from the
data. BF2’s effluent MEK concentration reached a maximum of approximately 5
ppmv, with a total of 16 mg of MEK detected in the effluent. Data from the second
shock load experiment, conducted on Day 160 (31 days since nutrient addition), is
presented in the middle graph in Figure 4.12. Once again, such small readings make
it difficult to report and breakthrough times with certainty. The BF2 effluent MEK
concentrations were less than 1.0 ppmv. The readings were so small that an accurate
mass of MEK could not be determined. Effluent MEK and CO2 data from the third
Shock Load II replicate, conducted on Day 167 (2 days since nutrient addition), is
presented in the bottom graph in Figure 4.12. Once again, BF2 effluent MEK
concentrations were less than 1.0 ppmv. A total of 0.27 mg of MEK was detected in
the BF2 effluent.

61
Shock Load II was performed on BF3 on Days 160, 165, and 169. Data from
the Day 160 shock load (31 days since nutrient addition) is presented in the top graph
of Figure 4.13. BF3 had a maximum effluent MEK concentration of 3 ppmv, resulting
in 1.5 mg of MEK in the effluent. BF3 received a second shock load on Day 165 (36
days since nutrient addition) with the data being presented in the middle graph of
Figure 4.13. MEK effluent concentrations reached a maximum of 5 ppmv, while a
total of 1.5 mg of MEK was detected in the BF3 effluent. Data from the third shock
load, conducted on Day 169 (4 days since nutrient addition), is shown in the bottom
graph of Figure 4.13. There was less than 1.0 ppmv breakthrough of MEK, which
resulted in small of a mass value to report with certainty.
CO2 data was not available for BF1’s Day 159 Shock Load II, but should be
similar to the data from Days 165 and 167 since the experimental parameters were
identical. Data from BF1’s Day 167 run showed a maximum CO2 production value of
approximately 1000 ppmv, and was observed 45 minutes after the shock load was
completed. BF2’s CO2 data from Day 158 showed a maximum production value of
approximately 1210 ppmv 0.15 hours after the end of the shock load. CO2 data for
BF3 on Day 160 reached a maximum of approximately 1030 ppmv 0.30 hours after
the end of the shock load. However, a much faster reduction of the CO2 levels of BF2
would indicate a smaller amount of time that would need to be allotted for REACT.
CO2 values were greater in the periodically operated biofilters, which along with the
amount of MEK breakthrough for BF1, depict superior performance.

62
0100200300400500600
0 1 2 3 4 5 6 7 8 9 10 11 12
Time (hours)
Influ
ent M
EK
C
once
ntra
tion
(ppm
v)BF1
0100200300400500600
0 1 2 3 4 5 6 7 8 9 10 11 12
Time (hours)
Influ
ent M
EK
C
once
ntra
tion
(ppm
v)
BF2
0100200300400500600
0 1 2 3 4 5 6 7 8 9 10 11 12
Time (hours)
Influ
ent M
EK
C
once
ntra
tion
(ppm
v)
BF3
Figure 4.10: Influent MEK concentrations for BF1 (top), BF2 (middle), and BF3 (bottom) during Shock Load II.

63
050
100150200250300
0 1 2 3 4 5
Time (hours)
Eff
luen
t ME
K
Con
cent
ratio
n (p
pmv)
BF1
050
100150200250300
0 1 2 3 4
Time (hours)
Eff
luen
t ME
K
Con
cent
ratio
n (p
pmv)
020040060080010001200
CO
2 Pro
duct
ion
(ppm
v)
BF1 MEK BF1 CO2
5
050
100150200250300
0 1 2 3 4 5
Time (hour)
Eff
luen
t ME
K
Con
cent
ratio
n (p
pmv)
020040060080010001200
CO
2 Pro
duct
ion
(ppm
v)
BF1 MEKBF1 CO2
Figure 4.11: Effluent MEK and CO2 concentrations during Shock Load II on BF1 performed on Days 159 (top), 165 (middle), and 167 (bottom).

64
050
100150200250300
0 1 2 3 4
Time (hour)
Eff
luen
t ME
K
Con
cent
ratio
n (p
pmv)
020040060080010001200
CO
2 Pro
duct
ion
(ppm
v)
BF2 MEKBF2 CO2
050
100150200250300
0 1 2 3 4
Time (hour)
Eff
luen
t ME
K
Con
cent
ratio
n (p
pmv)
020040060080010001200
CO
2 Pro
duct
ion
(ppm
v)
BF2 MEKBF2 CO2
0
50
100
150
200
250
300
0 1 2 3 4
Time (hours)
Eff
luen
t ME
K
Con
cent
ratio
n (p
pmv)
BF2 - MEK
Figure 4.12: Effluent MEK and CO2 concentrations during Shock Load II on BF2 performed on Days 158 (top), 160 (middle), and 167 (bottom).
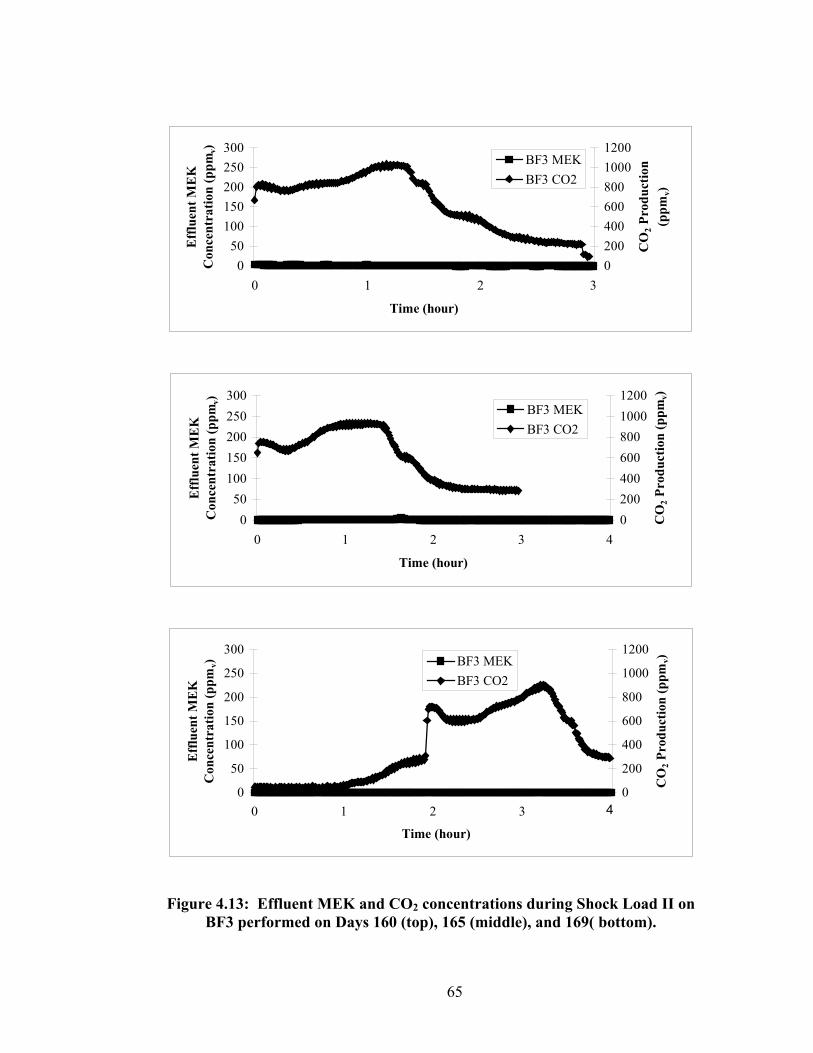
65
050
100150200250300
0 1 2 3
Time (hour)
Eff
luen
t ME
K
Con
cent
ratio
n (p
pmv)
020040060080010001200
CO
2 Pro
duct
ion
(ppm
v)
BF3 MEKBF3 CO2
050
100150200250300
0 1 2 3 4
Time (hour)
Eff
luen
t ME
K
Con
cent
ratio
n (p
pmv)
020040060080010001200
CO
2 Pro
duct
ion
(ppm
v)
BF3 MEKBF3 CO2
0
50
100
150
200
250
300
0 1 2 3
Time (hour)
Eff
luen
t ME
K
Con
cent
ratio
n (p
pmv)
0
200
400
600
800
1000
1200C
O2 P
rodu
ctio
n (p
pmv)BF3 MEK
BF3 CO2
4
Figure 4.13: Effluent MEK and CO2 concentrations during Shock Load II on BF3 performed on Days 160 (top), 165 (middle), and 169( bottom).
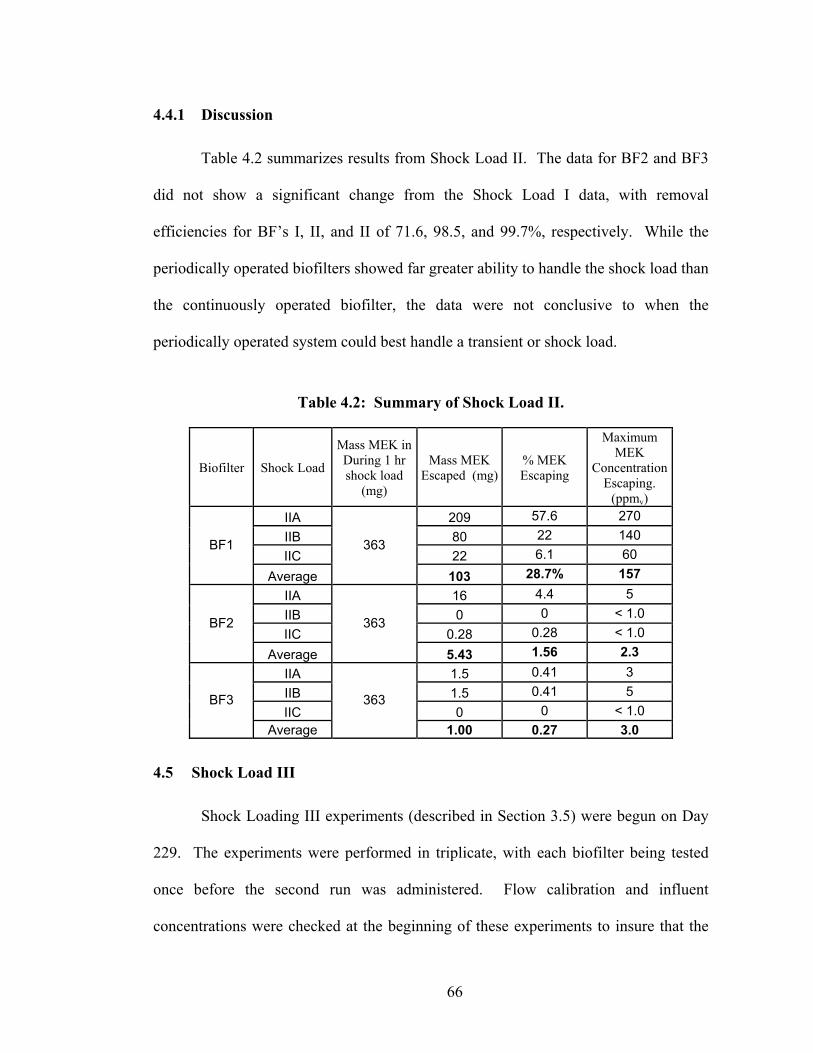
66
4.4.1 Discussion
Table 4.2 summarizes results from Shock Load II. The data for BF2 and BF3
did not show a significant change from the Shock Load I data, with removal
efficiencies for BF’s I, II, and II of 71.6, 98.5, and 99.7%, respectively. While the
periodically operated biofilters showed far greater ability to handle the shock load than
the continuously operated biofilter, the data were not conclusive to when the
periodically operated system could best handle a transient or shock load.
Table 4.2: Summary of Shock Load II.
Biofilter Shock Load
Mass MEK in During 1 hr shock load
(mg)
Mass MEK Escaped (mg)
% MEK Escaping
Maximum MEK
Concentration Escaping.
(ppmv) IIA 209 57.6 270 IIB 80 22 140 IIC 22 6.1 60
BF1
Average
363
103 28.7% 157 IIA 16 4.4 5 IIB 0 0 < 1.0 IIC 0.28 0.28 < 1.0
BF2
Average
363
5.43 1.56 2.3 IIA 1.5 0.41 3 IIB 1.5 0.41 5 IIC 0 0 < 1.0
BF3
Average
363
1.00 0.27 3.0
4.5 Shock Load III
Shock Loading III experiments (described in Section 3.5) were begun on Day
229. The experiments were performed in triplicate, with each biofilter being tested
once before the second run was administered. Flow calibration and influent
concentrations were checked at the beginning of these experiments to insure that the

67
desired shock load was achievable for each system. Influent concentrations were
periodically checked to make sure target influent MEK concentrations were achieved.
Influent MEK concentrations as a function of time for BF1, BF2, and BF3 during
Shock Load III are identical to Shock Load II (see Figure 4.10); however, with this
experiment, the biofilter EBRTs remained at there normal setting (i.e., 120, 40, and
20 seconds for BF1, BF2, and BF3, respectively).
Shock Load III experiments were conducted on BF1 on days 229, 231, and
233. Time zero in Figure 4.14, along with the subsequent graphs for Shock Load III,
designates the beginning of the shock load. On day 229 (18 days since nutrient
addition) MEK was detected in the effluent approximately 1.8 hrs after the influent
concentration was increased to 530 ppmv (see top graph of Figure 4.14). MEK was
detected in the effluent for approximately 1.0 hour, and reached a maximum
concentration of approximately 70 ppmv during this time period. A total of 25.5 mg of
MEK was measured in the effluent.
Data from the second shock load, conducted on Day 231 (20 days since
nutrient addition), is shown in the middle graph of Figure 4.14. MEK was detected in
the effluent approximately 1.6 hrs after the shock load was initiated. MEK was
detected in the effluent for approximately 1.0 hours, and reached a maximum
concentration during this time period of approximately 69 ppmv. A total of 30 mg of
MEK was measured in the effluent. Data from the third Shock Load III replicate on
Day 233 (22 days since nutrient addition) is presented in the bottom graph from Figure
4.14. MEK was detected in the effluent approximately 2.0 hrs after the shock load

68
was initiated. MEK was detected in the effluent for approximately 1.0 hour, and
reached a maximum concentration during this time period of approximately 66 ppmv.
A total of 25.3 mg of MEK was measured in the effluent.
Shock Load III experiments were conducted on BF2 on Days 229, 231, and
233. Effluent MEK data from Day 229 (18 days since nutrient addition) is depicted in
the top graph of Figure 4.15. Time zero in Figure 4.15, designates the beginning of
the shock load (i.e., last hour of FEED). As shown in the figure, MEK was detected
approximately 0.9 hours after the shock load was initiated, with breakthrough lasting
for approximately 1.8 hours. A maximum concentration of approximately 439 ppmv
was observed, resulting in a total mass of 755 mg of MEK in the effluent.
The middle graph in Figure 4.15 shows the data from Day 231 (20 days since
nutrient addition). MEK was detected approximately 0.85 hours after the shock load
was initiated. MEK was detected in the effluent from BF2 for approximately 1.8
hours, reaching a maximum concentration of approximately 475 ppmv. A total of 798
mg of MEK was detected in the effluent over this experiment. Data from Day 233 (22
days since nutrient addition) is presented in the bottom graph of Figure 4.15. MEK
was detected approximately 0.9 hours after the shock load was initiated. MEK was
detected in the effluent from BF2 for approximately 1.6 hours, reaching a maximum
concentration of approximately 440 ppmv. A total of 755 mg of MEK was detected in
the effluent over this experiment.
BF3 received Shock Load III on Days 230, 232, and 234. Effluent MEK data
from Day 230 (19 days since nutrient addition) is presented in the top graph of Figure
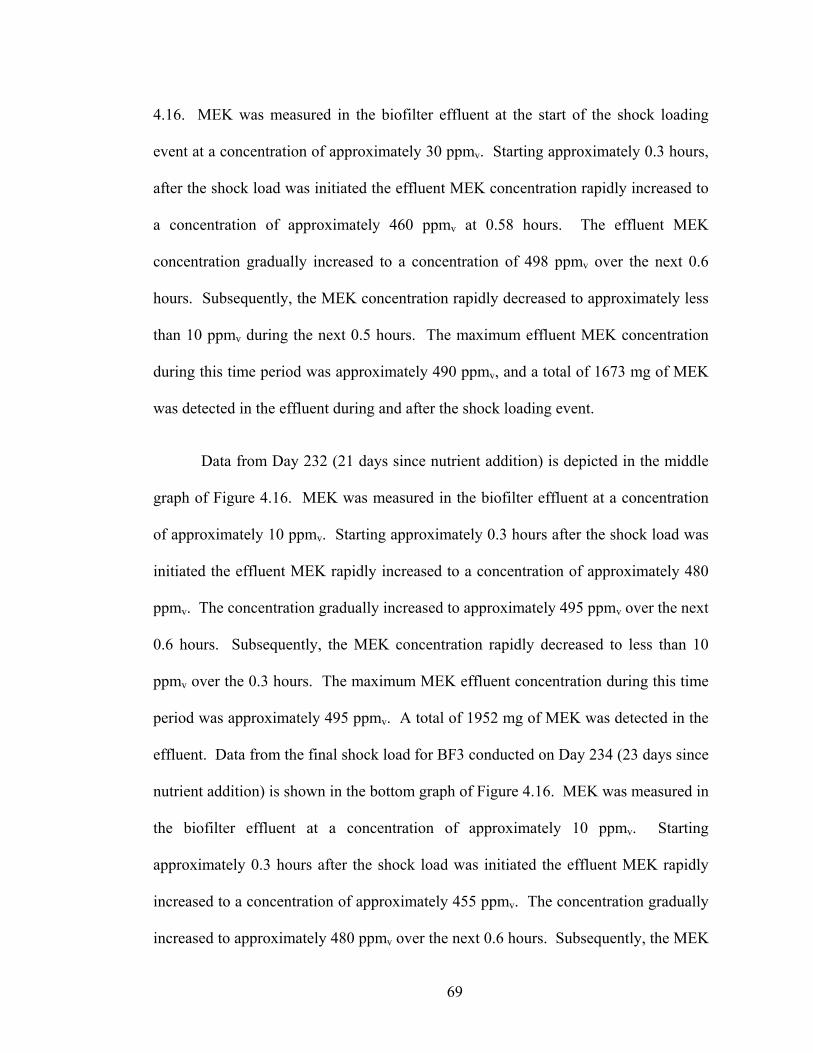
69
4.16. MEK was measured in the biofilter effluent at the start of the shock loading
event at a concentration of approximately 30 ppmv. Starting approximately 0.3 hours,
after the shock load was initiated the effluent MEK concentration rapidly increased to
a concentration of approximately 460 ppmv at 0.58 hours. The effluent MEK
concentration gradually increased to a concentration of 498 ppmv over the next 0.6
hours. Subsequently, the MEK concentration rapidly decreased to approximately less
than 10 ppmv during the next 0.5 hours. The maximum effluent MEK concentration
during this time period was approximately 490 ppmv, and a total of 1673 mg of MEK
was detected in the effluent during and after the shock loading event.
Data from Day 232 (21 days since nutrient addition) is depicted in the middle
graph of Figure 4.16. MEK was measured in the biofilter effluent at a concentration
of approximately 10 ppmv. Starting approximately 0.3 hours after the shock load was
initiated the effluent MEK rapidly increased to a concentration of approximately 480
ppmv. The concentration gradually increased to approximately 495 ppmv over the next
0.6 hours. Subsequently, the MEK concentration rapidly decreased to less than 10
ppmv over the 0.3 hours. The maximum MEK effluent concentration during this time
period was approximately 495 ppmv. A total of 1952 mg of MEK was detected in the
effluent. Data from the final shock load for BF3 conducted on Day 234 (23 days since
nutrient addition) is shown in the bottom graph of Figure 4.16. MEK was measured in
the biofilter effluent at a concentration of approximately 10 ppmv. Starting
approximately 0.3 hours after the shock load was initiated the effluent MEK rapidly
increased to a concentration of approximately 455 ppmv. The concentration gradually
increased to approximately 480 ppmv over the next 0.6 hours. Subsequently, the MEK
70
concentration rapidly decreased over the next 0.35 hours to approximately 20 ppmv
before gradually decreasing to less than 10 ppmv. The maximum MEK effluent
concentration during this time period was approximately 480 ppmv. A total of 1936
mg of MEK was detected in the effluent during this period.
Normal loading data from Days 214 and 228, (see Figures 4.17 and 4.18)
showed removal efficiencies of 86.98 and 87.67%, respectively. Both experiments
had breakthrough times of approximately 2.0 hours, and the total MEK masses during
these events were 205 and 198 mg, for Days 214 and 228. An analysis of the data
shows that over these two experiments the breakthrough masses were proportioned as
follows: during the first hour of feed 40 and 38 mg were present in the breakthrough
over the first hour, 133 and 121 mg over the second hour, and 32 and 39 mg of MEK
was present over the REACT time period monitored. Data from Day 214 showed an
MEK concentration of 2.3 ppmv detected in the effluent at 0.5 hours. The
concentration increased to a value of approximately 34 ppmv at 1.13 hour where it
remained until the 2.18 hour mark. The MEK concentration in the effluent then
decreased to 0 at 2.4 hours. Data from Day 228 had a MEK breakthrough
concentration of 3.1 ppmv at 0.52 hours. The concentration increased to a value of
approximately 30 ppmv at the 1.0 hour mark. The MEK effluent concentration
remained at approximately 20 ppmv until the 2.0 hour mark. The effluent MEK
concentration then dropped to 0 at 2.31 hours. Assuming the Shock Loading III data
for BF3 included normal loading MEK, and taking the mean mass from the REACT
periods of Days 214 and 228, 35.5 mg; the percent removal would be 16.5% instead of
14.9%, which is negligible.

71
0100200300400500600
0 1 2 3 4 5
Time (hours)
Eff
luen
t ME
K
Con
cent
ratio
n (p
pmv)
0100200300400500600
0 1 2 3 4 5
Time (hours)
Eff
luen
t ME
K
Con
cent
ratio
n (p
pmv)
0100200300400500600
0 1 2 3 4 5
Time (hours)
Eff
luen
t ME
K
Con
cent
ratio
n (p
pmv)
Figure 4.14: Effluent MEK concentrations for BF1 during Shock Load III performed on Days 229 (top), 231 (middle), and 233 (bottom).

72
0100200300400500600
0 1 2 3 4 5
Time (hours)
Eff
luen
t ME
K
Con
cetr
atio
n (p
pmv)
0100200300400500600
0 1 2 3 4 5
Time (hours)
Eff
luen
t ME
K
Con
cent
ratio
n (p
pmv)
0100200300400500600
0 1 2 3 4 5
Time (hours)
Eff
luen
t ME
K
Con
cetr
atio
n (p
pmv)
Figure 4.15: Effluent MEK concentrations for BF2 during Shock Load III performed on Days 229 (top), 231 (middle), and 233 (bottom).

73
0100200300400500600
0 1 2 3 4 5
Time (hours)
Eff
luen
t ME
K
Con
cent
ratio
n (p
pmv)
0100200300400500600
0 1 2 3 4 5
Time (hours)
Eff
luen
t ME
K
Con
cent
ratio
n (p
pmv)
0100200300400500600
0 1 2 3 4 5Time (hours)
Eff
luen
t ME
K
Con
cent
ratio
n (p
pmv)
Figure 4.16: Effluent MEK concentrations for BF3 during Shock Load III performed on Days 230 (top), 232 (middle), and 234 (bottom).
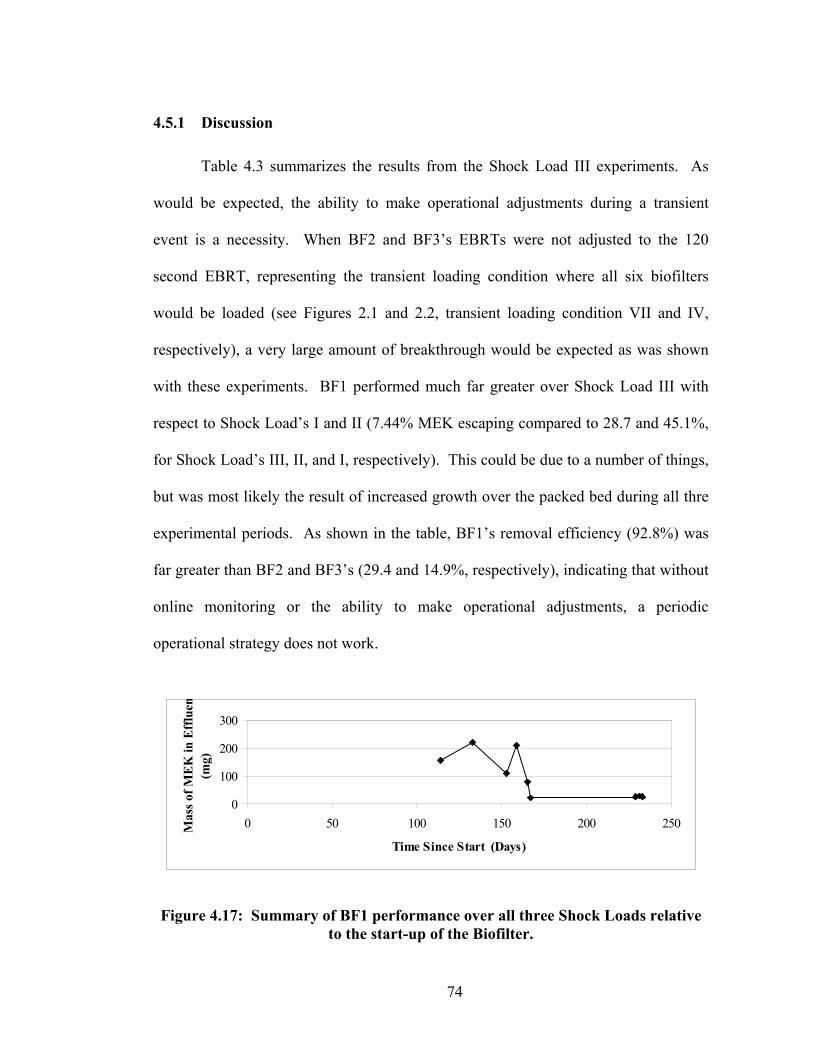
74
4.5.1 Discussion
Table 4.3 summarizes the results from the Shock Load III experiments. As
would be expected, the ability to make operational adjustments during a transient
event is a necessity. When BF2 and BF3’s EBRTs were not adjusted to the 120
second EBRT, representing the transient loading condition where all six biofilters
would be loaded (see Figures 2.1 and 2.2, transient loading condition VII and IV,
respectively), a very large amount of breakthrough would be expected as was shown
with these experiments. BF1 performed much far greater over Shock Load III with
respect to Shock Load’s I and II (7.44% MEK escaping compared to 28.7 and 45.1%,
for Shock Load’s III, II, and I, respectively). This could be due to a number of things,
but was most likely the result of increased growth over the packed bed during all thre
experimental periods. As shown in the table, BF1’s removal efficiency (92.8%) was
far greater than BF2 and BF3’s (29.4 and 14.9%, respectively), indicating that without
online monitoring or the ability to make operational adjustments, a periodic
operational strategy does not work.
0
100
200
300
0 50 100 150 200 250
Time Since Start (Days)
Mas
s of M
EK
in E
fflu
en(m
g)
Figure 4.17: Summary of BF1 performance over all three Shock Loads relative to the start-up of the Biofilter.

75
050
100150200250300
0 5 10 15 20 25 30 35 40
Time Since Nutrient Addition (days)
Mas
s of M
EK
in E
fflu
ent
(mg)
Figure 4.18: Summary of BF1 performance over all three Shock Loads relative to the time since nutrient addition.
Table 4.3: Summary of Shock Load III.
Biofilter Shock Load
Mass MEK in During 1 hr shock load
(mg)
Mass MEK in Efffluent (mg)
% MEK Escaping
Maximum MEK
Concentration Escaping.
(ppmv) IIIA 26 7.16 70 IIIB 30 8.26 69 IIIC 25 6.89 66 BF1
Average
363
26 7.44 68 IIIA 755 69.3 439 IIIB 798 73.3 475 IIIC 755 69.3 440 BF2
Average
1089
769 70.63 451 IIIA 1673 76.8 490 IIIB 1952 89.6 500 IIIC 1936 88.8 489
BF3
Average
2179
1853 85.1 493
76
CHAPTER 5 DISCUSSION AND CONCLUSIONS
5.1 Conclusions
Polyurethane foam manufactured in the laboratory for this study proved to
have low sorptive capacity for MEK. When the wet packing medium (65% moisture
content) was equilibrated with a humidified gas stream containing MEK at
concentrations of 106 or 530 ppmv, the mean mass of MEK sorbed to the wet medium
(absorbed in the liquid phase and adsorbed to the foam) was 37.1 and 115.1 g/m3,
respectively. Furthermore, essentially all of the initially sorbed MEK desorbed from
the medium when contaminant-free air was purged through it. This indicates that
MEK sorption to the foam medium is not expected to be an appreciable sink for MEK
in biofilters constructed using this medium. Martinez (2001), determined that
incorporation of powdered activated carbon (PAC) into the polyurethane foam greatly
increased the sorptive properties of the medium without changing the porosity and
other structural characteristics of the foam; however, that medium was not used in the
biofilter experiments described herein.
Following inoculation of the biofilters, the continuously operated biofilter
(BF1) removed approximately 96% of the MEK after just one day of operation and
approximately 99% after two days. This rapid increase in performance following
system start-up indicates that the inoculation procedure (using an enrichment culture
acclimated to the contaminant and nutrient medium) can provide rapid start-up of
polyurethane foam based biofilters. In contrast, start-up periods of considerable length
(several weeks) have been reported for biofilters using alternate media and inoculation
procedures. Although the periodically operated biofilters took somewhat longer to
reach such a high removal efficiency, the elimination capacity (overall biodegradation
rate) during the FEED period was comparable to that of the continuously operated
biofilter.
During the first 54 days of operation, treatment performance in the
continuously loaded biofilter (BF1) was quite stable with essentially 100%

77
contaminant removal (effluent MEK concentration below detection limit). Treatment
performance in the periodically operated biofilter loaded for one-third of its cycle
(BF2) exhibited removal efficiency with an average of approximately 88%. On the
other hand, treatment performance of the periodically operated biofilter loaded for
only one-sixth of it operating cycle (BF3) reached a maximum removal efficiency of
approximately 80% from Days 23 to Day 28 and subsequently declined to
approximately 25% on Day 54. Such diminished performance was not surprising
considering previous research indicating that nutrient limitations (particularly in the
case of nitrogen) can become kinetically limiting in a biofilter system at high loading
rates long before an overall stoichiometric limitation is observed (Moe and Irvine,
2001).
Once a regular nutrient addition strategy was employed (starting on Day 54),
the contaminant removal efficiency in the continuously operated biofilter (BF1) and
the periodically operated biofilter loaded for one-third of its cycle (BF2) exhibited
nearly identical treatment efficiency during normal loading periods with greater than
99% removal observed in each. Treatment performance in the periodically operated
biofilter loaded for only one-sixth of its operating cycle (BF3) exhibited unstable
performance for the duration of the normal loading, and only after 100 days did it
remain above 75%. The gradual increase in BF3 removal efficiency from Day 100 to
Day 180 suggests that the microbial populations may acclimate to the periodic loading
over time; however, because no attempt was made to characterize the microbial
population or its spatial distribution, such conclusions cannot be drawn from the
experimental results reported herein. The loading rate during the FEED period of BF3
was twice that of BF2 and six times that of BF1. The obviously superior treatment in
BF2 and BF1 (in comparison to BF3) during the normal loading experiments suggest
that the loading rate during the FEED period of BF3, which clearly exceeded the
biodegradation rate in the system (as evident from contaminant breakthrough), was too
high to ensure consistently high removal efficiency.

78
Because other loading rates were not examined in this study (e.g., FEED
period lasting only one-fourth or one-fifth of the cycle) it is not certain what the
maximum loading rate is during the FEED period which could be completely
removed. It is clear, however, from the results of BF2 experiments, that periodic
operation where the biofilter is loaded for only a portion of the cycle (but at a
proportionally higher rate so that the mass loading over a complete cycle is the same
as for a comparable continuous-flow system) can effectively remove MEK from a
contaminated gas stream in a stable manner over long time periods (more than 200
days).
Shock Loading I results demonstrated that the removal efficiencies in the
periodically operated biofilters (97.3% in BF2 and 99.5% in BF3, respectively) were
superior to the continuous-flow biofilter (54.8% in BF1 ). This is consistent with the
findings of Irvine and Moe (2001) who reported similar results when comparing the
performance of continuous-flow and periodically-operated biofilters treating a
toluene-contaminated gas stream. It thus appears that these results may be generalized
to other waste gas streams.
It should be noted that the mass loading rate to BF3 during a normal FEED
cycle was 62 g/m3/hr, whereas during the Shock Load I conditions, BF3 received an
MEK loading of 51.9 g/m3/hr. Therefore, BF3 actually received a lower mass load of
MEK during the shock load than during normal loading. It is not surprising, then, that
the system exhibited higher removal efficiency during the shock-loading condition
than it did during normal loading conditions.
Results from Shock Load II experiments also indicated superior performance
for the periodically operated biofilters in comparison to the continuously operated
biofilter, with removal efficiencies for BFI, BFII, and BFIII of 71.6, 98.5, and 99.7%,
respectively. While the periodically operated biofilters showed far greater ability to
handle the shock load than the continuously operated biofilter, the data was not
conclusive to during which portion of the FEED period (i.e., the start of the FEED
period in Shock Load I and the end of the FEED period in Shock Load II) the

79
periodically operated system could most effectively degrade MEK when subjected to a
transient period of elevated contaminant load.
Experimental results from the Shock Loading I and II studies described herein
demonstrate that controlled periodic operating strategies can enhance contaminant
removal of MEK during transient periods of elevated contaminant load. The
laboratory-scale biofilters subjected to periodic operation coupled with an active
control strategy exhibited substantially higher contaminant removal efficiency than did
the continuous flow system. There are several possible explanations for the better
performance of the periodically operated biofilters during the Shock Load I and II
conditions. First, the higher gas flow rates likely produced a more favorable spatial
distribution of the microbial population. Visual inspection of the biofilters revealed
that biomass (easily observed as a brown biofilm growing on the white packing
medium) was more evenly distributed along the height of the periodically operated
biofilter columns. Second, the microbes selected and enriched for in the periodically
operated systems may have been different. Third, the physiological state of the
microbes present in the periodically operated systems may have been different. A
substantial body of previous research on sequencing batch reactors and other periodic
processes used for wastewater treatment indicates that periodic loading strategies can
markedly affect selection and enrichment and physiological state in a manner that
produces microbes with higher specific substrate uptake rates under dynamically
loaded conditions (see for example Chiesa and Irvine, 1983; and Wilderer et al.,
2001). Additionally, results reported by Moe and Irvine (2001) indicate that
microorganisms selected in periodically operated gas-phase biofilters may have higher
RNA content than microbes in continuous-flow systems. Microorganisms with higher
RNA content are likely able to more quickly respond to transient periods of elevated
loading (Daigger and Grady, 1982).
Shock Loading III results indicated a very key factor in the success of the
periodic operation strategy. When the EBRTs of BF2 and BF3 were not adjusted to
the 120 second EBRT, representing the transient loading condition where all biofilters
80
constructed in parallel would be loaded simultaneously (see Figures 2.1 and 2.2,
transient loading condition VII and IV, respectively), a large amount of MEK
breakthrough occurred. As shown in Table 4.3, the removal efficiency in BF1
(92.8%) was far greater than BF2 and BF3’s (29.4 and 14.9%, respectively). This
indicates that without operational adjustments during transient loading events, periodic
operating strategies can result in substantially diminished treatment performance.
Thus, there is a clear need for adequate control systems if such an operating strategy is
adopted.
Direct comparison of results reported herein to those values found in the
literature (see Table 2.1) were difficult to make due to varying treatment systems and
experimental parameters. Agathos et al. (1997) and Chou and Huang (1997) use of a
tubular biofilm reactor and a biotrickling filter, respectively, made any direct
comparison of experimental results difficult. Results reported by Amanullah et al
(2000) dealt mostly with equilibrium and kinetic studies on MEK adsorption in
compost and granular activated carbon. Data reported from Farmer (1994) was only
from conditions he used to establish steady state, where the biofilters were operated
with a continuous flow strategy, making a comparison of the data of little benefit.
Although Deshusses et al. (1995) used a similar treatment system, the use of a second
compound and constantly changing operational conditions allowed for little
confidence in a direct comparison of the reported results.
Experimental results from laboratory studies reported herein demonstrated that
periodically operated biofilters are able to treat MEK contaminated gas streams during
both normal and shock loading. Particularly, a biofilter operated with a 40 second
EBRT (i.e., BF2, see Figure 2.2) had removal efficiencies equal to that of a
continuously operated biofilter during normal loading and superior removal
efficiencies during shock loading events.
A start-up period allowing the biofilters to be operated using a longer EBRT
(e.g., 120 seconds) for a period of time (e.g, two weeks), might eliminate the sporadic
treatment performance of BF3 during start-up. A more regulated nutrient addition

81
would likely have aided in the performance as shown in Figure 4.3, where removal
efficiency greatly increased after nutrient addition.
This is not to say that a 40 second EBRT would give the highest removal
efficiency. Results presented herein would lead one to conclude that an EBRT of 30
seconds might be the best periodic operation strategy. Cycle lengths could be changed
and experimented with which could result in longer or shorter FEED and REACT
periods, and ultimately better treatment performance. More sorptive packing would
most likely have a large impact on both removal efficiency and operating strategies.

82
BIBLIOGRAPHY
Agathos, S.N.; Hellin, E.; Ali-Khodja, H.; Deseveaux, S.; Vandermesse, F.; & Naveau, H. (1997). Gas-Phase Methyl Ethyl Ketone Biodegradation in a Tubular Biofilm Reactor: Microbiological and Bioprocess aspects. Biodegradation, 8, 251-264.
Amanullah, Md., Viswanathan, S., and Farooq, S. (2000). Equilibrium, Kinetics, and Column Dynamics of Methyl Ethyl Ketone Biodegradation. Industrial and Engineering Chemistry Research. 39 (3), 3387 – 3396.
American Public Health Assocoation (1998). Standard Methods for the Examination of Water and Water, 20th ed., APHA Washington DC.
Bezborodov, A.M.; Rogozhin, I.S.; Ushakova; N.A.; Zhukov, V.G.; Kurlovich, A.E.; and Popov, V.O. (1998) Interaction of Pseudomonas oleovarans and Nocardia rugosa in a Model System for Air Purification from a Toluene-Methyl Ethyl Ketone Mixture. Applied Biochemistry and Microbiology, 34(5):466-468.
Bielefeldt, A.R. and Stensel, H.D. (1999). Treating VOC-Contaminated Gases in Activated Sludge: Mechanistic Model to Evaluate Design and Performance. Environmental Science and Technology 33, 3234 – 3240.
Brauer, H. (1986) Biological Purification of Waste Gases. International Chemical Engineering. 26(3). July 1986. 387 – 395.
Britton, L.N. (1984). Microbial Degradation of Aliphatic Hydrocarbons. Microbial Degradation of Organic Compounds. Volume 13 Microbiology Series. Edited by David T. Gibson. Marcel Dekker, Inc. New York and Basel. 1984.
Brownell, F.W. (1998). Clean Air Handbook, 3rd Edition. Government Institutes Inc., Rockville, MD.
Chiesa S.C., Irvine R.L. and Manning J.F. Jr., Feast/famine growth environments and activated sludge population selection. Biotechnology and Bioengineering, 27, 562-569 (1985).
83
Chou, M. and Huang, J. (1997). Treatment of Methyl Ethyl Ketone in Air Stream by Biotrickling Filters. Journal of Environmental Engineering. June 1997.
Daigger, G.T., and Grady, C.P.L. Jr. (1982) An Assessment of the Role of Physiological Adaptation in the Transient Response of Bacterial Cultures, Biotechnology and Bioengineering, 24, 1427-1444
Deshusses, Marc A. (1994). Biodegradation of Mixtures of Methyl Ethyl Ketone Vapors in Biofilters for the Treatment of Waste Air. Ph.D. Dissertation, Swiss Federal Institute of Technology, Zurich, 1994.
Deshusses, M.A. (1997). Transient Behavior of Biofilters: Start-Up, Carbon Balances, and Interaction Between Pollutants. Journal of Environmental Engineering. June 1997.
Deshusses, M.A. & Johnson, Camdon T. (2000). Development and Validation of A Simple Protocol to Rapidly Determine the Performance of Biofilters for VOC Treatment. Environmental Science and Technology. 34; 461-467.
Deshusses, M. A.; Hamer, G.; and Dunn, I. J. (1995). Behavior of Biofilters for Waste Air Biotreatment. 1. Dynamic Model Development. Environmental Science and Technology. 29(4), 1048-1058.
Deshusses, M. A.; Hamer, G.; and Dunn, I. J. (1995). Behavior of Biofilters for Waste Air Biotreatment. 2. Experimental Evaluation of a Dynamic Model. Environmental Science and Technology. 29(4), 1059-1068.
Deshusses, M.A. and Hamer, G. (1992). Methyl Isobutyl and Methyl Ethyl Ketone Biodegradation in Biofilters. In: Biocatalysts in Non-Conventional Media. Edited by J Tamper et al., Elsevier Science Publishers B. V.
Deshusses, M.A.; and Hamer, G. (1993). The Removal of Volatile Ketone Mixtures from Air in Biofilters. Bioprocess Engineering. 9 141-146.
Devinny, Joseph S.; Deshusses, Marc A.; Webster, Todd S. (1999). Biofiltration for Air Pollution Control. Lewis Publishers.
84
Dharmavaram, S.; Casey, J.; Van Lith, C. (1993). Experimental Evaluation of a Biofiltration Unit for Removal of Acetone. Air and Waste Management Association. Presentation at the 86th Annual Meeting and Exhibition. June 13-18, 1993.
Dolfing, J.; van den Wijngaard, A.J.; Janssen, D.B. (1993). Microbiological Aspects of the Removal of Chlorinated Hydrocarbons from Air. Biodegradtion 4: 261-282.
Ergas, S.; Schroeder, E.D.; Chang,D.P.; and Scow, K.M. (1994). Spatial distribution of microbial populations in biofilters, 94-RP115B01, Proc. of the 87th Annual Meeting of the Air & Waste Management Association, Cincinnati, OH.
Farmer, R.W.(1994). Biofiltration: Process Variables and Optimization Studies. M.S. Thesis, University of Minnesota. December 1994.
Finn, Larry; Spencer, Robert. (1997). Managing Biofilters for Consistent Odor and VOC Treatment. Biocycle. January, 01, 1997.
Groenestijn, Johan W. van; Hesselink, Paul G.M. (1993). Biotechniques for Air Pollution Control. Biodegradation 4: 283-301.
Irvine, R.L. and Moe, W.M. (2001) Periodic Operation for Enhanced Performance During Unsteady-State Loading Conditions. Water Science and Technology, 43(3), 231-239.
Kazenski, S.L. (2000). Biofiltration for Paint Spray Booth Applications. M.S. Thesis, University of Texas at Austin. May 2000.
Kazenski, S.L. and Kinney, K.A. (2000) Biofiltration of Paint Spray Booth Emissions: Packing Media Considerations and VOC Interactions. Proc. 2000 Annual Meeting and Exposition of the Air & Waste Management Association, Salt Lake City, UT.
Kirchner, K.; Schlachter, U.; Rehm, H.J. (1989). Biological Purification of Exhaust Air Using Fixed Bacterial Monocultures. Applied Microbiology and Biotechnology, 31:629-632.

85
Kirchner, K.; Wagner, S.; Rehm, H.J.(1992) Exhaust Gas Purification using Biocatalysts (fixed bacteria monocultures)-The Influence of Biofilm Diffusion Rate (O2) on the Overall Reaction Rate. Applied Microbiology and Biotechnology 37:277-279.
Kirchner, K.; Wagner, S.; Rehm, H.J. (1994). Biological Purification of Waste Gases by Means of Immobilized Bacteria (Monocultures). Air and Waste Management Association. For presentation at the 87th Annual Meeting and Exhibition. June 1994 19-24.
Kopchynski, D M.; Farmer, R W.; Maier, W.J. Factors Affecting the process Performance of Biofiltration. Paper Submitted for Publication in the Proceedings of the 50th Annual Purdue University Industrial Waste Conference.
Leson, G.; Winer, A.M. (1991) Biofiltration: An Innovative Air Polution Control Technology for VOC Emissions. J. Air and Waste Management Association. 41(8), 1045-1054.
Lukins, H.B. and Foster, J.W. (1963). Methyl Ethyl Ketone Metabolism in Hydrocarbon-Utilizing Mycobacteria. Journal of Bacteriology, 85.
Mahmoud, T.A.; Davis, W.B. (1970). The Effect of Salinity on the Removal of Some Aliphatic Ketones. Sea Grant Publication. July 1970.
Martinez, F. A. (2001). Polyurethane Foam Based Packing Media for Biofilters Removing Volatile Organic Compounds Freom Contaminated Air. M.S. Thesis. Louisiana State University. 2001.
Moe, W.M. and Irvine, R.L., (2001). Effect of Nitrogen Limitation on Performance of Toluene Degrading Biofilters, Water Research, 35(6), 1407-1414.
Moe, W.M. and Irvine, R.L. (2000). Polyurethane Foam Medium for Biofiltration. I: Characterization. ASCE Journal of Environmental Engineering, 126(9), 815-824.
Moe, W.M. and Irvine, R.L. (2000). Polyurethane Foam Medium for Biofiltration. II: Operation and Performance. ASCE Journal of Environmental Engineering, 126(9) 826-832.

86
Moe, W.M. and Irvine, R.L. (2000). Performance of Periodically-Operated Gas-Phase Biofilters During Transient Loading Conditions. Water Science and Technology, 41(4-5), 441-444.
Moe, W.M. and Irvine, R.L. Application of Periodic Processes to the Biofiltration of Toluene Vapor, Air Pollution VI, Eds. Brebbia, C.A., Ratto, C.F., and Power, H., WIT Press, Computational Mechanics Publications, Southampton, UK, 267-276.
Moe, W.M. and Irvine, R.L. (2001) Intracellular Dynamics of Ribonucleic Acid (RNA) and Protein in Microorganisms from Periodically Operated Biofilters, Water Science and Technology, 43(3), 241-248.
Ottengraph, S.P.P. (1987) Biological Systems for Waste Gas Purification. Trends in Biotechnology (vol 5) May 1987.
Ottengraf, S.P.P.; Konings, J.H.G. (1991) Emission of Microorganisms from Biofilters. Bioprocess Engineering 7: 89-86.
Ottengraph, Simon P.P. (1986). Biological Elimination of Volatile Xenobiotic Compounds in Biofilters. Bioprocess Engineering, 1: 61-69.
Song, JiHyeon and Kinney, Kerry A. (2000). Effect of Vapor-Phase Bioreactor Operation on Biomass Accumulation, Distribution, and Activity: Linking Biofilm Properties to Bioreactor Performance. Biotechnology and Bioengineering, 68(5). 2000.
Strauss, Johannes M.; du Pleiss, Chris A.; Riedel, Karl-Heinz J. (2000). Empirical Model for Biofiltration of Toluene. Journal of Environmental Engineering, 7, pp. 644-648.
Togna, A. Paul; Singh, Manjari. (1994). Biological Vapor-Phase Treatment Using Biofilter and Biotrickling Filter Reactors: Practical Operating Regimes. Environmental Progress Vol. 13, no. 2. May 1994.
US EPA (2001). 1999 Toxic Release Inventory (TRI) Public Data Release Report, EPA 260-R-01-001, Washington D.C.
87
Visscher, K and Brinkman, J.(1989). Biological Degradation of Xenobiotics in Waste Management. Hazardous Waste and Hazardous Materials. 6(2) 1989.
Weber, F.J. and Hartmans, S. (1995). Use of activated carbon as a buffer in biofiltration of waste gases with fluctuating concentrations of toluene. Applied Microbiology and Biotechnology, 43, pp. 365 – 369.
Wilderer P.A., Irvine R.L. and Goronszy M.C., Sequencing Batch Reactor Technology. IWA Scientific and Technical Report No. 10, IWA Publishing, London (2001).
88
VITA Will Norman is from Vicksburg, Mississippi. He received his Bachelor of
Science degree in Microbiology from Louisiana State University in December 1997.
After graduation he worked at Waterways Experiment Station in Vicksburg, Mississippi,
before enrolling into the Engineering Science graduate program at Louisiana State
University in August of 1999.