the effect of oil-and-gas well drilling fluids on shallow
TRANSCRIPT

University of North DakotaUND Scholarly Commons
Theses and Dissertations Theses, Dissertations, and Senior Projects
1983
The effect of oil-and-gas well drilling fluids onshallow groundwater in western North DakotaEdward C. MurphyUniversity of North Dakota
Follow this and additional works at: https://commons.und.edu/theses
Part of the Geology Commons
This Thesis is brought to you for free and open access by the Theses, Dissertations, and Senior Projects at UND Scholarly Commons. It has beenaccepted for inclusion in Theses and Dissertations by an authorized administrator of UND Scholarly Commons. For more information, please [email protected].
Recommended CitationMurphy, Edward C., "The effect of oil-and-gas well drilling fluids on shallow groundwater in western North Dakota" (1983). Theses andDissertations. 206.https://commons.und.edu/theses/206
-
I
I I
THE EFFECT OF OIL-AND-GAS WELL DRILLING
FLUIDS ON SHALLOW GROUNDWATER IN
WESTERN NORTH DAKOTA
by Edward c. Murphy
Bachelor of Science in Geology, University of North Dakota, 1979
A Thesis
Submitted to the Graduate Faculty
of the
University of North Dakota
in partial fulfillment of the requirements
for the degree of
Master of Science
Grand Forks, North Dakota
May 1983

This thesis submitted by Edward C, Murphy 1n partial fulfill.m,:nt of the requirements for the Degree of Master of Science from the University of North Dakota is hereby approved by the Faculty Advisory Committee under whom the work has been done.
This thesis meets the standards for appearance and conforms ta the style and format requirements of the Graduate School of the University of North Dakota, and is hereby approved.
Dean of the Graduate Schaal
ii

I I \
Permission
Title The Effect of Oil-and-Gas Well Drilling Fluids on
Shallow Groundwater in Western North Dakota
Degree Master of Science
In presenting this thesis in partial fulfillment of the requirements for a graduate degree from the University of North Dakota, I agree that the Library of this University shall make it freely available for inspection. I further agree that permission for extensive copying for scholarly purposes may be granted by the professor who supervised my thesis work or, in his absence, by the Chairman of the Department or the Dean of the Graduate School. It is understood that any copying or publication or other use of this thesis or part thereof for financial gain shall not be allowed without my written permission. It is also understood that due recognition shall be given to me and to the University of North Dakota in any scholarly use which may be made of any material in my thesis,
Signature ~ (,~
Date b:)~ )IJ 1953
iii
ACKNOWLEDGEMENTS.
LIST OF TABLES. •
LIST OF ILLUSTRATIONS
ABSTRACT •••
INTRODUCTION •
TABLE OF CONTENTS
History of Oil-and-Gas Drilling Oil-and-Gas Drilling in North Dakota Reserve Pit Reclamation Drilling Fluid Chemistry Project Inception Purpose of Study Location and History of Study Sites Climate
PREVIOUS WORK
METHOD OF INVESTIGATION
Reconnaissance Study Field Methods Laboratory Work
•
OVERVIEW OF GEOLOGY AND GEOHYDROLOGY IN WESTERN N. DAK.
Regional Geology and Geohydrology Clays in Western North Dakota Groundwater Recharge Hydraulic Conductivity
. .
Chemical Evolution of Groundwater in Western N, Dak.
GEOLOGY AND GEOHYDROLOGY OF STUDY SITES
Texaco Charlson Cl33 Well Site Texaco Gov't. NCT Well Site Belco Petroleum Sheep Ck, #1-11 Well Site Apache (Federal #1-5) Well Site
RESULTS •• . .. . . . ~ . .. . " .. .. .. . .. .. .. .. . .
iv
xv
xiii·
vii
xvii
1
36
38
49
59
74

Precipitation at Sites During the Study Period Groundwater Recharge at Sites During Study Period Textural Analyses Hydraulic Conductivity Water Analyses from the Unsaturated Zone Elutriation Experiment Water Analyses from the Saturated Zone Apparent Resistivity Chemical Composition of Drilling Fluid at Study Sites Sources of Error in Study
DISCUSSION. • • • . • .. • . .. . .. • 107
Attenuation and Dispersion of Leachate Leachate Migration at the Texaco Gov't. NCT Well Site Leachate Migration at the Belco Petroleum Sheep
C.k. 1-11 Well Site Leachate Migration at the Apache Federal 1-5
Well Site Leachate Migration at the Texaco Charlson Cl33
Well Site Apparent Resistivity Interpreted Resistivity Variables in Earth Resistivity Surveying Effect of .Pit Reclamation on Precipitation Infiltration Health Effects of Drilling Fluid Leachate
CONCLUSIONS. • 143
RECOMMENDATIONS 145
Pit Reclamation Further Study
APPENDICES •••• • • • • • • 152
Appendix A. Rules and regulations for reserve pit reclamation •••
Appendix B. Lithologic description of drill holes
Appendix C. Textural analyses
Appendix D. Water analyses ••
Appendix E. Isoconcentration maps of selected parameters fran within the saturated zones at the Apache Federal #1-5 and Texaco Charlson
153
155
163
170
Cl33 sites. .. . .. . . . . . . .. .. .. . . .. . . 204
V

Appendix Ji'.
Appendix G.
REFERENCES CITED
Apparent and interpreted resistivity profiles for the Apache Federal #1-S and Texaco Charlson Cl33 sites ••••••••
Drilling fluid additives used at the Belco Petroleum B.N. Sheep Ck. Hl-11 and Apache Federal #1-S sites
. . . . . . .. . " . " "
vi
, 217
234
238
LIST OF ILLUSTRATIONS
Figure
l. The Amerada Clarence Iverson No. 1 •• . . . 7
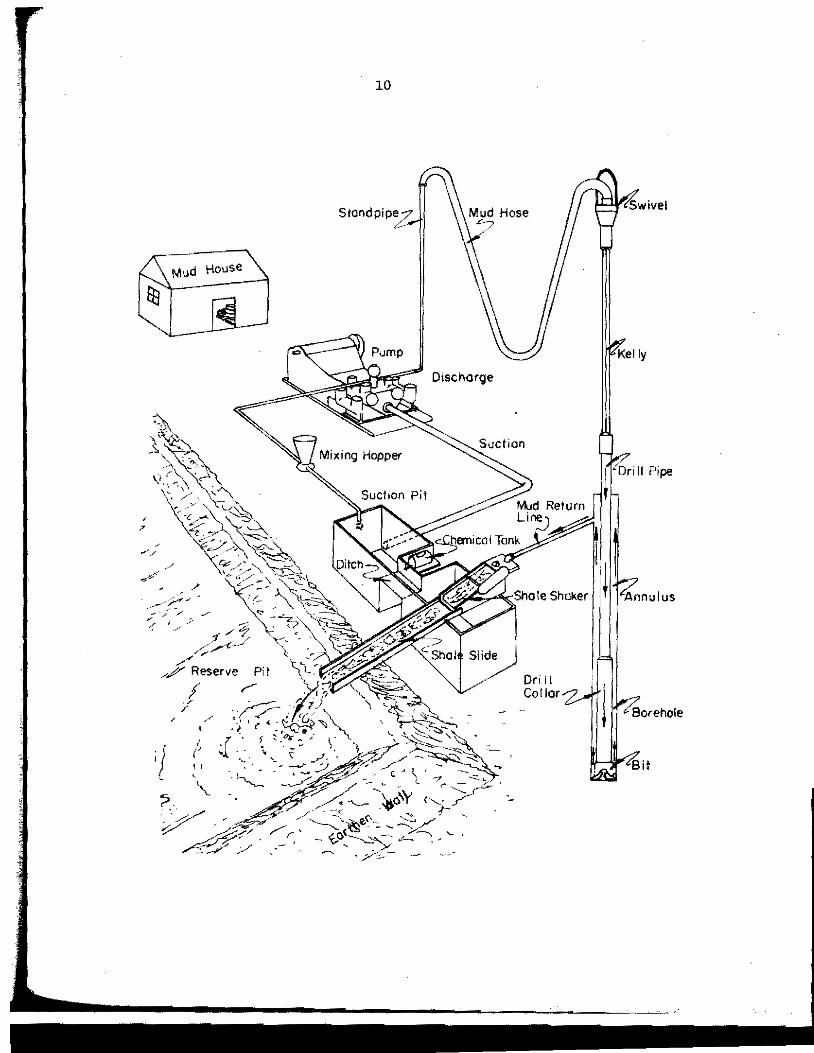
2, Closed-system circulation of drilling fluid 10
3. Polyethylene reserve pit in western North Dakota. 12
4. Reclamation of a reserve pit by trenching in Billings County, North Dakota. • ••• 12
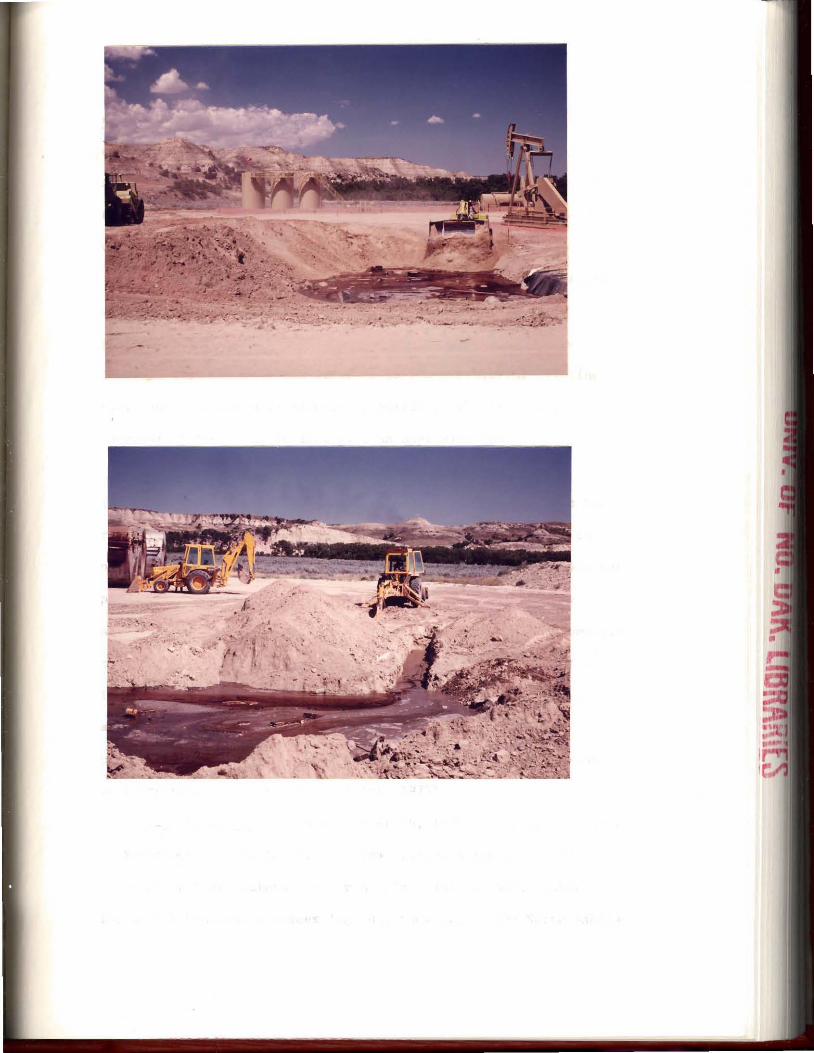
5. Reserve pit reclamation at the Apache Corp. Federal #1-5 re-entry . . . . . . . .
6. Reserve pit reclamation at the Apaclle Corp. Federal #1-5 re-entry .
7. Oil fields in North Dakota.
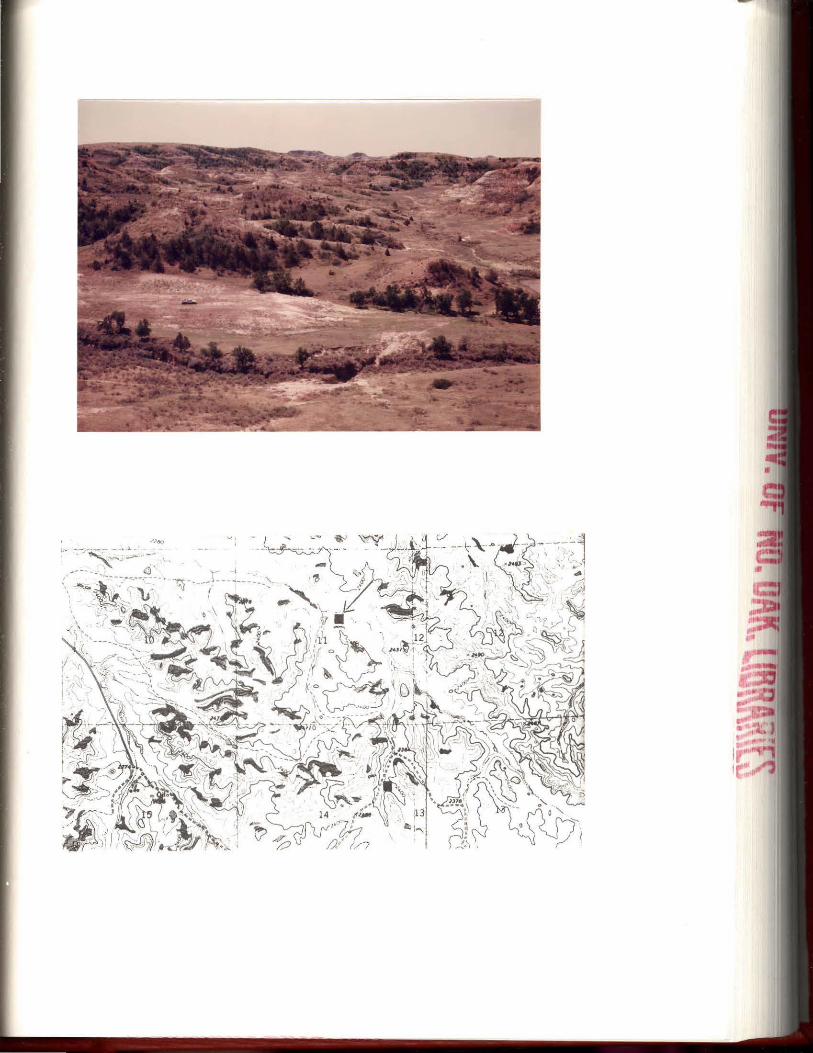
8. Location of the four study sites.
9. The Texaco Charlson Madison North Unit C133 study site. . • .. • .. . ••••
10. Topographic map of Texaco Charlson Madison
. . . . .
.. .. . . .
15
15
19
22
25
North Unit Cl33 site. • • • • • • • • • • • 25
11. The Texaco Inc. Government "A" (NCT-1) study site 28
12. Topographic map of Texaco Government "A" (NCT-1) site.. . .. . . . .. .. .. .. . .. . .. . 28
13. The Belco Petroleum B.N. Sheep Ck. #1-11 study site. • . • • . • • • • • • • 30
14. Topographic map of Belco Petroleum B,N, Sheep Ck. #1-11 site. • • • • • . • • . 30
15. The Apache Corp. Federal #1-5 study site. 32
16. Topographic map of Apache Corp. Federal fll-5 site 32
17. The Cardinal Rig #7 drilling the Apache Federal $1-5 re-entry ................. _ ,. . . . . 34
vii

Figure
18. The reserve pit at the Apache Federal #1-5 upon completion of drilling ••• , • • • • • • • • 34
19, A profile of a soil water sampler (lysimeter) and piezometer as used in this study. • • • • 41
20. Electrical earth resistivity survey equipment at resistivity station 18 at the Apache Federal !Jl-5 site . .. . . . . . .. . . . . . . .. .. . .. 46
21. Configuration of the four-electrode array used in the electrical resistivity survey. • • • • • • • 46
22. A hydrogeochemical model for the chemical evolutiou of groundwater in western North·Dakota. 57
23. Map view of the Texaco Charlson Madison North Unit C133 study site. • • • • • , • • • • 61
24. Geologic cross-section of the Texaco Charlson North Unit C133 site. • • • • • , 61
25. Correlat.ion of the Lake Sakakawea water level and the groundwater table elevations at the Texaco Charlson Madison North Un.it C133 site
26. Map view of the Texaco Government "A" (NCT-1)
64
study site . . . . .. . . . . . .. . . . .. . . 66
27. Geologic cross-section of the Texaco Government "A" (NCT-1) site. • , • • • • • . • • . 66
28. Map view of the Belco Petroleum B.N. Sheep Ck. 111-11 study site. • • • • 69
29. Geologic cross-section of the Belco Petroleum B. N. #1-11 site • • • • • • • , 69
30. Map view of the Apache Federal #1-5 study site. 72
31. Geologic cross-section of the Apache Federal #1-5 site. . . .. . . . . . . . . . 72
32. Annual and monthly precipitation totals from the Trotters 3se and Keene gauging stations 76
33. Water table levels and monthly precipitation totals for the Apache Federal #1-5 site • • • 79
viii

Figure
34. Water table levels and monthly precipitation totals for the Texaco Charlson Madison North Unit Cl33 site. . . .. . . . . . . .. . . . . . . . . . . .
35. Ranges and meana of hydraulic conductivities at
79
the Apache Federal /11-5 site ••••••••••• , 83
36. Ranges and means of hydraulic conductivities at the Texaco Charlson Madison North Unit Cl33 site. 83
37. Concentration profiles for various parameters in pore water within the unsaturated zone at the Texaco Gov't. "A" (NCT-1) site. • • • • • • • 85
38. Concentration profiles for various parameters in pore water within the unsaturated zone at the Belco Petroleum B.N. Sheep Ck. #1-11 site • • 88
39. Concentration profiles for various parameters in elutriated water samples from the Apache Federal #1-5 site . .. . . . . . . . . . . . . . . . . . . 91
40. Concentration profiles for various parameters in elutriated water samples from the Texaco Gov't. "A" (NCT-1) site. • • • • • • • • • • • • • 91
41. Apparent resistivity stations and maps for electrode spacings of 12 the Apache Federal 111-5 site •••
isoresitivity and 30 feet for . . . ~ . . . .
42. Apparent isoresistivity maps for electrode spacings of 40, 60, and 80 feet at the Apache Federal
96
111-5 site .. • . . .. • . . . .. . . . . . . . . . . 98
43. Apparent resistivity stations and isoresistivity maps for electrode spacings of 12 and 30 feet for the Texaco Charlson Madison North Unit Cl33 site. • 100
44. Apparent isoresistivity maps for electrode spacings of 40, 60 and 80 feet at the Texaco Charlson Madison North Unit Cl33 site. • • • ••••••• 102
45 •. Profiles of leachate migration at the Apache Federal #1-5 and Texaco Charlson Madison North Unit Cl33 sites • • • • • • • • • • • • ••• 117
46. Apparent isoresistivity maps for the Apache Federal #1-5 site • • • • • • • • • • • • • • • • 119
ix

Figure
47. Apparent isoresistivity maps for the Texaco Charlson Madison North Unit Cl33. , • • • • • • • • 122
48. A profile of interpreted resistivity values at the Apache Federal #1-5 site • • • • • • . • • • • • • • 125
49. A profile of interpreted resistivity values at the Texaco Charlson Madison North Unit Cl33 site. 125
50a·. Cross-section of an active drilling fluid pit .. 129
50b. A drilling fluid pit upon completion of trenching operation and prior to back filling. • • • • • • 129
50c. A drilling fluid pit upon completion of reclamation 129
50d. The results of drilling fluid desiccation and fill subsidence within the pit and trenches. • • • 129
51. Collapsed trench surface at the Apache Federal
52.
#1-5 site • • • • • • • • • • • • • • • • • • 132
Desiccation and settling surface of the reclaimed Federal #1-5 site ••••
cracks developed on the reserve pit at the Apache . . . . . . . . . . . . .. •• 132
53. Stability-field diagram for trivalent and hexavalent chromium compounds in water at 25°c and one atmosphere. 135
54.
55.
56.
57.
58.
59.
60.
Approximate limit of groundwater Recommended Concentration Limits at the Apache Federal #1-5 site.
which exceed the for c1- and Fe
Approximate limit of groundwater which exceeds the Recommended Concentration Limit and Maximum Concentration Limit at the Texaco Charlson Madison North Unit Cl33 site • • • • • • • • , • •
The reserve pit at the Apache Federal #1-5 site.
A reserve pit in northern Billings County,
An alternative method of reserve pit reclamation
Isoconcentration maps for TDS, pH, %Na, and SAR at the Apache Federaion #1-5 site ••••• , •
Isoconcentration maps for total hardness, total alkalinity, bicarbonate, and sulfate at the Apache Federal #1-5 site •••.• . . . . . . . . . . .
X
• • • 140
140
147
147
150
, • • 205
• • • 206

Figure
61. Isoconcentration maps for calcium, chloride, sodium, and fluoride at the Apache Federaion #1-5 site. 207
62. Isoconcentration maps for iron, manganese, and potassium at the #1-5 site ••••••
magnesit.m1, Apache Federal . . . . .. . .. .. 208
63. Isoconcentration maps for arsenic, barium, cadmium, and chromilDll at the Apache Federatl #1-5 site. • • • 209
64. Isoconcentration maps for copper, lead, zinc, and temperature at the Apache Federal #1-5 site 210
65. Isoconcentration maps for TDS, pH, %Na, and SAR at the Texaco Charlson Cl33 site. . • • • ••• 211
66. Isoconcentration maps for total hardness, total alkalinity, nitrate, and sulfate at the Texaco Charlson Cl33 site. . • •••••••••• . . . 212
67. Isoconcentration maps for calcium, chloride, sodium, and fluoride at the Texaco Charlson Cl33 site. • • • 213
68. Isoconcentration maps for iron, magnesium, manganese, and potassium at the Texaco Charlson Cl33 site. , , • 214
69. Isoconcentration maps for arsenic, barium, cadmium, and chromium at the Texaco Charlson Cl33 site • • • • 215
70. Isoconcentration maps for copper, lead, selenium, and zinc at the Texaco Charlson Cl33 site • • • • • 216
71. Apparent and interpreted resistivity profiles for sts. 1-4 at the Apache Federal #1-5 site. . . . . . 219
72. Apparent and incerpreted resistivity profiles for sts .. 5-8 at the Apache Federal #1-5 site. . . . . . 220
73. Apparent and interpreted resistivity profiles for sts. 9-12 at the Apache Federal #1-5 site. . . . . 221
74. Apparent and interpreted resistivity profiles for sts. 13-16 at the Apache Federal Ul-5 site. . . . . 222
75. Apparent and interpreted resistivity profiles for sts. 17-20 at the Apache Federal #1-5 site. , 223
xi
Figure
76. Apparent and interpreted resistivity profiles for sts. 21-2.4 at the Apache Federal 111-5 site. • • . • 224
77. Apparent and interpreted resistivity profile for st. 25 at the Apache Federal /11-5 site • • • • • . 225
78. Apparent and interpreted resistivity profiles for sts. 1-.4 at the Texaco Charlson Cl33 site •••••••.•• 226
79. Apparent and interpreted resistivity profiles for sts. 5-8 at the Texaco Charlson C133 site •• , ••••• , • 227
80. Apparent and interpreted resistivity profiles for sts • 9-12 at the Texaco Charlson Cl33 site. . . . . . . . . • 228
81. Apparent and interpreted resistivity profiles for sts. 13-16 at the Texaco Charlson Cl33 site. . . . . . . . • 229
82. Apparent and interpreted resistivity profiles for sts. 17-20 at the Texaco Charlson Cl33 site. . . . . . . . • 230
83. Apparent and interpreted resistivity profiles for sts. 21-2.4 at the Texaco Charlson C133 site . . . . . . . • 231
8.4. Apparent and interpreted resistivity profiles for sts. 25-28 at the Texaco Charlson Cl33 site . . . . . . . . • 232
85. Apparent and interpreted resistivity profiles for sts. 29-32 at the Texaco Charlson Cl33 site . . . . . . . . • 233
xii:.

r
Table
1.
LIST OF TABLES
Function and general purpose of drilling fluid additives. . • • . • • • • • , . • . .
2. The range of selected ion concentrations in drilling fluid and chemical analyses of the Apache
4
re-entry drilling fluid. • • • • • • • • . • • 105
3. Recaromended Concentration Limits and Maximum Permissible Concentrations for drinking water ••.• 137
4. Lithologic description of drill holes at the Texaco Government "A" (NCT-1) site • • • • • • • 157
5, Lithologic description of drill holes at the Belco Petroleum B,N. Sheep Ck. #1-11 site •••••• 158
6. Lithologic description of drill holes at the Apache Federal #1-5 site.. • • • • • • • •• 159
7. Lithologic description of drill holes at the Texaco Charlson Madison North Unit Cl33 site ••• , 160
8.
9.
10.
11.
Textural analyses for sediment at the Texaco Government "A" (NCT-1) site. . . . . . . . . Textural analyses for sediment at the Belco Petroleum B.N. Sheep Ck, #1-11 site. . . . . Textural analyses for sediment at the Apache Federal Dl-5 site. . . . . . . . . • . . . . Textural analyses for sediment at the Texaco Charlson Madison North Unit Cl33 site ••
. . .
. . .
. . .
12, Results of quarterly water sampling from instrument stations at the Texaco Government "A" (NCT-1)
. 166
. 167
. 168
169
site . . . . .. . . . . . . . . . . .. . . . . . . . • 172
13, Results of quarterly water sampling from instrument stations st the Belco Petroleum B.N. Sheep Ck. Hl-11 site • • • • . • • • • , 178
xiii

Table
14. Results of quarterly water sampling from instrument stations at the Apache Federal Ul-5 site .. .. .. . .. .. .. .. . .. .. . . .. .. ..
15. Results of quarterly water sampling from instrument stations at the Texaco Charlson Madison North
182
Unit C133 site.. .. . .. .. . .. .. .. . .. . .. .. • . . . 193
16. Elutriation experiment sediment samples from the Texaco Government "A" (NCT-1) and Apache Federal Ul-5 sites. . . . . . . . . . . . . . . . . . • • 201
17. Drilling fluid additives used at the Belco Petroleum B.N. Sheep Ck. n-11 site . . . . . . . . . 235
18. Drilling fluid additives used at the Apache Federal 11-5 site . . . . . . . . . . . . . . . . . . 236
19. Drilling fluid additives used at the Apache Federal #1-5 re-entry . . . . . . . . . . . . . . . . 237
xiv

....
ACKNOWLEDGEMENTS
I would like to express sincere appreciation to my advisory
committee chairman,' Dr. Alan E. Kehew, for his assistance in the
field and his guidance throughout this project. I would like to
also thank committee members Dr. Gerald H. Groenewold and Dr.
Don L. Halvorson for their constructive criticisms and professional
advice.
The staff of the North Dakota State Department of Health
Envirorunental Laboratory is gratefully acknowledged for their
assistance in this project. Special thanks are conveyed to
Francis J. Sch~indt, Rod Reetz, and Ken Kary.
Appreciation is extended to the members of the North Dakota
Geological Survey for their help and support. A special thanks
to David O. Lechner for his assistance in the earth resistivity
survey. I am especially indebted to Mark Stadum, Daniel Pyle,
and Bret Fossum (sUllllller NDGS employees) for their assistance
in instrumenting the sites and cheerfully working 12 to 16 hour
days, while only being paid for 8,
Special gratitude is expressed to Norman Winter and family
(Squaw Gap, Billings County) for their kindness and hospitality •.
My greatest debt of gratitude is to my mother and father,
Edward and Imogene, for their moral support and understanding.
I would like to also thank Mrs. Marlys Kennedy for her
professional typing of this manuscript.
xv

DEDICATED TO:
my father
Edward Paul Murphy
xvi
ABSTRACT
Upon completion of an oil-and-gas well in North Dakota the
drilling fluid is buried in the reserve pit at the site. Reclamation
of the drill site is expedited by digging a series of trenches which
radiate out from the reserve pit, The majority of buried drilling
fluid is ultimately contained within these 5-7 metre deep trenches.
These fluids are commonly salt-based, i.e. they contain a con
centration of 300,000±20,000 ppm NaCl. In addition, these drilling
fluids also contain additives including toxic trace-metal compounds.
Four reclaimed oil~and-gas well sites were chosen for study in
western North Dakota. The ages of these sites ranged from 2 to 23
years. These sites were chosen in an effort to encompass as many
as possible of the geologic and geohydrologic variables that exist
in this area. A total of 31 piezometers and 22 soil water samplers
were installed in and around the drill sites and quarterly ground
water samples were obtained from these instruments, The local
groundwater flow conditions were also determined at these sites.
Results of both the water analyses and earth resistivity
surveys indicate that leachate is being generated at all of the
study sites, Water obtained from the unsaturated zone beneath the
buried drilling fluid at all of the four study sites exceeds some
of the Recommended and Maximum Permissible Concentration Limits for
trace elements and major ions (As, Cl-, Pb, Se and N03-). These
values are greatly reduced in the unsaturated zone as the depth from
xvii
the buried drilling fluid increases. This reduction is assumed to
be the result of attenuation of these ions by cation exchange on Na
montmorillonitic clays.
Two of these study sites represent the typical geohydrologic
setting for the majority of oil-and-gas well sites in this area.
At these sites the saturated zone was not monitored. The reduction
in ion concentration in the unsaturated zone suggests that there
would be very little impact on the groundwater from this buried
drilling fluid at these two sites.
The two other study sites were situated in geohydrologic
settings that offered a great potential for leachate migration in
the saturated zone. The chloride ion was chosen as an indicator
of maximum leachate migration because of its high mobility and lack
of attenuation other than by dispersion. The chloride concentrations
returned to background levels within the saturated zone 60 to 90
metres downgradient of the buried drilling fluid at these two sites.
The consUlllption of shallow groundwater beneath one of the study
sites constitutes a danger to human health. The Maximum Permissible
Concentration Limits for Cd, Pb, and Se were exceeded in the shallow
groundwater beneath the buried drilling fluid at this site. These
limits were exceeded in an area approximately 60 by 110 m. The
concentration level of N03- ranged from 1310 to 12.2 mg/1 (as N)
throughout the groundwater at this study site. It is not known
conclusively whether the buried drilling fluid at this site is the
source of the N03
- contamination.
xviii

INTRODUCTION
History of Oil-and-Gas Drilling.--The first commercial oil
well in the United States was drilled under the supervision of
Colonel E. L. Drake and completed on August 28, 1859 in Titusville,
Pennsylvania. However, the history of well drilling greatly
precedes this event and can be traced as far back as China in
600 B.C. (Brantly, 1971). These early wells were drilled using
a percussion method and it was not until the late 1880s that the
present day method of rotary drilling began to develop
(Chilingarian and Vorabutr, 1981).
As the drilling industry grew and advanced in technology,
so also did its associated industries. An incident early in
this developmental period gave rise to the drilling fluids
industry. In October of 1900, Capt. Anthony F. Lucas and the
Hamill Brothers were drilling the famous Spindletop well near
Gladys, Texas. The drilling fluid at this location consisted
of fresh water which was stored in a clay-lined pit adjacent
to the well. Upon encountering a "caving sand" interval in
the bore hole the drilling crew ran nearby cattle back and forth
through the pit to produce a muddy fluid which enabled them to
continue drilling and to complete the well (Chilingarian and
Vorabutr, 1981). Drilling fluids remained virtually unchanged
up until 1921 when the first attempt was made to control mud
properties with the use of chemical additives (Rogers, 1953).
I

2
The drilling fluid industry has changed dramatically since
those humble beginnings in east Texas. More than 700 U.S. patents
were issued for drilling fluids between 1930-1979. Approximately
45 different chemical compounds are represented by over 500 trade
name products. Out of these canpounds only a dozen or so are used
at a typical well site (Ranney, 1979).
The advent of deeper drilling within the last twenty to
thirty years has necessitated the development of chemical drilling
fluid additives which enable the drilling fluid to perform its
primary functions under higher temperatures and pressures. These
primary functions are to lift formation cuttings to the surface,
control subsurface pressures, lubricate the drill string, cool
the drill bit,.protect the formation productivity, and to provide
an aid for formation evaluation (Moore, 1974). Drilling fluid
additives can be grouped into a number of general categories
according to purpose (table l). Because of the great variability
in chemical COlllposition of drilling muds, the toxicity levels to
both plant and animal varies widely between categories, This
will be further discussed later in this report.
There are three types of oil-and-gas drilling fluid bases:
fresh water, salt water, and oil. In North Dakota, salt-water
based drilling muds are almost always used. The concentration of
salt (NaCl) in these drilling fluids is commonly 300,000± 20,000 mg/1
(American Petroleum Institute, 1969), In comparison the average
salinity of seawater is typically 35,000 mg/1 (Pearse and Gunther,

3
Table 1. Function and general purpose of drilling fluid additiv.es (from Wright, 1978 and Collins, 1975).

4
Genera i Pyrpos:e
Weighting Mitterial Control fonnation pressure, check cavinq. fascilitate po1Hnq dry pipe, & well c001]1'etlon ~erations ·
Viscosifier Viscosity builders for fluids, for a high viscosity-solids relationship
Thinner Oispe~ant l'bdify relationship between the viscosity and percentage of solids, vary gel strength, deflocculant
Filtrate Reducer Cut the loss of the drillfng fluid's liquid phase into the fonnat1on
Lost Circulation Pril'!lary function is to plug the zone Material of loss
Alktlinity, pH Control the degree of acidity or Control alkalinity of a fluid
Ul'lulsifier Create a heterogeneous mixture of blfJ liquids
Surfactant Used to the degree of emulsification, aggregation, dispersion, interfacial tension. foaming, and defoaffrlng (surface active agent}
Cort0sion Inhibitor Materia1s attempt to decrease the presen(:e of such corrosive compounds .as oxygen• carbon dioxide; and hydroqen sulfide
Defoalfter Reduce foaming action especially in salt water based IIIUds
roaner Surfactants which foam Sn the presence of ttater ;,,nd thus permit J ir or gas dri1 Hng in formations producing water
FloccuTants Used ca!ll'IOnly for increases in gel strength
Bactericides Reduce bacteria count
~n Additives
8arite, lead c~unds~ iron oxides
Bentonite, attnulgite clays~ all colloids, fiborous asb~stos Tannins (quebrachQ), po 1 yphosphates. lignitic materials Bentonite clays, sodium cal"boi:,methyl cellulose {CMC), pre!)e:latinfzed surch, various lignosulfonates Walnut shells, shredded celloplla:ne flakes. thi•otropic cement. shredded cane fiber, plq !\air, chicken feather-S etc. Line, caustic soda, bicarbonate of soda lignosulfonates, mud deterge11t, petroleum sulfonate Include additives used under emulsifier foamer-S. defoamers. & f1occulators
Cooper carbonate, sodi!Jffl chrol'!late, chn:mate~zinc solutions, chrollll' ligr,osul~ fonates, organic acids and amine P01y,nel"5. sodium arsenite Long chain alcohols. silicones+ sulfonated oils Organic sodii.m & su1fonates. alkyl bentene sulfonates
s, 1 t. hydrated l icr,e, qyosum, sodiUlll tetraphosohates Starch preservative, oaraforma 1dehyde. caustic soda. HllW!, sodium pentAchlor,1phenate
Lubricants Reduce torque and increase horsePOWer at the Graphite powder, soaPS.
Shale Control Inhibitors
bit by reducing the coefficient of friction certain of1s Prevent and overtol!ll' the contamination Caustic soda {NaOH}, soda ash, effects of anhydrtte and qypsum bicarbonate of soda,
barium carbonate USed to control cavinq by swe11tng or hydrous disente9rat1on
Gyt,Sum. sodi\1111 sn fcate, ca lei um lignosulfonatet, 11•. salt
5
1957). The brines that are used to make up these salt-based muds
are most commonly produced waters, i.e. they are produced along
with the oil-and-gas at the well site. The concentration of
many major ions in these "make up" waters is very high in
comparison to their concentrations in shallow groundwater in
western North Dakota. Therefore, in addition to the drilling fluid
additives, these waters contain ions that have the potential to
degrade the soil and shallow groundwater system.
Oil-and-Gas Drilling in North Dakota.~The ccmpletion of the
Clarence Iverson Hl by Amerada in 1951 marked the beginning of oil
production in North Dakota (fig. 1). To date, an estimated 9000
oil-and-gas wells have been drilled within the state.
Prior to drilling, a pit is excavated adjacent to the drill
hole that serves to contain the drilling fluid as it is being
circulated in and out of the bore hole. Mud or reserve pits
in North Dakota are at present cOllllllOnly constructed on the order
of 150 feet·in length, 60 feet in width, and 10 feet in depth
(46m x 18m x 3m) • The volume of drilling fluid maintained in
each pit during drilling usually ranges from 54,000 to 90,000
cubic feet ({1530 to 2549 m3) (400,000-675,000 gallons)). It
can therefore be estimated that approximately 360 million cubic
feet of drilling fluid have been buried in shallO'I( pits in
North Dakota.
Prior to the setting of surface casing, the drilling fluid
is commonly a mixture of bentonite and fresh water, i.e. is devoid
of most chemical additives, Just before setting the surface

6
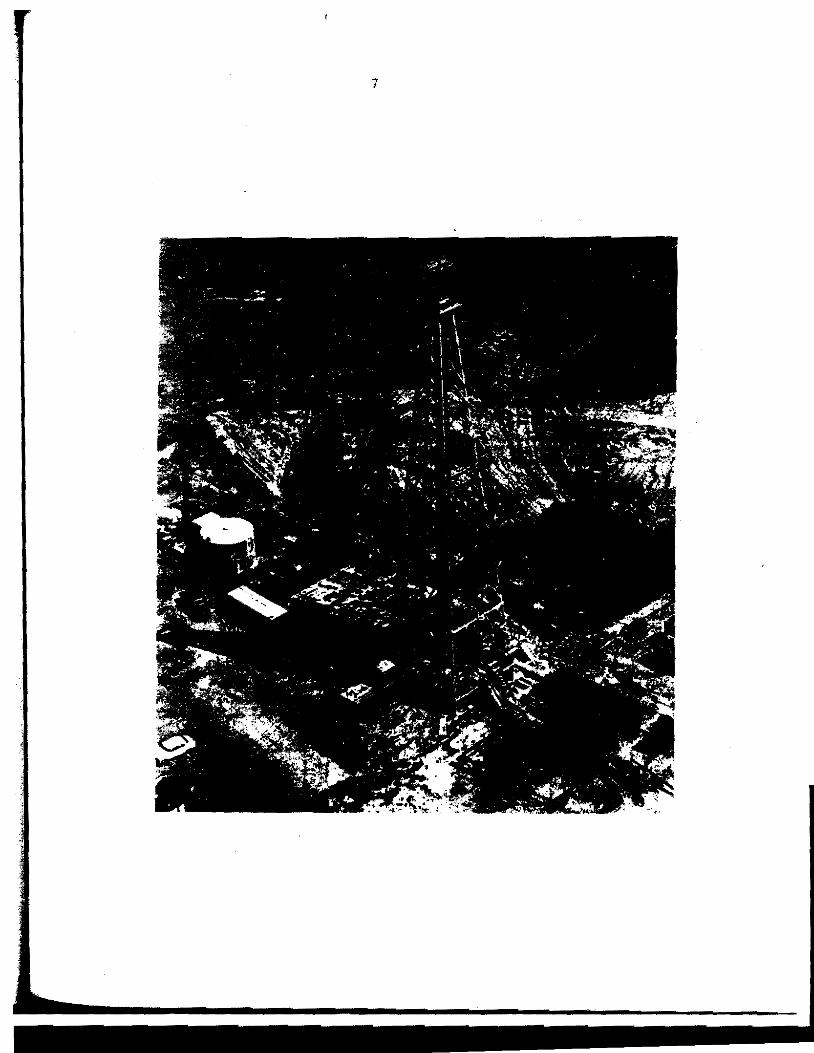
Figure 1. The Amerada Clarence Iverson No. 1. The discovery well in North Dakota (photo by Mr. Bill Shemorry).
7

8
casing, the drilling fluid is "mudded up" and circulated in a
closed system that no longer includes the reserve pit.
As the drilling fluid is circulated out of the bore hole,
the suspended sediment cuttings are separated at the shale shaker
and funneled into the reserve pit. The drilling fluid is then
directed through a series of settling tanks designed to remove
the remaining cuttings before being pumped back downhole
(fig. 2}. Although drilling fluid is no longer circulated into
the pit, the fluid coating the cuttings at the shake shaker, along
with that flushed out during periodic cleaning of the settling
tanks, is deposited in the reserve pit.
Prior to 1974, reserve pits which had been excavated into
permeable material (i.e., sand, gravel, and lignite) were often
lined with bentonite clay to prevent loss of fluids during
drilling. In recent years plastic liners have commonly replaced
clay liners for seepage control (fig. 3).
At present the Oil-and-Gas Regulatory Division of the
Industrial Gol!llDission of North Dakota has the authority to require
that an operator install a plastic liner in reserve pits where
it deems the surrounding sediment too permeable and would allow
an excessive amount of liquid into the subsurface. This
regulatory authority is provided by the General Rules and Regulations
for the Conservation of Crude Oil and Natural Gas. The U.S. Forest
Service has the same authority on federally-owned lands.
Reserve ~it Reclamat1on.--Shortly after completion of an oil
and-gas well in North Dakota, normally within a one-month period,

9
Figure 2. Closed-system circulation of drilling fluid.
10
Stondpipe
Kelly
Drill Pipe
7
Annulus

Figure 3. North Dakota. (3m).
1.1
A polyethylene lined reserve pit in western The depth of the pit is approximatel.y 10 feet
Figure 4. Recl.amation of a reserve pit by trenching 1n Billings County, North Dakota. The trenches are filled with drilling fluid from the pit in the background.


' '
13
the reserve pit is reclaimed. Disposal procedures commonly consist
of hauling away the less viscous portion of the drilling fluid
for disposal in another reserve pit or injection well, or by
spreading on roads to control dust. A series of trenches is
excavated radiating outward from one side of the pit (fig, 4).
Sediment is then pushed back into the pit from the opposite side
thereby forcing the drilling fluid into these trenches (figs. 5
and 6). Finally, the pit and trenches are backfilled and leveled.
In the 50s and 60s the pit was commonly reclaimed by pushing
sediment in from all sides and the trenching method was uncommon.
This earlier method required one month to a year to complete
(Haugen, 1980). In comparison, a trenched pit can usually be
reclaimed in a day or two. The trenching method of reclamation
is intended to minimize the effects of drilling fluid on surface
features (i.e. surface waters, soil, vegetation, and animals).
However, in doing so the potential for degradation of the shallow
groundwater is often greatly increased.
Drilling.Fluid Chemistry.--In any study determining the
effects of waste disposal on the shallow groundwater system, it
is extremely important to know as precisely as possible the
chemistry of the waste. This is essential to anticipate the
chemical makeup of the leachate that will be generated.
There are a number of problems associated with obtaining the
drilling fluid chemistry for a given drill site. The records of
drilling activity and drilling fluid additives are often no longer
available for sites that are twenty or thirty years old, Even

14
Figure 5. Reclamation of the reserve pit at the Apache Corp. Federal #1-5 re-entry. Sediment is being pushed into the pit and forcing the. drilling fluid into the trenches. Photo is taken looking north.
Figure 6. Reclamation of the reserve pit at the Apache Corp. Federal #1-5 re-entry. Drilling fluid is filling the 21-foot (6.4m) deep trenches. Photo taken looking east.
16
when these records are available it is extremely difficult to
determine the chemical composition of these drilling fluid
additives, The drilling fluid industry is very competitive and
the exact chemical composition of the product name additives is
very difficult to obtain.
During the drilling of an oil well, a mud engineer monitors
and records the concentrations of certain selected chemical
parameters in the drilling fluid (canmonly NaCl, N03
- and Cr04-).
Although the concentration recorded in the circulating drilling
fluid and that which is eventually buried at the site is not
necessarily the same, it does give an approximation.
It should be noted that completion and workover fluids
(including acidifying solutions) may also be discharged into the
reserve pit, depending on whether or not an attempt is made to
produce the well. The composition of these fluids is variable but
predominantly they are acid. The volume of acid used in the
acidizing of a well varies with subsurface conditions but commonly
ranges from 500 (1.9m3) to several thousand gallons (tens of m3).
The most common types of acids used are hydrochloric, fo:tmic,
and acetic. During 1975, 87,000,000, 200,000, and 100,000
gallons of these acids, respectively, were used for oil-and-gas
well treatments in the U.S. (Collins, 1975).
Project Inception.--On September 26, 1979 the State Geologist
of North Dakota (Dr. Lee C. Gerhard) drafted a letter to the
Governor of North Dakota (Arthur A. Link) and the North Dakota
Industrial Commission requesting that they direct the North Dakota
17
Geological Survey (NDGS) and the North Dakota State Department of
Health (NDSDH) to study the toxicity of drilling fluids and their
disposal effects. This letter was the result of concern expressed
by ranchers in western North Dakota in regard to the protection
of the shallow groundwater systems in these areas frooi potential
degradation by chemicals (especially chromium) leached from oil-and
gas well drilling fluid pits and the virtual absence of scientific
data on this subject. These concerns culminated in a special
hearing before the Industrial Commission of the State of North
Dakota on January 8, 1980 in Dickinson, North Dakota. The purpose
of the hearing was to determine if the use of sodium chromate
(a commonly used drilling fluid additive in western North Dakota)
(table 1) should be prohibited in North Dakota.
In response to Dr. Gerhard's letter, Dr. Alan E. Kehew
(formerly with the NDGS) and Francis J. Schwindt (Assistant
Director-Division of Water Supply and Pollution Control (NDSDH)
became co-investigators in a project designed to study the
migration of oil-and-gas well drilling fluids from reserve pits.
This project was funded by the NDGS and a grant from the
Environmental Protection Agency.
In April of 1980, I became the principal investigator of
this project and decided to focus the investigation and research
in western North Dakota because of the concentration of drilling
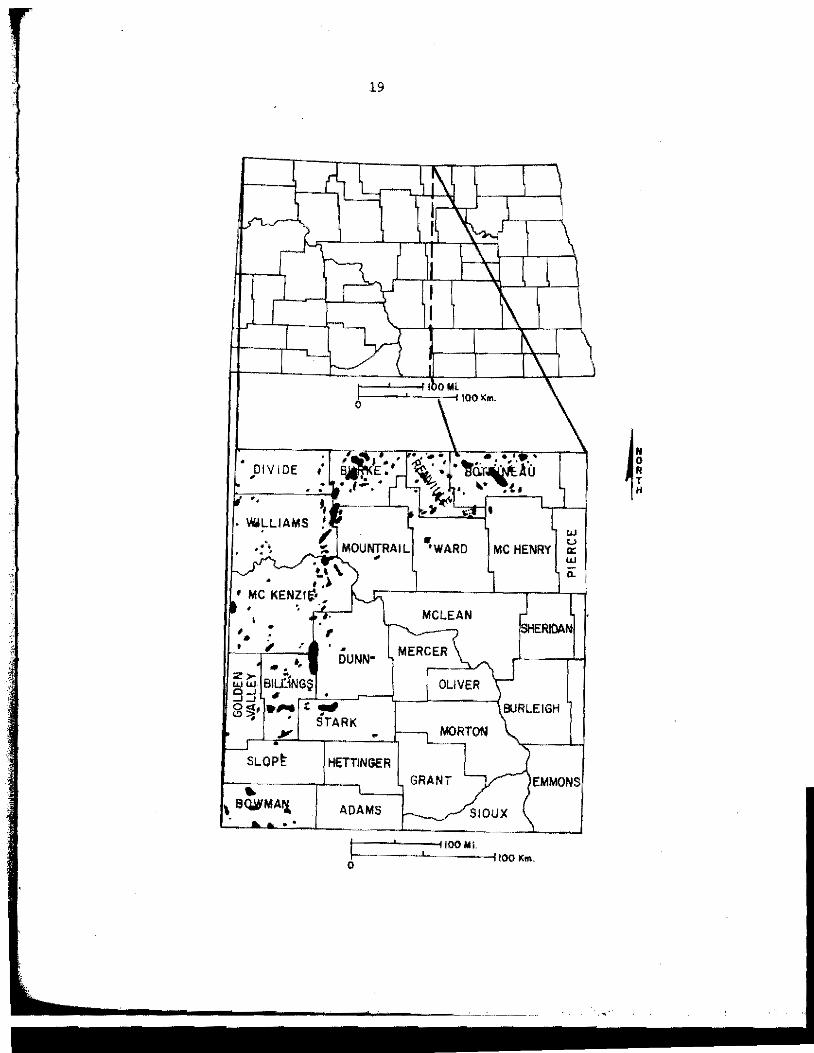
activity in this area of the state (fig. 7) and the frequent use
of sodium chromate as a drilling fluid additive in this area.
18
Figure 7. Oil fields in North Dakota {Gerhard and Anderson, 1981, p. 17).
'' ', y
19
• DIVIDE •
'~···/ ,· B I E. . .,; ~ . • WoiLLIAMS
I•
'
... . '
• ;, ••
, ••
2>-B1L(1NG$ WW ,,
, • •
DUNN•
9:J o~, ·- t..., "' . • STARK
y • • SLOPt HETTINGER ..
\ B(lllM~ ADAMS .. ~-
0
MCLEAN
MERCER
r-OLIVER
~MORTON
GRANT
w u
MC HENRY a: w Q.
RlOAN
BURLEIGH
EMMONS
SIOUX
IIOOMi, lOO Km.

20
These additives are commonly used in this area to reduce the
corrosion of the drill pipe by the high a2s content in the
subsurface.
Purpose.--Rule number (43-02-03-19) of the General Rules and
Regulations for the Conservation of Crude Oil and Natural Gas
states that " •••• no pit shall be constructed so as to allow surface
or subsurface contamination by seepage or flowage from said
pit ••• " (Appendix A) •
The purpose of this study is to:
1) detennine whether or not chemical components are being
leached out of reclaimed drilling sites in western
North Dakota.
2) if sos, to investigate the extent, character, and geo
chemical controls influencing the movement or
attenuation of the leachate;
3) evaluate the potential health risks to both humans and
livestock resulting from consumption of shallow ground
water within an area surrounding these reclaimed
drilling pits; and
4) suggest, if appropriate, alternative methods of drilling
fluid pit reclamation.
Location and History of Study Sites.--A total of four reclaimed
oil-and-gas reserve pits were selected for monitoring in western
North Dakota (fig, 8). Three of these sites are located within
the nonglaciated portion of the state in close proximity to the
center of the Williston Basin. The fourth site is located along

21
Figure 8. The location of the four study sites.

22
SASKATCHEWAN MANITOBA
NORTH DAKOTA
0 50 IOOMiles KM
Texaco Inc. - Charlson Cl33
north
Mc Kenzie County
* Belco Petroleum Corp. - 8.N. Sheep Ck.* I - 11
I " " ( l Texaco Inc. - Gov'I. A NCT - I '----.---.-------'--,
Apache Corp. - Federal*! - 5
Bil lings Co,
rf ~~__..~~--ij ~OKM '-----'O 25 50 Miles

23
the margin of maximum glacial extent but is not situated upon
glacially derived sediments (Clayton et al., 1980). All sites
lie within the Missouri River Drainage Basin, the major drainage
basin in this area.
In choosing these four sites an attempt was made to
encompass the major variables which effect reclaimed drilling fluid
pits; the age of the pit, the geologic and geohydrologic conditions,
the chemical drilling fluid additives used, the use of workover
and completion fluids, the presence or absence of a pit liner,
and the method of pit reclamation.
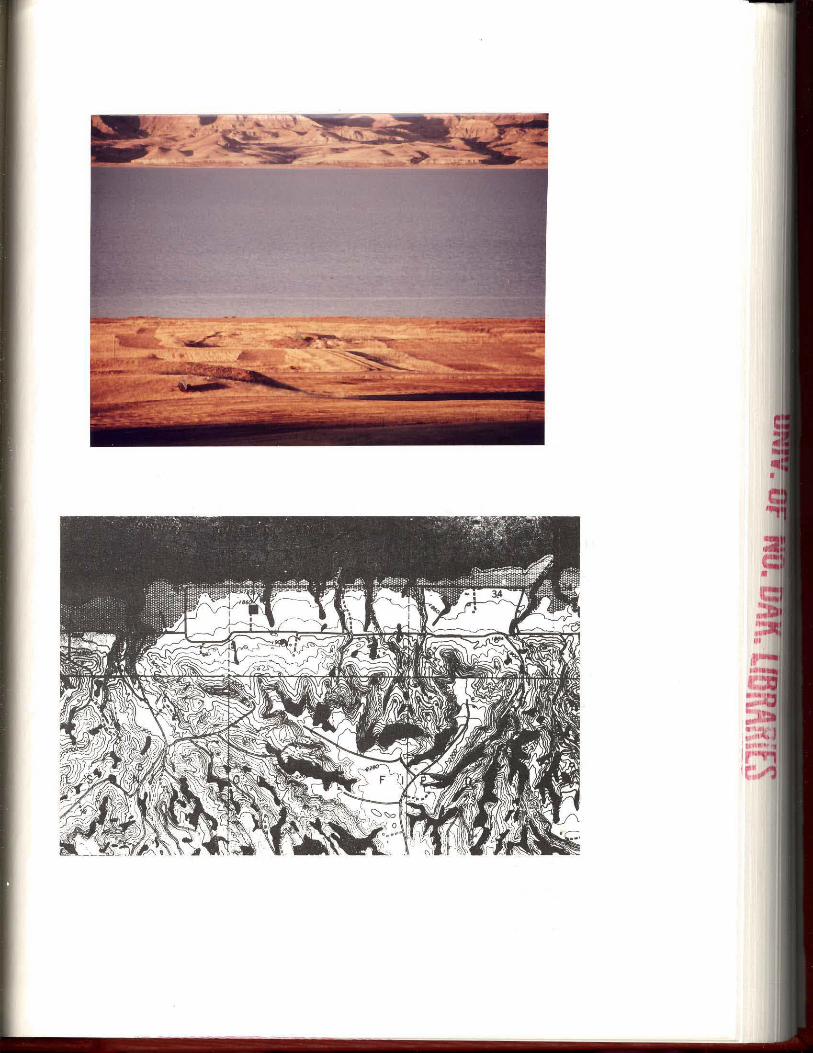
The oldest drill site is located in the Charlson oil field
in northeastern McKenzie County along the southern shore of Lake
Sakakawea (T154N, R95W, C NW/SW Sec. 33) (figs. 9 and 10). This
site is identified as the "Charlson Cl33." t'\merada Petroleum
Corporation began drilling (spudded) the well (Steve Yttredahl
"B" 112) on November 19, 1955 and began producing oil from it in
1956. The well was turned over to Texaco Inc. in the mid-60s
and converted to a water injection well in 1966 (Madison North
Unit Cl33). The well operated in this capacity until the late
1970s. From August of 1974 through January of 1977, compressed
nitrogen gas was added to the injected fresh water as part of
Texaco's enhanced secondary recovery program. The reserve pit
did not have a plastic liner and, although data are inconclusive,
most likely was not trenched during reclamation.
Two additional sites are located about a mile apart in the
Roughrider oil field in southern McKenzie County. These sites are
24
Figure 9. Photograph of Texaco Charlson Madison North Unit C-133. Photo is taken looking north.
Figure 10. Topographic map of Texaco Charlson Madison North Unit C133 (T154N, R95W, c nw/sw sec. 33).
·Scale is 1.9 inches= 1 mile (1.6 km).

26
identified as "Govt. A (NCT-1)" and "B.N. Sheep Creek /11-11,"
and are situated within highly dissected badland topography in
the Little Missouri Drainage Basin, 4.5 airmiles (7.2 Ian) east
of the Little Missouri River. Texaco Inc. spudded the Government
"A" (NCT-1) (Tl45N., RlOlW, SE/NE Sec. 14) on December 29, 1960
(figs. 11 and 12). The well was temporarily abandoned in April
of the following year and plugged on October 24, 1964. The reserve
pit was not lined with a plastic liner and apparently was pushed
in during reclamation. Belco Petroleum Corporation spudded the
Sheep Creek Burlington Northern #1-11 (Tl45N, R101W, SW/NE Sec.
11) on March 21, 1977 and plugged and abandoned the well on
April 19 of the same year (figs, 13 and 14). The well site is
bounded to the west by a stock pond and to the north by an
interm:ittent fork of the Little Beicegal Creek. The reserve pit
did not have a plastic liner and was apparently trenched to the
west.
The fourth study site is located approximately 1200 feet
(366m) west of the Little Missouri River in northwestern Billings
County (Tl45N, RJ.02W, NE/SE Sec. 5) (figs. 15 and 16). This site
is identified as the "Apache Federal Ul-5." It is situated
upon the Little Missouri flood plain 2400 feet (732m) southwest
of the Theodore llDosevelt National Memorial Park (Elkhorn Ranch
Site). Apache Corporation spudded the Federal #1-5 on June 7,
1979 and plugged it on the 30th of the month. On May 2, 1981,
Apache re-entered the well and drilled approximately. 1000 feet
(305m) deeper (figs. 17 and 18). This well is presently producing

27
1 h f G "A" Figure 1, Photograp o Texaco Inc. overnment (NCT-1). Note absence of vegetation over reserve pit. Photo taken looking northeast.
Figure 12. Topographic map of Texaco Inc. Government "A" (NCT-1) study site (T145N, RlOlW, se/ne sec. 14). Scale is 2.0 inches= 1 mile (1.6 km).
,


29
Figure 13. Photograph of Belco Petroleum B.N. Sheep Creek #1-11. Stock pond is located along right-hand border. Photo is taken looking south.
Figure 14. Topographic map of Belco Petroleum B.N. Sheep Creek #1-11 study site (Tl45N, RlOlW, HW/ne sec. 11). Scale is 2,0 inches= 1 mile (1.6 km),

31
Figure 15. Photograph of Apache Corp. Federal #1-5 study site. Note vegetation above reclaimed reserve pit (arrow). Photo was taken prior to the drilling of the reentry well, Photo is looking northeast.
Figure 16. Topographic map of Apache Corp. Federal #1-5 study site (Tl45N, Rl02W, ne/se sec. 5). Scale is 1,9 inches= l mile (1.6 km),

\/·· ' '-:--, ', ' ·. __ ) '-'. .
~ --~, ' "' . . ( ~<> ~ '-,-~
.. % i'-MX 1
. . 3, '- ~' ' ' 'v \
... ...,,,,.'"" .•. '. ; :_ i~ -.. -s . 1. __ -

33
Figure 17, The cardinal Rig 07 drilling the Apache Corp. Federal #1-5 re-entry. The reserve pit is located between the rig and the sediment pile. Photo taken looking east-northeast.
Figure 18. The reserve pit from the Apache Corp. Federal #1-5 upon completion of drilling. Note the extensive tear in the pit liner along the entire north face of the pit. Photo is taken looking north.


35
oil, This site has two separate reserve pits on location because
of the 1981 re-entry. Both mud pits were lined with a plastic
liner and trenched during reclamation.
Climate.--The climate in the area of study is continental,
semi-arid, characterized by long cold winters and short warm
to hot summers (Anna, 1981), Precipitation averages slightly
higher than fifteen inches (38 cm) annually, fifty percent of
this typically coming during the months of May, June, and July.
The average annual snowfall is between 30 and 35 inches (76-89 cm)
(Goodman and Eidem, 1976}. The ground in this area is normally
frozen three to five months of the year. (National Oceanic
and Atmospheric Administration, 1981).

~-'.
PREVIOUS WORK
An extensive library search and a nationwide computer search
through the Georef system produced less than a dozen articles on
the disposal of drilling fluids, none of which provided
quantitative geochemical data. A few drilling-fluid-related
studies either began after the inception of this project or were
in progress and have not as yet been published. Foremost among
these is a project similar to this one sponsored by the American
Petroleum Institute (AP!). It involves the field monitoring of
twenty reclaimed reserve pits from Texas to North Dakota. The
North Dakota site is located a few miles north of Dickinson. This
(AP!) project began early in 1980 in response to an attempt by the
U.S. Environmental Protection Agency to have drilling fluids
classified as hazardous wastes.
The U.S. Bureau of Land Management (BLM) has been testing the
effects of drilling fluid on soils in Wyoming. In this cooperative
project, BLM has been spreading drilling fluid over test plots
and planting numerous species of grass and shrubs. The plants
are later tissue-tested to determine their uptake of salts and
trace minerals. A similar project was recently conducted by Utah
State University, and another is currently in progress at Purdue
UniversHy (Lenzini, 1980). The drilling fluids being tested are
fresh-water based and, therefore, such ·a test would.not be
36

37
practical with the salt-water based drilling fluids that are
used in North Dakota.
The dumping of drilling fluid into oceanic waters upon
completion of an offshore drilling program has long been an area of
primary concern, Laboratory research into the effects of drilling
fluids on marine organisms began as early as the 1950s. Prior to
1977, drilling fluid waste had been discharged into the marine
environment from over 20,000 offshore wells (Ranney, 1979). The
majority of environmental studies on offshore drilling fluid
disposal involve the determination of toxicity levels to marine
organisms. Unfortunately, these data are not applicable to
on-shore studies.
-···-~---···---- --- ---··---------·
METHOD OF INVESTIGATION
Reconnaissance Study.--During the month of April, 1980, ,sixty
well sites were chosen for potential monitoring in western North
Dakota. The Geologic Map of North Dakota (Clayton et al., 1980)
was used in combination with geologic and geohydrologic inter
pretation of l:20,000 aerial photographs to narrow the list to a
dozen sites. These sites were situated within either Tertiary
bedrock or colluvial and alluvial sediments.
Initial site investigation occurred during the last week in
May, 1980. A North Dakota Geological Survey truck""1llounted auger
(4 3/4 inch diameter) was used to obtain subsurface geologic
information at each of these sites. Four study sites were chosen
for groundwater monitoring based upon the results of this
reconnaissance study.· Two of these sites represent the typical
geohydrologic conditions within which the majority of oil-and-gas
well sites in this area are situated. The other two sites were
chosen because of their relatively permeable sediments and high
water table.
Field Methods.~The North Dakota Geological Survey's truck
mounted hollow stem 8" auger (Mobil B-50) was used to drill holes
to provide geologic and geohydrologic data as well as to enable
installation of monitoring equipment at each of these four sites
during the periods of June 16-26 and August 11-15 in 1980 and May 26 -
38
l
39
June 6 of 1981 (Appendix B). The maximWII depth of penetration
obtained with this auger was 72 feet (22m), The limitations this
:imposed upon the groundwater 1DDnitoring affected, hut were not
detritnental to, the overall project.
Shelby tube sediment samples were taken at each site in addition
to the collection of sample drill cuttings. These 2.5 foot (0.762m)
by 3 inch (7.62 cm) sediment cores provided detailed lithologic and
stratigraphic information as well as relatively undisturbed
samples for textural analysis. A total of 160 feet (48.Sm) of
shelby tube sediment cores was retrieved from the four sites,
Piezometers were one of two types of instruments installed to
monitor the groundwater system at each site. They provided water
samples from wi·thin the zone of saturation, enabled a determination
of the elevation and gradient of the water table, and enabled slug
tests to be performed for estimation of the hydraulic conductivity
of the sediment adjacent to the screened interval.. The piezometers
consisted of 2 inch (5.08 cm) diameter schedule 40 pvc bottomed
with a 5 foot (1.52m) preslotted 0.02 inch (5,1 !IDll) pvc screen.
A washed gravel pack was placed around the screen and the holes
were sealed with approximately 10 feet of cement and then back
filled to the surface with drill cuttings (fig. 19).
Pressure-vacuum lysimeters (soil water samplers) (Soil Moisture
Equipment Corp. Model 1920) were used to obtain water samples from
the unsaturated zone. The soil water sampler is 3 inches (7.6 cm)
in diameter and 25 inches (0.64m) in length (fig. 19). A 2 inch
40
Figure 19. A profile of a soil water sampler (lysimeter) and piezometer as used in this study.

41
PRESSURE-VACUUM SOIL WATER SAMPLER
T 25"
1 WATER TABLE
PIEZOMETER
bJ fill
bc1 CEMENT
~ GRAVEL
• BENTONITE
till SILICA FLOUR
I 'I ,, ,, ii !I

42
(5.08 cm) ceramic cup is attached to the bottom of the pvc body,
This cup forms the porous membrane through which soil water is drawn
into the device.. Vacuums of 50--85 centibars are normally applied.
The annulus between the ceramic cup and the edge of the bore hole
was filled with silica flour to prevent the clogging of the 1,0
micron diameter ceramic pores. Al foot (30.5 cm) bentonite plug
was placed above this interval to prevent percolation of water
down through the backfilled bore hole. Access tubes were run
to the surface to enable the application of a vacuum and collection
of the water sample at the surface. The maximum sample obtainable
is one quart (0.946 litre).
A number of studies have shown that Ca, Na, and K can be
leached out of the ceramic cup of this device and thus produce values
of these ions in excess of their true concentration (Johnson et al.,
1981). To prevent this the ceramic cups were first rinsed with
approximately SN HCl and then rinsed twice with distilled water.
Water samples were collected on a quarterly basis. Two to four
weeks prior to collection, the wells were bailed dry in order to
provide a representative sample. At this time, a vacuum was also
induced into the soil water samplers to allow sufficient time for
the soil water to be drawn into the sample chamber.
The temperature, pH, and electrical conductivity of the water
samples were determined in the field at the time of sample collection.
The dissolved-oxygen content of esch of these water samples was
determined only once (Nov. 3, 1981) due to equipment malfunction
and inaccessibility. The water samples were filtered through a
,, .. :: Ii ii

43
series of prefilters and ultimately through 0.45 micron filters,
placed in plastic quart (0.946 litre) and pint (473 ml) containers,
and were packed in ice during transportation to the lab. The water
samples in the pint (473 ml) bottles were analyzed for trace metal
content. Five milliliters of concentrated nitric acid was added
to these samples after filtering to prevent the trace metals
from precipitating out of solution. The water samples in the quart
(0.946 litre) containers were analyzed for major ions. All water
samples were analyzed by the North Dakota State Department of Health
Environmental Laboratory in Bismarck.
A detailed description of the field equipment used and the
precise methods of field sampling is provided in Groenewold et al.
(1979) •
Each site was surveyed with plane table and alidade to construct
a base map and to obtain accurate elevation control for the
monitoring equipment.
Hydraulic conductivity for sediment in the zone of saturation
was determined directly by field tests. Single-well-response tests
(Hvorslev, 1951) were used to determine the hydraulic conductivity
of the sediment adjacent to the screened interval, This determination
is made by displacing the hydraulic head (water level) and measuring
the time required for it to return to equilibrium. In this study a
slug was used to raise the water level in a 2 inch (5 cm) pvc pipe
3.3 feet (l.Om). Upon insertion of the slug, the time was recorded
for the water level to return to its original equilibrium level
,, ,, '• '• II ii
44
(falling head test), The time was also recorded for the water level
to return to equilibrium when the slug was withdrawn (rising head
test). Hydraulic conductivities were determined for the tested
intervals by analysis of this data using techniques developed by
Hvorslev (1951). A step-by-step discussion of single-well-response
test methods and procedures is provided in Groenewold et al. (1979).
Single-well-response tests were conducted on piezometers at
the Texaco Charlson Cl33 and Apache Federal 1-5 sites. A total of 7
piezometers was tested, The remaining piezometers were not tested
because either the slug could not be lowered into the well due to
constrictions and bends in the pipe or there was not sufficient
water in the well.
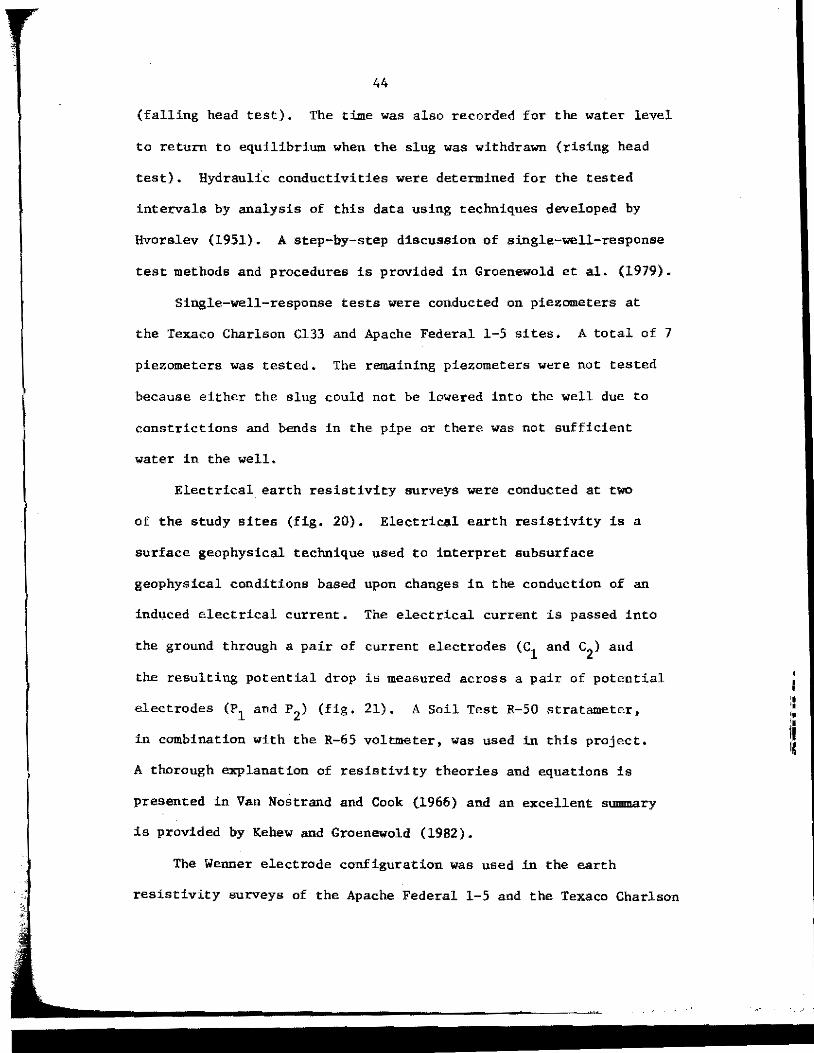
Electrical earth resistivity surveys were conducted at two
of the study sites (fig. 20). Electrical earth resistivity is a
surface geophysical technique used to interpret subsurface
geophysical conditions based upon changes in the conduction of an
induced electrical current. The electrical current is passed into
the ground through a pair of current electrodes (C1
and c2
) and
the resulting potential drop is measured across a pair of potential
electrodes (P1 and P2) (fig. 21). A Soil Test R-50 stratameter,
in combination with the R-65 voltmeter, was used in this project,
A thorough explanation of resistivity theories and equations is
presented in Van Nostrand and Cook {1966) and an excellent summary
is provided by Kehew and Groenewold (1982).
The Wenner electrode configuration was used in the earth
resistivity surveys of the Apache Federal 1-5 and the Texaco Charlson

45
Figure 20. The electrical earth resistivity survey equipment at resistivity station 18 of the Apache Federal Hl-5 site. The.electrode spacing of the array is 12 feet (3.7m). The photo is taken looking west-northwest.
Figure 21. Configuration of the four-electrode array used in the electrical earth resistivity survey. Current is passed through electrodes c1 and c2 and potential difference readings are ma.de between electrodes P1 and P2 • Equal electrode spacings (a) were used in the Wenner electrode configuration.

Battery Current Meter ~,,, ,~~~----------{ Vol t meter
WENNER CONFIGURATION
1~,,,,,,,, "I", ,4,,, , T"",,, ":r, 0 • 4 0 _, .. 0
D RESISTIVITY STATION

47
Cl33 sites. In this method the four electrodes are equally spaced
along a line. The distance between adjacent electrodes or the
electrode spacing is designated as "a". The center of the electrode
array is the point for which the data is obtained and has been
designated in this report as the resistivity station (fig. 21).
The Vertical Electrical Sounding method (VES) was used in
this project. It involves a fixed center of the electrode array
(resistivity station) and expansion of the electrodes about this
point. Stations were spaced approximately 100 feet (30.5m) apart.
Readings were taken at successive electrode spacings ("a") of 12,
30, 40, 60, and 80 feet.
Laboratory Work.--Microscopic mineral evaluation and wet and
dry sieve analyses were performed on sandy gravel layers at the
Texaco Charlson C133 and Apache Federal 1-5 sites. Sand, silt, and
clay contents were determined with the use of a hydrometer for
shelby tube samples at each of the study sites. The procedure used
is outlined in Appendix C.
A second method of hydraulic conductivity determination was
based upon textural analysis. A simple equation relating effective
grain size to permeability was used (Freeze and Cherry, 1979):
A= 1 for Kin cm/sand d10 in mm
d10 = effective grain size at which 10% by weight of the sediment particles are finer and 90% are coarser.
• C: I! .. .. E

48
This equation is suitable for textural app.roximation of hydraulic
conductivity for sediment in the range of fine sand to gravel.
Eleven shelby tube sediment samples were added to distilled
water (35 grams sediment to 1000 ml H20)·and stirred for four hours.
These samples were elutriated to determine the variability in
relative concentrations of ions that would readily go into solution.
The results of this elutriation were compared with analyses of water
samples from the unsaturated zone at the Texaco Gov't. (NCT-1) and
Apache Federal 1-5 sites to assist in determination of the depth
of leachate migration. The fluids derived from the elutriation
of sediment samples were chemically analyzed by the North Dakota
State Department of Health Laboratory.
I • I • I r

OVERVIEW OF GEOLOGY AND GEOHYDROLOGY IN
WESTERN NORTH DAKOTA
Regional Geology and Geohydrology.--Billings and McKenzie
Counties are located near the center of the Williston Basin and
are underlain by 15,000 feet (4570m) of sedimentary rocks ranging
in age from Cambrian to Recent. These strata overlie Precambrian
igenous and metamorphic basement rocks (Groenewold et al., 1979).
The surface and near-surface stratigraphy of southwestern North
Dakota is comprised largely of sediments of Paleocene age. These
sediments consist of alternating sands, silts, clays, and lignites,
The majority of drilling fluid pits in western North Dakota are
situated within either tbe Bullion Creek or Sentinel Butte Formations,
which include sediments that are fluvial, lacustrine, and paludal in
origin. The maximum thickness for each of these formations is
about 600 feet (200m) (Clayton et al., 1980).
Holocene alluvium, comprised of cross-bedded sands and
obscurely bedded silts and clays, is present along stream channels.
These deposits are of local importance along the major drainage
systems, such as the Little Missouri River.
The major aquifers in Billings and McKenzie Counties are the
Fox Hills-lower Hell Creek aquifer system, the upper Hell Creek-lower
Ludlow aquifer system, aquifers within the upper Ludlow-Bullion
Creek Formations, aquifers within the Sentinel Butte Formation, and
aquifers within alluvial deposits (Anna, 1981). 49
' I I • • • I C
r '
50
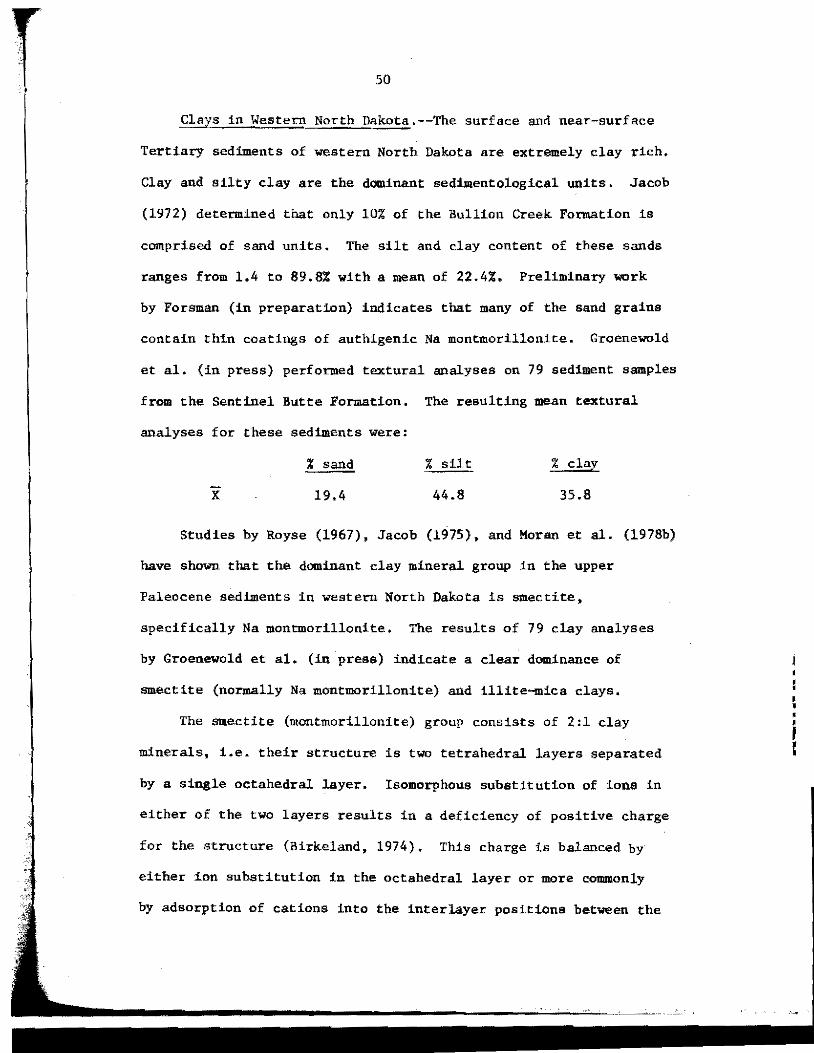
Clays in Western North Dakota.--The surface and near-surface
Tertiary sediments of western North Dakota are extremely clay rich,
Clay and silty clay are the dominant sedimentological units. Jacob
(1972) determined that only 10% of the Bullion Creek Fonnation is
comprised of sand units. The silt and clay content of these sands
ranges from 1.4 to 89.8% with a mean of 22.4%. Preliminary "°rk
by Forsman (in preparation) indicates that many of the sand grains
contain thin coatings of authigenic Na montmorillonite. Groenewold
et al. (in press) performed textural analyses on 79 sediment samples
from the Sentinel Butte Formation. The resulting mean textural
analyses for these sediments were:
X
% sand
19.4
% silt
44.8
% clay
35.8
Studies by Royse (1967), Jacob (1975), and Moran et al. (1978b)
have shown that the dominant clay mineral group in the upper
Paleocene sediments in western North Dakota is smectite,
specifically Na montmorillonite. The results of 79 clay analyses
by Groenewold et al. (in press) indicate a clear dominance of
smectite (normally Na montmorillonite) and illite"11ica clays.
The smectite (montmorillonite) group consists of 2:1 clay
minerals, i.e. their structure is two tetrahedral layers separated
by a single octahedral layer. Isomorphous substitution of ions in
either of the two layers results in a deficiency of positive charge
for the structure (Birkeland, 1974), This charge is balanced by
either ion substitution in the octahedral layer or more commonly
by adsorption of cations into the interlayer positions between the
' • I I

51
sheets. These cations are held rather loosely in the structure and
are exchangeable. This explains the smectite clay's relatively
large cation exchange capacity (Krauskopf, 1979).
2+ 2+ 2+ Divalent ions such as Ba , Ca , and Mg normally have a
+ stronger adsorption affinity than do monovalent ions such as K and
+ Na. The strongest affinity is for the Sm.!lller hydrated ions and
the weakest is for the largest ions. Laboratory experiments have
2+ + shown that Ca is adsorbed in strong preference to both Na and
Mg2+, and Mg2+ is selected in preference to Na+. These affinities
are highly dependent upon relative concentration levels of the
interacting ions (Moran et al., 1978b).
The exchange reactions between cations proceed very quickly
(Freeze and Cherry, 1979). These reactions continue until the
concentration of cations in the pore water and the cations adsorbed
onto the adjacent clay surfaces are in equilibrium. As the pore
water,flows through the clay or clayey sediments there is continual
readjustment by cation exchange to maintain this equilibrium. This
adjustment is relatively fast in comparison to normal subsurface
flow rates (Moran et al,, 1978b).
Groundwater Recharge.--The unsaturated zone is the interval
between the surface and the water table. The saturated zone lies
beneath the groundwater table. Groundwater recharge is defined
as that portion of infiltrating water which reaches the saturated
zone and begins to flow downward from the water table, In the
Northern Great Plains the depth to the saturated zone is often
several tens of metres (Rehm et al., 1982),
• I • • • • ~
T 52
Water at the surface (either from recent precipitation or snow
meJ.t) can either evaporate, transpire from vegetation, pond, or
infiltrate into the subsurface, The major controlling factors are
the permeability and moisture content of the sediment and the amount
of water available.
Water which has infiltrated into the unsaturated zone can
either continue its downward movement to the saturated zone or
remain within this zone. This water will eventually either move down
to the saturated zone with subsequent infiltrating water or be
removed from this zone by evapotranspiration.
Groundwater recharge can occur any time during the year. In a
recent study in west-central North Dakota it was shown that the
majority of gro·undwater recharge occurred during the months of
March and April when the concurrent evapotranspiration rates were
very small and runoff maximized (Rehm et al., 1982). Evapo
transpiration rates are lowest to nonexistent in the late fall and
throughout the winter but precipitation is low or in the form of
snow. These rates slowly increase during the spring and normally
reach peak amounts d,iring August,
Potential spring recharge is directly related to the accumulation
of snow from the previous 4 to 5 months and recent precipitation.
The accumulated snow is often not available for groundwater recharge
until the last week of March when the mean daily air temperatures
rise above the freezing point (Rerun et al., 1982),
I • • f
( •

53
Commencing in November, the ground normally begins to freeze
from the surface downward. The maximum depth of frost is normally
5 to 8 feet (1.5-2.Sm) below a vegetated surface and 9 feet (2.7m)
beneath a vegetation free surface. This 'frozen soil is not
necessarily impermeable as evidenced by observed rises in the
water table during spring melt. The rise often precedes the
completion of thawing in the shallow subsurface. Frozen soil
exists as four major structures, the least p<>rous of which is
normally found beneath vegetation free soil. This frost will begin
0 to melt when the air and soil temperatures rise above O C and will
be completely thawed within a thirty- to fifty-day per~od (Rehm,
et al., 1982).
Hydraulic Conductivity.~Hydraulic conductivity is a
quantitative measurement of the ability of a material to transmit a
fluid. Within the saturated zone this measurement is a function of
the permeability of the sediment and the density and viscosity of
the fluid.
Within the saturated zone of a shallow unconfined aquifer
there are normally two major components of flow, One of the
components of flow is lateral and in the direction of decreasing
water table elevation. The second is a downward component (for a
recharge area) and is commonly the dominant flow direction (Moran
et al,, 1978a).
Water within the unsaturated zone is held in the soil pores
by surface tension forces. As the moisture content of the sediment
increases, this holding force decreases. When this force is
• I • • • ' ' , • •
54
exceeded, the water will flow downward under the force of gravity
or laterally if a perched saturated zone forms above a horizontal
zone of low permeability. The hydraulic conductivity of unsaturated
sediment increases as the moisture content increases. The
hydraulic conductivity is also a function of the pressure head
(Freeze and Cherry, 1979).
The determination of hydraulic conductivity within the
unsaturated zone requires a pressure head measuring device, such as
a tensiometer, and measurement of the moisture content of the
sediment. These values are extremely var.iable with time and create
a wide range of hydraulic conductivity values for a given sediment
within this zone.
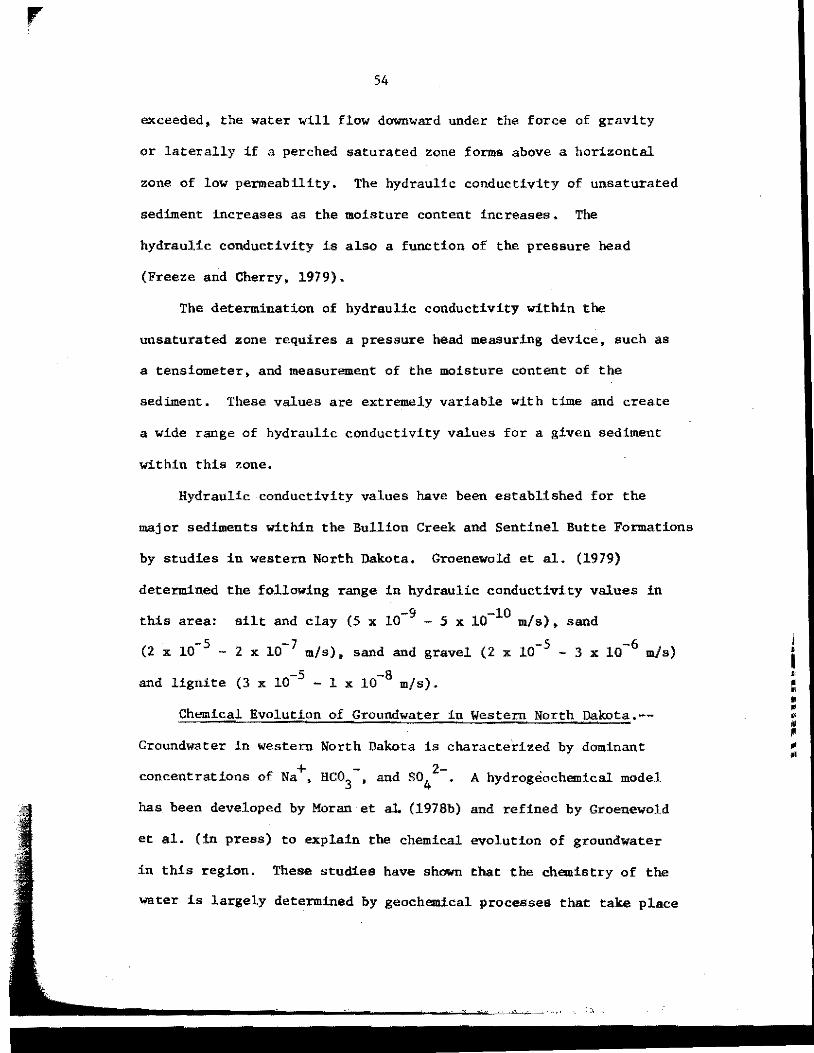
Hydraulic conductivity values have been established for the
major sediments within the Bullion Creek and Sentinel Butte Formations
by studies in western North Dakota. Groenewold et al. (1979)
determined the following range in hydraulic conductivity values in
this area:
-5 (2 X 10 -
and lignite
silt and clay (5 x -9 -10 10 - 5 x 10 m/s), sand
-7 2 x 10 m/s), sand and gravel -5 -6 (2 x 10 - 3 x 10 m/s)
-5 -8 (3 x 10 - l x 10 m/s).
Chemical Evolution of Groundwater in Western North Dakota.-
Groundwater in western North Dakota is characterized by dominant
concentrations of Na+, HC03-, and so4
2-. A hydrogeochemical model
has been developed by Moran et al. (1978b) and refined by Groenewold
et al. (in press) to explain the chemical evolution of groundwater
in this region, These studies have shown that the chemistry of the
water is largely determined by geochemical processes that take place
I • I • • • • • • • ~
-..
55
in the unsaturated zone. These processes are dependent upon the
recharge pattern and mineral content of the sediment in this portion
of the landscape.
In western North Dakota, most of the rainfall and snowmelt
infiltrates into the unsaturated zone only a short distance before it
is removed by evapotranspiration. The oxidation of both organic
matter in the soil and iron sulfide by this infiltrating water
2-produces hydrogen ions and so4
• The oxidation of organic matter
is by far the dominant source of the H+ ion. Weathered sediments
appear to be the dominant source of the sulfate ions. This water is
+ now acidic, as a result of the H ion, and will dissolve any
carbonate mineral with which it comes in contact. The dissolution
~ -of calcite and ·dolomite will release Ca and HC03
into the pore
water. Most of this pore water in the unsaturated zone will
eventually return to the atmosphere by evapotranspiration. This
will cause the supersaturation level of Caso4
to be reached and
gypsum will precipitate in the shallow subsurface. This geochemical
model is also applicable in the absence of organic matter in the
soil (Groenewold et al., in press) (fig. 22).
During exceptional infiltration events, water will pass through
the geochemically critical near-surface zone and dissolve a portion
2+ of the accumulated gypsum. This will add high concentrations of Ca
2-ans so4 ions to the solution. HC03
ions will also be added from
carbonate mineral dissolution. As this water infiltrates through
2+ + the unsaturated zone the Ca ion will normally be replaced by Na
due to exchange on sodium montmorillonitic clays. The resulting
j •
' I • • ' • ' • • • "
56
Figure 22. A hydrogeochemkal model for the chemical evolution of groundwater in westem North Dakota. The predominant chemical reactions are presented for both the normal and exceptional rainfall and snowmelt events (frCJm Moran et al., 1978b and Groenewold et al., in press).

57
Normal Roinfol I or Snowmelt Event
I. Co2 Production
2. Pyrite Oxidation
3. Carbonate Dissolution
4. G~psum Precipitation
Evapolronspirotion causes salt accumulation in root zone
Exceptional Roinfal I or Snowmelt Event
I. Co2 Production
2. Pyrite Oxidation
3. Carbonate Dissolution
4. Gypsum Dissolution
5. Cation Exchange
Water fable Salts Flushed To Saturated Zone
~ ·~
I
• •

•
•
58
+ water is now characterized by dominant concentrations of Na,
2-so4 , and HC03
ions. This basic chemistry w:ill change little
after migration to the saturated zone (fig. 22). A detailed
discussion of this geochemical model is presented in Moran et al.
(1978b) and Groenewold et al. (in press).
I • I I
• • • • • = • •

GEOLOGY AND GEOHYDROLOGY OF STUDY SITES
Texaco Charlson Cl33 Well Site.--The site is underlain by at
least 60 feet (18m) of colluvium and alluvium (figs. 23 and 24).
Fluvial sediments include gravel composed entirely of subrounded
to sub-angular pebbles 0.16 to 2.4 inches (0.4 to 6.0 cm) in
diameter. The pebble lithologies include clinker, siltstone, and
claystone and appear to have been derived from the Bullion Creek
and Sentinel Butte Formations.
overlying the gravel layer is 30-40 feet (9.l-12.2m) of
colluvium and slopewash sediment eroded from steep slopes underlain
by the Bullion Creek Formation just to the south of the site. This
sediment includes sandy gravel, gravelly sand, sandy silt, and
silty clay. Fragments of both clinker and lignite range from
common to locally abundant and vary in grain size, corresponding to
the dominant grain size of the specific horizon. The source
location is substantiated by the general decrease in grain size
from south to north a.~d a decrease in abundance of the more
unstable fragments (i.e., lignite and poorly cemented sandstone
pebbles) in this same direction,
The water table of the unconfined aquifer beneath this study
site, which fluctuated over a range of 10 feet (3 .05m) in elevation
during the monitoring period between August of 1980 and November of
59
I
' • I • C • • • .. • " • ..

60
Figure 23. Map view of the Texaco Inc. Charlson Madison North Unit C133 Site. Water sampling instrumentation and earth resistivity stations are depicted.
~ Drilling fluid
0 or Silty clay
§
f '/ Sandy silt
LEGEND
f.:,;'J Sand ~
~§J Sandy gravel
• Lignite
E:.] Fill
Map View Profile
Piezometer
Soil water sampler
Resistivity station
Oil-and-gas borehole 0
A St.16
u
Reserve pit outline
Reclamation trenches
Groundwater table
Water level
~:;:=;;;~ ____ _y_ __ _
Elevation contours, (ft. above sea level)
Profile line of cross-section
Contact of alluvium and underlying bedrock
Contact of colluvilil!l and underlying bedrock
:sz "
Qc rec
figure 24. Geologic cross-section of the Texaco Inc. Charlson Madison North Unit Cl33 site. The configuration of the water table is shown for two separate periods. The line of profile is depicted in figure 23.

61
o, "2
\ ·t •
"' ~
\ • •
A o, 0.. •
• ~ • A'
~ • • • • f: • • ~
( • • • I --·----·
C.I.= 5ft.(l.5m.) -~m.
N().!!TH
~
8_70 I
• • I ! • • • d • .. d • Cl60 • ,.
j
'

62
1981 (fig. 25), is directly related to the level of Lake Sakakawea.
The fluctuating reservoir level correlates exactly with the
elevation of the water table which ranged in elevation from 1840
feet (560m) above sea level down to 1831 feet (557.Sm). Beneath
the bottom of the drilling-fluid pit the depth to the water table
fluctuated from 13-21 feet (4.0-6.4m) during this study period.
The direction of groundwater flow in this area is from south to
north. The gradient of the water table is 3 x 10⁻³ ft/ft (3 x 10⁻⁴
m/m) in a direction normal to the shoreline of Lake Sakakawea.
Texaco (Gov't. NCT) Well Site.--This site is underlain by
approximately 20 feet (6m) of colluvium (figs. 26 and 27) which
varies in grain size from medium sand to clay but consists predomin
antly of silt. ·Fragments of lignite and clinker are common throughout
this deposit.
Underlying the colluvium are sediments of the lower Sentinel
Butte Fol:lllation. The dominant Sentinel Butte lithologies are sands,
clays, and lignites. The sands are comprised of poorly cemented
fine- to medium-size sand grains with varying percentages of silt.
The clays range from silty to very silty and vary in color
from light gray to light blue-green. The degree of induration is
highly variable, ranging from extremely well to poor, The lignites
vary in both induration and in percentage of clay partings. The
middle coal (2351-2355 ft. [717-718mJ above sea level) is highly
indurated.
Monitoring of the five piezometers installed indicates that the
water table was never reached at this site. Two piezometere (A3
and
I I
• ' • • • • • • • • • • • • • •

I
' 1U •• •1: •• ""' .,, ,..,,, '"'' il'iUt .... lf'' ,i::::
63
Figure 25. Correlation of the Lake Sakakawea water level and the groundwater table elevations at the Texaco Charlson Madison North Unit Cl33 site. Data is presented for August of 1980 through November of 1981 (from National Oceanic and Atmospheric Administration, 1981 and U.S. Army Corps of Engineers, 1981}.

1839
1838
1837
1836
1835 I- -w w 1834 I.L.
z 1833
z 1832
0 -I- 1831 <t > -w ..J 1830 w
1829
1828
64
{\ I
I \ \ I
I
!AlslolNlofJlF!MIAIM!J!JIA!slolNIDIJI 80 81 81 82
---- LAKE SAKAKAWEA -- · - WATERTABLE ( 012)
I
: =
' "
r ,:~-
- l I
I
' • • 11 •• tc ... -· •• ••• 1a111 .... ....
Ir" 1c:
65
Figure 26. Map view of the Texaco Inc. Government "A" (NCT-1) site. Water sampling devices are depicted (for legend see figs. 23 and 24).
Figure 27. Geologic cross-section of the Texaco Inc • Government "A" (NCT-1) site. The water levels for A10 and A13 are depicted (not groundwater table). The line of profile is shown in figure 26 (for legend see figs. 23 and 24).

C.I., 5ft. ( 1.5m.)
SOUTHWEST A
E.V. lN Fl!l!T
66
-------------------~--------------------------------------------------------- -------~---------------=----_:-_-_-:_-:.:-_-_:-__ -_-_-::..--:..-::..- 10 -------------------------------~--------------------------- ------------------ --------------------------------------------------- ---~~-
• = : " = .. .. .. :I ,. "' :: :-

67
Ai2
) have never contained water indicating that, barring improper
installation, the screened intervals are above the zone of
saturation. The elevation difference between water levels in two
other piezometers (Ail and A13) ranges from 10 feet (3m) up to 16
feet (Sm) (fig. 27). Given the close proximity of these piezometers,
a possible explanation is that the screened intervals intercept
perched saturated zones in the clay. Joints and fractures may
result in differences in hydraulic conductivity in the unsaturated
zone and the formation of a perched water table; therefore, the
position of the true water table is unknown. Another possible
explanation is that the cement plugs were not properly installed
in either A11 and/or AiJ and therefore allowed water from the
perched water table to travel down the outside of the pvc and into
the screen interval.
A temporary perched water table (at a depth of 30 feet [9.2ml)
was found to exist in the silty sand layer above the middle coal.
The fifth piezometer (A4
) was installed with a ten foot (3m) screen
through this interval in a successful attempt to obtain water
samples· after periods of high precipitation.
Belco Petroleum (Sheep Creek lil-11) Well Site.--The reserve
pit was constructed in 6 to 7 feet (1.8-2.lm) of silt (figs. 28
and 29) overlying sediments of the Sentinel Butte Formation. An
underlying 9 foot (2. 7m) orange to gray silty clay layer contains
plant fossils. Below the silty clay layer is a 3 foot (0.9m)
coal seam that is moderately to well indurated and contains clay
partings. The underlying 30 foot (9.lm) clay is light gray to
• • • • • 1 ;
• • • •
68
Figure 28. Map view of the Belco Petroleum B.N. Sheep Creek #1-11 site. The reserve pit is outlined with dashes and the oil well pad with dot and dashes (for legend see figs. 23 and 24).
Figure 29. Geologic cross-section of the Belco Petroleum B.N. Sheep Creek #1-11 site. The line of profile is shown in figure 28 (for legend see figs. 23 and 24).

C.!. • 5ft. ( I.Om.)
WEST A
ELEV. !ff FUT
2320
69
2320
I I
l_ --------·----· ~. -233-0 ----
/ ~ 2?,40~
0 iOOft.
------------------------------- ----- -------------------- -------------- ------~--------- ------- -------
--------------------------------- ------------------------ ----------------------~·-~-~-~-~--~-~-~-~<-~-~-~-~:-~-~-~-r.-~-~-~~,~:-~-~.---;-----------------
I • • • • ' • • • • • • • = .. ..

70
blue-gray in color and varies from extremely well to W)derately
indurated.
A cemented zone was encountered in the subsurface at a depth
of 50 feet (15.2m). The auger was only able to penetrate this
zone a few inches, in spite of four separate attempts. The holes
were left open for two days but never contained any water, indicating
the saturated zone was not reached. Because of this barrier the
water table could not be reached during drilling and, therefore,
only soil water samplers were installed.
Apache (Federal #1-5) Well Site.~The Apache site is located upon
40-45 feet (12.2-13.7m) of Holocene alluvium (figs. 30 and 31) on
the flood plain of the Little Missouri River. At the base of the
alluvium a 3 to 7 foot (O. 9-2.lm) basal gravel unit consists of
subrounded 0.2 to 3.2 inch (0.4-8.0 cm) diameter pebbles comprised
predominantly of clinker, siltstone, and claystone derived from
Paleocene formations. The gravel layer is moderately to poorly
sorted. The alluvium sediments form a fining upward sequence
from the basal gravel layer to a sandy clayey silt. The amount
of lignite and clinker fragments is extremely variable throughout
these deposits.
The alluvial deposits are underlain by sediments of the Bullion
Creek Formation. The upper part of the section consists of at
least 20 feet (6.lm) of light blue-gray to light blue-green silty
clay in the area beneath the drilling pad. Two lenticular beds of
medium-grained sand are located at this horizon east of the drill
pad. The lower sand bed is most likely present at a greater depth
• ' • • • • • I • • • • "

7l
Figure 30. Map view of the Apache Corp. Federal Hl-5 site. The 1979 reserve pit is shown in dashed outline, the 1981 reserve pit is shown with a solid line (for legend see figs. 23 and 24).
Figure 31. Geologic cross-section of the Apache Corp. Federal Hl-5 site. Piezometers c5, C, and C11 were destroyed during reconstruction of the pad tor the 1981 re-entry. The line of profile is shown in figure 30 (for legend see figs. 23 and 24).

-72
•
• ' ' '
• c.a// .c12 •
c, ~, •c13c • , en lgr,e
, 13A ,..., •
8 .. •
C.I. = 5ft. { i.5m.)
s=9ou.
• •
•
•
•
• \ J; I
IOO!t
!!Om.
~!
I IOO"'
• 800 • I • • • • I
• " ,, • • • I
' • • ,

)
73
to the west.
The depth to the water table ranges from 35.5 feet (10.Bm)
along the western edge of the study are.a to 28 feet (8.Sm) in the
eastern portion. The depth to the water table from beneath the
t:wo drilling fluid pit bottoms is approximately 23 feet (7.0m).
The depth of the water table from the bottom of the unlined
drilling-fluid filled trenches varies from approximately 15 feet
(4.6m} for the 1979 trenches to 10 feet (3.0m) for those excavated
in 1981. The water table of the unconfined aquifer beneath the
study site has declined an average of 6 inches (15 cm) during this
project. This minor decline is apparently due to the abnormally
low amount of precipitation recorded over the period of study.
The direction of groundwater flow is from southwest to north
east. The gradient of the water table averages 2 x 10⁻³ ft/ft
-4 (2 x 10 m/m) within the area of study. • I • • • • • • • • • • I 1 .. ..

RESULTS
Precipitation at Sites During Study Period.~Precipitation was
estimated at the four study sites between August of 1980 and
November of 1981 using monthly totals from nearby U.S. Weather Bureau
gauging stations. Three of the monitored sitea (Belco Corp.,
Texaco-NCT, and Apache Corp.) are in close prox:lmity to the Trotters
3 se gauging station. The Texaco Charlson site is in an area
monitored by the Keene gauging station.
During 1981 the Keene station recorded 16.52 inches (41.96 cm)
of precipitation (fig. 32). The mean annual precipitation for this
station over the last twenty-eight years has been 15.35 inches
(38.99 cm). Therefore, the amount of precipitation that fell in
and around the Texaco Charlson Cl33 site during the study period
was slightly more than an inch (2.5 cm) above normal. Ten inches
(25.4 cm) of this moisture fell during the months of June and July
(fig. 32).
The Trotters 3 se station recorded only 9,87 inches (25.07
cm) of precipitation during 1981, This was nearly five inches
(12,7 cm) less than the twenty-eight year annual mean of 14.36
inches (36.47 cm), The precipitation that fell on the Texaco NCT;
Belco Corp., and Apache Corp, study sites during this period was
the fifth lowest· amount in the last twenty-nine years (fig. 32),
74
• ' • • '
•

,.
75
Figure 32. Annual and monthly precipitation totals from the Trotters 3se and Keene gauging stations. Annual precipitation is for the years of 1954-1982, Monthly precipitation is for the period of June 1980 through May 1982 (from National Oceanic and Atmospheric Administration, 1981).
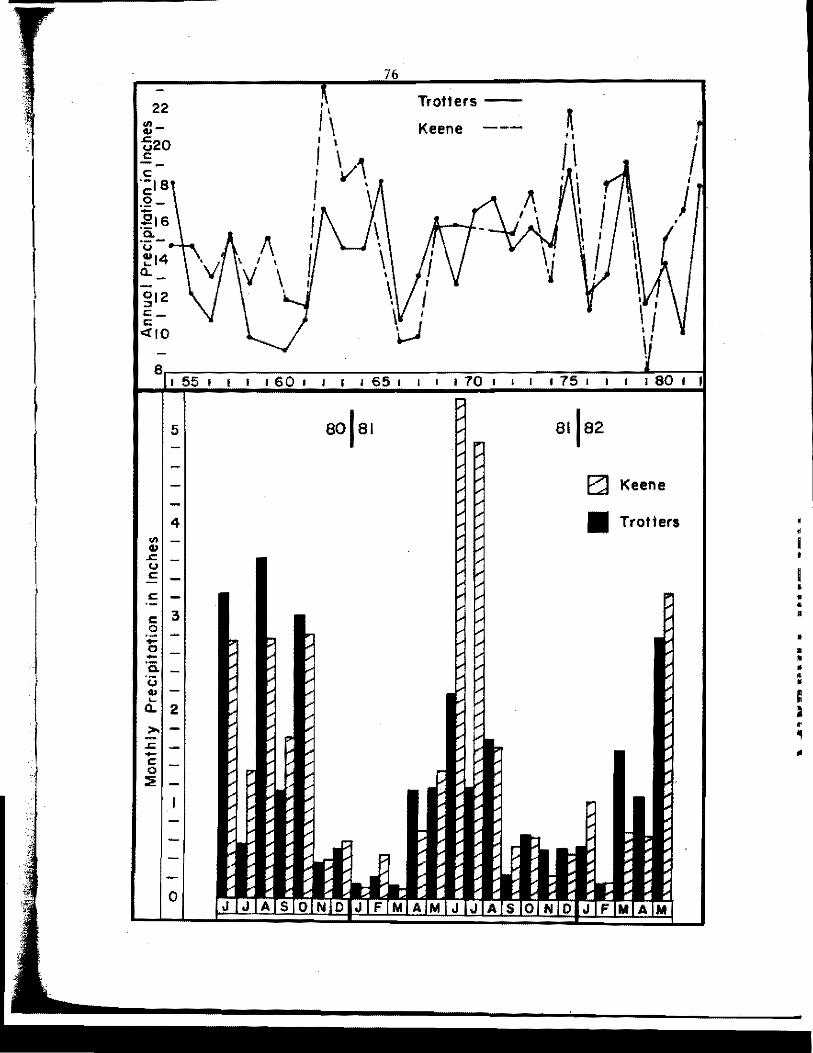
22
::-'520 C
C: ·-1s C .9--,g1s .9--u ~14
Q..
012 :, c_ C <:tlO
8
f
I 55 I
5
4 .. QI
.i:::. -u C
C ·-C 3 0 .... 0 -·a
·c:; QI '-
Q.. 2 >
.i:::. -C 0
'1 ~
0
76
I I
I \ I I
I 'v,, t
I ' \ t
I I\ t
\ I \ I V \ •
I I I 60 I I I I 65 I
Trotters --
Keene
I I I 70 I I I
I
I '
) I
l I
\ I
\ I I
\ I \'
I 75 I I I I 80 I
81,82
EJ Keene
• Trotters
J J AS ONO J FMAM J JASONO J FMAM
I • • • • • • • • :

I
77
Groundwater Recharge at Sites During Study Period.--Ground
water was monitored at the two study sites which have shallow
groundwater tables (Apache Federal 1-5 and Texaco Charlson Cl33).
Water-level readings were taken a total of 8 times over a span of
16 months. Difficulties in travel to each site and the frequent
inaccessibility of water level tapes made monthly readings
impractical. In the absence of monthly control, quantitative
recharge data could not be determined for each site,
The wster table remained relatively constant during the period
of study at the Apache Federal 1-5 site (fig. 33). Most of the water
levels declined slightly during the interim from August of 1980
through July of 1981. The levels then slightly increased through
the end of the monitoring period. A portion of the October 1981
precipitation could have resulted in groundwater recharge because
of the coinciding low to negligible evapotranspiration rates.
Below-average recharge is believed to have taken place in the
spring of 1981 and very little, if any, took place again until
October of that year.
The water table at the Texaco Charlson Cl33 site fluctuated
significantly during the study period (fig. 34). As previously
discussed, these changes correlated precisely with the fluctuating
water levels of the adjacent Sakakawea Reservoir (fig. 25). The
water table fluctuations also correlate with precipitation during
the months of June and July. Although significant amounts of
precipitation infiltrated to the saturated zone during this time,
the 5 foot (1.5m) water table rise is attributed to the adjacent
I I
' ' • • • • • • • ~ ;
•

r
' . ' 1 -~ I
~!1 ... , ••1' 11111~ ' ... '
78
Figure 33. Water table levels and monthly precipitation totals for the Apache Corp. Federal #1-5 site. Monitored from August of 1980 through December of 1981. Quarterly water sampling dates indicated by(+).
Figure 34. Water table levels and monthly precipitation totals for the Texaco Inc. Charlson Madison North Unit Cl33 site. Monitored from August of 1980 through December of 1981. Quarterly water sampling dates indicated by(+). Well number n
9 is believed to have a faulty screened interval.

-25 +
::i:: -l-o.. I.I.I -0
79
+
ri i
!
1980
+
APACHE FEDERALl-5
+ +
• lc,2
• • • 1 Cl3C
• •
i n
1981
TEXACO CHARLSON Cl33
+ +
6
+A-;;--t-;S~-;:O:+N:-:--t-;;:--!==t--=--t=:=c:=i--=:..+:--:M+-4-J--l--Jl1t::::~--I-D-i' o 1980
• • C • ~ • • .. •

80
rise of the reservoir.
During the study period the shallow groundwater flow at the
Texaco Charlson Cl33 site was to the north. The reliationship
between the local water table and the reservoir level could produce
a reduction in gradient and even a reversal in the groundwater flow
direction. This could occur as a result of a higher lake level.
No recharge data is available for the Texaco Gov't.(Ncr-1) and
Belco Petroleum Sheep Creek 1-11 sites because the saturated zone
could not be reached to be monitored. Considerably less recharge
is believed to have occurred at these two sites, in comparison to
the Apache Federal 1-5 sites, because of their greater depth to
the water table.
Textural Al;lalyses.--A total of 57 sediment samples from the four
study sites was texturally analyzed (Appendix C). The mean sand,
silt, and clay ratios for each site are:
% Sand % Silt % Clay·
Texaco Gov't. NCT-1 14.7 43.7 41.6
Belco B.N. #1-11 5.8 50.5 43. 7
Apache Federal #1-5 15.6 55.8 28.6
Texaco Charlson Cl33 22.8 44.6 32.6
The mean and effective grain sizes were determined for the sand
and sandy gravel layer at both the Apache and Texaco Charlson site.
The resulting sediment size in mm is:
Apache Federal #1-5
Texaco Charlson Cl33
0.177
0.153
3.0
3.9
• I
I • ' • • • • • • • • • I : -• I
-

81
Hydraulic Conductivity.--Hydraulic conductivity values for
sediment within the saturated zone at the Apache Federal #1-5 and
Texaco Charlson Cl33 sites are presented in figures 35 and 36.
These values were derived from single-well-response tests, textural
analyses, and from published data on similar sediments in this area,
The saturated hydraulic conductivity values for the sandy gravel
layers at these two sites ranged from 2,0 x 10⁻⁴ to 5.2 x 10⁻⁶ m/s.
-5 The values for the silty sand deposits ranged from 1.0 x 10 to
1.0 x 10⁻⁶ m/s.
Water Analyses from the Unsaturated Zone,--A total of 119
individual water samples was analyzed by the North Dakota State
Department of Health. One hundred of these were analyzed for both
trace metal and major ion content. The water sample analyses are
listed for each study site in Appendix D, These samples were
obtained from the unsaturated and saturated zones,
Profiles of 20 chemical parameters from the Texaco Gov't.
(NCT-1) site are presented in figure 37. The values plotted are
the means of quarterly water samples from the unsaturated zone. A
number of parameters had extremely high concentrations in the pore
water beneath the reserve pits: TDS (152,000 mg/L), Cl- (91,250
mg/L), Na (60,300 mg/L), N03 - (264 mg/L as N), As (93 ug/L), Cr
(98.2 ug/L), and Pb (619 ug/L). These maximum concentration levels
were attained by most constituents (excluding N03-) 4 to 6 feet
(1.2-1,Sm) beneath the bottom of the buried drilling fluid, Most
of these concentrations had been reduced significantly in pore
I
• I • • • • • • • • • • • I C a • • *

82
Figure 35. Ranges and means of hydraulic conductivities at the Apache Corp. Federal #1-5 site. The values presented are for sediment under saturated conditions (for lithology see figure 31).
Figure 36. Ranges and means of hydraulic conductivities at the Texaco Inc. Charlson Madison North Unit Cl33 site, The values presented are for sediment under saturated conditions (for lithology see figure 24).
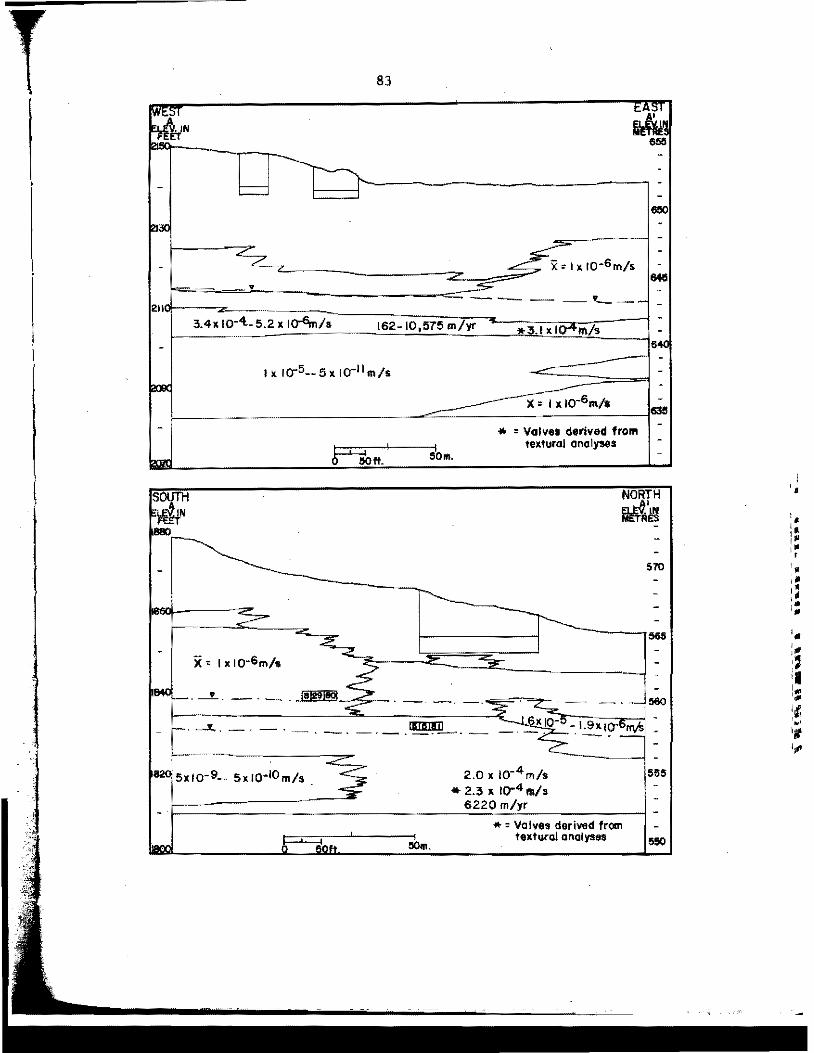
83
-- -- --·--211~ ....
3.4x 1o·'l. s.2 x 1o-6m;. 162~ 10,575 m/yr *3-,_1-,--c1-=--r-111-;-r,---1
X = I x 10-6111/$ ______________ _-,:;=::_-----------l'se
50m.
X, Ix 10-6m/s
* = Valves derived from i.xturol analyws
NORTH
rJlrt~
570
. ......'l.. -- . -· --- mllll __
. a<IO ~c---c-~..----<
-1.9x10⁻⁶rrv1>: --.
5x10⁻⁹._ s,10-IOm/s ~ 2.0 X IQ·4 m/s * 2.3 X 10⁻⁴ m/$
6220 m/yr
*=Valves derived from textural analyses
555
550
I
'• '• ,, l• ,• r
• • •• ,• ,• • ••
" .. ill ...
84
Figure 37. Concentration profiles for various parameters in pore water within the unsaturated zone at the Texaco Inc. Government "A" (NCT-1) site. Position of soil water samplers indicated by(*). For lithology see legend for figure 24 •
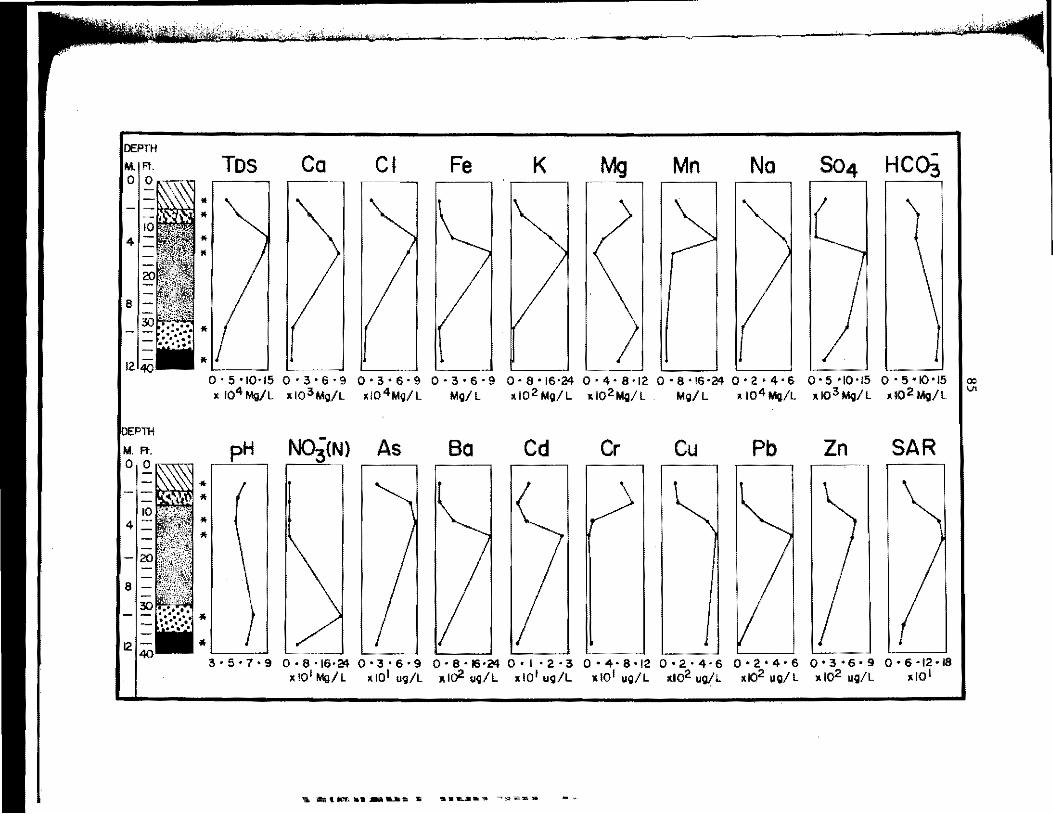
DEPTH
PTH M. Ft.
o,~~~
-10
41= ---,20 8 -
121-40
* ..
... .. .. ..
*
l' ~., ... ,.,.:C', '-y;;i,i/ ~------ , • · ,io·AAwn:llifll ~
Tos Ca Cl Fe K Mg Mn Na S04 HC03
0·5•10•15 0·3·6·9 0•3•6·9 0•3•6·9 0•8•16·24 0•4·8•12 0·8·16·24 0•2•4•6 0•5•10•15 0·5•IO•J5 x J04Mg/L x103MQ/L xl04M\)/L MQ/L xl02MQ/L xl02MQ/L MQ/L xl04MQ/L xl03MQ/L ,102MQ/L
pH N03(N) As Ba Cd Cr Cu Pb Zn SAR
3 • 5 • 7 • 9 0 • 8 • 16• 21! 0 • 3 • 6 • 9 0 • 8 • IEVi!4 0 • I • 2 • 3 0 • 4 • 8 • 12 0 • 2 • 4 • 6 0 • 2 • 4 • 6 0 • 3 • 6 • 9 0 • 6 • 12 • IB x101 Mg/L x1ol ug/L ,u:>2 uQ/L ,101 ug/L ,101 uQ/L x102 uQ/L xl02 ug/L ,102 ug/L xl0 1
, aatn,••--._..• s ••&..J1•• ~st ........
0:,
'-"

86
water within 20 feet (6.lm) of the base of the buried fluid; TDS
(17,300 mg/L), Cl- (2750 mg/L), Na (5355 mg/L), As (26 ug/L), Cr
(3.2 ug/L), and Pb (S.5 ug/L). The pore water in the unsaturated
zone at this site is slightly acidic.
Profiles for chemical parameters from the Belco Petroleum B.N.
Sheep Creek #1-11 are presented in figure 38. The values plotted
for the 20 chemical parameters are the mean values of quarterly
water samples from the unsaturated zone. The maximum concentration
levels of most of these ions were found at a level 2 feet (0.6m)
beneath the bottom of the buried drilling fluid: TDS {136,000 mg/L),
cC (81,250 ,,;g/L), Na (57,950 mg/L), As (80.4 ug/L), Cr (5.6 ug/L),
and Pb (540 ug/L). Most of these concentrations had been significantly
reduced within a depth of 8 feet (2 .4m) beneath the drilling fluid:
TDS (29,950 mg/L), Cl (13,133 mg/L), Na (8800 mg/L), As (24. 3 ug/L),
Cr (5.4 ug/L), and Pb (93 ug/L). The pore water throughout the
unsaturated zone at this site is slightly acidic.
Only one water sample was recovered from the unsaturated zone
at the Apache Federal 1-5 site (c10
, Appendix D). This sample was
obtained from 10 feet (3m) beneath the bottom of the reserve pit,
20 feet (6m) beneath the surface. The concentrations of many
parameters were very high at this depth: TDS (53,200 mg/L), Cl
(25,000 mg/L), Na (17,900 mg/L), N03
- (203 mg/Las N), As (43.3
ug/L), Cr (18.9 ug/L), and Pb (188 ug/L). The pH of this pore
water was 6.5.
At the Texaco Charlson Cl33 site water samples were recovered
from depths of 3 feet (lm) and 10 feet (3m) beneath the base of the
' • l

i ,,
87
Figure 38. Concentration profiles for various parameters in pore water in the unsaturated zone at the Belco Petroleum B.N. Sheep Creek 11-11. Position of soil water samplers indicated by(*). See legend of figure 24 for lithology.

iilfi\ r 1Vn1, , ___ ~-- • .,1,'r'''*lWIHl ~
c:EPTii
M. Fl. 010~
EPTH
M. Fl. o,o~
2
IO p;.,.•;.-~
•
*
" •
"
" * *
Tos Ca Cl Fe Mg Mn K Na S04 HC03
o • 5 • 10 • 15 o • 2 • 4 • s o • 3 • s , 9 o • z • 4. s o • 5 • 10 -15 o • 2 • 4 • s o • s • 12, 1s o • 2 • 4 • s o • 3 • s • 9 o • 4 • s • 12 I gi xl04Mg/L xl03Mg/L xl04Mg/l Mg/L xl02Mg/L Mg/L xJ02Mg/L xt04Mg/l xl03Mg/L xlo2Mg/l
pH N~~(N) As
\ \ \ \
\ \
\
I
Ba
\ \ \
\ \
Cd
\ \
\ \
\
Cr Cu Pb Zn SAR
\ \ \ \ ' \
\ \ \ \ \ \
??? J •3•5•7 0•4•8•12 0•3•6•9 0•2 •4•6 0•2•4•6 0•2•4•6 0•2•4•6 0•2·4·6 0•2•4•6 0•6•12·18
xlOIMg/l xto 1 ug/L ,102u;/L ,10 1..g/L ug/L x102ug/L xl02ug/L x1olug/L xtol
11., 1t 'IJ'l •• .._ ... • ••--•• • •••
89
reserve pit (D7
and n8
, AppendiJ< D). The concentrations of many
parameters did not decrease as expected but commonly increased
within this interval; TDS (19,000-26,200 mg/L), Cl- (10,000-12,000
mg/L), Na (5970-7470 mg/L), N03- (47.1-138 mg/L), As (18.5-26.5
ug/L), Cr (2.9-22.4 ug/L), and Pb (35-33 ug/L). The pore water
within this interval is slightly acidic.
Elutriation Experiment.--Ten sediment samples from the unsaturated
zones at the Texaco (NCT-1) and Apache Corp. Federal #1-5 were
elutriated.· The test was performed to obtain additional pore water
chemistry at these sites. Distilled water was used at a sufficiently
high solution-to-sediment ratio to minimize the possibility of ions
reaching the saturation point.
The concentrations of seven selected parameters in fluids
separated by elutriation of sediment samples at the Apache Corp.
Federal 1-5 site is presented in figure 39. The maximum
concentration-levels of many parameters were in fluids that had
either been mixed with drilling fluid or sediment that was from 3
feet (lm) beneath the base of the reserve pit. In this analysis
Cr ranged from 26.6 ug/L in the drilling fluid to 6.3 ug/L in
fluid mixed with sediment 7.5 feet (2.3m) beneath the reserve pit.
Chloride was reduced from 350 mg/L to 64 mg/L within this same
interval.
The water analyses of the elutriation experiments from the
Texaco Gov't. (NCT-1) site demonstrate a maximum concentration of
most of these parameters within the drilling fluid (fig. 40). Same
of· the parameters reach maximum concentrations in sediment 14 feet
• I • I
I
• ' ' • • • I t • • ' • • r -
f ., ... , ... , c:: ..
90
Figure 39. Concentration profiles for various parameters in elutriated sediment samples from the Apache Corp. Federal #1-5 site. Textural analyses were determined by the hydrometer method (Appendix C), The(*) indicates the depth the elutriated sample was taken from,(·) indicates the depth of the sediment for hydrometer textural analyses, See legend of figure 24 for lithology.
Figure 40. Concentration profiles for various parameters in elutriated sediment samples from the Texaco Inc. Government "A" {NCT-1) site. Textural analyses were determined by the hydrometer method (Appendix C), The depth of the elutriated sample indicated by(*) and the depth of the sediment samples for hydrometer textural analyses indicated by (•), See legend of figure 24 for lithology.

''LCC • ,,,i,. ,,~
M. 0
'TH
I, -
3
5
-5 ~
Fia.39
M Ft
TDS
TDS 0 I 0..-r-n .~----~
•
s -!!.: -.. : . I - ..... 10139 .:_;.; .. *I
•
Co Cl K Cr Se Zn 0
f 0 • 5 • 10 • 15 0 • 2 • 4 • 6 0 • 5 · 10' 15 0 • I • 2 · 3 0 • 4 ' 8 '12
fAV/ L ,102 mg/L tt11/ L ,101 uo/L ug/ L
Co Ct K No Mn S04
~
Fi~.40 0·1·2·a 0•2•4·& o-s-,0·1s 0-1-2,3 o·is·e·& o·a·&·9 o-•·a-12100
l la3mg/L lla2111g/L ,io21111/L ,101 mg/L ,1o2mg/ L , 1o·lmg/L ,102 •v/L
"- 'II{• \•SZ-..,.e!III.E QI •«.'=--•• .... _ ..
°lo SAND !Kl
50 0/oCLAY -
0/o_SAND [: .. :,;'!
"' ...

92
(4.3m) beneath the base of the reserve pit: TDS (2540 mg/L), Cl
(1380 mg/L), and Na (947 mg/L). The concentration of all of the
measured parameters was very low in the fluid mixed with sediment
from a depth of 64 feet (19.5m): TDS (264 mg/L), Cl- (5 mg/L),
and Na (104 mg/L).
The ion profiles (figs. 39 and 40) from the elutriation
experiment demonstrate a general decrease in concentration with
increased depth from the buried drilling fluid. Although the
results from this method do not necessarily represent the actual
pore water chemistry in the unsaturated zone, they do demonstrate
the reduction in leachate concentration as the distance from the
reserve pit increases.
Water Analysis from the Saturated Zone.--Isoconcentration maps
of 24 chemical parameters from the Apache Federal #1-5 site are
presented in Appendix E. These maps represent the groundwater
chemistry for the upper 10 feet (3m) of the saturated zone at this
site. These isoconcentration maps were constructed to enable
determination of the lateral extent of leachate migration within
this zone. The values plotted'are the mean of quarterly water
samples from the saturated zone. The background chemical con
centration levels were obtained from piezometers and shallow water
wells upgradient from the site. The highest concentrations recorded
for most parameters in the saturated zone were beneath the reserve
pit: TDS (12,100 mg/L), Cl- (4500 mg/L), Na (3520mg/L}, N03
- (< 2
mg/Las N), As (15 ug/L), Cr (1.8 ug/L), and Pb (26 ug/L). The
concentrations of all parameters returned to background levels
• I
' • • I • "' = • , • ..

93
within 200 feet (61m) downgradient from the reserve pit: TDS
(3610 mg/L), Cl- (13 mg/L), Na (944 mg/L), As (4.6 ug/L), Cr
(2.6 ug/L), and Pb (9.0 ug/L). The pH is slightly acidic (6.4)
within the effected zone to slightly alkaline (7.2) outside of
this area.
Isoconcentration maps of 24 chemical parameters from the Texaco
Charlson Cl33 site are presented in Appendix E. These maps
represent the groundwater chemistry for the upper 15 feet (4.6m)
of the saturated zone at this site. Background chemical con
centration levels were obtained from piezometers and shallow water
wells upgradient from the site. The highest concentrations recorded
for most parameters in the saturated zone, with the exception of
N03-, were recorded beneath the reserve pit: TDS (16,100 mg/L),
Cl- (4875 mg/L), Na (3940 mg/L), N03
- (1160 mg/Las N), As (22
ug/L), Pb (53 ug/L), and Se (272 ug/L). Most of these parameters
returned to background concentrations within a 300 to 400 foot
(91~122m) radius of the reserve pit: TDS (4810 mg/L), Cl- (38
mg/L), Na (766 mg/L), N03- (35.l mg/Las N),As (6.2 ug/L), Pb (.14
ug/L), and Se (<2 ug/L). The pH of the groundwater is slightly
acidic (6.5-6.8) within the effected area.
No water samples were obtained from the saturated zone at
either the Texaco Gov't. (NCT-1) or Belco Petroleum B.N. Sheep
Creek 1-11 study sites.
Apparent Resistivity.--Apparent resistivity values for the Apache
Federal #1-5 and Texaco Charlson Cl33 sites are plotted vertically in
Appendix F. Some of the lithologies and the water table depth are
I ' • • • • • • I : • • I • • = • ..

. I
I
94
discernible from the resistivity values of these profiles. However,
their detection is a function of the electrode spacing. The effect
of the drilling fluid in reducing the apparent resistivity values
can be observed in stations 16 and 21 of the Texaco Charlson site
(Appendix F).
These same apparent resistivity values are presented in iso
resistivity maps of the five electrode spacings at each site (figs.
41-44). At the Apache site a plume of low resistivity originates
in the reserve pit and extends in the direction of groundwater flow.
The low resistivity plume at the Texaco Charlson Cl33 site is large
and extends both upgradient and downgradient from the local ground
water flow direction.
In the presentation of the apparent resistivity profiles the
electrode spacing and depth of current penetration are depicted as
equal. This has been found to be generally true for electrode spacings
of less than 100 feet (30.5m) (Soiltest, 1968), This 1:1 ratio of
depth to electrode spacing has been demonstrated by a nwnber of VES
projects in Illinois (Cartwright and Sherman, 1972). However, the
presence of sedimentary layers with greatly differing resistivities
and/or saline pore water has been shown to distort the electrical
field and reduce the depth of current penetration (Reed et al.,
1981).
Chemical Composition of Drilling Fluid at Study Sites.--The
records of drilling activity and drilling fluid additives were no
longer available for the two oldest sites, Texaco Charlson Cl33
(1955) and Texaco Gov't. NCT-1 (1960). The records (mud
,, ..

,C: •:':II ··.. _, •• I
jf-. ··-1: I ... :111 . .,.-, . ..,-, ... -.. -~.W-'1 .......... .. ~. r .. -..... 1 ... , ......
95
Figure 41. Apparent resistivity stations and isoresistivity maps for electrode spacings of 12 and 30 feet (3.7 and 9.lm) for the Apache Federal f/1-5 site. The values for each station are given in Appendix F. see legend of figure 23 for symbols.

96
., •9 •I
•• •15
', s ' ) •14
,/ •l3 •19
' •• ' ' ,.., / •12
• 18
•
•
•
••• •20
. .,,
•
•
g
/. \
' \ I
I /
/
C.!.: 20ol'lm:ft
• • • • • • • • " = I
• • C .. .. = .. ,, .. ..

" ,,
97
Figure 42. Apparent isoresistivity maps for electrode spacings of 40, 60, and 80 feet (12.2, 18.3, and 24.4m) at the Apache Federal #1-5 site. The values for each resistivity station are given in Appendix F. See legend of figure 23 for symbols.
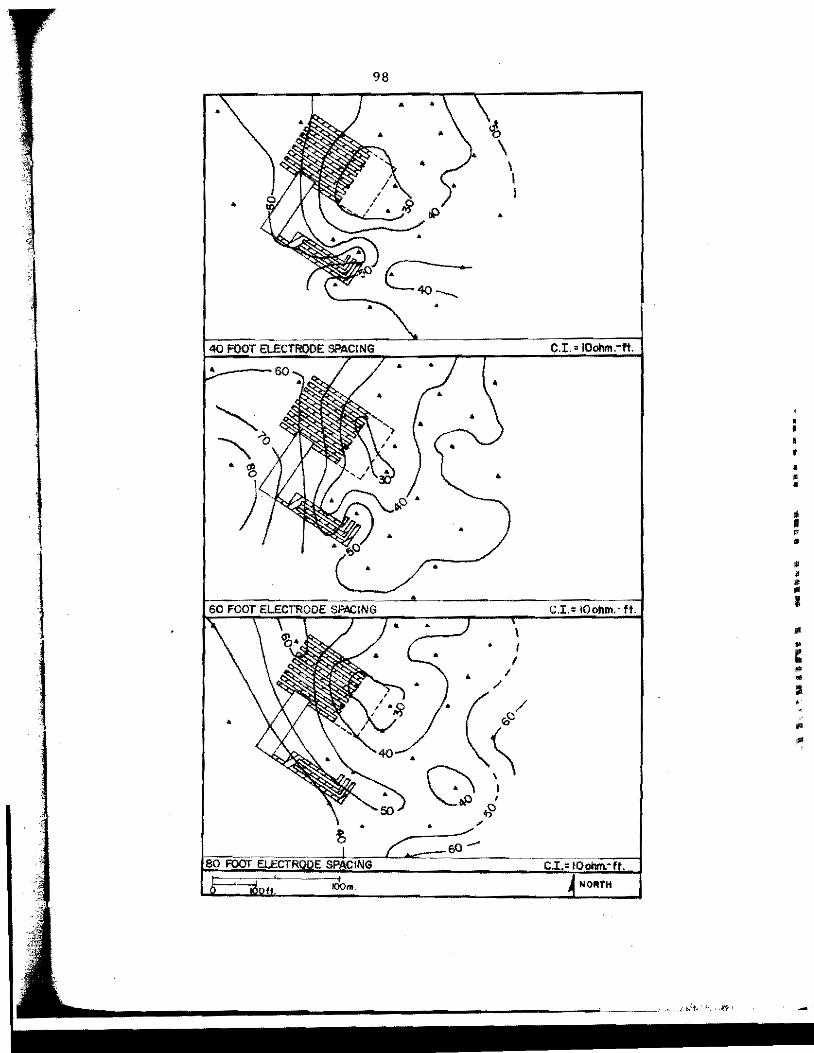
98
•
• \ I I
o? • J •
• •
40 FOOT ELECTRODE SPACING
·---- • • •
•
. ~ )
•
• •
• •
•
. . " t, ___ _,.,,.
,-=c-<1= ..... c=c.........o.:== €fl --so FOOT' El.ECTROOE $PACING ----
•.L; IOOm.
C.I., IOonm.·ft.
C.I.• IOonm.·ft .
c.I.• 1oo11m.·1 .
NORfH
• I
• • • • " I • • • • • -• " .. :I •
" ..
.. :,1"
""' ·~
99
Figure 43. Apparent resistivity stations and isoresistivity maps for electrode spacings of 12 and 30 feet (3.7 and 9.1.m) at the Texaco Charlson Madison North Unit Cl33 site. Values for each resistivity station are plotted in Appendix F. See legend of figure 23 for symbols.
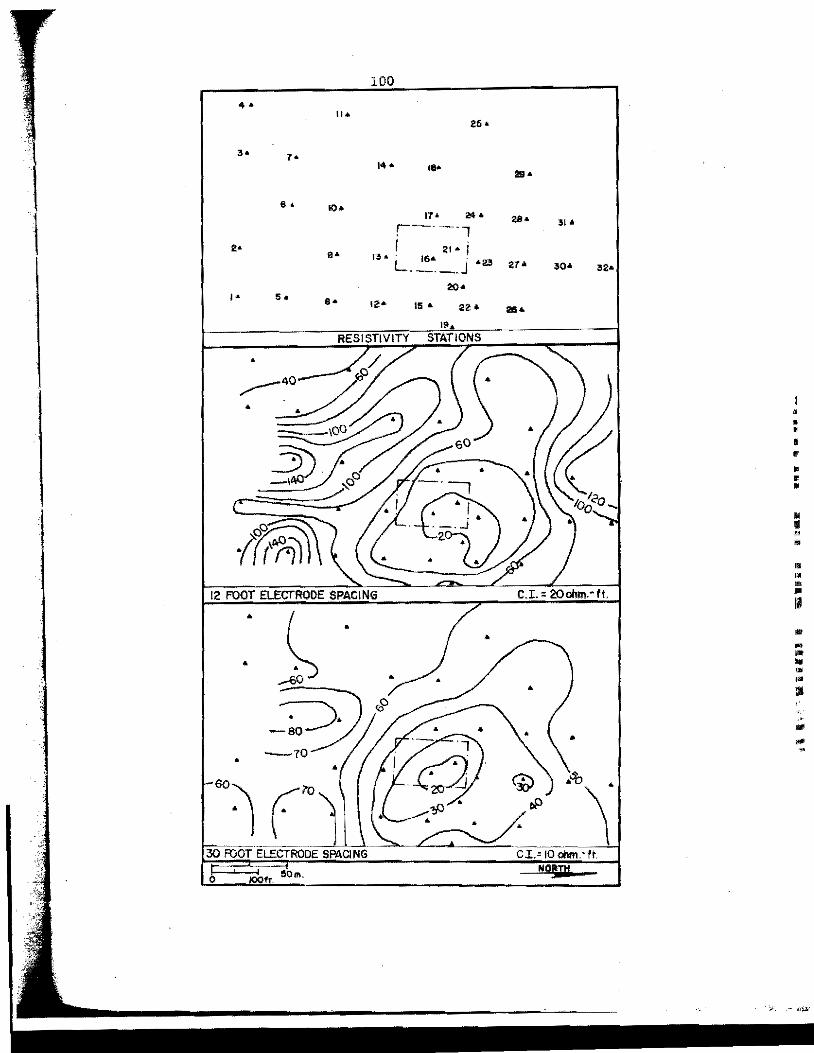
100
4• II•
25•
'l 3• ,.
14 • te•
•• IO•
1 17• ...
r-·-·, 2• I 21 • I •• 13• . 16• · L. ___ J •23
20• ,. •• •• 12• 15 • 22 •
•
•
•
0 ft. l50m.
29 •
a&• Ol •
27• >O• >2•
....
C.I. = 20omn.·ft
•
CI.=10"'1m.·ft N0!3J1
' • • ' • • • •
• I
" .. " .. " " II
.. .. .. .. .. ... ll ,,,. ,, . ..

' ., • " ...
-... C ...
101
Figure 44. Apparent isoresistivity maps for electrode spacings of 40, 60, and 80 feet (12.2, 18.3, and 24.4m) at the Texaco Charlson Madison North Unit Cl33 site. Values for each resistivity station are plotted in Appendix F. See legend of figure 23 for symbols.

1
I
102
•
•
40 FOOT ELECTROOE C.I.= 10 m.·ft.
• •
• ~ •
../ •
/ .,o •
• • •
60 FOOT ELECTRODE SPACING C I.=10 ohm,·ft.
• l__,----so----.._ •
•
'-. • @i "'o
• . .J • ~· -:; • \ 0 ~
l50m
• •• ,. • • ,. '
; '.• " .. '" = I
" ,,. • ... .. .. ii
.. .. \.-: ..

103
recapitulation sheets) were obtained for the Belco Petroleum and
Apache Corp. sites, The type and quantity of drilling additives
were estimated from these reports (Appendix G).
The concentration range for the chemical parameters from t:he
mud engineer's report at the Belco Petroleum and Apache Corp. study
sites is given in table 2. A sample of drilling fluid was taken
from the Apache Corp. Federal 111-5 just prior to the reclamation
of the site, The analysis of the fluid indicates that the majority
of the chemical parameters measured exceed the background levels at
this site by factors of 10 to 10,000 (table 2).
Sources of Error in Study.--There has been concern in recent
years for potential chemical biassing of water samples collected by
soil water samplers. The concern is with the ceramic cup through
which the water sample is drawn. The effective pore diameter of
this cup is approximately one micron, too small to allow the passage
of some colloids and bacteria, The concentration levels of some
trace elements and N03
- in the water samples may be limited or
reduced by adsorption by the ceramic matrix. Because of the
extremely high ion concentrations of the pore water sampled by these
devices, the effects of the ceramic cup were considered to be
negligible, The soil water samplers function irregularly and the
ceramic cup pores can become irreversibly plugged if not properly
inst.alled. The water sample recovery success was 39% during this
study.
The sand and sandy gravel layers at the Apache and Texaco
Charlson sites posed a significant problem to piezometer installation.
• • • • • • • • • m • • • • " -• • .. .. .. $ ... • .. .. •

104
Table 2, The range of selected chemical concentrations in drilling fluid and chemical analyses of the Apache reentry drilling fluid. The concentration ranges were obtained from mud engineer reports. The sample of Apache re-entry drilling fluid was taken from the reserve pit 48 hours prior to reclamation.
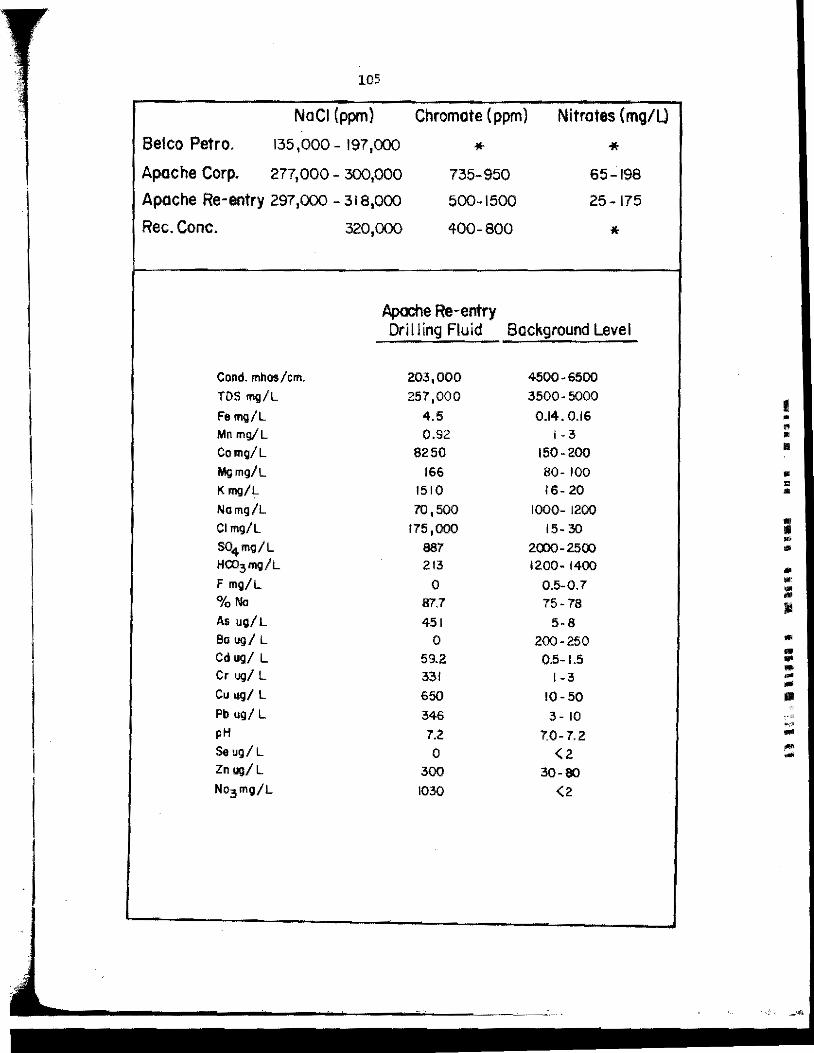
105
NaCl (ppm) Chromate (ppm) Nitrates (mg/U
Belco Petro. 135,000 - 197,000 * * Apache Corp. 277,000- 300,000 735-950 65-198
Apache Re-entry 297,000 - 318,000 500-1500 25-175
Rec. Cone. 320,000 400-800 *
Apache Re-entry Drilling Fluid Background Level
Cond. mhos /cm. 203,000 4500-6500
TOS mg/L 257,000 3500-5000 I
Fe mg/L 4.5 0.14. 0.16 • Mn mg/L 0.92 I -3
.. •
Comg/L 8250 150-200 II
Mgmg/L 166 80- 100 .. Kmg/L 1510 16- 20
~ .. Namg/L 70,500 1000- 1200 Clmg/L 175,000 15- 30
.. Ill
S04mg/L ..
887 2(X)()- 2500 .. HC03mg/L 213 1200- 1400 .. F mg/L 0 0.5-0.7 " "' %Na 87.7 75-78 -· Ill As ug/L 451 5-8 Ba ug/ L 0 200-250 .. Cd ug/ L 59.2
.. 0.5-1.5 •
Cr ug/ L ...
331 1-3 -"' Cu ug/ L 650 10-50 Ill Pb ug/ L 346 3- 10 ··'1 ., pH 7.2 7.0-7.2 ... Se ug/ L 0 <2
... ... Zn ug/L 300 30-80 No3 mg/L 1030 <2

l
I
106
The majority of auger holes collapsed and the piezometers had to
be pounded through these intervals. The thickness of these
collapsed intervals ranged frQ!ll 5 to 20 feet (1.5-6,lm). Because
of this collapsed sediment, the cement plugs could not be properly
installed above the screened interval. The improper sealing of
these pieZQ!lleters allowed the leachate in the gravel layers to
travel unobstructed through the auger hole backfill and into the
screened interval, This was apparently the case with piezQ!lleters
c7B and c13C at the Apache study site.
The basis for clay percentage determination by the hydrometer
method is the change in water density due to the suspended clay
particles. A very high NaCl content was found in the pore water
and sediments beneath the reclaimed reserve pits, There was concern
that this salt content would be sufficiently high to substantially
increase the density of the hydrometer tested water, This would
result in erroneously high clay percentages. A series of liquid
decantationswas suggested to reduce the NaCl content but was not
attempted because of possible loss of clay particles. The sediment
percentages obtained in this study are thought to be within the
normal margin of error for the hydrQ!lleter method,
' '
• I • • • • • • I
• • • • • • •
DISCUSSION
Attenuation of Dispersion of Leachate.--There are two main types
of drilling fluid leachate. The first is the initial less viscous
fluid component of the buried waste. This is the portion that is
supposed to be sucked out of the pit prior to reclamation, The
other is the leachate generated by infiltrating precipitation. Both
of these leachates are subject to the controls of the hydrogeo
chemical model that was described earlier. Evapotranspiration of
this leachate will cause the near surface accumulation of NaCl
crystals.
Exceptional precipitation events will flush the salt and leach
other soluble constituents from the buried drilling fluid. This
leachate will eventually reach the saturated zone and will flow along
with the groundwater. The nonreactive solutes, generally the
dissolved anions, will be carried at a rate equal to the average
linear velocity of the groundwater. Unless there is a constant
influx of leachate, the leachate plume in the saturated zone will
become increasingly dilute away from the source, This dilution is
largely a result of hydrodynamic dispersion, a mixing process caused
by the differences in flow velocity in the saturated porous medium.
M.olecular diffusion is another dispersive process where the ions
or molecules migrate under a chemical gradient from regions of high
concentrations to regions of low concentrations. This is a relatively
107
' • •
= • • • • • • I
• • • • • • • ·• ,,
• • •

108
slow process and is only illlportant under low groundwater velocity
conditions (Freeze and Cherry, 1979).
Transfer of the solutes from the porewater to the porous medium
retards the movement of the leachate plume. Chief among these transfer
processes is adsorption by clay minerals. A landfill study in
Illinois concluded that leachate had to travel through 700 feet
(213.4m) of sand to achieve the same attenuation provided by 5 feet
(1.5m) of clay till (Cartwright and Sherman, 1972). As discussed
earlier, these dissolved ions are discr:llllinately adsorbed as a
function of concentration, charge, and ionic radius. Foremost among
the most highly attenuated ions are the trace metals.
Initially, burial of the drilling fluid in the unlined trenches
produces leachate at a near-constant rate from the desiccation of this
drilling mud and the downward migration of the less viscous part of
the fluid. If emplaced above the water table, the buried drilling
fluid eventually will desiccate, after which leachate will normally
be generated only after exceptional rainfall or sno'W!llelt events.
This infrequently (seasonally) generated leachate will normally
be subject to attenuation on clay minerals in the unsaturated and
saturated zones and by dispersion in the saturated zone.
At both the Apache and Texaco Charlson sites the high clay content
in the unsaturated zone should retard movement of most of the ions by
adsorption onto the sediment matrix. Mechanical dispersion is assumed
to be the dcminant dilution process in the saturated sandy gravel zones.
Longitudinal dispersion is the prevalent dispersive process in the sandy
gravel layer at the Apache site (Appendix E). A groundwater gradient
E • • • I
• :!I
•
i .. .. • .. .. • I
• .. .. • .. .. • l ·• ., .. ..
109
reduction or flow reversal at the Texaco Cl33 site would explain the
shape and location of the leachate plume at this site. If the
groundwater flow has remained constant at this site, the configuration
of the leachate plume is most likely a result of longitudinal and
transverse dispersion in the saturated zone (Appendix E).
The chloride ion was selected for special attention during this
project for a number of reasons. The normal concentration level for
the chloride ion in the shallow groundwater systems of western North
Dakota commonly ranges from a few to several tens of milligrams per
litre (Groenewold et al., 1979). The ave~age concentration of the
chloride ion in oil-and-gas well drilling fluids in North Dakota is
150,000 mg/L (table 2). In addition, the chloride ion is a mobile
anion in the soil system. This low susceptibility to attenuation is
attributed to the relative noninteraction between clay minerals and
the chloride ion (Griffin et al., 1976). The extremely high
concentration of chloride ions in drilling fluid and its mobility in
the subsurface inake it an excellent indicator of leachate migration.
This ion can generally be used to monitor the maximum extent of a
drilling fluid generated leachate plume in western North Dakota.
Leachate Migration at the Texaco (NCT-1) Site.--The chemical
profiles from the Texaco (NCT-1) site (figs. 37 and 40) indicate
that many of the ions are being leachated out of the buried drilling
fluid. There are a number of trace elements present in high con
centrations in the pore water from the buried drilling fluid to a
depth of 5 feet (1.5m) beneath the reserve pit: As (93-88 ug/L), Pb
(619-253 ug/L), and Zn (726-655 ug/L). These elements are assumed to
I ' • • I
•
; • • • • = I
• .. • • • • • J • ., • ..

I 110
have been adsorbed onto clay surfaces within the clayey silt interval
and are much reduced in concentration in pore water samples from a
depth of 30 feet (9.lm): As (26 ug/L), Pb (8.5 ug/L), and Zn (125
ug/L).
Relatively high concentrations of Pb (104-137 ug/L) and Cl
(9250-5250 mg/L) are present in groundwater from piezometer A-ii at a
depth of 72 feet (21.9m). These concentrations are believed to be
the result of leachate traveling down through the annulus to the
screened interval in the improperly sealed bore hole and do not
represent the true pore water at this level. This assumption is
substantiated by analyses of pore water collected at depths of 20
feet (6m) beneath the reserve pit. This pore water contained Cl_
concentrations of only 2750 mg/L.
Leachate Migration at the Belco Petroleum R.N. Sheep Creek
#1-11 Site.--The chemical profiles for the Relco Petroleum study
site indicate a maximum concentration of most of the ions within a
depth of 2 feet (0.6m) of the buried drilling fluid. The chJ.oride
ion content is reduced from 93,700 to 12,000 mg/L within the zone
from the buried drilling fluid to a depth of 8 feet (2,4m). Within
this same interval As is reduced from 163 to 24 ug/L and Pb from
1320 to 93 ug/L. The reduction in concentration of these and other
ions in the pore water within the unsaturated zone is attributable
to attenuation by clay adsorption.
The Texaco {NCT-1) and Belco Petroleum R.N. Sheep Creek #1-11
study sites are very similar geologically and geohydrologically.
As the distance away from the reserve pit is increased in the
C " • • I
•
• I • • • .. ~ • I
• .. .. • • .. Ill
: ' "I .. ..

,. ' I '
111
subsurface, there is a significant reduction in ion concentration in
the pore water. This reduction is assumed to be the result of ion
attenuation by exchange on clay minerals. This reduction should
continue throughout the thick unsaturated zones and, therefore,
very little if any leachate should reach the water table at these
sites.
Leachate Migration at the Apache Federal #1-5.~The water
sample from the unsaturated zone at the Apache site contained high
concentrations of Cl- (25,000 mg/L), N03
- (203 mg/Las N), and Pb.
(188 ug/L). The elutriation experiment demonstrated that leachate
decreased in concentration as the depth from the reserve pit
increased. In the saturated zone beneath the reserve pit the
concentrations of these ions are much reduced: Cl- (3750 mg/L),
N03
- (<2 mg/Las N), and Pb (10.0 ug/L). The attenuation of these
and other ions in the unsaturated zone, along with dispersion in
the upper saturated zone, is believed to be responsible for
limiting the drilling fluid leachate to a very small area (250 x
250 feet [76 x 76m]) (Appendix E).
The effect of layered heterogeneities in the subsurface is
to focus the leachate migration in the zone of highest hydraulic
conductivity. This will occur if the hydraulic conductivity in
one zone is at least 100 times that in the others (Freeze and Cherry,
1979). The hydraulic conductivity in the saturated sandy gravel
2 7 layer at the Apache site is 10 to .10 times greater than that of
the underlying bedrock silty clay. Large concentrations of Cl-
t • • • • • • •
i • • • .. ::: • • .. • .. :I II
J ., ... , :=

i
I
I
112
in samples from piezometers c7B, c13B, and c13C suggest that leachate
is not being focused in the gravel layer but is moving through the
underlying silty clay. However, these concentrations are believed
to be the result of an inadequate seal in the bore hole between
the screened interval and the gravel layer. The leachate may
have traveled ~own the outside of the pvc pipe through the gravel
backfill. If, on the contrary, these ion concentrations are indeed
a true reflection of the groundwater chemistry at this depth,
the density of the leachate plume would have to be large enough to
overcome the effects of lateral groundwater flow and hydraulic
conductivity variations.
Leachate Migration at the Texaco Charlson Cl33 Site.~lu:lalyses
of water samples from the unsaturated zone beneath the reserve pit
at this site indicate a high concentration of some parameters
and relatively low concentrations of trace elements: TDS (26,200
mg/L), Cl- (12,500 mg/L), N03- (138 mg/Las N), Pb (17-33 ug/L)
and Se (<2 ug/L). The concentrations of most of these parameters
are reduced in the saturated zone: TDS (16,100 mg/L) and Cl
(.5000 mg/L). However, for a few parameters the concentrations
are increased in this zone: Pb (85 ug/L), Se (260 ug/L), and N03
-
(818 mg/L as N) (Appendix D and E). The shape and position of the
plumes on the isoconcentration maps for Pb and Se indicate that the
reserve pit is the source. The decreased concentration of Pb and Se
in the unsaturated zone, relative to the saturated zone, is most
likely a local phenomenon. This is probably due to the heterogeneity
of the buried drilling fluid both in its chemical composition and
relative thickness.
I
• ' • • I
• • •
i • • • • : I
• • • • ~ • J " , :

113
The leachate from the reserve pit has created a plume approxi
mately 400 x 300 feet (122 x 91m) within the upper saturated zone
at this site. This plume extends both upgradient and downgradient
with respect to the local groundwater flow direction (Appendix E).
The configuration of this plume is assumed to be the result of
either a gradient reduction or reversal in the local groundwater
table in recent years or longitudinal and transverse dispersion
in the saturated zone.
Extremely high levels of N03-, a very mobile anion, were found
in the shallow groundwater at this site. The maximum concentration
recorded was 1310 mg/L (reported as N) in the saturated zone and
138 mg/L (reported as N) in the unsaturated zone beneath the reserve
pit. The maxim.um concentration recorded in the saturated zone was
250 feet (76.2m) upgradient from the reserve pit, The shape of
the plume seems to indicate a source other than the reserve pit,
However, nitrate levels from the drilling fluid at the Apache re
entry are sufficiently high to indicate that buried drilling fluid
is a potential source (table 2). The reserve pit could be the
source if the adjacent reservoir has caused a groundwater flow
reversal in this area.
If the N03- is not being leached from the reserve pit, then
alternative sources must be proposed, A small undetected pit to the
south of the reserve pit may contain discarded nitrate fertilizer
or drilling fluid additives. The source could also be from a
surface spill of nitric acid or some other nitrogen compound.
However, there is no evidence to support the existence of either of
• • • • • I
• • •
• • =
• • • • J • J

114
these possible sources. As mentioned in the history section of this
site, this well was used for nitrogen injection between 1974 and
1977. The injection line runs parallel to the access road and it
was initially theorized that a rupture in this line could be the
source of nitrate pollution. However, under normal circumstances
the nitrogen gas will not produce N03- (Koob, 1981). Two wells were
sampled upgradi<mt from the site and were found to contain normal
N03- background levels (Tl54N, T95W, Sec. 32 C/SE/SE and Sec. 33
SW/SW/SE). The first well tested is a farm well located approximately
one quarter of a mile south of the study site. It was initially
speculated that either barnyard wastes or a faulty septic system at
this farmstead might explain the high N03- level in the study area.
However, this source was considered unlikely because of the high
nitrate concentrations of the leachate and was completely dismissed
when the farm well was found to only have normal background con
centrations of this ion, If the reserve pit is not the source of
N03- pollution at this site, no viable alternative has yet been
determined.
Comparison of water chemistry from piezometers n12 and n13
(Apperldix D) suggest that the major zone of leachate migration at
this site does not correspond to the top of the saturated zone.
This could be the result of preferential migration of the leachate
due to lenses of high hydraulic conductivity in the sand and sandy
gravel deposits (fig. 36). A greater density of the leachate in
in comparison to the local groundwater could also create a vertical
component of transport. Whether these two factors act in combination
.
• I
• I • I
• • • "
; • -.. .. 3 C
• .. = ' • II "' 'I
'

115
or separately the maximum migration of leachate at this site is
occurring within the sandy gravel layer.
The geologic and geohydrologic conditions at the Apache
Corporation Federal 1-5 and Texaco Charlson Cl33 study sites are
very similar. At both sites the unsaturated zones have moderate
percentages of clay which has the capacity to attenuate the leachate.
The upper portions of the saturated zones at these sites have very
high hydraulic conductivities. Leachate migration at the Apache
site corresponds to the direction of groundwater flow (fig. 45).
The leachate plume at the Texaco Charlson site has a stronger
upgradient component than it does in the direction of groundwater
flow (fig. 45). This is believed to be the ,result of a reduction
in, or a reversal of, the groundwater flow direction in recent
time due to a higher water level in the adjacent reservoir.
Apparent Resistivity.--Leachate distribution was estimated
using apparent resistivity values. These values were compared with
water analyses to determine leachate indicators. An apparent
resistivity value of 30 ohm-ft. or less was chosen as an indicator
of leachate at the Apache Corp. Federal 1-5 site. A comparison
of the four electrode spacings, at or below the water table,
indicates the maximum extent of leachate migration to be at a depth
of 30 to 40 feet (9.l-12.2m) (fig. 46). A sandy gravel layer lies
within this interval. This supports the hypothesis that maximtun
migration of the leachate would take place within the zone of highest
hydraulic conductivity.
An apparent resistivity value of 30 ohm-ft. or less was also
chosen as an indicator of leachate at the Texaco Charlson Cl33 site.
• • • -,, " " ,, •

~ . ... , ::: 111111 ' .1
116
Figure 45. Profiles of leachate migration at the Apache Corp. Federal #1-5 and T.exaco Charlson Madison North Unit Cl33 sites. There is no upgradient component of leachate migration at the Apache site. An upgradient component of leachate is present at the Texaco site. The configuration at the Texaco site is also a reflection of control. The arrows point in the direction of shallow groundwater flow, The Texaco Charlson Cl33 profile supports the theory that groundwater flow at this site had been from north to south :1.n the i11DDediate past.

2 4 ~ ...I
' "' :. 2
--~ u WEST
117
EAST
8 --~ 100 o--~~·.-- 3()o e6o I rfu DISTANCE FROM RESERVE PIT ( IN FT.)
Cl
.J
} z~ J ~ Q - -,~ T
1$lO 100 0 100 300 500 1'00 DISTANCE FROM RESERVE PIT ( IN FT. )
-111 Na Q w :; 12
} :z - 6
><
~I
f ;!: 5
u z 0 uo
2
ti d
-
SOUTH
CHAR Cl33
NORTH 300 200 100 0 tOO
DISTANCE FROM RESERVE PIT ( IN FT.)
Cl
300 200 100 0 i DISTANCE FROM RESERVE PIT ( IN FT.)
Na
8 --- ~ ~ •o•·•·•·•u~--~~--~~-,~oo-~~o-~~~~T DISTANCE FROM RESERVE PIT ( IN FT.) DISTANCE FROM RESERVE PIT ( IN FT.)
...I 12
g ~ 6 u
Cr
8 ~---. oo o oo 1
~ .,- s6o 1 ;&, DISTANCE FROM RESERVE PIT ( IN FT.)
Pb
0 ~ 300 100 0 100 3ClO 5>0 700
DI STANCE FROM RESERVE PIT ( IN FT.)
z ti 5 z 8
0
0
Cr
-T--~r-----,----~~~ !00 aX> 100 0 100
DISTANCE FROM RESERVE PIT ( IN FT.)
N03 (asN)
~~-,OO~T 100 O=;a...-,---,. DISTANCE FR'.lM RESERVE PIT (IN FT.)
• • • • •
I ,, .. .. • II
= .. .. :II
' .. J .. • '

f J •l
l ,,
118
Figure 46. Apparent isoresistivity maps for Apache Corp. Federal #1-5 site. Selected ohm-ft. values indicate leachate distribution. Electrode spacings of 30, 40, 60, and 80.feet (9,1, 12.2, 18.3, and 24.4m). See figure 23 for legend.

• • •
•
• • •
•
-GS,~ ~
• •
30 FOOT ELECTRODE SPACING 40 FOOT ELECTRODE SPACING
• • J • •
• • • •
• • •
•
• • ~ • • • •
A • 60 FOOT ELECTRODE SPACING 80 FOOT- ELECTRODE SPACING
ioo,. a Apporent Resistivity of 30ohm,ft.or Leu K:'.l Apparent Resistivity of 30 ·40 ohm-ft.
v••~ a •111:• ii ., 1111 ·f~,fii!: .... ~.i:::=:t•
•
•
•
•
NORTH
.... .... "'
...

120
A comparison of the four electrode spacings, at or below the water
table, indicate the maximum e~tent of leachate migration to be
at a depth of 30 to 60 feet (9.1-18.Jm) (fig. 47). The thick
gravel unit is within this interval. These results again support
the interpretation of maximum migration of the leachate in the
zone of highest hydraulic conductivity. The reduction of leachate
at the 80 foot electrode spacing is theorized to be the result
of Tertiary bedrock sediments. This low hydraulic conductivity
layer would have an upper boundary between a depth of 60 and 80
feet (18.3-24.4m). This depth was not reached during augering and
the resistivity data are the only basis for speculation regarding
the presence of such a unit at this depth.
Interpreted Resistivity.--The measurements obtained by surface
resistivity methods correspond to the true resistivity of the
geologic sediments if they are homogeneous and isotropic. However,
as a rule geologic materials are nonhomogeneous and anisotropic.
The values recorded are, therefore, apparent resistivities (Yazicigil
and Sendlein, 1982).
The apparent resistivity values for the two monitored sites
were plotted against electrode spacing to obtain qualitative
information on the subsurface geological conditions (Appendix F).
Subsurface control from auger hole data was used for correlation
with the apparent resistivity curves. In addition, stratigraphic
data were compared with automatically interpreted resistivity curves
using a computer program developed by Zohdy and Bisdorf (1975),
' • ' ' ' I
• • I
I • • • • l • • • • I • I , • I I
121
Figure 47. Apparent isoresistivity maps for Texaco Charlson C133 site. Selected ohm-ft, values indicate leachate distribution. Electrode spacings of 30, 40, 60, and 80 feet (9.1, 12.2, 18,3, and Z4.4m), For legend see figure 23.
I
r
I I

• I • • • • •
• • I • • • • • • • •
• • I • ~" • • • • .! • •
~ :,. ,~LA,. ,; • • • • ~Y. I • • • I 'i /4 .
30 R)QT ELECfRODE SPACING 40 FOOT ELECTRODE SPACING
• • • • • •
• • • • • • • • • •
• • ts. " '\. I • •
~· • • • • r ..,
• • /1 iY • • I i • • • • & • L _. _ _J ·o
~ • • • ~. "'~ ~\ • ~· • • 0 • •
~
60 FOOT ELECTRODE SPACING IBO FOOT ELECTRODE SPACING -~--·-~-··-
-! a Apparent Resistivity of 30ohm-ft. or L!lSll ~ Apparent Resistivity of 30-40 ohm-ft. ~ORTH
0 10011. 100111,
'~
; .__.. .. - - ._,illE I !lW!I •~r..;r 811~ •uc;;:1111•
•
I
•
'-~ ~
~ N
123
which calculates layer thicknesses and resistivities (Appendix F),
There are a few inherent problems with this computer program.
The program cannot interpret VES curves that have a slope which
exceeds 45° (as was the case for stations 9, 13, 15, 16, 17, 22,
and 24 for the Texaco Charlson Cl33 site). In addition, the
program assumeshorizontally and laterally h010.ogeneous layers.
Neither of the two sites surveyed has much lateral continuity,
Interpretations can still be made successfully as long as the
lateral heterogeneity is not excessive (Kehew and Groenewold, 1982).
Profiles .of interpreted resistivity values for the Apache
Federal 1-5 and Texaco Charlson Cl33 sites are presented in
figures 48 and 49. Both depict a zone of low interpreted
resistivity underlying the buried drilling fluid, The apparent
resistivity curves (field values) and the interpreted resistivity
values do not correlate well at the Apache site. A much better
correlation between the two exists at the Texaco site. Correlation
between interpreted resistivity and sediment boundaries are, at
best, tenuous at the Apache site. These same correlations agree
very well for the Texaco site.
Variables in Earth Resistivity Surveying.--The earth resistivity
surveys were used in this study to obtain additional data on the
migration of leachate from the reserve pit and trenches. The
optimum conditions, for which the most favorable results would be
obtained, include a high water table, a thick relatively homogeneous
sediment layer of moderate to high resistivity, and a leachate of
low resistivity.
• • • • • I
• • I
I .. • ~
.. • • .. .. • •
' ' ' I •

124
Figure 48. A profile of interpreted resistivity values at the Apache Corp. Federal #1-5. The reduction in apparent resistivity caused by the leachate can be seen in the silt layer beneath the reserve pit. The interpreted resistivity boundaries do not correlate well with lithologic changes, Values are in ohm-ft, See legend of figure 24 for lithologic symbols.
Figure 49. A profile of interpreted resistivity values at the Texaco Inc. Charlson Ma.dison North Unit Cl33. The reduction in apparent resistivity caused by the leachate created the 10-25 ohm-ft. zone beneath the reserve pit. The interpreted resistivity boundaries correlate well at this site with both the leachate boundaries and lithologic changes, See legend of figure 24 for lithologic symbols.

125
EAST
I • I
l I
., ., ,,
., pl
II
"' ... •• . , ,

' I ' I
l l
ll6
The two sites which were VES surveyed are characterized by
both lateral and vertical discontinuity. The sediment size in the
deposits ranges from clay to gravel. The high silt percentage
and the degree of unconsolidation of these deposits resulted in
poor definition of the layer boundaries (Appendix F). Fortunately,
the resistivity values of the leachate at these sites were
sufficiently low to permit detection by this method.
The two remaining study sites were not surveyed with the
resistivity technique even though they were sedimentologically more
laterally continuous. It was felt that the depth to the water
table was too great and that leachate in the saturated zone would
not be detected,
At the Apache site vegetation was absent an the highly compacted
pad. This caused a slight reduction in resistivity over this area.
This reduction was greatly overshadowed by the much greater
influence of the leachate.
The lines of electrodes were oriented east-west at the Apache
site and north-south at the Texaco Charlson site. At each site
the arrays approximately paralleled the direction of shallow
groundwater flow. Studies have shown that the apparent resistivity
is variable and dependent upon the orientation of the electrode
array. Anomolies are therefore abnormally elongated in the
direction of traverse (Van Nostrand and Cook, 1966). The resulting
resistivity patterns on isoresistivity n,aps for the sites (figs.
41-44) are somewhat elongated parallel to the direction of the
electrode lines. However, this appears to be largely a result of
• • • r • I
• • , r, • • • • • ~
•• •• •• •• r

I '
I l
127
leachate dispersion by groundwater flow in this same direction.
The ·assumption has been made in the presentation of both the
apparent and interpreted resistivity data that the electrode
spacings (a) and depth of current penetration are equivalent.
This was assumed even though both sites contain zones of high
salinity pore water which could reduce current penetration. The
depth of current penetration and the electrode spacing are con
sidered equal in this study because no observable pattern was
detected to indicate otherwise.
Effect of Pit Reclamation on Precipitation Infiltration.--As
previously discussed, the most common method of pit reclamation
today is by trenching. A series of trenches, ranging in depth
from 14 to 21 feet (4.3 to 6.4m), are constructed to radiate out
from one side of the pit (fig, 50-B), Simultaneously, or shortly
after completion of trench construction, the pit is pushed in from
the opposite side by a bulldozer. As the fill is pushed toward
the trenches it forces the drilling fluid into them. When the
pit is completely filled with sediment most of the drilling fluid
is contained in the trenches. The final stage of reclamation is
to cover the trenches with fill and to level and compact the
site (fig. 50-C).
Prior to the drilling of an oil well, an area (pad)is leveled
and highly compacted to minimize settling due to the weight of the
oil rig and a,;sociated heavy equipment, This compaction creates
an area of high potential runoff and very low infiltration capacity.
During reclamation the fill in the reserve pit and trenches is
• • • ! • I
., ., P'
S! •• • m
•• •• II •• •• •• •• ,

r '
128
Figure 50a. A cross-section of an active drilling fluid pit.
Figure 50b. A drilling fluid pit upon completion of the trenching operation and prior to back filling. Note the depth of the drilling fluid in the trenches in comparison to the reserve pit.
Figure 50c. A drilling fluid pit upon completion of reclamation. Sediment has been spread over the pit and the area has been leveled. Note that the majority of the drilling fluid is now in the unlined trenches.
Figure 50d. The results of subsidence within the pit and trench.es. This increases the infiltration in this area.

129
I ' I
I I '
8
C
0
D
20•"----------------
• lle~,!;ING
[J FILL
! PRECIPITATION
JI' RUNOFF
t INFILTRATION
\ CRACKS
c::;:, CAVITIES
... , .. .... 1!!1 .... .... '"' :::= 11111 .... ... ;,·
•• '

' l I
130
compacted to a lesser extent than the surrounding sediment on the
pad. In addition, desiccation of the drilling fluid over time
reducesits volume and causes settling of the overlying fill. The
settling of the fill is most prevalent over the trenches (due to
the greater drilling fluid/fill ratio) but also occurs throughout
the pit area. This settling creates cavities and surface cracks
which act as preferred avenues for infiltration. In addition,
ponding of water in surface depressions is caused by subsidence of
all or parts of the trench surfaces. This ponding, along with the
presence of surface cracks, results in greatly increased infiltration
above the fluid filled trenches (figs. 50-D, 51, and 52). This,
therefore, increases the amount of leachate that is produced. The
highly compacted sediment between the trenches and throughout the
rest of the drill pad (not including the ares above the reserve
pit) often funnels runoff into the surface cracks, cavities,
and depressions of the fill in the pit and trenches. Infiltration
is also increased by the lack of vegetation over the reserve pit
and trenches. Moisture that could be taken up by plants and
recirculated to the atmosphere is now available for infiltration
to the buried drilling fluid (fig. 50-D).
Health Effects of Drilling Fluid Leachate.--Much concern has been
expressed about the toxicity and mobility of the chromiUIII ion, a
component of certain drilling fluids. Chromium exists in three forms:
+6 pure element11l chromium metal, hexavalent chromium (Cr ) and tri-
+3 valent chromium (Cr ) • Trivalent chromitllll is very insoluble and
immobile but becomes highly mobile when oxidized to the hexavalent
" •• '" 11 •• 1: •• •• ••
II •• •• ,. •• •• Ill ,,. ••
" '
r r r ;;
l l
131
Figure 51. A collapsed trench surface at the Apache Federal 111-5 site (this trench is from the reclamation of the original reserve pit). The collapsed surface is due to desiccation of buried drilling fluid. The maximum depth of the depression is 2.4 feet (0.7m). The photo is looking east towards the buried reserve pit.
Figure 52. Desiccation and settling cracks developed on the surface of the reclaimed reserve pit at Apache Federal #1-5 re-entry. The photo was taken 5 weeks after the pit was reclaillled. The knife is 9 inches (22,9 cm) in length.


133
state (Robertson, 1975). The hexavalent chromium ion is also much
more toxic than is the trivalent ion (Valkovic', 1975), The valence
state of chromium is largely dependent upon the Eh and the pH of the
surrounding environment.
The Eh-pH stability field diagram for chromium in natural waters
at a temperature at 25°c and one atmosphere is shown in figure 53.
The diagram indicates that there is only a small portion of the
+6 typical groundwater field within which Cr is stable. The conversion
of chromium to the hexavalent state requires strongly oxidizing
conditions.
The North Dakota State Department of Health Lab analyzed the
groundwater samples for 29 chemical parameters. The Recommended
Concentration Limit and Ma><:imum. Permissible Concentration Limit for
human, livestock uses, and irrigation purposes for a number of
these parameters are present,ed in table 3.
The Maximum Permissible Concentration Limit of 50 ug/L was
determined for chromium in its hexavalent state. This limit was
exceeded in only two of the water samples from the four study
sites. Both of these samples were obtained from soil water
samplers emplaced in the reserve pit at the Texaco Gov't. NCT-1
site (fig. 37). The water samples from the saturated zones at
the Apache Federal 1-5 and Texaco Charlson Cl33 sites contained Cr
concentrations far below the Maximum Permissible Concentration.
Even if this ion is in its hexavalent state in this groundwater,
which is highly unlikely (fig. 53), it does not pose a health threat
at these concentrations.
.. .. .. r .. = •• .. .. !I .. .. .. : Ill .. ..
b
134
Figure 53. Stability-field diagram for trivalent and hexavalent chromium compounds in water st 2s
0c and one
atmosphere. Hexavalent chromium normally exists over a small Eh-pH range in natural groundwaters. The pH range for the groundwater at the study sites is shown in the diagram (from Robertson, 1975, p. 522).

1.2
1.0
.8
.6
.4
-:? j .2 E .c 41 0
•. 2
- .4
-.6
•. s
135
pH
2 3 4 5 6 7 S 9 10 11 12 13 14
1'-. ..... ', ......
...... ....... ,, HCr04 .,.
1'· I ~
I I
\ cr•3 . \
\
pH RANGE IN STUDY AREA
MOST NATURAL SURFACE WATERS WITHIN THIS za',IE
• MOST NATURAL GROUNDWATER WITHIN THIS ZONE
.. .. ·~ il!l .. .. ..
.. ... .. Ill ·~ .. ... :I Iii
• ..

136
Table 3. Recommended Concentration Limits and Maximum Permissible Concentrations for human, livestock, and irrigation crop conslllllption of some selected chemical parameters {Freeze and Cherry, 1979).

137
Human Livestock Crops PARAlly1ETER inmq/L in ma/L in ma/ L
Total dissolved solids* 500 7000 700 Chloride* 250 Sulfate* 250 Nitrate** 45 45 Iron* 0.3 Manganese* 0.05 Capper* 1.0 Zinc* 5.0
in ug/ L in ug/ L in ug/ L Arsenic** 50 200 100 Barium** 1000 Cadmium** 10 50 10 Chromium** 50 1000 100 Selenium** 10 50 20 Lead** 50 100 5000 Silver** 50 2000 1000
* Recommended Concentration Limit based upon taste and esthetic appearance.
** Maximum Permissible Concentration based upon health effects.
·l
i
• • ; • • •
• • ..
.. .. •

138
At the Apache Federal 1-5 site only five parameters (TDS, Cl,
2-S04 , Fe and Mn) exceeded the Recommended Concentration Limits in
the saturated zone. The background concentration levels of TDS,
2-S04 , and Mn also exceed these limits at this site. The
Recommended Concentration Limits for Cl- and Fe are exceeded in
an area approximately 150 x 120 feet (46 x 37m) within the upper
saturated zone at this site (fig. 54). The limits for these ions
are set for taste and aesthetics of the water, The consUIJlPt±on of
water from the saturated zone at this site did not pose a health
threat to humans or livestock during the sampling period.
A number of parameters in groundwater at the Texaco Charlson
Cl33 site exceed the drinking water standards. The Recommended
- 2-Concentration Limits for TDS, Cl, so4
, Fe, and Mn were
exceeded but do not pose health threats (Appendix E). The back-
2-ground concentration levels of TDS, so4
, and Mn also exceed the
limits at this site. The Recommended Concentration Limits for Cl
and Fe are exceeded in an area approximately 400 x 300 feet (122 x
91m) within the upper saturated zone at this site (fig. 55).
Maximum Permissible Concentration Limits for Cd, Pb, N03-, and Se
were exceeded in the groundwater at this site (fig. 55). Ground
water samples periodically exceeded the Maximum Concentration
Limits for Cd and Pb in an area approximately 200 x 200 feet (61 x
61m) in the upper saturated zone. The mean of the quarterly water
samples exceeded the limits at only two piezometers, n9
for Cd
and D5 for Pb (Appendix E), These two ions are potential carcino
genics in concentrations exceeding the Maximum Concentration Limits
•• . , ••
•• ~,, "11 ... :I' .. • •

139
Figure 54. Approximate limits of groundwater which exceeds the Recommended Concentration Limits for c1- and Fe at the Apache Corp. Federal #1-5 site. The upper 10 feet (3m) of the saturated zone was monitored.
Figure 55. Approximate limit of groundwater which exceeds the Recommended Concentration Limit and Maximum Permissible Concentration Limit at the Texaco Charlson Cl33 site. The upper 15 feet (4.6m) of the saturated zone was monitored.

1
i I
140
•
:
APACHE FEDERAL I - 5 0
•
•
No - Exceeds MPC Throu hout Stud Area · TEXACO CHARLSON Cl33
NORTH >
---RCL --MPC
• •
!50m.
Nl ... S! ~· ,., ... •• ... ... . , .. , ~!
I' " • '

r .
'i
I '
! l I
141
{Valkovic', 1975).
Se exceeds the Maximum Permissible Concentration Limit by a
factor of 25X over an area approximately 350 x 200 feet {107 x
61m) in the upper saturated zone (fig. 55). There has been some
question as to whether or not the 10 ug/L limit for Se is
justifiable. The health effects of this ion are not known at low
concentrations and 50 ug/L might be a more realistic limit (Hammer,
1981). At the high concentration observed at this site, Se is a
potential carcinogen.
The concentration of N03- in groundwater at the Texaco Charlson
Cl.33 exceeds the Maximum Permissible Concentration Limit by a factor
of up to llOX (Appendix E). All of the water samples analyzed from
the saturated zone at this site exceed the 10 mg/L limit for N03-
(as N). The health effects of this ion are well known at
concentrations exceeding this limit. Adults can tolerate higher
concentrations of N03- but it is often fatal to infants by inducing
methemoglobinemia ("blue baby disease"). The human and livestock
consumption of shallow groundwater in the immediate area of the
Texaco Charlson Cl33 site constitutes a danger to health.
As assessment of the groundwater quality at the Texaco Gov't.
(NCT-1) and Belco Petroleum B.N. Sheep Creek 1-11 sites could
not be made. The pore water in the unsaturated zone beneath these
reserve pits contained a number of parameters which exceeded
drinking water standards. However, this pore water will not be
consumed by humans or livestock and does not therefore constitute
a health hazard. The concern at these two sites is for the quality
., •• !! •• •• •• •• •• ••
I' •

r . .
. . I '
' I I I
I I I
of water that will reach the saturated zone where it has the potential
to be consumed. The reduction in ion concentrations in the pore
water through the unsaturated zone (figs. 37-40) is the basis for
the assumption that this water will be sufficiently reduced in these
concentrations and will not adversely affect the groundwater
beneath these two sites.
• • •• fl •• •• •• •• •• •• •• II •• :e I' r
i ' I
CONCLUSIONS
The following can be concluded from the results of this study:
1. Leachate is being generated from the buried drilling fluid at
each of the four western North Dakota study sites. The amount
of leachate generated is relatively small because of the
small volume of buried drilling fluid and the normally low
amounts of subsurface infiltration of precipitation. However,
infiltration is increased by the improper compaction of
sediments over the buried drilling fluid and by improper
leveling of the site during reclamation.
2. The amount of drilling-fluid-generated leachate that reaches
the groundwater table is assumed minimized by adsorption onto the
commonly abundant Na montmorillonitic clays within the normally
thick unsaturated zone. The portion of leachate which enters
the saturated zone is often diluted by mechanical dispersion.
3. Two of the study sites (Texaco Gov't. "A" (.NCT-1) and Belco
Petroleum B.N. Sheep Creek 1-11) were chosen because they
represent typical geologic and geohydrologic conditions for
the majority of reserve pits in western North Dakota. The
saturated zone was not monitored at these two sites but the
reduction in ion concentrations in the leachate as it moved
through the unsaturated zone is the basis for assuming that
very little leachate is reaching the groundwater table, The
two other sites (Apache Corp. Federal 1-5 and Texaco Charlson
143
•• '• i! '" •• • • •• •• . , 1111 ... :,

I I
4.
144
Madison North Unit (Cl33) were chosen because they represented
the "highest potential" for leachate migration. At these
sites leachate plumes were detected within the saturated zone.
The chemical concentrations within the saturated zones at
these sites returned to background levels within a maximum
radius of 400 feet (122m) from the reserve pit.
The consumption of shallow groundwater within the immediate
vicinity of the reserve pit at one of the four study sites
(Texaco Charlson Cl33) constitutes a danger to health.
5. Reserve pits are most often reclaimed by the trenching method
regardless of whether or not the pit was lined. The majority
of drilling fluid is disposed of in these unlined trenches
and not in the reserve pit.
6. The chloride ion is the best single indicator of the maximum
extent of leachate migration because of its high concentration
in drilling fluid, its low concentration in the shallow
groundwater in this area, and its mobility in the subsurface.
7. Electrical earth resistivity was used to successfully outline
the drilling-fluid-generated leachate plume at two of the
study sites.
8. Chromate drilling fluid additives were constituents of the buried
drilling fluid at two of the study sites (Apache Federal 1-5 and
Texaco Gov't. "A" NCT-1). The chromium ion was greatly reduced
in concentration in the pore water. as the depth in the unsatu
rated zone increased at these sites. The shallow groundwater
beneath the buried drilling fluid at the Apache Federal 1-5
showed no increase in chromium concentration.
. .. '" lll ... ,., '" ... •• •• . , •• '• lt
I'

RECOMMENDATIONS
Pit Reclamation.--Unfortunately, the disposal of discarded
drilling fluid over the years has been one of the most neglected
areas of shallow waste disposal within the state of North Dakota.
The reserve pits have been trenched regardless of whether or not
they had been lined and in total disregard to the local geohydrologic
conditions. ln addition, the liners in the pits have often not been
properly maintained and generally have substantial tears in them
(fig. 56). There have also been cases where the reclamation
trenches have been improperly constructed (fig, 57). The less
viscous ("fluid") portion of the drilling fluid is supposed to be
removed from the pit prior to site reclamation. This did not occur
at many of the reserve pit reclamations that I witnessed.
In certain geohydrologic settings, i.e. a high water table and
sediment with high hydraulic conductivities, the drilling fluid
should not be disposed of "on site". At such locations the drilling
fluid should be removed and disposed of in an approved site.
In a few isolated sites the reserve pit has been reclaimed by
alternative methods. Drilling fluid has been collected from the pit
and disposed in the deep subsurface by injection wells. This method
is rarely used because of the difficulties associated with the very
viscous nature of the fluid.
A few "toxic-free additives" have been developed by drilling
145
, . •• Ill ... ... ... ... ,. ... . , , . ... It

146
Figure 56. The reserve pit at the Apache Federal #1-5 site (re-entry). Note the substantial tear in the pit liner. Photo taken looking south.
Figure 57. A reserve pit in northern Billings County. The reclamation trench is leading down the hillside into the ravine.

1 148
fluid companies. These additives perform the same service as their
toxic counterparts, for example, Chrome Free Lignosulfonate. These
were developed because of the banning of some additives (i.e.,
chromates) in certain areas of the country. The use of such
additives reduces the potential health risk.
One solution discussed has been the sealing off of the buried
drilling fluid from infiltrating water by incapsulation in relatively
impermeable sediment. One such method has been designed by (Hicks,
in preparation) (fig. 58). The mounding of sediment would increase
precipitation runoff and thereby reduce infiltration and consequential
leachate. If a method can be devised to desiccate the drilling fluid
prior to pit reclamation, this method of incapsulation and mounding
will have more merit. Desiccation would also eliminate the volume
of leachate generated.
The lithology of the upper 200 feet (61m) of sediment at each
drill site should be determined. In addition, the depth to the
water table should be determined. This determination could be made
while the oil-and-gas well was being spudded. This infonnation
should be sent to the state or federal agency in charge of site
reclamation to enable the selection of the proper reclamation method.
Further Study,--This study has determined that leachate will be
generated by the current method of reserve pit reclamation. Therefore,
it is important to focus interest in areas where this leachate will
degrade the local groundwater. This concern should now be focused
• a I , • • t !
149
Figure 58. Alternative method of reserve pit reclamation (from Hicks, in preparation). This method should increase surface runoff and decrease leachate generated by the buried
drilling fluid.

T I
150
I ~ --re SQJJ.--._ ~ -- -- - .......... -........ --- ~ "" '-,,,_ __.. _- COMPACTED ,,_;,........_..;;::,,... __ _
FILL
BENTONITE - a SEDIMENT
PLASTIC LINER
.. .. Ill "" .. , ... ••
.. .. t
l ' I
151
on oil-and-gas well sites in north-central North Dakota. Sites
situated upon permeable glacial meltwater channels have a high
potential for large-scale leachate contamination of the shallow
groundwater. The sites in this area should be monitored in both
the saturated and unsaturated zones with piezometers and soil
water samplers.
Future studies in the semi-arid climate of western North
Dakota and eastern Montana should focus upon the migration and
attenuation mechanisms of the drilling fluid leachate in the
unsaturated zone. Soil water samplers should be placed in the
unsaturated zone both beneath and adjacent to the buried drilling
fluid to enable determination of lateral and vertical leachate
migration. Any future study should also incorporate the use of
x-ray fluorescence (XRF), scanning electron microscopy (SEM),
and/or other geochemical techniques to accurately determine the
attenuating mechanisms.
Alternative methods of res.erve pit reclamation should be
studied. If a method can be devised to desiccate the drilling
fluid prior to burial, it can be confined to the lined pit. This
confinement will greatly reduce the amount of leachate that will
be generated,
.. .. ~ .. .. ""
Ir

-.... ':=
.• ·'.,;···.J.·
···1
,, •
APPENDICES
.. .. 9 ~~•• •• ••
' • • •

l '
I I I '
APPENDIX A
RULES AND REGULATIONS FOR RESERVE PIT RECLAMATION
.. " Ill "" .. .. ••
•

,,
l I I •
154 43-02-03-19. PIT FOR DRILLING MUD AND DRILL CUTTINGS, AND
RESTORATION OF SURFACE. In order to assure a supply of proper material or mud-laden fluid to confine oil, gas, or water to their native strata during the drilling of any well, each operator shall provide, before drilling is commenced, a container or pit of sufficient size to contain said material or fluid, and the accumulation of drill cuttings. The pit shall be leveled and the surface restored within a reasonable time after the well has been completed.
(((No pit shall be constructed so as to allow surface or subsurface contamination by seepage or flowage from said pit.)))
Pits shall not be located in, or hazardously near, stream·courses, nor shall they block natural drainages, and shall be constructed in such a manner so as to prevent contamination of surface or subsurface waters by seepage or flowage therefran.
In the construction of a drill site or production facility, the topsoil shall be removed, stockpiled, and stabilized for later redistribution on the surface of the location when it is reclaimed. "Topsoil" means the suitable plant growth material on the surface, however, in no event shall this be deemed to be more than the top 8" of soil.
Within a reasonable time, normally no more than one year, after the completion of a well, pi ts shall be pushed in and levelled, or in the case of abandonment, the site shall be restored. Prior to the COD11Dencement of such operations, the operator or the operator's agent shall file a notice of intention (Form 4) to level pits or restore site with the State Geologist and obtain approval from the State Geologist or his representative. Verbal approval to commence operations may be given, in which case the operator shall file a subsequent notice with the State Geologist reporting the work performed. Any operator who obtains verbal approval may be required by the State Geologist to perform additional work if the State Geologist determines that the work performed does not constitute proper restoration, or does not comport with the subsequent notice of intention submitted. The notice shall state the name and location of the well, the name of the operator, and the method of restoration, and shall include a statement of proposed work. Such work shall include, but not be limited to the following:
(1) The location or unused portion shall be restored as close as possible to original condition. This work will be done within a reasonable time after plugging or setting production casing.
(2) The stockpiled topsoil will be evenly distributed over the location, and revegetation will be native species or to the specifications of the appropriate government representative and the landowner.
(3) If required by the State Geologist, the reserve pit will have fencing on three sides during drilling operations, and prior to rig release the fourth side will be fenced. The pit fence will maintain until the pit is dry.
(4) If there is any oil on the pits when drilling is completed, it will be removed immediately or the pits will be flagged overhead.
General Authority NDCC 38-08-04
Law Implemented NDCC 38-08-04
" .. IJ! .. .. "" ..

APPENDIX B
LITHOLOGIC DESCRIPTION OF DRILL HOLES
... ,., Ill .. ... ... .• , JI I
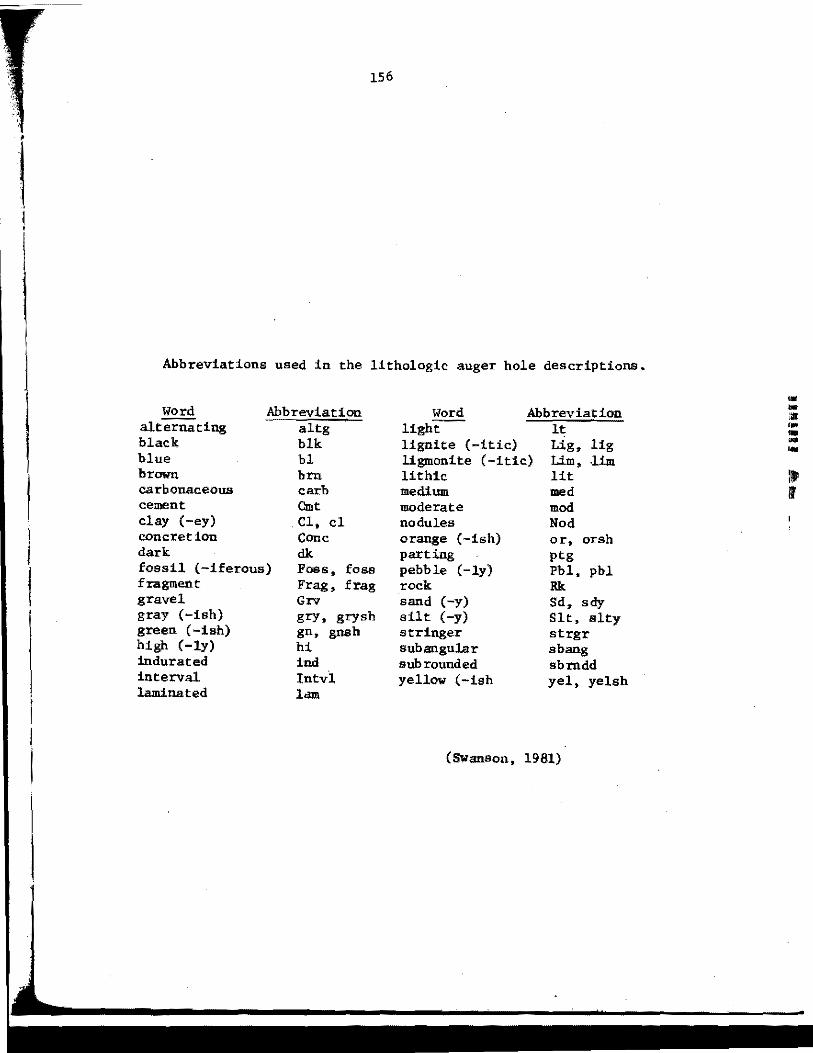
156
l l •
Abbreviations used in the lithologic auger hole descriptions.
... Word Abbreviation Word Abbreviation ..
:a alternating altg ligh_t_ lt ... .. black blk lignite (-itic) Lig, lig .. ... blue bl ligmonite (-itic) Lim, lui brown brn lithic lit :t carbonaceous carb medium med If cement Cmt moderate mod clay (-ey) . Cl, cl nodules Nod
j concretion Cone orange (-ish) or, orsh dark dk parting ptg
I fossil (-iferous) Foes, foss pebble (-ly) Pbl, pbl fragment Frag, frag rock Rk gravel Grv sand (-y) Sd, sdy
I gray (-ish) gry, grysh silt (-y) Slt, slty green (-ish) gn, gnsh stringer strgr high (-ly) hi subangular sbang indurated ind sub rounded sbmdd interval Intvi yellow (-ish yel, yelsh laminated ldlll
(Swanson, 1981)
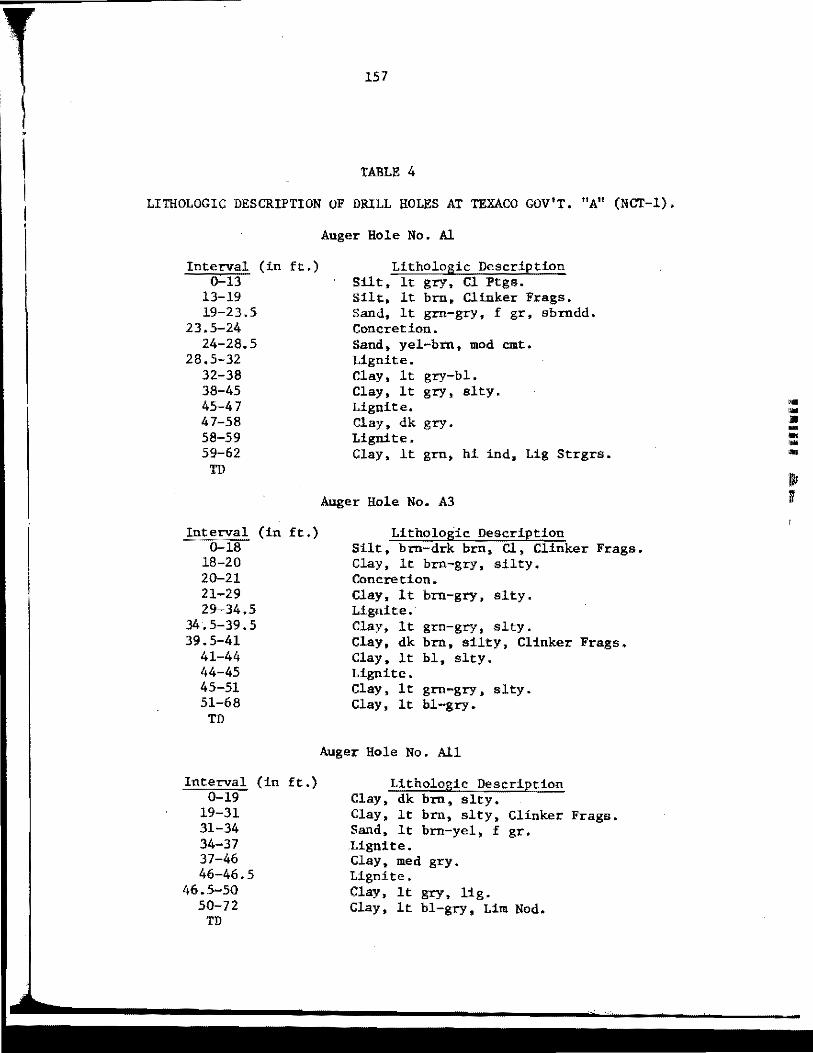
.
I I '
157
TABLE 4
LITHOLOGIC DESCRIPTION OF DRILL HOLES AT TEXACO GOV'T, "A" (NCT-1),
Auger Hole No. Al
Interval (in ft.) 0-13
13-19 19-23.5
23.5-24 24-28.5
28.5-32 32-38 38-45 45-47 47-58 58-59 59-62
TD
Interval (in ft,) 0-18
18-20 20-21 21-29 29-34.5
34.5-39.5 39.5-41
41-44 44-45 45-51 51-68
TD
Interval (in ft,) 0-19
19-31 31-34 34-37 37-46 46-46.5
46.5-50 50-72
TD
Lithologic Description Silt, lt gry, Cl Ptgs. Silt, lt brn, Clinker Frags. Sand, lt grn-gry, f gr, sbrndd. Concretion. Sand, yel-brn, mod cmt, Lignite. Clay, lt gry-bl. Clay, lt gry, slty. Lignite, Clay, dk gry, Lignite. Clay, lt gm, hi ind, Lig Strgrs.
Auger Hole No. A3
Lithologic Description Silt, brn-drk brn, Cl, Clinker Frags. Clay, lt brn-gry, silty. Concretion. Clay, lt brn-gry, slty. Lignite. Clay, lt grn-gry, slty. Clay, dk brn, silty, Clinker Frags. Clay, lt bl, slty. Lignite. Clay, lt grn-gry, slty. Clay, lt bl-gry.
Auger Hole No. All
Lithologic Description Clay, dk brn, slty, Clay, lt brn, slty, Clinker Frags. Sand, lt brn-yel, f gr, Lignite. Clay, med gry. Lignite. Clay, lt gry, lig. Clay, lt bl-gry, Lim Nod.
.. , .. JI -... "" ..
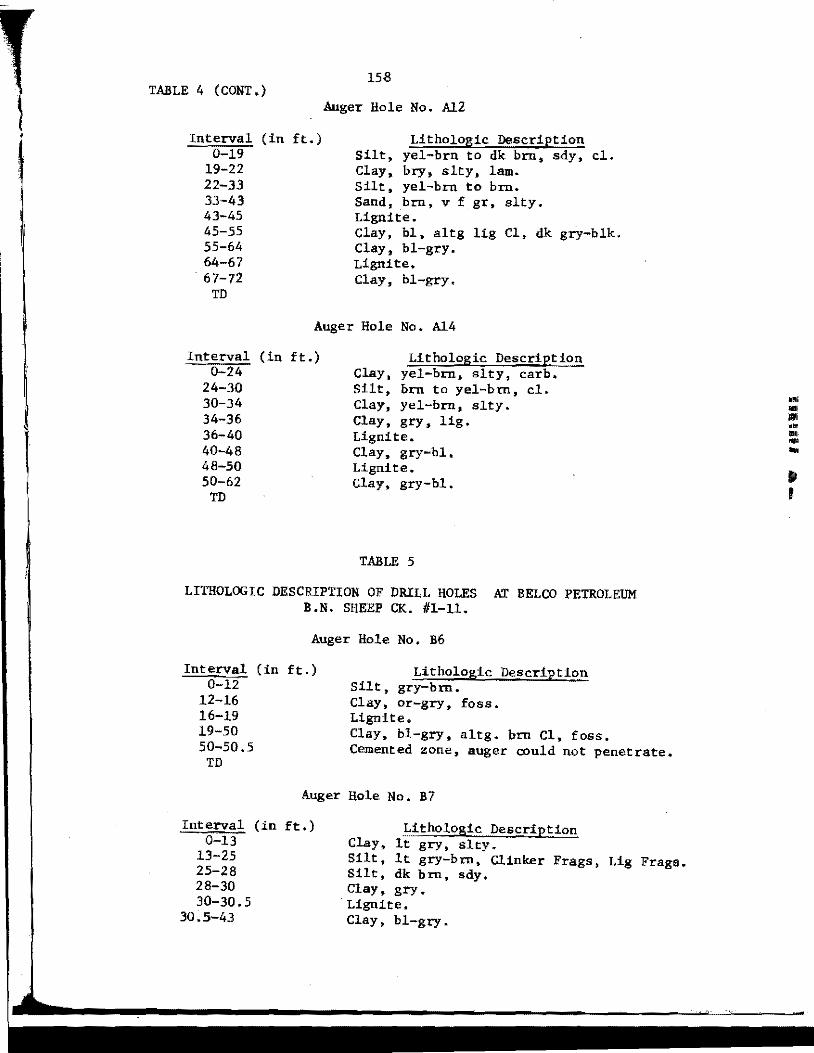
•
' (
TABLE 4 (CONT.)
Interval (in ft.) 0-19
19-22 22-33 33-43 43-45 45-55 55-64 64-67 67-72
TD
158
Auger Hole No. Al2
Lithologic Description Silt, yel-brn to dk brn, sdy, cl. Clay, bry, slty, lam. Silt, yel-brn to bm. Sand, brn, v f gr, slty. Lignite. Clay, bl, altg lig Cl, dk gry-blk. Clay, bl-gry. Lignite. Clay, bl-gry.
Auger Hole No. Al4
Interval (in ft.) 0-24
24-30 30-34 34-36 36-40 40--48 48-50 50-62
TD
Lithologic Description Clay, yel-brn, slty, carb. Silt, brn to yel-brn, cl. Clay, yel-brn, slty. Clay, gry, lig, Lignite. Clay, gry-bl. Lignite. Clay, gry-bl.
TABLE 5
LITHOLOGIC DESCRIPTION OF DRILL HOLES Kr BELCO PETROLEUM B.N. SHEEP CK. #1-11.
Auger Hole No. B6
Interval (in ft.) 0-12
12-16 16-19 19-50 50-50.5
TD
Lithologic Description Silt, gry-bm. Clay, or-gry, foss. Lignite. Clay, bl-gry, altg. brn Cl, foss. Cemented zone, auger could not penetrate.
Auger Hole No. B7
Interval (in ft.) 0-13
13-25 25-28 28-30 30-30.5
30.5-43
~ithologic Description CLay, lt gry, slty. Silt, lt gry-brn, Clinker Frags, Lig Fraga. Silt, dk brn, sdy. Clay, gry.
. Lignite, Clay, bl-gry.
'"' 111; !PIii •• "" .. ...

'
TABLE 5 (CONT.)
43-43.5 TD
159
Cemented zone, auger could not penetrate.
TABLE 6
LITHOLOGIC DESCRIPTION OF DRILL HOLES AT APACHE FEDERAL #1-5.
Interval (in ft.) 0-25
25-34.5 34.5-40
40-47 ,5 TD
Interval (in ft.) 0-14
14-28 28-32 .5
32.5-37.5 TD
Interval (in ft,) 0-14
14-29 29-36.5
36.5-38 TD
Auger Hole No. Cl
Lithologic Description Silt, lt brn-brn, sdy, Cl Intvls. Clay, brn-dk brn, slty. Sand, brn, med. gr. Gravel, sdy, Clinker & Lig Frags.
Auger Hole No. CS
Lithologic Description Silt, lt yel-brn, cl. Clay, lt brn, slty, Lig & Clinker Frags. Sand, b-rn, med-f gr. Gravel, sdy, Clinker & Lig Frags.
Auger Hole No. C6
Lithologic Description Silt, lt yel-brn, cl. Clay, brn-lt brn, Lig & Clinker Fraga. Sand, brn, med-£ gr. Gravel, sdy, Clinker & Lig Frags.
Auger Hole No. Cll
Interval (in ft.) 0-11
11-29 29-37 .s
37.5-38.5 TD
Lithologic Description Silt, lt yel-brn, cl. Clay, yel-brn, slty, Clinker & Lig Frags. Sand, lt-dk gry, med-f gr, Clinker &
Lig Frags. Gravel, s·dy.
.. • ill .. .. .. ..

I J
•
160
TABLE 6 (CONT.)
Auger Hole No. Cl3
Interval (in ft.) 0-9 9-24
24-27.5
27.5-38 38-55
TD
Lithologic Description' Silt, lt yel-brn, cl. Clay, yel-brn, slty, Clinker & Lig Frags. Sand, lt-dk gry, med-f gr, Clinker &
Lig Frags. Gravel, sdy. Clay, gry-lt bl, slty.
Auger Hole No. Cl4
Interval 0-19
19-30 30-42 42-47
TD
(in ft.) Lithologic Description Silt, lt yel-brn, sdy. Sand, med gr. Gravel, sdy. Clay, lt bl to gm-bl.
Auger Hole No. Cl5
Interval (in ft.) 0-14
14-22 22-35
35-39 39-42 42-47 47-49 49-62
TD
Lithologic Description Silt, lt yel-brn, sdy. Sand, med brn, med gr. Sand, gry, med gr, Clinker & Lig
Frags, Grv. Gravel, sdy. Clay, lt bl. Sand, gry, med gr. Clay, lt gry-bl. Sand, gry, med gr.
TABLE 7
LITHOLOGIC DESCRIPTION OF DRILL HOLES AT TEXACO CHARLSON Cl33,
Auger Hole No. Dl
Interval (in ft.) 0-14
14-26
26-29 29-40 40-52
Lithologic Description Silt, lt yel-brn, sdy, cl. Sand, med brn, med gr, slty, Clinker
& Lig Frags. Clay, lt yel, slty. Clay, drk brn, slty, Clinker Frags. Sand, med--dk brn, slty, Clinker & Lig
Frags.
.. • ' " .. •• •• I~ r

' I I 1,
I J
TABLE 7 (CONT.)
52-65 TD
Interval (in 0-18
18-23 23-33 33-42 42-45 45-54 54-66 66-72
TD
161
Gravel sdy.
Auger Hole No. D3
ft.) Lithologic Description Sand, lt yel-brn, slty, cl, Clinker & Lig Frags, Gravel. Sand, med-dk brn, slty, Clinker & Lig Frags. Clay, dk brn-brn, slty, lit RK & Lig Fraga. Gravel. Clay, dk brn-brn, slty, lit Rk & Lig Frags. Clay, blk-dk brn, slty, Clinker & Lig Fraga. Gravel, sdy.
Auger Hole No. D4
Interval (in ft,) Lithologic Description 0-5 Silt, lt gry, cl. 5-26 Sand, yel-brn, slty, cl, Clinker Fraga.
26-31 Clay, dk brn, slty. 31-36 Clay, yel-brn, slty, Lig Frags. 36-42 · Gravel, sdy.
TD
Auger Hole No. D5
Interval (in ft.) Lithologic Description
0-7 7-11
ll-13 13-28 28-32.5
TD
Clay, lt brn, slty. Drilling Fluid. Silt, lt brn-brn, slty, Clinker Fraga. Clay, brn-dk brn, slty, Sd Strgr. Gravel, sdy, sbrndd.
Auger Hole No. D9
Interval (in ft,) Lithologic Description 0-10 Silt, lt yel-brn, sdy.
10-18 Sand, lt yel-brn, v f gr, slty. 18-23 Gravel, sdy, sbang lit Rk pbls. 23-31 Clay, brn-dk brn, slty, Sd Strgr. 31-37.5 Gravel, sdy.
TD
"' "' ... ,. ,.. . .. ... Ii I'
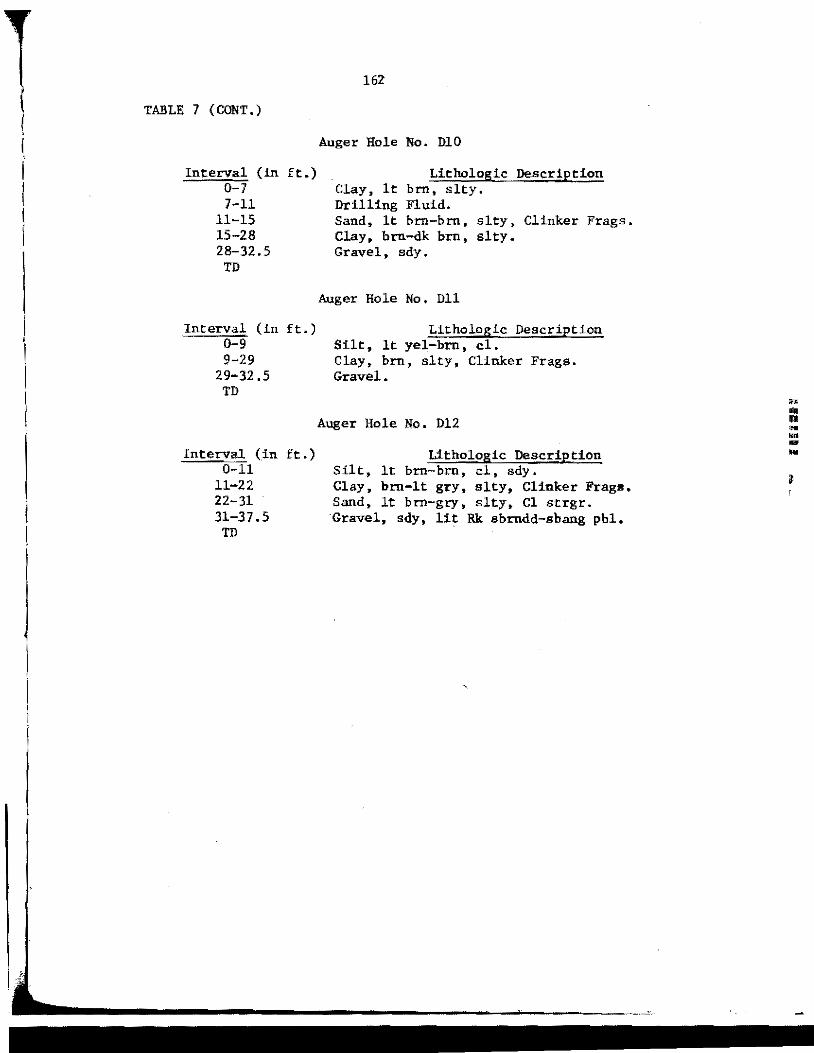
TABLE 7 (CONT.)
Interval (in ft.) 0-7 7-11
11-15 15-28 28-32.5
TD
Interval (in ft.) 0-9 9-29
29-32.5 TD
Interval (in ft.) 0-11
11-22 22-31 31-37.5
TD
162
Auger Hole No. DlO
Lithologic Description Clay, lt brn, slty. Drilling Fluid. Sand, lt brn-brn, slty, Clinker Frags. Clay, brn-dk brn, slty. Gravel, sdy.
Auger Hole No. Dll
Lithologic Description Silt, lt yel-brn, cl. Clay, brn, slty, Clinker Frags. Gravel.
Auger Hole No. Dl2
Lithologic Description Silt, lt brn-brn, cl, sdy. Clay, brn-lt gry, slty, Clinker Frags. Sand, lt brn-gry, slty, Cl strgr. Gravel, sdy, lit Rk sbrndd-sbang pbl.
.. .. Ill .. .. .. ...

i I r I ! I
APPENDIX C
TEXTURAL ANALYSES
.. .. " .. .. .. ••

(
I I I I I
164
HYDROMETER METHOD OF TEXTURAL ANALYSES
The sample was air-dried and placed on a thin cardboard box
lid on a wooden surface. The blunt end of a rock chisel was dropped
on the sample with just enough force to disaggregate the sample.
This was done until the pieces were approximately 15 mm or smaller.
The day before analyses were run, a batch of 4 percent Calgon
solution was mixed and placed in a carboy. At the same time,
two distilled water carboys were filled and all three were left
overnight to attain room temperature. Approximately 45 grams of a
sample were weighed and put in a beaker (pint jar). The sample
was soaked overnight in 125 ml of 4 percent Calgon solution. A
test cylinder of 125 ml 4 percent Calgon solution was prepared
to determine the hydrometer weight of the Calgon. After soaking,
the sample was put in the mechanical analysis stirred with some
distilled water and agitated for one to two minutes. It was
then decanted into a settling cylinder. If any clay balls coated
with sand grains were present, they were gently flattened with a
glass stirring rod and agitated in the stirrer with additional
distilled water until completely dispersed before being added
to the settling cylinder. The cylinder was topped off with
distilled water and agitated fo.r about 45 seconds with a rubber
stopper full of holes attached to an iron rod. Any sand or
gravel clinging to the stopper was washed off with distilled
water into the soaking beaker and added to the sample during wet-
... •• .. ... .. .. •
1 I I
I r
I ' I
I
I
1 I
165
sieving. The sample was left to settle for approximately two and
one-half hours depending on the water (room) temperature (two
0 hours thirty-three minutes for 22 C), The hydrometer reading
was recorded and the test Calgon reading subtracted from it to
obtain the clay weight, The sample was then wet-sieved and the
sand and gravel was returned to the soaking beaker. The sample
0 was dried overnight in an oven at 100 C. The sample was then
put on the Ro-Tap mechanical shaker for ten minutes with No. 10
(2 llllll), No. 18 (1 mm), and No. 230 (63 microns) sieves. The sand
envelopes were weighed during sieving then filled with the sand
and gravel fraction and weighed again subtracting the envelope
weight to obtain the sand and gravel weight. The gravel was
subtracted from the original sample weight and the corrected
weight was used to calculate the sand, silt, and clay percentages.
All weight not accounted for by the gravel, sand, and clay was
considered silt,

166
Table 8. TEXTURAL ANALYSES OF SEDIMENT AT THE TEXACO GOVERNMENT I "A" (NCT-1) SITE.
' I Depth General Descri2tion % Sand % Silt % Clay • I 1' Fill 31.1 33.2 35.7
\ 4' Fill 12.3 48.9 38.8
.1 6' Fill 3.3 56.9 39.8
9.5' Fill 0.6 36.2 63.2
11' Silty clay 0.4 31.3 68.3
I 12' Clayey silt 0.2 66.4 33.4 ·1
' 14.5' Silty clay 1.2 44.5 54.3
17' Silty clay 2.0 48.0 50.0 " .. I • ..
19.5' Clayey silt 3.1 63.6 33,3 • .. .. 22' . Clayey silt 7.4 56.1 36.5
l 22 .5' Laminated clayey silt 15.0 66.2 18.8
( 24.5' V. F. sand 64.6. 9.9 25.5
I 25.5' Clayey silt 12.8 62.8 24.4
27' Clayey silt 0.7 66.0 33.3
28' Laminated clayey silt 23.1 50.3 26.6
29' V. F. sand 61.4 16.4 22 •. 2
32' V.F. sand 55.0 18.2 26.8
33.5' Clay 0.2 15.6 84.2
42' Silty clay 0.1 41.1 58.8
64' Silty clay 0.4 40.8 58.8
Mean 14. 7 43.7 41.6

16,
{ TAJlLE 9. TEXTURAL ANALYSES OF SEDIMENT AT THE BELCO PETROLEUM
I B.N. SHEEP CK. Dl-11 SITE
Depth General Description % Sand % Silt % Clay
.1 l' Fill 11.1 53.2 35. 7
4.5' Fill 14.9 51.0 34.1
6' Fill 7.6 54.6 37.8
I 9.5 1 Drilling Fluid & Fill 12.8 52.6 34.6
11' Silt 0.2 74.3 25.5
"" ' 12' Silt 0.2 64 .3 35.5 •• ( ... ••
l •• 13.5' Silt 1.0 55.7 43.3 •• a
15' Silty Clay 4.6 41.8 53.6
19.5' Silty Clay 2.5 31.0 66.5
22' Clayey Silt 4.7 57.6 37.7
25' Clay 0.3 33.2 66.5
28' Clay 1.7 31. 7 66.6
31' Clayey Silt 1.8 58.2 40
43' Clayey Silt 17.7 47.9 34.4
Mean 5.8 50.5 43.7

168
TABLE 10, TEXTURAL ANALYSES OF SEDIMENT AT THE APACHE CORP.
1
FEDERAL #1-5 SITE
Depth General Description % Sand % Silt % Clay I
1' Fill 5.6 52.2 42 .2
4.5' Fill 10.9 58.0 31.1
6' Fill 8.3 54 .0 37. 7 ... 9' Fill 17 .o 50.8 32.2 '"" 111, ..
'" 11' F.ill 25.2 47 .o 27.8 . ., ••
12' Silt 6.4 66.9 26.7
14' Silt 18.6 55.8 25.6
15' Silt 8.1 59. 7 32.2
17' Silt 11.6 61. 7 26.7
26' Clayey Silt 4.0 63.7 32.3
28' Silt 19.4 60.5 20.1
30' Silty Sand 59.6 29.3 11.1
45' Silt 8.1 66.3 25.6
Mean 15.6 55.8 28.6

169
I '
TABLE 11. TEXTURAL ANALYSES OF SEDIMENT AT THE TEXACO
1
CHARLSON MADISON NORTH UNIT Cl33 SITE
Depth General Description % Sand % Silt % Clay
I l' Fill 20.7 51.5 27.8
I 4.5 1 Fill 24.1 37.4 38.5
6' Fill 18.3 35.1 46.6
8' Fill 46.0 37.0 17.0 ••• ... D ••
11' Sandy Silt 41.4 43.1 15.5 " ,, •
13' Silty Sand 44 .2 40.9 14.9
15' Clayey Silt 17 .5 57,0 25.5
16.5' Clayey Silt 7. 9 64.4 27.7
18' Sandy Silt 27.7 52,3 20.0
28' Clayey Silt 1.1 50.1 48.8
32' Silty Clay 1.5 21.9 76 .6
Mean 22.8 44.6 32.6

'
I
I I
APPENDIX D
WATER ANALYSES
.. .. .. .. .. ..

Sta. Instrt.m1entation Number
Date-X Sampling date or mean
Cond. Specific conductance in micrombos/cm. TDS Total dissolved solids in milligrams/litre Fe Iron in milligrams/litre
' Mn Manganese in milligrams/litre
I Ca Calcium in milligrams/litre Mg Magnesium in milligrams/litre
I Total H. Total hardness in milligrams/litre
\ K Potassium in milligrams/litre Na Sodium in milligrams/litre
i Cl Chloride in milligrams/litre .. .. so Sulfate in milligrams/litre ... Tolal ..
A. Total alkalinity (CaC03) in milligrams/litre ... • HC03 Bicarbonate in milligrams/litre ' C03 Carbonate in milligrams/litre F Fluoride in milligrams/litre % Na Percent sodium As Arsenic in micrograms/litre Ba Barium in micrograms/litre Cd Cadmium in micrograms/litre Cr Chromium in micrograms/litre Cu Copper in micrograms/litre Pb Lead in micrograms/litre pH Field pH Se Selenium in micrograms/litre Temp. Field temperature in degrees Celsius Turb. Turbidity Zn Zinc in micrograms/litre SAR Sodium absorption ratio N03 Nitrate reported as Nin milligrams/litre

172
TABLE 12. RESULTS OF QUARTERLY WATER SAMPLING FROM INSTRUMENT STATIONS AT TEXACO INC. GOV'T, uAn (NCT-1) SITE
Instr, No. Sampling Date
9/3/80 1/7/81 6/8/81 10/9/81
* -\ 0 0 0 0
* A2 0 0 0 0
* A3 0 0 0 0
A4 X X ... :!ti !I~
* AS X 0 X X .. w "
* A6 X 0 0 X
* ~ X X X X
* As 0 X 0 0
* A9 0 0 0 0
* AlO X
-\1 X X X 0
Al2 0 0 0 0
-\3 X X X X
X Water sample obtained from instrument
0 No sample obtained from instrument
- Sampling device not yet instrumented
* Soil water sampler
I

173
Sta. A4 A4 A4 AS AS ~ Date-X 6/27/81 10/9/81 - 9/30/80 7/17/81 10/9/81 X
Cond. 18,200 23,100 20,650 49,800 44,000 44,100 TDS 17,300 22,400 19,850 32,700 32,000 32,200 Fe 0.42 0.67 o. 55 0.30 0.30 0.54 Mn l. 77 2.49 2.13 8.70 6.03 5.16 Ca 565 532 549 1570 1460 1480 Mg 522 707 615 760 760 770
I Total H. 3560 4240 3900 7060 6770 6860 K 77. 7 59.2 68.5 148 152 133
\ Na 4080 6630 5355 11,400 10,300 Cl 2000 3500 2750 14,000 16,200 15,000 .. 504 9550 10,100 9825 4480 3590 4260 .. ,. ,, Total A. 911 1220 1066 587 520 564 ,,
' HC03 1110 1490 1300 717 636 689 co3 0 0 0 0 0 0 F 0.2 0.2 0.2 0.3 0.2 0.2 % Na 71. 2 77.l 74. 2 77.8 75,2 76.4 As 22 29 26 -- 24 24.7 Ba 260 60 160 160 50 Cd 3.2 4.0 3.6 8.5 10.4 Cr 1.5 4.9 3.2 74.4 78.0 Cu 74.0 19. 6 46.8 141 111 Pb 4 13 8.5 36 34 pH 7.2 6.5 6.9 6.7 6.8 6.1 Se <2 <2 <2 Temp. 11.0 10.0 11.0 18.0 14.0 15 Turb. 1.0 5.0 3.0 5,00 2,0 4.0 Zn 103 145 124 158 175 SAR 29.7 44.2 37 .o 59.2 50.3 54.0 N0
3 <2 85.6 42.8 2.00 5.0 2.00
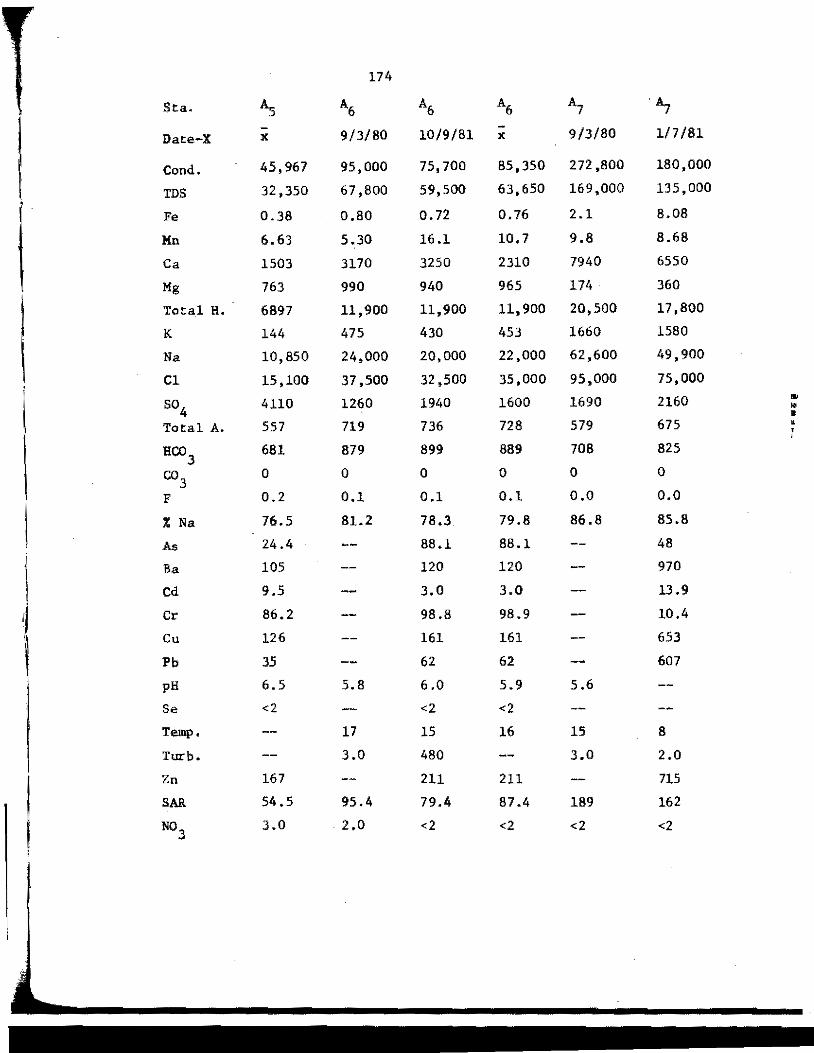
174
Sta. AS A6 A6 A6 A7 ·~
Date-X X 9/3/80 10/9/81 X 9/3/80 1/7 /81
Cond. 45,967 95,000 75,700 85,350 272,800 180,000
TDS 32,350 67,800 59,500 63,650 169,000 135,000
Fe 0.38 0.80 o. 72 0.76 2.1 8.08
Mn 6.63 5.30 16.1 10.7 9.8 8.68
Ca 1503 3170 3250 2310 7940 6550
Mg 763 990 940 965 174 · 360
Total H. 6897 11,900 11,900 11,900 20,500 17,800
K 144 475 430 453 1660 1580
Na 10,850 24,000 20,000 22,000 62,600 49,900
Cl 15,100 37,500 32,500 35,000 95,000 75,000
so4 4110 1260 1940 1600 1690 2160 ,. .. •
Total A. 557 719 736 728 579 675 • ' I
HC03 681 879 899 889 708 825
co3 0 0 0 0 0 0
F 0.2 0.1 0.1 0.1 o.o o.o % Na 76.5 81.2 78.3 79.8 86.8 85.8
1
A,; 24.4 88.1 88.1 48
Ba 105 120 120 970
11
Cd 9.5 3.0 3.0 13.9
Cr 86.2 98.8 98.9 10,4
' Cu 126 161 161 653
Pb 35 62 62 607
pH 6.5 5.8 6.0 5.9 5.6
Se <2 <2 <2
Temp, 17 15 16 15 8
Turb. 3.0 480 3.0 2.0
Zn 167 211 211 715
SAR 54.5 95.4 79.4 87.4 189 162
No3
3.0 2.0 <2 <2 <2 <2
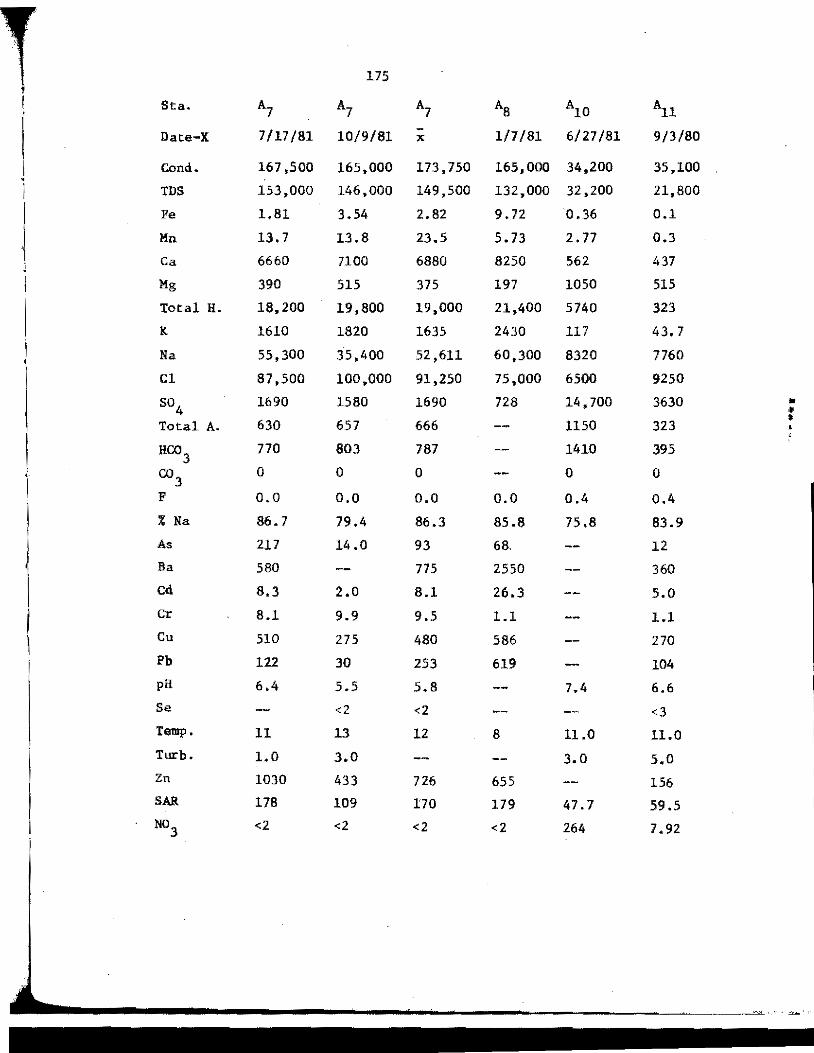
175
Sta. A7 A7 A7 AS AlO All
Date-X 7/17/81 10/9/81 X 1/7 /81 6/27/81 9/3/80
Cond. 167,500 165,000 173,750 165,000 34,200 35,100
I IDS 153,000 146,000 149,500 132,000 32,200 21,800
j Fe 1.81 3.54 2.82 9.72 0.36 0.1
Mn 13.7 13.8 23.5 5.73 2. 77 0.3
Ca 6660 7100 6880 8250 562 437
Mg 390 515 375 197 1050 515
Total H. 18,200 19,800 19,000 21,400 5740 323
K 1610 1820 1635 2430 117 43.7
Na 55,300 35,400 52,611 60,300 8320 7760
Cl 87,500 100,000 91,250 75,000 6500 9250
so4
1690 1580 1690 728 14,700 3630 • • • Total A. 630 657 666 1150 323
HC03 770 803 787 1410 395
co3
0 0 0 0 0
F o.o o.o o.o o.o 0.4 0.4
% Na 86.7 79.4 86.3 85.8 75.8 83.9 As 217 14.0 93 68. 12 Ba 580 775 2550 360 Cd 8,3 2.0 8.1 26.3 5.0 Cr 8.1 9.9 9.5 1.1 1.1 Cu 510 275 480 586 270 Pb 122 30 253 619 104 pH 6.4 5.5 5.8 7.4 6.6 Se <2 <2 <3 Temp. 11 13 12 8 11.0 11.0 Turb. 1.0 3.0 3,0 5.0 Zn 1030 433 726 655 156 SAR 178 109 170 179 47.7 59.5
N03 <2 <2 <2 <2 264 7.92
-----------------------·-··~-~~· . - '

176
I Sta. All All Ai1 Ai3 Al3 Al3 ' -
Date-X 1/7/81 6/2 7 /81 X 9/3/80 l/7 /81 6/8/81
Cond. 22,500 19,800 25,800 21,000 15,000 15,400
TDS 13,200 13,200 16,067 14,400 12,500 12,100
l Fe 0.58 1.54 • 74 0.8 0.34 0.32
Mn 0.6 0.600 0.5 1.8 o. 71 1.21
Ca 266 187 297 256 192 171
I Mg 305 186 335 252 153 121
I Total H. 1920 1230 1158 1670 1100 926
K 39.8 33.2 38.9 31.2 33.5 26.l i Na 4890 4310 5653 5120 3980 3560
Cl 5250 5250 6583 2750 1700 1000
so4
2300 2970 2967 5420 5820 6590 • > • Total A. 347 486 385 1010 1110 1160
HC03 424 594 471 1240 1360 1420
• co3 0 0 0 0 0 0 I ' F '(). 5 o.s 0.5 0.5 0.4 0.5
% Na 84.6 88.3 85.6 86.8 88.5 89.2
As ll 12 16 16 25
Ba 130 245 260 250
Cd 3.1 4.1 5.6 8.5 5.9
Cr 8.8 5.0 6.0 2.3 10.4
Cu 77 .o 174 204 127 135
Pb 137 121 23 64 29
pH 7.8 7.2 6.9 7.6
Se <3 <3
Temp. 8.0 13 11 11 8 11
Turb. 3.0 44 50 3.0 5.0 Zn no 133 211 102 272
SAR 48.5 53.3 54.3 51.9 50.8 N0
3 2.0 <2 3.97 21.6 <2 <2
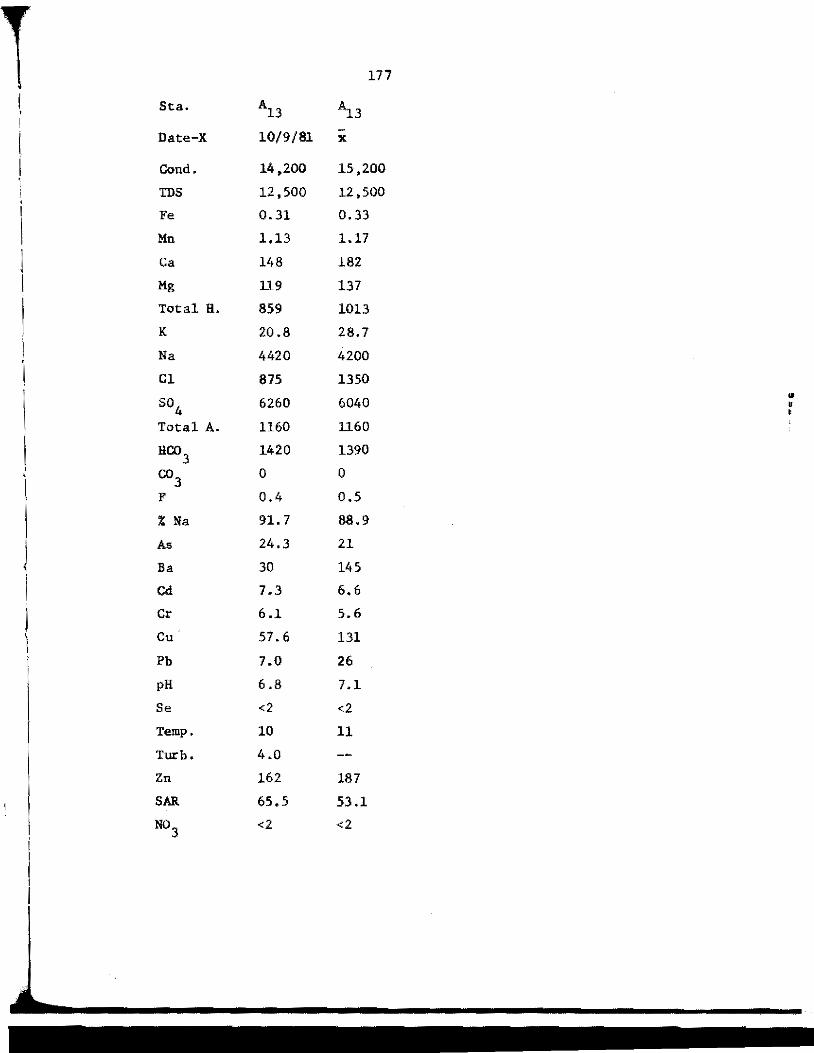
177
Sta. Al3 ~3
Date-X 10/9/81 -X
Cond. 14,200 15,200
TDS 12,500 12,500
Fe 0.31 0.33
Mn 1.13 1.17
Ca 148 182
Mg 119 137
Total H. 859 1013
K 20.8 28. 7
·1
Na 4420 4200
Cl 875 1350
I so4 6260 6040 • •
' l Total A. 1160 1160
I HC03 1420 1390
' co3 0 0
I F 0.4 o.s
:t Na 91.7 88.9
As 24,3 21
Ba 30 145
Cd 7.3 6.6
Cr 6.1 5.6
Cu 57.6 131
Pb 7.0 26
pH 6.8 7.1
Se <2 <2
Temp. 10 11
Turb. 4.0
Zn 162 187
SAR 65.5 53.1
N03 <2 <2
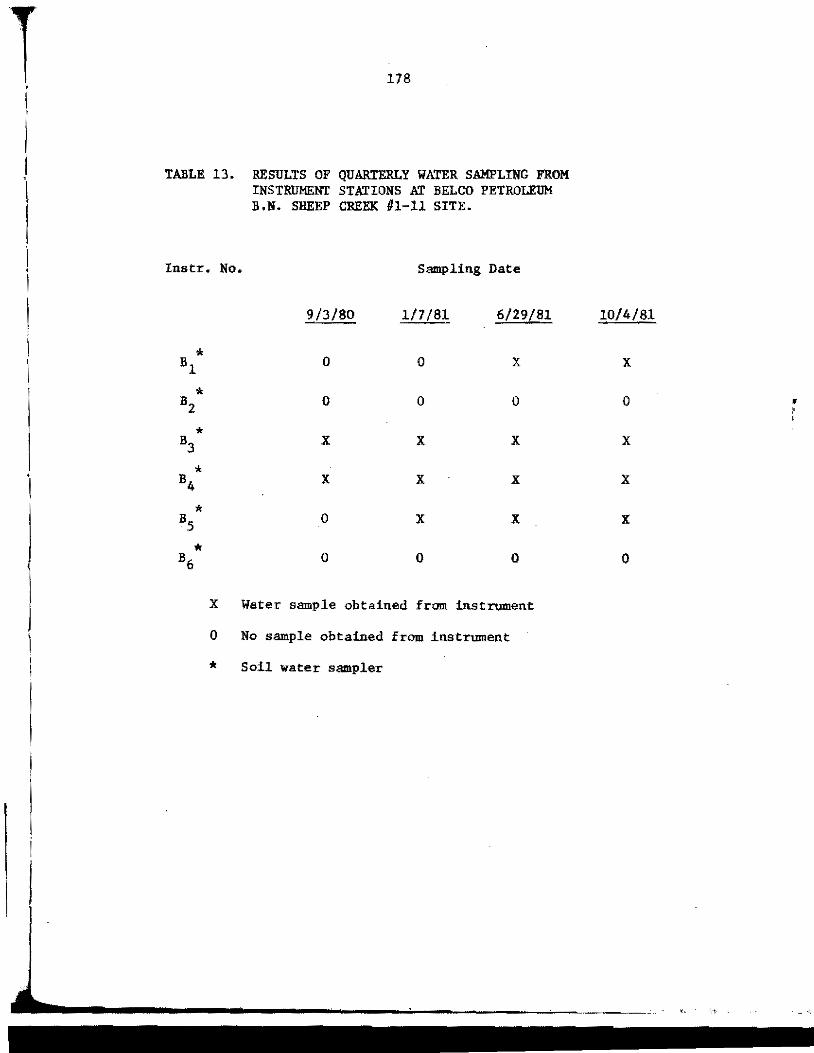
I '
I 'l
I I • I
I
·1
178
TABLE 13. RESULTS OF QUARTERLY WATER SAMPLING FROM INSTRllMBNT STATIONS AT BELCO PETROLEUM B.N. SHEEP CREEK #1-11 SITE.
Instr. No. Sampling Date
* Bl
* B2
* B3
* B4
* B5
* B6
9/3/80 1/7 /81 6/29/81
0 0 X
0 0 0
X X X
X X X
0 X X
0 0 0
X Water sample obtained from instrument
0 No sample obtained from instrument
* Soil water sampler
10/4/81
X
0 • ' '
X
X
X
0
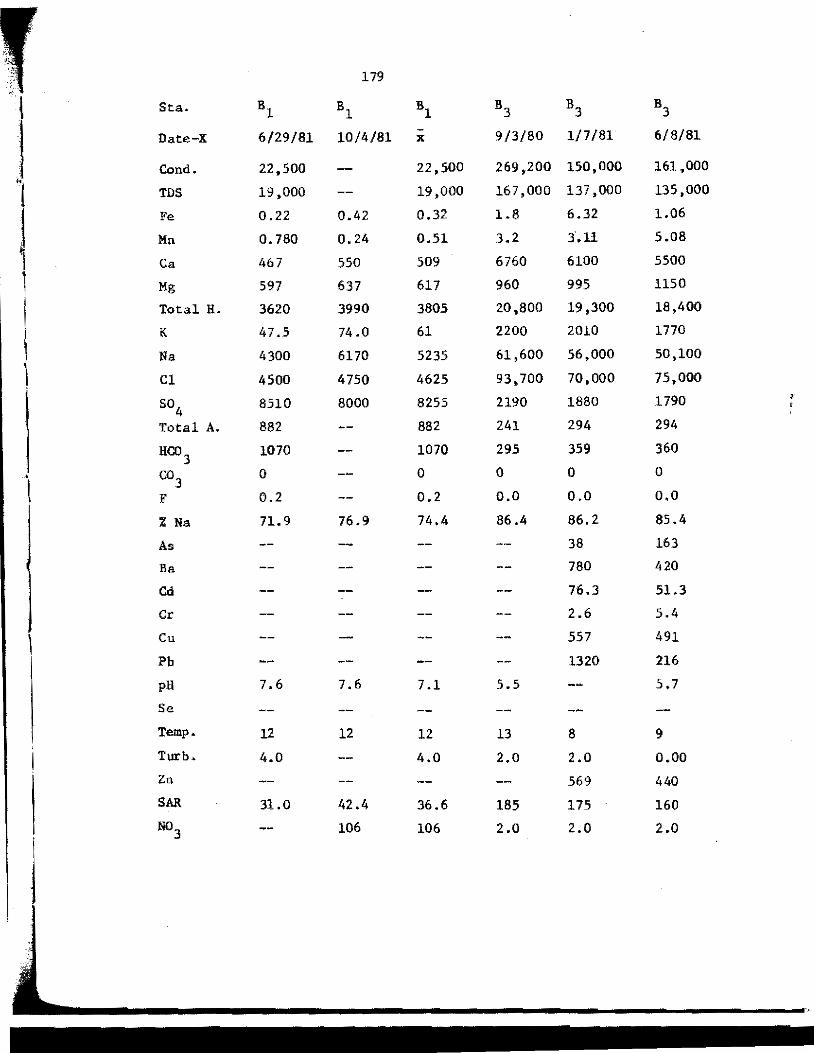
179
l Sta. Bl Bl Bl B3 B3 B3
I Date-X 6/29/81 10/4/81 - 9/3/80 1/7/81 6/8/81 X
Cond. 22,500 22,500 269,200 150,000 161,000 h,
l TDS 19,000 19,000 167,000 137,000 135,000
Fe 0.22 0.42 0.32 1.8 6.32 1.06
Mn 0.780 0.24 0.51 3.2 3.ll 5.08
1 Ca 467 550 509 6760 6100 5500 • I Mg 597 637 617 960 995 1150
I Total H. 3620 3990 3805 20,800 19,300 18,400
K 47.5 74.0 61 2200 2010 1770
i Na 4300 6170 5235 61,600 56,000 50,100
Cl 4500 4750 4625 93,700 70,000 75,000
so4
8510 8000 8255 2190 1880 1790 • '
Total A. 882 882 241 294 294
HC:03 1070 1070 295 359 360
• co3 0 0 0 0 0
\ F 0.2 0. 2 0.0 o.o o.o % Na 71.9 76.9 74.4 86.4 86.2 85.4
As 38 163
Ba 780 420
Cd 76.3 51.3
Cr 2.6 5.4
Cu 557 491
Pb 1320 216
pH 7.6 7.6 7.1 5.5 5,7
Se
Temp. u 12 12 13 8 9
Turb. 4.0 4.0 2.0 2.0 o.oo Zn 569 440 SAR 31.0 42.4 36.6 185 175 160 N0
3 106 106 2.0 2.0 2.0
i
1
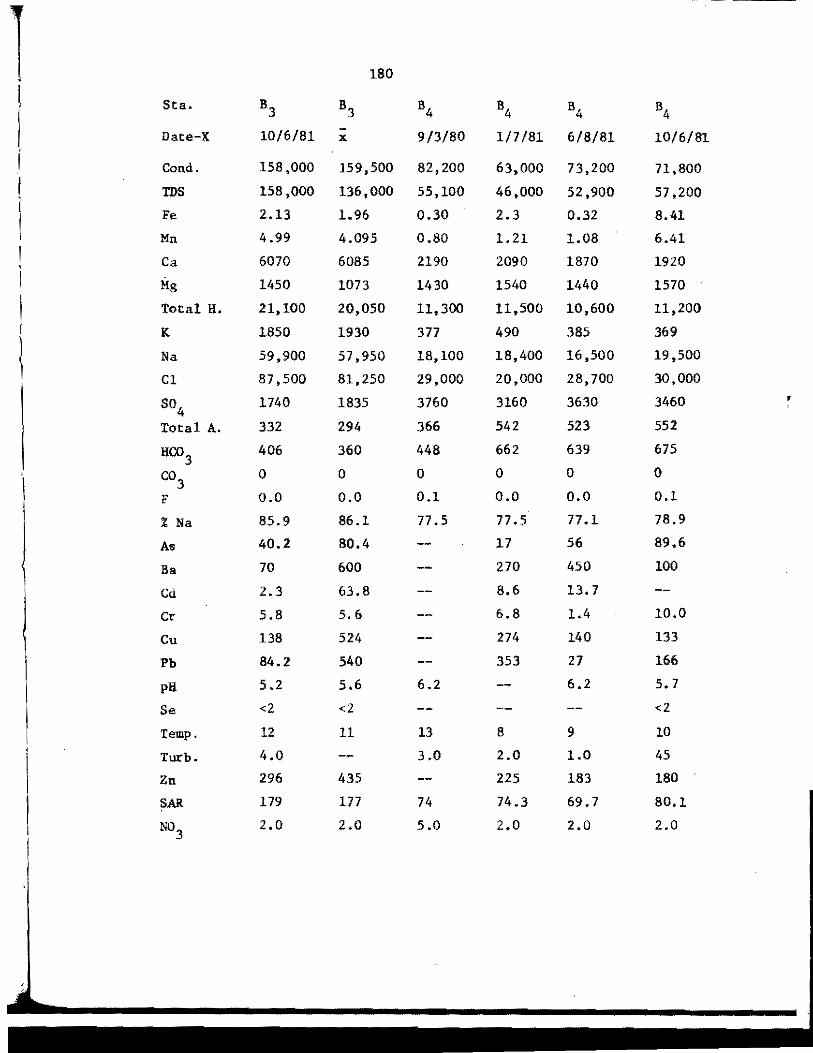
1 180
Sta. B3 B3 B4 B4 B4 B4
Date-X 10/6/81 X 9/3/80 1/7 /81 6/8/81 10/6/81
Cond. 158,000 159,500 82,200 63,000 73,200 71,800
TDS 158,000 136,000 55,100 46,000 52,900 57,200
Fe 2.13 1.96 0.30 2.3 0.32 8.41
Mn 4.99 4.095 0.80 1.21 1.08 6.41
Ca 6070 6085 2190 2090 1870 1920
Mg 1450 1073 1430 1540 1440 1570
I Total H. 21,100 20,050 11,300 11,500 10,600 11,200
K 1850 1930 377 490 385 369 1 Na 59,900 57,950 18,100 18,400 16,500 19,500 1 Cl 87,500 81,250 29,000 20,000 28,700 30,000
I so4 1740 1835 3760 3160 3630 3460
Total A. 332 294 366 542 523 552
I HC03 406 360 448 662 639 675
' co3 0 0 0 0 0 0
I F 0.0 0.0 0.1 0.0 0.0 0.1 I % Na 85.9 86.1 77.5 77.5 77.l 78.9
1 As 40.2 80.4 17 56 89.6
Ba 70 600 270 450 100
I Cd 2.3 63.8 8.6 13.7
l Cr 5.8 5. 6 6.8 1.4 10.0
\ Cu 138 524 274 140 133
' Pb 84.2 540 353 27 166 I pH 5.2 5.6 6.2 6.2 5.7
Se <2 <2 <2
Temp, 12 11 13 8 9 10
Turb. 4.0 3.0 2.0 1.0 45
Zn 296 435 225 183 180
SAR 179 177 74 74.3 69.7 80,1
N03 2.0 2.0 5.0 2.0 2.0 2.0

i 181
\ Sta. B4 B5 B5 B5 B5
! - 1/7/81 -Date-X X 6/8/81 10/6/81 X
I Cond. 72,500 41,000 41,000 39,400 41,000
I TDS 54,000 32,800 27,100 28,200 29,950
l Fe 1.35 1.62 4.89 11.4 5.97
Mn 1.15 3.31 2.55 2.85 2.90
Ca 2005 1060 900 950 970
Mg 1490 810 750 830 797
I Total H. 11,250 5980 5330 5790 5700
K 381 99.5 92.0 65.5 86.0
l Na 18,250 9010 7980 9410 8800 ' I Cl 28,750 12,000 13,700 13, 700 13,133
\ so
4 3545 3210 3360 2910 3160
Total A. 533 517 515 516
l HC03 651 632 629 631
. co3 0 0 0 0
l F 0.1 0.1 0.1 0.1 0.1
% Na 77.5 76.5 76.3 77. 8 76. 9
As 54.2 12 21 40.0 24.3
Ba 273 150 260 205
Cd 11.15 9.7 1.8 4.8 5,4
Cr 6.1 5.2 2.3. 8.6 5.4
' Cu 182 133 81.0 41.l 85.0
I Pb 182 205 38 36 93
pH 6.2 6.2 5.9 6.1
Se <2 <2 <2
Temp. 8 10 10 9
Turb. 50 90.0
Zn 196 158 137 164 153
SAR 74.2 50.6 47.4 53.7 50.6
N03 2.0 2.0 <2 <2 <2
I 1

1 182
TABLE 14, RESULTS OF QUARTERLY WATER SAMPLING FROM INSTRUMENT
I STATIONS AT APACHE CORP. FEDERAL 11-5 SITE
Instr, No. Sampling Date / ' 9/30/80 1/7/81 6/29/81 10/12/81 I '
l cl X X X X
c2 X X
c3,, X X
c3b X X
* c4 0 0
i cs X X l
I c6 X X
I c7,, X X
c7b X X ' I * 0 0 CB I
* Cg 0 0
* ClO 0 X
l ell X X
c12 X X X X
l c13,, X X
I c13b X X X X
cl3c X X
c14a X X
cl4b X X
c15a X X
cl5b X X
X Water sample obtained from instrument 0 No water sample obtained from instrument
Sampling device not yet instrumented or was destroyed "' Soil water sampler

r 183
I Sta. cl cl cl cl cl c2
I Date-X 9/3/80 l/7 /81 6/29/81 10/12/81 - 6/29/81 X
Cond. 6200 5400 4460 5280 5340 4230
I TDS 4630 4840 4060 4550 4590 3740
' Fe 0.12 0.2 1.3 2.47 0.75 0.25
Mn 2.44 2.66 2.69 2.85 2.68 2.82
Ca 188 181 150 177 179 154 I
I Mg 107 106 89 103 105 80.0
I Total H. 910 888 742 867 878 714
K 18.8 17 .8 16.2 19.0 18.3 16.6
I Na 1310 1130 1030 1400 1220 965
·1 Cl 25 11 13 30 19 55
so4 2260 2650 2130 2130 2195 1850
Total A. 1180 1240 1040 1120 1150 1030
HC03 1440 1520 1270 1370 1405 1250
co3 0 0 0 0 0 0
I F 0.6 0.7 0.5 0.5 0.6 0.6
% Na 75.8 73.3 75 77. 7 75 74 .5
As 7.0 14 21 7.5 11 11
Ba 260 160 240 0 200 360
Cd 5.6 0.5 2.8 1.5 2.2 2.0
Cr 1.2 1.4 2.6 1.6 1.5 6.8
Cu 134 95.0 26.0 12.3 60.5 94
Pb 27 7.0 36 6.0 17.0 6 pH 7 .1 6.8 7.5 7.1 6.8
Se <3 <2 <2
Temp. 10.1 8 11 10 11
Turb. 3.0 5.0 22.0 7.0 Zn 120 119 35 49 84 169 SAR 19.0 16.4 16.4 20.7 17. 7 15.6
N03 <2 <2 <2 <2 <2 <2

184
Sta. c2 c2 C3A C3A C3A C3B
1 10/12/81 - 6/29/81 10/12/81 6/29/81 Date-X X X
Cond. 4180 4205 4320 4410 4365 4050
TDS 3470 3605 3720 3790 3755 3650
Fe 0.08 0.17 0.47 1.27 0.87 0.24
Mn 0.14 1.48 1.81 1.86 1.84 1.27
Ca 80.0 117 150 149 150 143 I
I Mg 76.5 78.3 76.5 79.0 78 66.0
Total H. 514 614 689 698 694 630
K 14.2 15.4 17.3 13.8 15.6 16.8
J Na 1040 1003 1050 1130 1090 1040
Cl 13 34 33 33 33 23
so4
1680 1765 1740 1730 1735 1740
Total A. 929 951 1020 1080 1075 1020
HC03 1130 1190 1300 1330 1315 1250
003 0 0 0 0 0 0
I F 0.4 0.5 0.8 0.8 0.8 1.3
% Na 81.3 77 .9 76.8 77 .8 77.3 78.2
As 6.7 8.9 9 5.0 7.0 7
Ba 360 340 340 170
Cd 0.9 1.5 1. 7 1.1 1.4 1.8
Cr 2.3 4.6 2.0 1.4 1. 7 2.0
Cu 6.1 50.5 46.0 6.3 26.2 52
Pb 9.0 7.5 8 4.0 6.0 21
pH 7.5 7.1 6.9 7.7 7.3 7.0
Se <2 <2 <2 <2
Temp. 10 11 10 11
Turb. 3.0 4.0 10.0 2.0
Zn 65 117 47.0 29,0 38.0 34
SAR 19.9 17.8 17 .5 18.6 18.l 18.1
N03 <2 <2 <2 <2 <2 <2

185
Sta. C3B C3B cs cs cs C 6
• Date-X 10/12/81 9/3/80 l/7 /81 - 9/3/80
j X X
Cond, 3840 3945 4680 4000 4340 5820
I TDS 3200 3425 3420 3360 3390 4130
Fe 0.21 0.23 0,06 1.06 0.56 0.04 t
I Mn 0.98 1.13 2. 72 3.19 3.0 2.84
Ca 109 126 147 148 148 193
Mg 54 60 75.0 82.0 79 105
l Total H. 494 562 677 707 692 917
K 12.4 14.6 15.1 76.5 45.8 16.5
Na 1010 1025 998 899 949 1250
\ Cl 28 26 105 70 88 150
so4 1380 1560 1480 1470 1475 1760
Total A. 999 1010 981 1010 996 1080
HC03 1220 1235 1190 1230 1210 1330
co3 0 0 0 0 0 0
I F 1.3 1.3 0.6 0.6 0.6 0.6
% Na 81.6 79.9 76.1 73.3 73. 7 74.6
As 6.8 6.9 3.0 a.o 5.5 4.0
Ba 60 110 120 180 150 20
Cd 0.7 1.3 1.9 0.7 1.3 1.0
Cr 2.1 2.1 o.o 0.8 0.4 0.4
Cu 6.9 29.5 63 .o 16.0 40.0 99.0
Pb 5 13 7.0 7.0 7.0 3.0
pH 7.8 7.4 6.8 6.8 6.6
Se <2 <2 <3 <3 <3
Temp. 10 10.5 8 10.5
Turb. 4.0 2.0 2.0
Zn 24.0 29 .o 136 48 92 206
SAR 19.8 19.0 16.6 14.6 15.6 1.7 .9
N03
<2 <2 <2 <2 <2 <2
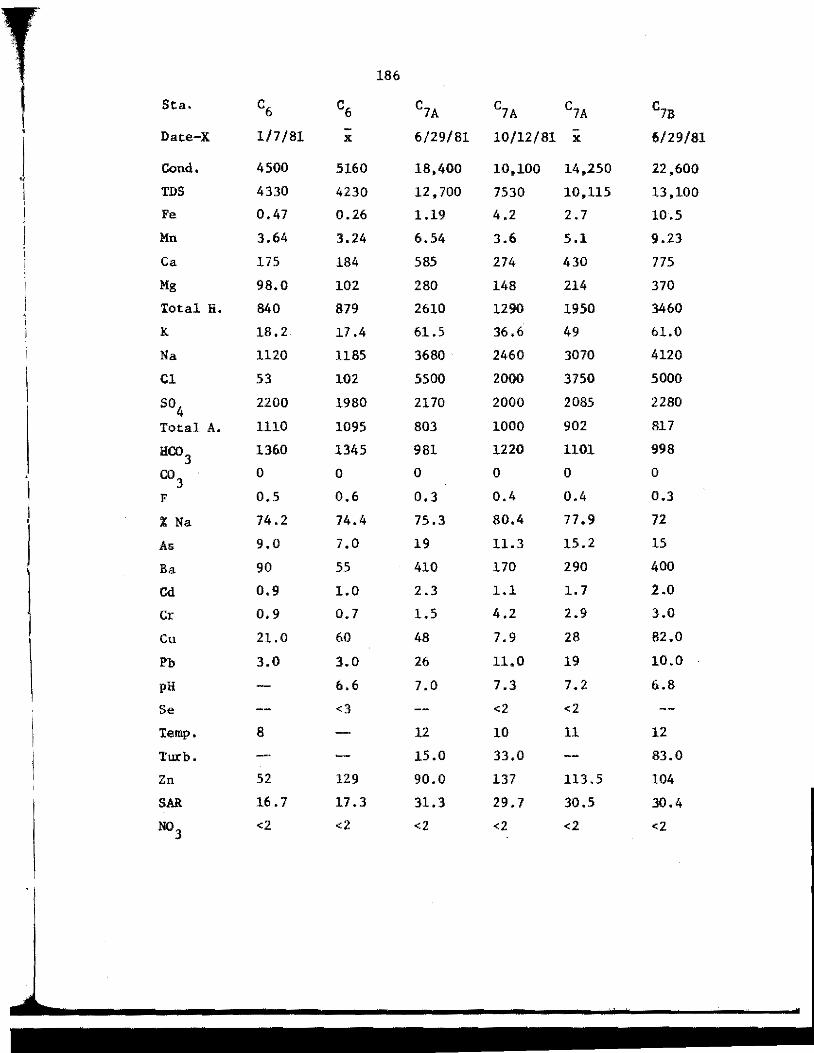
186
Sta. c6 c6 C7A C7A C7A C7B
Date-X 1/7/81 - 6/29/81 10/12/81 - 6/29/81
I X X
Cond, 4500 5160 18,400 10,100 14,250 22,600 ~
I TDS 4330 4230 12,700 7530 10,115 13,100
Fe 0.47 0.26 1.19 4.2 2.7 10.5
Mn 3.64 3.24 6.54 3.6 5.1 9.23
Ca 175 184 585 274 430 775
Mg 98.0 102 280 148 214 370
Total H, 840 879 2610 1290 1950 3460
K 18,2 17 .4 61.5 36.6 49 61.0
Na 1120 1185 3680 2460 3070 4120
Cl 53 102 5500 2000 3750 5000
so4
2200 1980 2170 2000 2085 2280
Total A, 1110 1095 803 1000 902 817
HC03 1360 1345 981 1220 1101 998
co3 0 0 0 0 0 0
I F 0.5 0.6 0.3 0.4 0.4 0,3 I
% Na 74.2 74.4 75.3 80.4 77.9 72 •
l As 9.0 7.0 19 11.3 15.2 15
Ba 90 55 410 170 290 400
Cd 0.9 1.0 2.3 1.1 1. 7 2.0
Cr 0.9 0.7 1.5 4.2 2.9 3.0
Cu 21.0 60 48 7.9 28 82.0
Pb 3.0 3.0 26 11.0 19 10.0
pH 6.6 7.0 7.3 7.2 6.8
Se <3 <2 <2
Temp. 8 u 10 11 12
Turb. 15.0 33.0 83.0
Zn 52 129 90.0 137 113.S 104
SAR 16. 7 17.3 31.3 29.7 30.S 30.4
N03 <2 <2 <2 <2 <2 <2
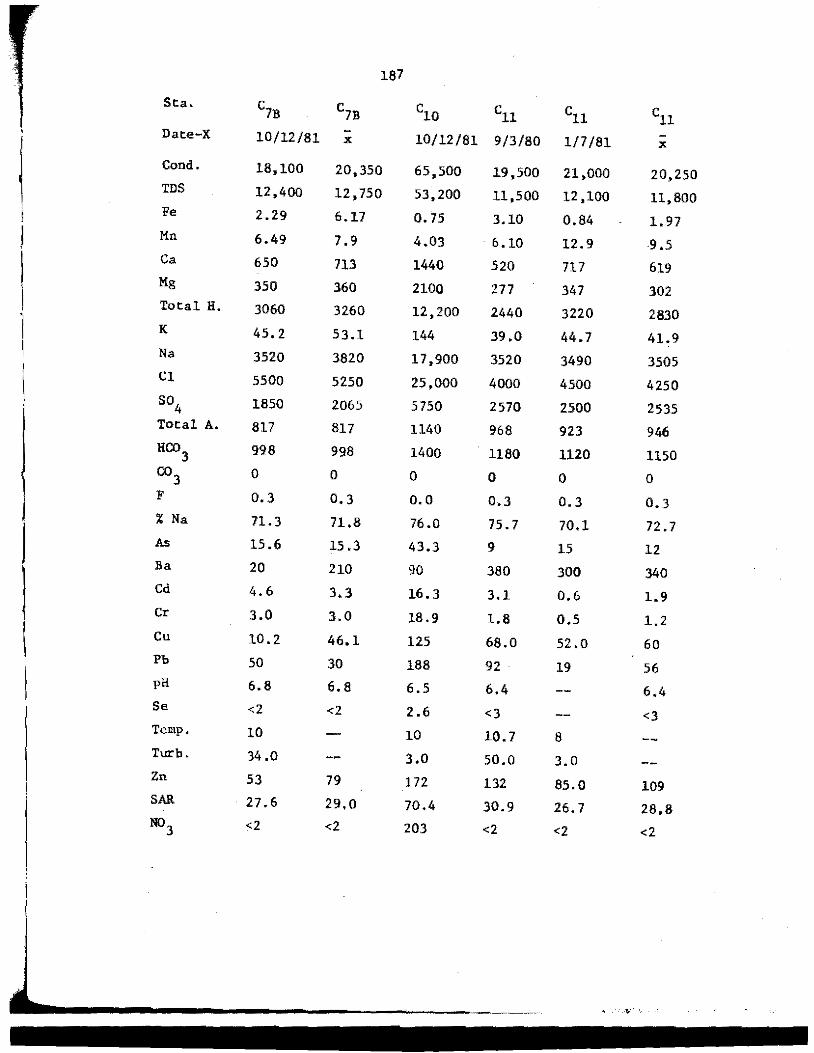
187
Sta. C7B C7B ClO c11 ell c11 Date-X 10/12/81 X 10/12/81 9/3/80 1/7 /81 X
Cond. 18,100 20,350 65,500 19,500 21,000 20,250 TDS 12,400 12,750 53,200 11,500 12,100 11,800 Fe 2.29 6.17 o. 75 3.10 0.84 1.97 Mn 6.49 7.9 4.03 · 6.10 12.9 9,5 Ca 650 713 1440 520 717 619 Mg 350 360 2100 277 347 302 Total H. 3060 3260 12,200 2440 3220 2830
1 K 45,2 53.l 144 39.0 44.7 41.9 ! Na 3520 3820 17,900 3520 3490 3505
\ Cl 5500 5250 25,000 4000 4500 4250 so
4 1850 2065 5750 2570 2500 2535 Total A. 817 817 1140 968 923 946 HC03 998 998 1400 1180 1120 1150 co3 0 0 0 0 0 0 F 0.3 0.3 0.0 0.3 0.3 0,3
J % Na 71.3 71.8 76.0 75.7 70.1 72. 7
J As 15.6 15 .3 43.3 9 15 12 Ba 20 210 90 380 300 340 Cd 4.6 3,3 16. 3 3.1 0.6 1.9 Cr 3.0 3.0 18.9 1.8 0.5 1.2
I Cu 10.2 46.1 125 68.0 52.0 60 Pb 50 30 188 92 19 56
I pH 6.8 6.8 6.5 6.4 6.4 Se <2 <2 2.6 <3 <3 Temp, 10 10 10.7 8 Turb. 34.0 3.0 50.0 3.0 Zn 53 79 172 132 85.0 109 SAR 27.6 29,0 70.4 30.9 26.7 28,8 N03 <2 <2 203 <2 <2 <2
------------------··

l 188
\ Sea. c12 c12 c12 c12 c12 Cl3A
9/3/80 1/7 /81 6/29/81 10/12/81 - 6/29/81
I Date-X X
Cond. 14,200 12,000 14,600 15,800 14,400 13,600
i TDS 8590 9660 11,000 11,500 10,330 10,000
Fe 0.7 0.54 10.7 15.6 5.6 0.25
Mn 5.6 8.28 9.86 11.0 9.1 5.0
Ca 525 680 715 745 698 515
Mg 287 372 385 455 379 267 i Total H. 2490 3230 3370 3730 3300 2380 I K 38.7 34.7 33 35.7 35,2 33.5 I Na 2120 2310 2660 3000 2485 2660 I I
Cl 2750 2750 3500 3750 3125 3250
so4 2360 3030 3290 3060 3045 2820
Total A, 846 814 811 804 813 761
HC:03 1030 994 991 982 993 930
1 co
3 0 0 0 0 0 0
J. F (). 3 0.3 0.3 0.2 0.3 0.4
% Na 64. 7 60.7 63.1 63.5 63,3 70.7
As 10.0 17.0 11.0 3.9 10.5 8
Ba 160 140 150 150 470
Cd 2.4 0.5 1.3 o.s 0.9 3.9
Cr 2.3 1.2 1.9 2.0 2.0 2.6
Cu 76 41.0 54 10.3 48 72 Pb 26 11 13 6.0 12 27 pH 6.5 6.9 7.2 6.9 7,1 Se <3 <2 <2 Temp. 9.7 8.0 12.0 10 11.0 Turb. 25 2.0 85 112 3.0 Zn 144 67 .o 76.0 79 78 114 SAR 18.4 17.6 19.9 21.3 19.2 23.7
N03 <2 <2 <2 <2 <2 <2

r 189
l Sta, C13A C13A C13B C13B C13B C13B
10/12/81 - 1/7/81 . Date-X X 9/3/80 6/29/81 10/12/81
I Cond. 13,800 13,700 18,800 17,500 14,000 12,700
TDS 9810 9905 11,600 11,600 9580 9080
Fe 1.58 0.92 0.10 1.93 o. 75 1.53
Mn 6.13 5.6 9.10 14. 7 11.2 9.9
Ca 515 515 760 780 565 495
Mg 285 276 400 390 280 265
Total H. 2460 2420 3540 3550 2560 2320
'I K 31. 7 32.6 37.5 39,5 29.5 28.5
I Na 2780 2720 3130 2930 2510 2510
I Cl 3250 3250 4250 4650 3250 3250
so4 2480 2650 2610 2370 2390 1970
I Total A. 781 771 819 814 914 939
HC03 954 942 1000 994 1110 1140
co3 0 0 0 0 0 0
F 0.4 0.4 0.3 0.2 0.3 0.3
% Na 70.9 70.8 65.6 64 67.9 70,0
As 9.6 8.8 7 13 14 9.1
Ba 110 290 240 190 310 90
Cd 0.4 2.2 5.8 0.8 1.8 2.0
Cr 3.2 2,9 2.0 0.7 4.2 3.5
I Cu 9.2 40.6 106 73.0 49.0 12,6
Pb 7 17 78 25 10 21.0
pH 7.4 7.3 6.3 6.8 7.1
Se <2 <2 <3 <2
Temp. 10.0 10.0 8 11 10
Turb. 25 4.0 23.0 s.o 12 Zn 69 92 124 138 88 50.0
SAR 24.3 24 22.8 21.3 21.5 22.6
N03 <2 <2 <2 <2 <2 <2

i 190
l Sta. Cl3B cl3C Cl3C Cl3C Cl4A Cl4A (
Date-X - 6/29/81 10/12/81 - 6/29/81 10/12/81
I X X
Cond. 15,750 13,800 9400 12,100 4040 4060
TDS 10,590 9670 6640 8155 3610 6640
Fe 1.1 0.60 0.68 o.64 0.10 0.26
Mn 10.6 5.43 3.59 4.51 0.880 0.80
Ca 663 487 281 384 148 126
I Mg 335 245 155 200 77 .o 71.0
Total H. 3050 2220 1340 1780 688 607
K 33.5 32.7 22.9 27.8 19.4 15. 7
l Na 2720 2590 2080 2335 973 944
l Cl 3750 3250 1750 2500 13 10
! so4
2380 2610 1880 2245 1890 1640
Total A. 867 748 764 756 804 829
HC.03 1055 914 933 924 982 1010
co3 0 0 0 0 0 0
I F 0.3 0.4 0,5 0.5 0.6 0.5
' % Na 66.8 71.5 77.0 74.7 75.3 77.1
As 11.1 16 o.o 8.0 11 4.6
Ba 215 450 20 235 460 40
Cd 1.9 1.9 0.9 2.4 0,9 0.6
Cr 2.8 1.6 2.3 2.0 3.1 2.6
Cu. 61 56.0 · 9. 4 32. 7 50.0 10.0
Pb 23 12.0 10.0 11.0 14 4.0
pH 6.7 7.0 7.2 7.1 7.1 7.2
Se <2 <2 <i! <2
Temp. 11 10 11 .10
Turb. 3.0 6.0 5.0 3.0
Zn 106 65.0 38 52 78 30
SAR 22.1 23.8 24.7 24.3 16 .1 16.6
N03
<2 <2 <2 <2 <2 <2
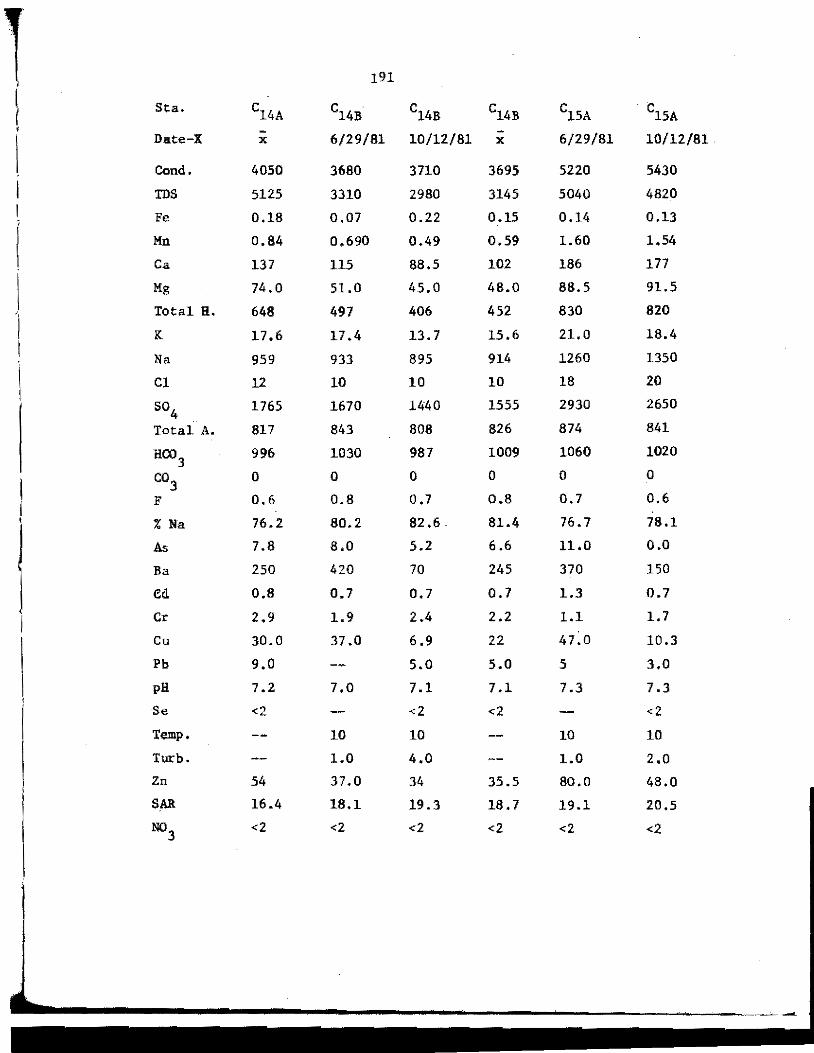
i 191
I Sta. Cl4A Cl4B Cl4B Cl4B Cl5A Cl5A
' - -I
Date-X X 6/29/81 10/12/81 X 6/29/81 10/12/81
Cond. 4050 3680 3710 3695 5220 5430
IDS 5125 3310 2980 3145 5040 4820
Fe 0.18 0.07 0.22 0.15 0.14 0.13
Mn 0.84 0.690 0.49 0.59 1.60 1.54
Ca 137 115 88.5 102 186 177
Mg 74.0 51.0 45.0 48.0 88.5 91.5 ,., Total H. 648 497 406 452 830 820
I K 17.6 17.4 13.7 15.6 21.0 18.4 I Na 959 933 895 914 1260 1350
\ Cl 12 10 10 10 18 20
504 1765 1670 1440 1555 2930 2650
Total A. 817 843 808 826 874 841
HC03 996 1030 987 1009 1060 1020
co3
0 0 0 0 0 0
F 0.6 0.8 0.7 0.8 0.7 0.6
% Na 76.2 80.2 82 .6. 81.4 76.7 78.1
As 7.8 8.0 5.2 6.6 11.0 0.0
Ba 250 420 70 245 370 150
eel. 0.8 0.7 0.7 0.7 1.3 0.7
Cr 2.9 1.9 2.4 2.2 1.1 1. 7
Cu 30.0 37.0 6.9 22 4 7 .o 10.3
Pb 9.0 5.0 5.0 5 3.0
pH 7.2 7.0 7.1 7.1 7.3 7.3
Se <2 <2 <2 <2
Temp. 10 10 10 10
Turb. 1.0 4.0 1.0 2.0
Zn 54 37.0 34 35.5 80.0 48.0
SAR 16.4 18.1 19.3 18.7 19.l 20.5
N03 <2 <2 <2 <2 <2 <2
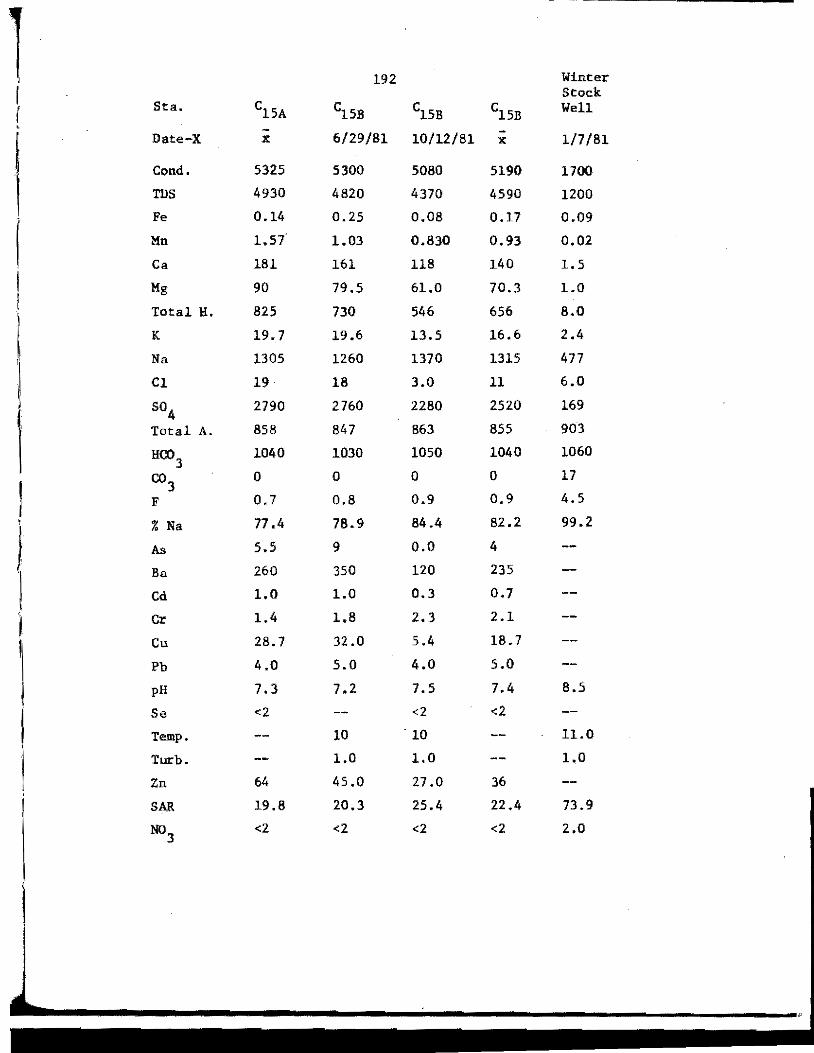
i 192 Winter
I Stock
r Sta. Cl5A ClSB Cl5B Cl5B Well
I - 6/29/81 10/12/81 -Date-X X X 1/7 /Bl
Cond. 5325 5300 5080 5190 1700
TDS 4930 4820 4370 4590 1200
Fe 0.14 0.25 0.08 0.17 0.09
f Mn 1.57 1.03 0.830 0.93 0.02
Ca 181 161 118 140 1.5
I Mg 90 79.5 61.0 70.3 1.0 ! Total H. 825 730 546 656 8.0
i K 19.7 19.6 13.5 16,6 2.4
I Na 1305 1260 1370 1315 477
'l Cl 19 18 3.0 11 6.0
I so4 2790 2760 2280 2520 169
Total A. 858 847 863 855 903
HC03 1040 1030 1050 1040 1060
co3 0 0 0 0 17
I F 0.7 0.8 0.9 0.9 4.5
' % Na 77 .4 78.9 84.4 82.2 99.2
} As 5.5 9 o.o 4
Ba 260 350 120 235
,I Cd 1.0 1.0 0.3 0.7
l Cr 1.4 1.8 2,3 2.1
I Cu 28.7 32.0 5.4 18.7
Pb 4.0 5.0 4.0 5.0
pH 7.3 7,2 7.5 7.4 8.5
I Se <2 <2 <2
Temp. 10 10 11.0
I Turb. 1.0 1.0 1.0
Zn 64 45.0 27.0 36
SAR 19.8 20.3 25.4 22.4 73.9
N03 <2 <2 <2 <2 2,0

193
' ' TABLE 15. RESULTS OF QUARTERLY WATER SAMPLING FROM I
l INSTRl.1MENT STATIONS AT TEXACO INC. CHARLSON MADISON NORTH UNIT Cl33 SITE,
' I
Instr. No. Sampling Date
9/3/81 l/7 /81 6/8/81 10/6/81
1)1 X X
* 1)2 0 0
I D3 X X
j 1)4 X X 0 X
D5 X X 0 0
l * 0 0 0 1)6 0
I * 0 X I 1)7 ' * I 1)8 X X
1 1)9 X X X X
{
I 010 X X 0 X
011 X X X X
012 X X X X
013 X X
X Water sample obtained from instrl.llllent
0 Nowater sample obtained from instrument
- Sampling device not yet instrumented
* Soil water sampler
'1
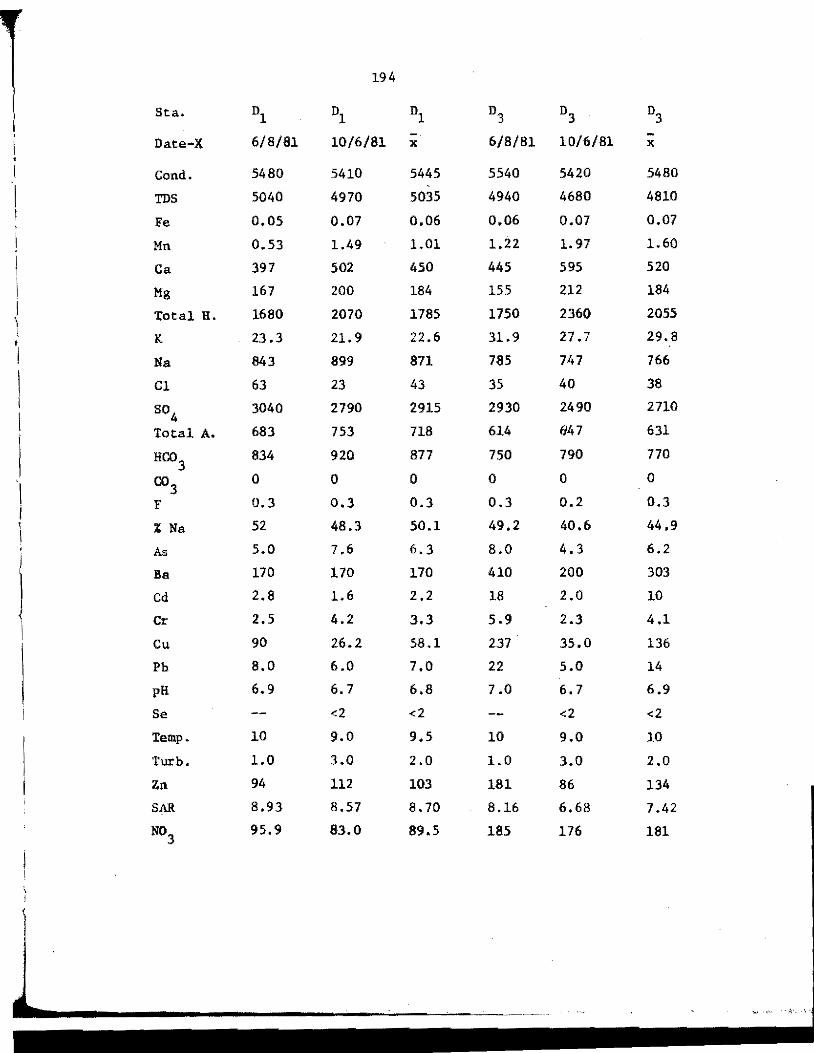
194
Sta. Dl Dl Dl D3 D3 D3
Date-X 6/8/81 10/6/81 -X 6/8/81 10/6/81 -X
I Cond. 5480 5410 5445 5540 5420 5480
I TDS 5040 4970 5035 4940 4680 4810 I Fe 0,05 0.07 0.06 0,06 0.07 0.07
Mn 0.53 1.49 1.01 1.22 1.97 1.60
Ca 397 502 450 445 595 520 '
I Mg 167 200 184 155 212 184 I Total H. 1680 2070 1785 1750 2360 2055
·1 K 23 .3 21.9 22.6 31.9 27.7 29.8 • I Na 843 899 871 785 747 766
I Cl 63 23 43 35 40 38
so4 3040 2790 2915 2930 2490 2710
I
I Total A. 683 753 718 614 64 7 631
HC03 834 920 877 750 790 770
I co3 0 0 0 0 0 0
F 0.3 0,3 0.3 0.3 0.2 0.3
1 % Na 52 48.3 50.1 49.2 40.6 44.9 I j As 5.0 7.6 6.3 8.0 4.3 6.2
) Ba 170 170 170 410 200 303
Cd 2.8 1.6 2.2 18 2.0 10
Cr 2.5 4.2 3.3 5.9 2.3 4.1
Cu 90 26.2 58.1 237 35.0 136
Pb 8.0 6.0 7.0 22 5.0 14
pH 6.9 6.7 6.8 7.0 6.7 6.9
Se <2 <2 <2 <2
Temp. 10 9.0 9.5 10 9.0 10
turb. 1.0 3.0 2.0 1.0 3.0 2.0
Zn 94 112 103 181 86 134
SAR 8.93 8.57 8.70 8.16 6,68 7.42
N03
95. 9 83.0 89.5 185 176 181

1 195
l Sta. D4 D4 D4 D4 D5 DS
Date-X 9/3/80 1/7/81 10/6/81 - 9/3/80 1/7/81 X
Cond. 11,200 12,500 11,700 11,800 16,500 26,000
TDS 6980 8930 7830 7913 11,000 21,200
Fe 0,0 0.42 0.11 0.18 o.o 1.46
Mn 0.2 0.42 0.11 0.18 0.6 0.77
Ca 542 725 757 675 510 675
Mg 352 477 472 434 667 1240
Total H. 2800 3770 3820 3467 4020 6790
K 21.2 31.3 21.2 24.6 26.7 54. 7
Na 1580 .1980 1890 1817 2830 5050
Cl 68 60 70 66 1750 4150
so4
3220 3960 2960 3380 4420 8520
Total A. 542 642 554 580 598 678
HC03 663 784 677 708 731 828
co3 0 0 0 0 0 0
F 0.2 0.2 0.2 0.2 0.3 0.2
% Na 54.9 53.l 51.6 53.2 60.3 61.6
j As 6 12 1.1 6.4 15 28
Ba 400 150 150 233 180 170
1 Cd 3.7 2.1 1.5 2.4 7.3 10.4
< Cr 4.4 1.0 3.0 2.8 3.8 7.0 I Cu · 82.0 85.0 56.0 74 164 160 I
Pb 18 5.0 5.0 9.3 20 85
pH 6.4 6.5 6.5 6.6
Se 260 <2 <2 272
Temp. 9.0 6.0 9 8 11 6
Turb. 3.0 2.0 2.0 2.0 5.0 5.0
Zn 99 75 82 85 132 160
SAR 12. 9 14.0 13,3 13.4 19.4 26.6
N03
861 1310 1310 1160 496 1140
t

196
Sta. D5 D7 D8 D8 D8 D9 - -
Date-X X 10/6/81 6/29/81 10/6/81 X 9/3/80 I •
I Cond. 21,250 27,600 27,500 36,400 31,950 19,600
TDS 6100 19,000 15,500 26,200 20,850 21,600
Fe o. 73 0.25 0.18 0.32 0.25 0
Mn 0.68 0.13 0.78 0.66 o. 72 0.2
Ca 593 575 700 1000 850 725
Mg 954 705 855 1390 1123 647
Total H. 5405 4330 5260 8210 6735 4470
K 40.7 34.2 37.7 36.0 36.9 18.2 ' I Na 3940 5970 4430 7470 5950 2810
I Cl 2950 10,000 7500 12,500 10,000 3750
so4 6470 1170 1440 3160 2300 3970
i Total A. 638 829 775 972 874 485
HC03 780 1010 947 1180 1064 593
co3 0 0 0 0 0 0
F 0.3 o.o 0.1 o.o 0.1 0.3
• % Na 61 74 .8 64.5 66.3 65.4 57.6 I
As 22 18.5 16 26.5 21.3 29 )
Ba 175 260 830 130 480 240
l Cd 8.9 4.0 9.8 4.4 7.1 19.1
Cr 5.4 2.9 3.7 22.4 13.1 13.4 i I Cu 162 40.9 69.0 74. 7 71.9 338
Pb 53 35 17 33 25 63
pH 6.6 6.4 7.0 6.2 6.6 6.5
Se 272 <2 <2 <2 136
Temp. 9.7 13 10 12 11 10
Turb. 15 3.0 4.0 3.5 11
Zn 146 120 77 111 94 454
SAR 23 39.4 26.5 35.8 31.2 18.2
N03 818 47.1 103 138 121 396
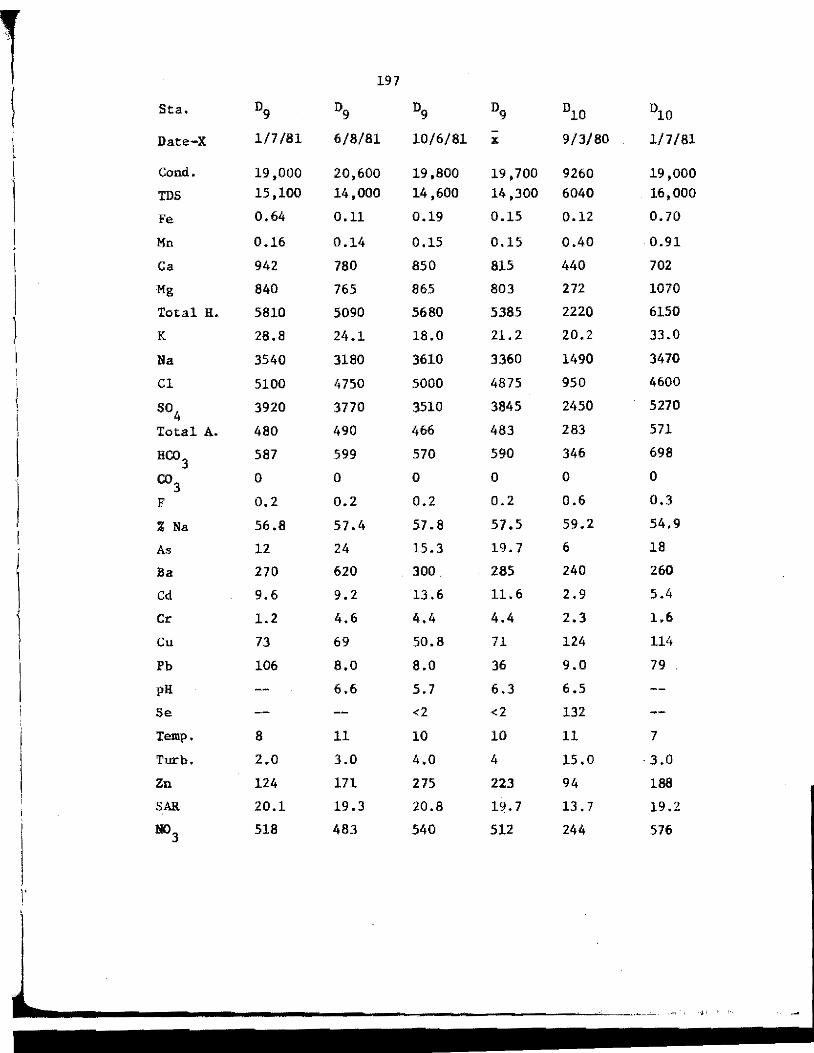
1 197
! Sta. D9 D9 D9 D9 D10 D10
I Date-X l/7 /81 6/8/81 10/6/81 X 9/3/80 1/7/81 • I Cond. 19,000 20,600 19,800 19,700 9260 19,000
I IDS 15,100 14,000 14,600 14,300 6040 16,000
Fe 0.64 0.11 0.19 0.15 0.12 0.70
I Mn 0.16 0.14 0.15 0.15 0.40 0.91
I Ca 942 780 850 815 440 702
I Mg 840 765 865 803 272 1070 I Total H. 5810 5090 5680 5385 2220 6150
1 K 28.8 24.1 18.0 21.2 20.2 33.0 '
Na 3540 3180 3610 3360 1490 3470
Cl 5100 4750 5000 4875 950 4600
so4
3920 3770 3510 3845 2450 5270
Total A. 480 490 466 483 283 571
HC03 587 599 570 590 346 698
co3 0 0 0 0 0 0
F 0.2 0.2 0.2 0.2 0.6 0.3
% Na 56.8 57 .4 57.8 57.5 59.2 54.9 I
12 24 15.3 19.7 6 18 As )
Ba 270 620 300 285 240 260
1 Cd 9.6 9.2 13.6 11.6 2.9 5.4
1 Cr 1.2 4.6 4.4 4.4 2.3 1.6
Cu 73 69 50.8 71 124 114
I Pb 106 8.0 8.0 36 9.0 79
pH 6.6 5.7 6.3 6.5
Se <2 <2 132
Te111p. 8 11 10 10 11 7
Turb. 2.0 3.0 4.0 4 15,0 3.0
Zn 124 171 275 223 94 188
SAR 20.1 19.3 20.8 19.7 13.7 19.2
N03 518 483 540 512 244 576
r

, 198
l Sta. DlO D10 Dll Dll Dll Dll
Date-X 10/6/81 -I X 9/3/80 l/7 /81 6/8/81 10/6/81 • J Cond. 15,100 14,453 7590 6400 6670 6220
l TDS 10,600 10,880 4760 5390 5010 4900
Fe 0.14 0.32 0.04 0.23 0.04 0.09
I Mn 0.07 0.46 0.64 0.880 0.53 0.51
I Ca 450 531 407 442 451 450
I Mg 635 659 237 225 235 235
Total H. 3730 4033 1990 2030 2090 2090
1 K 22.2 25,l 17.5 26.3 25.3 19.2 ·1 Na 2810 2590 995 905 1040 890
I Cl 2500 2683 775 700 750 875
$04 3340 3687 1950 2710 2150 2070 I ' Total A. 535 463 479 530 490 475
I HC03 654 566 585 648 599 580
co3 0 0 0 0 0 0
I F 0.4 0.4 0.2 0.2 0.2 0.2
% Na 61.9 58.7 51.8 49.0 51.9 47.9
As 14.4 12.8 8 17 9 o.o Ba 100 200 180 90 310 60
i Cd 2.8 3.7 5.5 15.6 9.4 1.6 i • Cr 3.8 2.6 1.8 1.5 2.8 3.0
Cu 35 .• 7 91.2 58 52 80.0 43.9
Pb 5.0 31 26 43 3.0 3.0
pH 6.5 6.5 6.6 7.2 6.4
Se <2 <2 28 <2
Temp. 10 9.3 9 7 11 9
Turb. 2.0 6.7 5.0 2.0 o.o 3.0
Zn 104 129 61.0 56.0 104 66
SAR 20.0 17.6 9.68 8. 73 9.93 8.46
N03 522 447 83.6 57.8 61.3 82.3
r

199
Sta. 011 012 012 012 012 D12
' Date-X - 9/3/80 6/8/81 10/6/81 -I X 1/7/81 X
j Cond. 6535 5430 4200 4160 3970 4180 TDS 4955 3880 4370 3570 3480 3725 Fe 0.04 0.04 0.18 0.06 0.12 0.0.9
j Mn 0.59 1.48 1.52 1.49 2.0 1.51
I Ca 446 432 437 370 435 434
I Mg 235 162 180 150 157 160 Total H. 2060 1740 1830 1540 1730 1735 ' I K 22.3 19.5 16.7 21.l ' 22. 7 22.7
·1 Na 950 600 606 521 528 564 Cl 763 225 125 95 100 113
so4 2110 2090 2680 2140 1960 2115
I Total A. 485 405 445 437 437 437
HC:03 592 495 544 534 534 534
co3 0 0 0 0 0 0
l F 0.2 0.3 0.2 0.3 0.2 0.3
% Na 50.4 42.5 41.7 42.2 39.7 42,0 ! As 11 4.0 4.0 5.0 1.3 4.0
Ba 135 180 180 450 50 180
Cd 7.5 3.4 2.5 3.3 1. 7 2.9
Cr 2.3 3.1 0.8 2.8 2.9 2.9
Cu 53 64 37.0 44.0 17.3 41
Pb 15 17 18.0 4.0 18 pH 6.7 6.5 7.4 6.5 6.8 Se 27 <2 Temp. 9,0 10 7.0 10.0 8.0 9.0 Turb. 3.0 2.0 1.0 o·.o 2.0 2.0 Zn 64 58.0 45.0 114 73 66 SAR 9.20 6.23 6.15 5. 77 5.51 5.96 N0
3 71. 9 99.6 53.7 16.5 12.2 35.1
1'
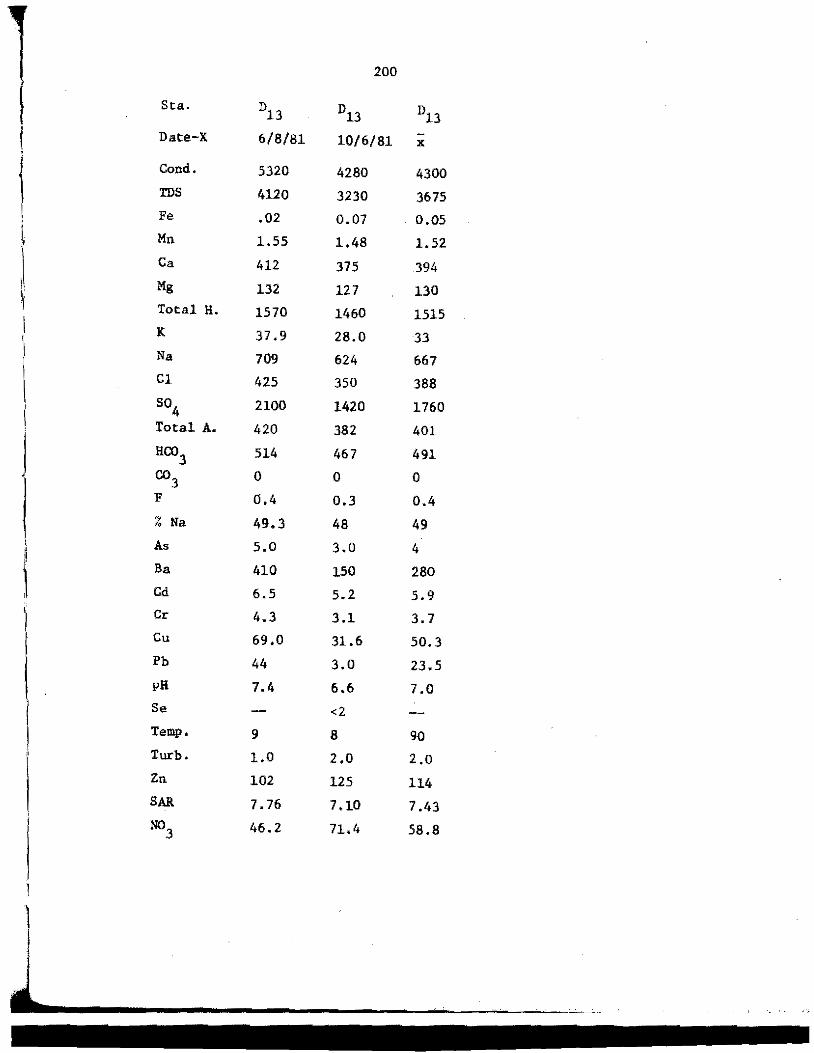
1 200
I Sta. D13 D13 Dl3
I Date-X 6/8/81 10/6/81 -X
I Cond. 5320 4280 4300 TDS 4120 3230 3675 Fe .02 0.07 0.05
1, Mn 1,55 1.48 1.52
I Ca 412 375 394 Mg 132 127 130 Total H. 1570 1460 1515 K 37.9 28.0 33 Na 709 624 667
\ Cl 425 350 388 so
4 2100 1420 1760 i Total A. 420 382 401
J Ha:>3 514 467 491
co3 0 0 0
I F 0,4 0.3 0.4 % Na 49.3 48 49 As 5.0 3,0 4
' Ba 410 150 280 l Cd 6,5 5.2 5.9 Cr 4.3 3.1 3.7 Cu 69,0 31.6 50.3 Pb 44 3.0 23.5 pH 7.4 6,6 7.0 Se <2 Temp, 9 8 90 Turb. 1.0 2.0 2.0 Zn 102 125 114 SAR 7.76 7.10 7.43
N03 46.2 71.4 58.8
1

i
I I
I I
201
TABLE 16. ELUTRIATION EXPERIMENT SEDIMENT SAMPLES FROM STUDY SITES.
Sample No. Stud)!'. Site lleEth from surface
El Texaco Gov't nA" NCT-1 8 .o ft. (2.4m)
E2 Texaco Gov't "An NCT-1 11.5 ft. (3.5m)
E3 Texaco Gov't HA" NCT-1 14.5 ft. (4.4m)
E4 Texaco Gov't "A" NCT-1 22.3 ft. (6. 8m)
ES Texaco Gov't "A" NCT-1 33.5 ft. (10.2 m)
E6 Texaco Gov't "A" NCT-1 64.5 ft, (19. 7m)
E7 Belco Petro. B.N. 1/1-11 9.5 ft. (2. 9m)
E8 Apache Federal /11-5 7.5 ft. (2.3m)
E9 Apache Federal 111-5 12.5 ft. (3.8m)
ElO Apache Federal /Jl-5 15.5 ft. (4. 7m)
Ell Apache Federal 111-5 17.5 ft. (5 .3m)
El2 Texaco Charlson Cl33 14.0 ft. (4.2m)
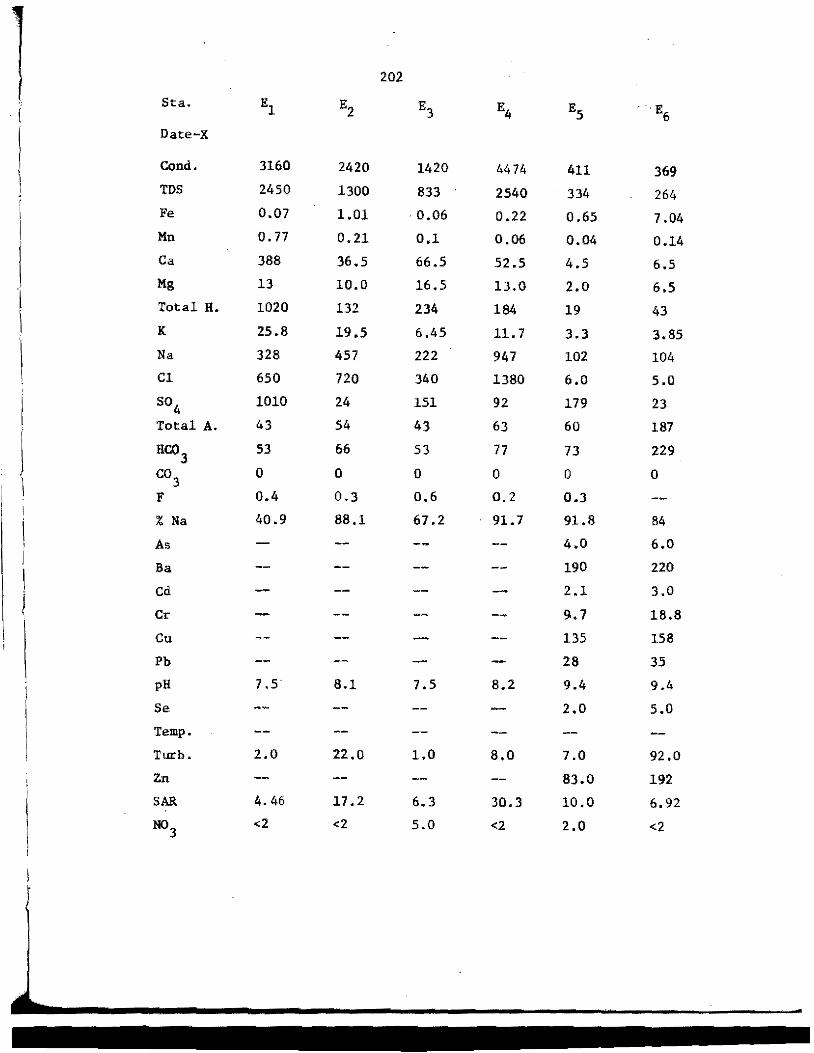
202
Sta. El E2 E3 E4 E5 E I 6 Date-X
Cond. 3160 2420 1420 4474 411 369 TDS 2450 1300 833 2540 334 264 Fe 0.07 1.01 0.06 0.22 0.65 7 .04 Mn o. 77 0.21 0.1 0,06 0.04 0.14 Ca 388 36.5 66.5 52.5 4.5 6.5 Mg 13 10.0 16.5 13.0 2.0 6.5
I Total H. 1020 132 234 184 19 43 l K 25.8 19.5 6.45 11.7 3.3 3,85
1 Na 328 457 222 947 102 104 Cl 650 720 340 1380 6.0 5.0 so4 1010 24 151 92 179 23
Total A. 43 54 43 63 60 187
HC03 53 66 53 77 73 229
co3 0 0 0 0 0 0 I F 0.4 0.3 0.6 0.2 0.3 I
% Na 40.9 88.1 67.2 91.7 91.8 84 i As 4.0 6.0 ' I Ba 190 220 I Cd 2.1 3.0 ! Cr 9.7 18,8
Cu 135 158
Pb 28 35
pH 7 .5 8.1 7.5 8.2 9.4 9.4
Se 2.0 5.0
Temp.
Turb. 2.0 22.0 LO 8.0 7.0 92.0
Zn 83.0 192
SAR 4.46 17.2 6.3 30.3 10.0 6.92
N03 <2 <2 5.0 <2 2.0 <2

203
Sta. E7 E8 E9 ElO Ell El2 Date-X
Cond. 1380 1830 2620 675 800 253 I TDS 797 1150 1230 371 542 143 I Fe 0.04 0.1 10.7 6.84 2.59 0.04 I Mn 0.08 0.02 0.14 0.12 0.04 0.01 I Ca 51.0 8.0 13.0 14.0 8.0 8.0
·1
Mg 16.0 1.0 6.0 6.0 3.0 5.5 Total H. 193 24 57 60 32 43
I K 7.2 11.9 12.7 3.45 2.8 1.4
l Na 212 390 473 135 164 45 Cl 290 350 590 5.0 64 48 so4 186 291 45 88 250 7.0 Total A. 54 163 158 195 81 45
HC:03 66 200 179 235 99 55
003 0 0 7.0 2.0 0 0 F 0.2 0.4 0.1 0.1 0.2 0.1 % Na 70.4 97.2 94.7 83.0 91.6 69.5
As 3.0 5.0 10.0 9.0 7.0
Ba 420 320 200 230 210
Cd 0.8 1.0 2.6 2.6 1.2 Cr 1.2 26.6 17 .6 7.4 6.3 Cu 19.0 60.0 101 142 60.0
Pb s.o 15.0 23.0 14.0 13.0 pH 8.2 8.6 9.8 10.0 9.6 9,1
Se 0 11.0 8.0 0 0 Temp.
Turb. 1.0 1.0 35.0 4.0 15.0 3.0 Zn 24 30 52.0 94.0 30.0 SAR 6.64 34.5 27.2 7 .62 12.5 2,99 N0
3 <2 <2 <2 <2 2.0 <2
I r
------------------'------~.~-

f I
l I !
l l \ l I I
I I I i I
i
APPENDIX E
ISOCONCENTRATION MAPS OF SELECTED PARAMETERS FROM WITHIN THE SATURATED ZONES AT THE APACHE FEDERAL #1-5 AND TEXACO CHARLSON
Cl33 SITES.

l:i ....... _ ....... -- --·-- ------ ------- - - ---'-- ---·--· ___ , ___ -----~------ ----- -s - d Ill
- --
Background Level Is 3500-&lOO RCL Is 500 mg/L
" ' ' ' ' l
____ _,,
'\. \ I
/
•
I
Bockground L.avel Is 7. 0. 7. 2
J "-'),
/
' TOTAL DISSOL.VED SOLIDS TDS C.l.= 1000 l FIELD H C.l.: 0.2 ~
Background L.avel is 75-78% Background Lsvel is 16-20 '-"
',l~;/ ~~x'; '!,~\ ~/
I
:t"'
•
:
.. loL <>i\l\11 •M C.I.• 5% I SODIUM ABSORPTION RATIO {SAR} "T • ,,-F--/
~ NORTH Fig. 59. lsoconcenlrotion mops for TOS, pH., '%No ond SAR ot Apache Federal "'I· 5.
IOOm. 0 lOO!t.

_____________________ , __ _.. ____ -·-----· ··---- ---- --.--.. •
Background Level Is 600-SOOmg/L Background Level Is 800-1200 mg/L
t ,
, TOTAL HARDNESS - C.!.= 500m/L TOTAL ALKALINITY C.I. = 50 m /L ~
Background Level is 1200-1400mg/L Background Level Is 2000-2500 mg/ L "'
•
I /
t
" ··--- CI. • 50111ll !L I SULFATE
I 8
!a ;"' : C.I.: 500mg/L
0 100ft. ,oo m Fig.GO. lsoconcentrotion maps fort. hardness,t.alkafinity, HCO{ and soj-- at Apache Federal •1-5 ~ NORTH
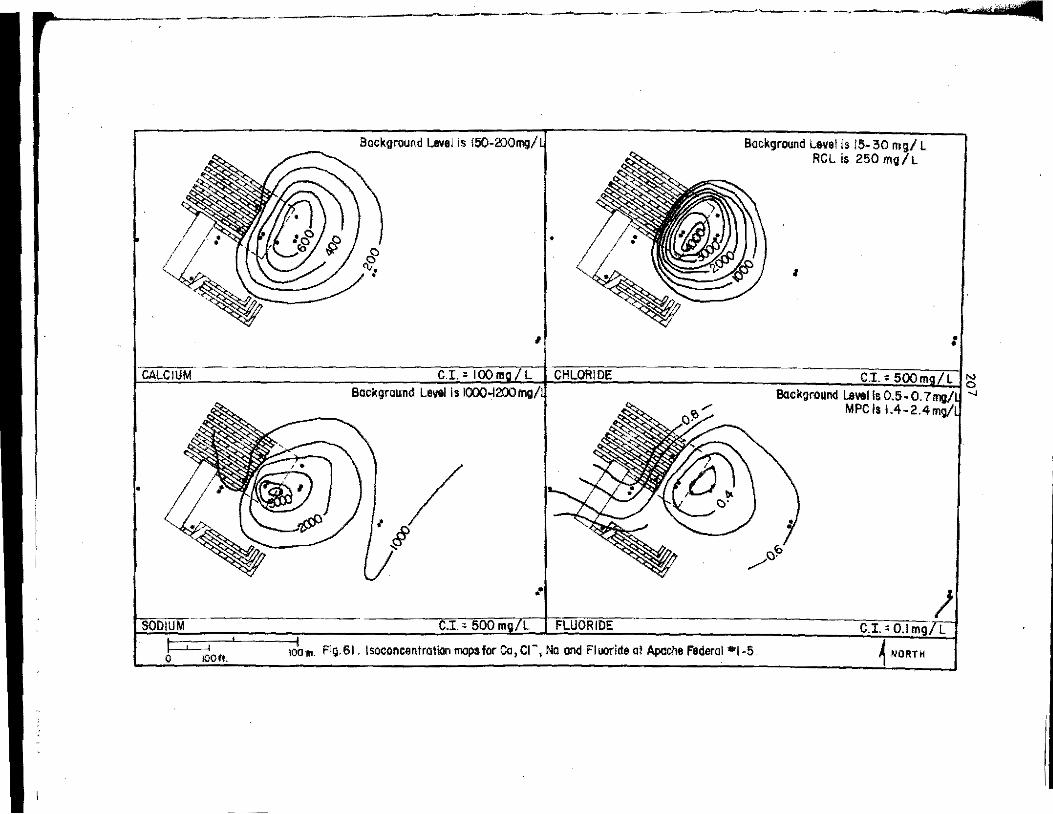
CALCIUM
•
SODIUM
I I 0 100ft.
------------------------·-----· --· ---·------~-- ----· ldft;tdrd/·,r ·111
Background Level is 150-2:>0mg/
•
,
C.I. • 100mg/L J CHLORIDE Background Level Is I000-120Jmg/
,/ #
••
--- C.I.• 500mg/L I FLUORIDE
Background Leve I Is I 5- 30 mg/ L RCL is 250 mg/ L
'
I
CI.•500mg/L ,~ Background lsvel Is 0.5-0. 7mg/' ...,
MPCls 1.4-2.4mg/
io· /C·
..
) ---------·--c;;-.;;;-I.-="07.1-::ml!TC
,otm. Fig.61. lsocon~ntration mops for Cc, c1·, No and Fluoride at Apache Federal •1-5. ~ NORTH

·---·--- ·-------- ---~-·----=-'
Background uvel is 0.14-0.16 mg/L RCL is 0.3 mg/ L
:
•
I
---·-' ~-----, ~· , a
Background Level is B0-100mg/L
I
:
I IRON C.I. = 1.0 mg/LI MAGNESIUM C.I." 50 mg/L j ~ Background Levet is I -3 mg/ L Rnrdtnrnunlt I 11t.ua.l ; .. 14: - "'"-... h co
RCL ls0.05 mg/L
I • -: I :
•• :
MANGANESE c.t. = 1 mo/L POTASSIUM C.I. = 5 mg/L
0 lOOlt. 100 m. Fig. 62. lsoconcentrotion mops for Fe, Mg, Mn ond K al Apoct,e Federal " 1-5. ~ NORTH

) ,,. ~
ARSENIC
.. CADMIUM
0 IOO!t.
_______ . ___ _,,...._,, ___ ~--- --- ·---------- ~--_.,., __________ ,__ .. -1-
Background Lsvel is 5 - 8 ug/ L MPC Is 50 ug/L
l
J /"' "'
) I
C.I. = ~ ug/L I BARIUM Background Level is 0.5-l .5 ug/ L
MPC Is 10 ug/L
~-:,._":
C.t. = 0.2 ug/l I CHROMHJM
/ '-~
100 m. Fig. 63. lsoconcentration mops for As, Bo, Cd and Cr at Apcche Federal• t -5.
Background Level is 200-250ug/L MPC Is IOOO ug/L
I
I
C.I.= IOOug/L ,~ Background Levelis 1-5 ug/L "'
. MPC is 50 ug/L
:; I
11,
/ I
.!J: /
c:r. = 0. 5 uii ~ NOF(TH
~
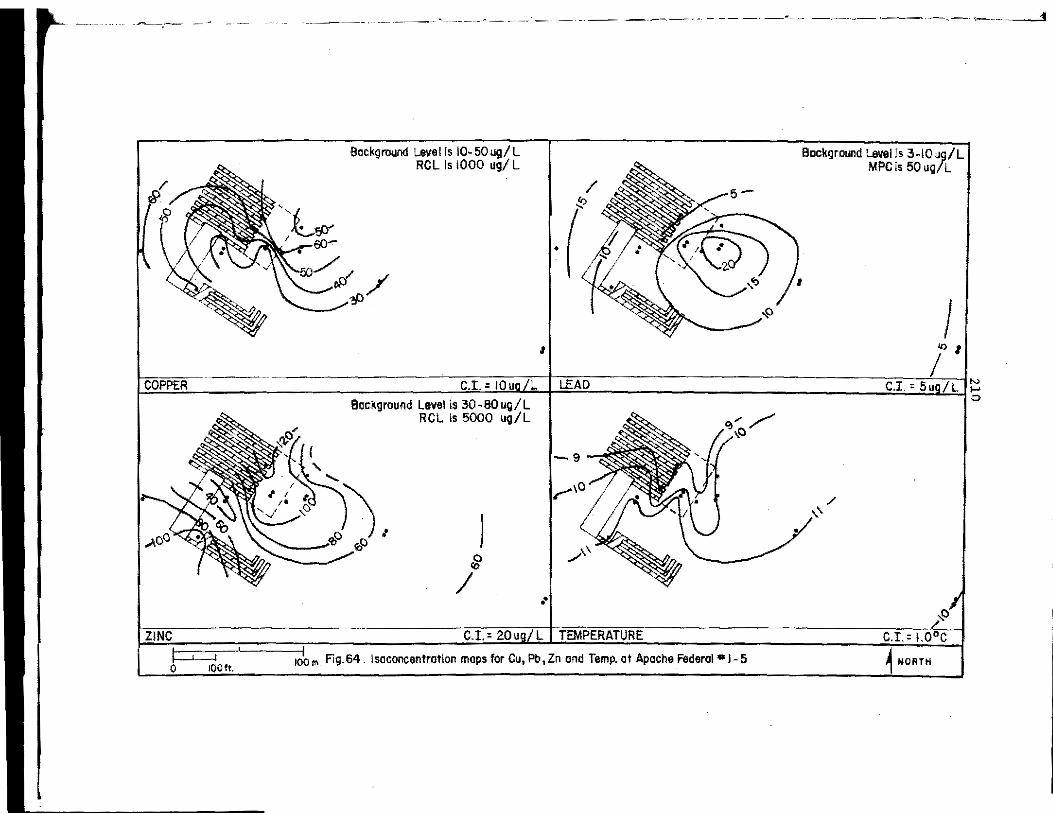
COPPER
ZINC
f:::::;-1 0 1001!.
------~- ------- --.---·----·-··· --·-·--· .. --1-· 11
Background Level Is I0-50ug/L RCL Is 1000 ug/ L
',,l,yY I &/"'
w/~ / .p -
C.I. • IOug/L Background Level is 30-80ug/L
RCL is 5000 ug/L
f),<:~{
., ~/ l , ...... G 1• c;
'.../ :-.;: '
~ I 11,0 0 .__ .0
) g
I
/
.( I
LEAD
-9
,.......10
••
C.I.: 20 ug/ L I TEMPERATURE
.sP
q,'/ \0
,do.,. Fig.64. lsoconcentrotion mops for Cu, Pt>,Zn ond Temp. at Apache federal• I- 5
Background Level ls 3-10u9/L MPCis 50 ug/L
I
/ \.\.
I ., I
I C.I: 5ug/LJ~
C) ~
c.r., 1.0°c 1 NORTH
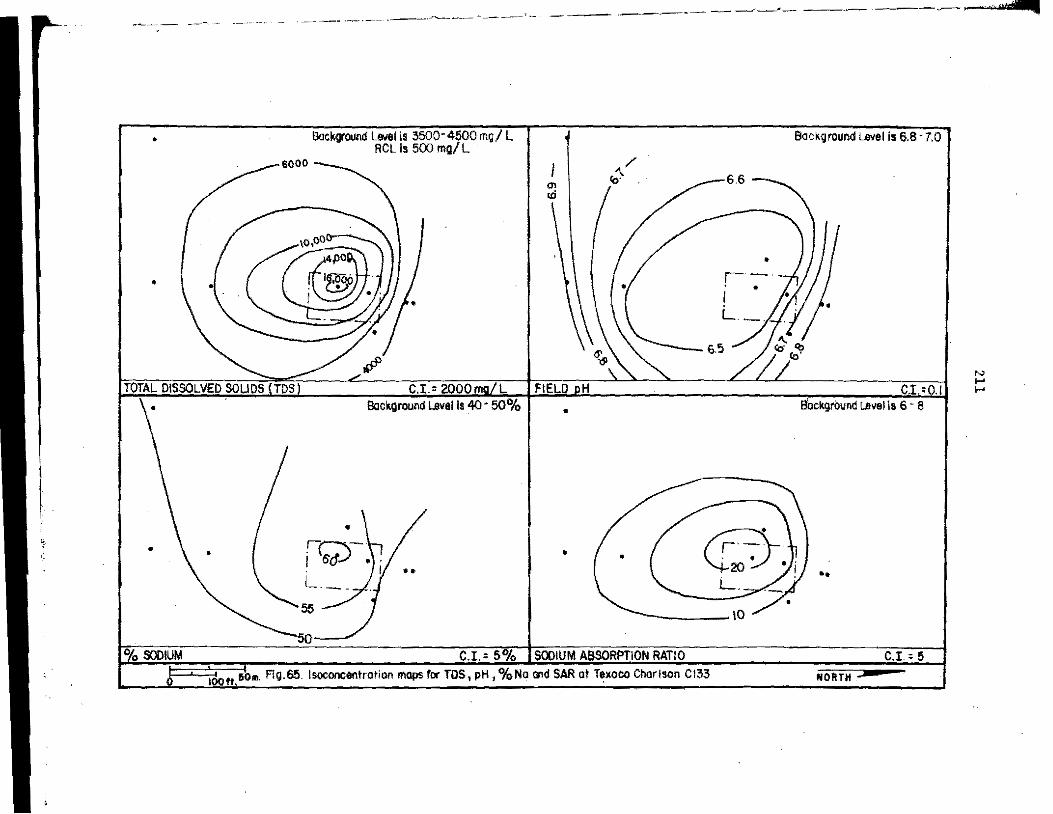
•
•
L '
0~ &JOIUM
- - --- ·-·-·-- ... ----~----- --- -· - '·- -- ·---------- --~~- ------ ·----·
•
BackgrOUlld Level is 3500-4500mg/ L RCL is 500 mg/ L
6000
c.t.= 200oma/L Background Lsvel Is 40 • 50%
rQ-. L
55
50
••
"' "'
FLELO
•
•
,,,_/ .
<o· .
-6.5
•
C.I. • 5% j SODIUM Af'JSORPTION RATIO IOO!t. 50111. Flg.65. lsoconcentratlon maps for TDS, pH, %No and SAR at T~xoeo Charlson Cl33
Background Level is 6.8 • 7.0
6.6
C.L::P.1 a'ockground Level is 6 - 8
••
C • .t" = _5
NORTH
..., .... ....
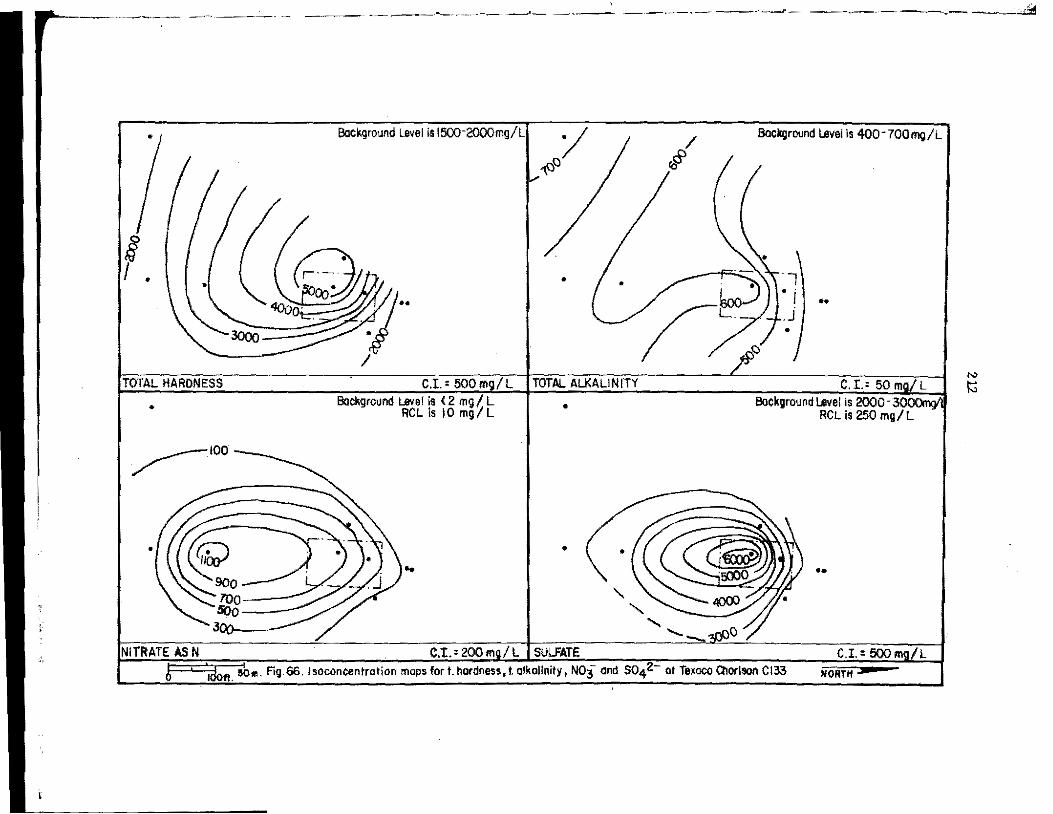
.---------.-- ____.._ _, _____ -- ------- - __ ____, _ __,.,.._ ------· -----.-- ,_______,,~
I I •
TOTAL HARDNESS
•
~100
•
Background Level is 1500-2000my/L
C.I.= 500mg/L Background ~el !s < 2 ma I L
RCL is 10 mg/ L
..
,,... '°C) '/
•
TOTAL ALKALINITY
•
•
' ' NITRATE ASN C.!.•200mo/L (SULFATE
/ lo
' '
8ackljround Level Is 400-700mg/L
1 • i . J •
••
C. I.= 50 mgL L Background Level is 2000-
RCL is 250 mg/ L
••
C.I.: 500 mg[L /; · "iJ,i,i. sb ... Fig.66. lsoconcentration maps fort. hardness, t. olkallnity, N03 end S04Z- at Te<OCO Qiorlsoo Cl33 NORTH :JII
"' ~

•
• •
----E[JO
.... -- '- ____ _ CALCIUM
•
I
•
SODIUM
/ /
\
" '
L.. -
Background L!wel is 400-450mg/
•
••
•
•
CHLORIDE
., o·
1
c.1., 500mg/L !FLUORIDE_
•
I
·--·''fill' q
Background Level is 20·40mg/L RCL Is 250 mg/ L
I - --
-··-···-····-···~··-·~
C.I , 500mo/ L Boci<grO<fld Level is0.2 • 0.3mg/L
MPC is 1.4- 2.4mg/L
r-~·-, i ~ L 0.3 • 0.2~
"' 1--' w
601!. Fig.67. lsoconcentrolion maps f..- Ca, c1·, Na ond Fluoride at Teiaco Charlson Cl33.
c.1., 0.1 mg/L NORTi?
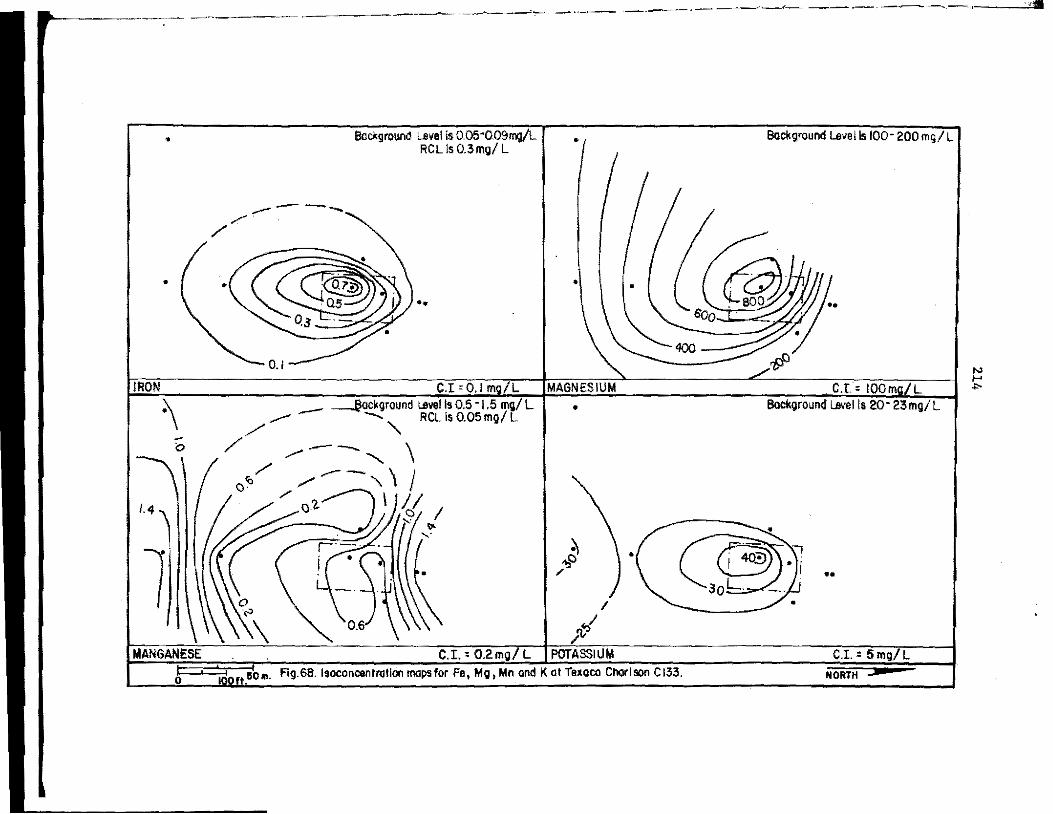
. --------- -----~-- ·- -··--- ·-- ---------~--'"- -------·--·~---.--., ·di
•
•
IRON
\ 0
/.4~
l) Q_
/ /
•
0.1
Bockgroun<l L.evel is 0.05·0.09mg/L RC Lis 0.3mg/ L
••
C.I = 0.1 mg/L - ~ockground ~vel Is 0.5 • f .5 ~ L
/.- --.'\. RCLis0.05mg/L
/
o<i;,
I
C.I.: 0.2m_q/ L
•
•
•
~ ,.,c /
Lef I
POTASSIUM
•
•
Boci<ground Lave! Is 100· 200 mg/ L
c.r.= IOOmgLL Background uwel Is 20· 23mg/L
~~ "-3~·1.
•
..
C.I.: 5mj!/L 50 11. Fig.68. lsoconcentrotlon maps for Fe, Mg, Mn and Kat Texoco Ct>orlson Cl33. NORTH :JI
"' ... .,,.

•
•
ARSENIC
•
•
CADMIUM
--~ ------·-·----- ------------ ........ ~ ~--------- - _ _, _____ -- -·--· --1,__,,,... .
•
•
'
I ....
Background Level is 4 - €i ug / L MPC " 50 ug/ L
/
\ ' l 'I(~ . -,:,_.J I .. •
Background Lev I I C.I. ; 5ug/ L e s 2·4uJ/L
MPC Is IOug L .
._C·~~J e\'\ ~ . . i-
6-
I~) :::::-.. ?fJ)
BARIUM
•
\ • ... J
C.I. • 2uq/ L J CHROMIUM
I Bocl<ground Level is 100 -MPC. 250ug/ L
IS IOOOug/ L
~~ B I
Bockg C.I • 20 u L round Level Is 2 • MPC. 4uJ/L ,s 50ug L
~
ISO•. Fig. 69. tsocancentration mops for As, Bo, Cd and Cr at Texaco Cl>lrlson C/33: C.I.• 0.5ug/L
NOR~
---··· ... ___ii
I "' ,_.
I "'
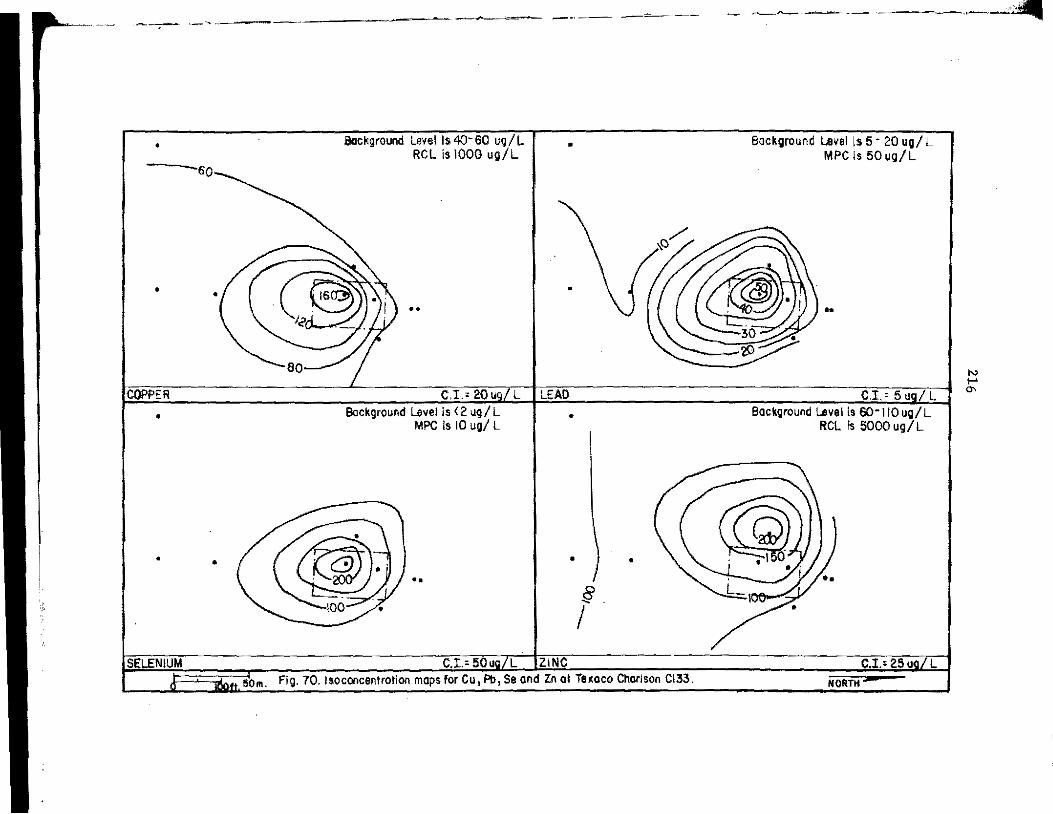
--·-·-- ---·- ·-' --------- ----·---~--
•
60
•
COPPER
•
• •
SELENIUM
Background Level Is 40- 60 ug / L RCL is 1000 ug/L
••
C,I., 20 ug/ L Bockground uvel is <2 ug/L
MPC is 10 ug/ L
••
•
LEAD •
•
!j.
I
•
c.r.,souq/L !ZINC __ -· __ _ 50m. Fig, 70. lsocancentrotion maps for Cu, Pb, Se and Zn ot Tucco Charlson Cl33.
·-- .,..~------------ ----·-·
Background L.evel Is 5 - 20 ug/ L MPC is 50 ug/ L
••
CJc' .!\ ug{L Background Level is so-11oug/L
RCL is 5000 ug / L
C.I., 25 uQ/ L NORTII.,_
"' ,_. "'
~

I
I
i I
I
l I' :
APPENDIX F
APPARENT AND INTERPRETED RESISTIVITY PROFILES FOR THE APACHE FEDERAL #1-5 AND TEXACO CHARLSON Cl33 SITES.

i
I I i J 1
218
Each resistivity station profile includes the field curve plotted as apparent resistivity versus electrode spacing, the depths and resistivities obtained by automatic interpretation (this data was unobtainable when the slope of the apparent resistivity field curve exceeded 45°), lithology, and-water table level on the date the resistivity readings were taken. A lithologic column is presented for each resistivity station and corresponds to the station that it is adjacent to. When the lithology is the same for the two adjacent stations only one lithologic column is presented.

i
I J 1 )
Apporen! Resistivity (ohm,.ft.)
,o
38
"' 99
'"' ;:;
"' .s l! 40
<lt
'"' i iii
5 "'
70
80
Apparent Resistivity (ohm.-ft.) FIESIS. JNTERP.
l<)WoFT.) 00 40 80 120
163
108
40
78
(St 3)
!O
"'
-30 ~ 1 140 " ~ .:; • Ill
"'
219
Ct
c, ,, .. : '•. ,::· .....
.: ·.'
.: :~. ; . : · ... .. · .. ; . ' . ., ... ~? .'' .·.-·
C6 ·.·: :, ·:· •• 1
. : . · ... . ..
29
44
...... IHTDP.
(OHlh·FT.j
53
8
Awon,nt Resistivity{ohl!l-fl.}
(St. 2)
!O
TO
AA:ment ResisHvity (ohmcfl.) 0 Z 40 6Q
0
(St.4)
IO
Fig. 71. Apparent and Interpreted Resistivity Profiles for Sts. 1-4 at Apnche Federal,. 1-5

Rt:81$. ,._ 0- ( IHTt!IP. .....,,... ent -••tivity onm,. fl.)
(OHMrFt) O l !O
45 (St.5)
24
s !'
l 47 '8
10
20
!: ""
~ 80
16
AA,arent Raisttvify (ollm.-ft.) ...... INTERP:
{OHMb•'FT.) 0o 2& so 10
100
72
25
44
(St. 7)
10
a,
.:: S)
.,. C .; 0 Q.
"' .. " loo .. iii
80
220
Cs ; .. '
.. :•, •,• , .,
102
67
21
45
A:ISIS, lNTERP.
..., ::: .,. C .; 0
/Ir • e :; .. iii
(OHN:-FT.}
95
186
2
12 -..., e !l' Q 0 Q.
"' 29
.. .., e
Awarent Rnistivity (ohm, ft.) o0p..u..i.!.i.L.U..J./l!U..U..J.l:L
,o
20
80
Aj)parent Rosiotivily (ohm.-11.)
a° 40 80 "" (st. al
IO
20
:; "" .. iii
Fi • 72. AJlP(lrent and Interpreted Reslstivit Profiles for Sts. 5-B at A ache Federo1 •1.5.

l !
i ·,
I '1
I \
I
...... Al>Porenl ReoiS!ivlty (ohm.· fl.) IH!nP. (_,FT.) 00
169 (St 9)
106 IQ
25
:230
E 8«> Q. u,
"° • .,, e u ..
iii
~. Apponr,I Resistivity (olrn.-fl.) {(Hil:-FT.} O O 40 l20
(St. II) 121
IO
57 :?"SJ -"' " 'ii a.
"' .. .,, e ti .. iii
80
37
"'
221
Cs
C11
... :
• • •
• •
Ail!,arent RooistMty (otrndt. )
(St.10)
Kl
29 .. ;:
87 .. .: l'o • }eo u
ill
II
Apparent Resistivity (ollm.· 11.) 00 a:> 40
{St.12)
" 7
"'
36 :::
"'
80
F,g. 73. Apparent and Interpreted Resistivity PrO!i les for Sis. 9 -12 at Apache Federol •1- 5.

I
I \
Apparent Resistivity (ollm.- tt. l RESIS.
INTlRP. (OHM.-l'T) 00 26 90 ,s
113 (St. 13)
13 20
9
:: 54 "' C
040 & ,,, " 1 0 .. GJ
1461
"'
Apparent Resistivity (ohm.-ft.) RESlS. INlERI'.
(OHM,Fr.) 0 0 2$ 5:) 7!S
111 (St.15)
79 "
20
24
-., ~ 0 C
·g40 a.
"' .. " 0 ;eo
71 :t w
222 Ap,,arent Aosl8tlvily (ohnl.-ft.)
00 3) 40
(St. 14)
10
•
- ilO "' ,e
77 "' C
l'° .. "C 0 zeo u .. w
..,
4 1'0
Apparent Resist!vily (ohm.-ff.l ...... INTEAP.
(OHM-,,.FT'.l 0o «> eo t
(St.16 l
10
!57 E "' " 140 "' .. " e"° " iS
42
"'
eo Fig. 74. AR)(lrent and Interpreted Resistivity Profiles for Sts.13-16 at APache Federal •1-5.

I I 11
l 'l f I I . l I
' i: (
IIESlS. App:,rent Ra!stivity (ohm .• ft.) 1NT£AP.
!OHlls>T.) 00 .., eo 120
136 (St.17)
10
20 20
:: "' 30 ,lj <40
i ., .,, _g eo " ~
eo 218
11:>
1~~- Apparent Resistivity {ohm.~ft) (OHM. ... Ff.} O O 20 -40 90
83 (St.19)
24
10
.. 150 ¥
20 iil
223
C14
··--· . .-. ..,..
-"-. . ....,.
C14
.. ... . . . . .
...:sz_
. •-;"",__. ...... . _ .. \
Appo;nlt'I! Resistivity (onm..fl.) 00 211 eo 111
(St.18)
26
-' !:; 69 .,.
" l.., ., ,, 0
.i, eo
! eo
32
70
80
,~'/.. A4>Poront Reslsijvlty (ohm.-lt.) {CIWrfT.J O O Z5 GO 7'
188 (St.20)
10
23 20
_,, "'
69 .. " ·g40 /Ji ~ e i"" fij
J "" 43 eo
l
\ "" eo
Fig. 75. Apparent and Interpreted Resistivity Profiles for Sts. 17. 20 at Apoclle Federal •1.5.
I -------------------------------- .. ]
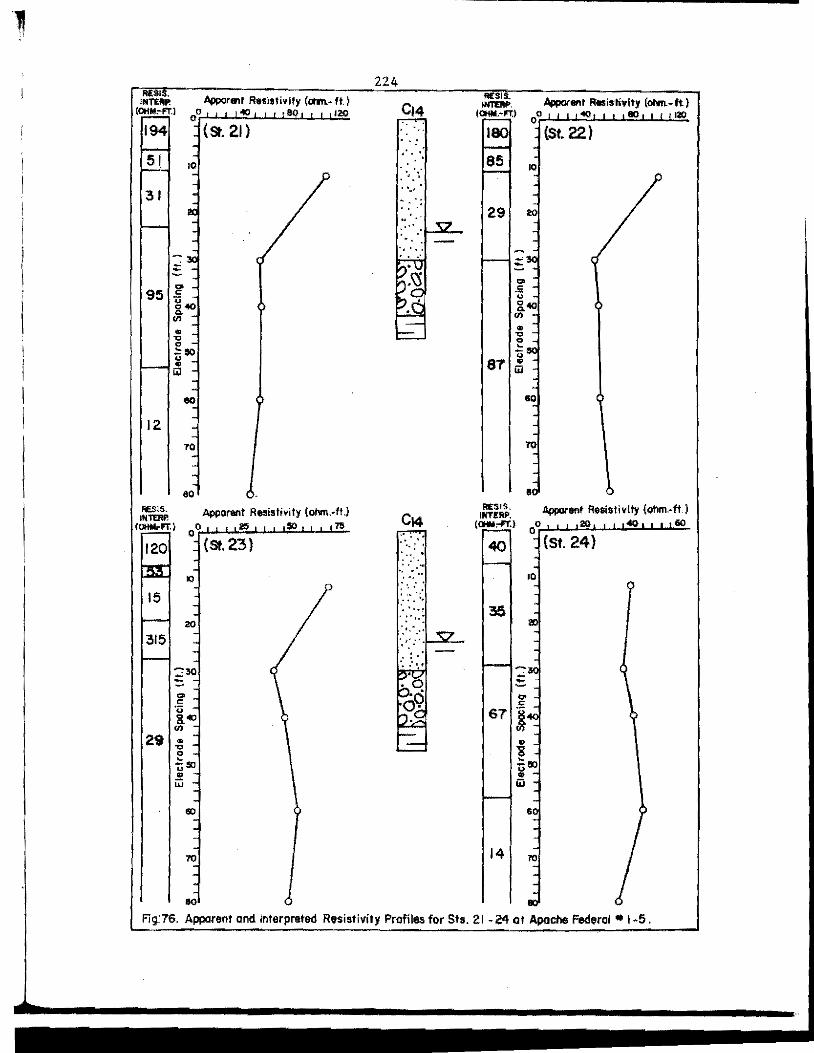
"' ' lNTEftP. ~ra,t Resistivlfy (ctm.- ft.) (OHMcFt) 00 40 80 ,20
194
51 IO
31
:: "' 95 " l<!O "' .. .,, "' ::: IIO u .. [ii
80
12 10
80 RE.SIS.
INTERP. (OHM,,fr.) oo
120
15
315
29
.,
20
g' '(i 8..., "' .. "' "' ~ -.:;so " ul
El)
70
80
(St. 21)
Apparent R .. l,livity (ohm.-fl.) .. IIO .. (St. 23)
224
•, ',
. ..
:· •. :: .. . .. ~ .. · . . . , .. : ', .. : ·. ·.~ .-~. · ..... . : . ·<
ftESIS. """"'· AA,arent Resistivity (<>llm.-ft)
IOHM.~rr;) 0o 40 80 120
180 (St. 22)
85 IO
29
""
,:r.l,'l.: Apparent Reflislivlty (ohm...ft) (()N;--FT.} 00 20 40 60
40 (St. 24)
IQ
35
... ::; .,.
67 J .. 'g i;m .. ijj
•
14 "'
Fig:76. Apparent and interpreted Resistivity Profiles for Sts. 21 -24 at Apache Federal " 1-5.

69
47
77
Apparent Rnl•tlv!ty ( Ohft'l.-ft.)
0
(St. 25}
10
20
t30 .. C u • .,. ., • ... 0 • :; • w
S)
225
C14 ::· .. ··: ... . ·.·. ,: ' .. .· ,•
; . •, .··
Fig. 77. Apparent and Interpreted Rmstivity Profiles for St. 25 ot Apache Rlderal •1- 5.

226 RESIS. App,1rent Rlsi,tivity (cnn,ft) 1.-··· o, Ot4M:-FT.) 00 30 60 90
Resistivity {ot,m,.ft.)
128 (st. I) . :-: 7::·. ,•.:
85 10 ~-·. :, 10
, ... 'fl" .. ~·
20 .. :. ~·
31 ·.'! t·~ . '.
30
-.,.40 ~
·.:;
48 " ... "' .. !50 ... £ u .. w !SC)
37 70 18 70
00 • RESIS:. Apparent Resistivity (ol\m.-ft.) 03 INTDP.
(OHM,-n.) 00 20 40 60
(St.3) .. , ~·/ ...
AJiparenl Resistivity [onm.-11.) 00 20 40
(Sl 4) ·,• ..•
10 ~: .. · i' ...... IO . '.• : ....
48 .. 78 20
-.., £ .. ·" 29
42 140 .. ... 0 !c 00 u .. w
60 "" 70
60 ~
Fig. 78. Apparent and Interpreted Resistivity Profiles for Sts. 1-4 or Texoco Charlson Cl33.

Apporent Reistlvity (ollm.·lt) ffESIS.
tNTERP, (OHIHl'.)
0 O IO 100 lOO
138
43
"' C
IO
20
113 i40 "' I 1;50 .. iii
20 00
(St. 5)
RESIS. INTERP.
(OHM:""Ft) Apparent Rasi>tivity (ollm.-ft.)
00 20 40 60
(St7) 39
10
"' 82
-""· ~ "' C
·u40 ! .. ]ISO
35 ~ (ij
"" 10
227
!':.' ':• ',, .. (, : .. . .. , .. . ~# ••• ~ ~ .. :,
~· . ~' T' •, • .
. ·."':£, . ·.; ...
95
63
99
3
134
30
Apparent Resistivity (OM'lrft) 00 ~ ~ l~
(St. 6)
10
"'
:?°30 -I!' i«> "' .. " g u
~
..,
.., All!lorent Rasistivity (o!un.-ft.)
00 20 40 60 80
(St. 8)
10
"'
9 :; 30
0
" 57140
"" 1'0
"' ~ Fig. 79. Appor8lll and Interpreted Resistivity Profiles for Sts. 5 - 8 ot T8lOCo Chortson Ci33.

RESIS. lttTERP.
(OHM.•FT.)
21
70
129
39
Apparent Reaistlvity (ohm.- fl.) 00 20 40 60 80
(St. 9)
10
20
60
70
80
Ac>Pot•nt Resistivity (Ollm.-ff.J 00 20 -40 to 80
(St. 11)
10
,0
""
228
.•· .• ·.• .. . '~-. ... .
~- .. ·.: ~·' ... ::.:. .. :~ :~ ; .. '
':·it ;
Apparent Resistivity (onm,,..ft.) Q 70 I
121 (St.10)
IC
,0
126
70
Appo"'nt Raslstlvlty (onm,.ft) R£$1S. 1MT'ERP.
{Offftb•FTJ 00 20 40 60
38 (SI. 12)
10
26
-"' C 7i .§. ..
44 "' 0 !: so 0 .. iii
so
70
80 80
Fig. 00. Apparent and Interpreted Resistivity Proflles for Sis. 9- 12 at Texaco Charlson CJ33.

' I I I I
I I
Apparent Resistivity (o!un.-ft.} 00 20 40 80 80
(st.13)
,o
20
71'.1
so
Apparent Resistivity (ohm,ftJ
l ao eo '° (St. 15)
,o
60
80
229
' " ~ ...... ..... . · .. , .. . . . •·.·• ; . · . •.. · .. . .
'• ·. ', .. ,. : ·:.: - . ·:-~ ' ... . . . .. · .. ... •. ~. -:.:
~: ~;
REStS. 1NT£RP.
{ .)
182
115
46
-"' ·= u !l. "' .. "' 0
Appa,.nt Resistivity (onm,f!) 0o eo 100 J&O
(St. 14)
'"
20
67 't 50 .. iii
so
71'.1
80
Apparent Resistivity (Ohm,ft.} 00 20 40 60
(St. 16)
10
Fig. 81. Apparent and Interpreted Resistivity Profiles for Sts.13 -16 ot Texaco Charlson Ci 33.
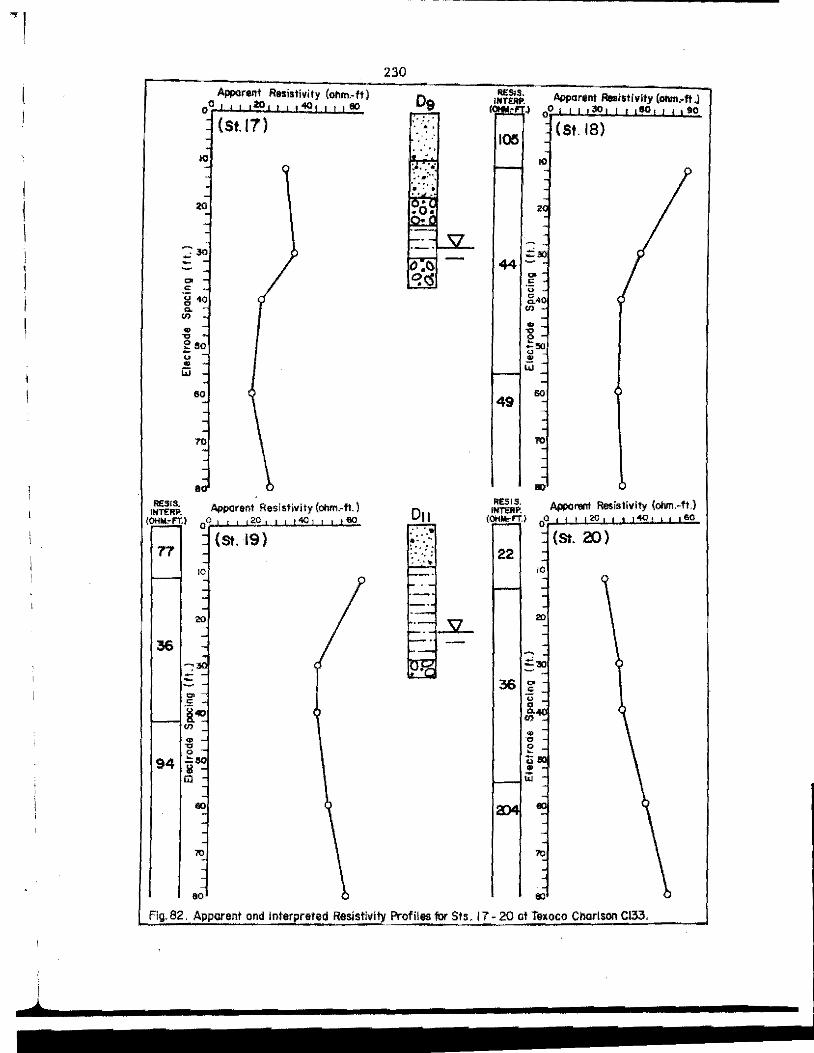
APP<lrent Resistivity (ohm.-ft) 00 20 40 60
.. "
10
gso " " w
so
70
80
(St.17)
Apparent Resistivity (ornn.-fl.) RESTS, INTERP.
IO!ll<-FT,l 00 20 40 to
77 (St. 19)
10
20
36
--o> ,£
it'"' "' .. " 0
94 !: "" I! t1
80
230
D9 ... . . .. •,
D11 ~: ·: .. : .. ; . ... : ; •,,.
Apparent Resistivity (ohm.•fl .J 0o 30 eo to
IOIS (St. 18)
10
•
::' 44
"' C ·.; [40
"' .. " Eoo ril i;j
49 60
,0
Ill
A/rl>Qren! Resistivity (-.-ft,) Pl£S1S, INTERP.
{OH.IT.) 0o 20 40 GO
(St. 20) 22
10
20
80 Ill
Fig.82. Apparent ond Inter roted ReslstivllyProflles 1br Sis. 17. 20 at Texaco Chorlson Cl33.

1 !
l 11
I I f I
·1 '
I l
RE.SIS. fflEIIP,
(OHM.-l't)
15
10
25::
24
67
Apporent Rwlstivity (ohm di) 00 C) «>
(St.21)
10
60
70
ao Al)l)arent Resiolivily (ohm,lt) o 20 ,40 eo
0 (St. 23)
10
"' C ·o 8. 4()
"' • .,, g u • w
70
2 1
:· : . · .. ·. ' .. ' . ' . .. .. '7 .-
Appare<1I Rnls!Mly (olun.-tt.) 00 20 40 60
(St. 22)
IO
60
80
APIIOrenf R .. islivity (ohm, It.) 0 20 40 S)
0 ( St. 24)
to
.f u J«> .. e ~
ao
70
Flg.83. Apparent and Interpreted Resistivity Profiles for Sis. 21- 24 at Texaco Charlson Cl33.
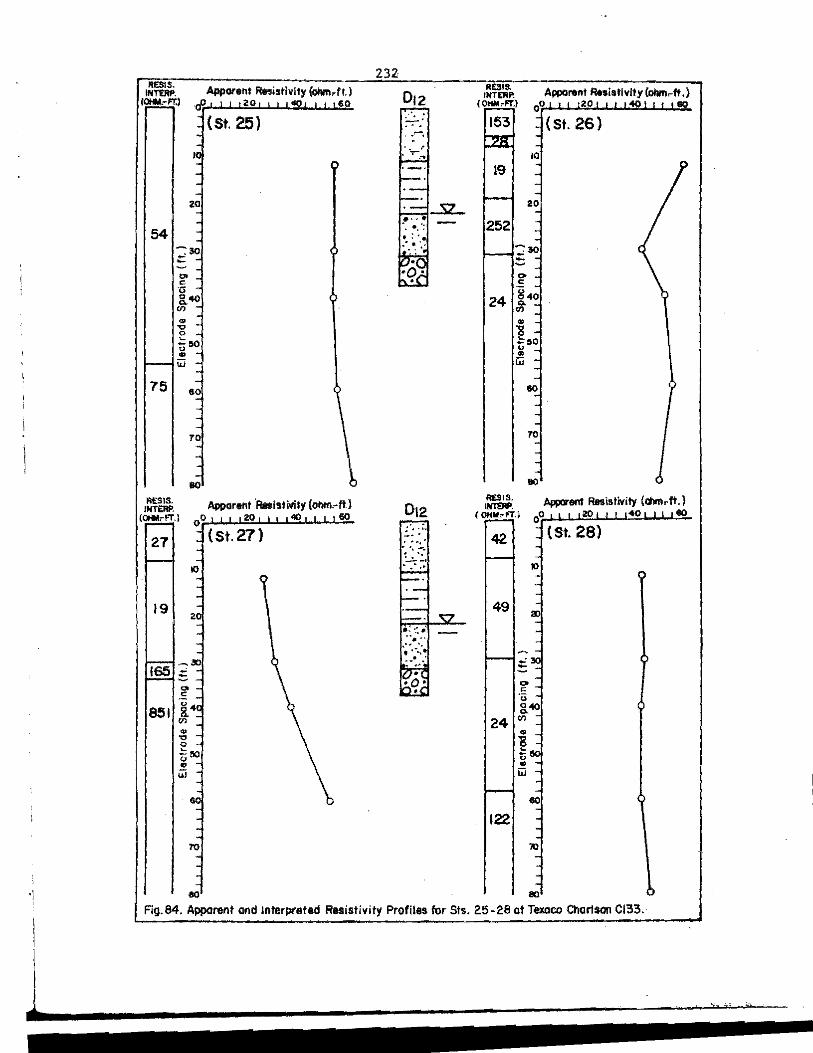
232 ...... Apporent Resistivity (onm,.ft) RESIS.
INT!llf'. 012 IHTERP. Apparent Resi•Nvity(o/m,ft.) (<)HM,FrJ <P. 20 .., •• I """,m o• 20 40 60
(St. 25) +.: 153 (St.26) -. ' ' ·T"".,.,, 10
19
20 20
54 252 -so :;,o :: .'!::
"' "' e e ·c;
840 8.40 24 .. "' "' .. .. "' 1l 0
~DO !':oo 0 .. ..
w iii
75 60 60
T 70
60 80
R£S1S. Apparent ·Raoistivity {ohm.-ft) MSIS, Apparent Resistivity (dlmc It.)
INTERP. 012 ........ {CHl1:-FT.) o• 20 "° "" ( OHltf':'"FT.l o• 20 40 60
27 (St.27) :.': : ~ 42 (St. 28) ..... . .. -.
~·: . IO . . · .. "
19 49 2
165 :E ::
"' "' e
·= ·., 851 8.4 &"°
"' 24 "' .. .. "' 1s 0 tM ti .. .. ul iii
60
122
1ll
·: ~ 80
Flg.84. Apparent end Interpreted Resistivity Profiles for Sis. 25-28 at Texaco CllartSO!l Cl33.

Apparent Resistivity (ohm.- ft) 0o 40 eo
(St. 29)
zo 38
-~ ii!' ·;; i "' * 0 !::~ " 93 " iii
70
80
.. ~Ji Apparent Resistivity(dlrn.-lt) (OHM,-foT.) O O 50- !00 !ISO
(St.31)
124 10
20
36
230
ii!' 140
80 .. 1eo it
ii]
60
233
012 . ;, . ·~.
.·-· ... . . .:: ' .. ,•:
93
28
70
41
17
70
eo
Api>aN1nt Resistivity (ohm.-ft J 0 30 60 90
0
(St. 32)
10
20
s~ "' "' u &.40 "' .. " 0 ~
ti !50 .. iii
60
ro
80
Flg.85. Apparent and Interpreted Resistivity Profiles tor Sts. 29 -32 ct Texaco Chari= Cl33.

APPENDIX G
DRILLING FLUID ADDITIVES USED AT THE BELCO PETROLEUM B.N. SHEEP CK. #1-11 AND APACHE FEDERAL #1-5 SITES.

235
TABLE 17. DRILLING FLUID ADDITIVES USED AT THE BELCO PETROLEUM B .N. SHEEP CK. ltl-11 SITE.
Drilling Fluid Additives Belco Petroleum Corp. Sheep Creek B.N. ltl-11 Drilling Dates: 3/27/ 77 thru 4/18/77
Quantity
385 sacks
305 sacks
227 sacks
43 sacks
36 sacks
27 sacks
25 sacks
20 sacks
16 sacks
11 sacks
10 sacks
8 sacks
7 sacks
4 sacks
Product Name Physical or Chemical Composition
Geogel Sepiolite (chain lattice clay)
My-Lo-Jel Corn starch
Salt Gel Attapulgite clay, Fuller's Earth
Scav 730 Organic
Poly Sol Potato starch
Preservative Paraforma.ldehyde
Drillaid 421 Selective flocculant polymer
Select Floe Blend of selective flocculants
Super Visbestos Asbestos
Pipe-Lax Surfactants in a naptha base
Ammonium Nitrate NH4N03
Mud Fiber Bagasse-cane fiber
Mica, Fine Mica flakes
A-40 Alkyl-aryl sulfonate
(sacks are commonly 100 lbs.)

236
TABLE 18. DRILLING FLUID ADDITIVES USED AT Tl!E APACHE FEDERAL #1-5 SITE.
Drilling Fluid Additives Apache Corp, Federal Ul-5 Drilling Dates: 6/7/79 thru 6/30/79
Quantity Product Name Physical or" Chemical Composition
674 sacks Salt Gel Attapulgite clay , Fuller's Earth
383 sacks Magco-Poly-Sol Pregelatinized s"tarch
105 sacks My-Lo-Jel Corn starch
105 gallons X-100 Zinc-chromium solution
40 sacks Magcogel Sodium montmorillonite
14 sacks Mag co-Mica Mica flakes
11 sacks Sodium Dichromate Na2cr2o7•2H2o
8 sacks Ammonium Nitrate N1\N03
6 sacks Lime eao
2 sacks Selec Floe Selective flocculants
2 sacks Dow G Preservative
l can Magco-Poly- Polyalkylene glycols Defoamer
{sacks are commonly 100 lbs.

237
TABLE 19, DRILLING FLUID ADDITIVES USED AT THE APACHE FEDERAL #1-5 RE-ENTRY.
Drilling Fluid Additives Apache Corp, Federal #1-5 (Re-entry) Drilling Dates: 4/2/81 thru 4/15/81
Quantity Product Name Physical or
397 sacks My-Lo-Jel Corn starch
124 sacks Sea Mud Sepiolite
Chemical Composition
122 sacks Salt Gel Attapulgite clay, Fuller's Earth
21 sacks TDF-Gel
10 sacks Preservative
9 sacks Desco
6 sacks Sodium Dichromate
4 sacks HME
4 cans Magco-Poly-Defoamer
(sacks are commonly 100 lbs.)
* * Composition unknown
* *
Paraflormaldebyde
Sulfometbylated tannin-sodium dicbromate mixture
Na2cr2o7 •2H20
* *
Polyalkylene glycols

REFERENCES CITED

239
REFERENCES CITED
American Petroleum Institute, 1969, Principles of drilling fluid control (12th ed): University of Texas-Austin, Petroleum Extension Service,- 215 p.
Anna, L.O., 1981, Ground-water resources of Billings, Golden Valley, and Slope Counties, North Dakota: North Dakota Geological Survey Bulletin 76, no. 3, 56 p.
Birkeland, P.W., 1974, Pedology, weathering, and geomorphological research: New York, Oxford University Press, 285 p.
Brantly, J.E., 1971, History of oil well drilling: Houston, Texas, Gulf Publishing, 1525 p,
Cartwright, K., and Sherman, F.B., Jr,, 1972, Electrical earth resistivity surveying in landfill investigations, 1-.!!_ Engineering and Soils Engineering Symposium, 10th, Moscow, Idaho, p. 77-92.
Chilingarian, G.V., and Vorabutr, P., 1981, Drilling and drilling fluids-development in petroleum science 11: New York, Elsevier, 767 p.
Clayton, L., Moran, S.R., Bluemle, Geologic map of North Dakota: scale 1:500,000.
J.P., and Carlson, C.G., 1980, U.S. Geological Survey,
Collins, A.G., 1975, Possible contamination of groundwaters by oil-and-gas well drilling fluids: U.S. Department of Commerce, NTIS Report No. CONF75051331, 37 p.
ForSlllan, N.F., (in preparation), Petrology and the Sentinel Butte Formation (Paleocene): University of North Dakota.
geochemistry of PhD Dissertation,
Freeze, R.A., and Cherry, J.A., 1979, Groundwater, Englewood Cliffs, New Jersey, Prentice-Hall, 604 p.
Gerhard, L.C., and Anderson, S.B., 1981, ·011 exploration and development in the North Dakota Williston Basin-1980 update: North Dakota Geological Survey Miscellaneous Series 59, 19 p.
Goodman, L.R., and Eidem, R.J., 1976, The atlas of North Dakota: Fargo, North Dakota, North Dakota Studies, Inc., 111 p.

240 Griffin, R,A., Cartwright, K., Shimp, N.F., Steele, J.D., Ruch,
R.R., White, W.A., Hughes, G.M., and Gilkeson, R.H., 1976, Attenuation of pollutants in municipal landfill leachate by clay minerals-part 1: Illinois State Geological Survey Envriorunental Geology Notes No. 78, 34 p.
Groenewold, C.H., Hemish, L.A., Cherry, J.A., Rehm, B.W., Meyer, G.N., Winczewski, L.M., 1979, Geology and Geohydrology of the Knife River Basin.and adjacent areas of west-central North Dakota: North Dakota Geological Survey Report of Investigation No. 64, 402 p.
Groenewold, C.H., Koob, R.D., McCarthy, G.J., Rehm, B.W., and Peterson, W.M., (in press), Geological and geochemical controls on the chemical evolution of subsurface water in the undisturbed and surface-mined landscape in western North Dakota: Report to U.S. Department of the Interior-Bureau of Mines, Contract No. J0275010, 166 p.
Hammer, M.J., 1981, An assessment of current standards for selenium in drinking water: Groundwater, v. 19, no. 4, p. 366-369.
Haugen, Gary, 1980, personal cOlllD.unications, Haugen Construction Service, Minot, North Dakota, July 11.
Hicks, B.L., (in preparation), Saltwater seeps: a preliminary investigation of reserve pit closure problems: u.s. Department of Agriculture, Forest Service, Northern Region Office, Missoula, Montana.
Hvorslev, M.J., 1951, Time lag and soil permeability in groundwater observations: Waterways Experiment Station, Corps of Engineers, U.S. Army, Bulletin no. 36, Vicksburg, Mississippi, 47 p.
Jacob, A.F., 1972, Depositional environments of parts of the Tongue River Formation, western North Dakota, in Ting, F.T.C., ed., Depositional envirorunents of the lignite-bearing strata in western North Dakota: North Dakota Geological Survey Miscellaneous Series no. 50, 134 p.
~~-• 1975, Criteria for differentiating the Tongue River Sentinel Butte Formations (Paleocene), North Dakota: Dakota Geological Survey Report of Investigations no, 55 p.
and North 53,
Johnson, T.M., Cartwright, K., and Schuller, R.M., 1981, Monitoring of leachate migration in the unsaturated zone in the vicinity of sanitary landfills: Ground Water Monitoring Review, v. 1, no. 3, p. 55-63,
241
Kehew, A.E., and Groene-wold, G.H., 1982, Earth resistivity investigations in reclaimed surface lignite mine spoils: U.S. Department of the Interior, Bureau of Mines, Contract no. J0275010, 98 p.
Koob, R.D., 1981, personal co111Dunications, Dean of the College of Science and Mathematics, North Dakota State University, Fargo, North Dakota, December 2.
Krauskopf, K.B., 1979, Introduction to geochemistry (2nd ed): Ne'I< York, licGra-Hill, 617 p.
Lenzini, Doug, 1980, BI.M testing of drilling muds on Wy0111ing soils: Western Oil Reporter, v. 37, no. 7, p. 120-121.
Moore, P.L., 1974, Drilling practices manual: Tulsa, Oklahoma, Petroleum. Publishing, 448 p.
Moran, S.R., Cherry, J.A., Fritz, P., Peterson, W.M., Sommerville, M.H., Stancel, S.A., and Ulmer, J.H., 1978a, Geology, groundwater hydrology, and hydrochemistry of a proposed surface. mine and lignite gasification site near Dunn Center, North Dakota: North Dakota Geological Survey Report of Investigation, no. 61, 263 p.
Moran, S.R., Groenewold, G.H., and Cherry, J.A., 1978b, Geologic, hydrologic, and geochemical concepts ·and techniques in overburden characterization for mined-land reclamation: North Dakota Geological Survey Report of Investigation no. 63, 152 p.
National Oceanic and.Atmospheric Administration, 1981, Climatological data and monthly precipitation data: National Weather Service, U.S. Department of C011lmerce, Bismarck, North Dakota.
Pearse, A.S., and Gunther, G., 1957, Salinity, in Hedgepeth, J.W., ed, Treatise on marine ecology and paleocology: Geological Society of America, Memoir 67, v. 1, p. 129-157.
Ranney, M.W., 1979, Crude oil drilling fluids: Park Ridge, Ne'I< Jersey, Noyes Data Corp., 348 p.
Reed, P.C., Cart'l<rigbt, K., and Osby, D., 1981, Electrical resistivity surveys near brine holding ponds 1n Illinois: Illinois State Geological Survey Geology Notes no. 95, 30 p.

242
Rehm, B.W., Groenewold, G.H., and Peterson, W.M., 1982, Mechanisms, distribution and frequency of groundwater recharge in an upland area of western North Dakota: North Dakota Geological Survey Report of Investigation no. 75, 72 p.
Robertson, F.R., 1975, Hexavalent chromium in the groundwater in Paradise Valley, Arizona: . Groundwater,. v. 13, no. 6, p. 516-527.
Rogers, W.F .• , 1953, Composition and properties of oil well drilling fluids: Houston, Texas, Gulf Publishing, 670 p.
Royse, C.F., Jr., 1967, A stratigraphic and sedimentologic analysis of the Tongue River and Sentinel Butte Formations (Paleocene), western North Dakota: PhD Dissertation, University of North Dakota, 312 p.
Soiltest Inc., 1968, Earth resistivity l!lanual: Evanston, Illinois, Soiltest Inc., 52 p.
Swanson, R.G., 1981, Sample exsmination manual, methods in exploration series: Tulsa, OklahOl!la, American Association of Petroleum Geologists, 6 p.
U.S. Army Corps of Engineers, 1981, Daily water levels for the Garr~son Dam Reservoir: Riverdale, North Dakota, Omaha Division.
Valkovic', Vlado, 1975, Trace element analysis: London, Taylor and Francis, 229 p.
Van Nostrand, R.G., and resistivity data: 499, 310 p.
Cook, K.L., 1966, Interpretation of U.S. Geological Survey Professional Paper
Wright, T.R., ed., 1978, Guide to drilling, workover, and completion fluids: World 011, no. 6, p. 53-96.
Yazicigil, Hasan, and Sendlein, L.V.A., 1982, Surface geophysical techniques in groundwater monitoring-part 2: Ground Water Monitoring Review, v. 2, no. 1, p. 56-62,
Zohdy, A.A.R., and Bisdorf, R.J., 1975, Computer programs for the forward calculation and autOl!latic inversion of Wenner sounding curves: U.S. Department of Commerce, NTIS Publication no. PB-247 265, 47 p.