the effect of occupant behaviour on electricity consumption in … · (kwh/m2/ year) gas (m3/m2/...
TRANSCRIPT

The Effect of Occupant Behaviour on Electricity Consumption in Canadian Schools
SBE 16 Toronto
Mohamed Ouf, EIT, LEED® Green Associate

Overview
• Introduction
• Background
• Objectives
• Scope
• Data Collection
• Tools
• Results
• Conclusions
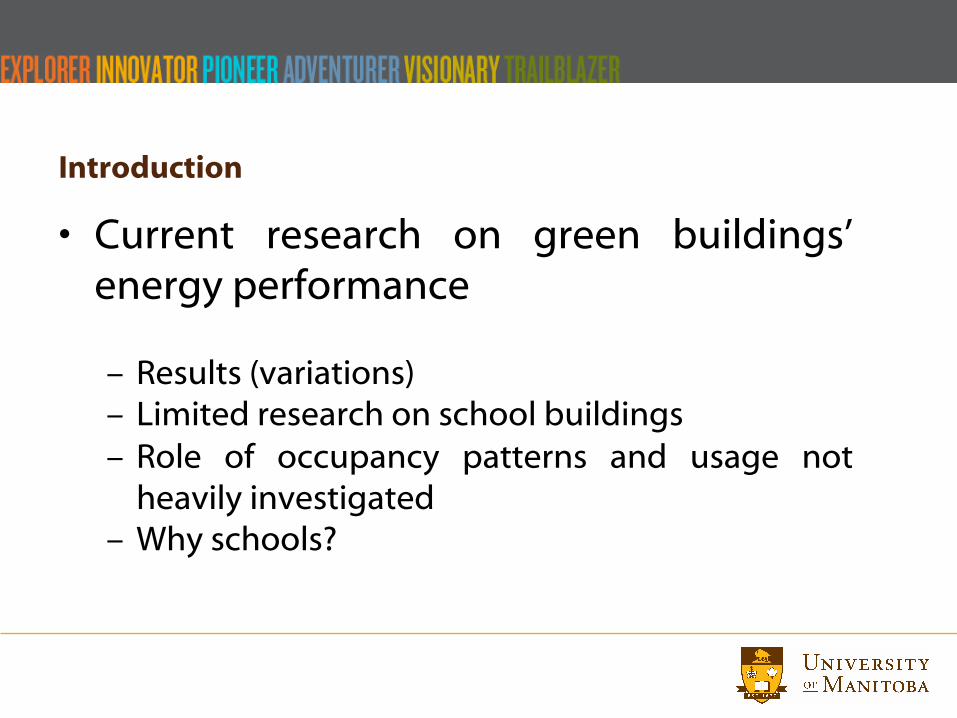
Introduction
• Current research on green buildings’energy performance
– Results (variations)– Limited research on school buildings– Role of occupancy patterns and usage not
heavily investigated– Why schools?
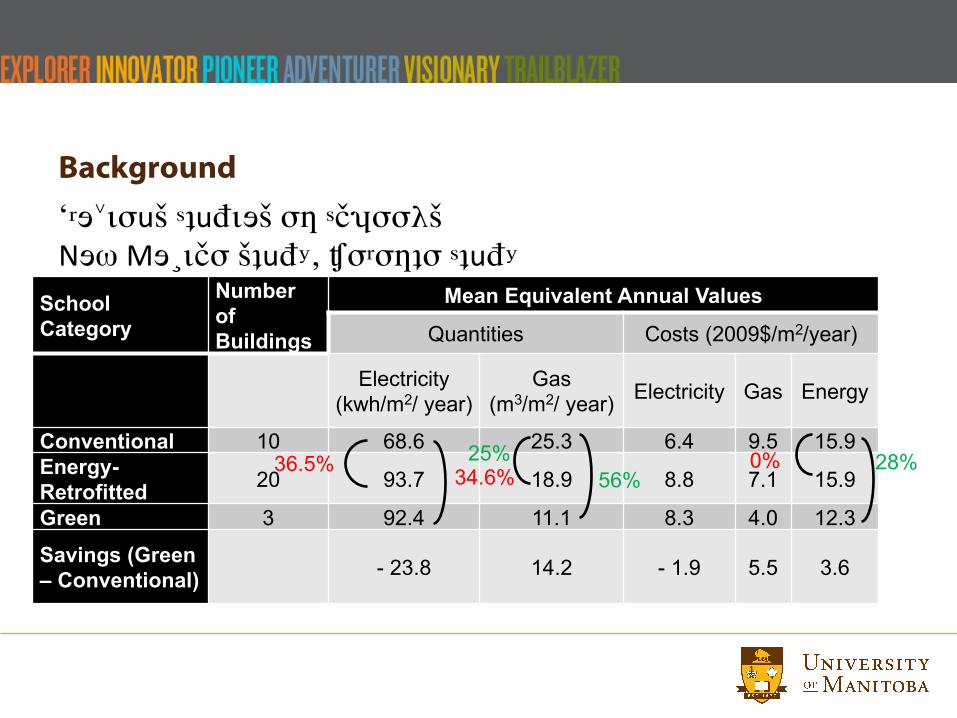
Background
School Category
Number of Buildings
Mean Equivalent Annual Values
Quantities Costs (2009$/m2/year)
Electricity (kwh/m2/ year)
Gas(m3/m2/ year) Electricity Gas Energy
Conventional 10 68.6 25.3 6.4 9.5 15.9Energy-Retrofitted 20 93.7 18.9 8.8 7.1 15.9
Green 3 92.4 11.1 8.3 4.0 12.3
Savings (Green – Conventional) - 23.8 14.2 - 1.9 5.5 3.6
36.5% 34.6%25%
56%0% 28%
Previous Studies on Schools
New Me¸ico study, Toronto Study

Background
• Several factors affect buildings’ energy consumption – Location and surrounding climate
– Building size and orientation
– occupants’ behaviour and usage• Often overlooked or estimated at best.

Objectives
• Evaluate energy performance of Manitoba’s new schools in comparison with middle-aged and old schools
• Evaluate the effect of occupancy on electricity consumption in 3 case-study schools

Scope
• Location: South Manitoba
• Summer Temp : +30 (86 F)
• Winter Temp: -30 C (-22F)

Data Collection
• Objective 1– School size
– Building footprint
– Weekly school operating hours
– School surroundings (if attached to other buildings)
– Historical Utility bills (2003 – 2013)
– Number of students (2003 – 2013)

Data Collection
• Objective 2
• Real-time electricity consumption (Feb –Jun 2015)– Total Building
– Classroom Lights and Plugs
– Gymnasium Lights and Plugs
– Other Spaces Lights and Plugs

Data Collection
• Objective 2
• Real-time Usage– General behavioural survey
– Occupancy and Light Sensors
– Daily Surveys
– Observational Studies
– Room Bookings
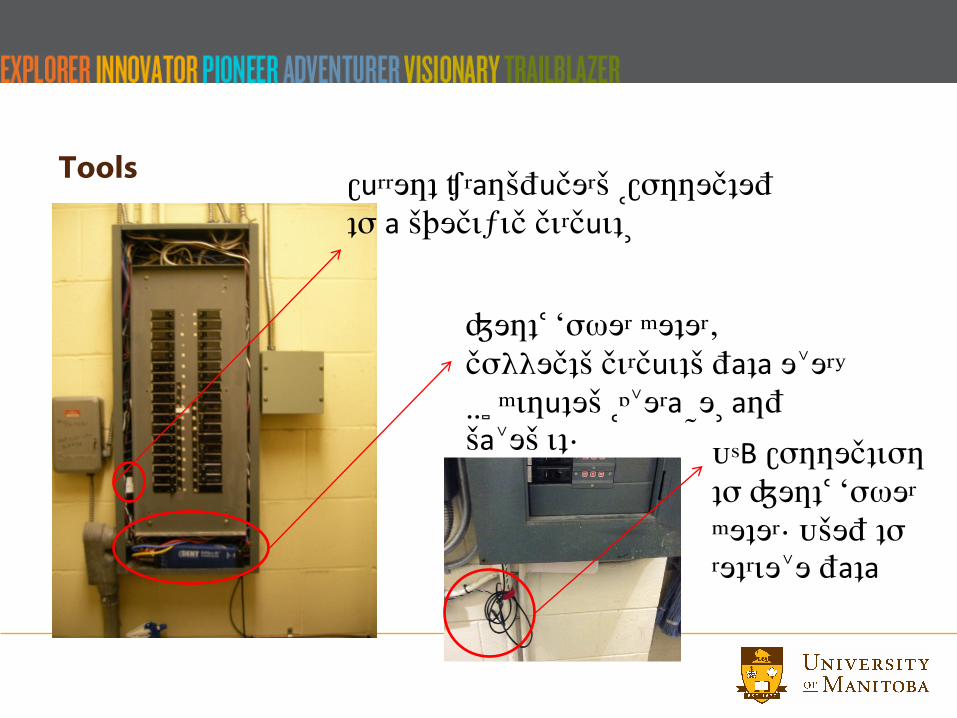
ToolsCurrent Transducers (Connected
to a specific circuit)
Dent® Power meter,
collects circuits data every
30 minutes (Average) and
saves it· USB Connection
to Dent® Power
meter· Used to
retrieve data
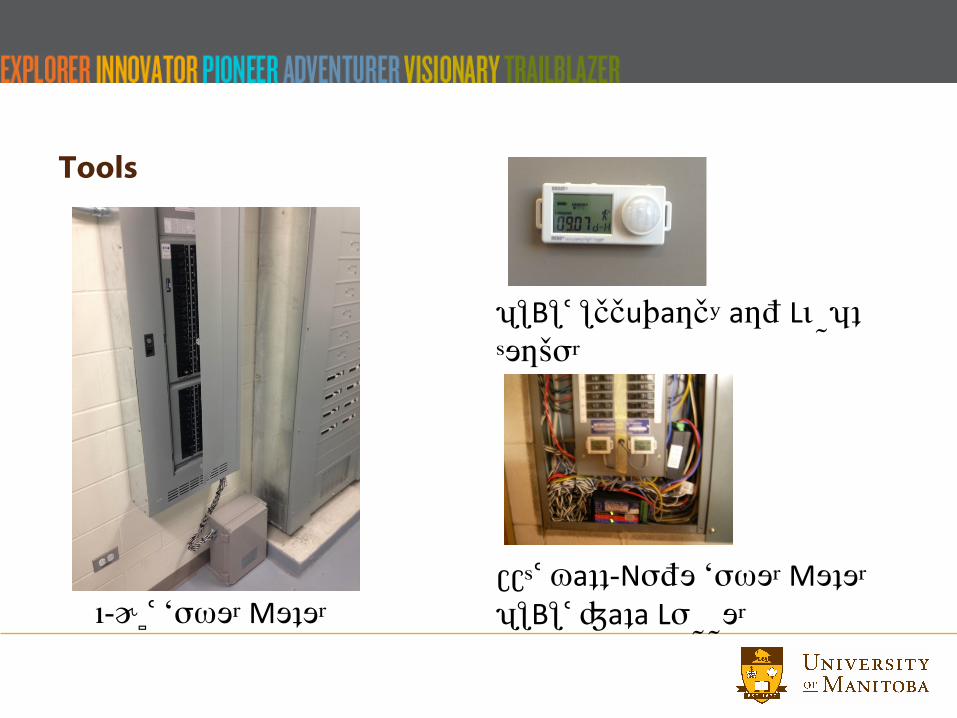
Tools
K-20® Power Meter
CCS® Watt-Node Power Meter
HOBO® Data Logger
HOBO® Occupancy and Light
Sensor
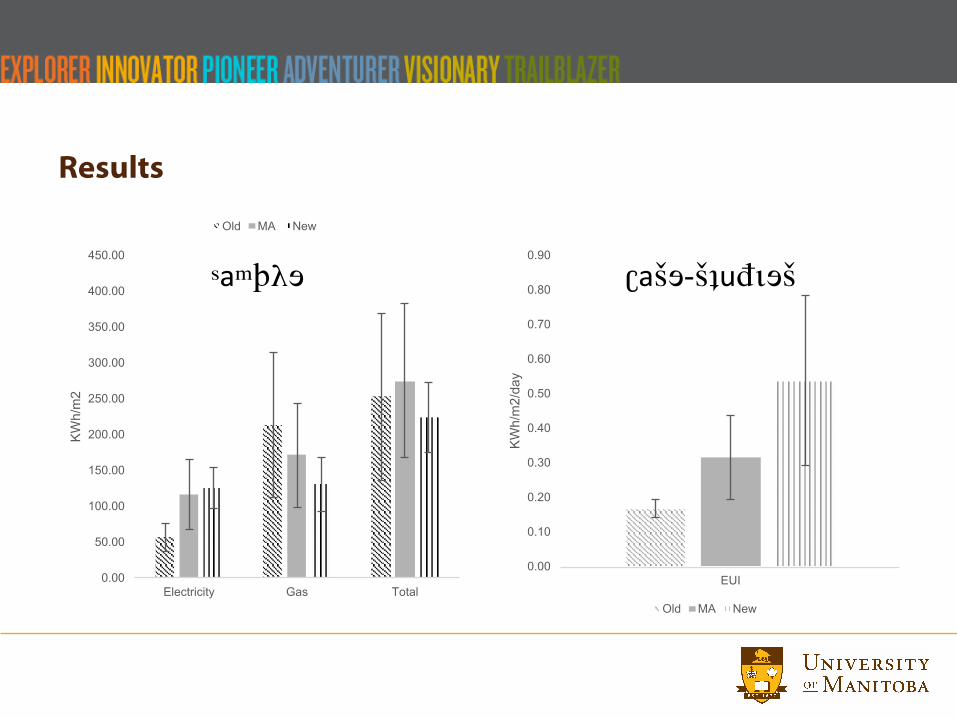
Results
0.00
50.00
100.00
150.00
200.00
250.00
300.00
350.00
400.00
450.00
Electricity Gas Total
KWh/
m2
Old MA New
0.00
0.10
0.20
0.30
0.40
0.50
0.60
0.70
0.80
0.90
EUI
KWh/
m2/
day
Old MA New
Sample Case-studies
Results
0
0.5
1
1.5
2
2.5
3
3.5
0:00
:00
1:00
:00
2:00
:00
3:00
:00
4:00
:00
5:00
:00
6:00
:00
7:00
:00
8:00
:00
9:00
:00
10:0
0:00
11:0
0:00
12:0
0:00
13:0
0:00
14:0
0:00
15:0
0:00
16:0
0:00
17:0
0:00
18:0
0:00
19:0
0:00
20:0
0:00
21:0
0:00
22:0
0:00
23:0
0:00
KW
h/m
2
New MA Old
0
0.1
0.2
0.3
0.4
0.5
0.6
0:00
:00
1:00
:00
2:00
:00
3:00
:00
4:00
:00
5:00
:00
6:00
:00
7:00
:00
8:00
:00
9:00
:00
10:0
0:00
11:0
0:00
12:0
0:00
13:0
0:00
14:0
0:00
15:0
0:00
16:0
0:00
17:0
0:00
18:0
0:00
19:0
0:00
20:0
0:00
21:0
0:00
22:0
0:00
23:0
0:00
KW
h/m
2
New MA Old
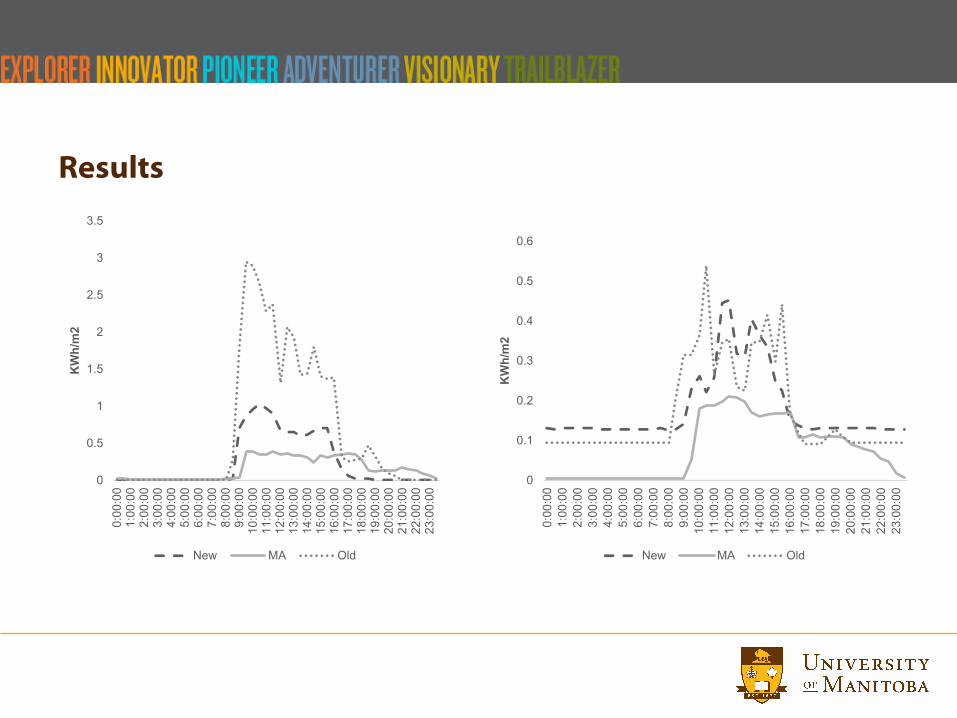
Results
0
0.5
1
1.5
2
2.5
3
3.5
4
4.5
5
0:00
:00
1:00
:00
2:00
:00
3:00
:00
4:00
:00
5:00
:00
6:00
:00
7:00
:00
8:00
:00
9:00
:00
10:0
0:00
11:0
0:00
12:0
0:00
13:0
0:00
14:0
0:00
15:0
0:00
16:0
0:00
17:0
0:00
18:0
0:00
19:0
0:00
20:0
0:00
21:0
0:00
22:0
0:00
23:0
0:00
KW
h/m
2
New MA Old
0
0.1
0.2
0.3
0.4
0.5
0.6
0.7
0.8
0.9
0:00
:00
1:00
:00
2:00
:00
3:00
:00
4:00
:00
5:00
:00
6:00
:00
7:00
:00
8:00
:00
9:00
:00
10:0
0:00
11:0
0:00
12:0
0:00
13:0
0:00
14:0
0:00
15:0
0:00
16:0
0:00
17:0
0:00
18:0
0:00
19:0
0:00
20:0
0:00
21:0
0:00
22:0
0:00
23:0
0:00
KW
h/m
2
New MA Old

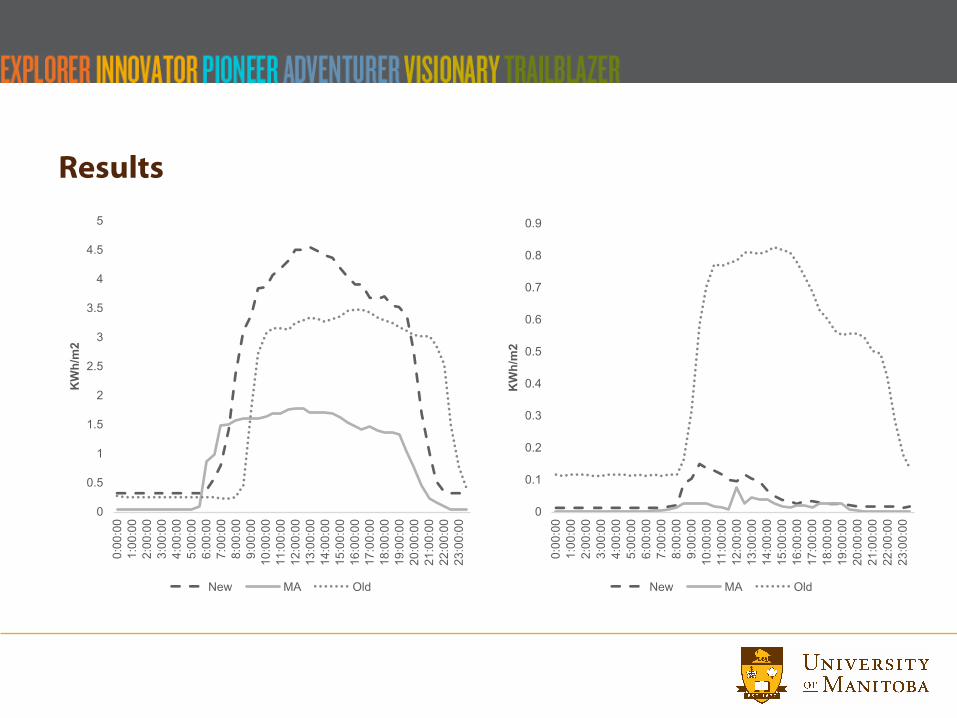
Results

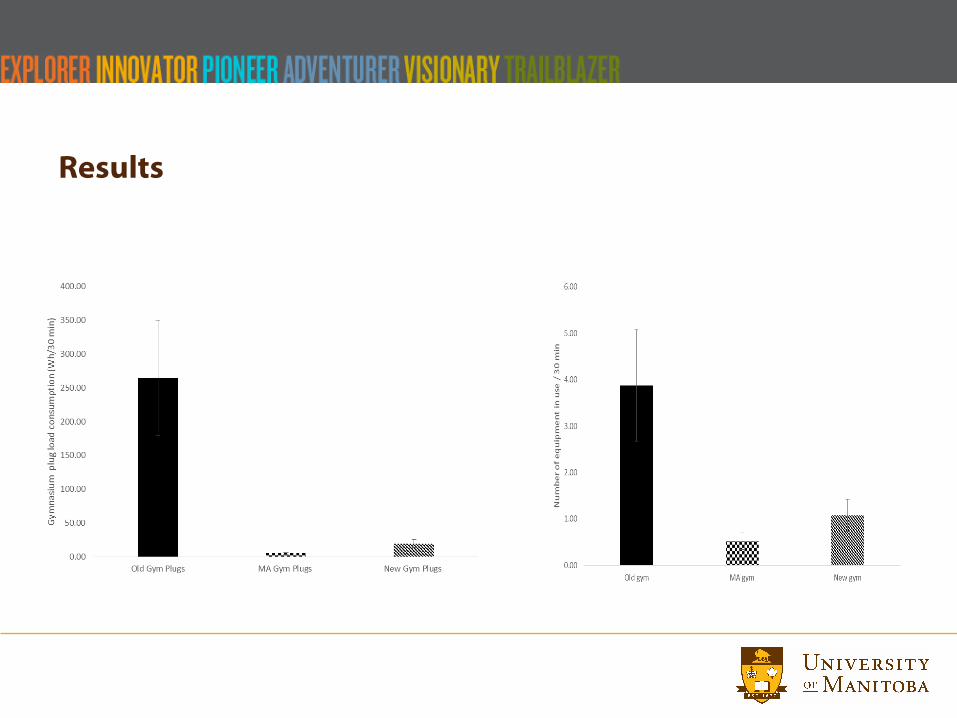
Results
Results
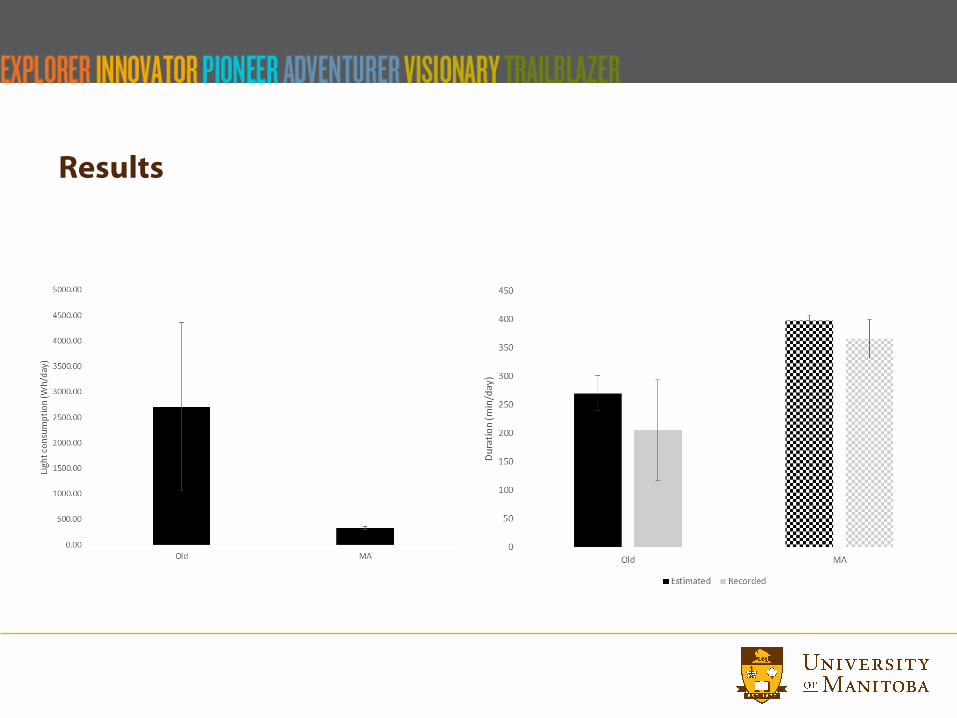
Results
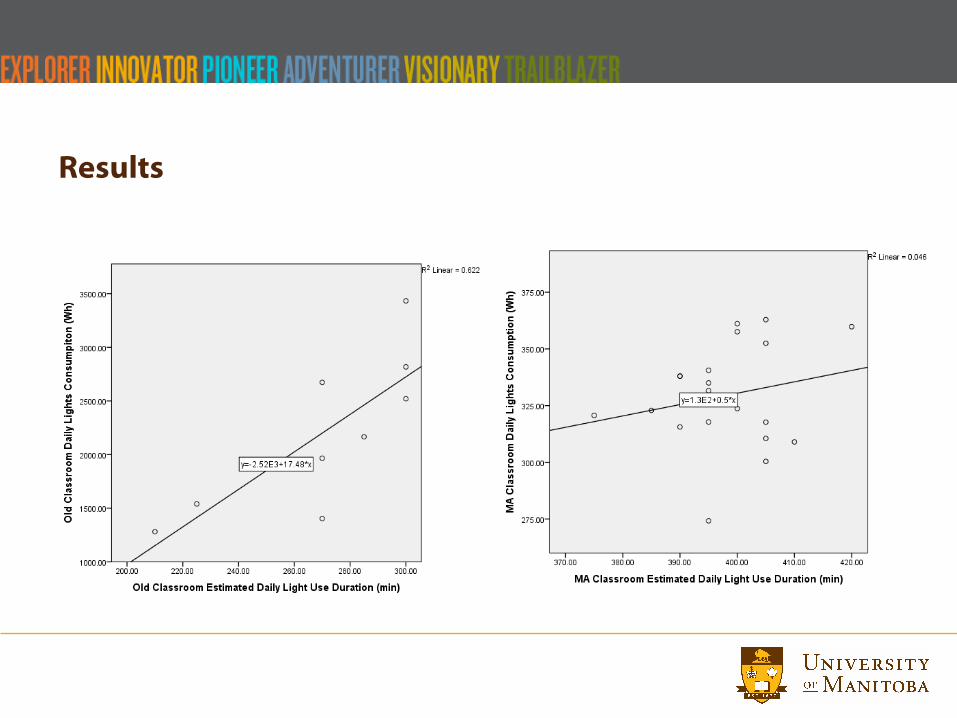
Results

Conclusions
• Electricity consumption increase in new schools
• Differences in space-level variations
• Demonstrated effect of occupants’behaviour
