the effect of novel frying methods on quality of breaded fried foods
TRANSCRIPT

The Effect of Novel Frying Methods on Quality of Breaded Fried Foods
Rhonda Bengtson
Thesis submitted to the Faculty of Virginia Polytechnic Institute and State
University in partial fulfillment of the requirements for the degree of
Master of Science
In
Biological Systems Engineering
Parameswarakumar Mallikarjunan, Chair
John S. Cundiff
George J. Flick, Jr.
July 17, 2006
Blacksburg, VA
Keywords: pressure frying, vacuum frying, fish sticks, nitrogen gas, compressed air
©2006 Rhonda Bengtson
ii
The Effect of Novel Frying Methods on Quality of
Breaded Fried Foods By Rhonda Bengtson
Parameswarakumar Mallikarjunan, Chair
Biological Systems Engineering
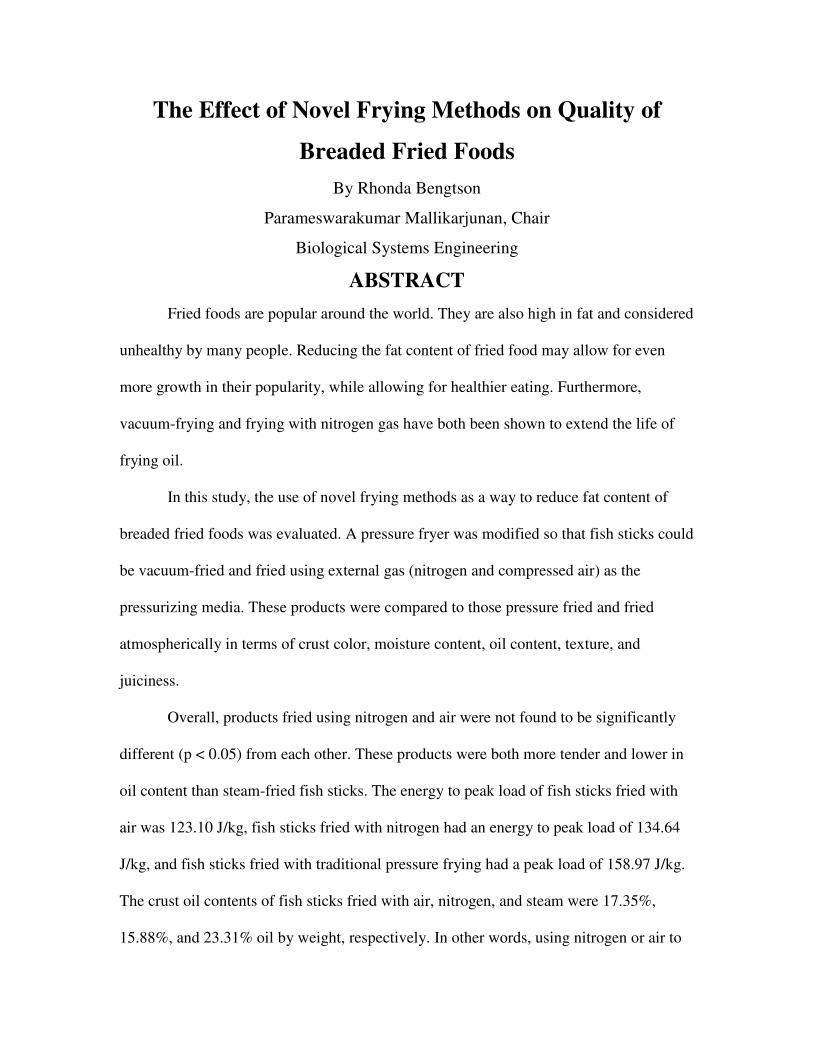
ABSTRACT Fried foods are popular around the world. They are also high in fat and considered
unhealthy by many people. Reducing the fat content of fried food may allow for even
more growth in their popularity, while allowing for healthier eating. Furthermore,
vacuum-frying and frying with nitrogen gas have both been shown to extend the life of
frying oil.
In this study, the use of novel frying methods as a way to reduce fat content of
breaded fried foods was evaluated. A pressure fryer was modified so that fish sticks could
be vacuum-fried and fried using external gas (nitrogen and compressed air) as the
pressurizing media. These products were compared to those pressure fried and fried
atmospherically in terms of crust color, moisture content, oil content, texture, and
juiciness.
Overall, products fried using nitrogen and air were not found to be significantly
different (p < 0.05) from each other. These products were both more tender and lower in
oil content than steam-fried fish sticks. The energy to peak load of fish sticks fried with
air was 123.10 J/kg, fish sticks fried with nitrogen had an energy to peak load of 134.64
J/kg, and fish sticks fried with traditional pressure frying had a peak load of 158.97 J/kg.
The crust oil contents of fish sticks fried with air, nitrogen, and steam were 17.35%,
15.88%, and 23.31% oil by weight, respectively. In other words, using nitrogen or air to

iii
fry fish sticks reduced the fat uptake in the crust by 31.8% and 25.6% compared to
traditional pressure frying, respectively.
The only area where vacuum-frying had a significant effect, when compared to
pressure-fried and atmospherically-fried fish sticks, was in juiciness. Vacuum-frying
created significantly juicier fish sticks than the other two frying methods. Vacuum-fried
fish sticks had juiciness of 43.03% (120oC) and 41.31% (150oC), while pressure-fried
fish sticks had juiciness of 30.01% (175oC) and 32.93% (190oC), and atmospherically-
fried fish sticks had juiciness of 31.56% (175oC) and 29.38% (190oC). In addition,
vacuum-fried fish sticks were more tender than atmospherically-fried fish sticks.
This results of this study demonstrated that frying with external pressurizing
media can be used to reduce oil content in fish sticks, while also creating products that
are more tender than conventionally pressure-fried fish sticks. In addition, vacuum-
frying, which has been shown to extend oil life compared to pressure frying because of
the lower temperatures involved, can be used to create fish sticks that are comparable to
pressure-fried fish sticks, but juicier.

iv
ACKNOWLEDGEMENTS
I would first like to thank my graduate advisor, Dr. Kumar Mallikarjunan, for his
guidance and assistance during my Master’s program. He is a good man who supports me
not only as his student but also as a valuable human being.
I am also grateful to Drs. John Cundiff and George Flick for serving on my
advisory committee. Without their support and encouragement, as well as that of other
faculty members, such as Drs. Brian Benham and Robert Grisso, this project would have
been much more difficult, if not impossible. I would also like to thank Robert Lane and
Mike Carpenter for providing the fish sticks used in this research, and MAOP and the BSE
Department for their financial support.
Special thanks go to all of the BSE staff members who helped me with various
parts of my planning, research, and paperwork. Most especially, I thank Amy Egan for her
tireless effort on my behalf. Her friendly face and helpful advice kept me going when there
appeared to be no end in sight.
I would be remiss if I excluded my fellow graduate students who supported,
encouraged, advised, helped, and generally loved me during the past two years. Ahmad
Athamneh, Tameshia Ballard, Leslie Clark, Amanda Martin, and Anand Lakshmikanth,
especially, deserve gold stars for putting up with me during this time. I also extend my
thanks all the way to my friends in Louisiana and beyond who have listened to me
repeatedly tell of my trials and tribulations, including Greg Wilson, Emily Acampora, Jim
Carpenter, Michael El Koubi, and Sarah Rials.
Last, I am extremely grateful to my parents who loved and supported me, even if
they didn’t entirely understand what I was doing or why. Thank you!
v
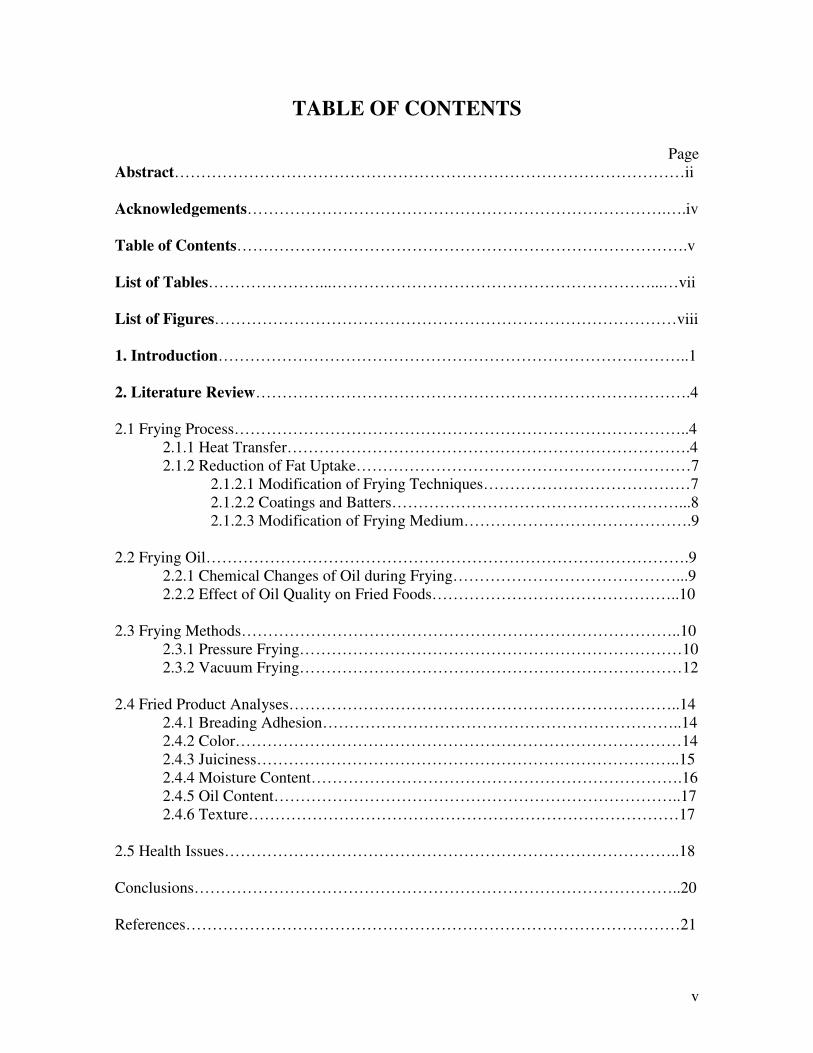
TABLE OF CONTENTS
Page Abstract……………………………………………………………………………………ii Acknowledgements…………………………………………………………………….….iv Table of Contents………………………………………………………………………….v List of Tables…………………...……………………………………………………...…vii List of Figures……………………………………………………………………………viii 1. Introduction……………………………………………………………………………..1 2. Literature Review……………………………………………………………………….4 2.1 Frying Process…………………………………………………………………………..4
2.1.1 Heat Transfer………………………………………………………………….4 2.1.2 Reduction of Fat Uptake………………………………………………………7
2.1.2.1 Modification of Frying Techniques…………………………………7 2.1.2.2 Coatings and Batters………………………………………………...8 2.1.2.3 Modification of Frying Medium…………………………………….9 2.2 Frying Oil……………………………………………………………………………….9
2.2.1 Chemical Changes of Oil during Frying……………………………………...9 2.2.2 Effect of Oil Quality on Fried Foods………………………………………..10
2.3 Frying Methods………………………………………………………………………..10
2.3.1 Pressure Frying………………………………………………………………10 2.3.2 Vacuum Frying………………………………………………………………12 2.4 Fried Product Analyses………………………………………………………………..14 2.4.1 Breading Adhesion…………………………………………………………..14 2.4.2 Color…………………………………………………………………………14 2.4.3 Juiciness……………………………………………………………………..15 2.4.4 Moisture Content…………………………………………………………….16 2.4.5 Oil Content…………………………………………………………………..17 2.4.6 Texture………………………………………………………………………17 2.5 Health Issues…………………………………………………………………………..18 Conclusions………………………………………………………………………………..20 References…………………………………………………………………………………21

vi
3. The Effect of External Pressurizing Media on Quality of Breaded Fried Foods….26 4. The Effect of Vacuum Frying on Quality of Breaded Fried Foods………………...56 5. Summary and Conclusions……………………………………………………………83 Vita………………………………………………………………………………………...86

vii
LIST OF TABLES
Page Table 3.1 Effect of Pressure on Crust Color of Breaded Fried Fish Sticks…………..43 Table 3.2 Effect of Pressure on Moisture and Oil Contents of Breaded Fried Fish
Sticks………………………………………………………………………43 Table 3.3 Effect of Pressure on Texture of Breaded Fried Fish Sticks………………43 Table 3.4 Effect of Temperature on Juiciness of Breaded Fried Fish Sticks………...44 Table 3.5 Effect of Pressure on Juiciness of Breaded Fried Fish Sticks……………..44 Table 3.6 Effect of Source of Pressure on Juiciness of Breaded Fried Fish Sticks…..44 Table 3.7 Effect of Temperature on Color of Breaded Fried Fish Sticks……………45 Table 3.8 Effect of Source of Pressure on Moisture Content of Breaded Fried Fish
Sticks………………………………………………………………………45 Table 3.9 Effect of Temperature on Moisture Content of Breaded Fried Fish Sticks.45 Table 3.10 Effect of Source of Pressure on Oil Content of Breaded Fried Fish Sticks.46 Table 3.11 Effect of Temperature on Oil Content of Breaded Fried Fish Sticks……...46 Table 3.12 Effect of Source of Pressure on Texture of Breaded Fried Fish Sticks……46 Table 3.13 Effect of Temperature on Texture of Breaded Fried Fish Sticks………….47 Table 4.1 Effect of Pressure and Temperature on Crust Color of Breaded Fried Fish
Sticks………………………………………………………………………69 Table 4.2 Effect of Pressure and Temperature on Juiciness of Breaded Fried Fish
Sticks………………………………………………………………………69 Table 4.3 Effect of Pressure and Temperature on Moisture and Oil Contents of
Breaded Fried Fish Sticks…………………………………………………69 Table 4.4 Effect of Pressure and Temperature on Texture of Breaded Fried Fish
Sticks………………………………………………………………………70

viii
LIST OF FIGURES
Page Figure 3.1 Modified Henny Penny Pressure Fryer used in this research……………...48 Figure 3.2 Typical internal temperature profile of fish sticks during frying in this
research…………………………………………………………………….49 Figure 3.3 Minolta Chromameter used in this research……………………………….50 Figure 3.4 Universal Testing Machine, with Kramer Shear Unit attached, used in this
research…………………………………………………………………….51 Figure 3.5 Kramer Shear Unit attached to universal testing machine in this research..52 Figure 3.6 Carver Press used to determine juiciness in this research…………………53 Figure 3.7 Freezemobile Freeze Dryer used in this research………………………….54 Figure 3.8 Soxtec Extraction Unit used to determine fat content in this research…….55 Figure 4.1 Vacuubrand Vacuum Pump used in this research…………………………71 Figure 4.2 Distribution of L* by Treatment…………………………………………..72 Figure 4.3 Distribution of a* by Treatment…………………………………………...73 Figure 4.4 Distribution of b* by Treatment…………………………………………...74 Figure 4.5 Distribution of Juiciness by Treatment……………………………………75 Figure 4.6 Distribution of Core Moisture Content by Treatment……………………..76 Figure 4.7 Distribution of Crust Moisture Content by Treatment…………………….77 Figure 4.8 Distribution of Core Oil Content by Treatment…………………………...78 Figure 4.9 Distribution of Crust Oil Content by Treatment…………………………..79 Figure 4.10 Distribution of Peak Load by Treatment…………………………………..80 Figure 4.11 Distribution of Energy to Peak Load by Treatment……………………….81 Figure 4.12 Distribution of Energy to Failure Point by Treatment…………………….82
1
CHAPTER 1
INTRODUCTION
Fried foods are tasty and popular around the world. One of the main reasons for
this popularity is the “textural dichotomy of the food: dry and crispy crust, tender inside”
(Mellema, 2003). Unfortunately, fried foods are also high in fat, in some cases reaching
1/3 of the total food product by weight (Mellema, 2003). The development of low-caloric
food products with reduced fat and cholesterol levels has become very important in
research and industry (Ang, 1993). Medical findings that correlate high intake of fat and
cholesterol to arterial and heart disease (American Heart Association, 1986) have pushed
this trend.
Food products fried via pressure frying are more juicy and tender than foods fried
at atmospheric pressure (Innawong, 2001). Currently, pressure fryers depend on the steam
released from large food loads to generate pressure inside the fryer (Innawong, 2001),
which can lead to wasted food products in commercial applications. Using nitrogen gas as
the pressurizing medium during frying has been shown to give food products of equal or
better quality than traditional pressure frying. In addition, the oil life was greatly extended
(Innawong, 2001).
Vacuum frying occurs at pressures well below atmospheric levels. It has been used
for some time in the frying of fruit chips (Minelli and Harney, 2000). Recently, Garayo
and Moreira (2002) demonstrated the reduction of fat in potato chips caused by frying
under vacuum conditions as opposed to atmospheric conditions.
During frying, oil quality is greatly reduced. The oil is hydrolyzed and oxidized,
forming free fatty acids and polar compounds. Steam released by food products during

2
pressure frying greatly increases the degradation. When nitrogen gas is used to generate the
pressure for frying, oil life can be extended (Innawong, 2001). During vacuum frying, oil
life and quality are increased because the low temperatures and pressures reduce
deterioration and oxidation of the frying oil (Imai, 1989).
Hypothesis
The hypothesis of this research is that there will not be a significant difference
between the use of air and nitrogen as pressure mediums during deep-fat frying. In
addition, frying with air and nitrogen will give similar or better quality fried foods when
compared to pressure frying. Finally, vacuum frying will create fried foods with reduced
oil content when compared to pressure or atmospheric frying.
Objectives
The goal of this research was to determine the effect of novel frying methods, frying
using nitrogen gas and air as the pressurizing mediums and vacuum frying, on a breaded
fried seafood product. The specific objectives were as follows:
1. Develop a vacuum fryer for use with breaded fried foods.
2. Determine the effects of frying with nitrogen, frying with air, and vacuum frying on
the quality of a breaded fried food, specifically fish sticks, in terms of moisture and
oil content, juiciness, color, and texture.
Rationale and Significance
Americans are becoming more concerned with their diets and overall fat intake.
The American government is also making great strides to address the issue of obesity and
poor eating habits among Americans. However, fried foods are still tasty and popular
around the country. The creation of a process to create delicious low-fat breaded fried

3
foods would benefit both the food industry and consumers. This research was performed to
elucidate the possibility of such a process.
4
CHAPTER 2
LITERATURE REVIEW
The most popular foods in the industry are produced through frying. This is a
complicated method for cooking involving many different simultaneous processes.
Although popular, they have a perception of being unhealthy. This review will provide
information about the frying process, issues related to frying, and the current research on
frying.
2.1 Frying Process
During the frying process, water evaporates from inside the product being fried,
creating voids that are penetrated by the oil. As long as there is moisture to evaporate, the
product will stay at a temperature of roughly 100oC (Blumenthal, 1996). As the water
evaporates, the crust indicative of fried foods is formed on the exterior of the product.
There are three simultaneous processes occurring: heat transfer from the hot oil to
the product, mass transfer of the water from the interior of the product to the exterior and
then into the oil, and mass transfer of the oil into the product. Because of the high
temperatures and the presence of water vapor (steam), the oil is also undergoing chemical
changes.
2.1.1 Heat Transfer
There is a rapid rise in the surface temperature of a food placed in hot oil. As the
product’s internal moisture is vaporized into steam, the surface begins to dry. A crunchy
crust forms on the outside as the plane of evaporation moves inside the food (Fellows,
2000) and hot fat begins to penetrate the food. The crust prevents large amounts of fat from
passing through to the inside of the product (Moreiras-Varelo et al., 1988). A film of oil
5
surrounds the product upon removal from the fryer. The thickness of this film controls the
rate of heat and mass transfer. The viscosity and velocity of oil determine the thickness of
this boundary layer (Fellows, 2000).
The initial mechanism considered for oil uptake was the condensation mechanism.
Although there is no direct proof of this mechanism, it’s been composed using common
sense. According to the condensation mechanism for oil uptake, as vapor escapes foods
frying in hot oil, an overpressure is created inside the food’s pores. This prevents the oil
from penetrating the food. This “barrier of escaping steam” continues until just after the
food is removed from the oil (Mellema, 2003). As the food cools, the vapor inside the crust
condenses, creating an underpressure in the pores. The film of oil surrounding the food
product is driven into the pores by the underpressure (Mellema, 2003). Because there is no
evidence to support this theory, it has largely been replaced by the capillary mechanism of
oil uptake, which is based on fluid flow through porous media.
After frying, according to the capillary mechanism, the pores of a food are filled
with vapor. During cooling, the surface tension between the thin film of frying oil
surrounding the product and the vapor inside the pores increases as the temperature
decreases. The capillary pressure, or pressure difference between two immiscible fluids (in
this case, water vapor and oil), subsequently increases, causing the surface oil to enter the
pores (Moreira et al., 1999). The hot oil fills the larger capillaries first, because water
vapor is removed from them first (Fellows, 2000). This mechanism has experimental
evidence to support it (Saguy and Pinthus, 1995; Moreira and Barrufet, 1998).
There is both convective and conductive heat transfer during frying. The
convection occurs between the hot oil and the food, while conduction occurs within the
6
product being fried (Singh, 1995). The rate of convective heat transfer depends on the
temperature difference between the oil and the food and by the product surface heat
transfer coefficient (Fellows, 2000). Water vapor bubbles escaping from the food also
affect the transfer of heat from the oil to the food (Singh, 1995). The rate of conductive
heat transfer depends on the thermal properties of the food, such as specific heat, thermal
conductivity, and thermal diffusivity. To complicate matters, these properties will change
with temperature during the frying process (Singh, 1995).
Farkas et al. (1996) have suggested that the frying process can be divided into four
stages: initial heating, surface boiling, falling rate, and bubble end-point. During the initial
heating stage, which usually only lasts a few seconds, the food surface is heated to the
elevated boiling point of water (approximately 103oC) through natural heat convection.
There is no vaporization of water from the surface of the food during this short time. When
vaporization begins, so does the surface boiling stage. The mode of heat transfer changes
to forced convection, because of the turbulence in the surrounding oil caused by escaping
water vapor. The crust begins to form at the surface of the food during this stage. The
falling rate stage is similar to the falling rate period that takes place during food
dehydration processes. This is when more internal moisture leaves the food and the
internal core temperature rises to the boiling point. The internal core region is undergoing
several physicochemical changes, such as cooking and starch gelatinization, and the crust
layer is increasing in thickness. After sufficient time, the vapor transfer to the surface
decreases. If the food is fried for a considerably long period of time, the bubble end point
will be reached. At this final stage, the rate of moisture removal diminishes and no more
7
bubbles are seen escaping the food surface. The crust layer continues to increase in
thickness as the frying process proceeds.
2.1.2 Reduction of Fat Uptake
There are three basic routes for the reduction of fat uptake – modification of frying
techniques, edible coatings and batters, and modification of frying medium.
2.1.2.1 Modification of Frying Techniques
It has been shown that the conditions following the removal of food from the fryer
are very important in terms of fat uptake. Proper shaking and draining of the food can help
reduce fat content, as can frying for the proper duration at the correct temperature
(Mellema, 2003). Further research has been done on how the actual frying process can be
modified to reduce oil uptake. Some researchers (Innawong et al., 2006; Ballard and
Mallikarjunan, 2006) theorized that using an external head gas, such as nitrogen, might
reduce fat uptake in breaded chicken products. While Innawong et al. (2006) found no
significant difference in the oil uptake by chicken nuggets fried in a typical pressure fryer
versus those fried with nitrogen, Ballard and Mallikarjunan (2006) found a significant
increase in the oil content of chicken nuggets fried with nitrogen versus those fried in a
traditional pressure fryer. Garayo and Moreira (2002), however, successfully reduced oil
uptake in potato chips by frying under a vacuum. The fat content was reduced by more
than 10% when fried at a vacuum pressure of 3.115 kPa instead of at atmospheric
conditions. Lloyd et al. (2004) investigated the possibility of using controlled dynamic
radiant heating as a finish heating method for par-fried French fries. It was found that
radiant heating (13.0% oil by weight) gave a significantly lower fat content than
immersion frying (19.2% oil by weight).

8
2.1.2.2 Coatings and Batters
Edible coatings may be a way to reduce the amount of oil absorbed during deep-fat
frying without negatively affecting other quality attributes like taste, texture, and product
color (Hansen, 1998). An edible film is a thin layer of edible material “formed on a food as
a coating or placed (pre-formed) on or between food components” (Krochta and Mulder-
Johnston, 1997). Besides reducing oil absorption, edible films and coatings have been
shown to improve breading adhesion, increase moisture content, and enhance texture and
appearance (Antonova et al., 2002).
One of the most common uses of edible coatings on fried foods is for reduction of
fat content, which has been correlated with an increase in moisture content. The edible
films form a thermally induced protective layer on the surface of the samples (Antonova et
al., 2002). This protective layer acts as a selective barrier to inhibit the transfer of moisture
and fat between the sample and the frying medium.
Collagen, caseins, and cellulose derivatives such as carboxy methylcellulose
(CMC), methylcellulose (MC), and hydroxypropyl methylcellulose (HPMC) have all been
used to significantly reduce oil absorption during frying (Debeaufort et al., 1998). MC and
HPMC have been used to reduce oil absorption during frying of extruded and frozen
French fries and onion rings (Gold, 1969).
Hydrophilic biopolymers can be used as water binders in a coating to reduce water
loss from the crust (Mellema, 2003). A reduction in water loss would also reduce oil
uptake (Pinthus et al., 1993). Most commercial biopolymer coatings used to reduce fat
uptake are polysaccharide coatings. Corn zein (Herald et al., 1996) and gellan gum
(Williams and Mittal, 1999) coatings have been claimed to reduce fat diffusivity. Feeny et

9
al. (1993) reported a 28% reduction in oil uptake when corn zein (CZ) was used as an
edible coating in French fried potatoes. Fan and Arce (1986) reported the use of amylose as
a surface coating to reduce fat uptake during frying. Olson and Zoss (1985) spray aqueous
gelatin solutions on battered and breaded meats. Oil absorption was reduced during frying
due to the grease resistance of the films. Feeney et al. (1993) applied zein coatings to
potatoes prior to deep-fat frying that reduced the oil content by 20 to 40% compared to
uncoated products. Polansky (1993) used collagen solution (1 to 2% w/w) to reduce the
amount of absorbed oil in potato slices by more than 40% compared to uncoated slices. A
mixture of soy protein isolate (10% w/w) and gellan gum (0.5% w/w) was recommended
by Rayner et al. (2000) for coating foods to reduce oil uptake during deep-fat frying.
2.1.2.3 Modification of Frying Medium
According to current theory, frying oil with either a high viscosity or a viscosity
that increases steeply upon cooling will decrease oil uptake, because the flow of oil is
hindered, especially in smaller holes or pores (Mellema, 2003). However, high viscosity
will also lead to less easy drainage of oil from the food (Moreira et al., 1999). No
techniques are available currently that significantly affect total oil uptake (Mellema, 2003).
2.2 Frying Oil
2.2.1 Chemical Changes of Oil during Frying
Frying oil undergoes many changes during the frying process, mostly due to the
high temperature and presence of water vapor. The presence of steam will lead to
hydrolysis, the end products of which include free fatty acids and partial glycerides
(deMan, 1999). Autoxidation occurs from contact with air. Oxidation products include
10
oxidized monomeric, dimeric, and oligomeric triglycerides, and volatile compounds such
as aldehydes, ketones, alcohols, hydrocarbons, and sterols. Thermal degradation from high
oil temperatures causes accelerated deterioration of the oil and the formation of free fatty
acids. Free fatty acids will lead to foaming and will alter the viscosity, flavor, and color of
the oil (Fellows, 2000).
2.2.2 Effect of Oil Quality on Fried Foods
The quality of frying oil heavily influences the final quality of the products fried in
it. It is commonly accepted that there are five stages that frying oil goes through during its
lifetime (Blumenthal, 1991). The first stage is break-in oil when foods produced are raw
and light in color, cooking odors are not present, product surfaces are not crispy and little
oil is absorbed. The second stage is fresh oil when foods are partially cooked, there is
slight browning at the edges of the product, product surfaces begin to crisp and there is
slightly more oil absorption. The next stage is optimum oil when foods are golden brown-
in color, products are fully cooked with crisp, rigid surfaces, pleasant cooking odors exist,
and there is optimal oil absorption. The fourth stage is degrading oil when products have
spotted surfaces and are becoming limp and there is excess oil absorption. The final stage
is runaway oil when foods have dark, hard surfaces, the product is excessively oily and not
fully cooked, and unpleasant odors and flavors are present.
2.3 Frying Methods
2.3.1 Pressure Frying
Frying in a closed pressurized system raises the boiling points of both frying oil
and product moisture, increasing the rate of heat transfer to the food and shortening frying

11
time. In addition, foods fried under pressure usually preserve more moisture and flavor
(Shyu et al., 1998). Unfortunately, a large food load is required to create enough steam to
allow for pressurization. Both Innawong et al. (2006) and Ballard and Mallikarjunan
(2006) experimented with using nitrogen gas as the pressurizing medium for deep fat
frying. The thought was that an external pressurizing medium, such as nitrogen gas, would
create the same good fried food qualities as traditional pressure frying while allowing for
smaller food loads and less waste. An additional bonus could be the preservation of frying
oil quality, degraded more quickly by the presence of steam.
Innawong et al. (2006) compared chicken nuggets fried with nitrogen gas with
chicken nuggets fried in a traditional pressure fryer, in terms of moisture retention and
lipid uptake. For his research, the author modified a commercial pressure fryer by adding
an exhaust tube and a T-shaped tube to allow for the flow of nitrogen into the vessel.
Innawong et al. (2006) found that the time to reach the desired frying pressure was much
shorter for nitrogen than for steam. In addition, products fried with nitrogen gas were
juicier. No significant differences were found in terms of breading adhesion, crust fat
content, or color. Nitrogen fried chicken nuggets had a softer crust, but were more tender
than nuggets fried under atmospheric conditions. When comparing the oil quality, the
nitrogen gas increased the life of the frying oil compared to traditional pressure frying, by
slowing the degradation of the oil (Innawong, 2001).
Ballard and Mallikarjunan (2006) compared chicken nuggets coated with edible
film coatings and fried with two pressure sources (nitrogen and steam). They concluded
that nuggets fried under nitrogen gas had similar or better quality when compared to
samples fried with steam, in terms of moisture and fat content, juiciness, and color. Ballard

12
and Mallikarjunan (2006) also investigated the effect of edible film coatings and pressure
source (nitrogen or steam) on crispness of chicken nuggets. They determined crispness
using an ultrasonic non-destructive evaluation system developed by Antonova et al.
(2002). Samples fried using nitrogen had a higher ultrasonic velocity than samples fried
with steam and were therefore determined to be crispier. A sensory panel using forty
untrained subjects suggested there were no differences in consumer acceptance of steam-
fried chicken nuggets versus nitrogen-fried chicken nuggets, in terms of crispness, oiliness,
juiciness, and flavor.
2.3.2 Vacuum Frying
During frying, the increased temperature causes boiling of the oil and product
moisture. The water in the fried foods evaporates leaving voids behind. Some oil will enter
the product to fill the voids; however, most oil is absorbed into the core of the product
during cooling. Since the product’s crust will have the highest temperature, it will lose the
most moisture, leaving more voids for oil (Mellema, 2003). During cooling, this surface oil
will enter the product core because of pressure differences between the core and its
surroundings (Garayo and Moreira, 2002).
During vacuum frying, reduced pressure is applied, lowering the boiling points of
both the frying oil and the moisture in food. This allows food to be fried at lower
temperatures, preserving their natural colors and flavors (Shyu et al., 1998). In addition, oil
life and quality are increased because the low temperatures and pressures reduce
deterioration and oxidation of the frying oil (Imai, 1989).
Shyu et al. (1998) compared the oxidative stability of palm oil, lard, and soybean
oil during vacuum frying. They did not do a direct comparison to other frying processes,

13
but they did determine that “vacuum frying imparted a lower oxidative degradation on the
frying oil than the typical frying.”
Shyu and Hwang (2001) vacuum fried apple chips at 3.115 kPa and 90, 100, and
110oC. They determined the optimum frying temperature and time to be 100-110oC and
20-25 min, respectively.
Garayo and Moreira (2002) produced vacuum-fried potato chips with decreased oil
content (27% wet basis) compared to atmospheric-fried potato chips (40% wet basis). The
vacuum-fried potato chips were fried at an oil temperature of 144oC and a vacuum pressure
of 3.115 kPa. The atmospheric-fried potato chips were fried at 165oC and 101.35 kPa.
They also found that vacuum-fried chips had higher volume shrinkage and were softer and
lighter than atmosphere-fried chips. They theorize that a slower-forming crust under
vacuum conditions causes the reduced oil content. This allows less oil to be held at the
surface, leaving less oil to be absorbed into the core. Potato chips were also fried under
vacuum at 16.661 and 9.888 kPa and 118 and 132oC.
In a patent for parfried potato strips, Minelli and Harney (2000) described the
optimal parameters for vacuum frying. Temperatures below 290oF are preferred, because,
above that level, vacuum-frying benefits, such as improved moisture removal efficiency
and better flavor retention, are reduced and become comparable to atmospheric frying at
the same temperature. Below 240oF, however, moisture removal becomes slow, increasing
frying time and/or vacuum levels, which, in turn, increase processing costs. Pressures
between 34 and 68 kPa are preferred. As pressures become lower, the boiling point of
water decreases, decreasing the moisture removal rate. This increases the traditional frying

14
behavior of vacuum frying. At higher pressures, the cost of creating and maintaining the
vacuum becomes very great.
Though some work has also been done on carrot, apple, and potato chips, there has
been no work on the vacuum frying of breaded foods.
2.4 Fried Product Analyses
2.4.1 Breading Adhesion
Maskat and Kerr (2004) shook fried chicken breasts on an orbital shaker
(VMRbrand, VMR Scientific Products, West Chester, PA). Innawong (2001) measured
breading adhesion using a method described by Suderman and Cunningham (1983), in
which ten pieces of the fried product (in this case, chicken nuggets) are shaken in a
standard wire sieve (No. 4 US Sieve) for 1 minute. Accumulated breadcrumbs were
weighed and used to calculate percentage coating loss.
2.4.2 Color
Shyu et al. (2005) measured the surface color of vacuum-fried carrot chips with a
colorimeter (Nippon Denshoku 90 color difference meter, Tokyo, Japan). They expressed
color as Hunter L, a, and b values. Garayo and Moreira (2002) used a Hunter Lab
Colorimeter Labscan XE (Hunter Associates Laboratory, Reston, VA) to measure color of
vacuum-fried potato chips. Both Innawong et al. (2006) and Ballard and Mallikarjunan
(2006) used a Minolta chromameter (Model CR-300, Minolta Camera, Ltd., Osaka, Japan)
to measure the L*, a*, and b* values of chicken nugget crusts. Moyano et al. (2002) used
this same instrument to determine French fry color, Baik and Mittal (2003) used it for fried
tofu, and Ramirez and Cava (2005) used it for fried pork chop loins. Patterson et al.

15
(2004) used a Minolta chromameter Model CR-200 for akara (fried cowpea paste). Dogan
et al. (2005) used a Minolta color reader (CR-10) on fried chicken nuggets. Hue angle was
used to characterize color.
2.4.3 Juiciness
Innawong et al. (2006) measured juiciness of chicken nuggets using a press method
described by Mallikarjunan and Mittal (1994), in which the core of the nugget was pressed
with 20 kPa pressure for 1 minute between aluminum foil, pre-weighed filter paper, and
Plexi-glass plates. The filter papers were re-weighed following the press and the weight
increase was correlated to the product’s expressed juice.
Since juiciness is more qualitative than quantitative, sensory panels, trained and
untrained, are the most common way to determine juiciness acceptability of foods. Sensory
panels can be influenced by personal biases, ambiguity of the survey, and individual
variability (Ballard, 2003), but there is not a consensus on a better way to determine
juiciness. Recently, sensory testing has been used to determine juiciness of tomatoes
(Plaehn and Lundahl, 2006), apples (Peneau et al., 2006), chicken (Xiong et al., 2006),
pork (Teye et al., 2006), ostrich meat (Hoffman et al., 2006), and buffalo meat (Thomas et
al., 2006).
Xiong et al. (2006), for example, used a consumer panel, consisting of 74 people,
to evaluate the acceptability of the juiciness of chicken breasts as well as overall texture
and tenderness, appropriateness of tenderness, and intensity of tenderness. These results,
along with those from a seven-member trained panel were correlated to instrumental
measurements.

16
Hoffman et al. (2006) used an 8-member trained panel to evaluate ostrich meat in
terms of initial juiciness, sustained juiciness, intensity of ostrich aroma, impression of
tenderness, amount of residue, and overall ostrich flavor. The initial juiciness was
described as “the amount of fluid exuded on the cut surface when pressed between the
thumb and forefinger,” and was rated on a scale of 0 (extremely dry) to 100 (extremely
juicy). The sustained juiciness was described as “the degree of juiciness perceived after the
first two to three chews between the molar teeth,” and was also rated on a scale of 0 to 100.
2.4.4 Moisture Content
Ramirez and Cava (2005) determined the moisture content of fried pork loin chops
by drying 5 g samples at 102oC until a constant weight was reached (AOAC, 2000).
Maskat et al. (2005) determined the moisture content of surface layers of coated chicken
breasts by oven drying at 105oC (AOAC, 2000). Dogan et al. (2005) dried fried chicken
nuggets in a forced convection oven at 105oC until constant weight was reached (AOAC,
2000). Shyu et al. (2005) dried vacuum-fried carrot chips in a vacuum oven to a constant
weight at 70oC to determine moisture content (MC). Maskat and Kerr (2004) measured the
weight difference of fried chicken breasts before and after drying at 100oC in a vacuum
oven for 24 hours (AOAC, 2000). Garayo and Moreira (2002) dried ground vacuum-fried
potato chips in a forced air oven at 105oC for 24 hours (AACC, 1986) to determine MC.
Moyano et al. (2002) dried French fries and Pedreschi and Moyano (2005) dried potato
chips in a convection oven at 105oC until constant weight was reached. Holownia et al.
(2000) determined the MC of fried marinated chicken strips using a Genesis SQ 25 Super
ES freeze dryer (Virtis Co., Gardiner, NY). The pressure in the chamber was kept below
17
3.2 kPa and the temperature was 20oC. Innawong et al. (2006) also used a freeze dryer to
determine MC of chicken nuggets.
2.4.5 Oil Content
Kita and Lisinska (2005) used Soxhlet’s method (AOAC, 2000) to determine fat
content of French fries with a Buchi B-811 universal extraction system (Buchi
Labortechnic AG, Flawil, Switzerland). Shyu et al. (2005) determined oil content (OC) of
vacuum-fried carrot chips gravimetrically by Soxhlet extraction (AOAC, 2000). Dogan et
al. (2005) used Soxhlet extraction with n-hexane for 6 hours on fried chicken nuggets
(AOAC, 2000). Ballard and Mallikarjunan (2006) used method 991.36 (AOAC, 2000) with
a Soxtec extraction unit to determine OC of chicken nuggets. Garayo and Moreira (2002)
used the Soxtec System HT extraction unit (AACC, 1986) with petroleum ether to
determine OC of vacuum-fried potato chips. Moyano et al. (2002) used a method by Bligh
and Dyer (1959) to determine oil content of French fries. This method involves using a
1:2:0.8 (v/v/v) mixture of chloroform, methanol, and water. Pedreschi and Moyano (2005)
also used this method on potato chips. Ramirez and Cava (2005) used the same method but
with 1:2 chloroform/methanol mixture. Innawong et al. (2006) used method 960.39
(AOAC, 2000) to determine OC of freeze-dried chicken nuggets. Holownia et al. (2000)
used a Labconco Goldfisch Fat and Oil Extractor (Labconco Corp., Kansas City, MO) with
petroleum ether as the solvent to determine OC of freeze-dried edible film-coated chicken
strips.
2.4.6 Texture
Dogan et al. (2005) determined texture of chicken nuggets in terms of fracturability
or brittleness, which is defined as the force at the first significant break in the first positive
18
bite area of the Texture Profile Analysis curve. A conical probe was attached to a texture
analyzer (Lloyd Instruments, TA Plus, Hants, UK). Shyu et al. (2005) used a TA-XT2
texture analyzer (Stable Micro Systems Co. Ltd., Godalming, Surrey, UK) to determine the
breaking force of vacuum-fried carrot chips. Pedreschi and Moyano (2005) did the same
with potato chips. Kita and Lisinska (2005) determined texture of French fries using an
Instron 5544 instrument with a rectangular attachment. The velocity of the head was 250
mm/min with a 100 kg load cell. Maximum shear force was determined. Patterson et al.
(2004) used an Instron universal testing machine (model 1122, Instron Corp., Canton, MA)
with a Kramer cell to characterize the texture of akara. They determined peak force
required to cut through the akara ball using a 500 kg load cell with a crosshead speed of 50
mm/min. Garayo and Moreira (2002) also used a TA-XT2 Texture Analyzer for a rupture
test on vacuum-fried potato chips. Innawong et al. (2006) used a Kramer shear unit with a
Sintech/MTS universal testing machine (model 5G, MTS, NC) to characterize the texture
of chicken nuggets. Peak load, total energy to peak load, and energy to failure point were
calculated.
2.5 Health Issues
Coronary heart disease is the single leading cause of death in the United States. It
caused 479, 305 deaths in 2003 alone. Cardiovascular disease was the cause of 37.3% of
all deaths in the United States in 2003 (American Heart Association, 2006). The excessive
consumption of fat, especially saturated fat, has been linked to the development of
cardiovascular disease. Dietary trans-fatty acids enhance the risk of developing coronary
heart disease (Ruiz-Roso and Varela, 2001). While deaths from cardiovascular disease and
19
coronary heart diseases have been decreasing over the last several years, there is still much
to be concerned about. Excess fat consumption from fried foods can be a key contributor to
coronary heart disease (Browner et al., 1991), as they can contain 10-40% oil (deMan,
1999). Browner et al. (1991) estimated that if all Americans reduced consumption of
saturated fat, the corresponding reductions in cholesterol levels could reduce deaths from
coronary heart disease by 5-20%, depending on age.
There is also an association between dietary fat and obesity. The prevalence of
overweight, obese, and morbidly obese Americans increased significantly from the time
the Third National Health and Nutrition Examination Survey (NHANES III) was
performed between 1988-1994 (Kuczmarski et al., 1994) until a survey (NHANES 1999-
2000) was performed by Flegal et al. (2002) from 1999-2000. Obesity is considered a
pandemic and is associated with cardiovascular disease, type 2 diabetes, hypertension,
sleep apnea, and certain cancers (Poirier et al., 2006).
In 1997, Swedish researchers discovered that cooking food at high temperatures
can lead to the formation of acrylamide, a known neurotoxin and potential carcinogen
(Erickson, 2004). Rats fed fried feed had N-(2-carbamoylethyl)valine (CEV) adduct levels
ten times higher in their hemoglobin than rats fed unfried feed. This adduct is formed when
acrylamide reacts with globin. In an analysis of the feed, fried feed had approximately
fifteen times more acrylamide present than unfried feed (Tareke et al., 2000). Granda and
Moreira (2005) investigated the possibility of vacuum frying potato chips to reduce the
formation of acrylamide. The acrylamide content of vacuum fried potato chips was 94%
less than traditionally fried potato chips. The lower temperatures used in vacuum frying
(118-140oC) compared to those in traditional frying (150-180oC) were cited as the cause of

20
the reduced acrylamide content. The biggest concern for the presence of acrylamide is in
starch-rich foods (i.e. potato chips, French fries); however, protein-rich foods, especially
ones coated in batter and breading before being fried, still contain a not insignificant
amount of acrylamide (Tareke et al., 2002).
Conclusions
Recently, the United States Food and Drug Administration (FDA) began requiring
that the amount of trans fat in a product be added to its label, thus increasing the awareness
of the fat content of the foods Americans eat. While there is concern about the healthiness
of fried foods, their popularity is not waning. There is clearly still a need for more research
into the development of ways to create healthier (i.e. low-fat) fried foods.
21
REFERENCES AACC. 1986. Approved methods of the American Association of Cereal Chemists.
Minneapolis, MN.
American Heart Association. 11 June 2006. American Heart Association. 11 June 2006.
<http://www.americanheart.org>.
Antonova, I., P. Mallikarjunan and M.S. Chinnan. 2002. Protein-based edible coatings
for fried foods. In Protein-Based Films and Coatings (Gennadios, A., ed.). CRC
Press, Boca Raton, FL.
AOAC. 2000. Official Methods of Analysis of AOAC International, 17th ed. Washington,
DC.
Baik, O.D. and G.S. Mittal. 2003. Kinetics of tofu color changes during deep-fat frying.
Lebensm.-Wiss. U.-Technol. 36: 43-48.
Ballard, T. 2003. Application of edible coatings in maintaining crispness of breaded fried
foods. Masters Thesis. Virginia Polytechnic Institute and State University.
Ballard, T. and P. Mallikarjunan. 2006. The effect of edible coatings and pressure
frying using nitrogen gas on the quality of breaded fried chicken nuggets. J. Food
Sci. 71(3): 259-264.
Bligh, E.G. and W. Dyer. 1959. A rapid method of total lipid extraction and purification.
Canadian J. Biochem. Physio. 37: 911-917.
Blumenthal, M.M. 1991. A new look at the chemistry and physics of deep-fat frying.
Food Technol. 45(2): 68-71, 94.
Blumenthal, M.M. 1996. Frying Technology. In Bailey’s Industrial Oil and Fat Products.
Volume 3: Edible Oil and Fat Products: Products and Application Technology (5th
ed.). Y.H. Hui, ed. John Wiley & Sons, Inc. 605 Third Avenue, New York, NY.
Browner, W.S., J. Westenhouse and J.A. Tice. 1991. What if Americans ate less fat? A
quantitative estimate of the effect on mortality. J. Am. Med. Assn. 265: 3285-3291.
Debeaufort, F., J. Quezada-Gallo and A.Voilley. 1998. Edible films and coatings:
Tomorrow’s packagings: A review. Critical Reviews in Food Science. 38(4): 299-
313.
deMan, J.M. 1999. Principles of Food Chemistry, Third Edition. Aspen Publishers, Inc.
p. 65-70.

22
Dogan, S.F., S. Sahin and G. Sumnu. 2005. Effects of soy and rice flour addition on
batter rheology and quality of deep-fat fried chicken nuggets. J. Food Engr. 71(1):
127-132.
Erickson, B.E. 2004. Finding acrylamide. Anal. Chem. 76(13): 247A-248A.
Fan, L.L. and J.A. Arce. 1986. Pretreatment of fried food products with oil containing
emulsifiers. U.S. Patent No. 4608264.
Farkas, B.E., R.P. Singh and T.R. Rumsey. 1996. Modeling heat and mass transfer in
immersion frying. I. Model development. J. Food Engr. 29: 211-226.
Feeney, R.D., S.G. Haralampu and A.T. Gross. 1993. Potato and other food products
coated with edible oil barrier films. U.S. Patent No. 5217736.
Fellows, P. 2000. Food Processing Technology: Principles and Practice, 2nd edition. CRC
Press, LLC, Boca Raton, FL.
Flegal, K.M., M.D. Carroll, C.L. Ogden, and C.L. Johnson. 2002. Prevalence and trends
in obesity among US adults, 1999-2000. 288: 1723-1727.
Garayo, J. and R. Moreira. 2002. Vacuum frying of potato chips. J. Food Engr. 55: 181-
191.
Gold, W.L. 1969. Hydrocolloid surface treatment to yield French fried potato products.
U.S. Patent No. 3424591.
Granda, C. and R.G. Moreira. 2005. Kinetics of acrylamide formation during traditional
and vacuum frying of potato chips. J. Food Proc. Engr. 28: 478-493.
Hansen, S.L. 1998. Effects of prefry drying methods on the quality of deep fat fried onion
slices. J. Food Qual. 21: 433-443.
Herald, T.J., K.A. Hachmeister, S. Huang and J.R. Bowers. 1996. Corn zein packaging
materials for cooked turkey. J. Food Sci. 61: 415.
Hoffman, L.C., S.S. Botha and T.J. Britz. 2006. Sensory properties of hot-deboned
ostrich (Struthio camelus var. domesticus) Muscularis gastrocnemius, pars interna.
Meat Sci. 72(4): 734-740.
Holownia, K.I., M.S. Chinnan, M.C. Erickson and P. Mallikarjunan. 2000. Quality
evaluation of edible film-coated chicken strips and frying oil. J. Food Sci. 65(6):
1087-1090.
Imai, K. 1989. Method of and apparatus for processing vacuum fry. U.S. Patent No.
23
4,828,859.
Innawong, B. 2001. Improving fried product and frying oil quality using nitrogen gas in a
pressure frying system. PhD. Dissertation. Virginia Polytechnic Institute and State
University.
Innawong, B., P. Mallikarjunan, J. Marcy, J. and J. Cundiff. 2006. Pressure conditions
and quality of chicken nuggets fried under gaseous nitrogen atmosphere. J. Food
Proc. Preserv. 30: 231-245.
Kita, A. and G. Lisinska. 2005. The influence of oil type and frying temperatures on the
texture and oil content of French fries. J. Sci. Food Agric. 85: 2600-2604.
Krochta, J.M. and C.D. Mulder-Johnston. 1997. Edible and biodegradable polymer
films: Challenges and opportunities. Food Technol. 51(2): 61-74.
Kuczmarski, R.J., K.M. Flegal, S.M. Campbell and C.L. Johnson. 1994. Increasing
prevalence of overweight among US adults: the National Health and Nutrition
Examination Surveys, 1960 to 1991. J. Am. Med. Assn. 272: 205-211.
Lloyd, B.J., B.E. Farkas and K.M. Keener. 2004. Quality comparison of French fry style
potatoes produced by oven heating, immersion frying, and controlled dynamic
radiant heating. J. Food Process. Preserv. 28: 460-472.
Mallikarjunan, P. and G.S. Mittal. 1994. Meat quality kinetics during beef carcass
chilling. J. Food Sci. 59: 291-294, 302.
Maskat, M.Y. and W.L. Kerr. 2004. Effect of breading particle size on coating adhesion
in breaded, fried chicken breasts. J. Food Qual. 27: 103-113.
Maskat, M.Y., H.H. Yip and H.M. Mahali. 2005. The performance of a methyl cellulose-
treated coating during the frying of a poultry product. Intern. J. Food Sci. Technol.
40: 811-816.
Mellema, M. 2003. Mechanism and reduction of fat uptake in deep-fat fried foods.
Trends Food Sci. Tech. 14: 364-373.
Minelli, M.P. and D.L. Harney. 2000. Process for preparing parfried, frozen potato strips.
U.S. Patent No. 6,136,358.
Moreira, R.G. and M.A. Barrufet. 1998. A new approach to describe oil absorption in
fried foods: a simulation study. J. Food. Engr. 35: 1-22.
Moreira, R.G., M.E. Castell-Perez, and M.A. Barrufet. 1999. Deep-Fat Frying:
24
Fundamentals and Applications. Gaithersburg, MD: Aspen Publishers, Inc. 179-
180.
Moreiras-Varelo, O., B. Ruiz-Roso and G. Varela. 1988. Effects of frying on the nutritive
value of food. In: Varela, G., A.E. Bender, I.D. Morton, eds. Frying of food:
Principles, changes, new approaches. Chichester, U.K.: Ellis Horwood Ltd. 93-102.
Moyano, P.C., V.K. Rioseco and P.A. Gonzalez. 2002. Kinetics of crust color changes
during deep-fat frying of impregnated French fries. J. Food Engr. 54: 249-255.
Olson, S. and R. Zoss. 1985. Fried foods of reduced oil absorption and methods of
preparation employing spray of film forming agent. U.S. Patent No. 4511583.
Patterson, S.P., R.D. Phillips, K.H. McWatters, Y-C. Hung and M.S. Chinnan. 2004. Fat
reduction affects quality of akara (fried cowpea paste). Intern. J. Food Sci. Technol.
39: 681-689.
Pedreschi, F. and P. Moyano. 2005. Oil uptake and texture development in fried potato
slices. J. Food Engr. 70(4): 557-563.
Peneau, S., E. Hoehn, H-R. Roth, F. Escher and J. Nuessli. 2006. Importance and
consumer perception of freshness of apples. Food Qual. Pref. 17(1-2): 9-19.
Pinthus, E.J., P. Weinberg and I.S. Saguy. 1993. Criterion for oil uptake during deep-fat
frying. J. Food Sci. 58: 204-205, 222.
Plaehn, D. and D.S. Lundahl. 2006. An L-PLS preference cluster analysis on French
consumer hedonics to fresh tomatoes. Food Qual. Pref. 17(3-4): 243-256.
Poirier, P., T.D. Giles, G.A. Bray, Y. Hong, J.S. Stern, F.X. Pi-Sunyer and R.H. Eckel.
2006. Obesity and cardiovascular disease: Pathophysiology, evaluation, and effect
of weight loss. Circulation. 113(6): 898-918.
Polansky, S. 1993. Deep fried foodstuffs retaining a minimum amount of frying medium
and a method for their preparation. U.S. Patent No. 5232721.
Ramirez, M.R. and R. Cava. 2005. Changes in color, lipid oxidation and fatty acid
composition of pork loin chops as affected by the type of culinary frying fat.
Lebensm.-Wiss. U.-Technol. 38(7): 726-734.
Rayner, M., V. Ciolfi, B. Maves, P. Stedman and G.S. Mittal. 2000. Development and
application of soy-protein films to reduce fat intake in deep-fried foods. J. Sci.
Food Agric. 80: 777-782.
25
Ruiz-Roso, B. and G. Varela. Health issues. In Frying: Improving Quality. J.B. Rossell,
ed. Cambridge, UK: Woodhead Publishing Limited. 59-84.
Saguy, I.S. and E.J. Pinthus. 1995. Oil uptake during deep-fat frying: factors and
mechanism. Food Technol. 4: 142-145, 152.
Shyu, S-L., L-B. Hau and L.S. Hwang. 1998. Effect of vacuum frying on the oxidative
stability of oils. J. Am. Oil Chem. Soc. 75(10): 1393-1398.
Shyu, S-L., L-B. Hau and L.S. Hwang. 2005. Effects of processing conditions on the
quality of vacuum-fried carrot chips. J. Sci. Food Agric. 85: 1903-1908.
Shyu, S-L. and L.S. Hwang. 2001. Effects of processing conditions on the quality of
vacuum fried apple chips. Food Res. Inter. 34: 133-142.
Suderman, D.R. and F.E. Cunningham. 1983. Batter and Breading. Westport, CT:
AVI Pub. Co., 224 p.
Tareke, E., P. Rydberg, P. Karlsson, S. Eriksson and M. Tornqvist. 2000. Acrylamide: A
cooking carcinogen? Chem. Res. Toxicol. 13: 517-522.
Tareke, E., P. Rydberg, P. Karlsson, S. Eriksson and M. Tornqvist. 2002. Analysis of
acrylamide, a carcinogen formed in heated foodstuffs. J. Agric. Food Chem. 50:
4998-5006.
Teye, G.A., P.R. Sheard, F.M. Whittington, G.R. Nute, A. Stewart and J.D. Wood. 2006.
Influence of dietary oils and protein level on pork quality. 1. Effects on muscle
fatty acid composition, carcass, meat and eating quality. Meat Sci. 73(1): 157-165.
Thomas, R., A.S.R. Anjaneyulu and N. Kondaiah. 2006. Quality and shelf life evaluation
of emulsion and restructured buffalo meat nuggets at cold storage (4 ± 1 oC). Meat
Sci. 72(3): 373-379.
Williams, R. and G.S. Mittal. 1999. Low-fat fried foods with edible coatings: Modeling
and simulation. J. Food Sci. 64: 317-322.
Xiong, R., L.C. Cavitt, J-F. Meullenet and C.M. Owens. 2006. Comparison of Allo-
Kramer, Warner-Bratzler and razor blade shears for predicting sensory tenderness
of broiler breast meat. J. Texture Studies. 37(2): 179-199.

26
CHAPTER 3 THE EFFECT OF EXTERNAL PRESSURIZING MEDIA ON
QUALITY OF BREADED FRIED FOODS
ABSTRACT
Pressure frying is a popular way to create juicy and tender foods, but it is
dependent upon large food loads to generate the pressure required inside the fryer. The use
of nitrogen gas as an external pressurizing media has been explored in previous studies.
This study evaluated the use of compressed air, much easier and less expensive to obtain
than nitrogen gas, as a pressurizing media during deep-fat frying. Fish sticks were fried at
two temperatures (175oC and 190oC) and two pressures (163 kPa and 184 kPa) by either
traditional pressure frying or external pressurizing media (nitrogen gas or compressed air).
The products were evaluated in terms of color, juiciness, moisture content, oil content, and
texture. Overall, products fried using nitrogen gas and compressed air were not found to be
significantly different (p < 0.05). In addition, these products had significantly lower (p <
0.05) crust oil contents and were more tender than steam-fried fish sticks. Frying with
nitrogen or air reduced the oil uptake in the crust by 31.8% and 25.6%, respectively,
compared to frying with steam.
Keywords: pressure frying, nitrogen gas, fish sticks, compressed air
In preparation for submission to LWT – Food Science and Technology

27
INTRODUCTION
Fried foods are popular around the world. One of the main reasons for this
popularity is the “textural dichotomy of the food: dry and crispy crust, tender inside”
(Mellema, 2003). Popular fried foods include fish sticks - 19.51 million pounds ($41.53
million value) were produced in 2001 in the U.S. alone (Gupta, 2004).
Food products fried via pressure frying are more juicy and tender than foods fried
at atmospheric pressure (Mallikarjunan, Chinnan, and Balasubramaniam, 1995; Rao and
Delaney 1995). Currently, pressure fryers depend on the steam released from large food
loads to generate pressure inside the fryer (Innawong, Mallikarjunan, Marcy, and Cundiff,
2006), which can lead to wasted food products in commercial applications. Using nitrogen
gas as the pressurizing medium during frying has been shown to give food products of
equal or better quality than traditional pressure frying, while allowing for smaller fry loads
(Innawong et al., 2006).
During frying, oil quality is greatly reduced. The oil is hydrolyzed and oxidized,
forming free fatty acids and polar compounds. Steam released by food products during
pressure frying also greatly increases the degradation of the oil. As oil degrades, it
negatively affects the quality of food being fried, in terms of color, texture, and flavor
(Blumenthal, 1991). When nitrogen gas is used to generate the pressure for frying, oil life
can be doubled (Innawong, 2001).
The objective of this study was to evaluate the use of compressed air, which is less
expensive and easier to obtain than nitrogen gas, as a pressurizing medium during deep-fat
frying of fish sticks. Experiments were conducted to compare the effects of compressed

28
air, nitrogen gas, and traditional pressure frying on the quality attributes (crust color,
juiciness, moisture content, oil content, and texture) of fried fish sticks.
MATERIALS AND METHODS
Sample Preparation
Par-fried frozen fish sticks were obtained from Icelandic USA, Inc. (Newport
News, VA). The fish sticks consisted of 42% minced pollock and were par-fried in
hydrogenated soybean oil. The breading consisted of enriched bleached wheat flour,
enriched yellow corn flour, and cellulose gum. They were packaged in dry ice during
shipping. Upon arrival, the fish sticks were placed in a freezer (-18oC), where they were
stored prior to frying.
Frying Experiment
Fish sticks were fried in a modified pressure fryer (Model 500C, Henny Penny,
Inc., Eaton, OH, Figure 3.1) using commercial soybean oil (Bakers & Chefs, North
Arkansas Wholesale Company, Inc., Bentonville, AR). Samples were fried at one of two
temperatures (175oC and 190oC) and one of two pressures (163 kPa and 184 kPa). These
temperatures and pressures were chosen because data exists for other products fried at
these settings (Innawong et al., 2006). Three pressure sources, compressed air, nitrogen
gas, and steam released from the food, were used to generate the required pressure in the
fryer.
Using a system developed by Innawong (2001), a tee replaced the exhaust tube
used to connect the operating valve to the fry pot. A universal connection was attached to
the tee, allowing for links to either the nitrogen gas tank or the compressed air valve, as

29
needed. The amount of pressure (163 kPa or 184 kPa) was set using weights in the
operating valve.
Each treatment combination included 1200 g of product fried for a constant time of
240 s. This was enough time for the internal temperature of the fish sticks to reach 100oC,
which was determined in a preliminary test. Figure 3.2 shows a typical internal
temperature profile of fish sticks during frying in this research. Internal temperature was
determined using thermocouples connected to a data logger (Model 21X, Campbell
Scientific, Inc., Logan, UT). There was an average 30 s delay for closing and opening the
fryer. There were three replications for each treatment (pressure, temperature, pressure
source) combination.
Color Analysis
The color of the products was measured immediately after frying using a Minolta
chromameter (Model CR-300, Minolta Camera, Ltd., Osaka, Japan, Figure 3.3) calibrated
to a white plate. L*, a*, and b* values were used to characterize color of the fried fish stick
crusts. The test was replicated three times using three different samples.
Texture Analysis
Texture of the products was analyzed using a universal testing machine (Model 5G,
MTC, NC, Figure 3.4) with a Kramer shear unit (Figure 3.5) attached. This test simulates
biting into the product. The load and crosshead speed were maintained at 5 kN and 100
mm/min, respectively. The peak load (N/kg), total energy to peak load (N-mm/kg), energy
to failure point (N-mm/m3) were determined and used to characterize the texture of the
fried fish sticks.

30
Juiciness
The juiciness of the fried products was determined using a slight modification to
the method developed by Mallikarjunan and Mittal (1994) method. In this study, a Carver
press (Model C, Fred S. Carver, Inc., Menomonee Falls, WI, Figure 3.6) was used to apply
pressure to the samples. One gram of core meat was placed between two sheets of
aluminum foil, which were in turn placed between two pre-weighed filter papers
(Whatman No. 5, 110 mm diameter). This sandwich was placed between two Plexi-glass
plates (12.5 x 12.5 cm) and compressed with an applied load 3000 N for one minute. The
amount of time and pressure was determined through a preliminary test. The weight
increase of the filter papers was recorded as pressed juice. The test was replicated three
times using three different samples.
Moisture and Fat Content
Moisture and fat contents were determined for both the core and the crust of the
fried products. After separation, the mass of the crust and core of each component were
measured, wrapped in a pre-weighed filter paper and placed inside a pre-weighed cellulose
extraction thimble. Samples were frozen overnight then freeze-dried (The Virtis Company,
Inc., Gardiner, NY, Figure 3.7) for three days. The thimbles containing the samples and
filter paper were weighed again to determine the moisture content. Freeze drying allows
the removal of moisture from the product without the destruction of its porous structure
(Ateba and Mittal, 1994). The test was replicated three times.

31
A subsequent fat analysis was conducted on the samples. The fat content was
determined using a Soxtec extraction unit (Figure 3.8) and AOAC method 991.36 (AOAC,
2000) with petroleum ether as the solvent. The test was replicated three times.
Statistical Analysis
The effect of pressure source, pressure, and temperature on color, juiciness,
moisture content, oil content and texture of fried fish sticks was evaluated using a three-
way factorial design with three levels of pressure source and two levels each of pressure
and temperature. The SAS statistical software package (version 9.0, 2004) was used to
conduct an analysis of variance (ANOVA) and Fisher’s least significant difference (LSD)
test, which was used to determine significant differences between treatments means. Alpha
(�) was set at 0.05 for all analyses.
RESULTS AND DISCUSSION
Effect of Pressure
Pressure as a main effect did not significantly influence (p > 0.05) any quality
measures of the fried fish sticks (Table 3.1 – Table 3.3). These results are contradictory to
those of Innawong et al. (2006), who found that pressure significantly affected (p < 0.05)
moisture content, oil content, and texture of fried chicken fillets. In the case of this
research, the insignificance of pressure may be due to differences in pressurizing media, in
terms of the length of time each took to reach the specified frying pressure. It took longer
for the specified pressure to be reached during traditional pressure frying because the
products’ internal moisture had to be heated, evaporated, and then released from the
product, before it was able to build up inside the fryer. The reduced time at the specified
32
pressure might have reduced the effect that pressure would have on the products being
fried.
The interaction of pressure and pressure source did significantly influence (p <
0.05) core oil content. The interaction of temperature and pressure significantly affected (p
< 0.05) peak load.
Juiciness
Juiciness was not significantly affected (p > 0.05) by temperature, pressure, source
of pressure, or any combination thereof (Table 3.4 – Table 3.6). Ballard and Mallikarjunan
(2006) also found that pressure source had no significant effect on juiciness. Innawong et
al. (2006), on the other hand, found that frying with nitrogen gas increased juiciness of
fried chicken fillets compared to traditional pressure frying. In addition, Innawong et al.
(2006) found that an increase in oil temperature decreased juiciness of chicken fillets. The
disparity between the results from this study and those conducted by Ballard and
Mallikarjunan (2006) and Innawong et al. (2006) suggests that the method used to measure
juiciness in this research might need to be re-evaluated. On the other hand, the differences
could be due to different product and batter formulations. The other researchers both fried
chicken products, while fish was used in this research. The natural juices and oils in fish
differ from those of chicken and might be affected differently by the frying process or the
techniques used for measurement. The meat of the products also differed in structure. The
structure determines the ease with which moisture migrates from the interior to the exterior
of foods during frying (Ateba and Mittal, 1994). Moisture migration would affect juiciness,
as moisture is one of the components of the juiciness of a food product. In addition, the
breadings used in this research contained cellulose gum and that of Ballard and

33
Mallikarjunan (2006) contained whey protein isolate or methylcellulose, while the
breading in the study by Innawong et al. (2006) did not. Edible coatings, such as cellulose
gums, inhibit moisture migration during frying (Antonova, Mallikarjunan, and Chinnan,
2002), which could explain the differences in juiciness.
Effect of Temperature on Color
While neither pressure nor pressure source had a significant effect on color,
temperature significantly affected (p < 0.05) both L* (lightness) and a* (green-red
chromaticity) (Table 3.7). A higher L* value means that the fish sticks were lighter in
color, while higher a* values indicate that more Maillard reactions are occurring (Garayo
and Moreira, 2002). Maillard reactions are a form of non-oxidative browning (i.e. the
increase in the red color of the fish sticks with temperature). Visually, fish sticks fried at
190oC were dark brown in color (L* = 77.85, a* = 2.57), while those fried at 175oC were
more golden brown (L* = 77.85, a* = 9.67). This relationship between temperature and
color is intuitive, because the velocity of Maillard reactions is affected by temperature.
Ballard and Mallikarjunan (2006) found that chicken nuggets fried with nitrogen were
significantly lighter in color than traditionally-fried chicken nuggets, while Innawong et al.
(2006) found no significant difference between the color of nitrogen-fried chicken fillets
and the color of traditionally-fried chicken fillets. Temperature and time of frying are the
most important factors affecting product color, thus it is not surprising that the source of
pressure had no effect on color.
Effect of Source of Pressure on Moisture Content
While pressure source had no significant effect (p < 0.05) on core moisture content,
there were significant differences between treatment means (Table 3.8). Fish sticks fried
34
with air as the pressurizing medium had significantly higher moisture contents (70.47%) in
the core of the product than fish sticks fried with nitrogen (67.86%), while the core
moisture content of nitrogen-fried fish sticks was also less than traditionally-fried fish
sticks (68.69%), though not significantly so. These results are similar to those of Ballard
and Mallikarjunan (2006) who found that nitrogen-fried chicken nuggets had statistically
lower core moisture contents than steam-fried nuggets. Innawong et al. (2006), however,
found that chicken fillets fried with nitrogen were shown to have significantly higher core
moisture contents than those fried with steam.
According to Ballard and Mallikarjunan (2006), the larger fry load used by
Innawong et al. (2006) resulted in a temperature drop that reduced the amount of moisture
loss from the product. The fry load in this research was equivalent to that used by
Innawong et al. (2006) and therefore, prevents the same line of reasoning in this situation.
The products used in the research by Innawong et al. (2006) did not contain edible
coatings, while both this research and the research done by Ballard and Mallikarjunan
(2006) involved products that did contain them. Edible coatings, such as cellulose gums
and whey protein isolate, inhibit moisture migration during frying (Antonova,
Mallikarjunan, and Chinnan, 2002), which could explain the differences in moisture
content effects.
Source of pressure also significantly affected (p < 0.05) the crust moisture content
(Table 3.8). Traditional pressure frying, where steam generated from the frying products is
the pressure source, gave significantly lower crust moisture contents (33.46%) than either
frying with compressed nitrogen (36.85%) or air (36.27%). The difference between crust
moisture content for air and nitrogen was not significant. Innawong et al. (2006) also

35
found that steam gave lower crust moisture contents than nitrogen, though the differences
were not significant. During pressure frying, the internal moisture of the food products is
heated, evaporated, and then released into the fryer through pores in the food. This release
of steam allows for the slow build up of pressure within the fryer. For pressure to build up
in the fryer, moisture must first be removed from the crust. With the use of external
pressurizing media, the specified pressure is reached shortly after the fryer lid is closed.
The external pressure is most likely greater than the pressure created by the steam
attempting to escape, thus inhibiting the escape of moisture from products being fried with
nitrogen or compressed air. This accounts for the lower crust moisture contents found in
traditionally pressure-fried fish sticks.
Effect of Temperature on Crust Moisture Content
Temperature also significantly affected (p < 0.05) the crust moisture content (Table
3.9). Products fried at 190oC had lower moisture contents in the crust of the products
(33.50%) than those fried at 175oC (37.56%). Others have found similar results: Innawong
et al. (2006) with chicken fillets, Shyu and Hwang (2001) with apple chips, and Shyu,
Hau, and Hwang (2005) with carrot chips. During frying, the moisture in a product will
vaporize when the local temperature is greater than the saturation temperature at the
pressure of the fryer. Since the crust is in direct contact with the frying oil, it is at a much
higher temperature than the saturation temperature and will, therefore, release moisture
more rapidly than the core of the food. Since the temperature of liquid water cannot be
greater than the saturation temperature, any further heat supplied to the water will result in
increased evaporation of the remaining moisture (Rao and Delaney, 1995).

36
Effect of Source of Pressure on Oil Content
Source of pressure significantly affected (p < 0.05) both the crust and core oil
contents of the fish sticks. No differences were found between the oil contents of fish
sticks fried with nitrogen and fish sticks fried with air; however, traditional pressure frying
had a significant effect on both crust and core oil contents (Table 3.10). Traditionally
pressure-fried fish sticks had decreased oil content in the sample cores and increased oil
content in the crusts of the products, when compared with fish sticks fried using external
pressurizing media. Frying with external pressurizing media decreased the overall oil
content, when compared to traditional pressure frying. Frying with nitrogen, for example,
led to an 18% reduction in overall oil content vs. steam, while frying with air led to an 8%
reduction.
When external pressurizing media was used, the full pressure was reached shortly
after the lid of the fryer was closed. For traditional pressure frying, on the other hand,
much more time was required for enough steam to be released from the products to
produce the specified pressure. Since the external pressurizing media allowed the fish
sticks to be fried for an overall longer period of time at the target pressure, there was more
time for oil to be forced past the crust and into the core of the product, whereas the oil in
the steam-fried fish sticks seems to have been restricted to the crust. This is also mostly
likely the reason for the significance of the pressure/source of pressure interaction upon
core oil content.
Another possibility behind the decreased oil contents in the crust of fish sticks fried
with external pressurizing media is that the gas entering the fryer created bubbles,
changing the turbulence of the oil, thus, changing the heat and mass transfer properties
37
between the oil and the fish sticks. The presence of bubbles may also have inhibited the
transfer of water vapor out of the fish sticks and migration of oil into the fish sticks by
affecting the interfacial tension between the water vapor in the pores of the product and the
oil surrounding it. Surface tension between the two is a key part of the condensation
mechanism, the currently accepted mechanism for oil uptake (Saguy and Pinthus, 1995).
Innawong et al. (2006) did not find that source of pressure had a significant effect
on crust oil content, while Ballard and Mallikarjunan (2006) found that frying with
nitrogen increased crust and core oil content versus traditional pressure frying. The
difference could be due to the different products being fried – fish instead of chicken – or
possibly due to different batter formulations. Another product-specific possibility is the
surface area of the foods being fried. Greater surface area results in increased oil uptake
(Saguy and Pinthus, 1995). The products fried in the previous studies might have been
larger, thus allowing for more contact between the product and the oil, or they might have
greater surface roughness, which increases the overall surface area of the product.
Effect of Temperature on Core Oil Content
An increase in temperature led to a significant decrease (p < 0.05) in core oil
content (Table 3.11). The core oil contents of fish sticks fried at 175oC and 190oC were
4.63% and 3.50%, respectively. Although not significant, the crust oil content was also less
for higher temperatures than for lower temperatures. These results were somewhat
surprising, given that in general, within a certain temperature range, increasing the frying
temperature decreases the oil absorption (Fan and Arce, 1986), but overall, the amount of
oil uptake is independent of temperature (Gamble, Rice, and Selman, 1987). The results, at
least as far as the core oil content is concerned, are correlated to the moisture loss. In the
38
core after frying at 175oC, the moisture content was lower and the oil content higher than
after frying at 190oC. One possibility for the reduced core oil content at higher
temperatures could be that some natural oils in the fish products were removed along with
the rapidly evaporating moisture at the higher temperature, but not at the lower
temperatures.
Effect of Source of Pressure on Texture
The source of pressure significantly affected (p < 0.05) the peak load, energy to
peak load, and energy to failure point (Table 3.12). In all three cases, fish sticks fried with
steam gave significantly higher values than fish sticks fried with air. Fish sticks fried with
steam also had a significantly higher energy to peak load (158.97 J/kg) than those fried
with nitrogen (134.64 J/kg). Higher values of peak load, energy to peak load, and energy to
failure point correlate to harder, tougher fish sticks. In general, the results of Innawong et
al. (2006) agree that nitrogen-fried foods have softer crusts and are more tender than
steam-fried foods.
Rao and Delaney (1995) found that increased pressures during frying decrease the
continuity of the breading starch network, resulting in softer textures. In contrast, frying
with lower pressures created breading with open networks of starch and protein. The voids
in this breading mostly contain air and oil, but little moisture, thus they are crisp. When
external pressurizing media was used, fish sticks were fried at the specified pressure for a
longer period of time than steam-fried fish sticks, where the pressure built slowly during
the process, thus the continuity of the starch network in the crust was reduced in fish sticks
fried with either nitrogen gas or compressed air. This resulted in softer textures.

39
Effect of Temperature on Texture
Temperature significantly affected (p < 0.05) both the peak load and energy to peak
load, but not the energy to failure point (Table 3.13). An increase in temperature led to an
increase in peak load, energy to peak load, and energy to failure point, meaning that higher
temperatures lead to tougher, harder fish sticks. Innawong et al. (2006) also found that
increasing temperature increased toughness of chicken nuggets. An increase in temperature
results in further moisture loss from the crust of the product, creating a drier, crispier
texture.
Although pressure was not found to significantly affect any texture measurement in
this study, the pressure-temperature interaction did affect (p < 0.05) peak load. Texture is
dependent upon both temperature and pressure and is related to the moisture loss in the
crust of the product (Rao and Delaney, 1995). The internal moisture of the product being
fried will evaporate when the local temperature is greater than the saturation temperature at
the pressure of the fryer (Rao and Delaney, 1995). Each temperature-pressure combination
will have a unique saturation temperature inside the fryer, thus each combination will have
a unique effect on moisture loss and, thus, the texture of the crust.
CONCLUSIONS
With the exception of core moisture content, where frying with compressed air
gave significantly higher values than nitrogen, no differences were found between products
fried using nitrogen and those fried using compressed air. The use of both air and nitrogen
as external pressurizing media created fish sticks that were more tender and lower in oil
content than those created via traditional pressure frying. This suggests that the use of

40
external pressurizing media during pressure frying can create healthier fish sticks, while
reducing fry loads and increasing frying oil life. Further studies that explore the effect of
compressed air (composed of 21% oxygen) as a pressurizing medium on the life of frying
oil are suggested. In addition, consumer acceptance of products fried using external
pressurizing media should be evaluated.

41
REFERENCES AOAC. (2000). Official Methods of Analysis of AOAC International. 17th edition, Vol.
2. Washington, DC.
Antonova, I., Mallikarjunan, P. & Chinnan, M.S. 2002. Protein-based edible coatings
for fried foods. In A. Gennadios. Protein-Based Films and Coatings. Boca Raton,
FL: CRC Press.
Ateba, P. & Mittal, G.S. (1994). Modeling the deep-fat frying of beef meatballs. Int. J.
Food Sci. Technol. 29: 429-440.
Ballard, T. & Mallikarjunan, P. (2006). The effect of edible coatings and pressure
frying using nitrogen gas on the quality of breaded fried chicken nuggets. J. Food
Sci. 71(3): 259-264.
Blumenthal, M.M. (1991). A new look at the chemistry and physics of deep-fat frying.
Food Technol. 45(2): 68-71, 94.
Fan, L.L. & Arce, J.A. (1986). Preparation of fried food products with oil containing
emulsifiers. U.S. patent 4,608,264.
Gamble, M.H., Rice, P. & Selman, J.D. (1987). Relationship between oil uptake and
moisture loss during frying of potato slices from cv. Record U.K. tubers. Int. J.
Food Sci. Technol. 22: 233-241.
Garayo, J. & Moreira, R. (2002). Vacuum frying of potato chips. J. Food Engr. 55: 181-
191.
Gupta, M.K. (2004). The frying industry. In M.K. Gupta, K. Warner & P.J. White. Frying
Technology and Practices (pp. 1-15). Champaign, IL: AOCS Press.
Innawong, B. (2001). Improving fried product and frying oil quality using nitrogen gas in
pressure frying system. PhD. Dissertation. Virginia Polytechnic Institute and State
University.
Innawong, B., Mallikarjunan, P., Marcy, J. & Cundiff, J. (2006). Pressure conditions and
quality of chicken nuggets fried under gaseous nitrogen atmosphere. J. Food Proc.
Preserv. 30: 231-245.
Mallikarjunan, P. & Mittal, G.S. (1994). Meat quality kinetics during beef carcass
chilling. J. Food Sci. 59: 291-294, 302.
Mallikarjunan, P., Chinnan, M.S. & Balasubramaniam, V.M. (1995). Mass transfer in
42
edible film coated chicken nuggets: Influence of frying temperature and pressure.
In G. Narshimhan, M.R. Okos & S. Lombardo. Advances in Food Engineering (pp.
107-111). West Lafayette, IN: Purdue University.
Mellema, M. (2003). Mechanism and reduction of fat uptake in deep-fat fried foods.
Trends Food Sci. Technol. 14: 364-373.
Rao, V.N.M. & Delaney, R.A.M. (1995). An engineering perspective on deep-fat frying
of breaded chicken pieces. Food Technol. 49(4): 138-141.
Saguy, I.S. & Pinthus, E.J. 1995. Oil uptake during deep-fat frying: Factors and
mechanism. Food Technol. 49(4): 142-145, 152.
SAS Institute. (2004). SAS Institute, Inc., Cary, NC.
Shyu, S-L. & Hwang, L.S. (2001). Effects of processing conditions on the quality of
vacuum fried apple chips. Food Res. Intern. 34: 133-142.
Shyu, S-L., Hau, L-B. & Hwang, L.S. (2005). Effects of processing conditions on the
quality of vacuum-fried carrot chips. J. Sci. Food Agric. 85: 1903-1908.
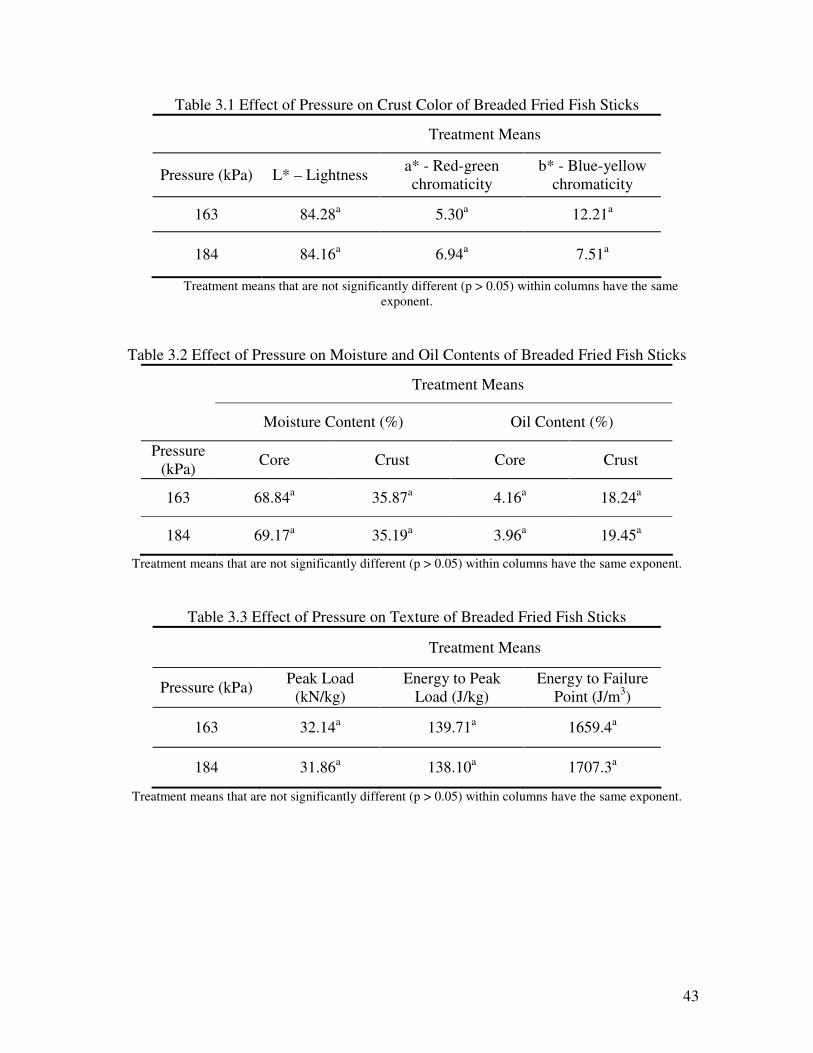
43
Table 3.1 Effect of Pressure on Crust Color of Breaded Fried Fish Sticks Treatment Means
Pressure (kPa) L* – Lightness a* - Red-green chromaticity
b* - Blue-yellow chromaticity
163 84.28a 5.30a 12.21a
184 84.16a 6.94a 7.51a
Treatment means that are not significantly different (p > 0.05) within columns have the same exponent.
Table 3.2 Effect of Pressure on Moisture and Oil Contents of Breaded Fried Fish Sticks
Treatment Means
Moisture Content (%) Oil Content (%)
Pressure (kPa) Core Crust Core Crust
163 68.84a 35.87a 4.16a 18.24a
184 69.17a 35.19a 3.96a 19.45a
Treatment means that are not significantly different (p > 0.05) within columns have the same exponent.
Table 3.3 Effect of Pressure on Texture of Breaded Fried Fish Sticks Treatment Means
Pressure (kPa) Peak Load (kN/kg)
Energy to Peak Load (J/kg)
Energy to Failure Point (J/m3)
163 32.14a 139.71a 1659.4a
184 31.86a 138.10a 1707.3a
Treatment means that are not significantly different (p > 0.05) within columns have the same exponent.
44
Table 3.4 Effect of Temperature on Juiciness of Breaded Fried Fish Sticks
Treatment Means
Pressure (kPa) Juiciness (%)
163 31.97a
184 30.96a
Treatment means that are not significantly different (p > 0.05) within columns have the same exponent.
Table 3.5 Effect of Pressure on Juiciness of Breaded Fried Fish Sticks
Treatment Means
Temperature (oC) Juiciness (%)
175 32.07a
190 30.87a
Treatment means that are not significantly different (p > 0.05) within columns have the same exponent.
Table 3.6 Effect of Source of Pressure on Juiciness of Breaded Fried Fish Sticks
Treatment Means
Source of Pressure Juiciness (%)
Air 32.06a
Nitrogen 30.78a
Steam 31.58a
Treatment means that are not significantly different (p > 0.05) within columns have the same exponent.

45
Table 3.7 Effect of Temperature on Crust Color of Breaded Fried Fish Sticks Treatment Means
Temperature (oC) L* – Lightness a* - Red-green
chromaticity b* - Blue-yellow
chromaticity
175 90.59a 2.57b 12.11a
190 77.85b 9.67a 7.60a
Treatment means that are not significantly different (p > 0.05) within columns have the same exponent.
Table 3.8 Effect of Source of Pressure on Moisture Content of Breaded Fried Fish Sticks
Treatment Means
Source of Pressure Core (%) Crust (%)
Air 70.47a 36.85a
Nitrogen 67.86b 36.27a
Steam 68.69a,b 33.46b
Treatment means that are not significantly different (p > 0.05) within columns have the same exponent.
Table 3.9 Effect of Temperature on Moisture Content of Breaded Fried Fish Sticks
Treatment Means
Temperature (oC) Core (%) Crust (%)
175 68.75a 37.56a
190 69.27a 33.50b
Treatment means that are not significantly different (p > 0.05) within columns have the same exponent.

46
Table 3.10 Effect of Source of Pressure on Oil Content of Breaded Fried Fish Sticks
Treatment Means Source of Pressure Core (%) Crust (%)
Air 4.07a 17.35b
Nitrogen 5.38a 15.88b
Steam 2.74b 23.31a
Treatment means that are not significantly different (p > 0.05) within columns have the same exponent.
Table 3.11 Effect of Temperature on Oil Content of Breaded Fried Fish Sticks
Treatment Means
Temperature (oC) Core (%) Crust (%)
175 4.63a 19.02a
190 3.50b 18.67a
Treatment means that are not significantly different (p > 0.05) within columns have the same exponent.
Table 3.12 Effect of Source of Pressure on Texture of Breaded Fried Fish Sticks
Treatment Means
Source of Pressure
Peak Load (kN/kg)
Energy to Peak Load (J/kg)
Energy to Failure Point (J/m3)
Air 29.12b 123.10b 1377.1b
Nitrogen 31.03a,b 134.64b 1671.0a,b
Steam 35.84a 158.97a 2001.9a
Treatment means that are not significantly different (p > 0.05) within columns have the same exponent.

47
Table 3.13 Effect of Temperature on Texture of Breaded Fried Fish Sticks
Treatment Means Temperature
(oC) Peak Load
(kN/kg) Energy to Peak
Load (J/kg) Energy to Failure
Point (J/m3)
175 27.48b 122.96b 1600.9a
190 36.51a 154.85a 1765.8a
Treatment means that are not significantly different (p > 0.05) within columns have the same exponent.
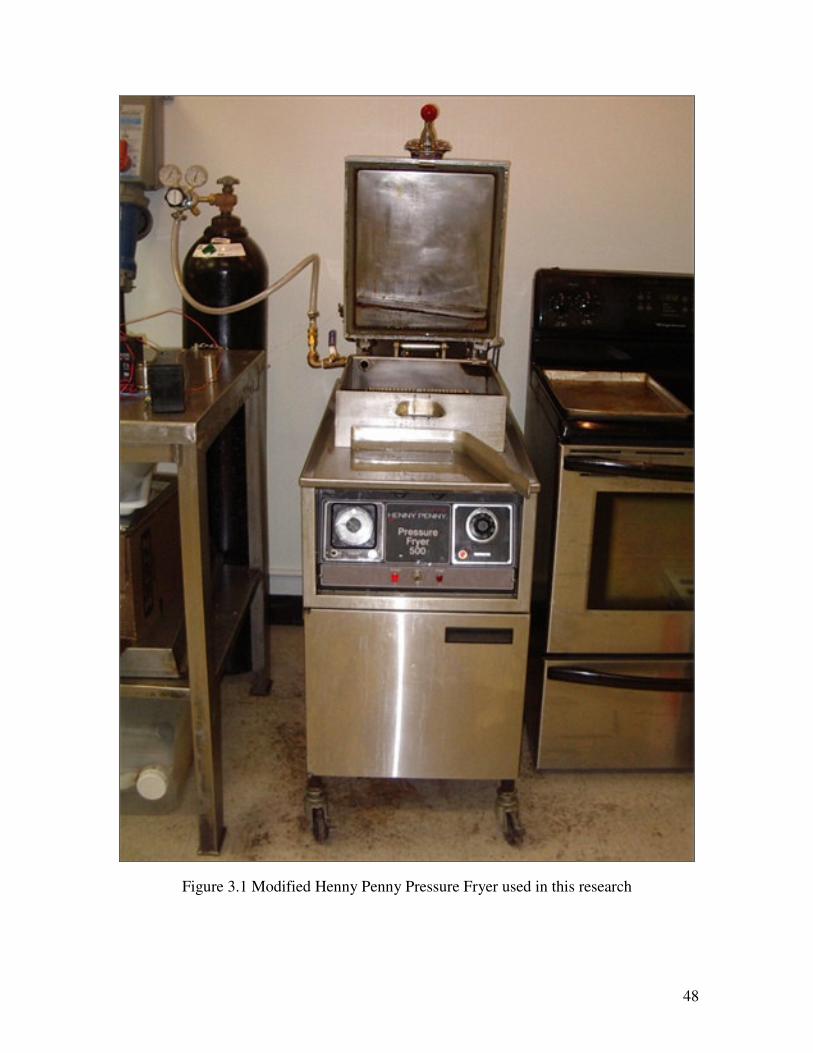
48
Figure 3.1 Modified Henny Penny Pressure Fryer used in this research
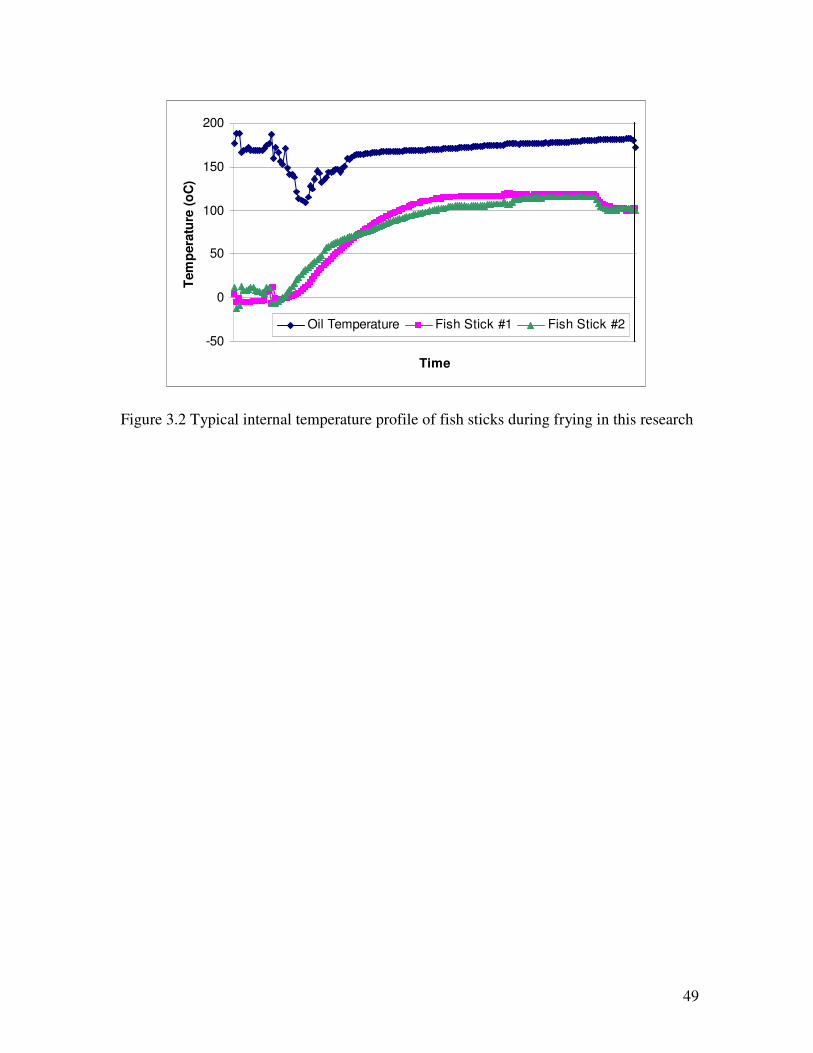
49
-50
0
50
100
150
200
Time
Tem
pera
ture
(oC
)
Oil Temperature Fish Stick #1 Fish Stick #2
Figure 3.2 Typical internal temperature profile of fish sticks during frying in this research

50
Figure 3.3 Minolta Chromameter used in this research

51
Figure 3.4 Universal Testing Machine, with Kramer Shear Unit attached, used in this research

52
Figure 3.5 Kramer Shear Unit attached to universal testing machine in this research
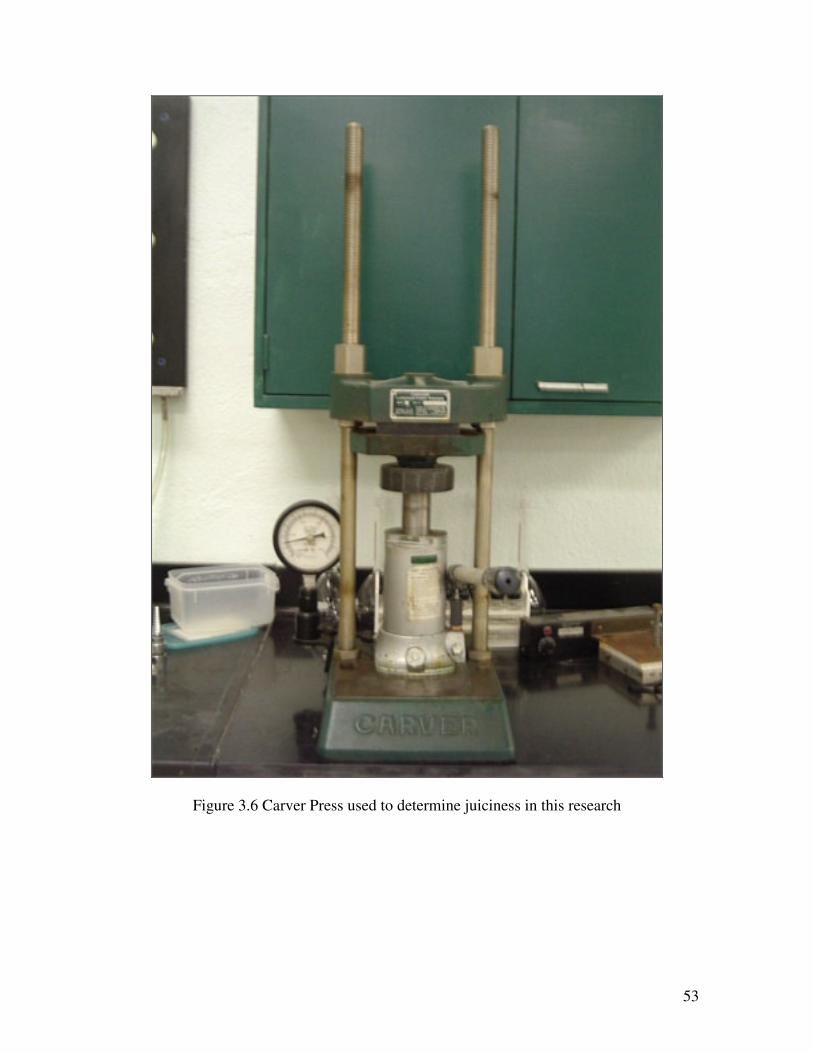
53
Figure 3.6 Carver Press used to determine juiciness in this research

54
Figure 3.7 Freezemobile Freeze Dryer used in this research

55
Figure 3.8 Soxtec Extraction Unit used to determine fat content in this research

56
CHAPTER 4
THE EFFECT OF VACUUM FRYING ON QUALITY OF BREADED FRIED FOODS
ABSTRACT
Vacuum frying, which occurs at pressures well below atmospheric levels, has
recently been demonstrated to reduce fat content of various fried food products when
compared to more conventional methods using steam for frying. This study evaluated the
applicability of vacuum frying for breaded fried foods. Fish sticks were either pressure-
fried at 163 kPa, atmospherically-fried at 101 kPa, or vacuum-fried at 41 kPa. Two
temperatures were used for each pressure - 175oC and 190oC for the first two, 120oC and
150oC for the last. The products were evaluated in terms of color, juiciness, moisture
content, oil content, and texture. The fish sticks vacuum-fried at 120oC reached a
maximum internal temperature of 40oC and thus, were not fully cooked. Excluding this
treatment, vacuum-frying did not have an effect on any quality attributes except juiciness.
Overall, vacuum-fried fish sticks were comparable to pressure-fried fish sticks, except that
the vacuum-fried fish sticks were significantly (p < 0.05) juicier.
Keywords: vacuum-frying, pressure frying, fish sticks
In preparation for submission to Journal of Food Engineering

57
INTRODUCTION
Deep-fat frying of foods has increased in both the United States and Europe over
the past 40 years (Granda, Moreira and Tichy, 2004). These products are popular because
they have a unique texture-flavor combination (Rao and Delaney, 1995). Breaded fried
seafood products, in particular, are especially popular in the southern United States. In
2001 alone, the U.S. produced 19.51 million pounds ($41.53 million value) of fish sticks
(Gupta, 2004). Despite their popularity, fried foods are considered by many to be
unhealthy, because they contain a significant amount of fat, up of 1/3 of the product’s
weight (Mellema, 2003).
Food products fried via pressure frying are more juicy and tender than foods fried
at atmospheric pressure (Innawong, Mallikarjunan, Marcy, and Cundiff, 2006). Currently,
pressure fryers depend on the steam released from large food loads to generate pressure
inside the fryer (Innawong et al., 2006), which can lead to wasted food products in
commercial applications. Much of the current research is focused on finding alternative
frying methods, such as vacuum frying.
Vacuum frying occurs at pressures well below atmospheric levels. It has been used
for some time in the frying of fruit chips (Minelli and Harney, 2000). Recently, Garayo
and Moreira (2002) demonstrated the reduction of fat in potato chips caused by frying
under vacuum conditions as opposed to atmospheric conditions. During frying, oil quality
is greatly reduced. The oil is hydrolyzed and oxidized, forming free fatty acids and polar
compounds. Steam released by food products during pressure frying also greatly increases
the degradation. During vacuum frying, oil life and quality are increased because the low
temperatures and pressures reduce deterioration and oxidation of the frying oil (Imai,

58
1989). No work has been done accessing the applicability of vacuum-frying for cooking
breaded fried foods.
The objective of this study was to develop a vacuum fryer for use on breaded fried
foods and to determine the effect of vacuum frying on the quality of fried fish sticks.
Experiments were conducted to compare vacuum frying to traditional pressure-frying and
atmospheric-frying.
MATERIALS AND METHODS
Sample Preparation
Par-fried frozen fish sticks consisting of 42% minced pollock meat were obtained
from Icelandic USA, Inc. (Newport News, VA). The fish sticks were par-fried in
hydrogenated soybean oil and their breading contained enriched bleached wheat flour,
enriched yellow corn flour, and cellulose gum. They were packaged in dry ice during
shipping, and, upon arrival, immediately placed in a freezer (-18oC) for storage until
frying.
Frying Experiment
Fish sticks were fried in a modified pressure fryer (Model 500C, Henney Penney,
Inc., Eaton, OH) using commercial soybean oil (Bakers & Chefs, North Arkansas
Wholesale Co., Inc., Bentonville, AR). Approximately 24 L of frying oil were used in a
frying vat with dimensions of 36.2 x 42.5 x 31.7 cm. The fryer’s exhaust tube that
connected the operating valve to the fryer was replaced by a tee. A diaphragm vacuum
pump (Model ME 8SI, Vacuubrand, Germany Figure 4.1) was attached to the tee using a
universal connection.
59
Products were fried at a vacuum pressure of 41 kPa and two temperatures (120oC
and 150oC). For comparison, samples were fried using steam generated from the product
with 163 kPa of pressure at two temperatures (175oC and 190oC). Samples were also fried
at two temperatures (175oC and 190oC) under atmospheric pressure conditions (101 kPa).
When internal steam was used, the amount of pressure (163 kPa) was set using weights in
the operating valve.
Each fry load consisted of 1200 g of product fried for a constant time of 240 s. In
general, this was enough time for the internal temperature of the fish sticks to reach
approximately 100oC. This was determined in a preliminary test using thermocouples
connected to a data logger (Model 21X, Campbell Scientific, Inc., Logan, UT). There was
an average 30 s delay for closing and opening the fryer. Three replications were performed
for each treatment (pressure, temperature, pressure source) combination.
Color Analysis
A Minolta chromameter (Model CR-300, Minolta Camera, Ltd., Osaka, Japan) was
used to determine the color of the product crust immediately following frying. The meter
was calibrated to a white plate prior to use. Color was evaluated using L*, a*, and b*
values. The test was replicated three times using three different samples.
Texture Analysis
A universal testing machine (Model 5G, MTC, NC), with a Kramer shear unit
attached, was used to evaluate the texture of the fried products. A 5 kN load and 100
mm/min crosshead speed were the test settings. The peak load (N/kg), total energy to peak
load (N-mm/kg), and energy to failure point (N-mm/m3) were determined and used to
characterize the texture.
60
Juiciness
A modified version of a press method developed by Mallikarjunan and Mittal
(1994) was used to measure juiciness of the product cores. A sandwich consisting of one
gram of core meat, surrounded by two sheets of aluminum foil, two pre-weighed filter
papers (Whatman No. 5, 110 mm diameter), and two Plexi-glass plates (12.5 x 12.5 cm)
was placed on a press (Model C, Fred S. Carver, Inc., Menomonee Falls, WI) and
compressed with a 3000 N load for one minute. The amount of time and pressure was
determined through a preliminary test. The increase in weight of the filter papers was
recorded as pressed juice. The test was replicated three times using three different samples.
Moisture and Fat Content
Moisture and fat contents were determined for both the core and the crust of the
fried products. The crust and core were separated, weighed, wrapped in a pre-weighed
sheet of filter paper, and placed inside a pre-weighed cellulose extraction thimble. Samples
were stored in a freezer (-16oC) overnight then freeze-dried (The Virtis Company, Inc.,
Gardiner, NY) for three days. Freeze drying avoids destruction of a product’s porous
structure, while still allowing the removal of its moisture (Innawong et al., 2006). The
moisture content was determined by re-weighing the thimbles containing the samples and
filter paper after removal from the freeze dryer. The test was replicated three times. The
dried thimbles were placed in a Soxtec extraction unit for determination of fat content,
which was evaluated using AOAC method 991.36 (AOAC, 2000) with petroleum ether as
the solvent. The test was replicated three times.

61
Statistical Analysis
The effect of treatments on product quality attributes was evaluated using a
completely randomized design. Analysis of Variance (ANOVA) and Fisher’s Least
Significant Difference (LSD) test were performed using Statistical Analysis Software
(version 9.0, 2004). SAS was also used to create box plots. Alpha (�) was set at 0.05 for all
analyses.
RESULTS AND DISCUSSION
Effect of Temperature on Color
Both L* (lightness) and a* (red-green chromacity) were significantly affected (p <
0.05) by temperature (Table 4.1). The highest temperatures for each pressure (190oC for
pressure- and atmospheric-frying, 150oC for vacuum-frying) had the lowest L* values,
which translates into darker crust colors. These treatments are represented as treatments 2,
3, and 5, respectively, in Figure 4.2. As seen in Figure 4.2, frying at 190oC, especially,
made a distinct difference in L* value. These two treatments gave fish sticks with the
darkest crust colors. The two treatments that took place at 190oC had significantly higher
(p < 0.05) a* values, indicating that more Maillard reactions occurred at the higher
temperatures (Garayo and Moreira, 2002). Temperature affects the velocity and subsequent
pathways of Maillard reactions, a form of non-oxidative browning. The reaction rate can
increase 2-3 times for each 10oC rise in temperature (Scandrett, 1997). In Figure 4.3, where
treatments 2 and 3 took place at 190oC, the distinct difference between these two
treatments and the other four, occurring at lower temperatures, can be seen. The treatments
did not significantly affect (p > 0.05) the b* value. This could be due to high variance in
the data, as can be seen in Figure 4.4. Pressure did not statistically affect any color

62
measurement. Garayo and Moreira (2002) found similar results with vacuum-fried potato
chips.
Effect of Pressure on Juiciness
The fish sticks fried under vacuum (41 kPa) were significantly juicier (p < 0.05)
than the fish sticks fried under traditional and atmospheric pressure conditions (Table 4.2).
Upon visual inspection, however, it was clear that the fish sticks fried under vacuum (41
kPa) at 120oC were not fully cooked. The internal temperature of these fish sticks reached
a maximum of 40oC. Because they weren’t fully heated, the moisture migration out of the
core of the fish sticks was reduced, thus increasing the juiciness of the samples. Still, the
fully-cooked fish sticks vacuum-fried at 150oC were juicier than fish stick fried under the
other four treatment conditions. Others have found that an increase in pressure increases
juiciness (Innawong et al., 2006; Moreira, Castell-Perez, and Barrufet, 1999;
Mallikarjunan, Chinnan, and Balasubramaniam, 1995); however, potato chips fried under
vacuum had higher moisture contents than atmospherically fried chips (Garayo and
Moreira, 2002). This retention of moisture would affect the juiciness of the fried products.
The atmospherically- and pressure-fried fish sticks had similar juiciness distributions, as
can be seen in Figure 4.5, whereas the vacuum-fried fish sticks, despite the undercooked
nature of treatment 6, had similar distributions to each other.
Effect of Pressure on Moisture Content
The fish sticks that were vacuum-fried at 120oC had significantly higher (p < 0.05)
core and crust moisture contents than the other treatments (Table 4.3). This is probably due
to the fact that the fish sticks fried with this treatment were not fully cooked, so their
internal moisture did not escape. The fish sticks that were fried at atmospheric pressure
63
(both temperatures) had the lowest core and crust moisture contents. Garayo and Moreira
(2002) found that atmospheric-fried potato chips had lower moisture contents than
vacuum-fried potato chips though the differences were not significant. Other than the
treatment where fish sticks were vacuum-fried at 120oC, the core moisture content
distributions were similar (Figure 4.6). The crust moisture distribution can be seen in
Figure 4.7. While the distributions of crust moisture contents of treatments fried at 101 kPa
were similar to each other, and so were those fried at 163 kPa, the two vacuum-fried (41
kPa) treatments’ distributions were very different. The large variation in the distribution of
treatment 5 (vacuum-frying at 150oC) made it difficult to determine the true effect that
vacuum-frying had on moisture content. Perhaps a larger sample size could have reduced
this variation, or it could be due to the natural variability association with the frying
process.
Effect of Pressure on Oil Content
Treatment conditions did not have a significant effect on crust oil content (p >
0.05), while they did have a significant effect on core oil content (p < 0.05). Fish sticks
vacuum-fried at 150oC had the highest core (5.86%) and crust oil contents (19.80%) (Table
4.3), though they were not significantly different (p < 0.05) from the pressure-fried
treatments, in the case of core oil content, and the pressure-fried and atmospherically-fried
treatments, in the case of crust oil content. Atmospheric-frying gave significantly lower
core oil contents (3.08% at 175oC, 2.06% at 190oC) than the other frying methods, which
can be seen clearly in Figure 4.8. Atmospheric-frying was next behind vacuum-frying at
150oC for the highest crust oil contents (19.61% at 175oC, 19.02% at 190oC). These results
were opposite of what was expected. In a study done by Garayo and Moreira (2002), it was
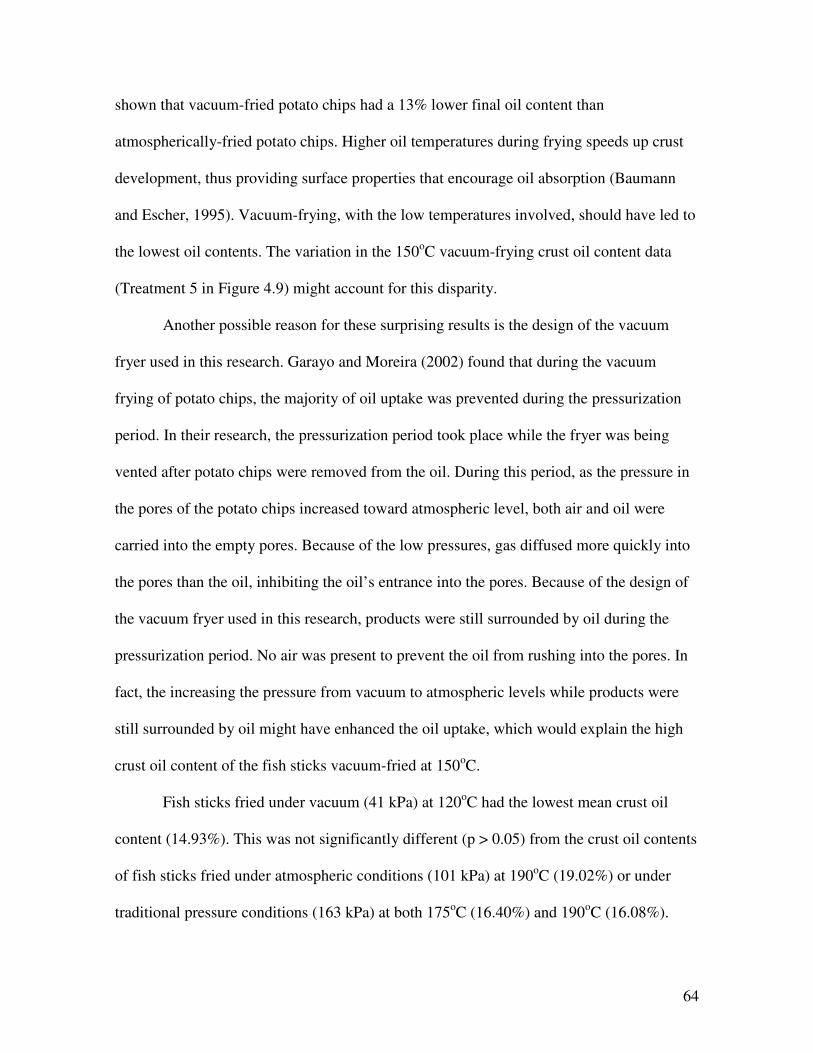
64
shown that vacuum-fried potato chips had a 13% lower final oil content than
atmospherically-fried potato chips. Higher oil temperatures during frying speeds up crust
development, thus providing surface properties that encourage oil absorption (Baumann
and Escher, 1995). Vacuum-frying, with the low temperatures involved, should have led to
the lowest oil contents. The variation in the 150oC vacuum-frying crust oil content data
(Treatment 5 in Figure 4.9) might account for this disparity.
Another possible reason for these surprising results is the design of the vacuum
fryer used in this research. Garayo and Moreira (2002) found that during the vacuum
frying of potato chips, the majority of oil uptake was prevented during the pressurization
period. In their research, the pressurization period took place while the fryer was being
vented after potato chips were removed from the oil. During this period, as the pressure in
the pores of the potato chips increased toward atmospheric level, both air and oil were
carried into the empty pores. Because of the low pressures, gas diffused more quickly into
the pores than the oil, inhibiting the oil’s entrance into the pores. Because of the design of
the vacuum fryer used in this research, products were still surrounded by oil during the
pressurization period. No air was present to prevent the oil from rushing into the pores. In
fact, the increasing the pressure from vacuum to atmospheric levels while products were
still surrounded by oil might have enhanced the oil uptake, which would explain the high
crust oil content of the fish sticks vacuum-fried at 150oC.
Fish sticks fried under vacuum (41 kPa) at 120oC had the lowest mean crust oil
content (14.93%). This was not significantly different (p > 0.05) from the crust oil contents
of fish sticks fried under atmospheric conditions (101 kPa) at 190oC (19.02%) or under
traditional pressure conditions (163 kPa) at both 175oC (16.40%) and 190oC (16.08%).

65
Since the products vacuum-fried at 120oC were not fully cooked, the internal moisture did
not migrate out of the product, leaving no room for oil to enter.
Effect of Pressure on Texture
Atmospheric frying gave the highest peak load, energy to peak load, and energy to
failure point values (Table 4.4), demonstrating that products fried under atmospheric
conditions were harder and tougher than those of all other treatments. Vacuum-frying gave
the lowest peak load and energy to peak load values. Vacuum-frying at 120oC also gave
the lowest energy to failure point values, probably because these fish sticks were uncooked
and had very little crust formation. These results agree with those of Garayo and Moreira
(2002) regarding vacuum-frying of potato chips. The vacuum-fried potato chips were
softer than atmospheric-fried potato chips, though not significantly so. In Figures 4.10 and
4.11, the clear delineation between pressures, as they affect peak load and energy to peak
load, can be seen. It’s apparent that pressure affects texture of fried fish sticks.
Atmospheric pressure was the only pressure to have a clear effect on energy to failure
point, as can be seen in Figure 4.12.
CONCLUSIONS
Excluding the uncooked treatment (vacuum-frying at 120oC), vacuum-frying did
not have any significant effect compared to pressure-frying in terms of oil content,
moisture content, color, or texture. Vacuum-frying did create juicier fish sticks than the
other two treatments. Vacuum-fried fish sticks were more tender than those fried at
atmospheric pressure. The vacuum-fried fish sticks also had the highest core and crust oil
contents, even though the difference was not significant. The vacuum fryer developed
during this project effectively produced juicy and tender golden-brown fish sticks;

66
however, the design did appear to encourage, rather than inhibit, oil absorption. The fish
sticks vacuum-fried at 120oC were not fully cooked. Therefore, further investigation is
needed to determine proper time, temperature and pressure combinations for the vacuum-
frying of breaded fried foods.

67
REFERENCES
AOAC. (2000). Official Methods of Analysis of AOAC International (17th edition, Vol.
2). Washington, DC.
Baumann, B. and Escher, F. (1995). Mass and heat transfer during deep-fat frying of
potato slices, rate of drying and oil uptake. Lebensmittel Wissenschaft und
Technologie, 28, 395-403.
Garayo, J. and Moreira, R. (2002). Vacuum frying of potato chips. Journal of Food
Engineering, 55, 181-191.
Granda, C., Moreira, R.G. & Tichy, S.E. (2004). Reduction of acrylamide formation in
potato chips by low-temperature vacuum frying. Journal of Food Science, 69(8),
405-411.
Gupta, M.K. (2004). The frying industry. In M.K. Gupta, K. Warner, P.J. White (Eds.),
Frying Technology and Practices (pp. 1-15). AOCS Press, Champaign, IL.
Imai, K. (1989). Method of and apparatus for processing vacuum fry. U.S. Patent No.
4,828,859.
Innawong, B., Mallikarjunan, P., Marcy, J. & Cundiff, J. (2006). Pressure conditions and
quality of chicken nuggets fried under gaseous nitrogen atmosphere. J. Food Proc.
Preserv. 30: 231-245.
Mallikarjunan, P. and Mittal, G.S. (1994). Meat quality kinetics during beef carcass
chilling. Journal of Food Science, 59, 291-294, 302.
Mallikarjunan, P., Chinnan, M.S. and Balasubramaniam, V.M. (1995). Mass transfer in
edible film coated chicken nuggets: Influence of frying temperature and pressure.
In G. Narsimhan, M. R. Okos and S. Lombardo (Eds.), Advances in Food
Engineering (pp. 107-111). Purdue University, IN.
Mellema, M. (2003). Mechanism and reduction of fat uptake in deep-fat fried foods.
Trends in Food Science and Technology, 14, 364-373.
Minelli, M.P. and Harney, D.L. (2000). Process for preparing parfried, frozen potato
strips. U.S. Patent No. 6,136,358.
Moreira, R.G., Castell-Perez, M.E. and Barrufet, M.A. (1999). Deep-fat frying systems. In
Deep-Fat Frying: Fundamentals and Applications (pp. 224-227). Aspen Publishers,
Inc., Gaithersburg, MD.

68
Rao, V.N.M. & Delaney, R.A.M. (1995). An engineering perspective on deep-fat frying
of breaded chicken pieces. Food Technology, 49(4), 138-141.
SAS Institute. (2004). SAS Institute, Inc., Cary, NC.
Scandrett, C. (1997). Maillard reactions 101: Theory. Online resource,
http://brewery.org/library/Maillard_CS0497.html.
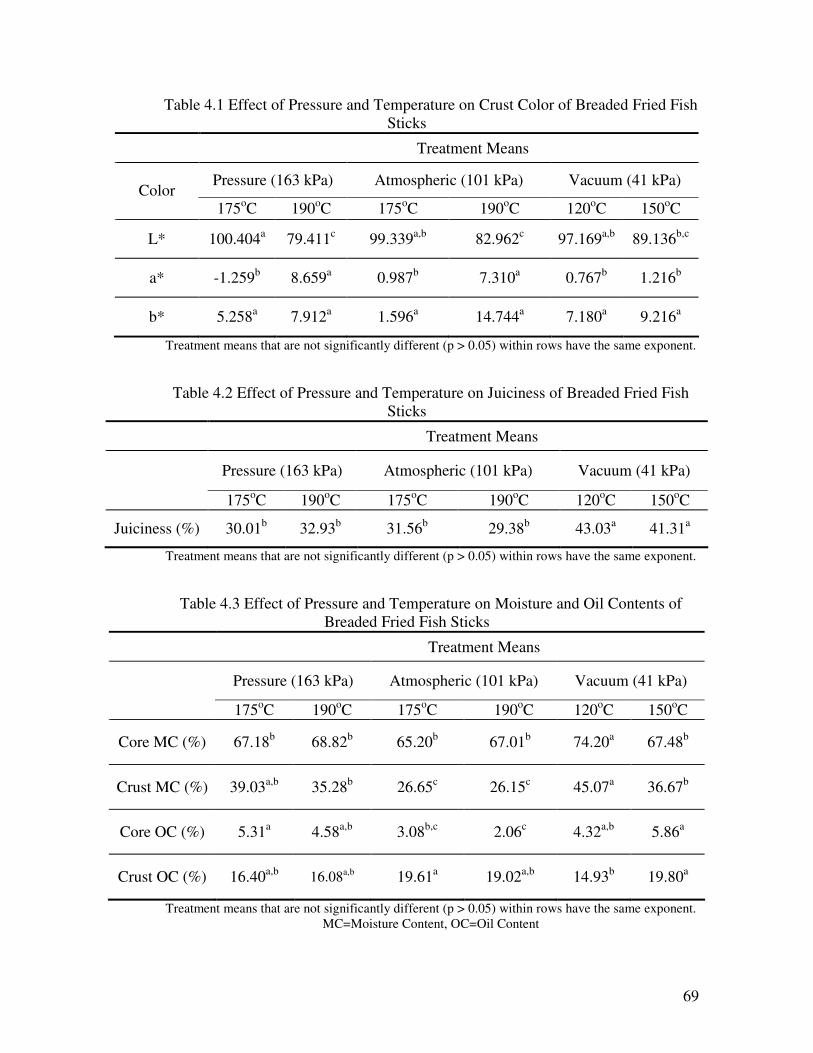
69
Table 4.1 Effect of Pressure and Temperature on Crust Color of Breaded Fried Fish Sticks
Treatment Means
Pressure (163 kPa) Atmospheric (101 kPa) Vacuum (41 kPa) Color
175oC 190oC 175oC 190oC 120oC 150oC
L* 100.404a 79.411c 99.339a,b 82.962c 97.169a,b 89.136b,c
a* -1.259b 8.659a 0.987b 7.310a 0.767b 1.216b
b* 5.258a 7.912a 1.596a 14.744a 7.180a 9.216a
Treatment means that are not significantly different (p > 0.05) within rows have the same exponent.
Table 4.2 Effect of Pressure and Temperature on Juiciness of Breaded Fried Fish
Sticks
Treatment Means
Pressure (163 kPa) Atmospheric (101 kPa) Vacuum (41 kPa) 175oC 190oC 175oC 190oC 120oC 150oC
Juiciness (%) 30.01b 32.93b 31.56b 29.38b 43.03a 41.31a
Treatment means that are not significantly different (p > 0.05) within rows have the same exponent.
Table 4.3 Effect of Pressure and Temperature on Moisture and Oil Contents of Breaded Fried Fish Sticks
Treatment Means
Pressure (163 kPa) Atmospheric (101 kPa) Vacuum (41 kPa) 175oC 190oC 175oC 190oC 120oC 150oC
Core MC (%) 67.18b 68.82b 65.20b 67.01b 74.20a 67.48b
Crust MC (%) 39.03a,b 35.28b 26.65c 26.15c 45.07a 36.67b
Core OC (%) 5.31a 4.58a,b 3.08b,c 2.06c 4.32a,b 5.86a
Crust OC (%) 16.40a,b 16.08a,b 19.61a 19.02a,b 14.93b 19.80a
Treatment means that are not significantly different (p > 0.05) within rows have the same exponent. MC=Moisture Content, OC=Oil Content
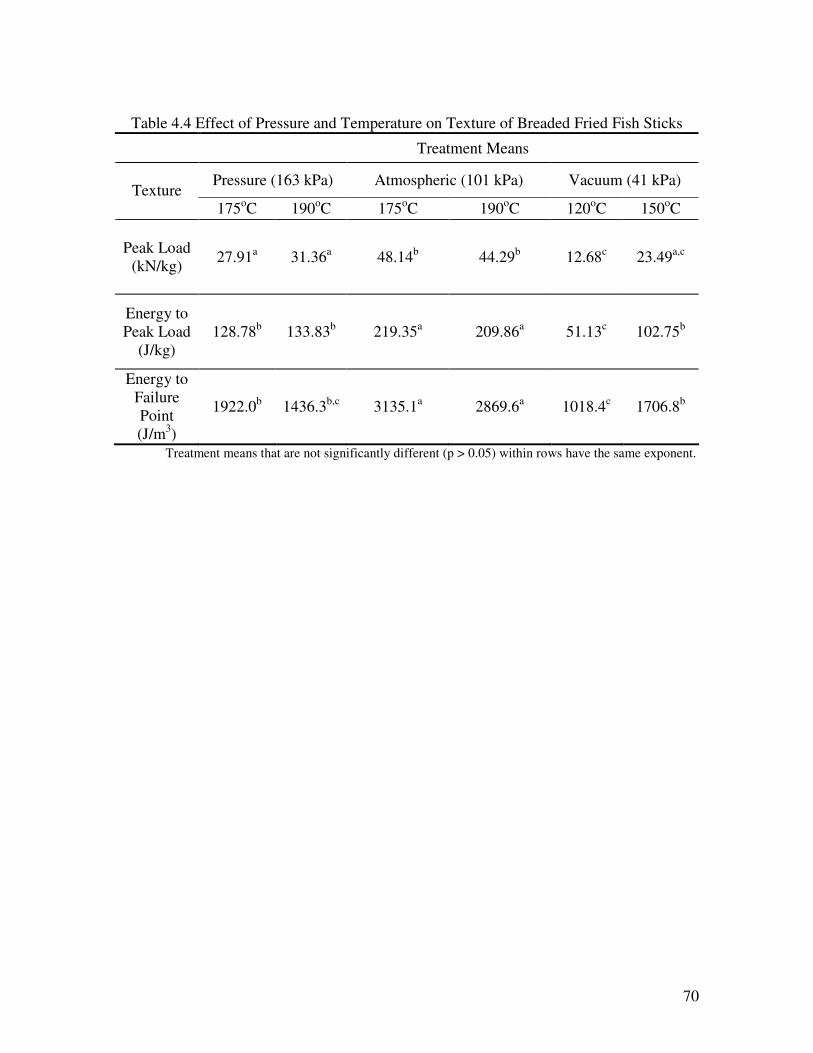
70
Table 4.4 Effect of Pressure and Temperature on Texture of Breaded Fried Fish Sticks
Treatment Means
Pressure (163 kPa) Atmospheric (101 kPa) Vacuum (41 kPa) Texture
175oC 190oC 175oC 190oC 120oC 150oC
Peak Load (kN/kg) 27.91a 31.36a 48.14b 44.29b 12.68c 23.49a,c
Energy to Peak Load
(J/kg) 128.78b 133.83b 219.35a 209.86a 51.13c 102.75b
Energy to Failure Point (J/m3)
1922.0b 1436.3b,c 3135.1a 2869.6a 1018.4c 1706.8b
Treatment means that are not significantly different (p > 0.05) within rows have the same exponent.

71
Figure 4.1 Vacuubrand Vacuum Pump used in this research

72
Figure 4.2 Distribution of L* by Treatment 1 = 163 kPa, 175oC; 2 = 163 kPa, 190oC; 3 = 101 kPa, 190oC; 4 = 101 kPa, 175oC;
5 = 41 kPa, 150oC; 6 = 41 kPa, 120oC

73
Figure 4.3 Distribution of a* by Treatment 1 = 163 kPa, 175oC; 2 = 163 kPa, 190oC; 3 = 101 kPa, 190oC; 4 = 101 kPa, 175oC;
5 = 41 kPa, 150oC; 6 = 41 kPa, 120oC

74
Figure 4.4 Distribution of b* by Treatment 1 = 163 kPa, 175oC; 2 = 163 kPa, 190oC; 3 = 101 kPa, 190oC; 4 = 101 kPa, 175oC;
5 = 41 kPa, 150oC; 6 = 41 kPa, 120oC

75
Figure 4.5 Distribution of Juiciness by Treatment 1 = 163 kPa, 175oC; 2 = 163 kPa, 190oC; 3 = 101 kPa, 190oC; 4 = 101 kPa, 175oC;
5 = 41 kPa, 150oC; 6 = 41 kPa, 120oC

76
Figure 4.6 Distribution of Core Moisture Content by Treatment 1 = 163 kPa, 175oC; 2 = 163 kPa, 190oC; 3 = 101 kPa, 190oC; 4 = 101 kPa, 175oC;
5 = 41 kPa, 150oC; 6 = 41 kPa, 120oC

77
Figure 4.7 Distribution of Crust Moisture Content by Treatment 1 = 163 kPa, 175oC; 2 = 163 kPa, 190oC; 3 = 101 kPa, 190oC; 4 = 101 kPa, 175oC;
5 = 41 kPa, 150oC; 6 = 41 kPa, 120oC

78
Figure 4.8 Distribution of Core Oil Content by Treatment 1 = 163 kPa, 175oC; 2 = 163 kPa, 190oC; 3 = 101 kPa, 190oC; 4 = 101 kPa, 175oC;
5 = 41 kPa, 150oC; 6 = 41 kPa, 120oC

79
Figure 4.9 Distribution of Crust Oil Content by Treatment 1 = 163 kPa, 175oC; 2 = 163 kPa, 190oC; 3 = 101 kPa, 190oC; 4 = 101 kPa, 175oC;
5 = 41 kPa, 150oC; 6 = 41 kPa, 120oC
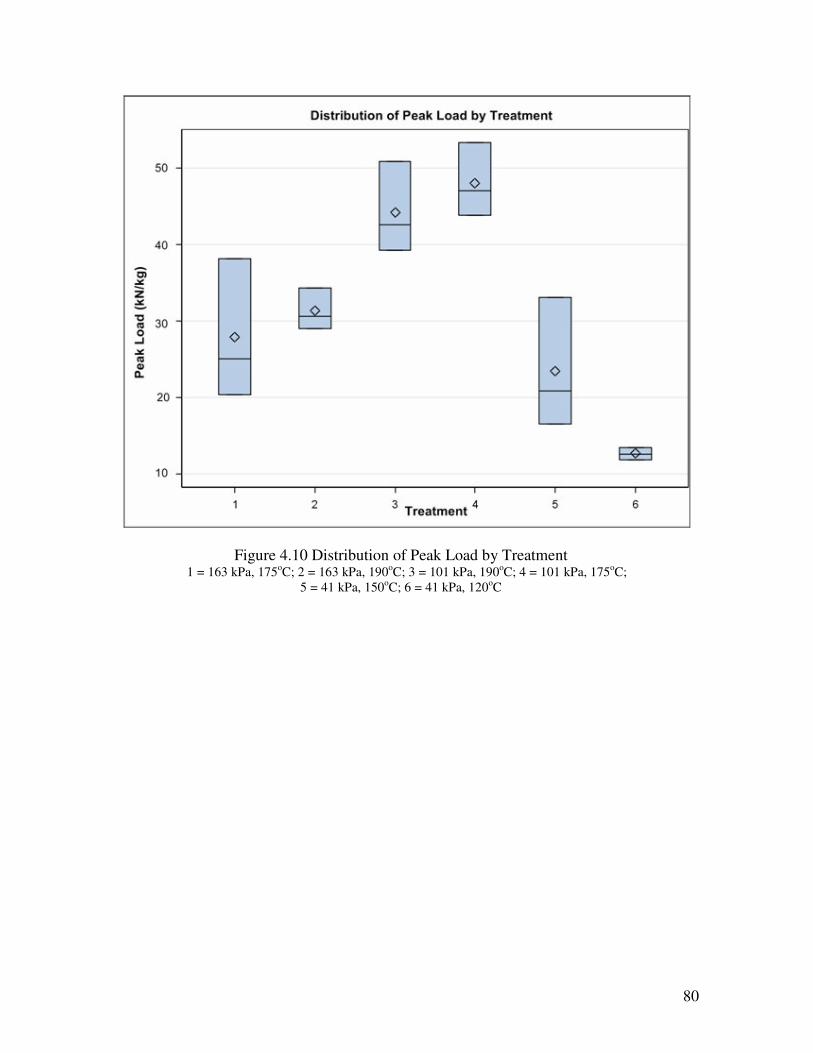
80
Figure 4.10 Distribution of Peak Load by Treatment 1 = 163 kPa, 175oC; 2 = 163 kPa, 190oC; 3 = 101 kPa, 190oC; 4 = 101 kPa, 175oC;
5 = 41 kPa, 150oC; 6 = 41 kPa, 120oC
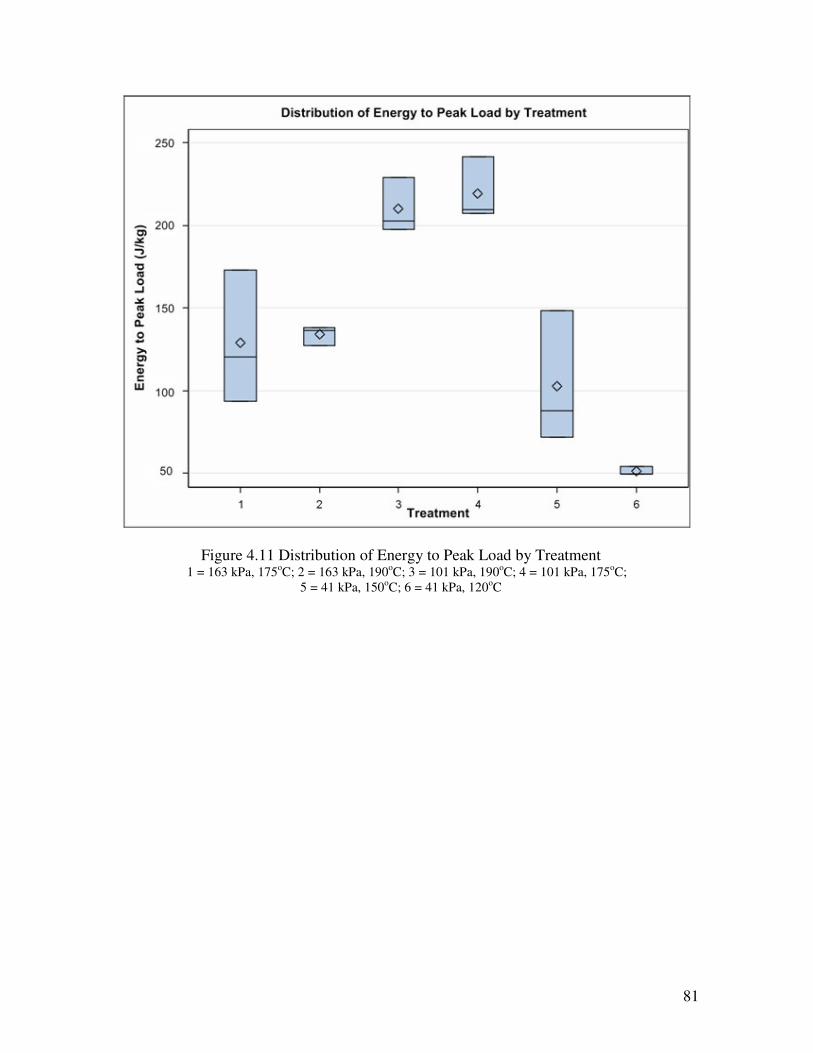
81
Figure 4.11 Distribution of Energy to Peak Load by Treatment 1 = 163 kPa, 175oC; 2 = 163 kPa, 190oC; 3 = 101 kPa, 190oC; 4 = 101 kPa, 175oC;
5 = 41 kPa, 150oC; 6 = 41 kPa, 120oC

82
Figure 4.12 Distribution of Energy to Failure Point by Treatment 1 = 163 kPa, 175oC; 2 = 163 kPa, 190oC; 3 = 101 kPa, 190oC; 4 = 101 kPa, 175oC;
5 = 41 kPa, 150oC; 6 = 41 kPa, 120oC

83
CHAPTER 5
SUMMARY AND CONCLUSIONS
In the first study, the use of compressed air as a pressurizing medium was
evaluated. Fish sticks fried in this way were compared to fish sticks fried using traditional
pressure frying and using nitrogen gas as the pressurizing medium in terms of crust color,
crust and core moisture and oil contents, juiciness, and texture. With the exception of core
moisture content, where air (70.47% moisture by weight) gave significantly higher values
than nitrogen (67.86% moisture by weight), there were no differences between the use of
nitrogen as a pressurizing medium and compressed air. Fish sticks fried using air and
nitrogen were more tender and had lower oil contents than those fried using traditional
pressure frying. The mean crust oil contents of fish sticks fried using air and nitrogen were
17.35% and 15.88% oil by weight, respectively. The mean crust oil content of traditionally
pressure-fried fish sticks was 23.31%. There was a 25% reduction in oil content between
the traditionally pressure-fried fish sticks and those fried with air as the pressurizing
media. Previous research has found that using nitrogen gas as a pressurizing medium
increases the life of frying oil, but further studies should be done to explore the effect of air
as a pressurizing medium on the life of frying oil, since it contains oxygen, which
contributes to oil degradation. In addition, studies should be done that determine the effect
of these novel methods on the quality of fish sticks that have been cooked to doneness, as
opposed to being cooked for a constant time, as in this research.
In the second study, the use of vacuum-frying, or frying under reduced pressure, to
cook breaded foods was explored. The quality of vacuum-fried (41 kPa) fish sticks was
compared to the quality of fish sticks fried at atmospheric pressure (101 kPa) and at
84
increased pressure (163 kPa) in terms of color, juiciness, core and crust moisture and oil
contents, and texture. The vacuum fryer developed during this project was effective;
however, since the fish sticks vacuum-fried at 120oC were not fully cooked (the internal
temperature reached a maximum of 40oC), further investigation is needed to determine
proper temperature and pressure combinations and correct cooking times for the vacuum-
frying of breaded fried foods. Excluding the uncooked treatment, vacuum-frying did not
have any significant effect on the oil content, moisture content, crust color, and texture of
fish sticks, compared to pressure-frying. Vacuum-frying did create juicier fish sticks than
frying under increased pressures. Vacuum-fried fish sticks were more tender than those
fried at atmospheric pressure. Since there has been some success in the use of vacuum-
frying to reduce the oil content of other fried products, and since vacuum-frying has been
shown to increase frying oil life, further research is suggested to determine the suitability
of vacuum-frying for cooking other breaded fried foods. In addition, studies should be
done that assess the acceptability of vacuum-frying on foods that have been cooked to
doneness, as opposed to being cooked for a constant time.
The effects of novel frying methods on quality attributes of fried fish sticks were
compared to each other. There were no significant differences between vacuum frying at
150oC, frying with air at 163 kPa and 175oC, and frying with nitrogen with air at 163 kPa
and 175oC, with the exception of crust oil content. Frying under vacuum led to a
significantly higher (p < 0.05) mean crust oil content (26.35% oil by weight) than both
frying with nitrogen (16.92%) and compressed air (16.29%). Sensory tests should be
performed to assess consumer acceptance of fish sticks fried using the novel methods
presented here.

85
The hypothesis of this research was that there would not be a significant difference
between the use of air and nitrogen as pressure mediums during deep-fat frying. In
addition, frying with air and nitrogen would give similar or better quality fried foods when
compared to pressure frying. Finally, vacuum frying would create fried foods with reduced
oil content when compared to pressure or atmospheric frying. Unexpectedly, air and
nitrogen reduced the overall oil content of fried fish sticks, while vacuum-frying increased
the oil content, compared to frying with pressurizing media. The differences between the
use of air and nitrogen as pressurizing media, with the exception of core moisture content,
were not significant. The results of this research demonstrated that novel frying methods
could be used to fry fish sticks that were comparable in terms of quality attributes to fish
sticks fried using atmospheric- and traditional pressure-frying.

86
VITA
Rhonda Bengtson was born on November 8, 1982 in Baton Rouge, LA. She
received her Bachelor of Science in Chemical Engineering from Louisiana State University
in May 2004. In August 2004, she entered Virginia Polytechnic Institute and State
University to pursue a Master of Science in Biological Systems Engineering under the
direction of Dr. P. Kumar Mallikarjunan. She completed the final exam for the degree in
July 2006.