the effect of merger on performance: evidence from the uae
TRANSCRIPT

The Effect of Merger on Performance: Evidence from the UAE
Manuel Fernandez1 and Rajesh Kumar2
Abstract
This study analyses the largest banking merger in the Middle East: Emirates
Bank International merged with National Bank of Dubai to form the Emirates
NBD. The study examines the effect of the merger on the wealth of
shareholders and on the operating performance of Emirates NBD. The result
shows that during the year surrounding the post-merger period, stock prices
increased thereby enhancing the shareholders wealth and the operating
performances also improved after the merger.
Keywords: merger, stock price, operating profit.
______________________________Manuel Fernandez1, PhD, Associate Professor, Skyline University College,P.O. Box 1797 University City of Sharjah, Sharjah, UAE,[email protected], [email protected] Kumar2, Associate Professor, IMT-Dubai, PO Box 345006, AcademicCity Dubai, UAE, [email protected], [email protected]

UAE: Mergers and Acquisitions
EJBE Vol. 4 No. 1/2014 Page 84
1. Introduction
Consolidation of business entities is a world-wide phenomenon. One of the
tools for consolidation is mergers and acquisitions. For any firm with the
objective of stockholder wealth maximization, the appropriate test of a
successful merger is the effect of merger on its stock prices. In an efficient
capital market, investor’s expectations of the merger's future benefit should be
fully reflected in stock prices by the merger date. Whereas, if the capital
markets are semi strong efficient, then the value of future benefits should be
fully reflected by the first public announcement of the merger and should
certainly be fully reflected by somewhat later merger date. The increase in the
equity value of the acquiring firm in the wake of a successful merger is a
compelling evidence for the synergy theory of mergers. M&A results in the
achievement of cost based and revenue based synergies. The cost based
synergy is achieved by reducing the costs incurred by combining similar assets
in the merged businesses. Revenue based synergy can be exploited if merging
businesses develop new competencies that allow them to command a price
premium through higher innovation capabilities or to boost sales volume
through increased market coverage both geographically and by product line
extension.
2. Objective of the study
In the theoretical context, a merger has to lead to synergistic benefits of cost
and revenue. This study was carried out to investigate whether the EBI-NBD
merger has yielded fruitful results with respect to economic value addition and
enhancement of shareholder wealth. The analysis was done with respect to
both the share price and operating performance.
UAE: Mergers and Acquisitions
EJBE Vol. 4 No. 1/2014 Page 85
2.1 M and A in the MENA Region
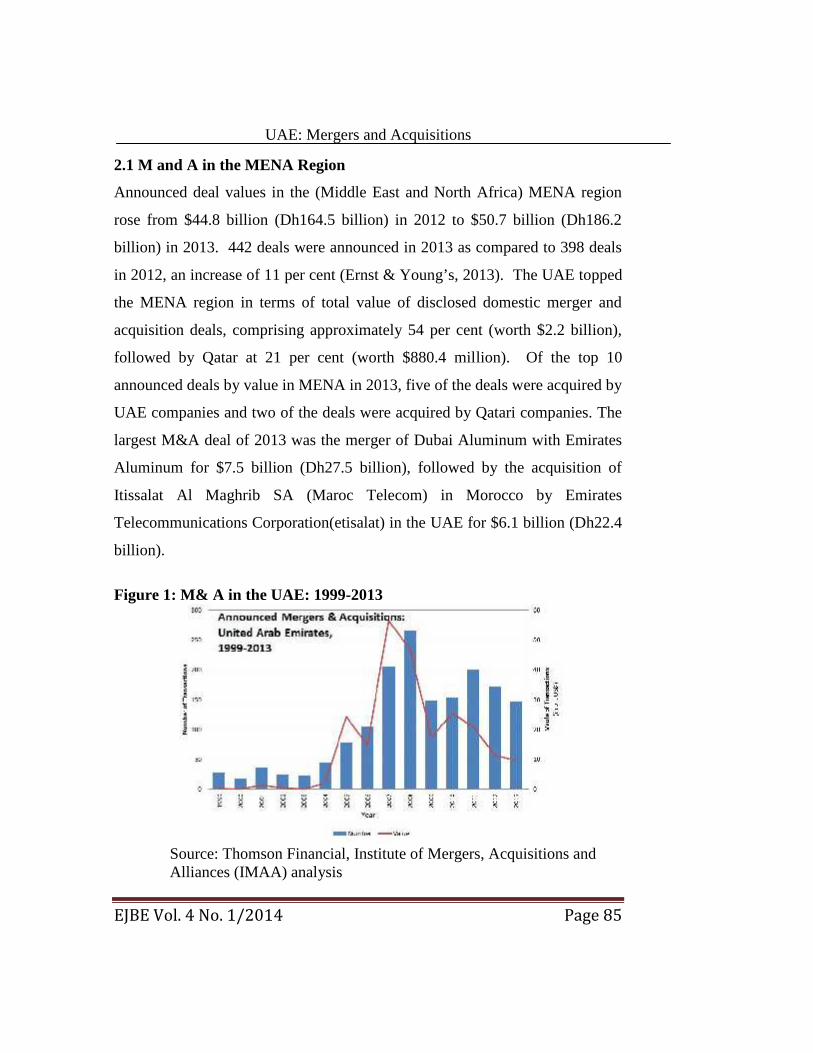
Announced deal values in the (Middle East and North Africa) MENA region
rose from $44.8 billion (Dh164.5 billion) in 2012 to $50.7 billion (Dh186.2
billion) in 2013. 442 deals were announced in 2013 as compared to 398 deals
in 2012, an increase of 11 per cent (Ernst & Young’s, 2013). The UAE topped
the MENA region in terms of total value of disclosed domestic merger and
acquisition deals, comprising approximately 54 per cent (worth $2.2 billion),
followed by Qatar at 21 per cent (worth $880.4 million). Of the top 10
announced deals by value in MENA in 2013, five of the deals were acquired by
UAE companies and two of the deals were acquired by Qatari companies. The
largest M&A deal of 2013 was the merger of Dubai Aluminum with Emirates
Aluminum for $7.5 billion (Dh27.5 billion), followed by the acquisition of
Itissalat Al Maghrib SA (Maroc Telecom) in Morocco by Emirates
Telecommunications Corporation(etisalat) in the UAE for $6.1 billion (Dh22.4
billion).
Figure 1: M& A in the UAE: 1999-2013
Source: Thomson Financial, Institute of Mergers, Acquisitions andAlliances (IMAA) analysis

UAE: Mergers and Acquisitions
EJBE Vol. 4 No. 1/2014 Page 86
GCC Banking Sector
The GCC (Gulf Cooperation Council) banking sector recorded an improved
performance in 2012 and 2013. Most banks have booked higher profits in
2013, driven by increased loan asset growth, wider interest margins, greater fee
and commission income and lower loan loss provisioning charges.
Table 1: GCC's Top 10 Banks in 2012Rank Bank Country Assets
(US$000)Net Profit(US$000)
1 Qatar National Bank Qatar 100,784,020 2,314,0222 National Commercial Bank KSA 92,085,369 1,763,5543 Emirates NBD UAE 83,935,843 695,3504 National Bank of Abu
DhabiUAE 81,840,231 1,179,479
5 Al Rajhi BankingCorporation
KSA 71,302,017 2,102,588
6 National Bank of Kuwait Kuwait 58,418,947 1,097,6247 Samba KSA 53,126,437 1,155,2268 Kuwait Finance House Kuwait 52,296,998 438,6349 Riyad Bank KSA 50,714,890 924,28010 Abu Dhabi Commercial
BankUAE 49,222,903 765,133
Source: http://gulfbusiness.com
Emirates NBD
“Emirates NBD”, the leading banking group in the Middle East, was formed on
16thof October 2007 when the shares of Emirates NBD were officially listed on
the Dubai Financial Market (DFM). Emirates NBD is a market leader across
core business lines and the leading retail banking franchise, with 219 branches
and over 920 ATMs and Cash Deposit Machines (CDMs) spread across the
country and overseas. It is a major player in the corporate banking arena. With
fast growing Islamic banking affiliated entities, strong investment and private

UAE: Mergers and Acquisitions
EJBE Vol. 4 No. 1/2014 Page 87
banking services and a leadership in the field of asset management products
and brokerage services. As at 31 December 2013, total assets were AED 342.1
billion. The Group has operations in the UAE, Egypt, the Kingdom of Saudi
Arabia, Qatar, Singapore, the United Kingdom, and representative offices in
India, China and Indonesia. Currently, more than 9,000 people, representing 70
nationalities, are employed by Emirates NBD, making it one of the largest and
most culturally diversified employers in the UAE.
2.2 Highlights of the Merger
The merger was announced on March 6, 2007. The Emirates NBD, merger
between Emirates Bank International (EBI) and the National Bank of Dubai
(NBD), became a regional consolidation blueprint for the banking and finance
sector as it combined the second and fourth largest banks in the United Arab
Emirates (UAE) to form a banking champion capable of delivering enhanced
value across corporate, retail, private, Islamic and investment banking
throughout the region. This merger was in tune with the high levels of growth
achieved by the banking industry over the past few years on the back of the
booming UAE and regional economies. During the period of pre-merger three
years, the UAE GDP grew at an average rate of 20 per cent. In 2007 the total
assets of UAE banks grew by 45 per cent to US $337 billion. The value of
deposits grew by 35 per cent to US $204 billion.
The merger resulted in the union of two powerful legacies which was aimed to
become a leading regional financial institution with an increasing international
presence. The merger was aimed to leverage financial strength, scale and
market positioning to capture domestic and regional opportunities. The merger
facilitated the partnership for wholesale, retail, investment, treasury and
UAE: Mergers and Acquisitions
EJBE Vol. 4 No. 1/2014 Page 88
Islamic banking clients. The total income of the two banks reached AED 7.1
billion, an increase of 50 per cent year on year. The group became a major
player in the corporate banking arena with a joint market share of almost a fifth
of corporate loans. This strategic merger was meant to create a bank with scale,
financial strength and service quality standards to compete effectively in a
dynamic market.
The merger created the largest UAE bank by assets and market capitalization,
significantly enhanced competitiveness by strategically positioning to capture
high growth potential of domestic and regional markets. It became corporate
and retail banking powerhouse with highly diversified business mix and largest
distribution network in the UAE.
UAE: Mergers and Acquisitions
EJBE Vol. 4 No. 1/2014 Page 89
2.3 Superior Value Creation Potential
Expected significant cost and revenue synergies driving value creation:
Table 2: Significant EventsDate Events
06 March 2007 The merger between Emirates Bank and National Bankof Dubai was announced
14 March 2007 A Merger steering committee was appointed09 April 2007 Goldman Sachs International appointed as lead financial
advisors on the merger12 July 2007 Emirates Bank and National Bank of Dubai announced
terms of their merger05 September 2007 Emirates Bank Shareholders approved the merger terms
at Extraordinary General meeting06 September 2007 National Bank of Dubai shareholders approved the
merger’s terms at an Extraordinary General Meeting18 September 2007 Emirates NBD closed its initial offer to shareholders of
National Bank of Dubai and Emirates Bank08 October 2007 Emirates bank and National Bank of Dubai’s shares were
suspended from trading on the Dubai Financial Market16 October 2007 Trading began on shares in Emirates NBD PJSC, the
newly merged banking group listed on the DubaiFinancial Market.
18 October 2007 Emirates NBD announced the integration of its ATMNetwork making it the largest in the UAE.
04 November 2007 The National Bank of Dubai’s building became the newheadquarters for Emirates NBD.
2.4 Financial Highlights
The significance of the merger of Emirates Bank International (EBI) and
National Bank of Dubai (NBD) was reflected in the strong pro forma results of
Emirates NBD. The total income reached AED7.1 billion on a pro forma basis.
The primary drivers for the increase in total income were robust growth in
customer assets supported by a rise in customer deposits across both the retail
and wholesale businesses. The group continued to maintain a healthy mix of

UAE: Mergers and Acquisitions
EJBE Vol. 4 No. 1/2014 Page 90
funded and non-funded income. The growth in income was supported by a
steady increase in fee based product revenue.
The operating cost for Emirates NBD was AED 2.7 billion on a pro forma
basis, an increase of 51 per cent over 2006. The increase in costs was driven by
continued investments in expanding distribution and product capabilities,
building robust infrastructure and developing strong governance capabilities.
The net profits of the Group were AED 4 billion (excluding amortization of
intangibles) for 2007 on a pro forma basis, an increase of 35 per cent over
2006. Emirates NBD reported a 25.12 per cent return on average shareholder
equity, a 1.6 per cent increase over 2006. Total assets recorded at the end of
2007 were AED 253.8 billion, an increase of 53 per cent for EBI and NBD’s
combined assets in 2006.This positioned Emirates NBD with a 20.5 per cent
market share of banking assets in the UAE and as the largest bank in the
Middle East.
2.5 Business Highlights
Emirates NBD’s wholesale banking’s net income (excluding IPO business)
grew by 38 per cent and its assets by 42 per cent in the year 2007.The
Structured Finance and Syndication Division (SFS) remained at the forefront
of the UAE’s loan syndication market in 2007.The division gained a significant
share in the local debt syndication market in value and number of deals acting
as mandated lead arrangers and book runners in a number of high profile
transactions. The division also led managed multiple benchmark transactions
for the UAE’s largest and highest profile issuers in the year 2007. The
Financial Institutions Division (FDI) became an important contributor to the
wholesale banking sector in the year 2007.

UAE: Mergers and Acquisitions
EJBE Vol. 4 No. 1/2014 Page 91
2.6 Consumer Banking and Wealth Management
As a result of the merger, the Group’s distribution network became the largest
in the UAE. Emirates NBD ended the year with a total of 88 retail branches
following the opening of 13 new outlets. The number of ATMs increased to
440. The expansion of the Al Shaheen and Suhail branch network to 27 in 2007
positioned the Bank with the largest network of affluent banking centers in the
country. Growth in customer deposits and loans was strong in 2007
outperforming the market growth. With the advent of cross selling across the
integrated group, improved delivery across all channels and a partnership with
the UK’s John Charcoal Brokers facilitated NBD to become the UAE’s leading
non Islamic home loans provider in 2007.
Private Banking
As part of its expansion strategy, Emirates NBD acquired two new locations in
2007. The Private Banking division worked with its London Office in the
introduction of the Hammersmith project to its client base. The Investment
Management Group added a mix of mutual funds to its platform in 2007
covering emerging markets, multi manager, global real estate and
commodities.
Investment Banking
NBD Investment Bank provides integrated investment banking, financial
markets and private equity solutions and serves the needs of corporations,
governments, institutional and high net worth clients across the GCC and wider
MENA region.

UAE: Mergers and Acquisitions
EJBE Vol. 4 No. 1/2014 Page 92
Group Treasury and Markets
In 2007, the group treasury activities included USD 1.5 billion 5 year
syndicated deposit facility; USD 1 billion Sukuk –Trust Certificate Issuance
program arranged for Emirates Islamic bank. The Group’s new credit
structuring and trading areas became fully operational in 2007.The Foreign
Exchange and Interest rate trading volumes increased positioning the newly
merged group as a leading market maker in GCC currencies. As a result of the
merger, the Group’s direct international footprint extended to a number of
countries outside of UAE namely, Egypt, the Kingdom of Saudi Arabia, Qatar,
Singapore, the United Kingdom, and representative offices in India, China and
Indonesia.
Information Technology and Operations
A number of major system initiatives were implemented in the year 2007
including core banking system replacement, the adaptation of an ERP system
for EHR and Enterprise Financial Management and the implementation of a
state of the art treasury system which enables integrated processing of the
front, middle and back offices. A new consumer finance system that processes
the complete life cycle of loans was implemented in the year 2007.
The integration of the combined banks Group, ATMs and Smart Deposit
Machines (SDMs) were completed by 2008 which rose to more than 650
across UAE making it the biggest network in the country. Mobile and online
banking has also been fully integrated with enhanced functionalities and 13
payment partners available to all of the bank’s customers.

UAE: Mergers and Acquisitions
EJBE Vol. 4 No. 1/2014 Page 93
The Key Terms of the Merger
The creation of Emirates NBD was by the merger of common ownership of
EBI and NBD. The salient features of the consideration were 1) Exchange ratio
of 0.95 Emirates NBD shares for every NBD share. 2) Exchange ratio of 1
Emirates NBD for every EBI share.
As on July 01 2007, the implied share price for NBD was AED 8.84. The
implied share price for EBI was AED 9.30.The implied total consideration was
AED 13.75 billion.1The offer price represented 14 per cent premium to the
prices on the day prior to announcement.
Synergies Expected from the Merger
Revenue Synergies
In the corporate banking, the cross selling of new product capabilities is
expected to result in revenue synergy through increase in fee income. In the
retail banking sector, the focus will be on incremental revenue generated
through market share/pricing advantages and the leveraging of the largest
distribution network in the UAE. In the Investment banking sector, expansion
of client base and cross selling of new product capabilities is expected to lead
to revenue synergies. Revenue synergies also result from improved cost of
funding due to a stronger capital base and improved sales due to integrated
broader offering.
1 Share price of EBI of AED 10.48 on 5 March 2007, implying a share price for NBD of AED9.96 based on 0.95x exchange ratio. Market price of NBD on 5March 2007 of AED8.75implying 14% premium. All share prices adjusted for bonus share issues.
UAE: Mergers and Acquisitions
EJBE Vol. 4 No. 1/2014 Page 94
Cost Synergies
Cost synergies are expected to result from retail banking due to: Branch and
ATM network consolidation; Integration of card acquiring business; and
Pricing advantages on advertising /marketing spend. The cost synergy is also
expected from optimized head office and group functions. Cost synergies
would also result from reallocation of IT personnel from NBD to EBI IT
dedicated center. Cost synergies are also expected from brokerage due to
improved efficiency from integrated operations and IT platform. Cost
synergies are also expected from leveraging Emirates Islamic Bank as a
platform for unified Islamic offerings.
3. Literature Review
Two main research approaches explain Mergers and Acquisition profitability.
The event studies examine the abnormal returns to shareholders in the period
surrounding the announcement of a merger or acquisition. The accounting
studies examine the reported financial results of acquirers before and after the
acquisitions to see how the financial performance changes. It is a well-
established fact that target shareholders gain when a merger, acquisition or
tender offer is announced.
3.1 Stock Market Studies
Most of the broad based risk adjusted studies on mergers like those of
Mandelker (1974) and Langeteig (1978) have shown that the stockholders of
acquiring firms either gain a small, statistically insignificant amount or as in
the study by Dodd(1980) lose a small significant amount from the
announcement of a merger bid. The study by Asquith et al (1983) examines the

UAE: Mergers and Acquisitions
EJBE Vol. 4 No. 1/2014 Page 95
effect of mergers on the wealth of bidding firms shareholders. Bidding firms
gain significantly during the twenty-one days leading to the announcement of
each of their first four merger bids. The results fail to support the capitalization
hypothesis that bidder’s gains are captured at the beginning of merger
programs. The study by Langetieg (1978) employs four alternative two-factor
market industry models in combination with a matched non-merging control
group to measure stockholder gains from mergers. Moeller et al (2004)
examined the announcement returns using a sample of 12,023 acquisitions by
public firms during the period 1980-2001. The results of this study show that
the equally weighted abnormal announcement returns is 1.1 per cent but
acquiring firm shareholders lose $25.2 million on average upon announcement.
Moeller et al (2004) find that acquisition announcements in the 1990s are
profitable in the aggregate for acquiring firm shareholders until 1997, but the
losses of acquiring firm shareholders from 1998 through 2001 wiped out all
gains made earlier thereby making acquisitions announcements in the latest
merger wave costly for acquiring firm shareholders.
3.2 Operating Performance Studies
Palepu (1985) finds that there is no significant cross-sectional difference
between the profitability of firms with predominantly related and unrelated
diversification; and profitability of firms with high and low total
diversification. Moreover, the study finds that the superior profitability growth
of related diversifiers is significantly greater than that of unrelated diversifiers.
Herman and Lowenstein (1988) examined the post-merger performance of a
sample of hostile acquisitions between 1975 and 1983. The study by Paul M.
Healy and Palepu (1992) examines the post-merger cash flow performance of
acquiring and target firms and explores the sources of merger induced changes

UAE: Mergers and Acquisitions
EJBE Vol. 4 No. 1/2014 Page 96
in cash flow performance based on 50 largest US mergers between 1979 and
mid-1984. The study finds that merged firms show significant improvements in
asset productivity relative to their industries, leading to higher operating cash
flow returns. These improvements were particularly strong for transactions
involving firms in overlapping business. The study further suggests that post-
merger cash flow improvements do not come at the expense of long term
performance since sample firms maintain their capital expenditure and R&D
rates relative to their industries after the merger. The study also found strong
positive relation between post-merger increases in operating cash flows and
abnormal stock returns at merger announcements indicating that expectations
of economic improvements explain a significant portion of the equity
revaluation of the merging firms. Cornett and Tehranian (1992) examine the
post-acquisition performance of large bank merger between 1982 and
1987.The results of their study indicate better performance for merged banks
due to the improvements in ability to attract loans and deposits, in employee
productivity and in profitable asset growth. Further, the study finds a
significant correlation between announcements period abnormal return and the
various performance measures indicating that the market participants are able
to identify in advance the improved performance associated with bank
acquisitions. Switzer (1996) examined the change in operating performance of
merged firms using a sample of 324 combinations, which occurred between
1967 and 1987. The results indicated that the performance of the merged
following their combinations and also the results are not sensitive to factors
such as offer size, industry relatedness between the bidder’s and target’s
businesses or bidder’s leverage. The study also found positive association
between the abnormal revaluation of the firms involved around the merger and
changes in operating performance observed. The study by Healy et al (1997)

UAE: Mergers and Acquisitions
EJBE Vol. 4 No. 1/2014 Page 97
found that strategic takeovers which are generally friendly transactions
involving stock and firms in overlapping business are more profitable than
financial deals which are usually hostile transactions involving cash and firms
in unrelated business. The results of this study also showed that the acquiring
companies did not generate any additional cash flows beyond those needed to
recover the premium paid. Ghosh (2001) compares the post and pre
acquisition performance of merging firms relative to matched firms to
determine whether operating cash flow performance improves following
acquisition. The result found no evidence of improvement of operating
performance following acquisitions.
4. Methodology
4.1 Stock Price Analysis
The studies of abnormal returns provide a basis for examining the issue of
whether or not value is enhanced by mergers. The study analyses the share
price performance using market adjusted method.
The market’s reaction to a merger bid is measured using daily stock return data
to compute excess stockholder returns. These excess returns are a measure of
the stockholder’s return from the new information which becomes available to
market. The daily excess return for the security is estimated by
XRt =Rt –E( Rt )Where t = day relative to an event.XRt = Excess return on the security for day t.Rt = Actual Return on the security for day t.E ( Rt) = Expected rate of return on the security for day t.The excess return for a time window period is cumulated to get the Cumulative
Abnormal Return (CAR).

UAE: Mergers and Acquisitions
EJBE Vol. 4 No. 1/2014 Page 98
The choice of the benchmark is probably the most important factor in making
accurate measurement of a merger’s impact.
The expected rate of return on the security is found out using the Market
Return Adjusted Method.
The predicted return for a firm for a day in the event period is just the return on
the market index. The market index used in the study is DFM index.
Rt = Rmt.Where Rt is the expected return. Rmt is the market index return. The merger
date used was the announcement date. The day of announcement of the merger
is titled t=0, the days before as -1, -2 etc. and the post-merger days as +1, +2
etc.
4.2 Operating Performance Analysis
Model for Analysis of Operating Performance:
Total Operating cash flow return on assets is defined as profit before
depreciation, interest and taxes divided by the book value of assets.
Cash flow return on Assets (CFA) = Total Operating cash flow ÷Book Value
of assets

UAE: Mergers and Acquisitions
EJBE Vol. 4 No. 1/2014 Page 99
4.3 Share Price Analysis and Interpretation
Table3: NBD Share Price Daily Returns during the announcement period
Day tReturn in
percentageCumulative Return in
percentage-5 0 0-4 0.975 0.975-3 1.44 2.415-2 -1.9 0.515-1 1.94 2.4550 0.47 2.9251 4.73 7.6552 0.45 8.1053 -5.8 2.3054 -0.47 1.8355 1.92 3.755
Figure 2: Share Price Returns for NBD during the merger announcementperiod (-40 to + 40 day)
Figure 2 shows that there have been increased returns for NBD during the
immediate merger announcement period. There has been a drastic upward
-0.05
0
0.05
0.1
0.15
0.2
0.25
-40 -36 -32 -28 -24 -20 -16 -12 -8 -4 0 4 8 12 16 20 24 28 32 36 40
Cumulative Share Price Returns for NBD
Cumulative share pricereturns -NBD
UAE: Mergers and Acquisitions
EJBE Vol. 4 No. 1/2014 Page 100
movement in the cumulative share price returns after day -22 of the merger
announcement period followed by volatility in the share price returns and
finally a drastic downfall in the price movement after +13 day of
announcement.
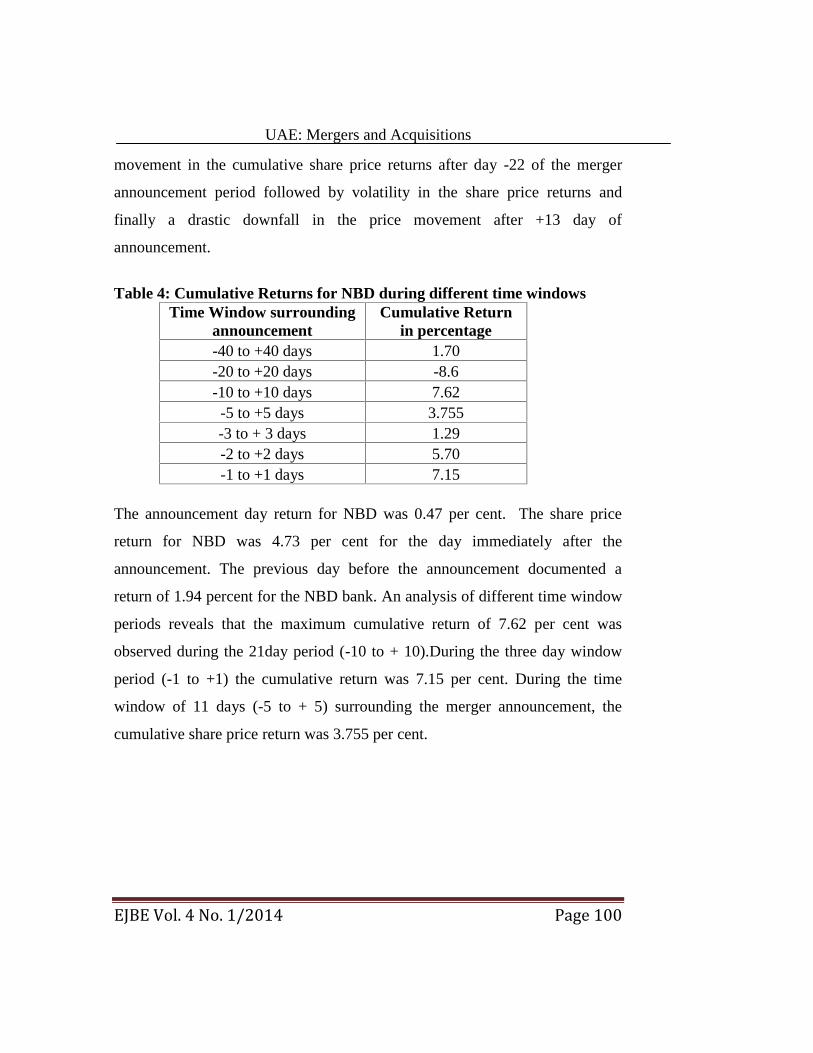
Table 4: Cumulative Returns for NBD during different time windowsTime Window surrounding
announcementCumulative Return
in percentage-40 to +40 days 1.70-20 to +20 days -8.6-10 to +10 days 7.62
-5 to +5 days 3.755-3 to + 3 days 1.29-2 to +2 days 5.70-1 to +1 days 7.15
The announcement day return for NBD was 0.47 per cent. The share price
return for NBD was 4.73 per cent for the day immediately after the
announcement. The previous day before the announcement documented a
return of 1.94 percent for the NBD bank. An analysis of different time window
periods reveals that the maximum cumulative return of 7.62 per cent was
observed during the 21day period (-10 to + 10).During the three day window
period (-1 to +1) the cumulative return was 7.15 per cent. During the time
window of 11 days (-5 to + 5) surrounding the merger announcement, the
cumulative share price return was 3.755 per cent.

UAE: Mergers and Acquisitions
EJBE Vol. 4 No. 1/2014 Page 101
Table 5: EBI Share Price Daily Returns during the announcement period
Day tReturn in
percentageCumulative Return
in percentage-5 -2.86 -2.86-4 -2.95 -5.81-3 -0.38 -6.19-2 4.19 -2-1 -4.02 -6.020 -3.05 -9.071 7.48 -1.592 -3.60 -5.193 -1.14 -6.334 -1.92 -8.255 1.96 -6.29
The analysis documents a return of 7.48 per cent for Emirates Bank
International in the day immediately after the announcement of merger. The
share price returns were negative during both -1 and the day of announcement.
During the time window period of -5 to +5 days, only the +1 and +5 day
surrounding the announcement period documented positive share price returns.
UAE: Mergers and Acquisitions
EJBE Vol. 4 No. 1/2014 Page 102
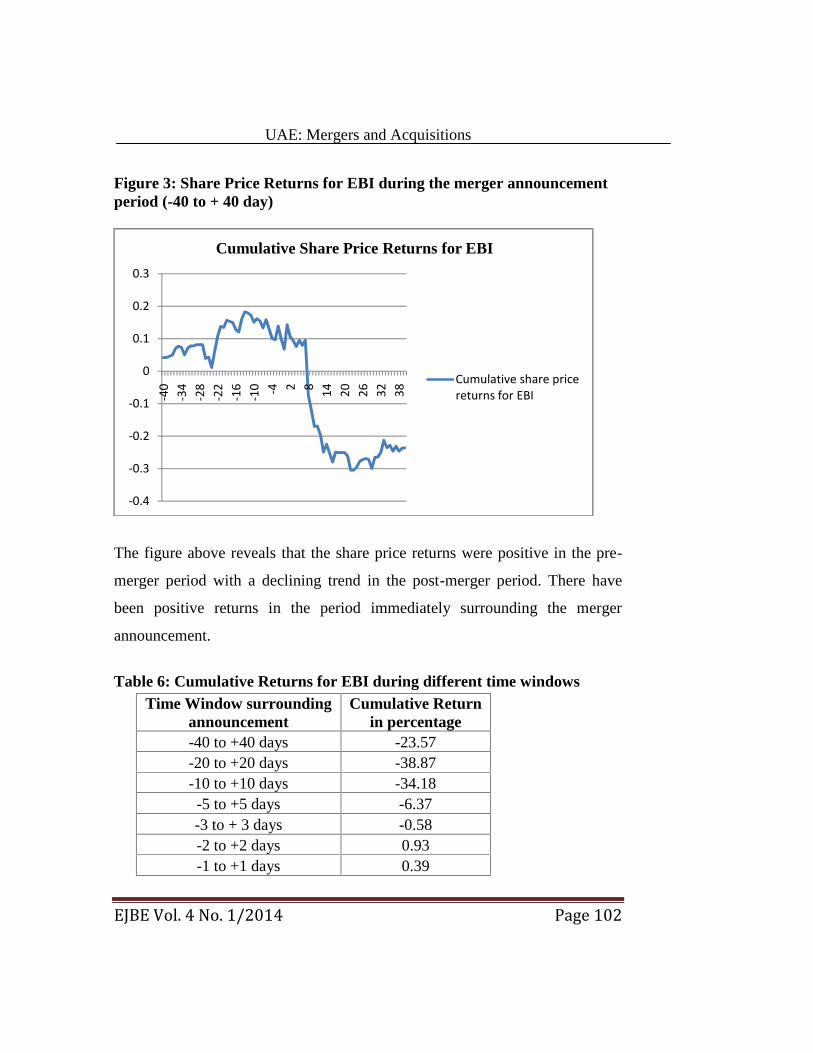
Figure 3: Share Price Returns for EBI during the merger announcementperiod (-40 to + 40 day)
The figure above reveals that the share price returns were positive in the pre-
merger period with a declining trend in the post-merger period. There have
been positive returns in the period immediately surrounding the merger
announcement.
Table 6: Cumulative Returns for EBI during different time windows
-0.4
-0.3
-0.2
-0.1
0
0.1
0.2
0.3
-40
-34
-28
-22
-16
-10 -4 2 8 14 20 26 32 38
Cumulative Share Price Returns for EBI
Cumulative share pricereturns for EBI
Time Window surroundingannouncement
Cumulative Returnin percentage
-40 to +40 days -23.57-20 to +20 days -38.87-10 to +10 days -34.18
-5 to +5 days -6.37-3 to + 3 days -0.58-2 to +2 days 0.93-1 to +1 days 0.39
UAE: Mergers and Acquisitions
EJBE Vol. 4 No. 1/2014 Page 103
From the table, it is observed that only during the shorter time window period
of -2 to +2 and 3 day period of -1 to + 1, the share price returns are positive.
All other time window period registered negative returns with 41 day and 21
day period having negative returns of approximately 39 per cent and 34 per
cent respectively. For the eighty one day period (-40 to + 40), the cumulative
return was negative 23.57 per cent.
It can be stated that the cumulative share price returns were positive for NBD
in different time window periods, except the window period -20 to + 20. In
comparison, EBI’s share price returns were highly negative in larger window
periods.
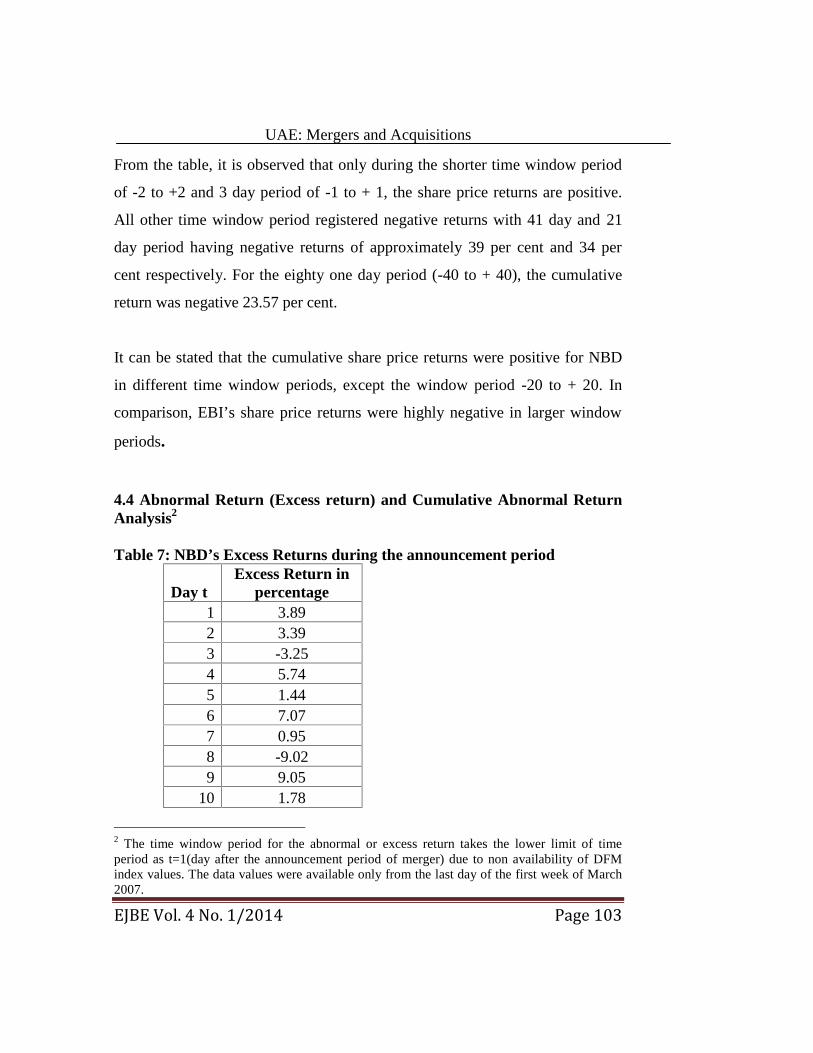
4.4 Abnormal Return (Excess return) and Cumulative Abnormal ReturnAnalysis2
Table 7: NBD’s Excess Returns during the announcement period
Day tExcess Return in
percentage1 3.892 3.393 -3.254 5.745 1.446 7.077 0.958 -9.029 9.05
10 1.78
2 The time window period for the abnormal or excess return takes the lower limit of timeperiod as t=1(day after the announcement period of merger) due to non availability of DFMindex values. The data values were available only from the last day of the first week of March2007.

UAE: Mergers and Acquisitions
EJBE Vol. 4 No. 1/2014 Page 104
The excess return or abnormal analysis for NBD reveals that on the day after
the merger announcement, NBD had an abnormal return of 3.89 per cent. The
highest abnormal return was observed on the 9th day after merger
announcement (9.05%). Negative abnormal returns were observed during the +
3 and +8 day of announcement.
Table 8: Cumulative Abnormal Returns for NBD during different timewindows
Time Window surroundingannouncement
Cumulative AbnormalReturn in percentage
+ 1 to +40 day -31.97+ 1 to +20 day -4.97+1 to+10 day 21.06+1 to +5 day 11.22+1 to + 3 day 4.02+1 to +2 day 7.2
The CAR analysis for NBD documents positive abnormal returns during the
shorter time window period surrounding the merger announcement. The CAR
during the time window period of +1 to + 10 day was 21.06 per cent. The CAR
analysis revealed negative abnormal returns during the longer time window
period.
UAE: Mergers and Acquisitions
EJBE Vol. 4 No. 1/2014 Page 105
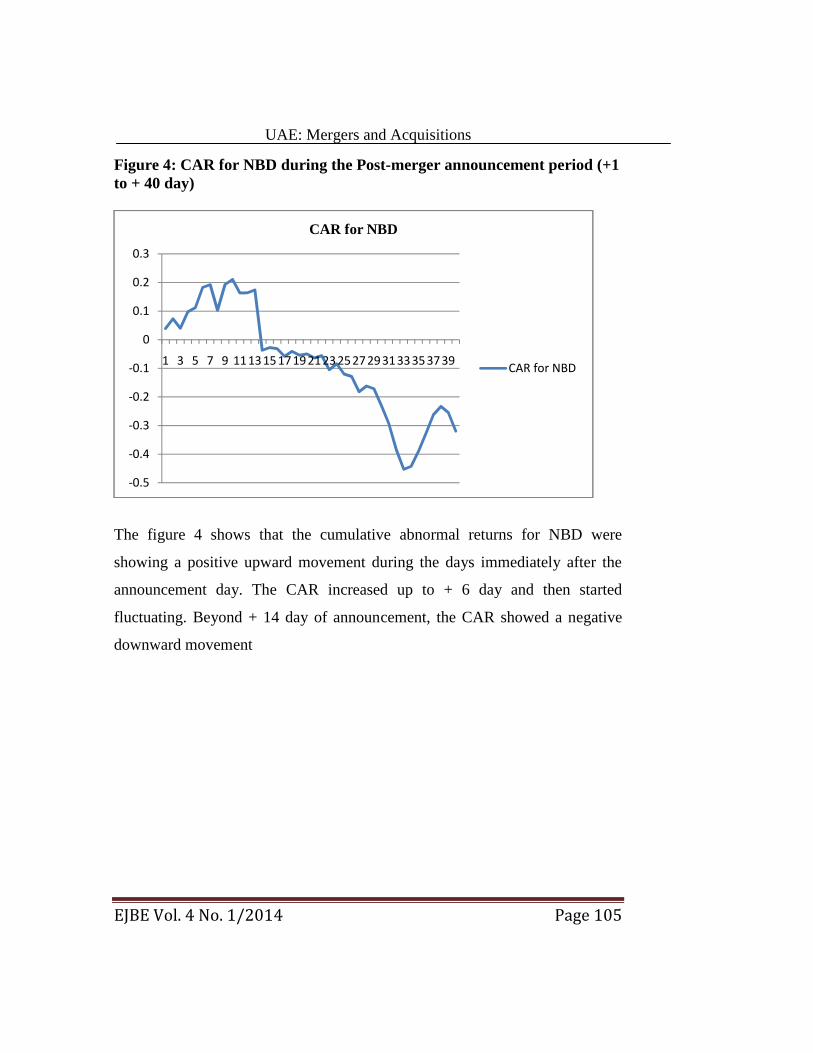
Figure 4: CAR for NBD during the Post-merger announcement period (+1to + 40 day)
The figure 4 shows that the cumulative abnormal returns for NBD were
showing a positive upward movement during the days immediately after the
announcement day. The CAR increased up to + 6 day and then started
fluctuating. Beyond + 14 day of announcement, the CAR showed a negative
downward movement
-0.5
-0.4
-0.3
-0.2
-0.1
0
0.1
0.2
0.3
1 3 5 7 9 111315171921232527293133353739
CAR for NBD
CAR for NBD

UAE: Mergers and Acquisitions
EJBE Vol. 4 No. 1/2014 Page 106
Table 9: EBI’s Excess Returns during the announcement period
Day tExcess Return in
percentage1 6.62 5.93 7.34 11.65 13.156 15.867 17.918 -3.49 -3.8
10 -9.27
The excess return analysis for EBI reveals an excess return of 6.6 per cent
compared to the market index DFM during the day immediately after the
merger announcement. The analysis also documents an excess return of 5.9%
and 7.3% during the +2 and + 3 day of announcement. Double digit return was
observed during the +4 to + 7 day of event announcement. Negative excess
return was observed in the following days up to the 10th day of merger
announcement.
Table 10: Cumulative Abnormal Returns for EBI during different timewindows
Time Window surroundingannouncement
Cumulative AbnormalReturn in percentage
+ 1 to +40 day -49+ 1 to +20 day -20.34+1 to+10 day -9.27+1 to +5 day 13.15+1 to + 3 day 7.36+1 to +2 day 5.9
UAE: Mergers and Acquisitions
EJBE Vol. 4 No. 1/2014 Page 107
The CAR analysis suggests that Emirates Bank International has positive
cumulative abnormal returns during the shorter time window period compared
to the negative returns in the longer period of analysis. The study documents a
CAR of 5.9 per cent during a-two-day period after the merger announcement.
During the 6 day period of +1 to +5, the study observes a positive CAR of
13.15 per cent.
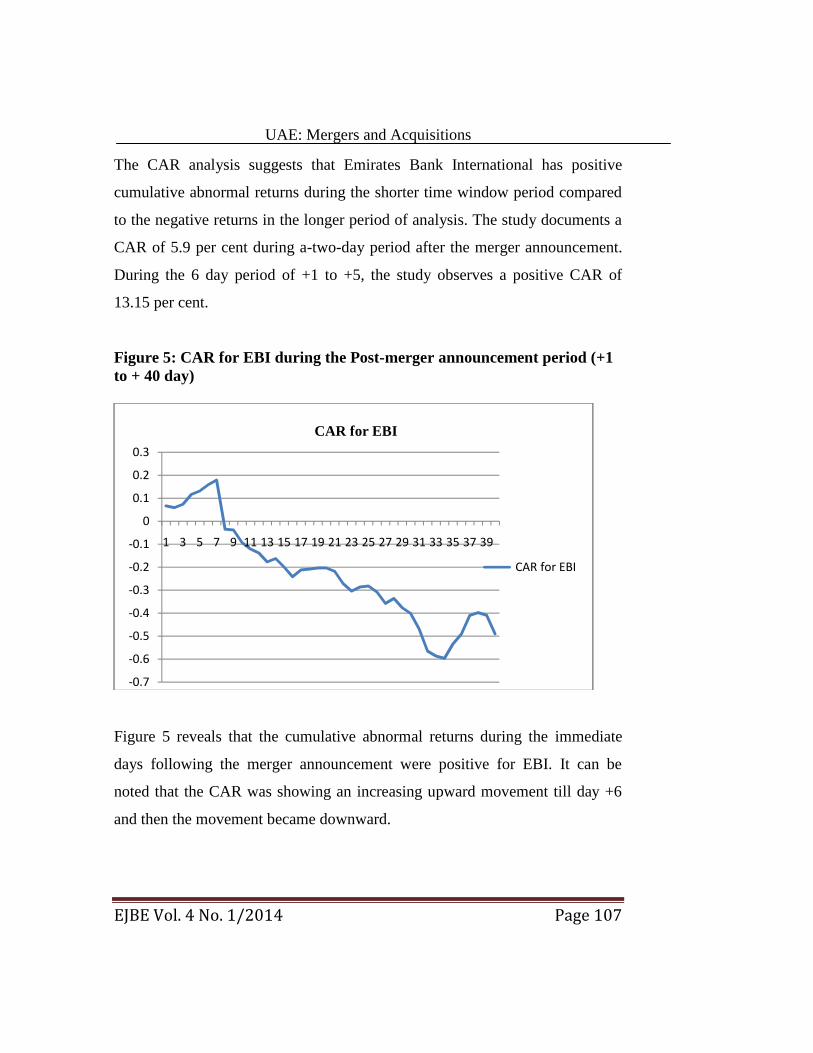
Figure 5: CAR for EBI during the Post-merger announcement period (+1to + 40 day)
Figure 5 reveals that the cumulative abnormal returns during the immediate
days following the merger announcement were positive for EBI. It can be
noted that the CAR was showing an increasing upward movement till day +6
and then the movement became downward.
-0.7
-0.6
-0.5
-0.4
-0.3
-0.2
-0.1
0
0.1
0.2
0.3
1 3 5 7 9 11 13 15 17 19 21 23 25 27 29 31 33 35 37 39
CAR for EBI
CAR for EBI

UAE: Mergers and Acquisitions
EJBE Vol. 4 No. 1/2014 Page 108
Table11: Stock Returns and Cumulative Abnormal Returns surroundingPost-merger Announcement
Months afterMerger
Returns CAR
1 2.76% 5.60%2 -1.08% 4.53%3 0.54% 5.07%4 0.00% 5.07%5 70.27% 75.34%6 -17.46% 57.88%7 11.54% 69.42%8 0.69% 70.11%9 0.00% 70.11%
10 -7.88% 62.23%11 -9.29% 52.94%
Figure 6: Graphical representation of CAR during the first 15 monthsPost-merger announcement
0
0.1
0.2
0.3
0.4
0.5
0.6
0.7
0.8
1 2 3 4 5 6 7 8 9 10 11 12 13 14 15
Series1
UAE: Mergers and Acquisitions
EJBE Vol. 4 No. 1/2014 Page 109
The stock market monthly returns from the post-merger period April 2007 to
April 2012 indicates a cumulative return of -43.89 per cent and average returns
of -0.73 per cent respectively. During the period April 2007 to March 2008,
the cumulative excess return was 62 per cent. The average return during this
period was 7.79 per cent. This shows that during the year surrounding the post-
merger period, stock prices showed substantial gain.
4.5 Operating Performance Analysis and Interpretation
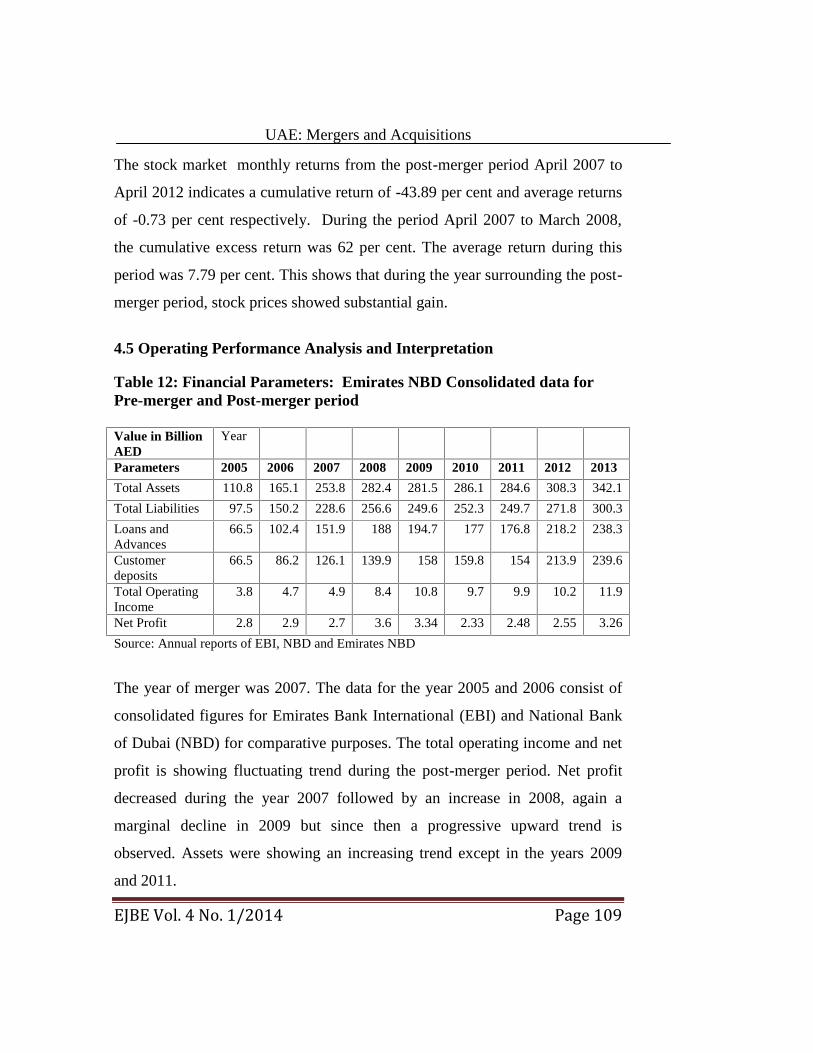
Table 12: Financial Parameters: Emirates NBD Consolidated data forPre-merger and Post-merger period
Value in BillionAED
Year
Parameters 2005 2006 2007 2008 2009 2010 2011 2012 2013
Total Assets 110.8 165.1 253.8 282.4 281.5 286.1 284.6 308.3 342.1
Total Liabilities 97.5 150.2 228.6 256.6 249.6 252.3 249.7 271.8 300.3
Loans andAdvances
66.5 102.4 151.9 188 194.7 177 176.8 218.2 238.3
Customerdeposits
66.5 86.2 126.1 139.9 158 159.8 154 213.9 239.6
Total OperatingIncome
3.8 4.7 4.9 8.4 10.8 9.7 9.9 10.2 11.9
Net Profit 2.8 2.9 2.7 3.6 3.34 2.33 2.48 2.55 3.26
Source: Annual reports of EBI, NBD and Emirates NBD
The year of merger was 2007. The data for the year 2005 and 2006 consist of
consolidated figures for Emirates Bank International (EBI) and National Bank
of Dubai (NBD) for comparative purposes. The total operating income and net
profit is showing fluctuating trend during the post-merger period. Net profit
decreased during the year 2007 followed by an increase in 2008, again a
marginal decline in 2009 but since then a progressive upward trend is
observed. Assets were showing an increasing trend except in the years 2009
and 2011.

UAE: Mergers and Acquisitions
EJBE Vol. 4 No. 1/2014 Page 110
Table 13: Comparative Growth Rate
Per cent changes in growthrate
Pre-Mergerperiod
Post-MergerPeriod
Total Assets 49% 11.26%Total Liabilities 53.90% 12.24%Loans and Advances 54.12% 23.72%Customer deposits 29.65% 10.97%Total operating Income 22.50% 70.31%Net Profit 3.57% 32.85%
For the comparative analysis two base periods were selected: 2005 for the
premerger period and 2007 for the post-merger period. The growth rates of the
financial parameters were examined in the year 2006 (for premerger period)
and 2008 (for the post-merger period) with respect to their base period. It is
observed that the growth rate in total assets and liabilities were greater during
the pre-merger period in comparison to the post-merger period. The growth
rate in loans and advances and customer deposits were higher during the
premerger period. The growth rate in total operating income and net profit
were higher in the post-merger period compared to the pre-merger period. The
operating income and net profit increased by 70.31 per cent and 32.85 per cent
respectively in the post-merger period compared to an increase of 22.5 per cent
and 3.57 per cent respectively in the pre-merger period. Compared to the
merger year of 2007, operating income and net profit to date has increased by
142 per cent and 21 per cent respectively.
UAE: Mergers and Acquisitions
EJBE Vol. 4 No. 1/2014 Page 111
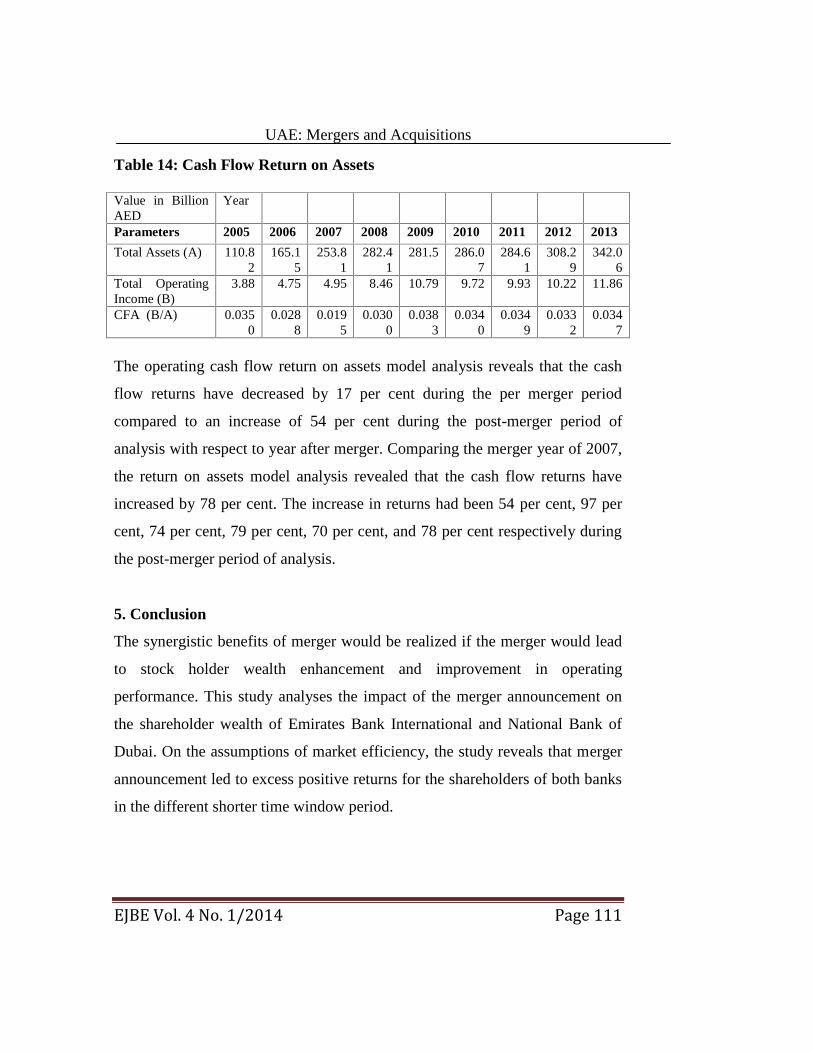
Table 14: Cash Flow Return on Assets
Value in BillionAED
Year
Parameters 2005 2006 2007 2008 2009 2010 2011 2012 2013
Total Assets (A) 110.82
165.15
253.81
282.41
281.5 286.07
284.61
308.29
342.06
Total OperatingIncome (B)
3.88 4.75 4.95 8.46 10.79 9.72 9.93 10.22 11.86
CFA (B/A) 0.0350
0.0288
0.0195
0.0300
0.0383
0.0340
0.0349
0.0332
0.0347
The operating cash flow return on assets model analysis reveals that the cash
flow returns have decreased by 17 per cent during the per merger period
compared to an increase of 54 per cent during the post-merger period of
analysis with respect to year after merger. Comparing the merger year of 2007,
the return on assets model analysis revealed that the cash flow returns have
increased by 78 per cent. The increase in returns had been 54 per cent, 97 per
cent, 74 per cent, 79 per cent, 70 per cent, and 78 per cent respectively during
the post-merger period of analysis.
5. Conclusion
The synergistic benefits of merger would be realized if the merger would lead
to stock holder wealth enhancement and improvement in operating
performance. This study analyses the impact of the merger announcement on
the shareholder wealth of Emirates Bank International and National Bank of
Dubai. On the assumptions of market efficiency, the study reveals that merger
announcement led to excess positive returns for the shareholders of both banks
in the different shorter time window period.
UAE: Mergers and Acquisitions
EJBE Vol. 4 No. 1/2014 Page 112
The study documents a share price return of 0.47 per cent and 4.73 per cent
respectively for NBD on the day of announcement and the following day. The
cumulative share price return was positive in all the time window periods
except the period of -20 to + 20 day. The excess return or abnormal analysis
for NBD reveals that on the day after the merger announcement NBD had an
abnormal return of 3.89 per cent. The CAR analysis for NBD reveals positive
double digit returns during the time window of + 1 to +10 and +1 to +5 day of
announcement.
The operating performance analysis suggests that the growth rate in total
operating income and net profit were higher in the post-merger period
compared to the pre-merger period. The operating cash flow return on assets
model analysis reveals that the cash flow returns have decreased by 17 per cent
during the pre merger period compared to an increase of 54 per cent during the
post-merger period of analysis of one year. Comparing the merger year of
2007, the return on assets model analysis revealed that the cash flow returns
have increased by 78 percent. The increase in returns had been 54 per cent, 97
per cent, 74 per cent, 79 per cent, 70 per cent, and 78 per cent respectively
during the post-merger period of analysis.
Mergers and acquisitions (M&A’s) continue to play an important role in
shaping business activities worldwide. They have become important business
strategies to help improve organizational performance. The Ethiopian economy
is also growing and the quest for growth is a major driving force behind
mergers and acquisitions. Studies in similar line may be carried out on different
corporate merger proposals in Ethiopia and in other nations.
(Note: The currency of UAE is Emirati Dirham; 1 US$ = AED 3.67)
UAE: Mergers and Acquisitions
EJBE Vol. 4 No. 1/2014 Page 113
ReferencesAnup Agrawal, Jeffrey F Jaffe and Gershon N Mandelker. 1992.“The post
merger performance of acquiring firms: A Reexamination of an
anomaly”:Journal of Finance Vol. 47-4, pp. 1605-1622.
Asquith Paul, Robert F Bruner and David W Mullins Jr. 1983.“The gains to
bidding firms from merger”:Journal of Financial Economics, Vol. 11,
pp. 121-139.
Cornett MM, Hassan Tehranian. 1992.“Changes in corporate performance
associated with bank acquisitions”:Journal of Financial Economics,
Vol. 31 pp. 211-234.
Cornett, Marcia Millon, Tehranian, Hassan. 1992.“Changes in corporate
performance associated with bank acquisitions”:Journal of Financial
Economics, Vol.31pp. 211-234.
Dodd, Peter. 1980. “Merger Proposals, Management Discretion and
Stockholder Wealth”:Journal of Financial Economics,Vol. 8, pp. 105
-137.
Ernst & Young’s. 2013. “Year-end MENA Mergers and Acquisition (M&A)
update”.
Franks J, Robert Harris and Sheridan Titman. 1991.“The post merger share
price performance of acquiring firms”:Journal of Financial Economics,
Vol. 29, pp. 81-96
Fuller Kathleen, Jeffrey Netter and Mike Stegemoller. 2004. “What do returns
to acquiring firms tell us? Evidence from Firms that make many
Acquisitions”, Journal of Finance, Vol. 57-4 , pp. 1763-1794.
Ghosh, Aloke. 2001.“Does operating performance really improve following
corporate acquisitions”,Journal of Corporate Finance, 7: pp. 151-178.
Healy, Paul M. Palepu, Krishna G. and Ruback, Richard S. 1992.“Does

UAE: Mergers and Acquisitions
EJBE Vol. 4 No. 1/2014 Page 114
Corporate Performance Improve After Mergers”,Journal of Financial
Economics, 31: pp. 135-175.
Healy, Paul M, Palepu, Krishna G and Ruback, Richard S. 1997. “Which
Takeovers are Profitable? Strategic or Financial?”,Sloan Management
Review, 38(4): pp.45-57.
Herman E. and Lowenstein L. 1988. “The efficiency effects of hostile
takeovers. In: Auerbach A (Ed.). Knights, Raiders and Targets: The
impact of hostile takeovers”, National Bureau of Economic Research,
Cambridge.
J F Houston, Christopher M James, Michael D Ryngaert. 2001.“Where do
merger gains come from? Bank mergers from the perspective of insiders
and outsiders”,Journal of Financial Economics, Vol. 60, pp. 285-331.
Langetieg Terence C. 1978.“An Application of a three-factor performance
index to measure stockholder gains from merger”,Journal of Financial
Economics, Vol. 6, pp. 365-383.
Mandelker, Gershon. 1974. “Risk and Return: The Case of Merging Firms”,
Journal of Financial Economics, Vol. 1, pp. 303-335.
Moeller Sara B, FrederikP Schlingemann and Rene M Stulz. 2004.“Firm Size
and the gains from acquisitions”, Journal of Financial Economics, Vol.
73, pp. 201-228.
MoellerSara, Frederik PSchlingemann and Rene M Stulz. 2005. “Wealth
Destruction on a Massive Scale? A study of Acquiring Firm Returns in
the recent merger wave”, The Journal of Finance, Vol. 60-2, pp. 757
-781.
Palepu, Krishna. 1985.“Diversification Strategy, Profit Performance and the
Entropy Measure”,Strategic Management Journal, 6: pp. 239-255.
Singal Vijay. 1996.“Airline mergers and competition: An integration of stock

UAE: Mergers and Acquisitions
EJBE Vol. 4 No. 1/2014 Page 115
and product price effects”, Journal of Business, Vol. 69 -2 pp. 233-268.
Switzer, Jeannette A. 1996.“Evidence on Real Gains in Corporate
Acquisitions”, Journal of Economics and Business, 48: pp. 443-460.
Thomson Financial.2013. Institute of Mergers, Acquisitions and Alliances
(IMAA) analysis.
YAmihud, Gayle L Delong, Anthony Saunders. 2002. “The effect of cross
border bank mergers on bank risk and value”, Journal of International
Money and Finance, Vol. 21, pp. 857-877.
http://gulfbusiness.com
www.emiratesnbd.com