the effect of linseed oil on the properties of lime-based...
TRANSCRIPT
AAllmmaa MMaatteerr SSttuuddiioorruumm –– UUnniivveerrssiittàà ddii BBoollooggnnaa
DOTTORATO DI RICERCA
Science for Conservation
Ciclo XXII
Settore/i scientifico disciplinari di afferenza: CHIM/12
TITOLO TESI
THE EFFECT OF LINSEED OIL ON THE
PROPERTIES OF LIME-BASED RESTORATION
MORTARS
Presentata da: Eva Čechová
Coordinatore Dottorato Relatore
Prof. Rocco Mazzeo Prof. Ioanna Papayianni
Esame finale anno 2009

Abstract
THE EFFECT OF LINSEED OIL ON THE PROPERTIES OF LIME-BASED RESTORATION MORTARS
The traditional lime mortar is composed of hydrated lime, sand and water. Besides
these constituents it may also contain additives aiming to modify fresh mortar´s properties
and/or to improve hardened mortar´s strength and durability. Already in the first civilizations
various additives were used to enhance mortar´s quality, among the organic additives,
linseed oil was one of the most common. From literature we know that it was used already
in Roman period to reduce water permeability of a mortar, but the mechanism and the
technology, e.g. effects of different dosages, are not clearly explained. There are only few
works studying the effect of oil experimentally. Knowing the function of oil in historical
mortars is important for designing a new compatible repair mortar. Moreover, linseed oil
addition could increase the sometimes insufficient durability of lime-based mortars used for
reparation and it could be a natural alternative to synthetic additives.
In the present study, the effect of linseed oil on the properties of six various lime-
based mortars has been studied. Mortars´ compositions have been selected with respect to
composition of historical mortars, but also mortars used in a modern restoration practise
have been tested. Oil was added in two different concentrations – 1% and 3% by the weight
of binder.
The addition of 1% of linseed oil has proved to have positive effect on mortars´
properties. It improves mechanical characteristics and limits water absorption into mortar
without affecting significantly the total open porosity or decreasing the degree of
carbonation. On the other hand, the 3% addition of linseed oil is making mortar to be almost
hydrophobic, but it markedly decreases mortars´ strength. However, all types of tested lime-
based mortars with the oil addition showed significantly decreased water and salt solution
absorption by capillary rise. Addition of oil into mortars is also decreasing the proportion of
pores which are easily accessible to water. Furthermore, mortars with linseed oil showed
significantly improved resistance to salt crystallization and freeze-thaw cycles.
On the base of the obtained results, the addition of 1% of linseed oil can be taken
into consideration in the design of mortars meant to repair or replace historic mortars.
Eva Čechová

List of symbols and abbreviations
ii
List of symbols and abbreviations
A [mm2] area on which the load is applied (compressive strength
testing)
ASTM American Standard Testing Method
b [mm] width of specimen
c [MPa] compressive strength
C [kg/(m2.min0,5)] coefficient of water (salt solution) absorption
C2S Dicalcium silicate 2CaO. SiO2
C3A Tricalcium aluminate 3CaO. Al2O3
C3S silicate 3CaO. SiO2
C4AF Tetracalcium aluminoferrite 4CaO. SiO2. Al2O3. Fe2O3
Ca coefficient of pores accessibility to water
Cv [g.h-1.m-2] water vapour permeability coefficient
C-S-H Calcium silicate hydrate
d [mm] depth of specimen
Edyn [GPa] dynamic modulus of elasticity
e.g. exempli gratia (= for example)
EN European Standard
f [MPa] flexural strength
Ff [N] maximum load applied to the specimen (flexural
strength test)
Fc [N] maximum load applied to the specimen (compressive
strength test)
φ angle with vertical direction
List of symbols and abbreviations
iii
g [m.s-2] gravity acceleration, g = 9.81 m.s-2
h [m] distance reached by water in the capillary
h0 [m] height of water above entrance pore
Δh/Δt [m.s-1] capillary absorption rate
i.e. id est (= that is)
l [mm] distance between the axes of the support rollers
L [m] length of the specimen
m0 [kg] mass of the empty vassel
m0 [kg] mass of the dry specimen
m1 [kg] mass of the empty container
m2 [kg] mass of the container and test specimen
m10 [kg] mass after 10 minutes
m90 [kg] mass after 90 minutes
mA [kg] mass of the empty pycnometer
mB [kg] mass of the pycnometer filled with distilled water
mC [kg] mass of the pycnometer filled with ethanol
mD [kg] mass of the specimen
mE [kg] mass of the pycnometer filled with ethanol and the
specimen
mfm [kg] mass of vassel with fresh mortar
mh1 [kg] mass of the saturated specimen after 48 hours weighed
hydrostatically
mh2 [kg] mass of the saturated surface dry specimen after vacuum
evacuation weighed hydrostatically
mSSD1 [kg] mass of the saturated surface dry specimen after 48 hours

List of symbols and abbreviations
iv
mSSD2 [kg] mass of the saturated surface dry specimen after vacuum
evacuation
n [Hz] fundamental frequency in longitudal mode of vibration
of the specimen
v [m.s-1] ultrasonic pulse velocity
η [Ns.m-2] water viscosity
OPC Ordinary Portland Cement
p48 [%] porosity after 48 hours, i.e. porosity easily accessible to
water
OHP2
[%] porosity accessible to water, i.e. open porosity
r [m] capillary radius
RH [%] relative humidity
ρ [kg.m-3] density of the material (dynamic modulus of elasticity
testing)
a [kg.m-3] apparent density
ρb [kg.m-3] bulk density of fresh mortar
[kg.m-3] distilled water density at 20 ºC, H2O = 998,2 kg.m-3
C [kg.m-3] density of ethanol at 20 ºC
ρl [kg.m-3] loose bulk density
ρp [kg.m-3] particle density determined
σ [N.m-1] surface tension of the water
T [s] pulse transit time
τ [h] time between two successive measurements (water
vapour permeability test)
Θ contact angle between water and the solid surface
OH 2

List of symbols and abbreviations
v
V [m3] capacity of the container
Vfm [m3] volume of fresh mortar
wt weight (percentage per weight)
WA [%] water absorption after vacuum evacuation
WA48 [%] water absorption after 48 hours

Table of contents
vi
Table of contents
1 INTRODUCTION .............................................................................................................. 1
2 THEORY .......................................................................................................................... 3
2.1 DEFINITION OF MORTAR .......................................................................................................... 3
2.2 MORTAR COMPOSITION .......................................................................................................... 5
2.2.1 Binders ....................................................................................................................... 6
2.2.1.1 Terminology on lime...................................................................................................... 6
2.2.2 Aggregate .................................................................................................................. 7
2.2.3 Water ......................................................................................................................... 8
2.2.4 Additives and admixtures .......................................................................................... 8
2.3 TYPES OF MORTAR .................................................................................................................. 9
2.3.1 Lime mortar ............................................................................................................... 9
2.3.1.1 Binder properties .......................................................................................................... 9
2.3.1.2 Hardening process ....................................................................................................... 10
2.3.2 Hydraulic mortars .................................................................................................... 12
2.3.2.1 Cement mortar ............................................................................................................ 13
2.3.2.1.1. Binder properties .................................................................................................... 14
2.3.2.1.2. Hardening process .................................................................................................. 16
2.3.2.2 Hydraulic lime mortar ................................................................................................. 17
2.3.2.2.1. Binder properties .................................................................................................... 17
2.3.2.2.2. Hardening process .................................................................................................. 18
2.3.2.3 Pozzolanic mortar ........................................................................................................ 18
2.4 DETERIORATION OF MORTARS ................................................................................................. 19
2.4.1 Physical deterioration .............................................................................................. 20
2.4.1.1 The effect of water ...................................................................................................... 20
2.4.1.2 The effect of salts ........................................................................................................ 20
2.4.2 Chemical (environmental) weathering .................................................................... 24
2.4.2.1 Degradation of lime mortars (4) ................................................................................... 25
2.4.2.2 Degradation of hydraulic mortars ............................................................................... 26
2.4.3 Biocorrosion ............................................................................................................. 27
2.5 NATURAL POLYMERS AS MORTAR ADMIXTURES ........................................................................... 27
Table of contents
vii
2.5.1 Overview of natural polymers ................................................................................. 27
2.5.2 Oils and fats ............................................................................................................. 30
2.5.2.1 The use of oils and fats as an admixtures to mortar in history ................................... 30
2.5.2.2 Chemistry and properties of oils and fats (45; 46; 47; 48) ................................................... 33
2.5.2.2.1. Drying-out of oils ..................................................................................................... 35
2.5.2.2.2. Oil films aging and degradation .............................................................................. 36
2.5.2.2.3. Reaction of oil in basic environment ...................................................................... 38
2.5.2.3 Studies on effect of oil on mortar ............................................................................... 38
3 EXPERIMENTAL PART .................................................................................................... 41
3.1 USED MATERIALS ................................................................................................................. 41
3.2 EXPERIMENTAL METHODS ...................................................................................................... 42
3.2.1 Materials characteristics ......................................................................................... 42
3.2.1.1 Determination of the particle density of binder ......................................................... 42
3.2.1.2 Determination of loose bulk density of dry binders and aggregate ........................... 43
3.2.1.3 Grain size distribution ................................................................................................. 43
3.2.1.4 Binder setting time determination .............................................................................. 43
3.2.2 Preparation of mortar mixtures............................................................................... 44
3.2.3 Properties of fresh mortars ...................................................................................... 45
3.2.3.1 Determination of water-binder ratio .......................................................................... 45
3.2.3.2 Determination of consistence ..................................................................................... 45
3.2.3.3 Bulk density determination ......................................................................................... 45
3.2.4 Samples preparation................................................................................................ 46
3.2.5 Properties of hardened mortars .............................................................................. 47
3.2.5.1 Flexural strength determination ................................................................................. 47
3.2.5.2 Compressive strength determination ......................................................................... 47
3.2.5.3 Dynamic modulus of elasticity determination ............................................................ 48
3.2.5.4 Determination of open porosity, apparent density, water absorption and pores
accessibility to water ..................................................................................................................... 49
3.2.5.5 Determining of drying rate .......................................................................................... 51
3.2.5.6 Pore size distribution ................................................................................................... 51
3.2.5.7 Capillary action ............................................................................................................ 52
3.2.5.8 Water contact angle .................................................................................................... 52
3.2.5.9 Water vapour permeability ......................................................................................... 53
Table of contents
viii
3.2.5.10 Defining the colour of binder pastes ........................................................................... 54
3.2.5.11 Resistance to salt crystallization cycles ....................................................................... 54
3.2.5.12 Resistance to freeze-thaw cycles ................................................................................ 55
3.2.6 Studying of linseed oil’s behaviour in mortar structure .......................................... 55
3.2.6.1 Observation of oil in mortar structure ........................................................................ 55
3.2.6.1.1. UV microscopy ........................................................................................................ 55
3.2.6.1.2. Scanning electron microscopy ................................................................................ 55
3.2.6.2 Studying of chemical changes of oil in a mortar and oil aging .................................... 56
4 RESULTS ....................................................................................................................... 57
4.1 BASIC CHARACTERISTICS OF MATERIALS USED ............................................................................. 57
4.2 SETTING TIME DETERMINATION ............................................................................................... 58
4.3 COMPOSITION AND PROPERTIES OF FRESH MORTARS ................................................................... 58
4.4 PROPERTIES OF HARDENED MORTARS ....................................................................................... 60
4.4.1 Mechanical properties ............................................................................................. 60
4.4.2 Apparent density, open porosity, water absorption and pores accessibility to
water............ .......................................................................................................................... 63
4.4.3 Drying rate ............................................................................................................... 65
4.4.4 Pore size distribution ............................................................................................... 65
4.4.5 Capillary action ........................................................................................................ 65
4.4.6 Contact angle ........................................................................................................... 66
4.4.7 Colour classification ................................................................................................. 67
4.4.8 Water vapour permeability ..................................................................................... 67
4.4.9 Durability ................................................................................................................. 68
4.4.9.1 Resistance to salt crystallization cycles ....................................................................... 68
4.4.9.2 Resistance to freeze-thaw cycles ................................................................................ 70
4.5 OBSERVATION OF OIL IN MORTAR STRUCTURE ............................................................................ 71
4.6 STUDYING OF CHEMICAL CHANGES OF OIL IN MORTAR AND OIL AGING ............................................. 71
5 DISCUSSION .................................................................................................................. 74
5.1 THE EFFECT OF LINSEED OIL ON THE PROPERTIES OF FRESH MORTARS .............................................. 74
5.2 THE EFFECT OF LINSEED OIL ON THE PROPERTIES OF HARDENED MORTARS ........................................ 75
5.2.1 The effect of linseed oil on the mechanical properties of mortars .......................... 75

Table of contents
ix
5.2.2 The effect of linseed oil on mortars´ porosity .......................................................... 80
5.2.3 Dispersion of oil in the mortar structure ................................................................. 83
5.2.4 The effect of linseed oil on capillary absorption ...................................................... 85
5.2.5 The effect of linseed oil on the rate of drying .......................................................... 96
5.2.6 The effect of linseed oil on mortars´ durability ....................................................... 97
6 CONCLUSIONS .............................................................................................................107
6.1 THE EFFECT OF THE ADDITION OF LINSEED OIL ON MORTARS PROPERTIES AND THE MECHANISM OF ITS
OPERATION .................................................................................................................................. 107
6.2 SUGGESTIONS FOR FURTHER RESEARCH ................................................................................... 109
7 REFERENCES ................................................................................................................111
8 ACKNOWLEDGEMENTS ................................................................................................118
List of tables
x
List of tables
Table 1: Clinker minerals and their chemical composition ...................................................... 15
Table 2: Chemical composition of clinker ................................................................................. 15
Table 3: Hydraulicity index of hydraulic limes ......................................................................... 17
Table 4: Compressive strength of hydraulic mortar after 28 days .......................................... 17
Table 5: The solubility of some salts and the relative humidity above their saturated
solutions .................................................................................................................................... 24
Table 6: Crystallization pressures of some compounds ........................................................... 24
Table 7: Recrystallization pressures of some salts ................................................................... 24
Table 8: The effect of natural organic additives on lime-based mortars ................................ 28
Table 9: Historical overview of using natural polymers as an additives to lime-based
mortars..................................................................................................................................... 29
Table 10: Some common fatty acids present in oils ................................................................ 33
Table 11: Composition of some oils .......................................................................................... 35
Table 12: Particle density and loose bulk density of the materials used ................................. 57
Table 13: Setting times ............................................................................................................. 58
Table 14: Composition of mortars ............................................................................................ 59
Table 15: Composition and properties of fresh mortar mixtures ............................................ 59
Table 16: Flexural strength ....................................................................................................... 61
Table 17: Comressive strength ................................................................................................. 62
Table 18: Dynamic modulus of elasticity .................................................................................. 63
Table 19: Apparent density, water absorption, porosity measured under varius conditions
and coefficient of pores´ accessibility to water ........................................................................ 64
Table 20: Apparent density, water absorption and opened porosity, mortars 1 year old ...... 64

List of tables
xi
Table 21: Coefficient of water (salt solution) absorption of mortars with different content of
linseed oil at different stages of curing .................................................................................... 65
Table 22: Contact angle on hardened binder pastes ................................................................ 66
Table 23: Munsell chart colour determination of hardened binder pastes ............................. 67
Table 24: Coefficient of water vapour permeability ................................................................ 67
Table 25: Resistance to NaCl crystallization cycles ................................................................... 68
Table 26: Beginning of deterioration due to NaCl crystallization cycles .................................. 69
Table 27: Resistance to Na2SO4 crystallization cycles............................................................... 69
Table 28: Beginning of deterioration due to Na2SO4 crystallization cycles .............................. 69
Table 29: Resistance to freeze-thaw cycles .............................................................................. 70
Table 30: Beginning of deterioratration due to the freeze-thaw cycles .................................. 71
Table 31: IR vibrational assignments of raw linseed oil ........................................................... 71
Table 32: EDX analysis of mortar specimens ............................................................................ 95
Table 33: EDX analysis of mortar specimens after twenty NaCl crystallization cycles
performed ............................................................................................................................... 100

List of figures
xii
List of figures
Figure 1: Scheme of lime mortar carbonation ......................................................................... 11
Figure 2: Compressive strength and pH development in mortar layer after 7 days of
carbonation .............................................................................................................................. 12
Figure 3: Decomposition of mortar-stone composite sample ................................................. 14
Figure 4: Hydration heat of cement.......................................................................................... 16
Figure 5: Damage due to salt crystallization (Prague, Czech Republic) .................................... 21
Figure 6: Salt efflorescence on a wall (Prague, Czech Republic) .............................................. 21
Figure 7: Example of masonry damaged due to the crystallization of salt on a frequent street
in Prague, Czech Republic, where NaCl is used as a de-icing agent in winter .......................... 23
Figure 8: Detachment of plaster due to the subflorescence .................................................... 23
Figure 9: Salt crystallization on naked masonry ....................................................................... 23
Figure 10: Structure of oil film and its degradation.................................................................. 37
Figure 11: Weight change of linseed and poppyseed oil films aged at 20°C in time .............. 38
Figure 12: Specimen for water vapour permeability test......................................................... 53
Figure 13: Grain size distribution of sand ................................................................................. 57
Figure 14: Grain size distribution of pozzolan .......................................................................... 57
Figure 15: Grain size distribution of brick dust ......................................................................... 57
Figure 16: FTIR-ATR analysis of binder-oil pastes ..................................................................... 72
Figure 17: Linseed oil and binder pastes spectras, 500-1000 cm-1 .......................................... 73
Figure 18: Compressive strength of mortars with 1% of linseed oil compared to unmodified
mortars at the age of 1 year ..................................................................................................... 75
Figure 19: Compressive strength of mortars with 1% of linseed oil compared to unmodified
mortars at the age of 3 months ................................................................................................ 75
Figure 20: Flexural strength of mortars with 1% of linseed oil tested at different ages .......... 76
List of figures
xiii
Figure 21: Dynamic modulus of elasticity of mortars with 1% oil addition.............................. 77
Figure 22: Changes of compressive strength with the addition of linseed oil ......................... 79
Figure 23: Changes of flexural strength with the addition of linseed oil ................................. 79
Figure 24: Rate of carbonation - phenolphthalein method ...................................................... 80
Figure 25: Pore size distribution of mortars with 3% addition of oil compared to unmodified
mortars...................................................................................................................................... 81
Figure 26: Avereage pore radius of mortars with 3% of oil compared to unmodified mortars81
Figure 27: Pore size distribution of mortars with 1% addition of oil compared to unmodified
mortars...................................................................................................................................... 82
Figure 28: Avereage pore radius of mortars with 1% of oil compared to unmodified mortars82
Figure 29: Water-binder ratio of mortars with different amount of oil ................................... 82
Figure 30: Open porosity of mortars with different amount of oil .......................................... 82
Figure 31: Changes of porosity in time ..................................................................................... 83
Figure 32: Pozzolanic mortar with 3% addition of linseed oil (code PO3), observed under UV
light ........................................................................................................................................... 84
Figure 33: Unmodified pozzolanic mortar (code P), observed under UV light ........................ 84
Figure 34: Fluorescence of oil-lime paste compared to lime without oil and lime with applied
oil drop ...................................................................................................................................... 85
Figure 35: Oil-lime paste compared to lime without oil and lime with applied oil drop,
observed under normal light .................................................................................................... 85
Figure 36: Capillarity of mortars cured for 1 month ................................................................. 86
Figure 37: Capillarity of mortars cured for 3 months ............................................................... 86
Figure 38: Capillarity of mortars cured for 1 year .................................................................... 86
Figure 39: Average reduction of the coefficient of liquid absorption ...................................... 87
Figure 40: Pore size distribution of mortars with 1% of oil compared to unmodified mortars
and the effect of pore ratio on capillary rise ............................................................................ 90
List of figures
xiv
Figure 41: Pore size distribution of hydrated lime mortars ..................................................... 91
Figure 42: Pore size distribution of hydraulic lime mortars ..................................................... 91
Figure 43: Pore size distribution of pozzolanic mortars ........................................................... 91
Figure 44: Pore size distribution of mortars with brick dust .................................................... 91
Figure 45: Pore size distribution of mortars with 5% of cement .............................................. 91
Figure 46: Pore size distributution of mortars with 10% of cement ........................................ 91
Figure 49: Hydrated lime mortar with 3% oil addition (code LO3) ........................................... 93
Figure 52: Hydraulic lime mortar with 1% oil addition (code HO3) .......................................... 93
Figure 54: Pozzolanic mortar with 3% oil addition (code PO3) ................................................ 93
Figure 55: Pozzolanic mortar with 3% oil addition (code PO3) ................................................ 93
Figure 47: Hydrated lime mortar (code L) ................................................................................ 93
Figure 48: Hydrated lime mortar with 1% oil addition (code LO1) ........................................... 93
Figure 50: Hydraulic lime mortar (code H) ............................................................................... 93
Figure 51: Hydraulic lime mortar with 1% oil addition (code HO1) .......................................... 93
Figure 53: Pozzolanic mortar (code P) ...................................................................................... 93
Figure 56: Big pore in the mortar with brick dust (code B) ...................................................... 94
Figure 57: Big pore in a brick dust mortar with 1% oil addition (code BO1) ............................. 94
Figure 59: Cement mortar (5% of cement) with 1% oil addition (code C2O1) ......................... 94
Figure 60: Cement mortar (10% of cement, code C2) .............................................................. 94
Figure 61: Cement mortar (10% of cement) with 1% oil addition (code C2O1) ....................... 94
Figure 58: Cement mortar (5% of cement, code C1) ................................................................ 94
Figure 62: Pores accessibility to water ..................................................................................... 95
Figure 63: Drying rate of mortars with 1% addition of linseed oil compared to unmodified
mortars...................................................................................................................................... 96
List of figures
xv
Figure 64: Resistence of 1 year old mortars to NaCl crystallization cycles – mortars with 1%
addition of oil compared to unmodified mortars .................................................................... 98
Figure 65: The damage pattern of unmodified mortars (codes P, B and C1) and mortars with
1% addition of linseed oil (codes BO1 and C1O1) ...................................................................... 99
Figure 66: Hydraulic lime mortar (code H) after twenty NaCl crystallization cycles performed
(SEM) ....................................................................................................................................... 100
Figure 67: Hydraulic lime mortar with 1% oil addition (code HO1) after twenty NaCl
crystallization cycles performed (SEM) .................................................................................. 100
Figure 68: Pozzolanic mortar (code P) after twenty NaCl crystallization cycles performed
(SEM) ....................................................................................................................................... 100
Figure 69: Pozzolanic mortar with 1% oil addition (code PO1) after twenty NaCl crystallization
cycles performed (SEM) .......................................................................................................... 100
Figure 70: Resistence of 1 month old mortars to NaCl crystallization cycles – mortars with 3%
addition of oil compared to unmodified mortars ................................................................... 101
Figure 72: State of the specimens of mortars with 3% addition of oil and unmodified mortars
after 25 NaCl crystallization cycles, tested after 1 month of curing ...................................... 102
Figure 71: Specimen after 6 hours of full immersion into a salt solution - solution penetration
only into depth of approx. 3 mm ............................................................................................ 102
Figure 73: Resistence of 1 year old mortars to Na2SO4 crystallization cycles – mortars with 1%
addition of oil compared to unmodified mortars ................................................................... 103
Figure 74: Resistence of 1 month old mortars to Na2SO4 crystallization cycles – mortars with
3% addition of oil compared to unmodified mortars ............................................................. 103
Figure 75: Specimens of hydrated lime and brick dust mortars in sodium sulphate solution -
specimens are hydrophobic, they lose surface powder layer ................................................ 103
Figure 76: Resistence of 1 year old mortars to freeze-thaw cycles – mortars with 1% addition
of oil compared to unmodified mortars ................................................................................. 104
Figure 77: Resistence of 1 month old mortars to freeze-thaw cycles – mortars with 3%
addition of oil compared to unmodified mortars ................................................................... 105

List of figures
xvi
Figure 78: Formation of crack due to freeze on the surface of a specimen (code C1O1) ...... 106
Figure 79: Surface scaling due to freeze-thaw cycling (sample BO3) ..................................... 106
Introduction
1
1 Introduction
The traditional lime mortar is composed of hydrated lime, sand and water. Besides
these constituents it may also contain additives aiming to improve fresh mortar´s workability
and/or to improve hardened mortars’ strength and durability.
The idea of improving mortar´s properties by using various additives is not new, but
something which has been known already by the first civilizations (1; 2). Lime-based mortars
used in ancient times were sometimes of poor quality; therefore masons were employing
various additives to reach desired properties. There are records that egg whites, bullock´s
blood, fruit juices, keratin and casein were used in Ancient Egypt (3; 4). Bitumen as an oldest
known natural organic additive was used already in Mesopotamia some 4000 years ago (5; 6;
7). Romans were known to use pozzolanic materials, which were giving hydraulic properties
to mortar, but these were not always available and cost was also a large factor (8).
Consequently locally available materials increased in use. Variety of substances of different
origin were used, such as local agroproducts (cereals, juices from trees, fruits and
vegetables), oils and fats, milk, eggs, but also blood, dung, urine or other materials like
animal hair. Although it looks that almost everything available went into mixes, there
seemed to be a method behind their madness (3). Unfortunately there is not much
information in literature about the technology of mortars preparation. This being their
livehood, masons were scared to write about the things they knew and often the knowledge
and experience were buried with them (6). On the other side we have legends of excellent
durability of some historic mortars, which has been accredited just to the use of natural
polymeric additives.
Nowadays it is quite complicated to analyze organic additives in historical mortars
since they were probably added in very small amounts which may be under the detection
limit of some analytical methods. Thus it is probable that most of the information of using
natural polymeric additives is based on the study of historical sources rather than on the
exact material analysis of preserved monuments (9). Among organic materials, linseed oil is
one of the most commonly used additive in past. It was used already in Roman period (1; 2) to
Introduction
2
reduce water permeability of a mortar. It was used especially in mortars for pavement to
increase their durability.
The motivations justifying the renewed interest in the use of natural polymeric
additives can be summarized as follows:
The only information we inherited from ancient treatises is that linseed oil was added
to decrease mortar´s water permeability. There are only few works studying the
effect of oil experimentally. The mechanism and the technology, e.g. effects of
different dosages, are not clearly explained.
Knowing the function of oil and purpose of its addition can help us to explain some
particular characteristics of historic mortars, which is important for designing a new
compatible repair mortar (10).
Lime-based mortars by itself are sometimes not meeting the requirements of certain
types of restoration interventions due to their little durability. On the other hand,
more durable cement mortars are not suitable for historical monuments restoration
because of their excessively high strength and sulphate content. The use of additives
seems to be a way to improve properties of lime-based mortars. Since the trends in
the restoration of historic monuments are to prefer the use of natural materials,
linseed oil can be a valid alternative to the synthetic additives. Furthermore, the
replacement of synthetic additives by natural ones can be an actual topic even out of
restoration field, using of linseed oil as a so called bio-admixture is in accordance
with the recent policy of sustainable development.
In this research linseed oil is has been added in different percentages, i.e. 1% and 3%
by the weight of binder, in order to study its influence on mortar´s properties systematically.
The research objectives of this thesis are:
To study linseed oil’s effect on the properties of lime-based mortars;
To experimentally verify the assumption that the addition of linseed oil is
increasing mortar´s resistance to deterioration;
To interpret and describe the mechanism of linseed oil’s action in mortars;
To develop a mortar with improved durability suitable for restoration.

Theory
3
2 Theory
2.1 DEFINITION OF MORTAR
A mortar can be defined as a mixture of one or more inorganic or organic binders,
mostly fine aggregates, water and sometimes additives and/or admixtures in the proportions
necessary to give to the mixture proper workability in the fresh state and adequate physical
and mechanical properties, outward aspect, durability etc, in the hardened state (11).
Mortar can be divided according to its use as either:
- bedding and jointing mortar – to bond masonry units (brick and/or stones)
together;
- plastering mortar – for external coating of masonry;
- rendering mortar – for internal application on masonry; or
- stucco – decoration mortar.
Ad Cowper (12) uses the term “mortar” for bedding and jointing mortar only:
“Mortar is defined as any material used in a plastic state which can be troweled, and
becomes hard in place, and which is utilized for bedding and jointing. The word “mortar” is
thus used without regard to the composition of the material, but simply defining its use as a
bonding material, and to distinguish it from “stuccos” and “plasters”. (12)
However standard EN 459-1/2001 (13) uses term “mortar” as a general term for all the
types of mortar mentioned above.
The primary functions of hardened bedding and jointing mortar in a construction
are (14):
To provide an even bed so that the load on the wall is distributed evenly over
the whole bearing area of the masonry units;
To bond the units together and help them resist lateral forces, and
To seal joints against the penetration of rain.
Theory
4
The main function of plastering and rendering mortar is to level walls surface asperity
and to protect the masonry against weathering. According to EN 459-1:2001 (13) rendering
and plastering mortars can be further divided
according to the concept as either:
- Designed mortars - mortar whose composition and manufacturing
method is chosen by the producer in order to achieve specified properties
(performance concept); or
- Prescribed mortars - mortar made in pre-determined proportions, the
properties of which are assumed from the stated proportion of the
constituents (recipe concept).
according to the mode of manufacture as either:
- Factory-made mortars - mortar batched and mixed in a factory. It may be
'dry mortar' which is ready mixed only requiring the addition of water, or
'wet mortar' which is supplied ready for use;
- Semi-finished factory mortars which can be either
o prebatched rendering/plastering mortar - mortar whose
constituents are wholly batched in a factory, supplied to the
building site and mixed there according to the manufacturer's
specification and conditions;
o premixed lime-sand rendering/plastering mortar - mortar whose
constituents are wholly batched and mixed in a plant, supplied to
the building site where further constituents specified or provided
by the factory are added (e.g. cement)); or
- Site-made mortars - mortar composed of individual constituents batched
and mixed on the building site.
according to the properties and/or use, as either:
- General purpose rendering/plastering mortar - rendering/plastering
mortar without special characteristics. It can be prescribed or designed;
- Lightweight rendering/plastering mortar - designed rendering/plastering
mortar with a dry hardened density below a prescribed figure;

Theory
5
- Coloured rendering mortar (designed rendering/plastering mortar
specially coloured, the colour is achieved e.g. with pigments or coloured
aggregates);
- One-coat rendering mortar for external use (designed rendering mortar
applied in one coat which fulfils all the functions of a multicoat system
used externally and which is usually specifically coloured. One coat
mortars for external use may be manufactured using normal and/or
lightweight aggregates);
- Renovation rendering/plastering mortar (designed rendering/plastering
mortar used on moist masonry walls containing water soluble salts. These
mortars have a high porosity and vapour permeability and reduced
capillary action);
- Thermal rendering/plastering insulating mortar (designed mortar with
specific insulating properties).
According to binder (or the combination of binders) used mortars can be divided as
either:
Clay (adobe) mortar;
Gypsum mortar;
Lime mortar;
Pozzolanic mortar;
Hydraulic lime mortar;
Portland cement mortar;
Mixed mortars (lime-clay, lime-gypsum, lime-cement...); or
Special mortars (water-proofing, desalination, WTA, thermo-isolating mortars...).
2.2 MORTAR COMPOSITION
Mortar is composed of a binder, aggregate, water and additives. Each component will
be described more in detail in the following chapters.
Theory
6
2.2.1 BINDERS
In general, the purpose of the binder is to hold the sand particles together and to fill
the voids in between the grains of sand (14).
Binders’ characteristics and hardening processes will be particularly described in
section 2.3.
2.2.1.1 TERMINOLOGY ON LIME
According to the standard EN 459-1 (13) on building lime following terms and
definitions apply:
Lime - material comprising any physical and chemical forms under which calcium
and/or magnesium oxide (CaO and MgO) and/or hydroxide (Ca(OH)2 and Mg(OH)2) can
appear.
Building limes - limes used in building construction and civil engineering. They are
either air limes or hydraulic limes.
Air limes - limes mainly consisting of calcium oxide or hydroxide, which slowly
harden in air by reacting with atmospheric carbon dioxide. Generally, they do
not harden under water as they have no hydraulic properties. They may be
either quicklimes or hydrated limes.
o Quicklimes (Q) - air limes mainly consisting of calcium oxide and
magnesium oxide produced by calcination of limestone and/or dolomite
rock. They have an exothermic reaction when in contact with water. They
are offered in varying sizes ranging from lumps to ground powder
materials. They include calcium limes and dolomitic limes.
o Hydrated limes (S) - calcium limes or dolomitic limes, resulting from the
controlled slaking of quicklimes. They are produced in the form of a dry
powder or putty or as a slurry (milk of lime).
o Calcium limes (CL) - limes mainly consisting of calcium oxide or calcium
hydroxide without any additions of hydraulic or pozzolanic materials.
Theory
7
o Dolomitic limes (DL) - limes mainly consisting of calcium oxide and
magnesium oxide or calcium hydroxide and magnesium hydroxide without
any additions of hydraulic or pozzolanic materials.
- Semi-hydrated dolomitic limes - hydrated dolomitic limes mainly
consisting of calcium hydroxide and magnesium oxide.
- Completely hydrated dolomitic limes - hydrated dolomitic limes
mainly consisting of calcium hydroxide and magnesium hydroxide.
Hydraulic limes (HL) limes mainly consisting of calcium hydroxide, calcium
silicates and calcium aluminates produced by mixing of suitable materials. They
have the property of setting and hardening under water. Atmospheric carbon
dioxide contributes to the hardening process.
o Natural hydraulic limes (NHL) - limes produced by burning of more or less
argillaceous or siliceous limestones with reduction to powder by slaking with
or without grinding. All NHL have the property of setting and hardening under
water. Atmospheric carbon dioxide contributes to the hardening process.
o Natural hydraulic limes with additional material (Z) - special products may
contain added suitable pozzolanic or hydraulic materials, up to 20 % by mass,
are additionally designated by "Z".
2.2.2 AGGREGATE
Aggregate forms the main mass of mortar, it is responsible for the mortar structure,
which plays a key role in the development of strength and permeability.
Sand is the most common aggregate in mortars. It can be either mined (river sand,
marine sand) or pit sand. Mined sand has rounded grains, usually poorly-graded and it
contains only little proportion of very fine particles. Mined sand is quite clean with little clay
impurities. Pit sand contains both spherical and angular grains and has wider grain size
distribution. Usually it contains some clay proportion (15). Soft sands with fine spherical grains
make weak mortars. Sharp sands with angular particles including some 3-4 mm grit produce
the strongest mortars (14).

Theory
8
An alternative to sand could be a grounded natural stone, which may be
advantageous for repair mortars in terms of compatibility to original stone.
The key characteristic of aggregate is the particle size distribution, i.e. proportion of
grains of different sizes. In order to prepare strong mortar it is essential to make enough
connection points between individual aggregate grains. The smaller are the grains, the
higher will be the binder consumption. If all the grains are of the same size, part of binder is
consumed to fill in the voids without increasing the final strength proportionally.
Consequently it is beneficial to fill the voids among big grains by smaller grains, thus the
binder consumption will be decreased, and so will be the porosity and water absorption of
the resulting mortar. (15)
2.2.3 WATER
The quality of water can affect the setting and strength of the mortar. Water should
not contain suspended solids, which add to the salt content, nor dissolved solids, which
might cause staining of the hardened mortar. Dissolved salts can be detrimental to the
durability of mortar and organic impurities can affect hardening and durability. Therefore
the potable water should be used in appropriate amount. (14) Mortar with too little water will
have bad workability; on the other hand too much water will decrease the mortar strength
by holding the grains apart thus leaving an open structure when dry (14; 16). This effect can be
dramatic. (14)
2.2.4 ADDITIVES AND ADMIXTURES
Additives and admixtures are added to a mortar to improve the plastic properties of
fresh mortar and/or to enhance the hardened mortar´s properties. They can be either
inorganic (e.g. pozzolanic materials) or organic, and either natural (e.g. linseed oil) or
synthetic, such is polymer dispersions, redispersible polymer powders, polymers soluble in
water, liquid resins or monomers. Inorganic materials added to mortar are mostly called
additives, they are added usually in concentration higher than 5% by the weight of binder,
while organic additions are usually called admixtures (less than 5% by the weight of
binder) (4). According to Lea´s chemistry of cement and concrete: “Admixtures should be
distinguished from additives and additions in that these materials are usually solids and are
Theory
9
added o the cement during its manufacture” (17). However, when speaking about natural
polymers added to historical mortars, the term “additive” is usually used, and so will be for
the purposes of this thesis.
Due to the topic of the thesis, only natural polymeric additives will be described in
detail, in the section 2.5.
2.3 TYPES OF MORTAR
2.3.1 LIME MORTAR
2.3.1.1 BINDER PROPERTIES
Lime is one of the oldest binding materials. In literature there are mentions that lime
was used in constructions dated back to 7000 B.C. (e.g. some buildings in today´s Syria) (18).
Based on identification analysis, use of lime is possible to date to the period of Ancient Egypt
where it was used together with gypsum for building the pyramids (4). Knowledge of lime
manufacture and use spread from Egypt to Mesopotamia and then to Greece, China and
Rome (4). First known treatises on lime are coming from this period; such is Vitruvius´ Ten
books on Architecture (1).
The basic raw material for lime manufacture is limestone. Limestone is a rock
containing mostly calcite, which is chemically calcium carbonate (CaCO3). Pure calcite is used
for calcium limes preparation. In nature, pure calcites are however rare, usually they contain
impurities such is clay minerals or dolomite (CaCO3.MgCO3); these calcites are used for
preparation of dolomitic lime. (12; 18; 15; 4)
Raw grounded limestone is burnt in lime-kilns. Chemical process involved consists
essentially in the dissociation by heat (around 900°C at normal pressure 101,3 kPa) of
calcium and magnesium carbonates according the equation:
CaCO3 CaO + CO2 (1)
Or alternatively,
CaCO3 .MgCO3 CaO + MgO + 2CO2 (2)
The speed of the reaction depends primarily on the reaction temperature and also on
thermal conductivity of the material and the removal of carbon dioxide. Obtained product is
Theory
10
called burned lime or quicklime. The temperature of burning defines lime microstructure,
which affects its activity, rate of slaking, efficiency and plasticity. Limes burned at lower
temperatures (up to 1050°C) have higher porosity and higher specific surface. Thus
hydration of this lime is fast and efficient in a short time. Limes burned at temperatures
higher than 1050°C have higher bulk density, lower porosity and thus smaller specific
surface. Their hydration is slower as it is determined by the rate of diffusion of water to not
hydrated lime. These limes are more likely to form lumps if not slaked well.
Lime slaking is in principle a hydration of calcium oxide:
CaO + H2O Ca(OH)2 + 1161 J.g-1 (8)
There are two ways of lime slaking differing in the amount of water added. By the
first way an excess amount of water is added to calcium oxide. Slaked lime prepared this way
need to be stored before its actual use to allow additional slaking of clustered grains of
calcium oxide and formation of hydro-gel of calcium hydroxide. Well tempered lime has
excellent plasticity and bonding properties (12). Already Vitruvius pointed out that the slaked
lime had to be stored for three years before its use to get lime of good quality (1). This way of
preparation when excess of water is used is called “wet way” and the product is lime-putty.
Another way of slaking of lime is a “dry way” when the amount of water only slightly higher
than the stoicheiometric amount is used. This way of preparation gives rise to coarse
particles of calcium hydroxide and hence the final product does not have as good rheological
properties as the lime prepared with the excess of water. However it does meet the
requirements of building industry satisfactorily (4).
2.3.1.2 HARDENING PROCESS
The process of hydrated lime hardening is composed of two phases, a physical
process and a slow chemical process called carbonation.
When fresh mortar is applied on masonry, firstly the excess water is absorbed by
substrate. Then starts the process of setting, which is in fact a colloidal shrinkage of fresh
mortar. In the process of mortar preparation, after blending lime and aggregate together
with water, particles of lime integrate with the particles of aggregate forming colloidal gel.
Important characteristic of this system is thixotropy (19), i.e. property of some non-newtonian
pseudoplastic fluids to show a time-dependent change in viscosity; the longer the fluid

Theory
11
undergoes shear stress, the lower its viscosity (20). Setting gives mortar the initial strength,
which enables mortar to hold together and prevents it to stream down. (19)
Second phase of lime mortar hardening is the actual carbonation, during which
insoluble calcium carbonate (solubility of CaCO3 is 1,3mg in 100g of water at 20°C)
crystallizes from supersaturated solution of calcium hydroxide. Crystallization starts on
coarse particles of aggregates, which serve as nuclei for formation of colloidal aggregations
(spheroliths). The ongoing chemical reaction can be expressed by following equation:
Ca(OH)2 + CO2 CaCO3 + H2O (9)
The rate of reaction is affecting the size of calcium carbonate crystals. The slower is
the reaction rate, the bigger will be the crystals precipitating, and consequently the bond
between binder and the grains of aggregate will be influenced. For lime mortar is
characteristic that it contracts considerably when drying due to the its colloidal character. It
is desirable that the colloidal shrinkage takes place soon after mortar application to limit
formation of micro-cracks in mortar structure (19).
The process of mortar carbonation is slow; the rate is dependent on the
concentration of carbon dioxide in the air and on the rate of evaporation of the reaction
water, hence on the relative humidity (RH) and temperature. If is RH<50% or RH>95%, the
reaction will takes place very slowly. At high relative humidity capillary condensation will
take place and pores will get filled by water, in consequence the diffusion of carbon dioxide
will be lowered approximately ten times. On the other hand, if RH is too low, carbon dioxide
cannot be transported into mortar, and the carbonation reaction will not take place either.
Figure 1: Scheme of lime mortar carbonation (4)
Theory
12
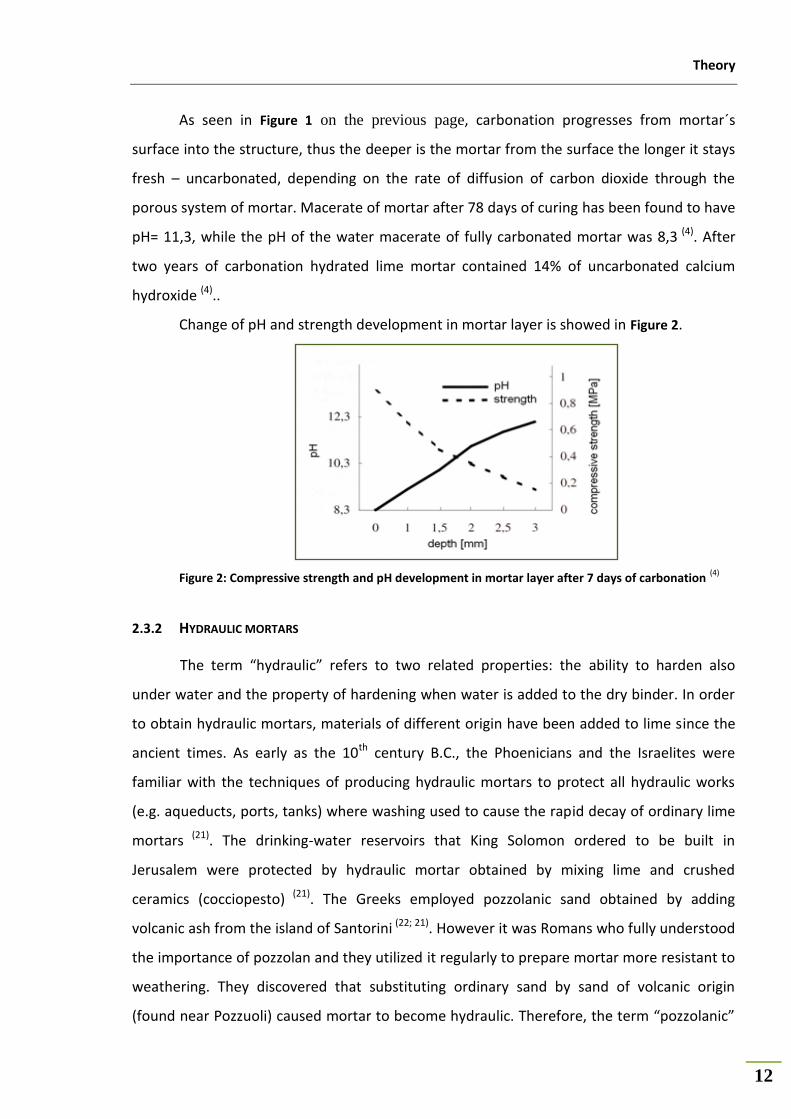
As seen in Figure 1 on the previous page, carbonation progresses from mortar´s
surface into the structure, thus the deeper is the mortar from the surface the longer it stays
fresh – uncarbonated, depending on the rate of diffusion of carbon dioxide through the
porous system of mortar. Macerate of mortar after 78 days of curing has been found to have
pH= 11,3, while the pH of the water macerate of fully carbonated mortar was 8,3 (4). After
two years of carbonation hydrated lime mortar contained 14% of uncarbonated calcium
hydroxide (4)..
Change of pH and strength development in mortar layer is showed in Figure 2.
Figure 2: Compressive strength and pH development in mortar layer after 7 days of carbonation (4)
2.3.2 HYDRAULIC MORTARS
The term “hydraulic” refers to two related properties: the ability to harden also
under water and the property of hardening when water is added to the dry binder. In order
to obtain hydraulic mortars, materials of different origin have been added to lime since the
ancient times. As early as the 10th century B.C., the Phoenicians and the Israelites were
familiar with the techniques of producing hydraulic mortars to protect all hydraulic works
(e.g. aqueducts, ports, tanks) where washing used to cause the rapid decay of ordinary lime
mortars (21). The drinking-water reservoirs that King Solomon ordered to be built in
Jerusalem were protected by hydraulic mortar obtained by mixing lime and crushed
ceramics (cocciopesto) (21). The Greeks employed pozzolanic sand obtained by adding
volcanic ash from the island of Santorini (22; 21). However it was Romans who fully understood
the importance of pozzolan and they utilized it regularly to prepare mortar more resistant to
weathering. They discovered that substituting ordinary sand by sand of volcanic origin
(found near Pozzuoli) caused mortar to become hydraulic. Therefore, the term “pozzolanic”

Theory
13
is used to refer to a type of sand which is able to make mortars hydraulic, although the
binder, i.e. lime, by itself is not hydraulic. (21)
Recognition of hydraulic lime, lime which is hydraulic by itself, without any additions,
was made not sooner than in 16th century by Italian architect Andrea Palladio (21). In 1756
Smeaton discovered the hydraulic reactions and he acknowledged that it is the clay presence
in limestone being responsible for the hydraulic properties. L.J. Vicat laid the foundation of
scientific knowledge on limestone based on chemical analysis (21). He sorted limestone
according to content of hydraulic oxides (SiO2, Al2O3 and Fe2O3) and came into conclusion
that only mortars containing these oxides are stable also under the water (23; 18).
In 1796, the discovery that hydraulic cement could be made by calcining nodules of
argillaceous limestone, known as septaria, found in certain Tertiary strata, was patented (24).
James Parker named the product obtained this way Roman cement, in a pamphlet entitled
Roman cement, artificial terras and stucco (1798) (24). Roman cement was in fact a strong
hydraulic lime, since the burning temperature did not exceed 1250°C (4).
In 1811 James Frost produced and patented cement which was made by calcining an
intimate mixture of chalk and clay, ground together in a wet mill. This process may be
regarded as the principal forerunner of the manufacture of Portland cement. (24; 4)
Among the numerous patents for hydraulic cements which appeared in the early 19th
century, Joseph Aspdin´s patent no. 5022 dated 21 October 1824 stands out in historic
importance to the others – Aspdin described his material called Portland cement. He chose
the name Portland to direct people´s attention to the resemblance of the colour and quality
of his cement to Portland limestone, which had at that time a high reputation for quality and
durability. (24) The following year Aspdin´s factory launched the first Portland cement into the
British market (4).
2.3.2.1 CEMENT MORTAR
Using of cement mortar for building restoration may cause severe problems. Cement
mortar reaches very high strengths (35-50 MPa, depending on the quality of cement and the
type and granulometry of aggregate (4)), far higher than lime mortar and some masonry
materials, and generally adheres very well to bricks and stones. For this reason, as
degradation progresses, it can even cause mechanical damage to original material, i.e.
Theory
14
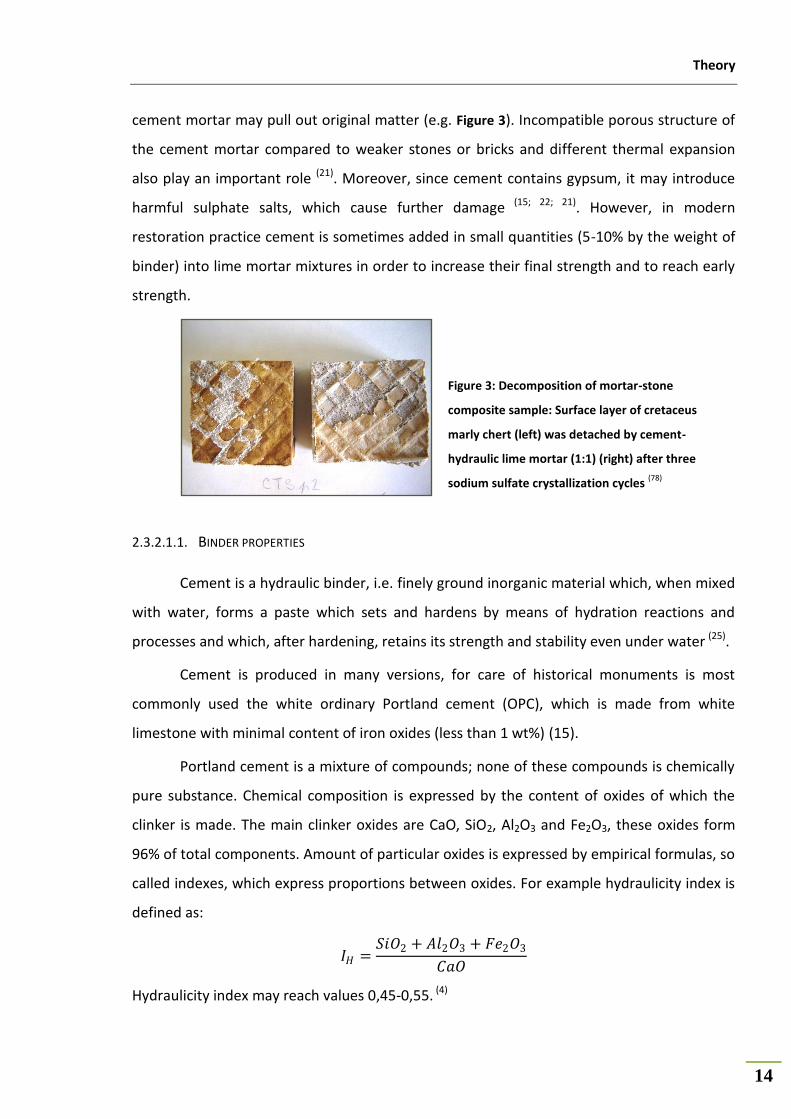
cement mortar may pull out original matter (e.g. Figure 3). Incompatible porous structure of
the cement mortar compared to weaker stones or bricks and different thermal expansion
also play an important role (21). Moreover, since cement contains gypsum, it may introduce
harmful sulphate salts, which cause further damage (15; 22; 21). However, in modern
restoration practice cement is sometimes added in small quantities (5-10% by the weight of
binder) into lime mortar mixtures in order to increase their final strength and to reach early
strength.
2.3.2.1.1. BINDER PROPERTIES
Cement is a hydraulic binder, i.e. finely ground inorganic material which, when mixed
with water, forms a paste which sets and hardens by means of hydration reactions and
processes and which, after hardening, retains its strength and stability even under water (25).
Cement is produced in many versions, for care of historical monuments is most
commonly used the white ordinary Portland cement (OPC), which is made from white
limestone with minimal content of iron oxides (less than 1 wt%) (15).
Portland cement is a mixture of compounds; none of these compounds is chemically
pure substance. Chemical composition is expressed by the content of oxides of which the
clinker is made. The main clinker oxides are CaO, SiO2, Al2O3 and Fe2O3, these oxides form
96% of total components. Amount of particular oxides is expressed by empirical formulas, so
called indexes, which express proportions between oxides. For example hydraulicity index is
defined as:
𝐼𝐻 =𝑆𝑖𝑂2 + 𝐴𝑙2𝑂3 + 𝐹𝑒2𝑂3
𝐶𝑎𝑂
Hydraulicity index may reach values 0,45-0,55. (4)
Figure 3: Decomposition of mortar-stone
composite sample: Surface layer of cretaceus
marly chert (left) was detached by cement-
hydraulic lime mortar (1:1) (right) after three
sodium sulfate crystallization cycles (78)

Theory
15
Portland cement clinker is made by sintering raw oxides, which transform to clinker
minerals, which are crystalline silicates, aluminates and ferrites (17; 4; 26).
Clinker mineral synthesis takes place at temperature over 1400°C, formation of minerals
continues also during cooling down of the clinker when the final form of minerals is
established. Clinker is then grounded together with gypsum, which is added as a setting rate
regulator. Clinker minerals make phases called alite, belite, aluminate and aluminoferrite. (17;
4; 26)
Following Table 1 gives overview of clinker minerals and their chemical composition
and Table 2 the resulting chemical composition. According to EN 197-1 “Portland cement
clinker shall consist of at least two-thirds by mass of calcium silicates, the remainder
consisting of aluminium and iron containing clinker phases and other compounds. The ratio
by mass (CaO)/(SiO2) shall be not less than 2,0. The content of magnesium oxide (MgO) shall
not exceed 5,0 % by mass.” (25)
Table 1: Clinker minerals and their chemical composition
Clinker phase Main phase name Abbreviation Chemical composition
alite Tricalcium silicate C3S 3CaO.SiO2
belite Dicalcium silicate C2S 2CaO.SiO2
aluminate Tricalcium aluminate C3A 3CaO.Al2O3
aluminoferrite Tetracalcium aluminoferrite C4AF 4CaO.Al2O3.Fe2O3
gypsum Calciumsulphate dihydrate - CaSO4·2H2O
Table 2: Chemical composition of clinker (27)
Oxide [wt%]
CaO 58-68
Al2O3 4-8
Fe2O3 2-5
SiO2 16-26
MgO 1-4
Na2O + K2O 0-0,6
SO3 0,1-2,5

Theory
16
2.3.2.1.2. HARDENING PROCESS
When the cement is mixed with water, the hydration of individual clinker minerals
starts. The main product is hydrosilicate gel (C-S-H phase), which defines most of the
properties. The process of hydration can be divided into several phases. During the initial
hydrolysis calcium, sodium and potassium sulphates dissolve in water. Calcium hydroxide is
being dissolved until supersaturated solution has occured. On the surface of the grains the
ettringite is formed, which is slowing down the setting process. After the dwell period which
is lasting few hours, the hydration of clinker minerals initiates, giving rise to hydrosilicate
phase (C-S-H phase). Incurred C-S-H phase gradually connects individual cement grains, thus
cement phase loses its plasticity and the mortar hardens. In the last phase the hydration rate
decreases. The hardening rate is determined by the rate of water diffusion into so far
unhydrated cement grains. After 28 days 70-90% of the mass of cement is hydrated and the
incurred hardened cement mortar is practically insoluble in water. The process of cement
hydration is possible to be monitored by measuring the development of hydration heat in
time (see Figure 4).
Figure 4: Hydration heat of cement

Theory
17
2.3.2.2 HYDRAULIC LIME MORTAR
2.3.2.2.1. BINDER PROPERTIES
Hydraulic lime lies in terms of its properties and composition in between hydrated
lime and cement. Contrary to hydrated lime, hydraulic lime contains also hydraulic oxides,
which enables it, after initial hardening, to harden even under water. Among hydraulic
oxides belong SiO2, Al2O3 and Fe2O3, which hydrate to form in water insoluble calcium
silicates and aluminates (14). Strongly hydraulic lime contains more than 15% of hydraulic
components (4). Hydraulic properties can by characterized by hydraulicity index, which is
defined as (22):
𝐼𝐻 =𝑆𝑖𝑂2 + 𝐴𝑙2𝑂3 + 𝐹𝑒2𝑂3
𝐶𝑎𝑂
According to the value of the hydraulicity index, hydraulic limes can be divided as follows:
Table 3: Hydraulicity index of hydraulic limes (4)
Lime Hydraulicity index IH
Faintly hydraulic 0,11-0,17
Medium hydraulic 0,17-0,33
Strongly hydraulic 0,33-0,59
According to EN 459-1 (13) hydraulic limes are sorted according to their compressive strength
reached after 28 days of curing Table 4:
Table 4: Compressive strength of hydraulic mortar after 28 days (22)
Hydraulic lime class Compressive strength [MPa]
HL 2 2-5
HL 3,5 3,5-10
HL 5 5-15
Hydraulic lime is produced by burning of marl or marlaceus limestone at temperature
900-1100°C. The temperature needed is dependent on the content of clay and dolomitic
admixtures - the higher is its content, the lower burning temperature. During the burning
Theory
18
CaCO3 and MgCO3 (if present) decomposes, followed by reaction of CaO (and MgO) with clay
and siliceous components. The final product contains free CaO, belite (C2S), aluminate (C3A),
ferrite (C2F), aluminoferrite (C4AF). Further eventually CaO.MgO.SiO2 phase rises from a part
of free MgO. Contrary to cement, hydraulic lime does not contain alite (C3S), due to the
reason that the burning temperature is lower than the temperature of its formation
(1250°C). (4; 14)
2.3.2.2.2. HARDENING PROCESS
During hardening process of hydraulic lime mortar, firstly the physical-chemical
processes ongoing during setting and hardening of the hydrated lime mortar are taking place
(see 2.3.1.2) and secondly processes related to hydration of hydraulic components similar to
cement hardening (see 2.3.2.1.2). First calcium and magnesium hydroxides are formed out
of the free calcium and magnesium oxides, if the magnesium oxides are present, and then by
carbonation calcium and magnesium hydroxides give rise to CaCO3 (MgCO3). The hydraulic
components give rise to formation of C-S-H phases. (14; 4)
Hydraulic lime is a slowly hardening binder. Depending on the content of free CaO,
the initial setting time is in 0,5-2 hours from mixing the dry constituents with water, and the
setting and hardening process lasts for 8-16 hours (4).
Hydraulic mortars have due to their different mineralogical composition, and thus
hardening process, different properties than hydrated lime mortars. Porosity of hydraulic
mortars is lower than that of hydrated lime mortars, and they may reach higher mechanical
strength. Hydraulic lime mortars have better adhesion to substrate comparing to hydrated
limes. On the other hand, fresh hydraulic lime mortar has lower plasticity than hydrated lime
mortar. (14; 22; 21)
2.3.2.3 POZZOLANIC MORTAR
Pozzolanic mortar is a lime mortar with pozzolanic additions, which give mortar
hydraulic properties. Pozzolans consist essentially of silicon dioxide (SiO2) and often also
aluminium oxide (Al2O3), which thanks to their amorphous, vitreous state and high specific
surface area react with lime (21; 26; 28).

Theory
19
The traditional pozzolans can be divided
according their origin as:
- Natural (only natural pozzolans from Pozzuoli in Italy can be called
“pozzolana” (14)), which can be either:
o Volcanic origin, or
o Sedimentary rocks; or
- Artificial (obtained from chamotte, brick dust (cocciopesto mortar). (4)
according their composition – containing amorphous silicon oxide, silicates,
aluminates, ferrites.
Pozzolans do not harden themselves when mixed with water but, when finely ground
and in presence of water, they react at normal ambient temperature with dissolved calcium
hydroxide to form strength-developing calcium silicate and calciumaluminate hydrates, very
similar to those formed in the hardening of hydraulic materials (14; 29; 26). These compounds
have the binding ability; they make strong connection between aggregate grains and are
stable under water and resistant to acids.
Pozzolans´ ability to react with calcium hydroxide in water is called pozzolanic activity
(14; 4). The pozzolanic reaction is determined by the chemical and mineral composition of the
pozzolan, its specific surface and the conditions of the reaction including water-binder ratio
and curing time and temperature (30; 31). Fine pozzolan having high specific surface should be
therefore considered as a part of the binder. Coarse pozzolan, often porous, can be used to
improve the permeability of the mortar and is then treated as a part of the aggregate (14).
2.4 DETERIORATION OF MORTARS
Materials´ deterioration is a set of natural phenomena, which lead to change of
mechanical, physical and chemical characteristics as well as to the change of appearance.
According factors affecting the causing the damage it can be divided into three main
categories: physical deterioration, chemical deterioration and biological deterioration.

Theory
20
2.4.1 PHYSICAL DETERIORATION
The main characteristic of physical deterioration is mechanical damage caused most
commonly by the effects of water, temperature changes, salt crystallization, wind flow or
mechanical stress to the object.
2.4.1.1 THE EFFECT OF WATER
The presence of water is necessary for the run of chemical reactions, water dissolves
and transports soluble salts and it supports living and action of living organisms. Rain water
flowing over surface causes erosion. (15)
Water can get into structure in form of rain water (rain, melting snow or fog), rising
from wrong isolated object foundation, water spray carried by wind from big water areas,
condensed water or water which got into object during its cleaning or restoration. Water is
usually not pure but in a form of salt or gas solutions (so called acid rains). Water present
inside mortar structure may cause frost damage. Water increases its volume by 10% when
transformed from liquid to solid state, causing pore systems damage, which may result in
formation of fissures and cracks in mortar. The change of water state happens repeatedly as
the temperature fluctuates around the water freezing point. Micro-cracks formed in
previous freeze-thaw cycles allow water to be absorbed deeper and the damage keeps
increasing (15; 4). In Central Europe, over 30 freeze-thaw cycles may occur per year (32).
2.4.1.2 THE EFFECT OF SALTS
“I observed ... that salt exuded from the soil to such an extent as even to injure the
pyramids.”
- Herodotus (484 B.C.-425 B.C.), History, Book 2 (from A.E.Charola (33)
)
Salts can originate from various sources: air pollution, de-icing salts, soil, sea spray,
inappropriate treatments or interaction between building materials. Some materials may
even contain salts inherently, for example Portland cement usually contains sulphates. (4; 33)
Salts can enter mortar or porous bodies in general only when dissolved in water.
Water can enter either as a liquid or vapour. In the liquid state, two mechanisms can be
operative (33):
Theory
21
Capillarity rise of groundwater – it is a result of the attraction of water and
capillary material,
Infiltration of rain water – requires a hydrostatic pressure and depends on the
permeability of the material.
In the vapour state, water can enter through two main mechanisms (33):
Condensation, of which there two types:
- Surface condensation
- Capillary condensation in pores
Hygroscopicity – ability of some salts to absorb or attract moisture
Once inside the porous material, water moves through capillarity mechanism, if it is
in a liquid state. When in a vapour state, transport mechanism relies on diffusion, if the
water vapour is not retained by hygroscopicity. Water movement is dependent on materials
porosity, pore-size distribution and environmental conditions. (33)
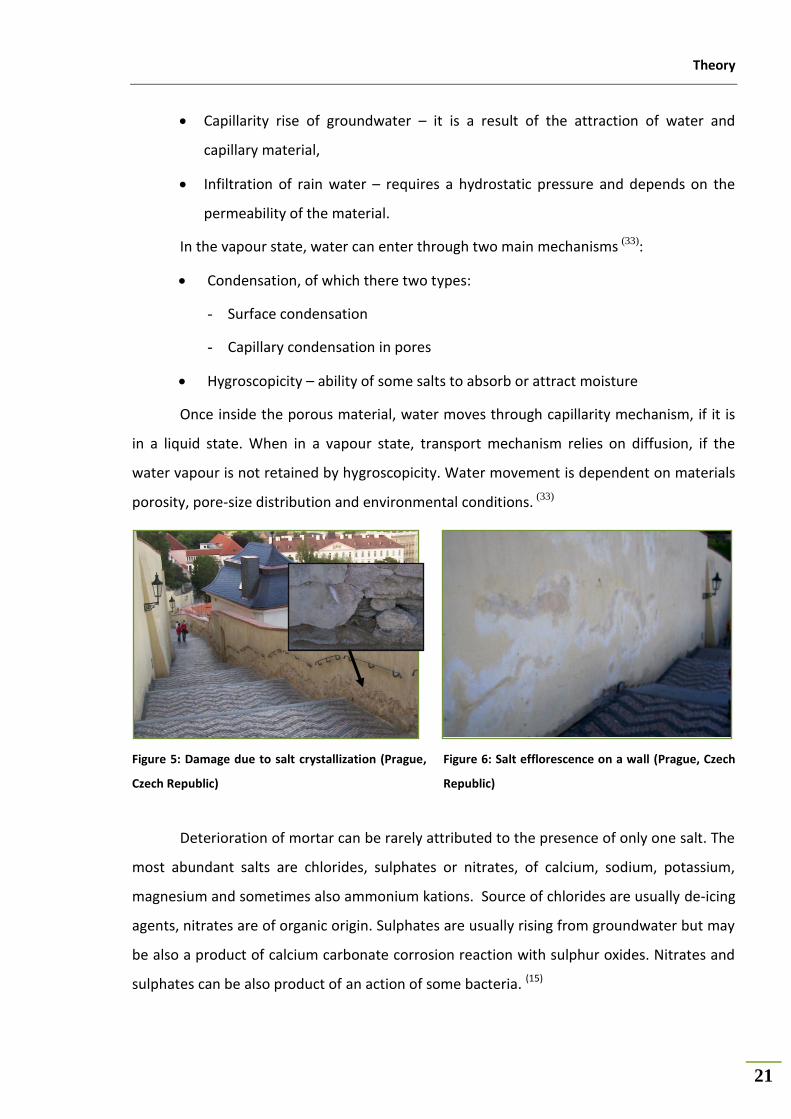
Figure 5: Damage due to salt crystallization (Prague,
Czech Republic)
Figure 6: Salt efflorescence on a wall (Prague, Czech
Republic)
Deterioration of mortar can be rarely attributed to the presence of only one salt. The
most abundant salts are chlorides, sulphates or nitrates, of calcium, sodium, potassium,
magnesium and sometimes also ammonium kations. Source of chlorides are usually de-icing
agents, nitrates are of organic origin. Sulphates are usually rising from groundwater but may
be also a product of calcium carbonate corrosion reaction with sulphur oxides. Nitrates and
sulphates can be also product of an action of some bacteria. (15)
Theory
22
Salt action in pores is strongly related of the amount of crystalline water they contain
(Table 5). Anhydrites (NaCl, KCl, K2SO4 and others) are very well soluble and movable in water
solution, thus they can get easily deep into mortar. When crystallizing they develop
crystallization pressure having effect on surrounding material (Table 6). Into second group
belong salts which crystals contain crystalline water (CaSO4.2H2O, MgSO4.7H2O,
Na2SO4.2H2O etc.). These salts may lose crystalline water with the decrease of relative
humidity in the air, forming anhydrite form, and with the increasing humidity they
recrystallize. Recrystallization is accompanied with the development of hydration pressures
(Table 7). These pressures are first compensated by the porous system of the material but
when exceeding the mechanical strength of the material they cause damage. Another group
are salts which seldom crystallize. These salts are hygroscopical, they can easily absorb water
from the air, thus causing long-term wetness of the material. (15; 4)
In an object which is in contact with groundwater, salt solution is transported by
capillary rise into the building material and moves up towards to the surface. As water
evaporates, the concentration of salts in the solution increases, and finally salts precipitate.
The place where salts precipitate is determined by the balance between the evaporation
rate and the supply of salts into the structure. If the evaporation is slower than the salt
solution supply, salts precipitate on building surface, forming so-called efflorescence (Figure
6). Efflorescence doesn´t cause mechanical damage of material, but the salt crystallization on
surface can be considered a visual damage. If the evaporation rate predominates the supply
of the salt solution from the material, crystallization take place inside the matter causing
damage to the material. The most harmful is subflorescence, which takes place when the
evaporation rate and the supply of the salt solution are in an approximate equilibrium and
salts crystallize beneath the surface, which may lead to bulging, scaling and spalling of the
whole outer layer, causing serious damage to the material (Figure 5). After exposure of a new
surface the whole process may repeat. Examples of damage due to the salt crystallization
are showed in Figure 7-9.

Theory
23
Figure 7: Example of masonry damaged due to
the crystallization of salt on a frequent street
in Prague, Czech Republic, where NaCl is used
as a de-icing agent in winter
Figure 8: Detachment of plaster due to the
subflorescence
Figure 9: Salt crystallization on naked masonry
Barbara Lubelli in her Ph.D. thesis (34) showed that the presence of salts (NaCl, KCl,
NaNO3 tested) in a material changes its hygric behaviour (i.e. dilation and shrinkage
depending on relative humidity changes) completely and thus that damage in a salt
contaminated material may originate from the shear stresses developed between areas
containing different amounts of salts. In a not contaminated material dilation can be
observed as RH increases and vice versa. In a salt loaded material dilation occurs during the
drying phase of RH cycle, when salts crystallize, whereas shrinkage occurs during dissolution
of the salts. Salt crystallizing in a form of a layer on the pore walls is able to transform
stresses to the pore walls as it crystallizes and thus causing dilation of the material, leading
to damage (34).
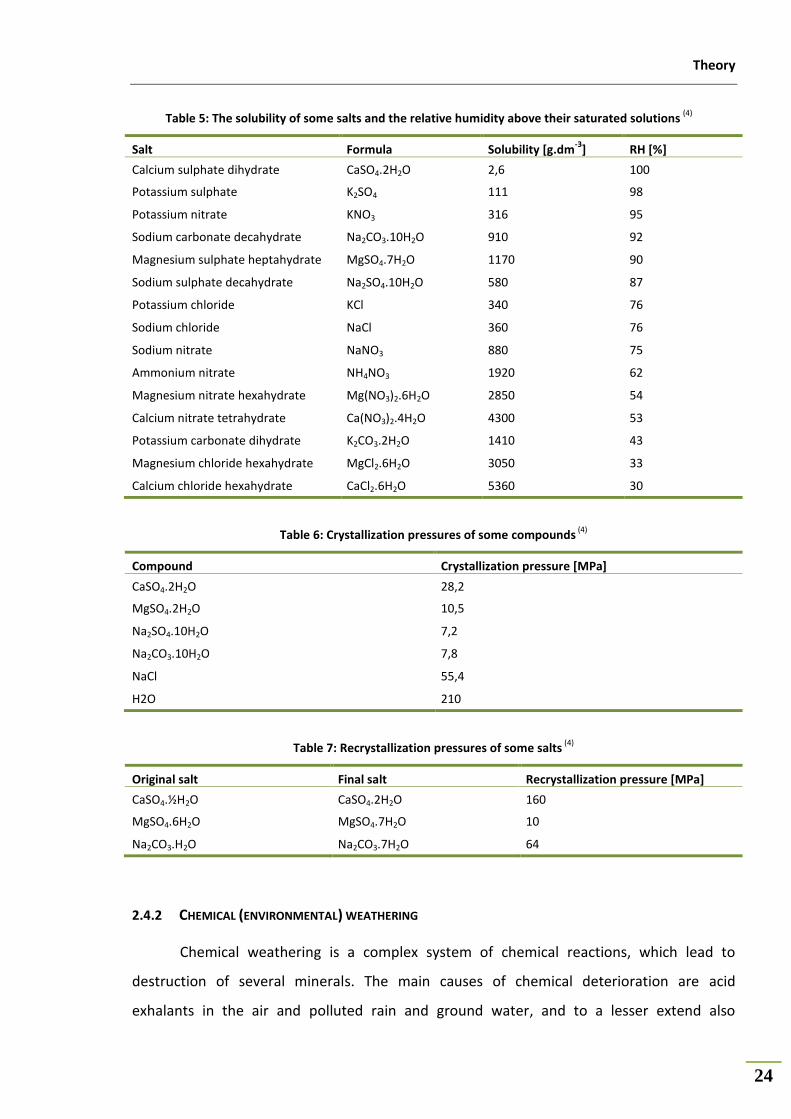
Theory
24
Table 5: The solubility of some salts and the relative humidity above their saturated solutions (4)
Salt Formula Solubility [g.dm-3
] RH [%]
Calcium sulphate dihydrate CaSO4.2H2O 2,6 100
Potassium sulphate K2SO4 111 98
Potassium nitrate KNO3 316 95
Sodium carbonate decahydrate Na2CO3.10H2O 910 92
Magnesium sulphate heptahydrate MgSO4.7H2O 1170 90
Sodium sulphate decahydrate Na2SO4.10H2O 580 87
Potassium chloride KCl 340 76
Sodium chloride NaCl 360 76
Sodium nitrate NaNO3 880 75
Ammonium nitrate NH4NO3 1920 62
Magnesium nitrate hexahydrate Mg(NO3)2.6H2O 2850 54
Calcium nitrate tetrahydrate Ca(NO3)2.4H2O 4300 53
Potassium carbonate dihydrate K2CO3.2H2O 1410 43
Magnesium chloride hexahydrate MgCl2.6H2O 3050 33
Calcium chloride hexahydrate CaCl2.6H2O 5360 30
Table 6: Crystallization pressures of some compounds (4)
Compound Crystallization pressure [MPa]
CaSO4.2H2O 28,2
MgSO4.2H2O 10,5
Na2SO4.10H2O 7,2
Na2CO3.10H2O 7,8
NaCl 55,4
H2O 210
Table 7: Recrystallization pressures of some salts (4)
Original salt Final salt Recrystallization pressure [MPa]
CaSO4.½H2O CaSO4.2H2O 160
MgSO4.6H2O MgSO4.7H2O 10
Na2CO3.H2O Na2CO3.7H2O 64
2.4.2 CHEMICAL (ENVIRONMENTAL) WEATHERING
Chemical weathering is a complex system of chemical reactions, which lead to
destruction of several minerals. The main causes of chemical deterioration are acid
exhalants in the air and polluted rain and ground water, and to a lesser extend also

Theory
25
chemically active substances which may be formed as products of living organisms. The basic
condition for chemical weathering is the presence of water. The main agents causing
chemical weathering are sulphur, nitrogen, carbon oxides and ammonium compounds.
Oxides and other gaseous exhalants are washed out from air by rain or fog to produce much
diluted solutions of inorganic acids, so called acid rains (15). The main damage product
resulting from interaction between atmosphere and building materials is gypsum
(CaSO4.2H2O), which can be either washed away due to its greater solubility, or be deposited
in the material´s structure (21).
2.4.2.1 DEGRADATION OF LIME MORTARS (4)
The main product of hardening of lime mortar is calcium carbonate (as described in
2.3.1.2), which is almost insoluble in water, its solubility is 1,4 mg in 100 g water at 25°C,
however it has a very low resistance to action of atmospheric acid gases. Due to their effect
the binder decomposes, forming usually more soluble products and these can be washed
away by rainwater. By this way mortar loses binder and when the limit of cohesion is
exceeded, the mortar disintegrates. Calcium carbonate may be decomposed by reaction (4)
with aggressive carbon dioxide, which may be dissolved in rainwater, giving
rise to soluble calcium hydrogen-carbonate:
CaCO3 + CO2 + H2O Ca2+ + 2HCO3-
Reaction is reversible; under suitable conditions hydrogen-carbonate anion
may decompose forming insoluble carbonate anion.
With sulphur oxides in presence of humidity forming calcium sulphite, which
further oxidises to form calcium sulphate:
CaCO3 + SO2 + ½O2 + 2H2O CaSO4.2H2O + CO2, or
CaCO3 + SO3 + 2H2O CaSO4.2H2O + CO2
The gypsum formed is of high molar volume and under appropriate humid
condition may crystallize forming large crystals. The process is accompanied
by development of high pressures on pores´ walls, which may result in
mortar´s degradation.
Theory
26
With nitrogen oxides in presence of water giving rise mostly to nitric acid,
which reacts with calcium carbonate according to the following equation:
CaCO3 + 2HNO3 Ca(NO3)2 + CO2 + H2O
Well soluble calcium nitrate is formed (solubility 127 g in 100 g water at 20°C),
which may by washed out from mortar by rainwater.
2.4.2.2 DEGRADATION OF HYDRAULIC MORTARS
The main products of hydraulic mortars hardening are C-S-H gels and hydrated
calcium aluminates. These compounds are formed both in hydraulic lime mortars and
hydrated lime mortars with hydraulic additions. Hydraulic binders are damaged mostly due
to the effect of acid compounds present in the air. Generally degradation process is similar
for all types of hydraulic binders, with the exception of cement and pure hydraulic lime
containing quicklime (CaO), which degradates preferentially, giving rise to calcium hydroxide
(Ca(OH)2). In mortars whose binder is composed of both lime and hydraulic products,
degradation initially runs the same way as in the lime mortars, followed by process related
to the degradation of hydraulic products. (4)
The main product of environmental deterioration is gypsum. In case of hydraulic
mortars the presence of gypsum may lead to two damaging expansive reactions to take
place (21):
Ettringite formation
3(CaSO4.2H2O) + 3CaO.Al2O3.6H2O + 20H2O 3CaO.Al2O3.3CaSO4.32H2O
Ettringite is produced at three possible situations:
1. In first hours of binder hardening process, in this case it is not dangerous,
because mortar is still in a plastic state so the expansion will not cause any
damage. Usually all sulphate present in mortar is consumed.
2. Secondary ettringite – if new sulphate interacts with the calcium aluminates
hydrates from the binder paste.
3. Delayed ettringite – produced in precast elements (cured in hydrothermal
condition, i.e. 60°C and 95%RH), when sulphates plus water are present in
the mortar.
Theory
27
Both secondary and delayed ettringite formation processes, which are highly
expansive, lead to the total destruction of the material.
Thaumasite formation (at low temperatures)
CaSO4.2H2O + CaCO3 + CaSiO3.H2O + 12H2O CaSiO3.CaSO4.CaCO3.15H2O
Thaumasite formation implies the destruction by CO2 and sulphate attack of
C-S-H gel, which is the main constituent of hydraulic binder paste. (21)
2.4.3 BIOCORROSION
Mortars can be damaged also by the action of living organisms, such is bacteria,
fungi, algae, mosses, lichens and also plants and animals. Besides the esthetical damages,
organisms damage mortar mostly mechanically. For example lichens hyphae and plant´s
roots cause mechanical stress, which may lead to the destruction of a material, by its growth
or by the change of water content in its fibbers. Organisms also produce various compounds
causing chemical deterioration. Sulphur bacteria oxidize compounds forming sulphurous
acid; even 5% solution can be formed. Fungi, algae and mosses produce organic acids which
cause deterioration of calcium carbonate.
2.5 NATURAL POLYMERS AS MORTAR ADMIXTURES
2.5.1 OVERVIEW OF NATURAL POLYMERS
Natural polymeric additives used for modification of lime-based mortars can be
sorted into several groups according to various criteria. According to their origin as natural
and synthetic additives, according to chemical composition as an organic and inorganic, and
according to their effect on the properties of lime-based mortars as additives:
Increasing strength and durability,
Setting time regulators,
Plasticizers,
Aerating agents,
Reinforcing fibrous additives,
Water-proofing additives. (9)
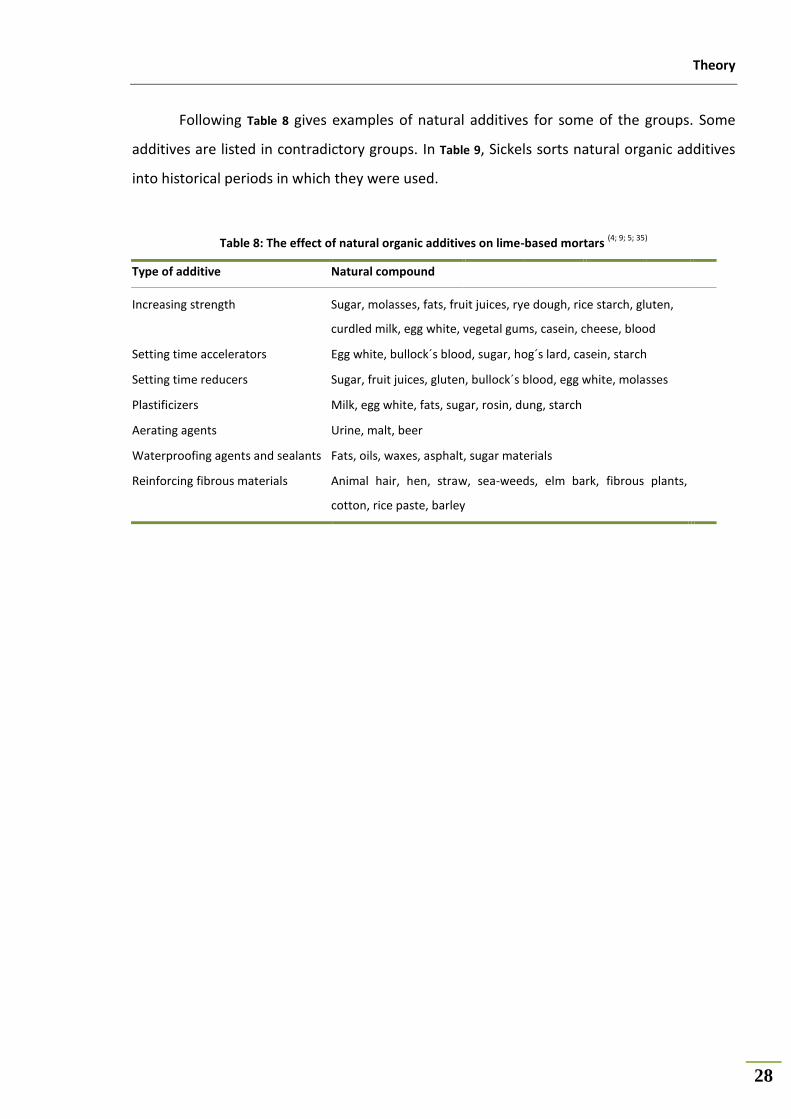
Theory
28
Following Table 8 gives examples of natural additives for some of the groups. Some
additives are listed in contradictory groups. In Table 9, Sickels sorts natural organic additives
into historical periods in which they were used.
Table 8: The effect of natural organic additives on lime-based mortars (4; 9; 5; 35)
Type of additive Natural compound
Increasing strength Sugar, molasses, fats, fruit juices, rye dough, rice starch, gluten,
curdled milk, egg white, vegetal gums, casein, cheese, blood
Setting time accelerators Egg white, bullock´s blood, sugar, hog´s lard, casein, starch
Setting time reducers Sugar, fruit juices, gluten, bullock´s blood, egg white, molasses
Plastificizers Milk, egg white, fats, sugar, rosin, dung, starch
Aerating agents Urine, malt, beer
Waterproofing agents and sealants Fats, oils, waxes, asphalt, sugar materials
Reinforcing fibrous materials Animal hair, hen, straw, sea-weeds, elm bark, fibrous plants,
cotton, rice paste, barley
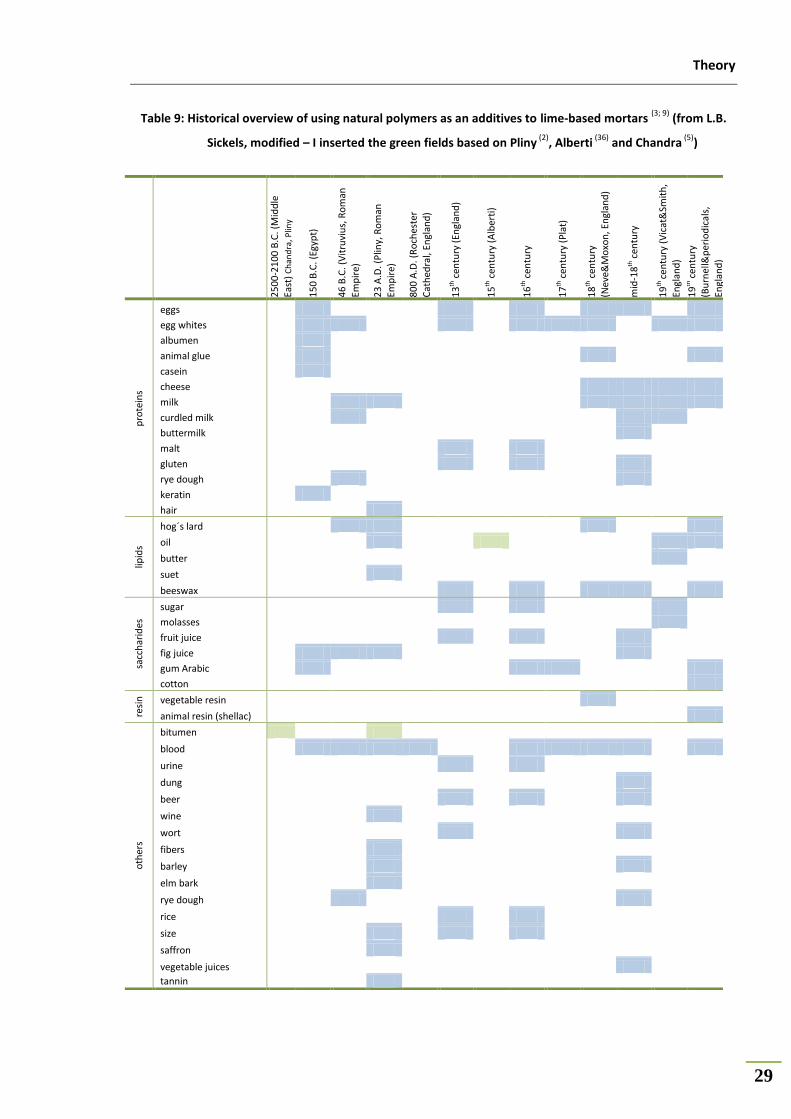
Theory
29
Table 9: Historical overview of using natural polymers as an additives to lime-based mortars (3; 9)
(from L.B.
Sickels, modified – I inserted the green fields based on Pliny (2)
, Alberti (36)
and Chandra (5)
)
25
00
-21
00
B.C
. (M
idd
le
East
) C
han
dra
, Plin
y
15
0 B
.C. (
Egyp
t)
46
B.C
. (V
itru
viu
s, R
om
an
Emp
ire)
23
A.D
. (P
liny,
Ro
man
Em
pir
e)
80
0 A
.D. (
Ro
ches
ter
Cat
hed
ral,
Engl
and
)
13
th c
entu
ry (
Engl
and
)
15
th c
entu
ry (
Alb
erti
)
16
th c
entu
ry
17
th c
entu
ry (
Pla
t)
18
th c
entu
ry
(Nev
e&M
oxo
n, E
ngl
and
)
mid
-18
th c
entu
ry
19
th ce
ntu
ry (
Vic
at&
Smit
h,
Engl
and
)
19
th c
entu
ry
(Bu
rnel
l&p
erio
dic
als,
Engl
and
)
pro
tein
s
eggs
egg whites
albumen
animal glue
casein
cheese
milk
curdled milk
buttermilk
malt
gluten
rye dough
keratin
hair
lipid
s
hog´s lard
oil
butter
suet
beeswax
sacc
har
ides
sugar
molasses
fruit juice
fig juice
gum Arabic
cotton
resi
n
vegetable resin
animal resin (shellac)
oth
ers
bitumen
blood
urine
dung
beer
wine
wort
fibers
barley
elm bark
rye dough
rice
size
saffron
vegetable juices
tannin
Theory
30
2.5.2 OILS AND FATS
Both oils (linseed oil) and fats (hog´s lard, butter) were used for the preparation of
mortar. Oils and fats belong to the chemically same group of compounds - lipids; they differ
in that oils are liquid at room temperature and fats are solid (37). They were added into
mortars in order to make them hydrophobic and consequently more durable against
deterioration. Such mortars were used especially for pavements and in areas suffering
higher contact with water and humidity, e.g. baths (36).
2.5.2.1 THE USE OF OILS AND FATS AS AN ADMIXTURES TO MORTAR IN HISTORY
While there are quite a lot of information in literature on using natural admixtures
such is proteins, saccharides and others (2; 38; 12; 39; 19; 40), information about linseed oil and oils
and fats in general are very rare. Oils and fats are more commonly mentioned as a protective
coat applied on a hardened mortar (41; 19; 42).
Marcus Vitruvius Pollio (later on Vitruvius) in his Ten Books on Architecture dated
30 B.C. mentions oil as a protective coating layer against frost:
“In order to protect the mortar from the strains of frost, every year, before winter
comes, saturate it with the residue from pressing olive oil; in this way it will not admit or
absorb frost.” (1)
In a chapter about pavements he advises to seal tiles on floor with lime mixed with
oil.
"When these are joined, lime tempered with oil is to be filled in... thus the lime will
harden and prevent water or anything else from passing through the joints" (39)
In a newer translation:
“When the tiles are joined together, these channels should be filled with lime that has
been mixed with oil, and the joins are rubbed together once they are compressed. In this
way, the lime that has adhered in the channels solidifies in an interlocking pattern as it dries,
and will not allow water, nor anything else, to penetrate the joints.” (1)
Besides the oil, hog´s lard is known to be used in ancient times. George P. Bankart in
his Art of the Plasterer (1909) refers to Vitruvius: “It has always been known to be necessary
Theory
31
to toughen and regulate its (lime) setting qualities, and the ingredients in his time were: juice
of figs, rye dough, hogs' lard, curdled milk, blood, etc.” (43)
The oldest mention about oil as an additive into mortar is by Pliny the Elder (23 A.D. -
August 25, 79 A.D. (the eruption of Vesuvius)) in his Natural History (around 77 A.D.). He
gives a recipe for a type of mortara called Maltha:
“Maltha is a cement prepared from fresh lime; lumps of which are quenched in wine,
and then pounded with hogs´ lard and figs, both of them, mollifying substances. It is the
most tenacious of all cements, and surpasses stone in hardness. Before applying the maltha,
the substance upon which it is used must be well rubbed with oil.” (2)
Leone Batista Alberti (February 18, 1404 – April 20, 1472 in his Ten Books on
Architecture (1452) described the theories and ideas of the Renaissance as well as his
observations about ancient Roman architecture, he often refers to Vitruvius and Pliny.
Alberti states that:
“Mortar worked up with Oil, is said in Pavements to keep out every thing that is
noxious.” (36)
And he also advices to sprinkle mortar with limewater and spread with linseed oil,
because it will attain “hardness comparable to that of glass and is unaffected by any
weather”. (38)
Lauren-Brooks Sickels has made an extensive literal survey on the use of natural
polymeric additives from ancient times to the 20th century in Great Britain. He reports that
hog´s lard was one of the natural organic additives used in England by the mid-18th century.
Sickels also quotes two Indian recipes for stucco, which were both mentioned in 1837 book
by Luis J. Vicat “A Practical and Scientific Treatise on Calcareus Mortars and Cements” (23),
for stuccoes containing oil together with other organic materials.
“The fact is, that they mix the lime with a little curdled milk, with gingelli oil, and
water of jaghery a course very brown sugar, which is derived from cocoa tree.” (3)
a Bostock and H.T. Riley use in their translation of Pliny term “cement”, which seemed to have until the
discovery of Portland cement the same meaning as a term “mortar”.

Theory
32
Second recipe if for stucco called ´Madras´; it was added as a footnote to the first
abovementioned recipe by a Madras engineer Colonel J.T. Smith, R.E. who translated that
particular edition of Vicat´s book.
“In about every bushel…mix the whites of ten or a dozen eggs, half a pond of ghee,
(which is a butter separated from its caseous parts by melting over slow fire,) and a quart of
tyre, (which is sour curd fresh prepared,) to which some add powdered balapong (or soap-
stone) from a quarter to half a pound, which is said to improve the polish. But, each master
bricklayer has generally a recipe of his own, which he boasts of as superior or all others. The
essential ingredients, in addition to the lime and sand, seem to be the albumen (of the eggs),
and the oily matter of the clarified butter, for which oil is sometimes substituted.” (3)
Furthermore, Sickels reports that in 23 August 1856 issue of The Land and Building
News is an article on “Mortar and Cements” which lists one Turkish cement recipe: “100
pounds of picked kilned lime…10 quarts of linseed oil, and one or two ounces of cotton.” (3)
In India, between 4th and 6th century, many types of beans, flowers, pulp of fruits and
various types of leaves soaked in different oils were employed in preparation of plasters
used on the wall for paintings (6; 44).
In Czech Republic, some of the Romanesque, Gothic or Baroque plasters are said to
be of exceptional quality and that it might be because of an addition of various natural
polymers that they have been lasting for centuries. However, as well as in other countries,
recipes for mortars using improving additions were each mason´s technological secret and
passed only orally from generation to generation, thus there is almost no information in the
literature. As for the linseed oil, in studied literature there is only a mention that it was
commonly added to lime water for preparation of a finish coat of plaster in the period of
Renaissance and Baroque (19). And also that it was used for the impregnation of the plaster
(19).
In Brazil, it is said that in past whale oil was commonly used as an additive to lime
mortars to increase their resistance. There are many historical buildings surviving to the
present days in Brazil, however there is no evidence in literature supporting the using of
whale oil for special purposes (45).
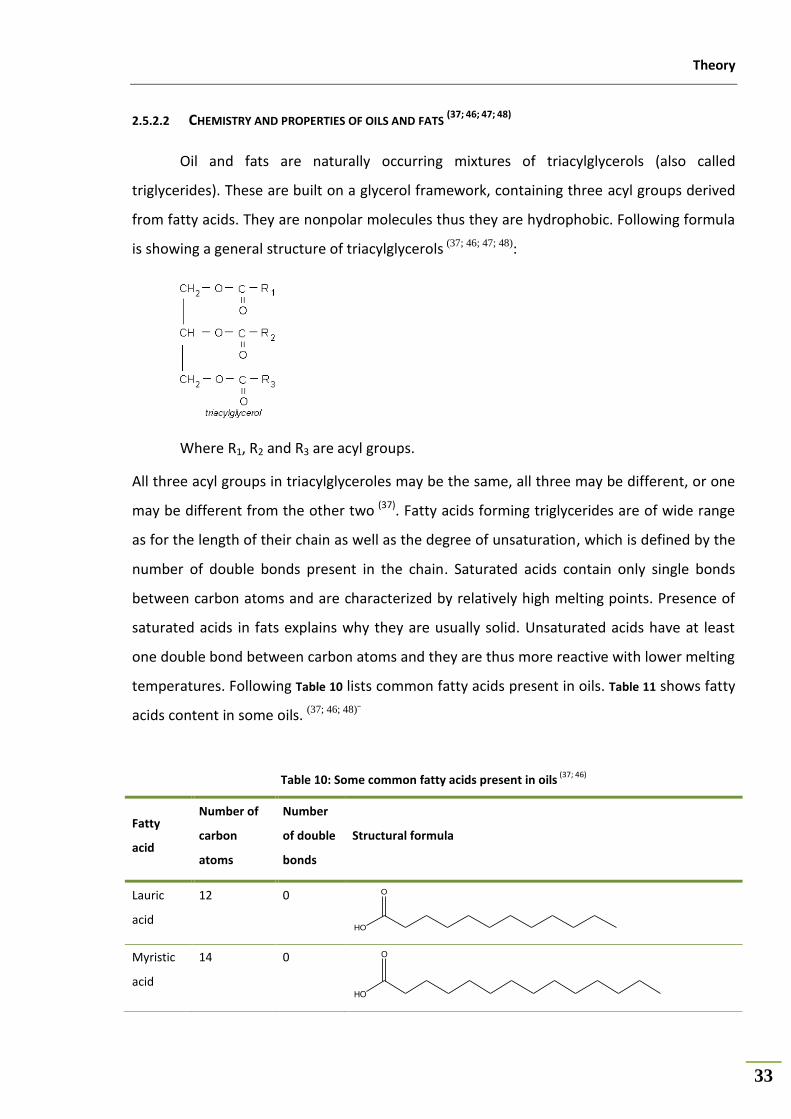
Theory
33
2.5.2.2 CHEMISTRY AND PROPERTIES OF OILS AND FATS (37; 46; 47; 48)
Oil and fats are naturally occurring mixtures of triacylglycerols (also called
triglycerides). These are built on a glycerol framework, containing three acyl groups derived
from fatty acids. They are nonpolar molecules thus they are hydrophobic. Following formula
is showing a general structure of triacylglycerols (37; 46; 47; 48):
Where R1, R2 and R3 are acyl groups.
All three acyl groups in triacylglyceroles may be the same, all three may be different, or one
may be different from the other two (37). Fatty acids forming triglycerides are of wide range
as for the length of their chain as well as the degree of unsaturation, which is defined by the
number of double bonds present in the chain. Saturated acids contain only single bonds
between carbon atoms and are characterized by relatively high melting points. Presence of
saturated acids in fats explains why they are usually solid. Unsaturated acids have at least
one double bond between carbon atoms and they are thus more reactive with lower melting
temperatures. Following Table 10 lists common fatty acids present in oils. Table 11 shows fatty
acids content in some oils. (37; 46; 48)¨
Table 10: Some common fatty acids present in oils (37; 46)
Fatty
acid
Number of
carbon
atoms
Number
of double
bonds
Structural formula
Lauric
acid
12 0 O
HO
Myristic
acid
14 0 O
HO

Theory
34
Fatty
acid
Number of
carbon
atoms
Number
of double
bonds
Structural formula
Palmitic
acid
16 0 O
HO
Stearic
acid
18 0 O
HO
Oleic acid 18 1 O
HO
Linoleic
acid
18 2
O
HO
Linolenic
acid
18 3 O
HO
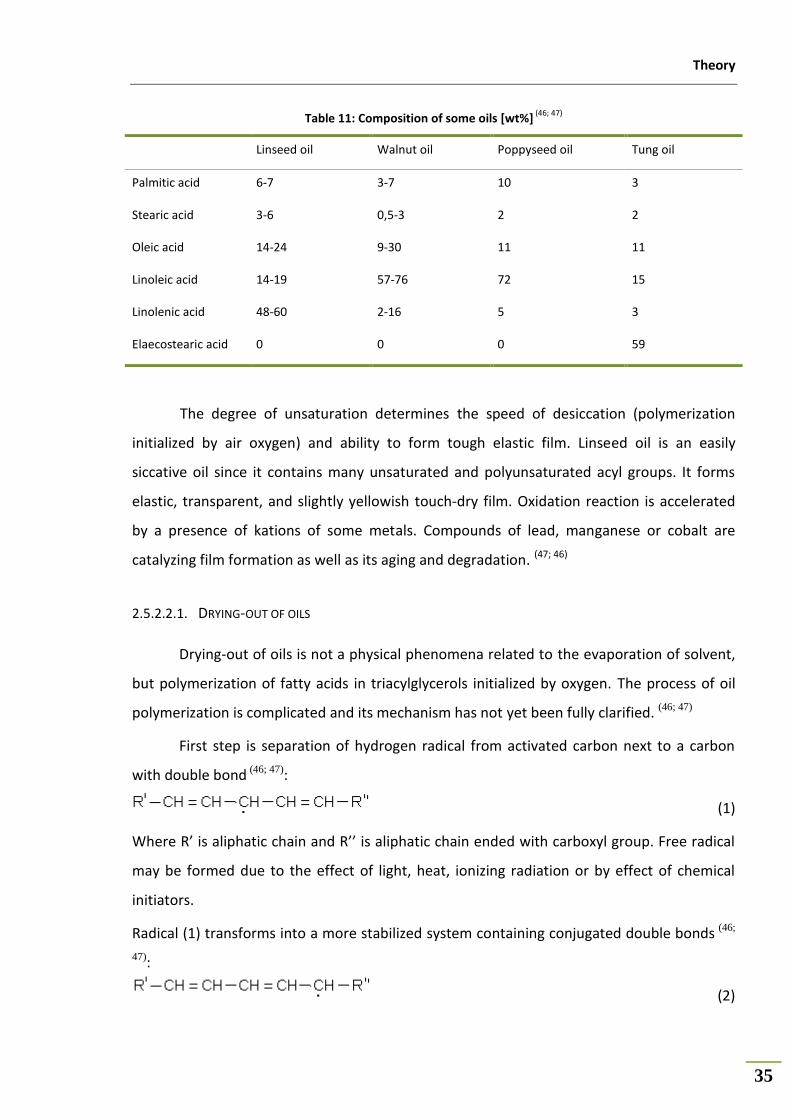
Theory
35
Table 11: Composition of some oils [wt%] (46; 47)
Linseed oil Walnut oil Poppyseed oil Tung oil
Palmitic acid 6-7 3-7 10 3
Stearic acid 3-6 0,5-3 2 2
Oleic acid 14-24 9-30 11 11
Linoleic acid 14-19 57-76 72 15
Linolenic acid 48-60 2-16 5 3
Elaecostearic acid 0 0 0 59
The degree of unsaturation determines the speed of desiccation (polymerization
initialized by air oxygen) and ability to form tough elastic film. Linseed oil is an easily
siccative oil since it contains many unsaturated and polyunsaturated acyl groups. It forms
elastic, transparent, and slightly yellowish touch-dry film. Oxidation reaction is accelerated
by a presence of kations of some metals. Compounds of lead, manganese or cobalt are
catalyzing film formation as well as its aging and degradation. (47; 46)
2.5.2.2.1. DRYING-OUT OF OILS
Drying-out of oils is not a physical phenomena related to the evaporation of solvent,
but polymerization of fatty acids in triacylglycerols initialized by oxygen. The process of oil
polymerization is complicated and its mechanism has not yet been fully clarified. (46; 47)
First step is separation of hydrogen radical from activated carbon next to a carbon
with double bond (46; 47):
(1)
Where R’ is aliphatic chain and R’’ is aliphatic chain ended with carboxyl group. Free radical
may be formed due to the effect of light, heat, ionizing radiation or by effect of chemical
initiators.
Radical (1) transforms into a more stabilized system containing conjugated double bonds (46;
47):
(2)
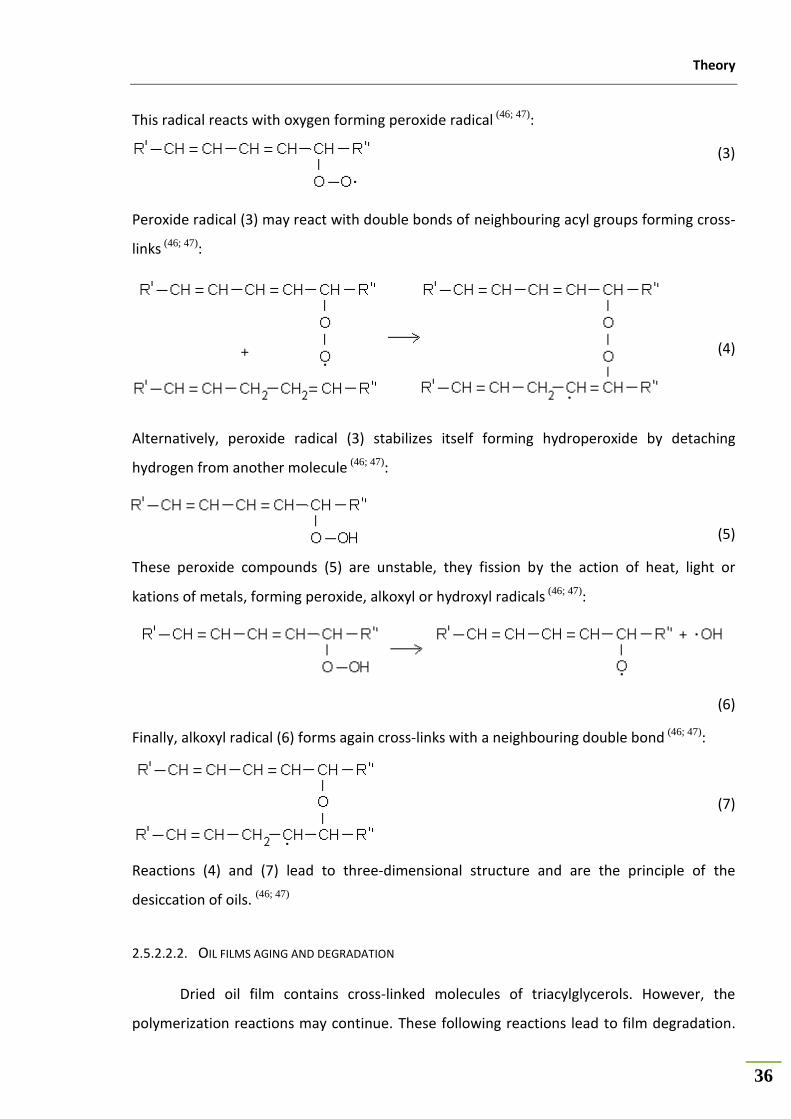
Theory
36
This radical reacts with oxygen forming peroxide radical (46; 47):
(3)
Peroxide radical (3) may react with double bonds of neighbouring acyl groups forming cross-
links (46; 47):
(4)
Alternatively, peroxide radical (3) stabilizes itself forming hydroperoxide by detaching
hydrogen from another molecule (46; 47):
(5)
These peroxide compounds (5) are unstable, they fission by the action of heat, light or
kations of metals, forming peroxide, alkoxyl or hydroxyl radicals (46; 47):
(6)
Finally, alkoxyl radical (6) forms again cross-links with a neighbouring double bond (46; 47):
(7)
Reactions (4) and (7) lead to three-dimensional structure and are the principle of the
desiccation of oils. (46; 47)
2.5.2.2.2. OIL FILMS AGING AND DEGRADATION
Dried oil film contains cross-linked molecules of triacylglycerols. However, the
polymerization reactions may continue. These following reactions lead to film degradation.

Theory
37
Film darkens, is losing its elasticity, cracks are formed and finally the film disintegrates.
Degradation process is caused mostly by breaking labile peroxide cross-links. This leads to
fission of fatty acid chains and to formation of compounds containing reactive hydroxyl,
carboxyl, and carbonyl groups. These groups are formed during subsequent reactions of
primarily formed hydroperoxides or alkoxyl radicals. For example, saturated and unsaturated
C5-C9 carbohydrates and various aldehydes may be formed by degradation of linoleic acid (46;
47):
(8)
Further oxidation leads to a formation of carboxylic acids such is capronic or azelaic
acid. A schematic represantation of oil film structure and its degradation is shown in Figure
10.
Figure 10: Structure of oil film and its degradation (22)
Figure 11 shows process of degradation reactions of linseed and poppyseed oil films.
We can observe well-known phenomena that during the degradation process the weight loss
of linseed oil is lower than that of poppyseed oil films. (46) The reason is that linseed oil
contains higher amount of unsaturated fatty acids and the higher content of double bonds
leads to higher density of cross-links between the molecules. Thus, the degradation products
are held bounded in the structure for a longer time, some of them permanently, and the
whole degradation process is slower. (46)

Theory
38
Figure 11: Weight change of linseed and poppyseed oil films aged at 20°C in time (46)
2.5.2.2.3. REACTION OF OIL IN BASIC ENVIRONMENT
Fresh mortar is strongly basic, with pH>12. When oil is added into mortar,
triacylglycerols undergo hydration resulting in formation of insoluble calcium salts of fatty
acids (4; 49; 5; 48).
(9)
Incurred fatty acids salts are hydrophobic due to their alkyl chains the same as
triacylglycerols. Due to their interaction with calcium, they are well bounded in mortar
structure and the hydrophobic alkyl chain will cause mortar repellency (48; 49).
2.5.2.3 STUDIES ON EFFECT OF OIL ON MORTAR
While there are some mentions of using of oil as a mortar additive in literature, there
are only a few studies on its actual effect.
Chandra et al. (5) studied effect of linseed, corn, and mustard oils on properties of
Portland cement mortar. Flexural and compressive strength, water absorption and freeze-

Theory
39
salt resistance have been tested. Oils were added in 0,5% and 0,8% concentrations by the
weight of cement, cement-sand ratio 1:3 mortar, samples were tested after 7 and 28 days of
curing. After 28 days, addition of 0,5% did not have effect on compressive strength, while
the addition of 0,8% decreased the compressive strength. Water absorption was decreased
and subsequently freeze-salt resistance was increased. The effect was more apparent with
higher concentration of oils. (5)
Further, Justnes et al. (48; 49) studied effect of vegetable oils but, the same as Chandra,
on cement mortar, which is not suitable for restoration purposes due to its hardness and
because of the risk of introducing dangerous salts into historical structures. Authors’
motivation was to develop a natural replacement of synthetic additives that can secure a
sustainable development, the so-called bio-admixtures. Linseed, sunflower, olive, soya
beans, peanuts, corn and rapeseeds oils were tested in 0,5% and 1,5% concentration by the
weight of cement. Oils were dispersed in the mixing water by the aid of lignosulphonate.
Cement-sand 1:3, w/c= 0,5. After 1 and 28 days of curing flexural and compressive strength,
capillary water absorption and water vapour diffusion was tested. After 3 years of further
curing at 93%RH, compressive strength, capillary water absorption, monolayer capacity and
chemically bound water were measured (49). Of the strengths measured after 1 and 28 days,
only compressive strength at 28 days of some oils at the highest dosage showed significant
decrease. The 3-year compressive strength was reduced by 30%, but had still increased from
the 28 days strength. Flexural strengths were not reduced to any larger degree than the
compressive strengths. Strength didn´t show clear dependence on oil dosage. Capillary
water absorption was greatly reduced comparing to reference, while water vapour diffusion
was only marginally reduced. Similarly to Chandra´s findings, capillarity was decreasing with
increasing oil concentration. Chloride intrusion was reduced to 35-66% of the reference
sample, but no trends were found in-between oils. Water repellent effect lasted more than 3
years at moist conditions. Oil did not have effect on the hydration degree of cement (48; 49).
The two following authors tested effect of oils on the lime mortar.
Santiago and Mendonca De Oliveira tested whale oil addition in concentration of 2%
and 5% by the weight of lime. Mortar was prepered in proportion lime:sand 1:3 and
lime:clay:sand 1:2:1. Capillary absorption of mortars with oil was lower then that of those
without oil, tested after 4 years of curing, mortars with 5% of oil had almost zero absorption.
Theory
40
On the other hand, mortars with oil had lower compressive strength then unmodified
mortars. Authors suppose it could be because oil encapsulates the Ca(OH)2 particles and
prevents carbonation process to take place (45).
Rovnaníková (4) studied an effect of various natural polymers on hydrated lime
mortar. Boiled linseed oil was tested in 1%, 5% and 10% concentration by the weight of
mortar mixture (0,3%, 1,7% and 3,3% by the weight of lime). Hydrated lime-sand-water
ratios were in proportion 1:3:1. Author observed decreased porosity and workability of fresh
mortar “due to the hydrophobicity of oil”. Hardened mortar showed lower porosity and
water absorption comparing to reference. Compressive strength was significantly increased
with addition of oil; however flexural strength was lower, probably because of the physical
action of oil. Water vapour permeability was not affected by the oil addition. Higher
additions of oil (5%, 10%) were causing slight increase in volume (1-1,5%) comparing to the
reference mortar, which showed shrinkage (2,5%) (4).
In summary, the effect of oil was tested mostly on the cement mortar, which is not
suitable for restoration, little is known about the effect on lime mortars. Cement mortar has
different chemical composition and in consequence different properties than the lime-based
mortars, so the effect of oil may be different.
Little experimental work on the effect of oil has been done. The effect of oil on some
properties (strength, porosity, capillarity) has been tested, but the effect of oil on mortar´s
microstructure and the exact mechanism of is operation is not clearly known. Most
importantly, the supposed increased resistance of lime-based mortars against deterioration
has not yet been verified experimentally.

Experimental part
41
3 Experimental part
In the present study, the effect of linseed oil on the properties of six various lime-
based mortars has been studied. Mortars composition has been selected with respect to
composition of historical mortars (hydrated lime mortar and pozzolanic mortars (50)), but also
mortars used in modern restoration practise (hydraulic lime mortar, mortars with addition of
cement) have been tested. Mortar mixtures were prepared in three different versions:
unmodified and with 1% and 3% addition of linseed oil by the weight of binder.
The effect of linseed oil addition on mortars mechanical (compressive and flexural
strength, dynamic modulus of elasticity) and physical properties (open porosity, water
absorption through capillarity) have been studied. Changes in pore size distribution have
been investigated by means of mercury intrusion porosimetry and the effect of oil addition
on mortars´ structure has been studied by means of scanning electron microscopy.
Dispersion of oil in mortar structure was verified by observing their cross-sections under
microscope with UV light, which evokes fluorescence of linseed oil. FTIR analysis of binder
pastes was performed in order to examine linseed oil’s possible chemical changes in mortar
(formation of carboxylate salts, cross-linking of fatty acids molecules). Finally, mortars
durability against salt crystallization (NaCl and Na2SO4) and freeze-thaw cycles was tested.
3.1 USED MATERIALS
Lime – hydrated lime, EN ISO 9002 TUV CERT, manufacturer: CaO Hellas
Pozzolan – natural pozzolan with very fine particles (<55µm), manufacturer:
Dalkafoukis, technical sheet in Appendix I.
Hydraulic lime – Albaria Calce Albazzana, natural hydraulic lime, without
cement, light colour, binder for plasters, bedding and joint mortars.
Manufacturer: Degussa Construction Chemicals spa (now BASF), technical and
safety sheets in Appendices II and III.
Cement – white cement, CEM II/A – LL 42,5N, manufacturer: TITAN
Brick dust – manufacturer: Kourasanit
Sand – Axios river natural sand, supplier: Tratselas S.A.

Experimental part
42
Linseed oil – crude natural linseed oil, manufacturer: Mercola
Potable water
3.2 EXPERIMENTAL METHODS
3.2.1 MATERIALS CHARACTERISTICS
3.2.1.1 DETERMINATION OF THE PARTICLE DENSITY OF BINDER
Real density of hydrated lime, hydraulic lime, cement, pozzolan and brick dust has
been determined by pycnometer method at 20°C, ethanol has been used as an auxiliary
liquid. Analysis has been done by Stavroula Konopissi at the Chemical laboratory of AUTH.
As a first step apparent volume of pycnometer has been determined:
OH
ABp
mmV
2
, where
Vp is the apparent volume of the pycnometer [m3],
mA is the mass of the empty pycnometer [kg],
mB is the mass of the pycnometer filled with distilled water [kg],
is the density of distilled water at 20 °C, = 998,23 kg.m-3.
Then the density of ethanol has been determined:
p
AC
CV
mm
, where
C is density of ethanol at 20°C [kg.m-3],
mC is mass of the pycnometer filled with ethanol [kg].
Particle density of analysed materials has been calculated from the following
formula:
EDC
DC
pmmm
m
, where
is the particle density [kg.m-3],
mD is the mass of the specimen [kg],
OH 2 OH2
p

Experimental part
43
mE is mass of the pycnometer filled with ethanol and the specimen [kg].
3.2.1.2 DETERMINATION OF LOOSE BULK DENSITY OF DRY BINDERS AND AGGREGATE
Loose bulk density of hydrated lime, hydraulic lime, pozzolan, cement and brick dust
has been determined according to EN 1097-3 (51).
Loose bulk density is defined as the quotient obtained when the mass of dry
aggregate filling a specified container without compaction is divided by the capacity of that
container.
The loose bulk density ρl is calculated according to the following equation:
V
mml
12 , where
ρl is the loose bulk density [kg.m-3],
m2 is the mass of the container and test specimen [kg],
m1 is the mass of the empty container [kg],
V is the volume of the specimen [m3].
3.2.1.3 GRAIN SIZE DISTRIBUTION
Distribution of sand and brick dust particles has been determined on mechanical
sieve shaker with sieve series of ISO 3310, using sieves with a square mesh of size 8 mm,
6,3 mm, 4 mm, 2,5 mm, 1 mm, 0,5 mm, 0,2 mm, 0,1 mm, 0,075 mm and 0,063 mm. Sieving
time was 10 min. Individual fractions were weighed and result plotted as a cumulative curve.
3.2.1.4 BINDER SETTING TIME DETERMINATION
Determination of initial and final setting time of hydrated lime, hydraulic lime,
mixture of hydrated lime and pozzolan in proportion 1:1, mixture of hydrated lime, pozzolan
and brick dust 1:0,5:0,5, mixture of hydrated lime, pozzolan and cement 1:0,9:0,1 mixture of
hydrated lime, pozzolan and cement in proportion 1:0,8:0,2 and all previous binder mixtures
modified by 1% and 3% per weight addition of linseed oil has been determined according to
EN 196-3 (52) on the Vicat apparatus.

Experimental part
44
Firstly the standard consistence was supposed to be determined. Standard
consistence is characterized by the depth of penetration of plunger into binder paste, which
is filled into Vicat ring placed on a glass base-plate. Standard consistence is such a proportion
of binder and water that the distance between the bottom face of the plunger and the base-
plate is (6±1) mm. Unfortunately, it was not possible to prepare binder pastes of the
standard consistence, because at this consistence binder pastes were too thick to be mixed
well so it was not possible to ensure proper incorporation of oil into the binder paste.
Setting time is determined on the Vicat apparatus equipped with a steel needle.
Initial setting time is defined as the time measured from zero time (mixing binder with
water) at which the distance between the needle and the base-plate is (4 ± 1) mm.
Final setting time is defined as the time measured from zero time (mixing binder with
water) at which needle first penetrates only 0,5 mm into the specimen.
3.2.2 PREPARATION OF MORTAR MIXTURES
Mortar mixtures were prepared using six different binding systems: hydrated lime:
sand (1: 3, code L), natural hydraulic lime: sand (1: 3, code HL), hydrated lime: pozzolan:
sand (1: 1: 6, code P), hydrated lime: pozzolan: brick dust: sand (1: 0,5: 0,5: 6, code B) and
hydrated lime: pozzolan: cement: sand with cement in two different concentrations (1: 0,9:
0,1: 6, code C1 and 1: 0,8: 0,2: 6, code C2). Compositions were prepared in three different
versions: unmodified, with 1% and 3% of linseed oil by the weight of binder. Water was
added in amount needed to maintain the same workability for all mortar mixtures. Mortar
mixtures have been prepared in the following way:
1. Mixing up of all dry constituents by chisel (to avoid dusting),
2. For modified mixtures: mixing oil with a bit of dry mixture (approx. 50 g) in a
plastic cup, then pouring oiled powder into the dry mixture,
3. Adding water while mixing at low speed, mixing for 3 minutes,
4. Pouring water on the bottom of mixing vessel, incorporation of mortar held
on vessel sides by chisel,
5. Mixing for another 3 minutes at low speed,
Experimental part
45
6. Checking consistence on a flow table (adding more water if necessary,
additional mixing for approx. 1 minute),
7. Filling into the moulds.
3.2.3 PROPERTIES OF FRESH MORTARS
Fresh mortar is characterized by its water-binder ratio, consistence, and bulk density.
3.2.3.1 DETERMINATION OF WATER-BINDER RATIO
Water binder ration is defined as:
b
OH
m
mbw 2/ , where
w/b is the water-binder ration,
mH2O is the mass of the kneading water [g],
mb is the mass of the binder [g].
3.2.3.2 DETERMINATION OF CONSISTENCE
Consistence is a measure of the fluidity and/or wetness of the fresh mortar and gives
a measure of the deformability of the fresh mortar when subjected to a certain type of
stress. Consistence has been determined according to 1015-3:1999 (53).
Mould of defined diameters has been placed in a centre of a flow table and filled
with fresh mortar. After removing the mould, mortar has been spread out on the disc by
jolting the flow table 15 times. Flow value has been measured after 15 vertical strokes of
flow table by raising the flow table and allowing it to fall freely through a given height.
Consistence is defined as a mean value of mortar diameter in centimetres measured in three
directions.
3.2.3.3 BULK DENSITY DETERMINATION
Bulk density has been determined according to EN 1015-6:1999 (54). Bulk density
expresses the mass of defined volume of fresh mortar. It is calculated from following
formula:
Experimental part
46
V
mmb
12 , where
ρb is the bulk density of fresh mortar [kg.m-3],
m0 is the mass of empty vessel [kg],
mfm is the mass of vessel with mortar [kg],
Vfm is the volume of fresh mortar [m3].
3.2.4 SAMPLES PREPARATION
Samples of shape of prisms 4 x 4 x 16 cm and cylindrical discs (Ø16 cm x 2 cm) were
prepared.
Internal faces of assembled moulds for preparation of prisms have been firstly
lubricated with a thin layer of mineral oil to prevent adhesion of the mortar. Fresh mortar
has been filled into the moulds in two approximately equal layers; each layer has been
compacted by 25 strokes of the tamper. Moulds have been covered with an iron plate and
stored according to EN 1015-11 (55).
Cylindrical disc specimens were prepared in a similar way, but without lubricating the
moulds by mineral oil, because that could affect water vapour permeability to be tested.
Curing conditions were as follows:
1. 5 days in the mould at (95±5)%,
2. 2 days with the mould removed at (95±5)%,
3. 11 weeks with the mould removed at (65±5)%,
4. 1 year in ambient conditions in air-conditioned room (temperature 20-25°C,
40-80% RH) – unmodified mortars and mortars with 1% oil addition only.
(95±5)%RH was reached by covering specimens in moulds and (65±5)% was obtained
by placing specimens into tray with dampened cloth and partial covering of tray by plastic
foil. Unfortunately, a climatic chamber was not available for curing of the specimens.
Prisms were used for experiments after 1, 3, and 12 months of curing.
Cylindrical discs for water vapour permeability test were cured for 1 month.

Experimental part
47
3.2.5 PROPERTIES OF HARDENED MORTARS
3.2.5.1 FLEXURAL STRENGTH DETERMINATION
Flexural strength has been measured according to EN 1015-11:1999 (55) on machine
by “Chemischer Laboratorium für TUNINDUSTRIE, Prof.Dr.H.Leger&E.Cramer Kom. Ges.,
BERLIN/WEST, Masch.Nr.12633, Bemjahr 1962”. For flexural strength determination
specimen in shape of prisms (4 x 4 x 16 cm) were used. Exacts prisms diameters (length,
width and depth in the place of testing, i.e. half of prism) were measured before testing.
Flexural strength was calculated from following formula:
2
5,1
db
lFf
f
, where
f is the flexural strength [MPa],
Ff is the maximum load applied to the specimen [N],
l is the distance between the axes of the support rollers [mm],
b is the width of specimen [mm],
d is the depth of specimen [mm].
Flexural strength has been tested on specimens of unmodified mortars and of
mortars with 1% addition of linseed oil at the age of 1, 3 and 12 months, specimens of
mortars with 3% addition of oil at 1 and 3 months. Result is the mean value of 6-9
measurements.
3.2.5.2 COMPRESSIVE STRENGTH DETERMINATION
Compressive strength has been determined according to EN 1015-11:1999 (55) on
MOHR & FEDERHAUF AG instrument provided with adapter for testing of mortars.
Instrument has been operated by either Michalis Papachristoforou, Dr. Maria Stefanidou or
Yiannis Goutsios. Halves of prisms have been used for the testing. Compressive strength is
defined by the maximum load to the specimen area:
A
Fc C , where
c is the compressive strength [MPa],
Experimental part
48
Fc is the maximum load applied to the specimen [N],
A is the area on which the load is applied [mm2].
Compressive strength has been tested on specimens of unmodified mortars and of
mortars with 1% addition of linseed oil at the age of 3 and 12 months, mortars with 3% of oil
addition were tested after 3 months of curing. Result is the mean value of 4-7
measurements.
3.2.5.3 DYNAMIC MODULUS OF ELASTICITY DETERMINATION
Dynamic modulus of elasticity was calculated from measured ultrasonic pulse
velocity, which is influenced by those properties of the material which determine its elastic
stiffness and mechanical strength. It indicates material´s uniformity, presence of cracks and
voids.
Ultrasonic pulse velocity in a solid material is a function of the square root of the
ratio of its modulus of elasticity to its density, according to BS 1881-203 (56; 57):
2
1
.
dynEgf
T
Lv
, where;
v is the ultrasonic pulse velocity [m.s-1];
L is the length of specimen [m];
T is the pulse transit time [s];
Edyn is dynamic modulus of elasticity [GPa],
ρ is the density of the material [kg.m-3],
g is the gravity acceleration, g = 9.81 m.s-2.
The natural frequency of transducers was 55 kHz.
The dynamic modulus of elasticity may be then calculated by substituting the value of
the pulse transit time into the equation according to BS 1881-209 (58) to yield an approximate
value for the desired resonant frequency:
, where
Edyn is the dynamic modulus of elasticity [GPa],
1522 10....4 LnEdyn

Experimental part
49
n is the fundamental frequency in longitudal mode of vibration of the specimen [Hz],
L is the length of the specimen [mm],
ρ is the density of the specimen [kg.m-3].
Dynamic modulus of elasticity has been tested on specimens of unmodified mortars
and of mortars with 1% addition of linseed oil at the age of 3 and 12 months, mortars with
3% of oil addition were tested after 3 months of curing. Result is the mean value of 3
measurements.
3.2.5.4 DETERMINATION OF OPEN POROSITY, APPARENT DENSITY, WATER ABSORPTION AND PORES
ACCESSIBILITY TO WATER
Open porosity and apparent density determination has been based on EN 1936:2006
(59). Quarters of prisms of weight (100±20) g were used for testing. Specimens were dried in a
ventilated oven at a temperature of (65±5) °C and weighed prior to the testing. The
procedure was as follows:
1. Submerging specimens in distilled water for 48 hours at ambient atmospheric
pressure,
2. Weighing the specimens after quick drying with a cloth at the air and also when
immersed under water,
3. Submerging the specimens in distilled water for 24 hours at lowered pressure
-0,85 bar compared to the atmospheric pressure (i.e. the pressure in the
vacuum vessel was 16,3 kPa). Obtained pressure was higher than the pressure
recommended by the standard ((2±0,7) kPa), also the time of air evacuation
was prolonged comparing to standard (2 hours).
4. Gradually increasing the pressure in the evacuation vessel (within 10 minutes),
leaving specimens for another 24 hours under water at atmospheric pressure,
5. Weighing the specimens at the air after quick drying with a cloth and also when
immersed under water.
Experimental part
50
Following variables were calculated based on measured weights:
Apparent density – ratio between the mass of the dry specimen and its
apparent volume:
Water absorption after 48 hours – ratio between the mass of water in the
specimen after 48 hours and the mass of dry specimen:
1000
01
48
m
mmWA SSD
Open porosity after 48 hours – ratio between the volume of the water in
pores after 48 hours (volume of easily accessible pores) and the apparent
volume of the specimen:
10011
01
48
hSSD
h
mm
mmp
Water absorption - ratio between the mass of water in the specimen after
vacuum evacuation and the mass of dry specimen:
1000
02
m
mmWA SSD
Open porosity – ratio between the volume of the water in pores after vacuum
evacuation (volume of pores accessible to water) and the apparent volume of
the specimen:
10022
02
2
hSSD
SSD
OHmm
mmP
Pores accessibility to water can be expressed as the proportion of pores easily
accessible to water to the total amount of opened pores (60):
OH
ap
pC
2
48
m0 is the mass of the dry specimen [kg],
mSSD1 is the mass of the saturated surface dry specimen after 48 hours [kg],
22
0 2
hSSD
OH
amm
m
Experimental part
51
mh1 is the mass of the saturated specimen after 48 hours weighed
hydrostatically [kg],
mSSD2 is the mass of the saturated surface dry specimen after vacuum evacuation [kg],
mh2 is the mass of the saturated surface dry specimen after vacuum evacuation
weighed hydrostatically [kg],
is the water density at 20 ºC, H2O = 998,2 kg.m-3,
a is the apparent density [kg.m-3],
WA48 is the water absorption after 48 hours [%],
p48 is the porosity after 48 hours, i.e. porosity easily accessible to water [%],
WA is the water absorption after vacuum evacuation [%],
p is the porosity accessible to water, i.e. open porosity [%],
Ca is the coefficient of pores accessibility to water.
Two samples of each mortar type were tested at the age of 1, 3, and 12 months.
Result is the mean value of the two measurements.
3.2.5.5 DETERMINING OF DRYING RATE
Saturated specimens after the open porosity determination, as described in previous
chapter, have been dried in a ventilated oven at 85°C. Specimens have been weighed in time
intervals and the drying rate has been plotted as a function of time (61).
3.2.5.6 PORE SIZE DISTRIBUTION
Pore size distribution has been determined by means of mercury intrusion
porosimetry, through ThermoQuest mercury porosimeter utilizing the Pascal 140 and Pascal
240 units. Analyses have been done by Dr. Silvia Rescic at CNR-ICVBC in Florence, Italy.
Analyse has been carried out in a range from 0,0037 µm to 150 µm pore ratio, which is the
area of mesopores (62).
The porosity is defined as a ratio of vacuum space and the total volume of the
material. Vacuum space is calculated as the difference between the total volume of the
material and the volume of the solid portion. At CNR-ICVBC, total volume of the material
OH 2
OH2

Experimental part
52
was measured by means of mercury pycnometer, and volume of the solid portion by means
of the helium pycnometer.
3.2.5.7 CAPILLARY ACTION
Capillarity is characterized by the coefficient of water absorption, which expresses
the initial slope of the plotted amount of water per unit surface as a function of square root
of time (63) (i.e. how much water and how quickly gets absorbed into material). Besides
water, the test has been performed using also salt solution (10% by weight NaCl) to see
whether the ions in water can significantly affect the process of capillary action. Coefficient
of water (salt solution) absorption by capillary action has been measured using half-prism
specimens of size of approximately 4 x 4 x 8 cm, as described in EN 1015-18:2002 (63). After
drying the specimens for 2 days at (65±5) °C, specimens have been immersed in 1 cm of
distilled water (salt solution) by their rough surface face (after breaking the specimen when
measuring the flexural strength) and the container with the specimen has been sealed to
avoid evaporation. Specimens have been weighed after 10 and 90 minutes and the increase
in mass determined. Coefficient of water (salt solution) absorption has been calculated
according to the following formula:
C= 0,1.(m90-m10), where
C is the coefficient of water (salt solution) absorption [kg/(m2.min0,5)],
m10 is the mass after 10 minutes [kg],
m90 is the mass after 90 minutes [kg].
Two specimens of all mortar types have been tested after 1 and 3 months of curing.
Mortars with 1% of oil and unmodified mortars have been tested also at the age of 1 year.
Result is the mean value of two measurements.
3.2.5.8 WATER CONTACT ANGLE
Contact angle that water drop forms on material´s surface defines material´s
hydrophobity. It is measured as an angle between the baseline of the drop and the tangent
at the drop boundary. The higher is the contact angle, the more hydrophobic is material´s
surface.
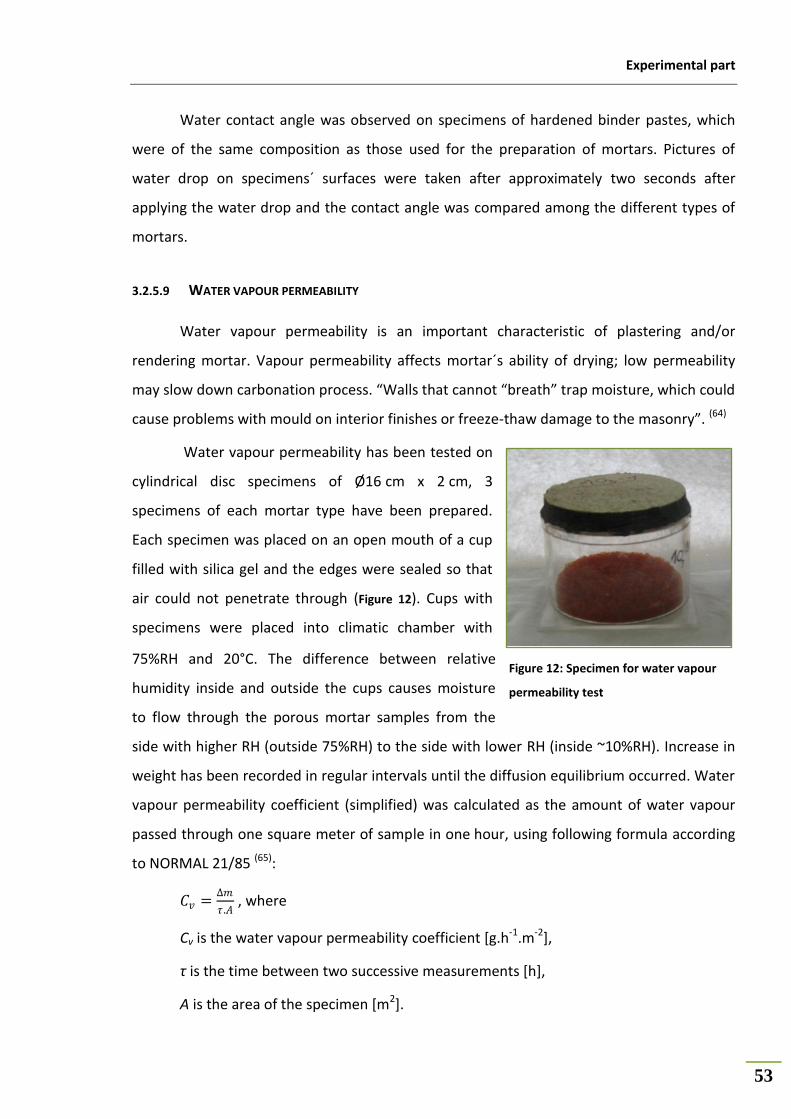
Experimental part
53
Water contact angle was observed on specimens of hardened binder pastes, which
were of the same composition as those used for the preparation of mortars. Pictures of
water drop on specimens´ surfaces were taken after approximately two seconds after
applying the water drop and the contact angle was compared among the different types of
mortars.
3.2.5.9 WATER VAPOUR PERMEABILITY
Water vapour permeability is an important characteristic of plastering and/or
rendering mortar. Vapour permeability affects mortar´s ability of drying; low permeability
may slow down carbonation process. “Walls that cannot “breath” trap moisture, which could
cause problems with mould on interior finishes or freeze-thaw damage to the masonry”. (64)
Water vapour permeability has been tested on
cylindrical disc specimens of Ø16 cm x 2 cm, 3
specimens of each mortar type have been prepared.
Each specimen was placed on an open mouth of a cup
filled with silica gel and the edges were sealed so that
air could not penetrate through (Figure 12). Cups with
specimens were placed into climatic chamber with
75%RH and 20°C. The difference between relative
humidity inside and outside the cups causes moisture
to flow through the porous mortar samples from the
side with higher RH (outside 75%RH) to the side with lower RH (inside ~10%RH). Increase in
weight has been recorded in regular intervals until the diffusion equilibrium occurred. Water
vapour permeability coefficient (simplified) was calculated as the amount of water vapour
passed through one square meter of sample in one hour, using following formula according
to NORMAL 21/85 (65):
𝐶𝑣 =∆𝑚
𝜏 .𝐴 , where
Cv is the water vapour permeability coefficient [g.h-1.m-2],
τ is the time between two successive measurements [h],
A is the area of the specimen [m2].
Figure 12: Specimen for water vapour
permeability test

Experimental part
54
3.2.5.10 DEFINING THE COLOUR OF BINDER PASTES
Colour of hardened binder samples has been observed in order to ascertain whether
oil addition has some effect on the colour. Binder pastes have been of the same composition
as the binders in mortars, plus the 1% and 3% by weight oil addition. Colour has been
determined according to Munsell soil colour charts (66).
3.2.5.11 RESISTANCE TO SALT CRYSTALLIZATION CYCLES
Resistance to salt crystallization has been tested in two different types of cycles.
Firstly, cycle during which specimens have been allowed to absorb 10wt% NaCl solution by
capillary rise for 24 hours and then dried in a ventilated oven for 2 days at (65±5)°C has been
tested. This cycle did not show to be sufficient enough, because specimens even after 15
cycles did not show decrease in weight, furthermore values were fluctuating (perhaps due to
unstable capillary rate and/or drying temperature), so that it was not possible to compare
individual mortar types in terms of their resistance.
Therefore another, more efficient, cycle has been set up, using both 10wt% NaCl and
10wt% Na2SO4 solution, with parameters as follows:
6 hours full immersion in salt solution;
18 hours drying in ventilated oven at 85°C (newer model of oven used).
In the first cycle NaCl has been used, since it is one of the most common salt, but in
the second type of cycle also Na2SO4 has been used concurrently to NaCl, because Na2SO4 is
more damaging salt than NaCl.
Drying temperature of 85°C is rather high temperature, but still lower than the drying
temperature recommended by RILEM for the porosity determination ((105±5) °C (67)), mortar
microstructure should not get damaged.
Mortar quarter-prism specimens of weight (100±20) g were used for testing.
Specimens were weighed after each cycle and the weight change as a percentage of the
original weight was plotted. Damage has been monitored visually, photographically and
some specimens representing three groups of mortar (unmodified, 1% and 3% linseed oil
addition) has been observed under SEM after 20th cycle of sodium chloride crystallization.
Experimental part
55
Cycles have been repeated until the destruction of specimens got destroyed, but
maximum 25 times. Two specimens of each mortar type have been tested.
3.2.5.12 RESISTANCE TO FREEZE-THAW CYCLES
Mortar quarter-prism specimens of weight (100±20) g were used for testing. Prior to
initial cycle specimens were immersed under water for 24 hours and weighed. Freeze-thaw
cycles were set up as follows:
6 hours at temperature of -20°C,
18 hours melting while immersed under the water at ambient temperature.
Specimens were weighed after each cycle and the weight change as a percentage of
the original weight was plotted. Damage has been monitored visually and photographically.
Cycles have been repeated until the destruction of the specimens, but maximum 25 times.
Two specimens of each mortar type have been tested.
3.2.6 STUDYING OF LINSEED OIL’S BEHAVIOUR IN MORTAR STRUCTURE
3.2.6.1 OBSERVATION OF OIL IN MORTAR STRUCTURE
3.2.6.1.1. UV MICROSCOPY
Cross-section of mortar specimens were observed under an epifluorescence
microscope Nikon Eclipse E 600, equipped with UV-2a filter (excitation 330-380, DM 400 nm,
BA 420 nm) at CNR-ICVBC in Florence, Italy. This technique allows capturing natural or
induced fluorescence of inorganic and organic materials.
3.2.6.1.2. SCANNING ELECTRON MICROSCOPY
Specimens were observed under Scanning electron microscope (SEM) JEOL JSM-840A
coupled with energy dispersive spectroscopy (EDS), duel voltage 20kV, at the Laboratory of
Scanning Electron Microscope at A.U.TH., Greece. The instrument was operated by Lambrini
Papadopoulou.
Experimental part
56
3.2.6.2 STUDYING OF CHEMICAL CHANGES OF OIL IN A MORTAR AND OIL AGING
Plastic binder pastes of the same binders proportion as in mortars with high content
of oil (30% oil, 40% water by the weight of binder) have been analysed with ATR Smart Orbit
Accessory inserted into Nicolet 5700 FTIR spectrometer from Thermo Electron Corperation
in the range 4000-525 cm-1 in M2ADL laboratory in Ravenna, Italy, by Elsebeth Kendix.
Specimens have been analysed at the age of 2 weeks.
The drying and oxidative degradation of oils has been investigated through drying of
a thin layer of oil, and also oil mixed with hydrated lime, in a ventilated oven at 60°C for 24
hours. Formed oil films have been observed under microscope with UV light (instrument
described above) at CNR-ICVBC and its changes monitored photographically. Dried oil film
has been analysed by FTIR-ATR in Ravenna.
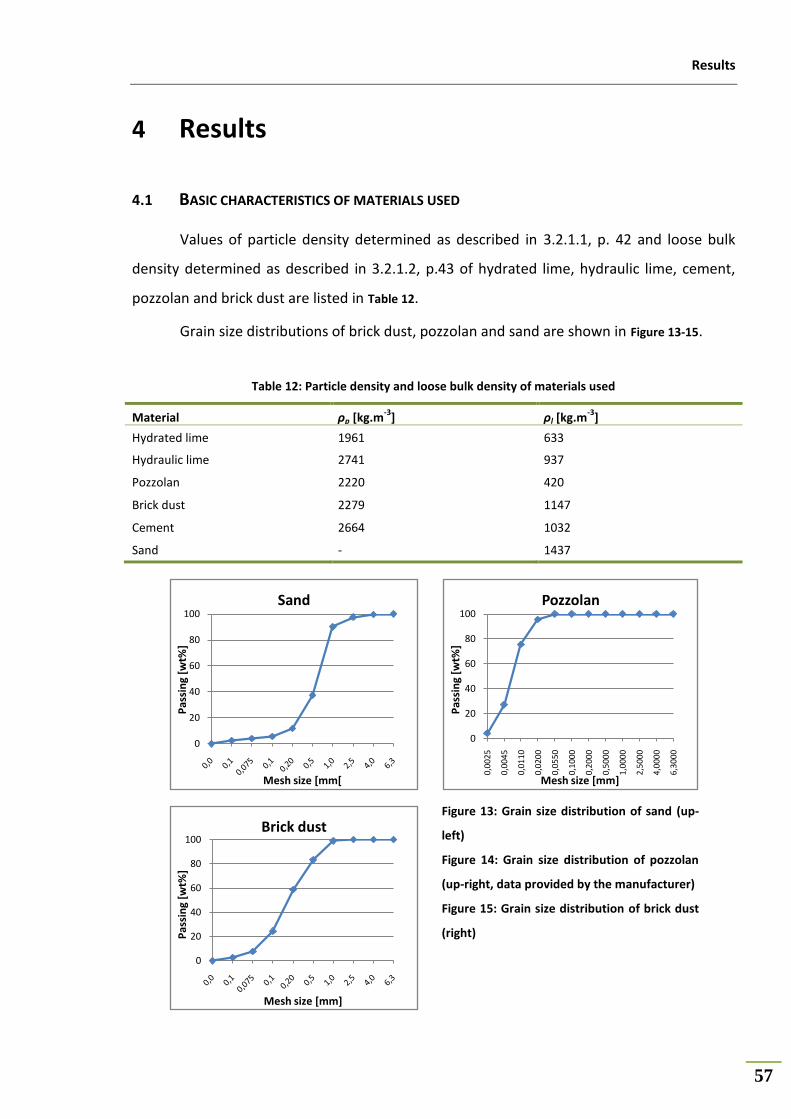
Results
57
4 Results
4.1 BASIC CHARACTERISTICS OF MATERIALS USED
Values of particle density determined as described in 3.2.1.1, p. 42 and loose bulk
density determined as described in 3.2.1.2, p.43 of hydrated lime, hydraulic lime, cement,
pozzolan and brick dust are listed in Table 12.
Grain size distributions of brick dust, pozzolan and sand are shown in Figure 13-15.
Table 12: Particle density and loose bulk density of materials used
Material ρp [kg.m-3
] ρl [kg.m-3
]
Hydrated lime 1961 633
Hydraulic lime 2741 937
Pozzolan 2220 420
Brick dust 2279 1147
Cement 2664 1032
Sand - 1437
Figure 13: Grain size distribution of sand (up-
left)
Figure 14: Grain size distribution of pozzolan
(up-right, data provided by the manufacturer)
Figure 15: Grain size distribution of brick dust
(right)
0
20
40
60
80
100
Pas
sin
g [w
t%]
Mesh size [mm[
Sand
0
20
40
60
80
100
6,30
00
4,00
00
2,50
00
1,00
00
0,50
00
0,20
00
0,10
00
0,05
50
0,02
00
0,01
10
0,00
45
0,00
25
Pas
sin
g [w
t%]
Mesh size [mm]
Pozzolan
0
20
40
60
80
100
Pas
sin
g [w
t%]
Mesh size [mm]
Brick dust
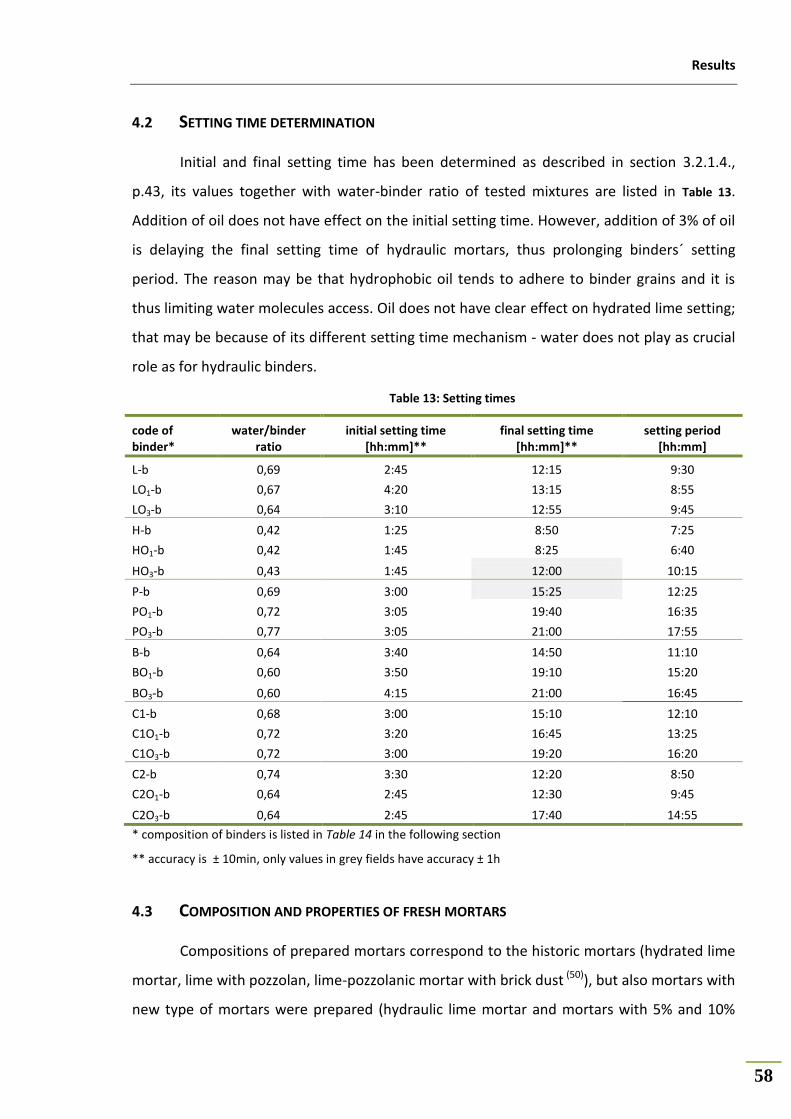
Results
58
4.2 SETTING TIME DETERMINATION
Initial and final setting time has been determined as described in section 3.2.1.4.,
p.43, its values together with water-binder ratio of tested mixtures are listed in Table 13.
Addition of oil does not have effect on the initial setting time. However, addition of 3% of oil
is delaying the final setting time of hydraulic mortars, thus prolonging binders´ setting
period. The reason may be that hydrophobic oil tends to adhere to binder grains and it is
thus limiting water molecules access. Oil does not have clear effect on hydrated lime setting;
that may be because of its different setting time mechanism - water does not play as crucial
role as for hydraulic binders.
Table 13: Setting times
code of binder*
water/binder ratio
initial setting time [hh:mm]**
final setting time [hh:mm]**
setting period [hh:mm]
L-b 0,69 2:45 12:15 9:30
LO1-b 0,67 4:20 13:15 8:55
LO3-b 0,64 3:10 12:55 9:45
H-b 0,42 1:25 8:50 7:25
HO1-b 0,42 1:45 8:25 6:40
HO3-b 0,43 1:45 12:00 10:15
P-b 0,69 3:00 15:25 12:25
PO1-b 0,72 3:05 19:40 16:35
PO3-b 0,77 3:05 21:00 17:55
B-b 0,64 3:40 14:50 11:10
BO1-b 0,60 3:50 19:10 15:20
BO3-b 0,60 4:15 21:00 16:45
C1-b 0,68 3:00 15:10 12:10
C1O1-b 0,72 3:20 16:45 13:25
C1O3-b 0,72 3:00 19:20 16:20
C2-b 0,74 3:30 12:20 8:50
C2O1-b 0,64 2:45 12:30 9:45
C2O3-b 0,64 2:45 17:40 14:55
* composition of binders is listed in Table 14 in the following section
** accuracy is ± 10min, only values in grey fields have accuracy ± 1h
4.3 COMPOSITION AND PROPERTIES OF FRESH MORTARS
Compositions of prepared mortars correspond to the historic mortars (hydrated lime
mortar, lime with pozzolan, lime-pozzolanic mortar with brick dust (50)), but also mortars with
new type of mortars were prepared (hydraulic lime mortar and mortars with 5% and 10%
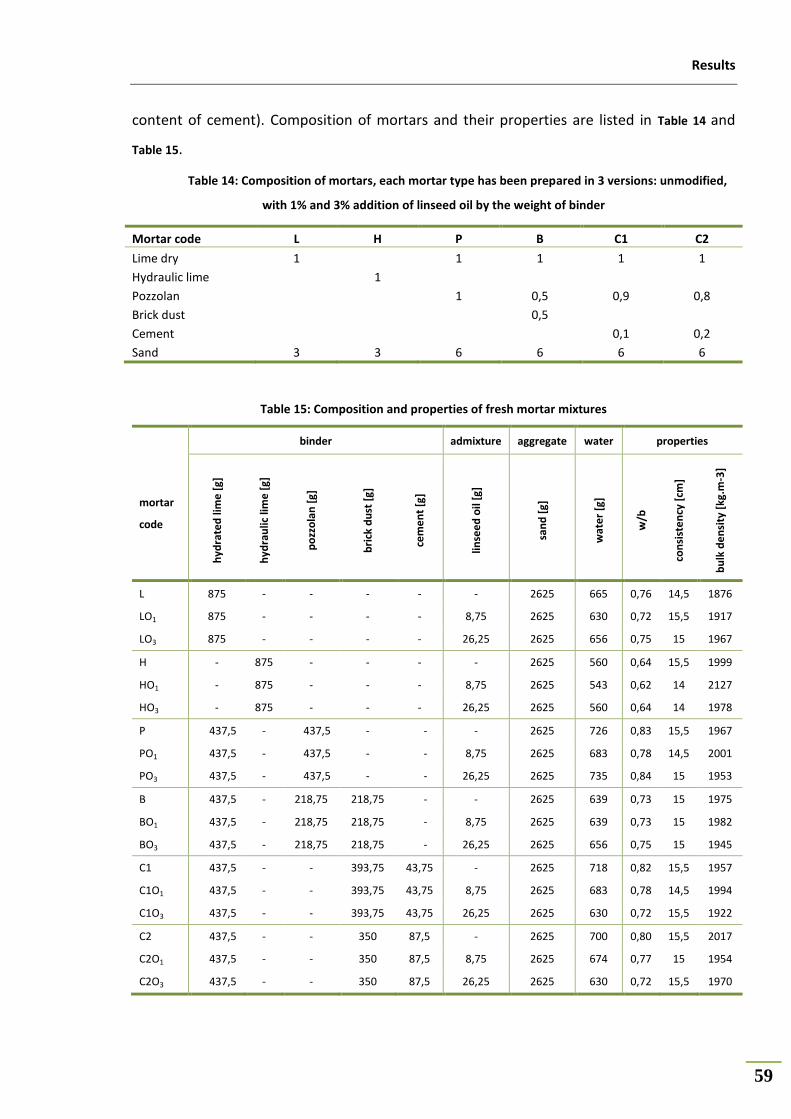
Results
59
content of cement). Composition of mortars and their properties are listed in Table 14 and
Table 15.
Table 14: Composition of mortars, each mortar type has been prepared in 3 versions: unmodified,
with 1% and 3% addition of linseed oil by the weight of binder
Mortar code L H P B C1 C2
Lime dry 1
1 1 1 1
Hydraulic lime
1 Pozzolan
1 0,5 0,9 0,8
Brick dust
0,5 Cement
0,1 0,2
Sand 3 3 6 6 6 6
Table 15: Composition and properties of fresh mortar mixtures
binder admixture aggregate water properties
mortar
code
hyd
rate
d li
me
[g]
hyd
rau
lic li
me
[g]
po
zzo
lan
[g]
bri
ck d
ust
[g]
cem
en
t [g
]
linse
ed
oil
[g]
san
d [
g]
wat
er
[g]
w/b
con
sist
en
cy [
cm]
bu
lk d
en
sity
[kg
.m-3
]
L 875 - - - - - 2625 665 0,76 14,5 1876
LO1 875 - - - - 8,75 2625 630 0,72 15,5 1917
LO3 875 - - - - 26,25 2625 656 0,75 15 1967
H - 875 - - - - 2625 560 0,64 15,5 1999
HO1 - 875 - - - 8,75 2625 543 0,62 14 2127
HO3 - 875 - - - 26,25 2625 560 0,64 14 1978
P 437,5 - 437,5 - - - 2625 726 0,83 15,5 1967
PO1 437,5 - 437,5 - - 8,75 2625 683 0,78 14,5 2001
PO3 437,5 - 437,5 - - 26,25 2625 735 0,84 15 1953
B 437,5 - 218,75 218,75 - - 2625 639 0,73 15 1975
BO1 437,5 - 218,75 218,75 - 8,75 2625 639 0,73 15 1982
BO3 437,5 - 218,75 218,75 - 26,25 2625 656 0,75 15 1945
C1 437,5 - - 393,75 43,75 - 2625 718 0,82 15,5 1957
C1O1 437,5 - - 393,75 43,75 8,75 2625 683 0,78 14,5 1994
C1O3 437,5 - - 393,75 43,75 26,25 2625 630 0,72 15,5 1922
C2 437,5 - - 350 87,5 - 2625 700 0,80 15,5 2017
C2O1 437,5 - - 350 87,5 8,75 2625 674 0,77 15 1954
C2O3 437,5 - - 350 87,5 26,25 2625 630 0,72 15,5 1970

Results
60
Table 15 shows amount of components used for preparation of one mortar dosage,
which is amount of which 6-7 prisms (4 x 4 x 16 cm) or 3 disc specimens (Ø16 cm x 2 cm) can
be prepared. To get the desired amount of specimens, each mortar mixture has been
prepared three times. Amount of dry constituents and oil has been always the same, but
amount of kneading water needed to maintain the same consistency varied (±5%), since the
consistency of fresh mortar is affected by many factors (temperature, humidity, speed of
adding water into dried constituents...). Values of water amount and fresh mortars´
properties are mean value of the three values.
4.4 PROPERTIES OF HARDENED MORTARS
4.4.1 MECHANICAL PROPERTIES
Mean values of flexural strength are listed in Table 16, compressive strength in
Table 17, and the mean values of dynamic modulus of elasticity are listed in Table 18.

Results
61
Table 16: Flexural strength
Mortar code
1 month 3 months 1 year
fle
xura
l str
en
gth
[MP
a]
sta
nd
ard
dev
iati
on
[M
Pa
]
coef
fici
ent
of
vari
ati
on
[%
]
fle
xura
l str
en
gth
[MP
a]
sta
nd
ard
dev
iati
on
[M
Pa
]
coef
fici
ent
of
vari
ati
on
[%
]
fle
xura
l str
en
gth
[MP
a]
sta
nd
ard
dev
iati
on
[M
Pa
]
coef
fici
ent
of
vari
ati
on
[%
]
L 0,11 0,011 10 0,23 0,021 9 0,35 0,134 38
LO1 0,11 0,043 39 0,13 0,029 22 0,33 0,032 10
LO3 0,09 0,014 15 0,04 0,021 53 - - -
H 0,91 0,074 8 1,20 0,116 10 1,03 0,191 19
HO1 1,06 0,045 4 1,32 0,220 17 1,04 0,144 14
HO3 0,22 0,013 6 0,48 0,077 16 - - -
P 1,77 0,264 15 1,88 0,183 10 0,58 0,067 12
PO1 1,64 0,203 12 1,37 0,158 12 1,87 0,110 6
PO3 0,47 0,092 20 1,06 0,052 5 - - -
B 1,00 0,057 6 1,30 0,084 6 0,44 0,068 15
BO1 1,33 0,147 11 1,43 0,218 15 1,35 0,164 12
BO3 0,17 0,013 8 0,42 0,039 9 - - -
C1 2,00 0,102 5 1,39 0,230 16 0,71 0,115 16
C1O1 1,57 0,307 20 1,73 0,260 15 1,27 0,159 13
C1O3 0,50 0,016 3 0,18 0,071 40 - - -
C2 1,77 0,086 5 1,53 0,263 17 0,48 0,095 20
C2O1 1,49 0,102 7 1,62 0,103 6 1,34 0,063 5
C2O3 0,72 0,038 5 0,70 0,116 17 - - -

Results
62
Table 17: Comressive strength
Mortar code
3 months 1 year
Co
mp
ress
ive
stre
ngt
h [
MP
a]
sta
nd
ard
dev
iati
on
[M
Pa
]
coef
fici
ent
of
vari
atio
n [
%]
Co
mp
ress
ive
stre
ngt
h [
MP
a]
sta
nd
ard
dev
iati
on
[M
Pa
]
coef
fici
ent
of
vari
atio
n [
%]
L 0,46 0,049 11 1,04 0,220 21
LO1 0,27 0,015 6 0,52 0,051 10
LO3 *
- - -
H 3,64 0,134 4 10,96 1,018 9
HO1 3,1 0,316 10 6,89 0,154 2
HO3 2,08 0,462 22 - - -
P 8,81 0,277 3 6,37 0,275 4
PO1 9,56 0,336 4 12,53 1,152 9
PO3 3,65 0,568 16 - - -
B 6,25 0,495 8 5,35 0,277 5
BO1 5,78 0,434 8 8,76 0,370 4
BO3 1,10 0,083 7 - - -
C1 8,08 0,575 7 7,89 0,713 9
C1O1 9,72 0,038 0 9,77 1,443 15
C1O3 0,84 0,206 25 - - -
C2 8,53 0,518 6 6,9 0,002 0
C2O1 10,09 0,130 1 13,21 0,412 3
C2O3 2,26 0,118 5 - - -
*below detection
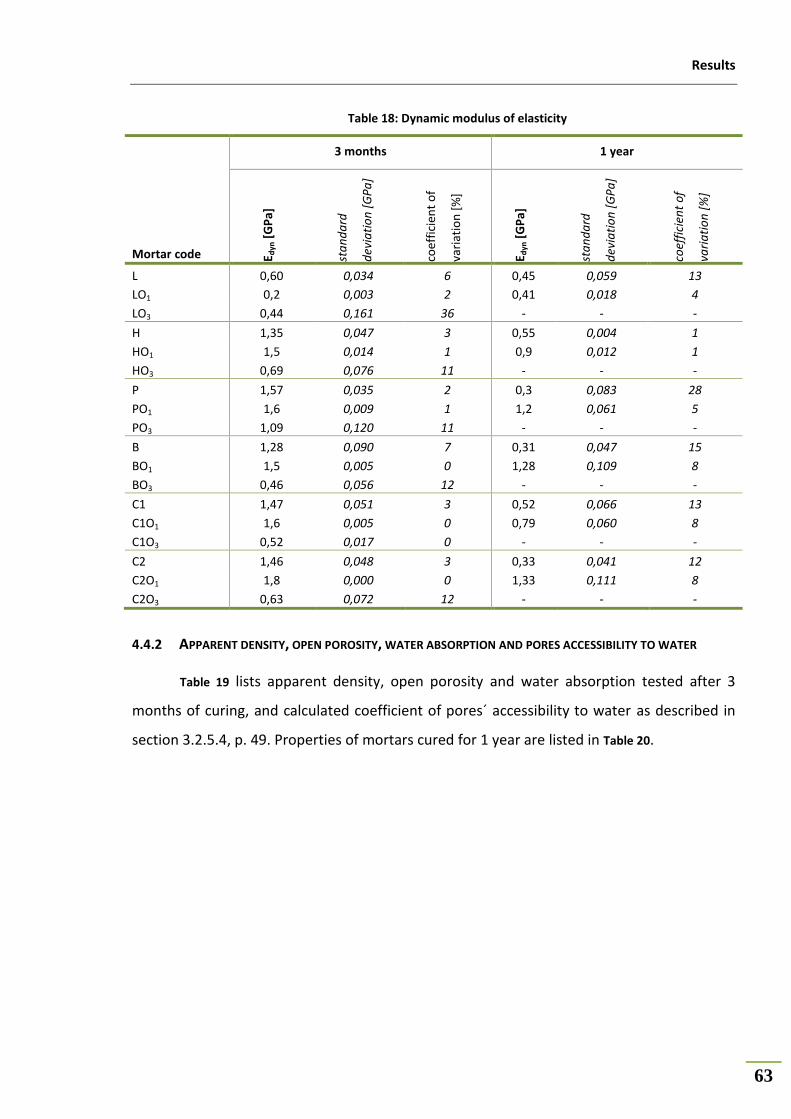
Results
63
Table 18: Dynamic modulus of elasticity
Mortar code
3 months 1 year
E dyn
[G
Pa]
sta
nd
ard
dev
iati
on
[G
Pa
]
coef
fici
ent
of
vari
atio
n [
%]
E dyn
[G
Pa]
sta
nd
ard
dev
iati
on
[G
Pa
]
coef
fici
ent
of
vari
ati
on
[%
]
L 0,60 0,034 6 0,45 0,059 13
LO1 0,2 0,003 2 0,41 0,018 4
LO3 0,44 0,161 36 - - -
H 1,35 0,047 3 0,55 0,004 1
HO1 1,5 0,014 1 0,9 0,012 1
HO3 0,69 0,076 11 - - -
P 1,57 0,035 2 0,3 0,083 28
PO1 1,6 0,009 1 1,2 0,061 5
PO3 1,09 0,120 11 - - -
B 1,28 0,090 7 0,31 0,047 15
BO1 1,5 0,005 0 1,28 0,109 8
BO3 0,46 0,056 12 - - -
C1 1,47 0,051 3 0,52 0,066 13
C1O1 1,6 0,005 0 0,79 0,060 8
C1O3 0,52 0,017 0 - - -
C2 1,46 0,048 3 0,33 0,041 12
C2O1 1,8 0,000 0 1,33 0,111 8
C2O3 0,63 0,072 12 - - -
4.4.2 APPARENT DENSITY, OPEN POROSITY, WATER ABSORPTION AND PORES ACCESSIBILITY TO WATER
Table 19 lists apparent density, open porosity and water absorption tested after 3
months of curing, and calculated coefficient of pores´ accessibility to water as described in
section 3.2.5.4, p. 49. Properties of mortars cured for 1 year are listed in Table 20.
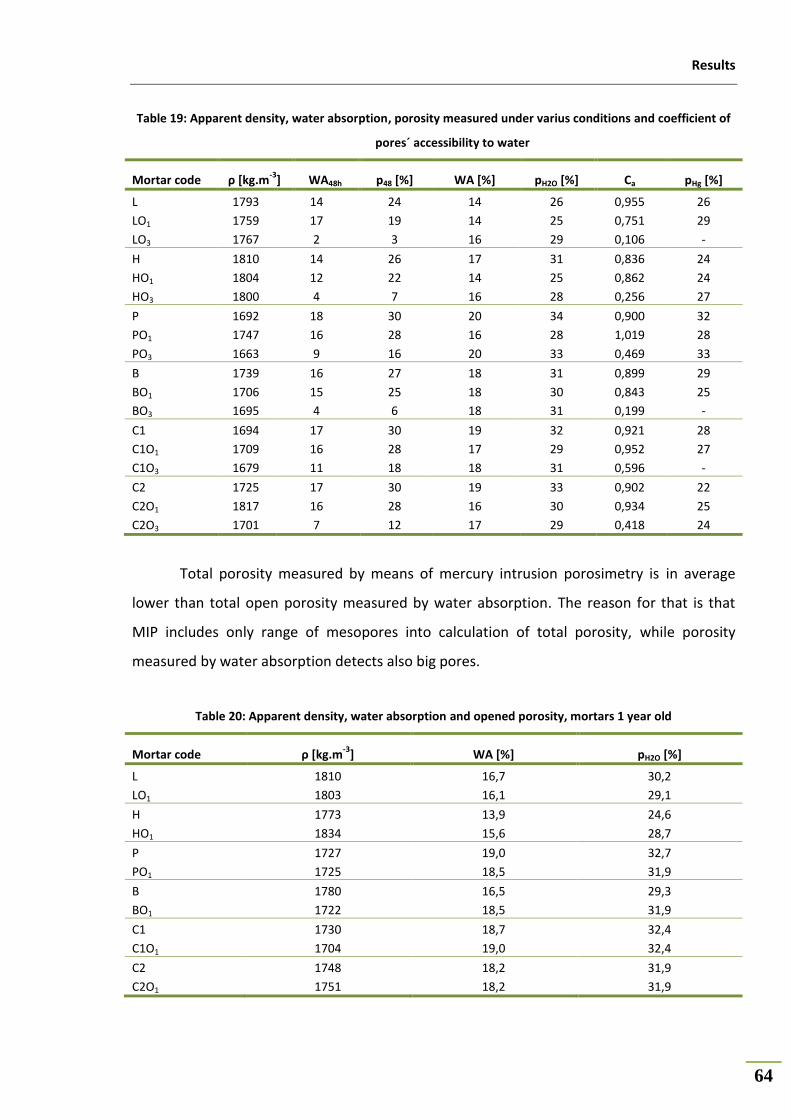
Results
64
Table 19: Apparent density, water absorption, porosity measured under varius conditions and coefficient of
pores´ accessibility to water
Mortar code ρ [kg.m-3
] WA48h p48 [%] WA [%] pH2O [%] Ca pHg [%]
L 1793 14 24 14 26 0,955 26
LO1 1759 17 19 14 25 0,751 29
LO3 1767 2 3 16 29 0,106 -
H 1810 14 26 17 31 0,836 24
HO1 1804 12 22 14 25 0,862 24
HO3 1800 4 7 16 28 0,256 27
P 1692 18 30 20 34 0,900 32
PO1 1747 16 28 16 28 1,019 28
PO3 1663 9 16 20 33 0,469 33
B 1739 16 27 18 31 0,899 29
BO1 1706 15 25 18 30 0,843 25
BO3 1695 4 6 18 31 0,199 -
C1 1694 17 30 19 32 0,921 28
C1O1 1709 16 28 17 29 0,952 27
C1O3 1679 11 18 18 31 0,596 -
C2 1725 17 30 19 33 0,902 22
C2O1 1817 16 28 16 30 0,934 25
C2O3 1701 7 12 17 29 0,418 24
Total porosity measured by means of mercury intrusion porosimetry is in average
lower than total open porosity measured by water absorption. The reason for that is that
MIP includes only range of mesopores into calculation of total porosity, while porosity
measured by water absorption detects also big pores.
Table 20: Apparent density, water absorption and opened porosity, mortars 1 year old
Mortar code ρ [kg.m-3
] WA [%] pH2O [%]
L 1810 16,7 30,2
LO1 1803 16,1 29,1
H 1773 13,9 24,6
HO1 1834 15,6 28,7
P 1727 19,0 32,7
PO1 1725 18,5 31,9
B 1780 16,5 29,3
BO1 1722 18,5 31,9
C1 1730 18,7 32,4
C1O1 1704 19,0 32,4
C2 1748 18,2 31,9
C2O1 1751 18,2 31,9

Results
65
4.4.3 DRYING RATE
Mortars´ drying rates expressed as a function of time are showed in Figure 63, p.96.
4.4.4 PORE SIZE DISTRIBUTION
Graf comparing pore size distributions of individual mortar types is presented in
Figure 25, p. 81 and Figure 27, p. 82. Values of overall porosity of mesopores are listed in Table
19 on the previous page.
4.4.5 CAPILLARY ACTION
Capillary action is expressed by the coefficient of water (salt solution) absorption,
which values for various types of mortars are listed in Table 21.
Table 21: Coefficient of water (salt solution) absorption of mortars with different content of linseed oil at
different stages of curing
Mortar code
4-6 weeks 3 months 1 year
water 10wt% NaCl water 10wt% NaCl water 10wt% NaCl
L 1,51 1,51 2,06 2,00 1,59 1,61
LO1 0,50 0,37 0,18 0,29 0,49 0,81
LO3 0,02 0,03 -0,02 0,00 - -
H 1,35 1,38 1,30 1,09 1,60 1,38
HO1 0,48 0,48 0,27 0,37 0,47 0,60
HO3 0,05 0,06 0,06 0,05 - -
P 1,69 1,62 2,18 2,08 1,77 2,08
PO1 1,47 1,30 0,99 1,13 0,96 0,93
PO3 0,07 0,05 0,07 0,17 - -
B 1,21 1,06 1,32 1,11 1,99 1,99
BO1 0,41 0,59 0,60 0,83 0,71 0,69
BO3 0,03 0,03 0,04 0,03 - -
C1 1,54 1,64 1,91 1,93 1,15 1,47
C1O1 0,92 1,05 0,90 1,07 0,77 0,75
C1O3 0,31 0,25 0,47 0,30 - -
C2 1,04 1,17 1,56 1,24 1,91 1,65
C2O1 0,57 0,78 0,64 0,75 0,69 0,73
C2O3 0,17 0,12 0,11 0,08 - -

Results
66
4.4.6 CONTACT ANGLE
Table 22 shows pictures of water drops on samples of hardened binder pastes with
different oil content. It is obvious that even only 1% addition of oil by weight is significantly
increasing all binders´ hydrophobicity a. Samples of binders with no oil addition absorb water
drop immediately after application, but binders with oil show hydrophobic properties. The
effect is the most evident on the samples of hydrated lime (code L): while water drop got
immediately absorbed into the unmodified sample, sample with 1% oil addition was
hydrophobic – the contact angle was nearly 90°. Sample of hydrated lime with 3% of oil
(code LO3) showed to be totally hydrophobic (cohesive forces among water molecules
exceed the adsorption forces to polar surface of the material) - water drops hardly held on
sample´s surface, as seen on the picture below. On the other hand, 1% addition of oil has not
had effect on hydraulic lime samples (code HO1), nevertheless sample with 3% of oil addition
(code HO3) did show increased hydrophobicity.
Table 22: Contact angle on hardened binder pastes
Binder paste
code
unmodified 1% linseed oil 3% linseed oil
L
H
P
B
C1
a The term “hydrophobic” applies according to a definition to materials on which water drop makes contact angle higher than 90°. In this
thesis by the term ”hydrophobicity“ is meant a general ability of material to repel water.

Results
67
4.4.7 COLOUR CLASSIFICATION
Colour classification of hardened binder pastes determined at the age of 1 month
according to Munsell Soil Colour Charts is showed in Table 23.
Table 23: Munsell chart colour determination of hardened binder pastes
Binder type unmodified 1% linseed oil 3% linseed oil
L white GLEY 8 * white 2,5Y 8/1 * pale yellow 2,5Y 8/2 *
H very pale brown 8/2 10YR very pale brown 8/2 10YR light grey 10YR 7/2
P white 5YR 8/1 white 5YR 8/1 white 5YR 8/1
B pinkish white 10R 8/2 pinkish white 10R 8/2 pink 2,5YR 8/3
C1 white 5YR 8/1 white 5YR 8/1 white 5YR 8/1
* hydrated lime samples (L) had lighter colour than listed, their actual colour was out of the Munsell chart colour range.
Linseed oil generally did not have effect on colour distinguishable by naked eye. Only
hydrated lime (code L) with 3% oil showed slightly yellowish shade comparing to snow white
colour of unmodified specimen.
4.4.8 WATER VAPOUR PERMEABILITY
Values of the measured coefficients of water vapour permeability are shown in Table
24. Unfortunately, only hydrated lime and hydraulic lime mortars with 3% of oil and
unmodified ones could be tested. Other mortar samples has not been possible to test due to
the failure of climatic chamber, which has not been repaired until the termination of the
Episcon project. However, the addition of linseed oil does not seem to decrease water
vapour permeability. Coefficient of water vapour permeability of hydrated lime mortar (code
L) is at the same level for both modified and unmodifies mortar; hydraulic lime mortar
specimen showed to have even higher permeability when linseed oil was added.
Table 24: Coefficient of water vapour permeability
mortar code Cv [g.m-².h
-1]
L 3,997
LO3 3,929
H 1,404
HO3 2,583
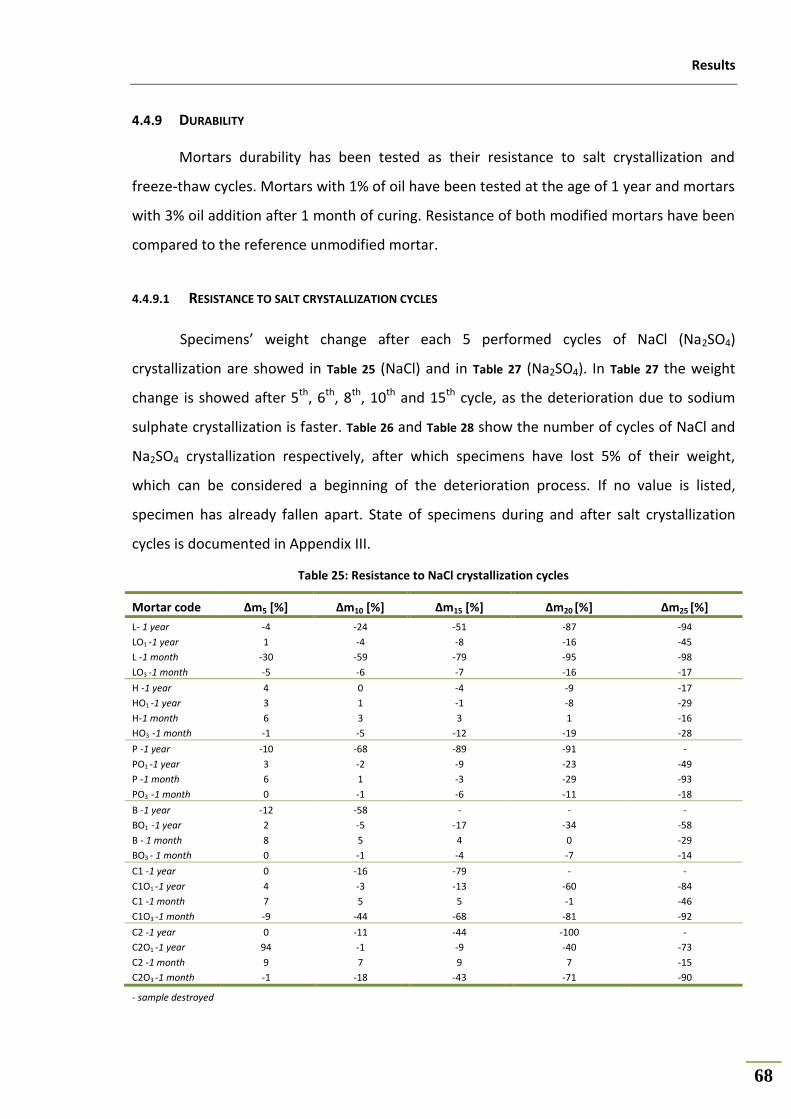
Results
68
4.4.9 DURABILITY
Mortars durability has been tested as their resistance to salt crystallization and
freeze-thaw cycles. Mortars with 1% of oil have been tested at the age of 1 year and mortars
with 3% oil addition after 1 month of curing. Resistance of both modified mortars have been
compared to the reference unmodified mortar.
4.4.9.1 RESISTANCE TO SALT CRYSTALLIZATION CYCLES
Specimens’ weight change after each 5 performed cycles of NaCl (Na2SO4)
crystallization are showed in Table 25 (NaCl) and in Table 27 (Na2SO4). In Table 27 the weight
change is showed after 5th, 6th, 8th, 10th and 15th cycle, as the deterioration due to sodium
sulphate crystallization is faster. Table 26 and Table 28 show the number of cycles of NaCl and
Na2SO4 crystallization respectively, after which specimens have lost 5% of their weight,
which can be considered a beginning of the deterioration process. If no value is listed,
specimen has already fallen apart. State of specimens during and after salt crystallization
cycles is documented in Appendix III.
Table 25: Resistance to NaCl crystallization cycles
Mortar code Δm5 [%] Δm10 [%] Δm15 [%] Δm20 [%] Δm25 [%]
L- 1 year -4 -24 -51 -87 -94
LO1 -1 year 1 -4 -8 -16 -45
L -1 month -30 -59 -79 -95 -98
LO3 -1 month -5 -6 -7 -16 -17
H -1 year 4 0 -4 -9 -17
HO1 -1 year 3 1 -1 -8 -29
H-1 month 6 3 3 1 -16
HO3 -1 month -1 -5 -12 -19 -28
P -1 year -10 -68 -89 -91 -
PO1 -1 year 3 -2 -9 -23 -49
P -1 month 6 1 -3 -29 -93
PO3 -1 month 0 -1 -6 -11 -18
B -1 year -12 -58 - - -
BO1 -1 year 2 -5 -17 -34 -58
B - 1 month 8 5 4 0 -29
BO3 - 1 month 0 -1 -4 -7 -14
C1 -1 year 0 -16 -79 - -
C1O1 -1 year 4 -3 -13 -60 -84
C1 -1 month 7 5 5 -1 -46
C1O3 -1 month -9 -44 -68 -81 -92
C2 -1 year 0 -11 -44 -100 -
C2O1 -1 year 94 -1 -9 -40 -73
C2 -1 month 9 7 9 7 -15
C2O3 -1 month -1 -18 -43 -71 -90
- sample destroyed

Results
69
Table 26: Beginning of deterioration due to NaCl crystallization cycles
1 year old 1 month old
Mortar type unmodified 1% linseed oil unmodified 3% linseed oil
L 6 12 2 5
H 14 19 24 10
P 4 13 16 15
B 3 9 21 18
C1 7 9 21 4
C2 8 13 24 8
Table 27: Resistance to Na2SO4 crystallization cycles
Mortar code Δm5 [%] Δm6 [%] Δm8 [%] Δm10 [%] Δm15 [%]
L- 1 year -75 -100 - - -
LO1 -1 year -100 - - - -
L -1 month -95 -100 - - -
LO3 -1 month -4 -6 36 -40 -41
H -1 year -16 -90 -100 - -
HO1 -1 year -17 -85 -100 - -
H-1 month -68 -100 - - -
HO3 -1 month -21 -61 -80 - -
P -1 year -92 -100 - - -
PO1 -1 year -31 -87 -100 - -
P -1 month -15 -80 - - -
PO3 -1 month -12 -95 - - -
B -1 year -50 -100 - - -
BO1 -1 year -29 -45 -93 - -
B - 1 month -76 -96 - - -
BO3 - 1 month -2 -7 -14 -23 -72
C1 -1 year -55 -100 - - -
C1O1 -1 year -42 -75 - - -
C1 -1 month -27 -100 - - -
C1O3 -1 month -100 - - - -
C2 -1 year -64 -100 - - -
C2O1 -1 year -19 -76 -100 - -
C2 -1 month -6 -100 - - -
C2O3 -1 month -63 -79 -89 -97 -
- sample destroyed
Table 28: Beginning of deterioration due to Na2SO4 crystallization cycles
1 year old 1 month old
Mortar type unmodified 1% linseed oil unmodified 3% linseed oil
L 4 3 2 6
H 4 5 4 4
P 3 4 5 5
B 4 5 4 6
C1 4 4 5 2
C2 4 4 5 3
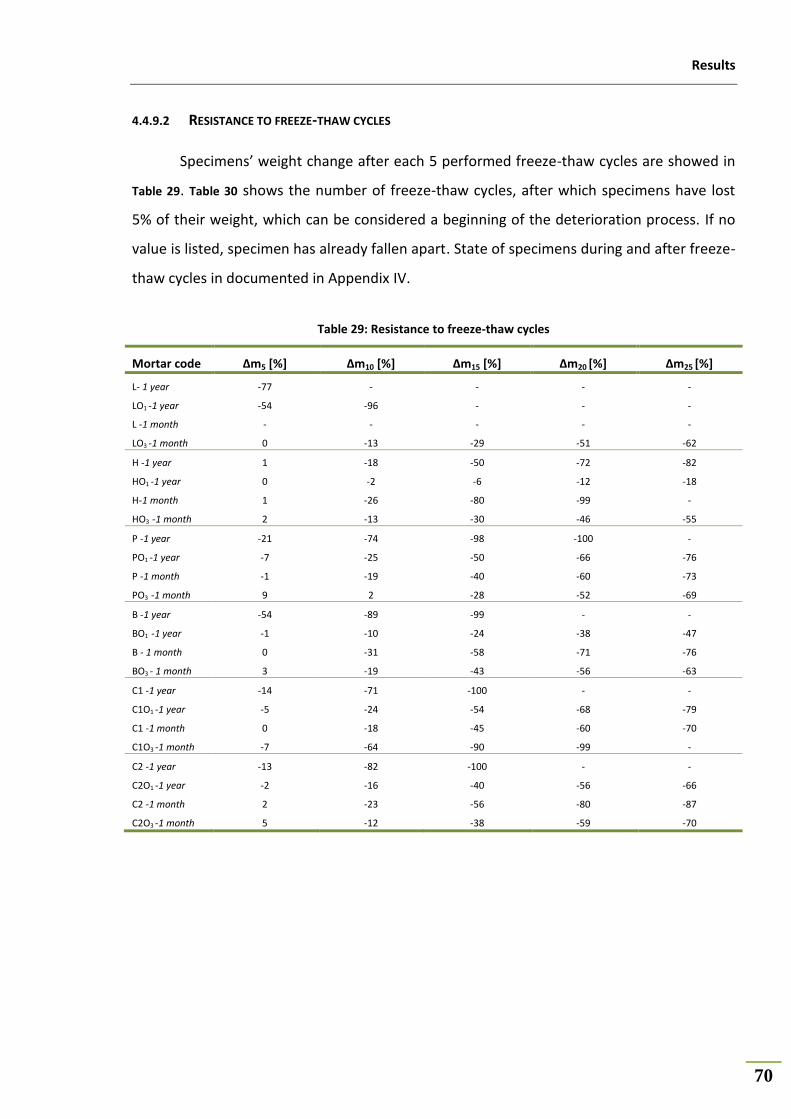
Results
70
4.4.9.2 RESISTANCE TO FREEZE-THAW CYCLES
Specimens’ weight change after each 5 performed freeze-thaw cycles are showed in
Table 29. Table 30 shows the number of freeze-thaw cycles, after which specimens have lost
5% of their weight, which can be considered a beginning of the deterioration process. If no
value is listed, specimen has already fallen apart. State of specimens during and after freeze-
thaw cycles in documented in Appendix IV.
Table 29: Resistance to freeze-thaw cycles
Mortar code Δm5 [%] Δm10 [%] Δm15 [%] Δm20 [%] Δm25 [%]
L- 1 year -77 - - - -
LO1 -1 year -54 -96 - - -
L -1 month - - - - -
LO3 -1 month 0 -13 -29 -51 -62
H -1 year 1 -18 -50 -72 -82
HO1 -1 year 0 -2 -6 -12 -18
H-1 month 1 -26 -80 -99 -
HO3 -1 month 2 -13 -30 -46 -55
P -1 year -21 -74 -98 -100 -
PO1 -1 year -7 -25 -50 -66 -76
P -1 month -1 -19 -40 -60 -73
PO3 -1 month 9 2 -28 -52 -69
B -1 year -54 -89 -99 - -
BO1 -1 year -1 -10 -24 -38 -47
B - 1 month 0 -31 -58 -71 -76
BO3 - 1 month 3 -19 -43 -56 -63
C1 -1 year -14 -71 -100 - -
C1O1 -1 year -5 -24 -54 -68 -79
C1 -1 month 0 -18 -45 -60 -70
C1O3 -1 month -7 -64 -90 -99 -
C2 -1 year -13 -82 -100 - -
C2O1 -1 year -2 -16 -40 -56 -66
C2 -1 month 2 -23 -56 -80 -87
C2O3 -1 month 5 -12 -38 -59 -70

Results
71
Table 30: Beginning of deterioratration due to the freeze-thaw cycles (expressed as a number of cycles after
which 5% weight loss occured)
1 year old 1 month old
Mortar type unmodified 1% linseed oil unmodified 3% linseed oil
L 3 5 1 8
H 9 13 8 8
P 3 5 7 12
B 2 8 8 8
C1 4 5 7 5
C2 4 7 8 9
4.5 OBSERVATION OF OIL IN MORTAR STRUCTURE
Mortar specimens have been observed under UV light and scanning electron
microscope; pictures are showed and discussed in Chapter 5.
4.6 STUDYING OF CHEMICAL CHANGES OF OIL IN MORTAR AND OIL AGING
Figure 16 shows spectra of binder pastes with linseed oil (see 3.2.6.2, p. 56) compared to
spectra of dried and fresh (M2ADL database) linseed oil film. IR vibrational assignments of
raw linseed oil are listed in Table 31.
Spectrum of linseed oil shows signs of polymerization, there is a decrease in intensity
of peak of isolated double bonds, meaning that some of the double-bonds have reacted to
make cross-links. According to literature, triacylglycerols present in oil decompose in basic
environment, giving rise to formation of fatty acids, which interact with calcium kations (23; 48;
5; 4; 7). Nevertheless, neither free fatty acids nor calcium carboxylates have been identified in
FTIR spectra (68).
Table 31: IR vibrational assignments of raw linseed oil (47)
Band possition [cm-1
] Intensitya Assignment
b
3011 m ν(C-H)=CH
~2960 sh νa(C-H)CH3
2926 s νa(C-H)CH2
2855 s νs(C-H)CH2
1747 s ν(C=O)
1658 w ν(C=C)
1464 s δ(CH2)
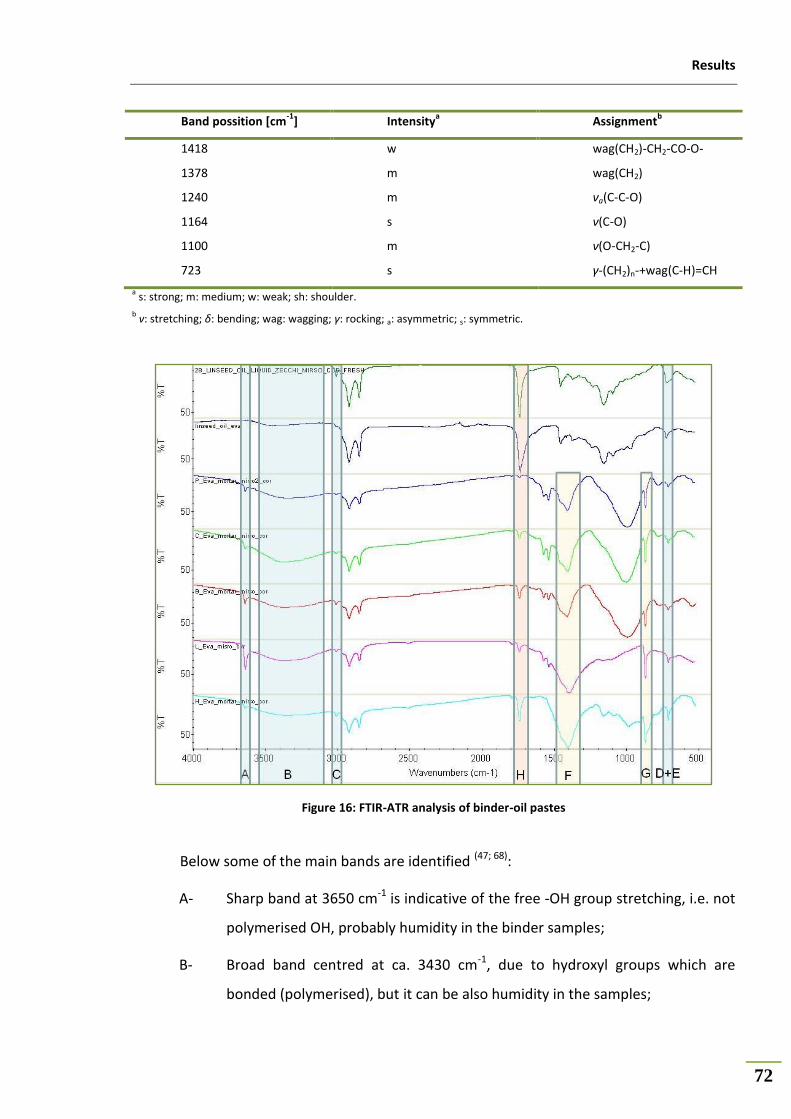
Results
72
Band possition [cm-1
] Intensitya Assignment
b
1418 w wag(CH2)-CH2-CO-O-
1378 m wag(CH2)
1240 m νa(C-C-O)
1164 s ν(C-O)
1100 m ν(O-CH2-C)
723 s γ-(CH2)n-+wag(C-H)=CH
a s: strong; m: medium; w: weak; sh: shoulder.
b v: stretching; δ: bending; wag: wagging; γ: rocking; a: asymmetric; s: symmetric.
Figure 16: FTIR-ATR analysis of binder-oil pastes
Below some of the main bands are identified (47; 68):
A- Sharp band at 3650 cm-1 is indicative of the free -OH group stretching, i.e. not
polymerised OH, probably humidity in the binder samples;
B- Broad band centred at ca. 3430 cm-1, due to hydroxyl groups which are
bonded (polymerised), but it can be also humidity in the samples;
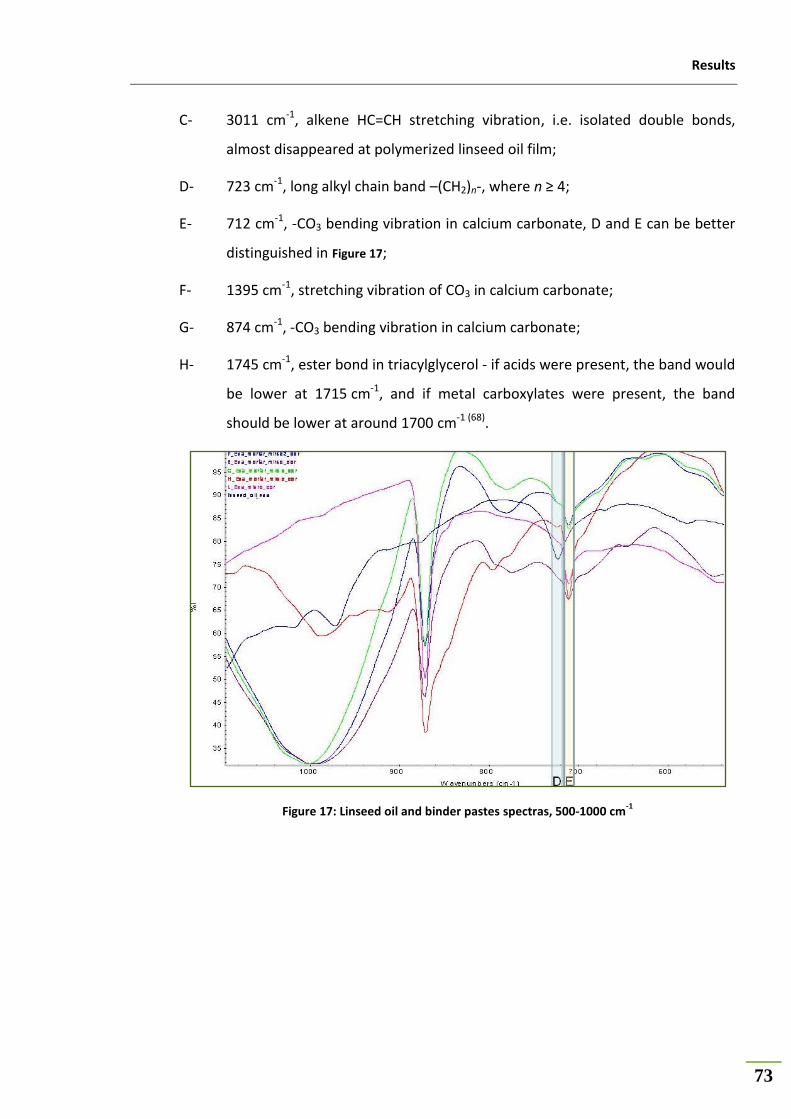
Results
73
C- 3011 cm-1, alkene HC=CH stretching vibration, i.e. isolated double bonds,
almost disappeared at polymerized linseed oil film;
D- 723 cm-1, long alkyl chain band –(CH2)n-, where n ≥ 4;
E- 712 cm-1, -CO3 bending vibration in calcium carbonate, D and E can be better
distinguished in Figure 17;
F- 1395 cm-1, stretching vibration of CO3 in calcium carbonate;
G- 874 cm-1, -CO3 bending vibration in calcium carbonate;
H- 1745 cm-1, ester bond in triacylglycerol - if acids were present, the band would
be lower at 1715 cm-1, and if metal carboxylates were present, the band
should be lower at around 1700 cm-1 (68).
Figure 17: Linseed oil and binder pastes spectras, 500-1000 cm-1

Discussion
74
5 Discussion
5.1 THE EFFECT OF LINSEED OIL ON THE PROPERTIES OF FRESH MORTARS
The addition of linseed oil is improving fresh mortars´ plasticity and workability.
Modified mixtures have been generally more compact and easier to work with. Addition of
1% of linseed oil is slightly decreasing water-binder ratio while maintaining the same
consistency. Nevertheless, the water-binder ratio of mortars with 3% addition of oil stayed
at the same level as that of unmodified mortars. The explanation might be the fact that the
mortars with 3% of oil paradoxically required higher amount of kneading water than the
mortars with only 1% of oil. As the water was being added, mortar first became too compact
and rather sticky, so that it required more kneading water compared to mortars with 1% oil
addition to reach the same workability. Also Rovnaníková (4) mentions decreased workability
of fresh mortar with the oil addition. Explanation of this phenomenon could be that oil,
being a hydrophobic substance, tends to soak into the solid phase, covering particles of
binder and aggregate, and thus increases cohesion of binder paste. When oil is added in a
little amount it improves mortar´s consistency, but at higher additions of oil the increased
cohesion results into very stiff mortar (particles are “glued” together) which consequently
requires more kneading water to reach appropriate workability.
This explanation has been supported by preparation of hydrated lime and hydraulic
lime mortar with high addition of oil - 5% by the weight of binder. Fresh mortars have been
very compact, plastic and rather stiff. Increasing of water additions did not lead to increased
plasticity, water was not fully mixed in mortar mass and the excess water has been being
released out of the mass of mortar, making little pools in the mortar mixture. When
determining the consistency by vibrations of a flow table, formation of fissures few
centimetres long throughout the mass of mortar and consequent releasing of excess water
has been observed. This phenomenon will later give an explanation of different effect of 1%
and 3% oil addition on some properties of hardened mortars, which will be discussed later.
However, the different water-binder ratios did not affect the bulk density of fresh
mortar; it stayed on the same level for all mortar mixtures.

Discussion
75
0
2
4
6
8
10
12
14
L HL P B C1 C2
[MP
a]
mortar code
Compressive strength
unmodified - 1 year
linseed oil 1% - 1 year
0
2
4
6
8
10
12
14
L HL P B C1 C2
[MP
a]
mortar code
Compressive strength
unmodified - 3 months
linseed oil 1% - 3 months
Addition of linseed oil did have effect on setting of hydraulic mortars. While the
initial setting time has not been affected by either 1% or 3% addition of linseed oil, the final
setting time of mortars with oil addition has been retarded. It seems that oil does not play a
role at an initial phase of setting, where there is enough water available for the hydration of
hydraulic binder. But as the setting continues the water is consumed and the concentration
of oil in a liquid phase increases, thus the oil droplets may block the pores and slow down
the hydration (49). In case of hydrated lime mortar the final setting time has not been
affected as significantly, because the mechanism of hydrated lime setting and hardening is
different than that of hydraulic limes, hydrated lime is air-hardening, i.e. water does not play
as important role as it does in hardening of hydraulic binders, it is only a transport medium
for carbon dioxide and does not directly participate in the hardening reactions.
5.2 THE EFFECT OF LINSEED OIL ON THE PROPERTIES OF HARDENED MORTARS
5.2.1 THE EFFECT OF LINSEED OIL ON THE MECHANICAL PROPERTIES OF MORTARS
Mechanical properties of mortars with 1% oil addition
Following figures show compressive strengths of mortars with 1% addition of linseed
oil measured after 3 month (Figure 19) and 1 year (Figure 18) of curing.
As seen in Figure 19, oil in 1% concentration did not have significant effect on the
compressive strength tested at 3 months. This is in agreement with the study of Justnes et
al. (48), who tested the effect of oil on cement mortar (0,5%, 1% and 1,5% by the weight of
Figure 18: Compressive strength of mortars with 1%
of linseed oil compared to unmodified mortars at
the age of 1 year
Figure 19: Compressive strength of mortars with 1%
of linseed oil compared to unmodified mortars at
the age of 3 months
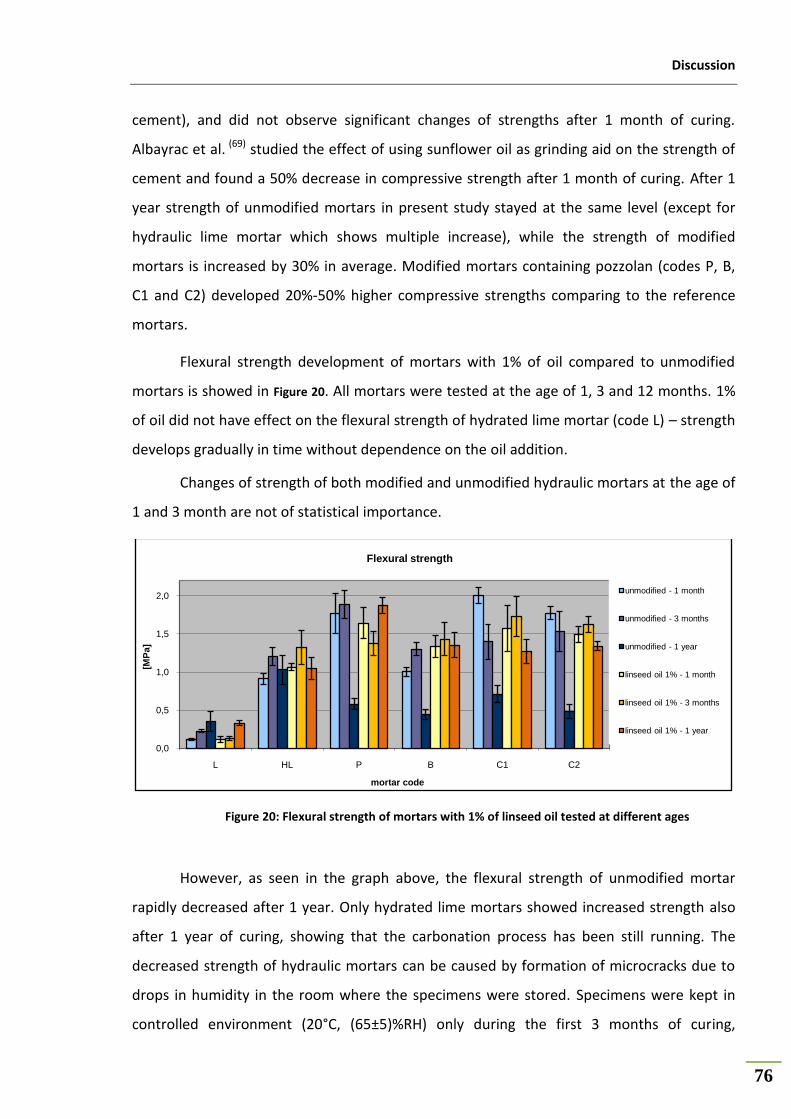
Discussion
76
cement), and did not observe significant changes of strengths after 1 month of curing.
Albayrac et al. (69) studied the effect of using sunflower oil as grinding aid on the strength of
cement and found a 50% decrease in compressive strength after 1 month of curing. After 1
year strength of unmodified mortars in present study stayed at the same level (except for
hydraulic lime mortar which shows multiple increase), while the strength of modified
mortars is increased by 30% in average. Modified mortars containing pozzolan (codes P, B,
C1 and C2) developed 20%-50% higher compressive strengths comparing to the reference
mortars.
Flexural strength development of mortars with 1% of oil compared to unmodified
mortars is showed in Figure 20. All mortars were tested at the age of 1, 3 and 12 months. 1%
of oil did not have effect on the flexural strength of hydrated lime mortar (code L) – strength
develops gradually in time without dependence on the oil addition.
Changes of strength of both modified and unmodified hydraulic mortars at the age of
1 and 3 month are not of statistical importance.
Figure 20: Flexural strength of mortars with 1% of linseed oil tested at different ages
However, as seen in the graph above, the flexural strength of unmodified mortar
rapidly decreased after 1 year. Only hydrated lime mortars showed increased strength also
after 1 year of curing, showing that the carbonation process has been still running. The
decreased strength of hydraulic mortars can be caused by formation of microcracks due to
drops in humidity in the room where the specimens were stored. Specimens were kept in
controlled environment (20°C, (65±5)%RH) only during the first 3 months of curing,
0,0
0,5
1,0
1,5
2,0
L HL P B C1 C2
[MP
a]
mortar code
Flexural strength
unmodified - 1 month
unmodified - 3 months
unmodified - 1 year
linseed oil 1% - 1 month
linseed oil 1% - 3 months
linseed oil 1% - 1 year
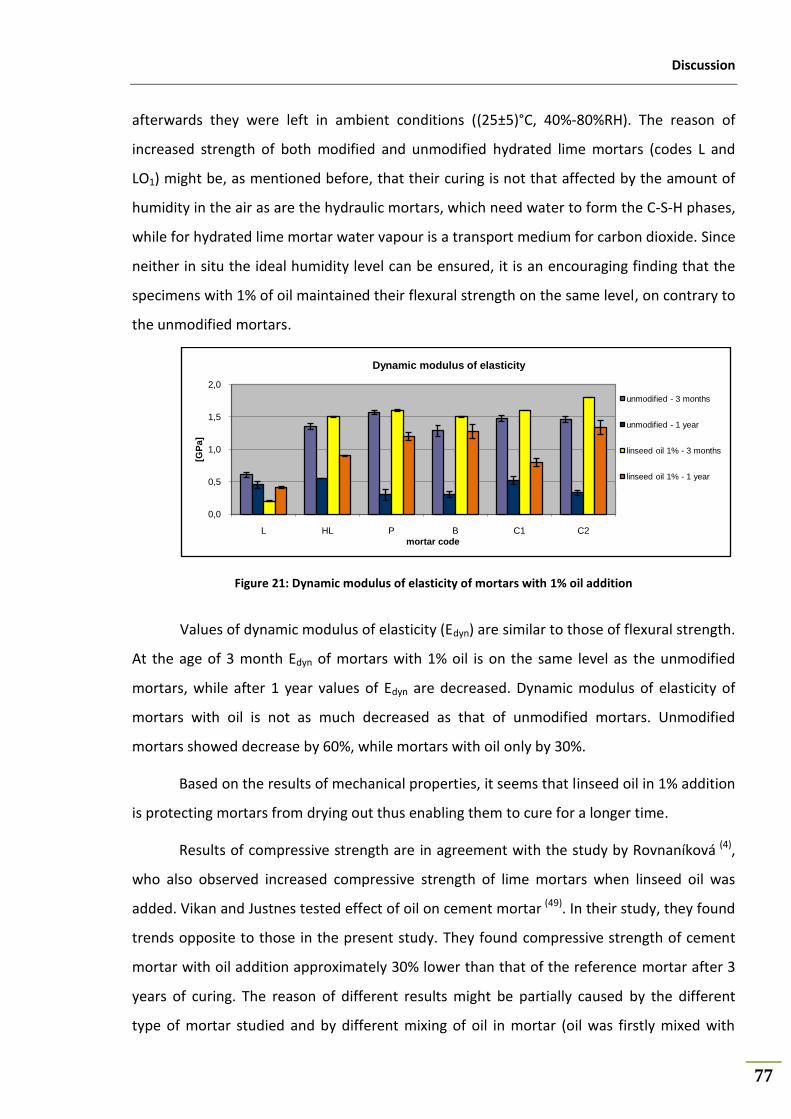
Discussion
77
afterwards they were left in ambient conditions ((25±5)°C, 40%-80%RH). The reason of
increased strength of both modified and unmodified hydrated lime mortars (codes L and
LO1) might be, as mentioned before, that their curing is not that affected by the amount of
humidity in the air as are the hydraulic mortars, which need water to form the C-S-H phases,
while for hydrated lime mortar water vapour is a transport medium for carbon dioxide. Since
neither in situ the ideal humidity level can be ensured, it is an encouraging finding that the
specimens with 1% of oil maintained their flexural strength on the same level, on contrary to
the unmodified mortars.
Figure 21: Dynamic modulus of elasticity of mortars with 1% oil addition
Values of dynamic modulus of elasticity (Edyn) are similar to those of flexural strength.
At the age of 3 month Edyn of mortars with 1% oil is on the same level as the unmodified
mortars, while after 1 year values of Edyn are decreased. Dynamic modulus of elasticity of
mortars with oil is not as much decreased as that of unmodified mortars. Unmodified
mortars showed decrease by 60%, while mortars with oil only by 30%.
Based on the results of mechanical properties, it seems that linseed oil in 1% addition
is protecting mortars from drying out thus enabling them to cure for a longer time.
Results of compressive strength are in agreement with the study by Rovnaníková (4),
who also observed increased compressive strength of lime mortars when linseed oil was
added. Vikan and Justnes tested effect of oil on cement mortar (49). In their study, they found
trends opposite to those in the present study. They found compressive strength of cement
mortar with oil addition approximately 30% lower than that of the reference mortar after 3
years of curing. The reason of different results might be partially caused by the different
type of mortar studied and by different mixing of oil in mortar (oil was firstly mixed with
0,0
0,5
1,0
1,5
2,0
L HL P B C1 C2
[GP
a]
mortar code
Dynamic modulus of elasticity
unmodified - 3 months
unmodified - 1 year
linseed oil 1% - 3 months
linseed oil 1% - 1 year
Discussion
78
water with the help of emulgator (lignosulphate) and then added to dried mixture, while in
the present study oil was mixed with dry constituents first), which might play an important
role. Authors suggest that the explanation of their lower strengths obtained might be either
lower degree of cement hydration due to the blocking of micro-pores by oil droplets, or the
fact that oil oxidizes as the oxygen diffuses over time through the sample to form solid
saturated fatty acid. Furthermore, authors propose that carboxyl acids derivates, occurring
during decomposition of oil in basic environment and coordinating strongly with Ca-sites,
might alter the hydration as they are adsorbed on cement particles by both delaying the
hydration and changing the morphology of hydration products. It the present study no
carboxylic acid derivates were identified in samples of binder-oil-water pastes by means of
FTIR-ATR (see sections 3.2.6.2 on p. 56 and 4.6 on p. 71). In order to support their theory,
Vikan and Justnes (49) have measured the amount of chemically bounded water, i.e. the
degree of hydration. Nevertheless, they found no trends between degree of hydration and
amount of oil added into mortar. This means that their founding of decreased strength of
mortars with oil is not caused by the lower degree of hydration.
Mechanical properties of mortars with 3% oil addition
The effect of 3% addition on mortars´ mechanical properties is not an increased
effect of 1% addition, but the opposite. Mechanical characteristics were significantly
reduced when 3% of linseed oil was added. Following figures show compressive (Figure 22)
and flexural (Figure 23 ) strengths of mortars with 3% addition of oil compared to mortars
with 1% addition and unmodified, tested after 3 months of curing. Strengths of mortars with
3% of oil were decreased by approximately 65%.

Discussion
79
Figure 22: Changes of compressive strength with
the addition of linseed oil
Figure 23: Changes of flexural strength with the
addition of linseed oil
Theoretically, decreased strength of mortars with 3% addition of oil might be caused
by various reasons, such is lower degree of carbonation, lower degree of hydration of
hydraulic components and/or increased porosity of mortars with oil. Oil can be also limiting
contact between grains of aggregate and binder phase. We will now discuss some of the
possible factors.
First theory is that oil as a hydrophobic substance in mortar is limiting water vapour
with dissolved carbon dioxide to penetrate into the mortar structure and thus causing
decreased carbonation. The result of water vapour permeability test did not show lower
permeability of hydrated and hydraulic mortars with the oil addition. Neither Rovnaníková(4)
found decreased water vapour permeability of hydrated lime mortar in her study. Justnes (48)
studied the effect of linseed oil on the cement mortar, which has different porosity than
hydrated lime mortars, but however he did not find reduced vapour diffusion coefficient of
mortars with the oil addition.
The rate of carbonation was tested by phenolphthalein method. Phenolphthalein is a
acidobasic indicator changing its colour depending on the pH. It has purple colour when
pH>8,5, like in a fresh mortar which is strongly basic, and it is colourless when pH<8,5, e.i. in
a carbonized mortar. As seen in Figure 24 below, mortars with 3% addition of oil (bottom) are
far more carbonized than unmodified mortars, so lower carbonation is not a cause of the
decreased strength of 3% oil-mortars.
0
2
4
6
8
10
12
14
L HL P B C1 C2
[MP
a]
mortar code
Changes of compressive strength with theaddition of linseed oil
unmodified -3 months
linseed oil 1% - 3 months
linseed oil 3% - 3 months
0,0
0,5
1,0
1,5
2,0
L HL P B C1 C2
[MP
a]
mortar code
Changes of flexural strength with addition of linseed oil
unmodified -3 months
linseed oil 1% - 3 months
linseed oil 3% - 3 months

Discussion
80
Figure 24: Rate of carbonation - phenolphthalein method
5.2.2 THE EFFECT OF LINSEED OIL ON MORTARS´ POROSITY
Another theory which might be explaining the decreased strength of mortars with 3%
addition of oil is that the decreased strength might have been caused by higher porosity of
modified mortars. Nevertheless, results of total open porosity measurement did not show
significant differences between unmodified mortars and mortars with 3% oil addition. On
the other hand, as seen from the diagram of pore size distribution measured by mercury
intrusion porosimetry (Figure 25), there are obvious differences between mortars with oil and
unmodified mortars.
Pore size distribution of all tested mortars with 3% of oil is shifted towards bigger
pore sizes. Also the calculated average pore radius indicates that mortars with 3% of oil have
much bigger pores. It should be pointed out that mercury intrusion porosimetry does not
measure the actual radius of the pore, but the radius of entrance into the pore, as the
pressure needed to push mercury inside the pore is defined by the size of its entrance and
remains the same while the whole volume of a pore is being filled. However, the mercury
intrusion porosimetry gives an idea about the pore size distribution. So it can be stated that
mortars with 3% of oil have seem to have higher proportion of big pores while maintaining
the same level of total porosity, which might affect their mechanical properties.
Furthermore, many big pores of size of about 1 mm can be observed in structure of 3% oil-
mortars even by naked eye, these can be responsible for the decreased strength.
C2O3C1O3BO3PO3HO3LO3
Mortars with 3% of linseed oil after 3 months of curing:
C2C1BPHL
Unmodified mortars after 3 months of curing:
C2O3C1O3BO3PO3HO3LO3
Mortars with 3% of linseed oil after 3 months of curing:
C2C1BPHL
Unmodified mortars after 3 months of curing:
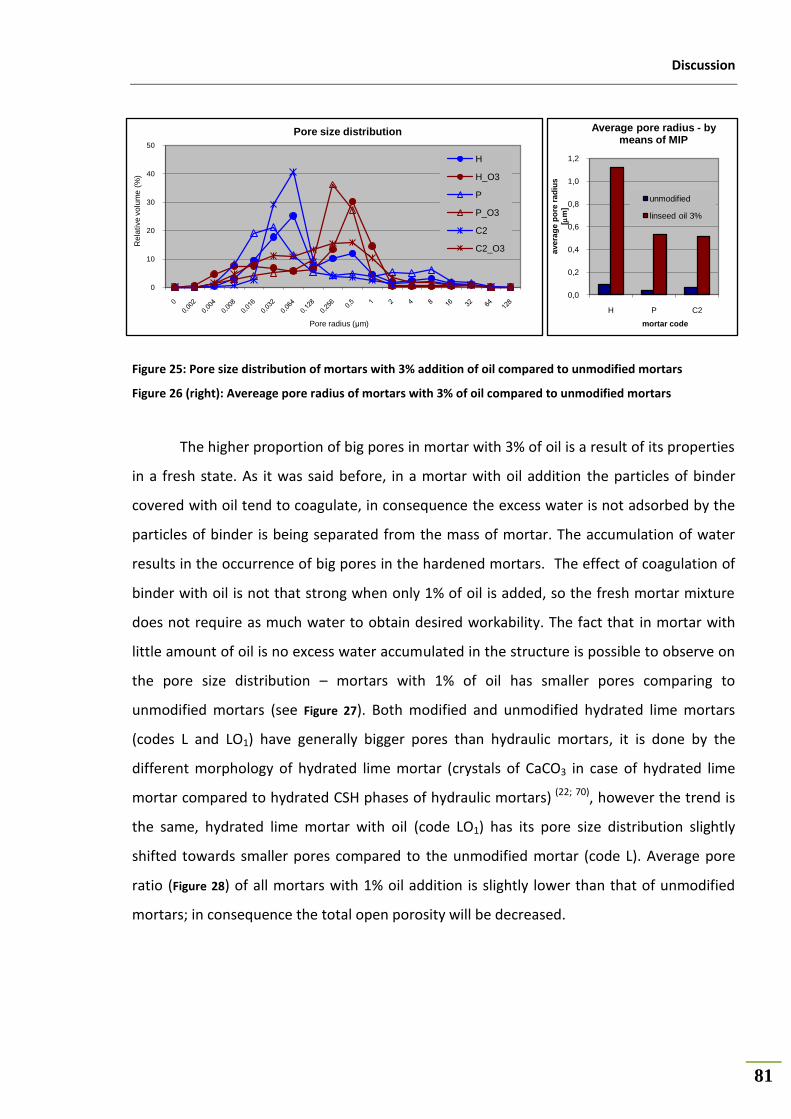
Discussion
81
Figure 25: Pore size distribution of mortars with 3% addition of oil compared to unmodified mortars
Figure 26 (right): Avereage pore radius of mortars with 3% of oil compared to unmodified mortars
The higher proportion of big pores in mortar with 3% of oil is a result of its properties
in a fresh state. As it was said before, in a mortar with oil addition the particles of binder
covered with oil tend to coagulate, in consequence the excess water is not adsorbed by the
particles of binder is being separated from the mass of mortar. The accumulation of water
results in the occurrence of big pores in the hardened mortars. The effect of coagulation of
binder with oil is not that strong when only 1% of oil is added, so the fresh mortar mixture
does not require as much water to obtain desired workability. The fact that in mortar with
little amount of oil is no excess water accumulated in the structure is possible to observe on
the pore size distribution – mortars with 1% of oil has smaller pores comparing to
unmodified mortars (see Figure 27). Both modified and unmodified hydrated lime mortars
(codes L and LO1) have generally bigger pores than hydraulic mortars, it is done by the
different morphology of hydrated lime mortar (crystals of CaCO3 in case of hydrated lime
mortar compared to hydrated CSH phases of hydraulic mortars) (22; 70), however the trend is
the same, hydrated lime mortar with oil (code LO1) has its pore size distribution slightly
shifted towards smaller pores compared to the unmodified mortar (code L). Average pore
ratio (Figure 28) of all mortars with 1% oil addition is slightly lower than that of unmodified
mortars; in consequence the total open porosity will be decreased.
0
10
20
30
40
50
Rela
tive
vo
lum
e (
%)
Pore radius (μm)
Pore size distribution
H
H_O3
P
P_O3
C2
C2_O3
0,0
0,2
0,4
0,6
0,8
1,0
1,2
H P C2
ave
rag
e p
ore
ra
diu
s
[mm
]
mortar code
Average pore radius - by means of MIP
unmodified
linseed oil 3%
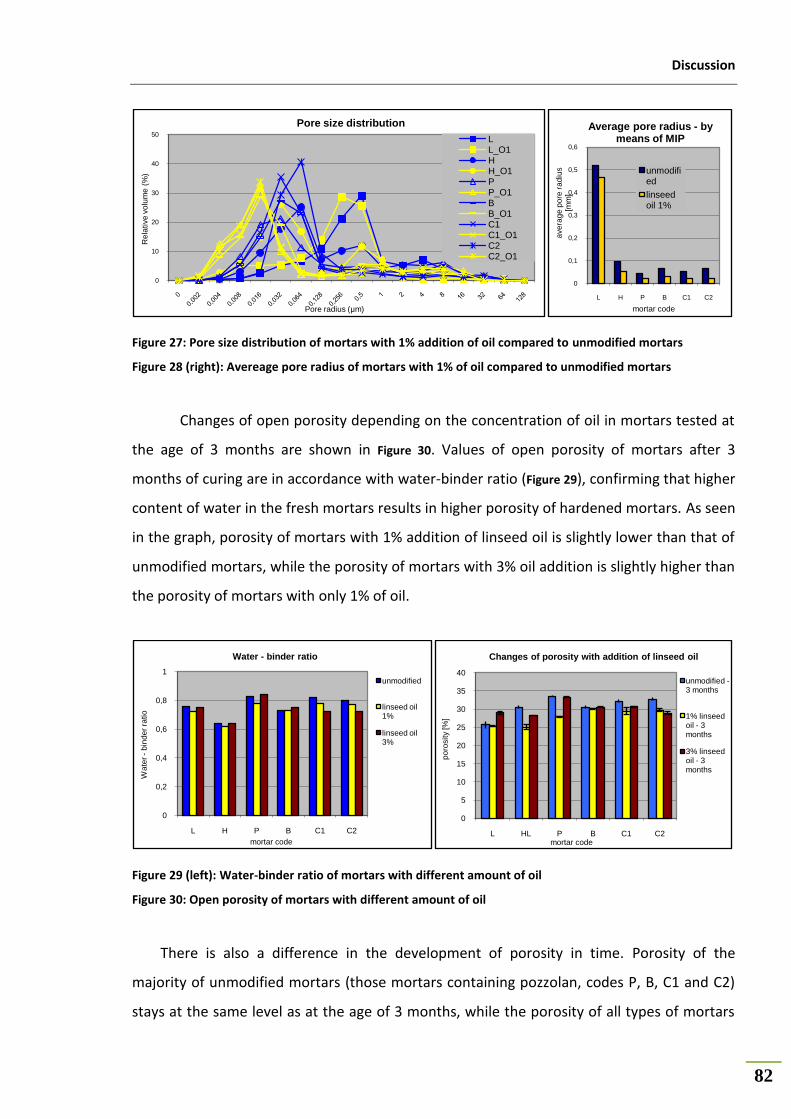
Discussion
82
Figure 27: Pore size distribution of mortars with 1% addition of oil compared to unmodified mortars
Figure 28 (right): Avereage pore radius of mortars with 1% of oil compared to unmodified mortars
Changes of open porosity depending on the concentration of oil in mortars tested at
the age of 3 months are shown in Figure 30. Values of open porosity of mortars after 3
months of curing are in accordance with water-binder ratio (Figure 29), confirming that higher
content of water in the fresh mortars results in higher porosity of hardened mortars. As seen
in the graph, porosity of mortars with 1% addition of linseed oil is slightly lower than that of
unmodified mortars, while the porosity of mortars with 3% oil addition is slightly higher than
the porosity of mortars with only 1% of oil.
Figure 29 (left): Water-binder ratio of mortars with different amount of oil
Figure 30: Open porosity of mortars with different amount of oil
There is also a difference in the development of porosity in time. Porosity of the
majority of unmodified mortars (those mortars containing pozzolan, codes P, B, C1 and C2)
stays at the same level as at the age of 3 months, while the porosity of all types of mortars
0
10
20
30
40
50
Rela
tive
vo
lum
e (
%)
Pore radius (μm)
Pore size distribution
LL_O1HH_O1PP_O1BB_O1C1C1_O1C2C2_O1
0
0,1
0,2
0,3
0,4
0,5
0,6
L H P B C1 C2
ave
rag
e p
ore
ra
diu
s
[mm
]
mortar code
Average pore radius - by means of MIP
unmodified
linseed oil 1%
0
0,2
0,4
0,6
0,8
1
L H P B C1 C2
Wa
ter -
bin
de
r ra
tio
mortar code
Water - binder ratio
unmodified
linseed oil 1%
linseed oil 3%
0
5
10
15
20
25
30
35
40
L HL P B C1 C2
po
rosity [%
]
mortar code
Changes of porosity with addition of linseed oil
unmodified -3 months
1% linseed oil - 3 months
3% linseed oil - 3 months
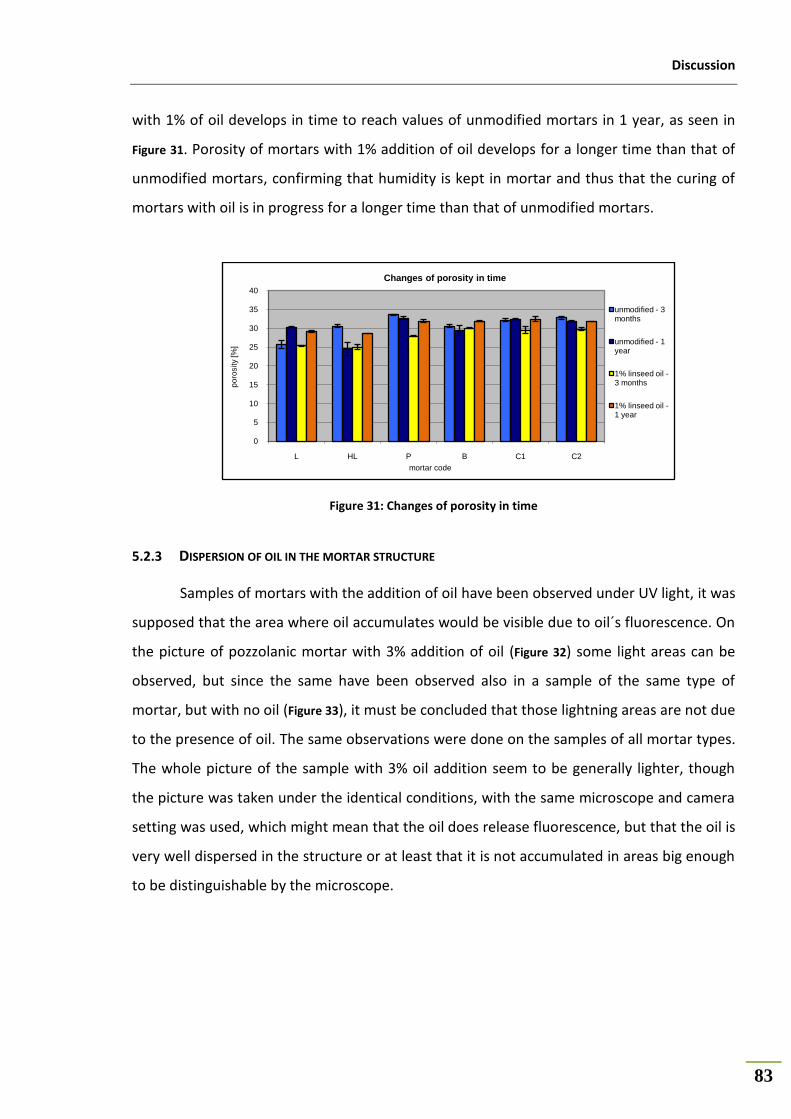
Discussion
83
with 1% of oil develops in time to reach values of unmodified mortars in 1 year, as seen in
Figure 31. Porosity of mortars with 1% addition of oil develops for a longer time than that of
unmodified mortars, confirming that humidity is kept in mortar and thus that the curing of
mortars with oil is in progress for a longer time than that of unmodified mortars.
Figure 31: Changes of porosity in time
5.2.3 DISPERSION OF OIL IN THE MORTAR STRUCTURE
Samples of mortars with the addition of oil have been observed under UV light, it was
supposed that the area where oil accumulates would be visible due to oil´s fluorescence. On
the picture of pozzolanic mortar with 3% addition of oil (Figure 32) some light areas can be
observed, but since the same have been observed also in a sample of the same type of
mortar, but with no oil (Figure 33), it must be concluded that those lightning areas are not due
to the presence of oil. The same observations were done on the samples of all mortar types.
The whole picture of the sample with 3% oil addition seem to be generally lighter, though
the picture was taken under the identical conditions, with the same microscope and camera
setting was used, which might mean that the oil does release fluorescence, but that the oil is
very well dispersed in the structure or at least that it is not accumulated in areas big enough
to be distinguishable by the microscope.
0
5
10
15
20
25
30
35
40
L HL P B C1 C2
po
rosity [%
]
mortar code
Changes of porosity in time
unmodified - 3 months
unmodified - 1 year
1% linseed oil -3 months
1% linseed oil -1 year
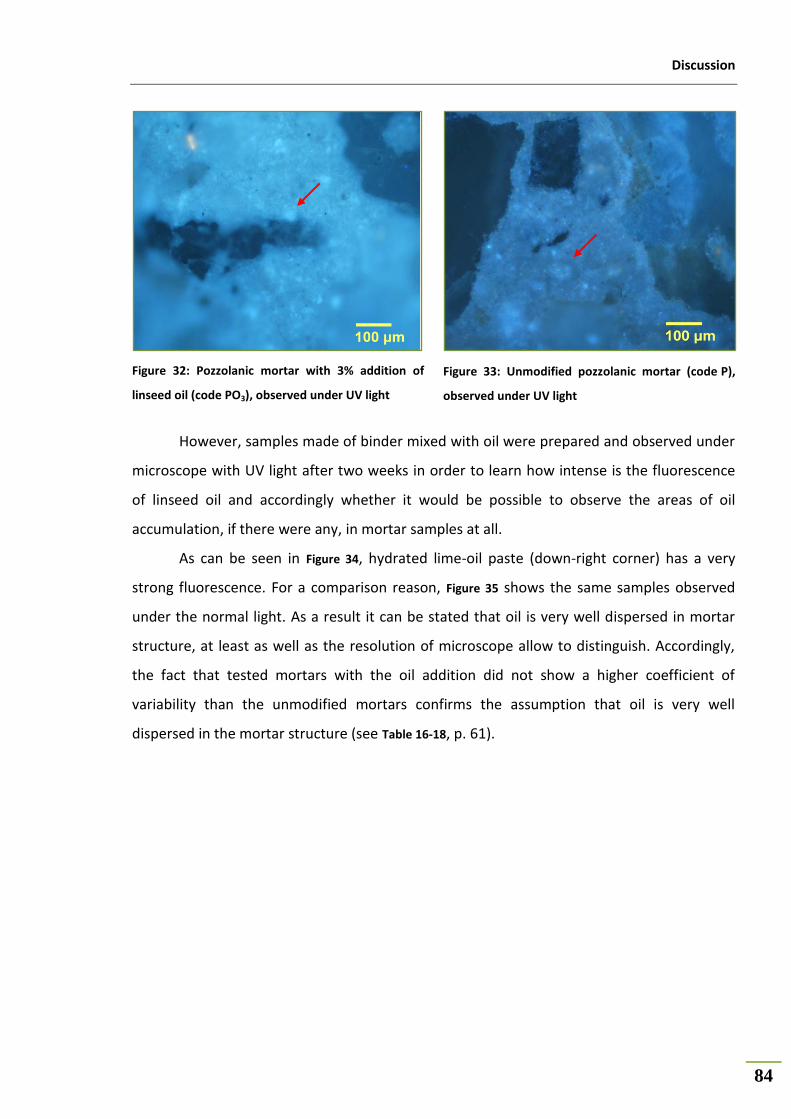
Discussion
84
Figure 32: Pozzolanic mortar with 3% addition of
linseed oil (code PO3), observed under UV light
Figure 33: Unmodified pozzolanic mortar (code P),
observed under UV light
However, samples made of binder mixed with oil were prepared and observed under
microscope with UV light after two weeks in order to learn how intense is the fluorescence
of linseed oil and accordingly whether it would be possible to observe the areas of oil
accumulation, if there were any, in mortar samples at all.
As can be seen in Figure 34, hydrated lime-oil paste (down-right corner) has a very
strong fluorescence. For a comparison reason, Figure 35 shows the same samples observed
under the normal light. As a result it can be stated that oil is very well dispersed in mortar
structure, at least as well as the resolution of microscope allow to distinguish. Accordingly,
the fact that tested mortars with the oil addition did not show a higher coefficient of
variability than the unmodified mortars confirms the assumption that oil is very well
dispersed in the mortar structure (see Table 16-18, p. 61).
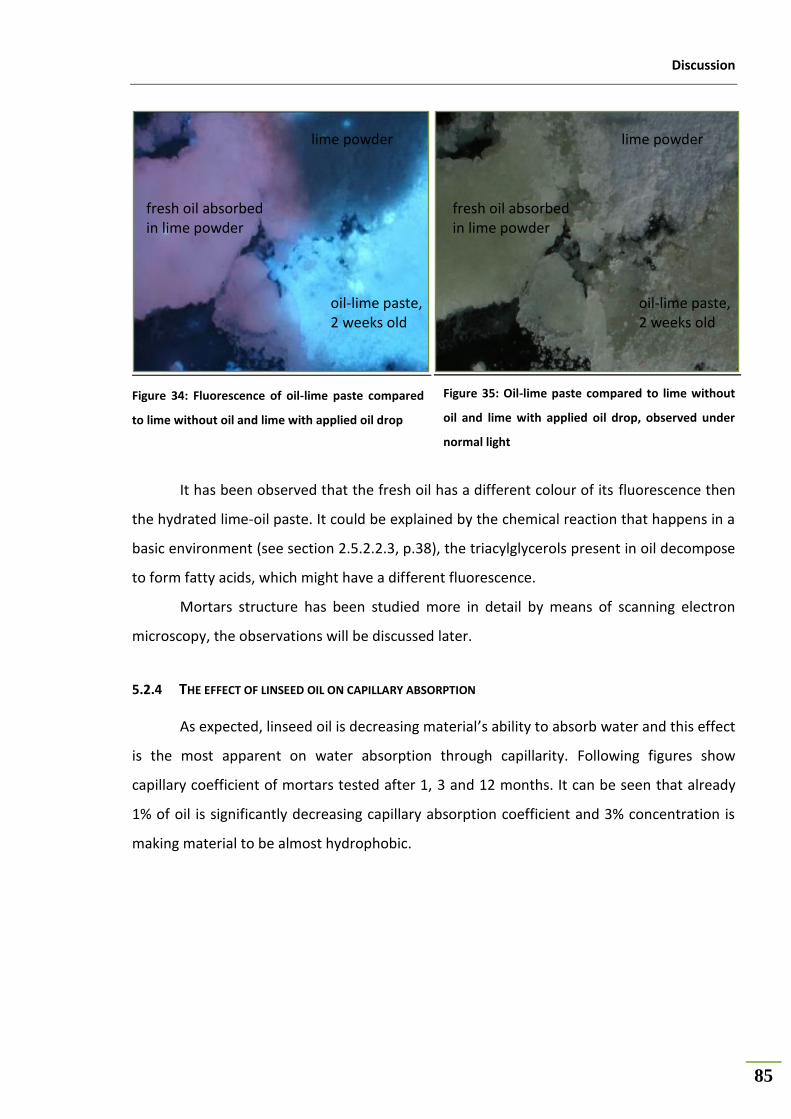
Discussion
85
Figure 34: Fluorescence of oil-lime paste compared
to lime without oil and lime with applied oil drop
Figure 35: Oil-lime paste compared to lime without
oil and lime with applied oil drop, observed under
normal light
It has been observed that the fresh oil has a different colour of its fluorescence then
the hydrated lime-oil paste. It could be explained by the chemical reaction that happens in a
basic environment (see section 2.5.2.2.3, p.38), the triacylglycerols present in oil decompose
to form fatty acids, which might have a different fluorescence.
Mortars structure has been studied more in detail by means of scanning electron
microscopy, the observations will be discussed later.
5.2.4 THE EFFECT OF LINSEED OIL ON CAPILLARY ABSORPTION
As expected, linseed oil is decreasing material’s ability to absorb water and this effect
is the most apparent on water absorption through capillarity. Following figures show
capillary coefficient of mortars tested after 1, 3 and 12 months. It can be seen that already
1% of oil is significantly decreasing capillary absorption coefficient and 3% concentration is
making material to be almost hydrophobic.
fresh oil absorbed in lime powder
lime powder
oil-lime paste, 2 weeks old
fresh oil absorbed in lime powder
oil-lime paste, 2 weeks old
lime powder
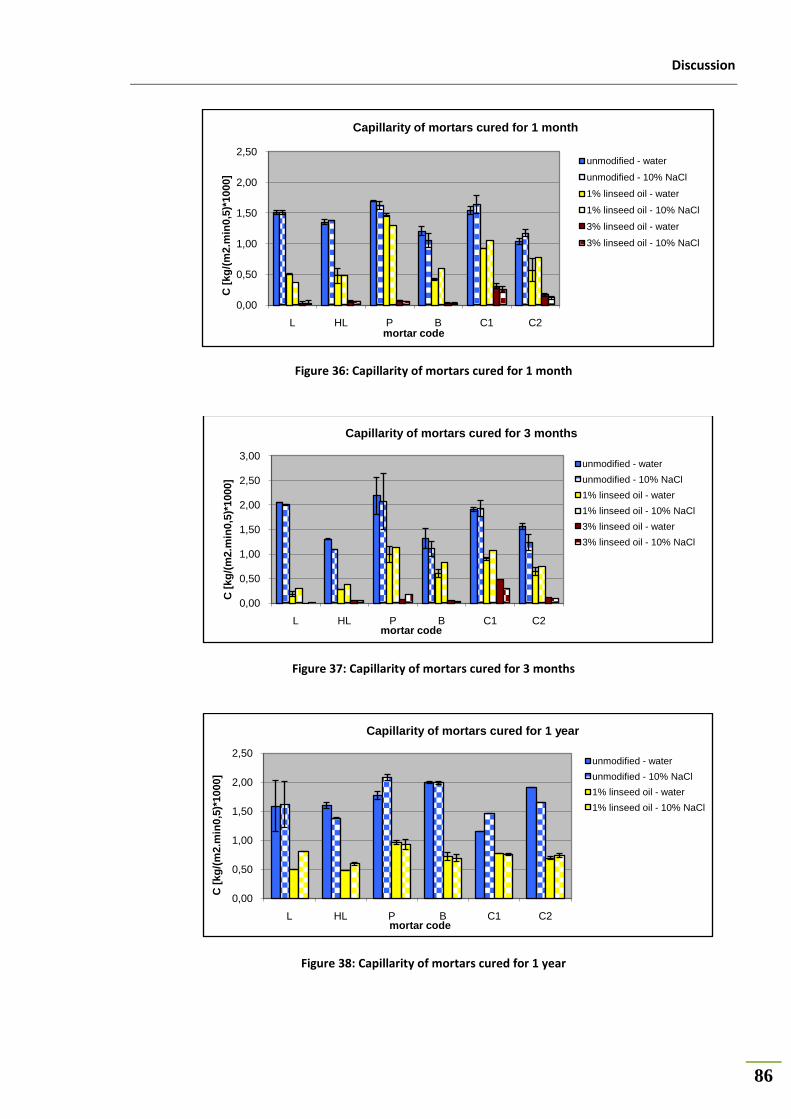
Discussion
86
Figure 36: Capillarity of mortars cured for 1 month
Figure 37: Capillarity of mortars cured for 3 months
Figure 38: Capillarity of mortars cured for 1 year
0,00
0,50
1,00
1,50
2,00
2,50
L HL P B C1 C2
C [
kg
/(m
2.m
in0
,5)*
1000]
mortar code
Capillarity of mortars cured for 1 month
unmodified - water
unmodified - 10% NaCl
1% linseed oil - water
1% linseed oil - 10% NaCl
3% linseed oil - water
3% linseed oil - 10% NaCl
0,00
0,50
1,00
1,50
2,00
2,50
3,00
L HL P B C1 C2
C [
kg
/(m
2.m
in0
,5)*
1000]
mortar code
Capillarity of mortars cured for 3 months
unmodified - water
unmodified - 10% NaCl
1% linseed oil - water
1% linseed oil - 10% NaCl
3% linseed oil - water
3% linseed oil - 10% NaCl
0,00
0,50
1,00
1,50
2,00
2,50
L HL P B C1 C2
C [
kg
/(m
2.m
in0
,5)*
1000]
mortar code
Capillarity of mortars cured for 1 year
unmodified - water
unmodified - 10% NaCl
1% linseed oil - water
1% linseed oil - 10% NaCl
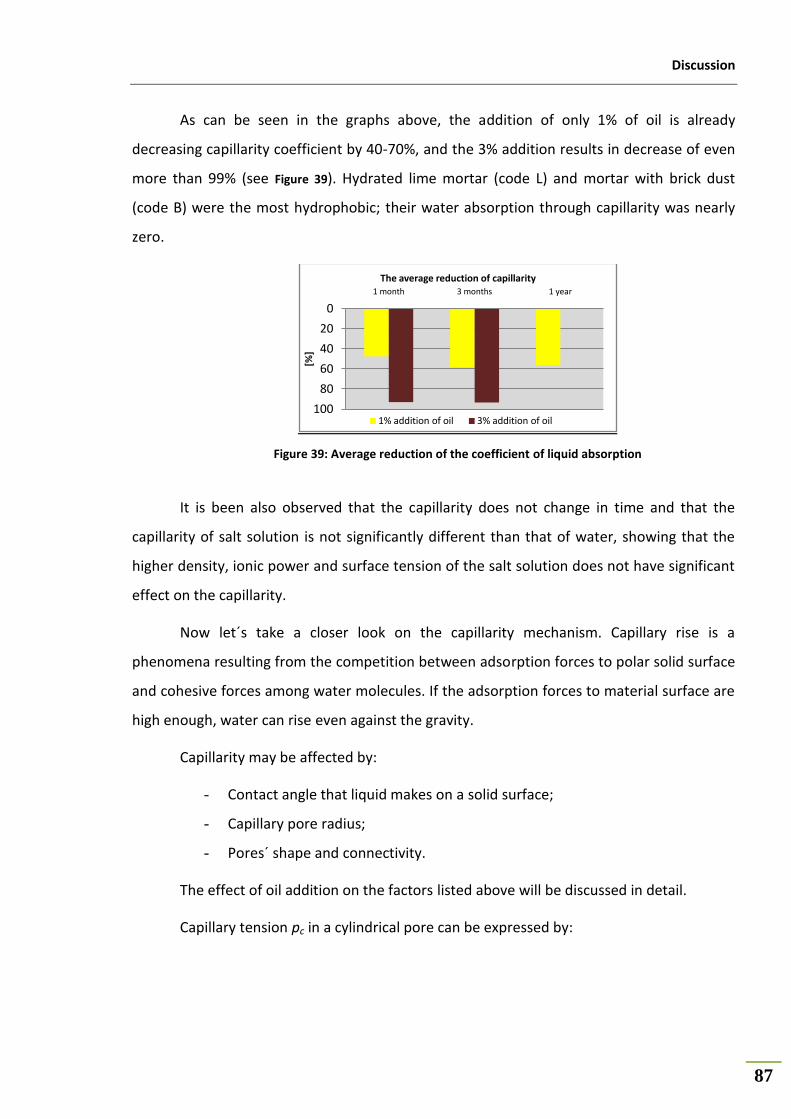
Discussion
87
As can be seen in the graphs above, the addition of only 1% of oil is already
decreasing capillarity coefficient by 40-70%, and the 3% addition results in decrease of even
more than 99% (see Figure 39). Hydrated lime mortar (code L) and mortar with brick dust
(code B) were the most hydrophobic; their water absorption through capillarity was nearly
zero.
Figure 39: Average reduction of the coefficient of liquid absorption
It is been also observed that the capillarity does not change in time and that the
capillarity of salt solution is not significantly different than that of water, showing that the
higher density, ionic power and surface tension of the salt solution does not have significant
effect on the capillarity.
Now let´s take a closer look on the capillarity mechanism. Capillary rise is a
phenomena resulting from the competition between adsorption forces to polar solid surface
and cohesive forces among water molecules. If the adsorption forces to material surface are
high enough, water can rise even against the gravity.
Capillarity may be affected by:
- Contact angle that liquid makes on a solid surface;
- Capillary pore radius;
- Pores´ shape and connectivity.
The effect of oil addition on the factors listed above will be discussed in detail.
Capillary tension pc in a cylindrical pore can be expressed by:
0
20
40
60
80
100
1 month 3 months 1 year
[%]
The average reduction of capillarity
1% addition of oil 3% addition of oil

Discussion
88
pc= 2.σ.cosΘ / r [Pa] (10)
To describe the maximum capillary height for the vetical transport the influence of
gravity and viscous resistance has to be considered since they are in opposition to the
capillary force:
Hmax = 2.cosΘ / r.ρ.g [m], (11)
where r is the capillary radius [m], Θ is the contact angle, σ is the surface tension of
the water [N.m-1], ρ is the water density *kg.m-3], and g is the gravity force [m.s-2] (61).
1. contact angle
Contact angle that liquid makes on a solid surface is defined by the surface energy of
the solid. As can be seen from the above equations, if the Θ = 90°, pc=0, and the adsorptive
and cohesive forces are equal. If Θ >90°, capillary depression will occur and water will not
enter the pore system unless external pressure is applied. Only if Θ <90°, adsorptive forces
exceed cohesive forces resulting in capillary absorption (61).
As shown in section 4.4.6, p. 66, contact angle of water drop on a surface of binder
pastes is significantly increased for all mortars, i.e. the mortars are more hydrophobic, so the
capillary rise is decreased. The hydrophobicity of mortars with the oil addition is probably
the most significant factor causing the decreased water absorption, however there are also
other factors which might play a role.
2. capillary pore radius
Since only water molecules close to the mineral surface (pore wall) can contribute to
absorption, smaller pores show a larger capillary tension. It is then valid that the smaller is
the capillary pore radius, the higher will be the capillary rise.
To study pore system of a material, mercury intrusion porosimetry (MIP) is a
generally accepted technique. Even though it has some disadvantages, i.e. assuming
cylindrical shape of pores, the pores are not equally accessible to mercury, and in fact it
measures the diameter of the entrance to the pore not the actual pore size, MIP gives an
indication about the pore size distribution in the material.
As it was already shown in Figure 26, p. 81, the 3% addition of linseed oil is increasing
average pore radius measured by means of MIP approximately ten times. Assuming some
Discussion
89
constant proportion of pores of the capillary shape, the result is in the agreement with the
theory, i.e. the capillary rise is inversely proportional to the capillary pore radius
(Equations 10 and 11), thus the decrease in capillarity of mortars with 3% oil addition might
be caused (besides other factors) by increased average pore radius.
The situation is not that clear for mortars with only 1% addition of linseed oil.
Average pore radius of mortars with oil is slightly lower than that of unmodified mortars and
as it can be seen in the pores size distribution (Figure 27, p. 82), mortars with 1% of have all
smaller range of pores compared to unmodified mortars, so consequently, if only pore
radius was concerned, the capillarity should be increased. It could mean that the pore sizes
do not have a significant effect on capillarity, i.e. the effect of hydrophobicity of material
plays much more important role than the pores´ sizes. Alternatively, observed phenomena
can be explained by the effect of absorption rate. The general equation describing transport
mechanism can be derived from the Pouiseuille and La Place equation (61):
Δh/Δt = *r2/8.η.h+ (2.σ.cosΘ / r + ρ.g.h0 + ρ.g.h.cosφ), where (12)
Δh/Δt is the capillary absorption rate [m.s-1];
h is the distance reached by water in the capillary [m];
r is the capillary radius [m];
η is the water viscosity [Ns.m-2];
σ is the surface tension of the water [N.m-1];
ρ is the water density [kg.m-3];
g is the gravity force [m.s-2]
h0 is the height of water above entrance pore [m];
Θ is the contact angle between water and the solid surface; and
φ is the angle with vertical direction.
The last term of the equation turns negative for φ angles larger than 90°, i.e. for
capillaries that are not vertical and the previous term turns constant for horizontal transport.
Thus, smaller capillaries will give rise to higher capillary rise, but larger capillaries will
provide faster water absorption rate due to their larger cross-section.
According to the previous equation, the capillary rate of pores smaller than 1 µm is
extremely slow, so there is practically no rise. Furthermore, in pores smaller than 0,1 µm
capillary condensation takes place, which is in fact a spontaneous formation of ordered

Discussion
90
water structures adsorbed on a mineral surface due to its electrostatic influence (61). In small
pores (nanopores) the influence of opposite pore walls may reach through the whole pore so
that the water is not in a liquid or vapour phase, but only in a phase of ordered structure,
which is energetically favoured (61). Thus, according to Wendler and Charola, water will move
by capillary transport only in pores in range from 10 µm to 1 mm (61). Barsottelli et al. (62)
suggest that capillary rise is most affected by the pores with radius around 1 µm.
Figure 40: Pore size distribution of mortars with 1% of oil compared to unmodified mortars and the
effect of pore ratio on capillary rise
In the following Figure 41-46 pore size distribution within 1 µm and 128 µm is showed,
which should be the range of pores most affecting the capillarity. It must be nevertheless
kept in mind that the pore size distribution is actually not showing pore ratios distribution
but the distribution of pores´ entrances, thus the evaluation is very rough. However, it can
be seen that the unmodified mortars of the majority of mortar types have the highest
proportion of pores in this range, followed by mortars with 1% of oil and the mortars with
3% of oil, in the same order as the capillarity decreases, suggesting that the capillarity might
be indeed affected mostly by the pores of ratio bigger than 1 µm.
Pore size distribution
0
10
20
30
40
50
0
0,00
2
0,00
4
0,00
8
0,01
6
0,03
2
0,06
4
0,12
8
0,25
60,
5 1 2 4 8 16 32 64 128
Pore radius (μm)
Rela
tive v
olu
me (
%)
L
L_O1
H
H_O1
P
P_O1
B
B_O1
C1
C1_O1
C2
C2_O1
Pores having the highest effect on capillarity Capillary condensation
Capillary rate extremely slow

Discussion
91
Figure 41: Pore size distribution of hydrated lime
mortars
Figure 42: Pore size distribution of hydraulic lime
mortars
Figure 43: Pore size distribution of pozzolanic
mortars
Figure 44: Pore size distribution of mortars with
brick dust
Figure 45: Pore size distribution of mortars with
5% of cement
Figure 46: Pore size distributution of mortars
with 10% of cement
0
1
2
3
4
5
6
7
8R
ela
tive v
olu
me (
%)
Pore radius (micron)
Pore size distribution
L
L_O1
0
1
2
3
4
5
6
7
8
Pore radius (micron)
Pore size distribution
H
H_O1
H_O3
0
1
2
3
4
5
6
7
8
Rela
tive v
olu
me (
%)
Pore radius (micron)
Pore size distribution
P
P_O1
P_O3
0
1
2
3
4
5
6
7
8
Rela
tive v
olu
me (
%)
Pore radius (micron)
Pore size distribution
B
B_O1
0
1
2
3
4
5
6
7
8
Rela
tive v
olu
me (
%)
Pore radius (micron)
Pore size distribution
C1
C1_O1
0
1
2
3
4
5
6
7
8
Rela
tive v
olu
me (
%)
Pore radius (micron)
Pore size distribution
C2
C2_O1
C2_O3

Discussion
92
3. pores´ shape and connectivity
Finally, the last issue having effect on capillarity is the shape and connectivity of
pores. The mathematical models describing the capillarity consider material to be composed
of parallel vertical capillary tubes. Since the real material pore structure is of course far from
the mathematical model, the absorption through capillarity will be affected by the pores´
shape, i.e. the proportion of capillary pores to the cylindrical pores as the two extreme
possible shapes, and the pores connectivity. The connectivity between pores can be affected
by the pore structure, as well as by the effect of the oil addition into the mortar. Oil is first of
all making material hydrophobic, thus the whole water movement mechanism is limited, but
it is not clear whether oil is covering pores walls, filling some pores, blocking the capillaries
or whether it is just evenly dispersed in the structure, without a tendency to accumulate in
dependence on pore system.
In order to understand better the mortar structure and the effect of the addition of
linseed oil on it, mortars samples have been observed under the scanning electron
microscopy (SEM). The resolution of SEM images does not allow observing pores’ shapes in
detail, however there were general differences in the appearance of the mortars. As seen in
Figure 49-61, unmodified mortars have sharp clear structure, while the mortars with oil
addition have all smoother texture. In unmodified hydraulic mortars (codes H, P, B, C1 and
C2) crystals have been observed. These crystals are probably various calcium silicates and
aluminates and are not present in hydrated lime mortar (code L) because it contains only
calcium carbonate. EDX analyses made in the points marked in figures below are listed in
Table 32. In mortars with the oil addition those crystals have not been observed anymore.
The SEM observation suggests that there is a thin oil film evenly spread in mortars
structure, covering the grains of binder and it seems that it is also limiting the formation of
crystals in hydraulic mortars.
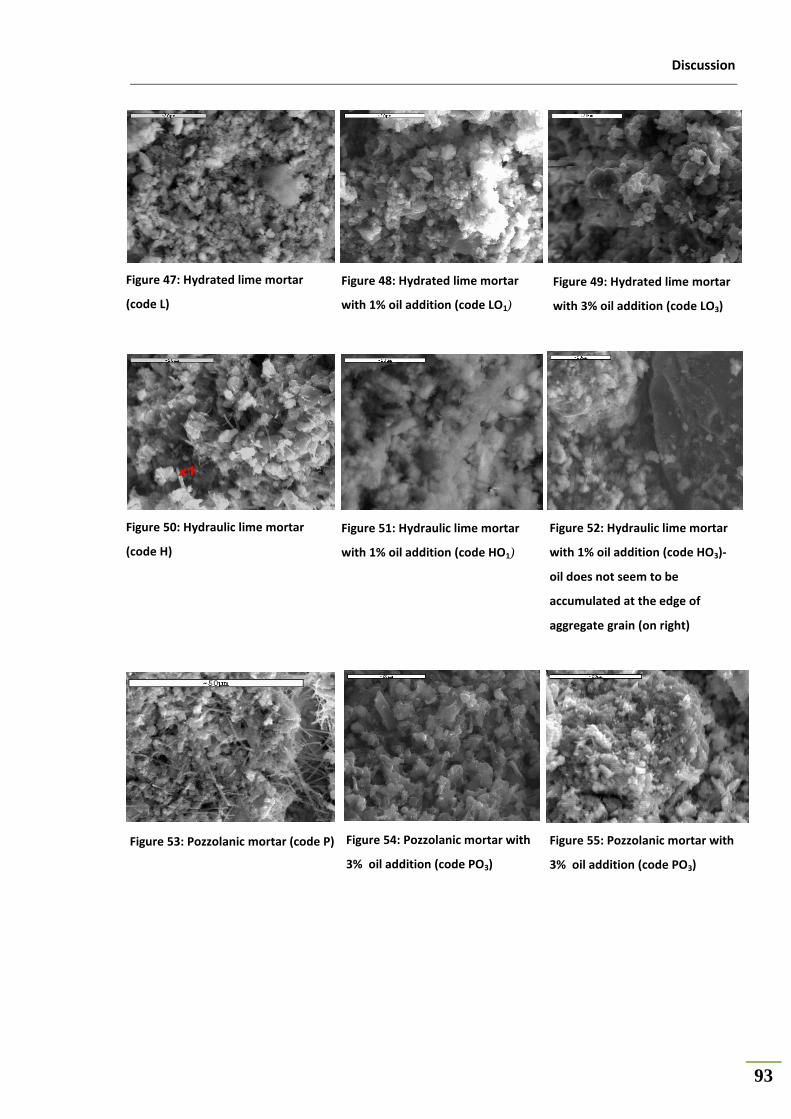
Discussion
93
Figure 49: Hydrated lime mortar
with 3% oil addition (code LO3)
Figure 52: Hydraulic lime mortar
with 1% oil addition (code HO3)-
oil does not seem to be
accumulated at the edge of
aggregate grain (on right)
Figure 54: Pozzolanic mortar with
3% oil addition (code PO3)
Figure 55: Pozzolanic mortar with
3% oil addition (code PO3)
Figure 47: Hydrated lime mortar
(code L)
Figure 48: Hydrated lime mortar
with 1% oil addition (code LO1)
Figure 50: Hydraulic lime mortar
(code H)
Figure 51: Hydraulic lime mortar
with 1% oil addition (code HO1)
Figure 53: Pozzolanic mortar (code P)
x1

Discussion
94
Figure 56: Big pore in the mortar
with brick dust (code B)
Figure 57: Big pore in a brick dust
mortar with 1% oil addition (code
BO1)-smoother edges of the pore
Figure 59: Cement mortar (5% of
cement) with 1% oil addition
(code C2O1)
Figure 60: Cement mortar (10% of
cement, code C2)
Figure 61: Cement mortar (10% of
cement) with 1% oil addition
(code C2O1)
Figure 58: Cement mortar (5% of
cement, code C1)
x2
x3
x4

Discussion
95
Table 32: EDX analysis of mortar specimens
Place of
analysis/Element [wt%] O Al Si S Cl K Ca Fe
x1 in Figure 50 55,70 3,80 4,70 - - - 31,25 4,56
x2 in Figure 56 29,11 4,73 15,28 1,80 - - 41,25 4,59
x3 in Figure 60 58,20 5,71 8,50 1,09 1,65 0,67 24,16 -
x4 in Figure 61 61,59 2,67 12,96 0,42 0,18 1,19 20,98 -
As a next step, the effect of linseed oil addition on the connectivity between pores
has been investigated by measuring the ease with which water gets into pore structure.
Open porosity has been determined by water absorption firstly after 48 hours of full
immersion of the specimens under normal pressure, and then after applying vacuum
(described more in detail in the section 3.2.5.4, p.49). Values of opened porosities measured
under normal conditions were plotted as percentages of the values of porosities measured
under vacuum (see Figure 62), giving an idea about the proportion of volume of the pores
easily accessible to water to the volume of those hardly accessible to water.
Figure 62: Pores accessibility to water
It is obvious that mortars with oil have higher volume of pores hardly accessible to
water. While the unmodified mortars have around 90% of pores filled by water already by
absorption under normal conditions, for mortars with 1% of oil addition it is 80% and in case
of mortars with 3% of oil addition it is only 30% of pores, which are easily accessible to
water. The effect of oil addition is the most prominent in case of hydrated lime mortar

Discussion
96
(code L). The proportion of pores hardly accessible to water decreased from 95% to only
65% when 1% of oil was added, and to 10% for the mortars with 3% oil addition, meaning
that only 10% of pores are accessible to water under normal conditions.
To summarize the discussion about capillarity, it can be stated that linseed oil is
decreasing the capillarity by various mechanisms. It makes a thin film spread evenly in
mortar´s structure, covering the grains of binder, which results in the decreased connectivity
between pores and thus limited water transport. Furthermore, the linseed oil´s addition is
also changing the pore size distribution in a way which decreases the capillary transport.
The ease with which water gets into material is a crucial factor affecting mortar´s
durability. Hirshwald stated already in 1908 (60) that materials having more than 80% of pores
easily accessible to water are likely to suffer damage due to the freeze-thaw cycles. Based on
the obtained results, the addition of oil into mortar is expected to improve mortar´s
durability.
5.2.5 THE EFFECT OF LINSEED OIL ON THE RATE OF DRYING
Once the water gets into material, it is important to know how quickly it will get out.
Rate of drying has been tested on saturated specimens of hardened mortar and, as seen in
Figure 63 in which the change of moisture content is plotted as a function of time, the results
did not show any effect of oil on the drying rate.
In the first stage of drying evaporation takes place from the exposed surface and the
drying rate is constant (this stage is not seen in the graph), as long as the liquid water is
supplied to the surface by capillary transport. The rate in this stage depends only on the
0
0,05
0,1
0,15
0,2
0,25
0,3
0,35
0 2 4 6 8
[kg
.m-3
.h-1
]
[h]
Drying rateL
H
P
B
C1
C2
LO1
HO1
PO1
BO1
C1O1
C2O1
Figure 63: Drying rate of mortars with 1% addition of linseed oil compared to
unmodified mortars

Discussion
97
external conditions and it will stay constant until the moisture content within the porous
material can no longer sustain capillary transport (critical moisture content). In the second
stage drying rate decreases and will be result of combination of different processes
happening due to the heterogenity of material. In area with small capillary pores it can still
be controlled by capillary transport, but in other areas having higher number of large pores
the drying rate will depend on the water evaporation from the remaining liquid water front
and subsequent vapour diffusion. The third stage begins when no liquid water is left and the
drying rate is controlled by the diffusion of water vapour to the surface and its diffusion or
convection from the surface. The rate is very slow, nearly constant, while the moisture
content of the materials tends towards the hygroscopic moisture content. (61)
The addition of oil might take effect in the second and third stage of drying, when the
attraction of water molecules to the mineral surface is involved. If the oil was limiting the
adsorption of water molecules to the polar material, drying of modified mortars would be
faster. On the other hand, oil might be locking water in very small pores and then the drying
of modified mortars would be slower than that of unmodified. Nevertheless, no differences
between modified and unmodified mortars were observed. Perhaps the method is not very
sensible to detect the changes on microscopical level.
However, the important conclusion to be made is that the addition of oil is not
slowing down the process of drying, i.e. the water evaporation from mortar structure, so
that the modified mortar does not tend to retain humidity.
5.2.6 THE EFFECT OF LINSEED OIL ON MORTARS´ DURABILITY
The durability is the most important characteristic of building materials in general.
Durability of mortar is a consequence of all previously discussed properties, bringing
theoretical presumptions a bit closer to practical applications.
Resistance to salt crystallization cycles
Resistance to the crystallization of two types of salts has been tested – sodium
chloride and sodium sulphate.

Discussion
98
Resistance to NaCl crystallization
In Figure 64 can be seen that the 1% addition of linseed oil significantly improves
mortars´ resistance to salt crystallization, tested after 1 year of curing. After 25 cycles all
unmodified mortars, except for the hydraulic lime mortar (code H), are totally destroyed,
while mortars with 1% addition of linseed oil show 30%-80% weight loss.
Figure 64: Resistence of 1 year old mortars to NaCl crystallization cycles – mortars with
1% addition of oil compared to unmodified mortars a
Hydrated lime mortars (codes L and LO1) belong to the most resistant mortars, even
though its mechanical strength was the lowest. On the other hand, mortars with cement
addition (codes C1, C1O1 and C2, C2O1; cement is added to hydrated lime mortars in order to
increase their strength) show quite low resistance compared to other mortars. In case of
hydrated lime mortars with the oil addition, their high resistance could be explained by their
lowest capillarity. But this explanation fails for the unmodified mortar. Another reason could
be their different pore size distribution compared to hydraulic mortars, i.e. that hydrated
lime mortars have bigger pores than hydraulic mortars. Or another hypothesis which might
explain the high resistance of hydrated lime mortars to salt crystallization is that sodium
chloride may have an effect of a sort of reinforcement, after it accumulates in pores,
supporting the mortar´s structure. Very resistant lime mortars have been observed on old
a drops in weight of mortars of codes L, LO1, H, HO1, P and PO1 after 20th cycle are caused by taking samples for SEM analysis (code L – one
of the two specimens has been used as a whole)
-100
-80
-60
-40
-20
0
0 1 2 3 4 5 6 7 8 9 10 11 12 13 14 15 16 17 18 19 20 21 22 23 24 25
weig
ht
ch
an
ge [
%]
cycle
NaCl crystallization cycles - 1 year old samples
L
H
P
B
C1
C2
LO1
HO1
PO1
BO1
C1O1
C2O1
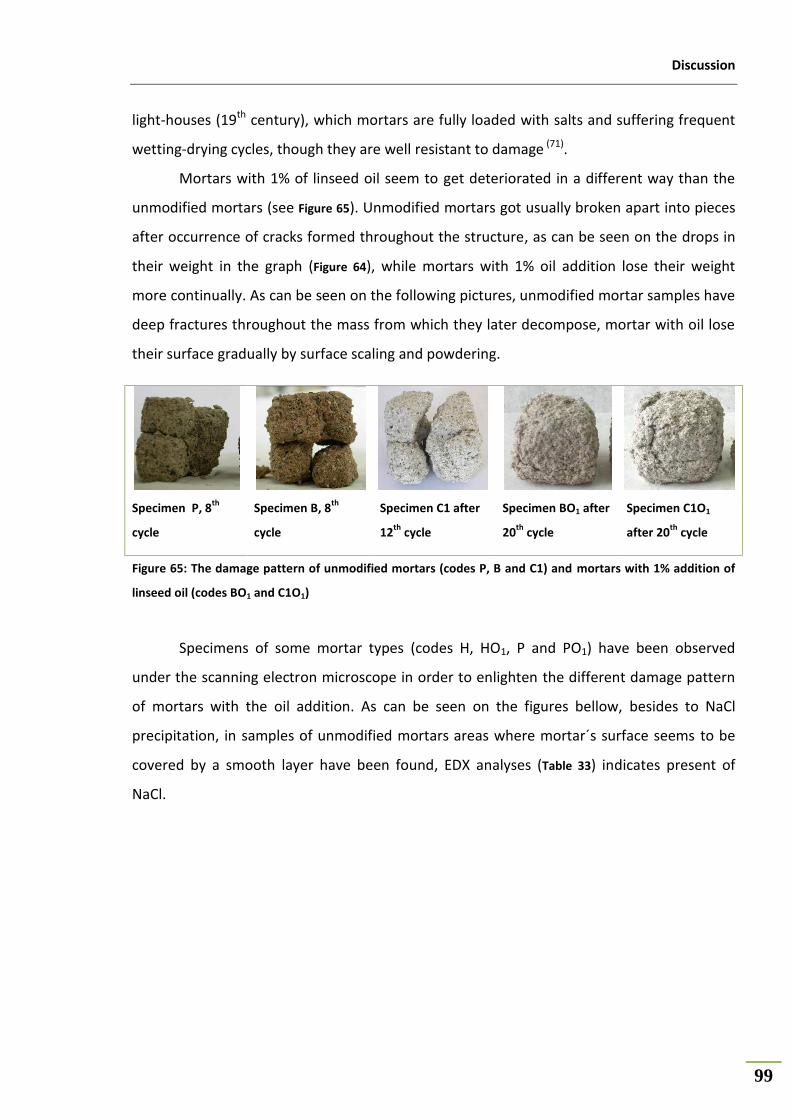
Discussion
99
light-houses (19th century), which mortars are fully loaded with salts and suffering frequent
wetting-drying cycles, though they are well resistant to damage (71).
Mortars with 1% of linseed oil seem to get deteriorated in a different way than the
unmodified mortars (see Figure 65). Unmodified mortars got usually broken apart into pieces
after occurrence of cracks formed throughout the structure, as can be seen on the drops in
their weight in the graph (Figure 64), while mortars with 1% oil addition lose their weight
more continually. As can be seen on the following pictures, unmodified mortar samples have
deep fractures throughout the mass from which they later decompose, mortar with oil lose
their surface gradually by surface scaling and powdering.
Specimens of some mortar types (codes H, HO1, P and PO1) have been observed
under the scanning electron microscope in order to enlighten the different damage pattern
of mortars with the oil addition. As can be seen on the figures bellow, besides to NaCl
precipitation, in samples of unmodified mortars areas where mortar´s surface seems to be
covered by a smooth layer have been found, EDX analyses (Table 33) indicates present of
NaCl.
Specimen P, 8th
cycle
Specimen B, 8th
cycle
Specimen C1 after
12th
cycle
Specimen BO1 after
20th
cycle
Specimen C1O1
after 20th
cycle
Figure 65: The damage pattern of unmodified mortars (codes P, B and C1) and mortars with 1% addition of
linseed oil (codes BO1 and C1O1)

Discussion
100
Figure 66: Hydraulic lime mortar
(code H) after twenty NaCl
crystallization cycles performed (SEM)
Figure 67: Hydraulic lime mortar with 1%
oil addition (code HO1) after twenty NaCl
crystallization cycles performed (SEM)
Figure 68: Pozzolanic mortar (code P) after
twenty NaCl crystallization cycles
performed (SEM)
Figure 69: Pozzolanic mortar with 1% oil
addition (code PO1) after twenty NaCl
crystallization cycles performed (SEM)
Table 33: EDX analysis of mortar specimens after twenty NaCl crystallization cycles performed
Element [wt%]/
Place of analysis O Na Mg Si Cl Ca
x1 in Figure 66 9,28 22,98 0,03 0,82 62,75 4,19
x2 in Figure 66 - 42,68 0,14 - 57,08 0,11
x3 in Figure 68 - 42,09 0,02 0,11 57,68 0,07
x4 in Figure 68 - 36,76 0,06 0,07 63,10 0,03
It seems that salt makes a crust on the surface of unmodified mortars. This crust has
not been observed in specimens of mortar with 1% addition of oil, as if the oil in mortar was
preventing crystals adhesion to mortar mass and thus affecting the damage pattern of
x1
x3
x4
x2
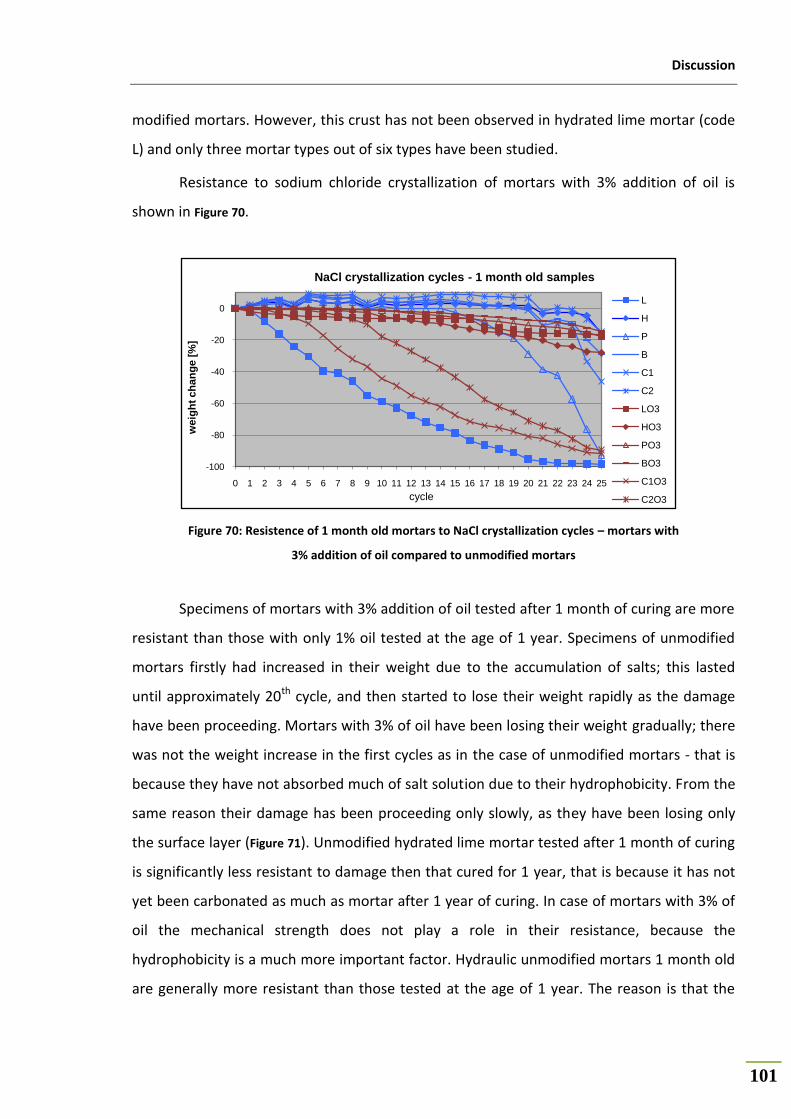
Discussion
101
modified mortars. However, this crust has not been observed in hydrated lime mortar (code
L) and only three mortar types out of six types have been studied.
Resistance to sodium chloride crystallization of mortars with 3% addition of oil is
shown in Figure 70.
Figure 70: Resistence of 1 month old mortars to NaCl crystallization cycles – mortars with
3% addition of oil compared to unmodified mortars
Specimens of mortars with 3% addition of oil tested after 1 month of curing are more
resistant than those with only 1% oil tested at the age of 1 year. Specimens of unmodified
mortars firstly had increased in their weight due to the accumulation of salts; this lasted
until approximately 20th cycle, and then started to lose their weight rapidly as the damage
have been proceeding. Mortars with 3% of oil have been losing their weight gradually; there
was not the weight increase in the first cycles as in the case of unmodified mortars - that is
because they have not absorbed much of salt solution due to their hydrophobicity. From the
same reason their damage has been proceeding only slowly, as they have been losing only
the surface layer (Figure 71). Unmodified hydrated lime mortar tested after 1 month of curing
is significantly less resistant to damage then that cured for 1 year, that is because it has not
yet been carbonated as much as mortar after 1 year of curing. In case of mortars with 3% of
oil the mechanical strength does not play a role in their resistance, because the
hydrophobicity is a much more important factor. Hydraulic unmodified mortars 1 month old
are generally more resistant than those tested at the age of 1 year. The reason is that the
-100
-80
-60
-40
-20
0
0 1 2 3 4 5 6 7 8 9 10 11 12 13 14 15 16 17 18 19 20 21 22 23 24 25
weig
ht
ch
an
ge [
%]
cycle
NaCl crystallization cycles - 1 month old samples
L
H
P
B
C1
C2
LO3
HO3
PO3
BO3
C1O3
C2O3

Discussion
102
unmodified mortars lost their strength probably because of formation of microcracks due to
improper curing conditions, as it has been already mentioned before.
On the pictures in Figure 71 can be seen that unmodified mortars contained cracks
after the testing, showing that higher damage occurred compared to the mortars with 3% of
linseed oil even though the weight loss is not that significant yet.
Resistance to Na2SO4 crystallization
To accelerate damage due to the salt crystallization, 10 wt% sodium sulphate solution
has been used for testing besides the sodium chloride solution of the same concentration.
Indeed, as seen in Figure 73 and Figure 74, the damage takes place much faster than that due
to the sodium chloride crystallization. The reason for that is that the damage is caused by
not only crystallization pressures like in the case of NaCl, but also by high hydration
pressures accompanying conversion of anhydrous phase of sodium sulphate (thenardite
Na2SO4) into the hydrated phase (mirabilite Na2SO4.10H2O), taking place when the dried
specimens are immersed into salt solution (hydration heat can be felt, the solution is
warmed-up).
Specimen H Specimen HO3 Specimen P Specimen PO3
Figure 72: State of the specimens of mortars with 3% addition of oil and unmodified mortars after 25 NaCl
crystallization cycles, tested after 1 month of curing
Figure 71: Specimen after 6 hours of full immersion
into a salt solution - solution penetration only into
depth of approx. 3 mm

Discussion
103
Figure 73: Resistence of 1 year old mortars to Na2SO4
crystallization cycles – mortars with 1% addition of
oil compared to unmodified mortars
Figure 74: Resistence of 1 month old mortars to
Na2SO4 crystallization cycles – mortars with 3%
addition of oil compared to unmodified mortars
The process of damage due to sodium sulphate crystallization is rather too fast so
that it is harder to compare weight loss of various types of mortars. However the result is in
accordance with the resistance to NaCl crystallization cycles – mortars with the addition of
linseed oil are showing higher durability. Interesting phenomena has been observed on the
hydrated lime (code LO3) and brick dust (code BO3) mortars with 3% addition of oil.
Specimens of these mortars stayed with almost no weight loss for ten more crystallization
cycles while all the other specimens have been already destroyed. These mortars both show
excellent hydrophobity and for that reason salt solution does not penetrate into their
structure thus cannot cause any damage, even though they have a very little strength.
Damage takes place only by loosing a thin powder layer from their surface when moved out
of salt solution, as can be seen in Figure 75.
-100
-80
-60
-40
-20
0
20
0 1 2 3 4 5 6 7 8 9 10
weig
ht change [
%]
cycle
Na2SO4 crystallization cycles- 1 year old samples
L
H
P
B
C1
C2
LO1
HO1
PO1
BO1
C1O1
C2O1
-100
-80
-60
-40
-20
0
20
0 2 4 6 8 10 12 14 16 18 20
weig
ht change [
%]
cycle
Na2SO4 crystallization cycles - 1 month old samples
L
H
P
B
C1
C2
LO3
HO3
PO3
BO3
C1O3
C2O3
Figure 75: Specimens of hydrated lime and brick dust
mortars in sodium sulphate solution - specimens are
hydrophobic, they lose surface powder layer
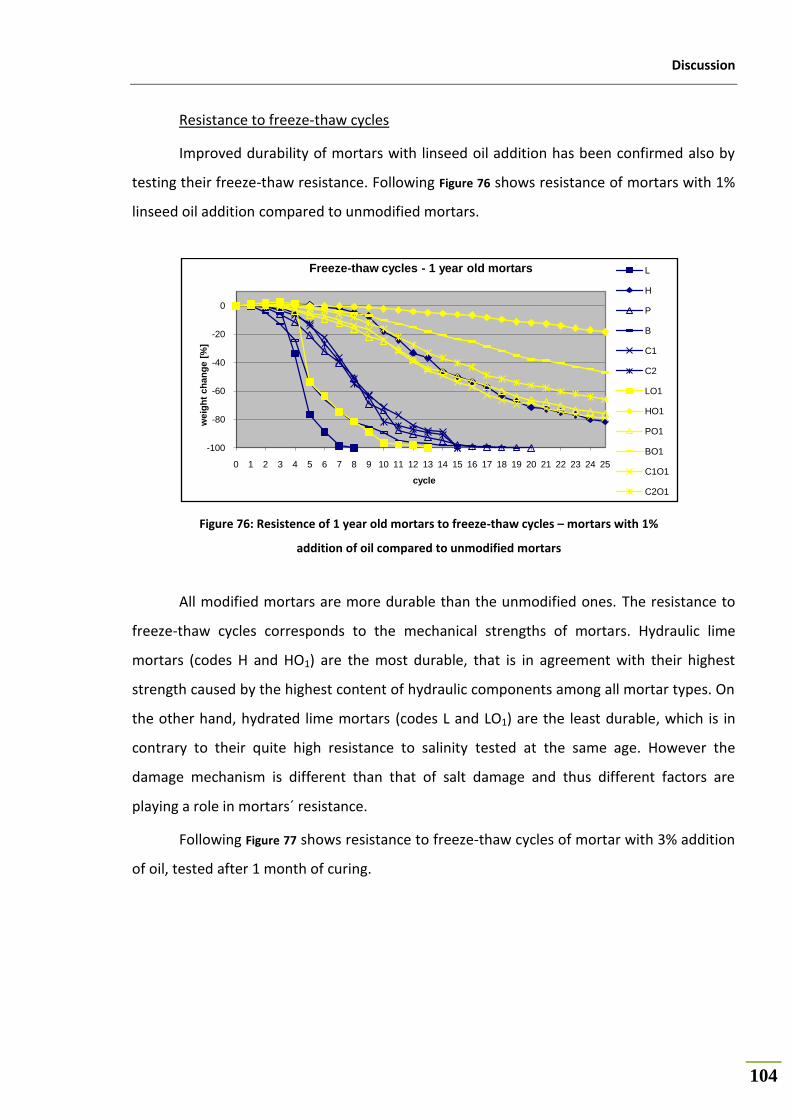
Discussion
104
Resistance to freeze-thaw cycles
Improved durability of mortars with linseed oil addition has been confirmed also by
testing their freeze-thaw resistance. Following Figure 76 shows resistance of mortars with 1%
linseed oil addition compared to unmodified mortars.
Figure 76: Resistence of 1 year old mortars to freeze-thaw cycles – mortars with 1%
addition of oil compared to unmodified mortars
All modified mortars are more durable than the unmodified ones. The resistance to
freeze-thaw cycles corresponds to the mechanical strengths of mortars. Hydraulic lime
mortars (codes H and HO1) are the most durable, that is in agreement with their highest
strength caused by the highest content of hydraulic components among all mortar types. On
the other hand, hydrated lime mortars (codes L and LO1) are the least durable, which is in
contrary to their quite high resistance to salinity tested at the same age. However the
damage mechanism is different than that of salt damage and thus different factors are
playing a role in mortars´ resistance.
Following Figure 77 shows resistance to freeze-thaw cycles of mortar with 3% addition
of oil, tested after 1 month of curing.
-100
-80
-60
-40
-20
0
0 1 2 3 4 5 6 7 8 9 10 11 12 13 14 15 16 17 18 19 20 21 22 23 24 25
weig
ht
ch
an
ge [
%]
cycle
Freeze-thaw cycles - 1 year old mortars L
H
P
B
C1
C2
LO1
HO1
PO1
BO1
C1O1
C2O1

Discussion
105
Figure 77: Resistence of 1 month old mortars to freeze-thaw cycles – mortars with 3%
addition of oil compared to unmodified mortars
Resistance to freeze-thaw cycles of mortars with 3% oil addition has been improved
as well as those with 1% oil addition comparing to unmodified mortars tested at the same
age, thought the difference between modified and unmodified mortar is not as remarkable
as in the case of mortars with 1% oil addition. The reason for that is probably that none of
the mortars have been carbonated at this age and that the strength obtained by carbonation
plays more important role than the effect of oil addition. Hydrated lime mortar decomposed
due to its low strength already after the first cycle.
Cement mortar with 3% oil addition (code C1O3) showed significantly lower
resistance than the other mortars. The decreased resistance might have been partially
affected by biological deterioration of mortars. Signs of moulds were observed on a surface
of two out of twelve specimens of this mortar type. Biological deterioration is a threat
related to the use of natural organic materials, moulds develop when suitable temperature
and relative humidity occurs, provided that they have nutrients, which can be oil in this case.
Growing of moulds is connected with development of pressures which may lead to damage
of the material. It is possible that the development of moulds, which might have not yet
been visible, might be one of the factors which caused the decrease in strength of all
mortars with 3% addition of oil. However no moulds were found on any other specimens
and in outdoor conditions moulds are less likely to occur. Nevertheless it should be kept in
mind that higher concentration of natural additives is increasing the risk of biological
deterioration.
-100
-80
-60
-40
-20
0
0 1 2 3 4 5 6 7 8 9 10 11 12 13 14 15 16 17 18 19 20 21 22 23 24 25
weig
ht
ch
an
ge [
%]
cycle
Freeze-thaw cycles - 1 month old mortarsL
H
P
B
C1
C2
LO3
HO3
PO3
BO3
C1O3
C2O3

Discussion
106
In contrary to damage mechanisms observed at mortars subjected to salinity test,
there seems to be no difference between the way of damage of modified and unmodified
mortars due to the freeze-thaw cycles. Mortars have been losing weight gradually by surface
powdering and scaling, specimens have been losing compactness and cohesion due to the
binder phase which seemed to be washing out. No formation of crack as in the case of the
salinity resistance test has been observed.
Following pictures document the damage mechanism due to the freeze-thaw cycles.
Figure 78: Formation of crack due to
freeze on the surface of a specimen
(code C1O1)
Figure 79: Surface scaling due to
freeze-thaw cycling (sample BO3)
Conclusions
107
6 Conclusions
6.1 THE EFFECT OF THE ADDITION OF LINSEED OIL ON MORTARS PROPERTIES AND THE
MECHANISM OF ITS OPERATION
In the present study, the effect of linseed oil on the properties of lime-based mortars
has been studied. Oil was added in two different concentrations – 1% and 3% by the weight
of binder – into six various lime-based mortar mixtures, which composition has been
selected with respect to composition of historical mortars, but also mortars used in modern
restoration practise have been tested.
Addition of linseed oil showed to have different effect on some properties of
hardened mortars depending on the amount added. The effect of 1% and 3% addition of oil
on the mechanical properties of mortars has been contradictory. Addition of 1% of linseed
oil is improving mortars’ strength, but the strength of mortars with 3% addition of oil is
dramatically reduced comparing to unmodified mortars. The explanation of the decreased
strength of mortars with 3% oil addition might be that oil is limiting contact between binder
phase and the grains of aggregate, but could be also related to the effect of oil on the
properties of fresh mortar. Oil seems to increase cohesion among the grains of binder and
by this way increasing the consistency of a mortar. In 1% addition the effect is positive – the
cohesion between binder grains leads to increased consistency, which is still sufficient for
required workability. The water/binder ratio is thus slightly decreased and so is the final
total porosity of hardened mortars. But in 3% addition of oil the cohesion among grains of
binder is higher, so the consistency of a mortar is too high and thus higher amount of
kneading water is needed to reach required plasticity and workability. But this “extra” water
is not incorporated evenly in mortar mixture because of the hydrophobicity of binder-
aggregate paste (oil does not allow more water to be mixed in), and hence the pore size
distribution of hardened mortar is affected. In other words, for a given concentration of oil
in mortar there is only a limited amount of water that can be evenly mixed into fresh mortar.
Excess water is segregated out of mortar mass or, if locked in mortar structure, results in a
formation of big pores in the hardened mortar, but without affecting the total porosity
Conclusions
108
significantly. For mortars with 1% addition of oil the effect is the opposite, mortars have
higher proportion of small pores compared to unmodified mortars.
Oil addition is mitigating water transport in mortar structure, both in a micro- and
macro- scale. It delays final setting time, because of blocking the pores and thus slowing
down the penetration of water molecules to grains of binder. 1% addition of oil is slowing
down the hydration of hydraulic components, but it is not decreasing the final hydration
degree. Later within the range of months the effect of oil addition on the water transport is
positive. Oil in 1% addition seems to be prolonging curing process (compressive strength of
modified mortar increased after 1 year while reference mortar stayed at the same level) and
preventing mortar to dry-out (flexural strength of unmodified mortar at the age of 1 year
decreased while that of mortar with 1% of oil stayed at the same level as at the age of 3
months). On contrary, in case of mortars with 3% addition of oil there are probably other
predominant effects, like worse contact between binder and aggregate grains due to oil or
the high proportion of big pores in the structure, as mentioned before, which resulted in the
decreased strength. Water vapour permeability does not seem to be affected by the
addition of oil and the degree of carbonation of mortar with either oil addition has not been
decreased, mortars with 3% addition of oil have been even more carbonated than
unmodified mortars, which is in accordance with the highest proportion of big pores causing
higher permeability.
As expected, oil addition is decreasing mortars´ ability to absorb liquid water, and
this effect is the most apparent on the results of water absorption through capillarity.
Already 1% addition of oil is decreasing the coefficient of capillarity significantly and 3%
addition of linseed oil results in decreasing the value of capillary coefficient by
approximately 90%. Decreased capillarity is probably first of all caused by the hydrophobic
effect of linseed oil, mortars with oil addition show increased water contact angle, but may
be also affected by the changes in pore size distribution in mortars due to the addition of oil.
Furthermore, the addition of oil into the mortar was found to be significantly
decreasing the amount of pores which are easily accessible to water; after immersion of
mortars specimens with 1% and 3% oil addition for 48 hours under water under normal
pressure, water filled 80% and 30% respectively of the total volume of opened pores
comparing to 90% easily accessible pores of unmodified mortar.

Conclusions
109
Pores accessibility to water is together with the strength of the material a crucial
characteristic determining mortars´ resistance to deterioration. Indeed, the durability of
mortars with oil addition has been significantly improved. Modified mortars showed higher
resistance to damage due to both salt crystallization and freeze-thaw cycles. For example
specimens of mortars with 1% addition of oil suffered in average only 40% weight loss when
all the unmodified mortars had been already decomposed, i.e. the difference in weight loss
between modified and unmodified mortars at the end of testing made 60%. The situation is
similar for the freeze-thaw testing; the difference in weight loss between modified and
unmodified mortars after 25 performed cycles was 55%.
In summary, the low addition of linseed oil (1%) has proved to have positive effect on
mortars´ properties. It improves mechanical characteristics and limits water absorption into
mortar without affecting the total open porosity or decreasing degree of carbonation. On
the other hand, the addition of linseed oil in 3% by the weight of binder does not have a
positive effect on the quality of mortars. Mortars with this content of oil are almost
hydrophobic, but their mechanical characteristics are markedly decreased. Mortars with
linseed oil in both concentrations showed significantly improved resistance to salt
crystallization and freeze-thaw cycles.
On the base of the above mentioned reasons, the addition of one percent of linseed
oil can be taken into consideration in the design of mortars meant to repair or replace
historic mortars.
6.2 SUGGESTIONS FOR FURTHER RESEARCH
Satisfactory results have been obtained by blending the oil with the dried
constituents of mortar prior to adding water. However the effect of different ways of mixing
the oil into mortar (blending the oil with water first, eventually with the addition of
emulsifier, effect of different periods and intensities of mixing) might be interesting to study
in detail.
Addition of 1% of linseed oil is unambiguously improving mortars´ properties tested
on small specimens in laboratory. In the next step mortars´ durability should be tested in
outdoor conditions, applied on a stone or brick masonry. It is important to study the
influence of linseed oil addition on mortar´s adhesion to different types of substrate.

Conclusions
110
Furthermore, the effect of mortars with oil addition on the mechanism of transport of
humidity and salts in a complex system of masonry should be studied.
References
111
7 References
1. Vitruvius. Ten Books on Architecture. [trans.] Ingrid D. Rowland. Cambridge : Cambridge
University Press, 1999. pp. 87-88. Book VII.. 0-521-55364-4.
2. Pliny. The Natural History. [trans.] John Bostock and H.T. Riley. London : s.n., 1857. pp.
372-377. Vol. VI., Book XXXVI., Chapter 58.
3. Sickels, Lauren-Brook. Organic additives in mortars. Edinburgh Architecture Research.
1981, Vol. 8, pp. 7-20.
4. Rovnaníková, Pavla. Omítky. Praha : STOP, 2002. 80-86657-00-0.
5. Chandra, S. History of Architecture and Ancient Building Materials in India, Part II.
6. Chandra, Satish. Use of natural polymers in concrete. Nice, France : s.n., 1994.
7. Chandra, Satish and Ohama, Yoshihiko. Polymers in concrete. s.l. : CRC Press, Inc., 1994.
0-8493-4815-3.
8. Organics vs. synthetics: Their use as additives in mortars. Sickels, Lauren-Brook. Rome :
s.n., 1981. Mortars, cements and grouts used in the conservation of historics buildings,
Symposium. pp. 25-52.
9. Doubravová, Kateřina. Přírodní organické materiály používané v minulosti jako přísady do
vápenných malt. Zprávy památkové péče. 2000, Vol. 60, 8, pp. 229-232.
10. Van Balen, K., et al. Introduction to requirments for and functions and properties of
repair mortars. [ed.] C. Groot, G. Ashall and J. Hughes. Characterization of Old Mortars with
Respect to their Repair - Final Report of RILEM TC 167-COM. 2004.
11. Norma UNI 10924. Malte per elementi construttivi e decorativi: classificazione e
terminologia. Milan : UNI (Ente Nazionale Italiano Unificazione), 2001.
12. Cowper, Ad. Lime and Lime Mortars. s.l. : Donhead, 1998. 1-873394-29-2.
13. EN 459-1:2001. Building lime - Part 1: Definitions, specifications and conformity criteria.
References
112
14. Allen, Geoffrey, et al. Hydraulic Lime Mortar for Stone, Brick, and Block Masonry.
Shaftesbury : Donhead Publishing Ltd, 2003. 1-873394-64-0.
15. Kotlík, Petr. Stavební materiály historických objektů. Praha : The Institute of Chemical
Technology Prague, 2007. 978-80-7080-347-9.
16. Papayianni, I. and Stefanidou, M. Strength-porosity relationships in lime-pozzolan
mortars. Constructions and Building Materials. 20, 2006, pp. 700-705.
17. Edmeades, R.M. and Hewlett, P.C. Cement Admixtures. [ed.] P.C. Hewlett. Lea´s
chemistry of cement and concrete. 4th edition. s.l. : Butterworth-Heinemann, 2004, pp. 841-
907.
18. Kotlík, P., et al. Vápno. Praha : STOP, 2001. 80-902668-8-6.
19. Hošek, Jiří and Ludvík, Losos. Historické omítky - Průzkum, sanace, typologie. Praha :
Grada Publishing, a.s., 2007. 978-80-247-1395-3.
20. [Online] [Cited: 2 9 2009.] http://encyclopedia.thefreedictionary.com/thixotropy.
21. Van Balen, K., et al. Environmental deterioration of ancient and modern hydraulic
mortars. s.l. : EC-Protection and conservation of European cultural heritage, 2002. Research
report No 15, Project No ENV4-CT95-0096. EUR 19863, ISBN 92-894-3169-5.
22. Pecchioni, E., Fratini, F. and Cantisani, E. Le malte antiche e moderne tra tradizione e
invazione. Bologna : Pàtron, 2008.
23. Vicat, Louis-Joseph. A Practical and Scientific reatise on Calcareous Mortars and
Cements. s.l. : J. Weale, 1837.
24. Blezard, R.B. The History of Calcareous Cements. [ed.] P.C. Hewlett. Lea´s chemistry of
cement and concrete. 4th edition. s.l. : Butterworth-Heinemann, 2004, pp. 1-23.
25. EN 197-1:1992. Cement - Part 1: Composition, specifications and conformity criteria for
common cements.
26. Taylor, H.F.W. Cement Chemistry. s.l. : Academic Press Ltd, 1990. 0-12-683900-X.

References
113
27. Macphee, D.E. and Lachowski, E.E. Cement Components and Their Phase Relations. [ed.]
P.C. Hewlett. Lea´s chemistry of cement and concrete. s.l. : Butterworth-Heinemann, 2004,
Vol. 4th edition, pp. 95-126.
28. Massazza, F. Pozzolana and pozzolanic cement. Hewlett P.C. Ed. Lea's chemistry of
cement and concrete. s.l. : Elsevier, 2007, pp. 471-602.
29. A petrographic study of mortar hydraulicity. Pavía, S. Lisbon : LNEC, Laboratorio General
Engenharia Civil, 2008. Historical Mortars Conference.
30. Baronio, G., Binda, L. and Lombardini, N. The role of brick pebbles and dust in
conglomerates based on hydraulic lime and crushed bricks. Construction and Building
Materials. 11, 1997, Vol. 1, pp. 33-40.
31. Massazza, F. Pozzolana and pozzolanic cements. [ed.] P.C. Hewlett. Lea's chemistry of
cement and concrete. 4th edition. s.l. : Butterworth-Heinemann, 2004, pp. 471-602.
32. Ruedrich, Joerg and Siegesmund, Siegfried. Salt and ice crystallization in porous
sandstones. Environmental Geology. 52, 2007, pp. 225-249.
33. Charola, A. Elena. Salts in the Deterioration of Porous Materials: An Overview. Journal of
the American Institute for Conservation (JAIC). 39, 2000, Vol. 3, pp. 327-343.
34. Sodium chloride damage to porous building materials. Lubelli, Barbara. s.l. : Delft
University of Technology, dissertation thesis, 2006. 90-9020343-5.
35. Chandra, S., Eklund, L. and Villarreal, R.R. Use of cactus in mortars and concrete.
Cement and Concrete Research. 1998, Vol. 28, 1, pp. 41-51.
36. Alberti, Leone Battista. Ten Books on Architecture. [trans.] J. Leoni. London : s.n., 1965.
p. 149.
37. Carey, Francis A. Organic Chemistry. 4th. s.l. : McGraw-Hill Higher Education, 2000. pp.
1017-1019. 0-070290501-8.
References
114
38. Alberti, Leon Battista. On the Art of Building in Ten Books. [trans.] Joseph Rykwert, Neil
Leach and Robert Tavenor. Cambridge, Massachusetts; London, England : The MIT Press,
1997. p. 90. Book III., chap. 16, 52V-54V. 0-262-51060-X.
39. Vitruvius. On Architecture. [trans.] Frank Granger. s.l. : Harvard University Press, 1957. p.
85. Vol. II., Book VII., paragraphs 6. and 7..
40. Arcolao, C. and Dal Bo, A. L’Influenza delle Sostanze Proteiche Naturali su Alcune
Proprieta degli Stucchi. Scienza e Beni Culturali “Lo Stucco: Cultura, Tecnologia, Conoscenza”.
Edizione Arcadia Ricerce, 2001, pp. 527-538.
41. Cennini, Cennino. The Craftsman´s handbook. [trans.] D.V. Thompson. New York : Dover
Publications, 1594.
42. Hošek, Jiří and Muk, Jan. Omítky historických staveb. Praha : SPN, 1990. 80-04-23349-X.
43. Bankard, George P. The Art of the Plasterer. London : s.n., 1909. pp. 6,7.
44. Chandra, S. and Aavik, J. Influence of proteins on some properties of portland cement
mortar. The International Journal of Cement Composites and Lightweight Concrete. 1987,
Vol. 9, 2, pp. 91-94.
45. Organic additives in Brazilian lime mortars. Santiago, Cybèle Celestino and Mendonca
De Oliveira, Mário. [ed.] Neville Hill, Stafford Holmes and David Mather. London :
Intermediate Technology Publications, 1992, Lime and other alternative cements. 1-85339-
178-6.
46. Zelinger, Jiří, Šimůnková, Eva and Kotlík, Petr. Chemie v práci konzervátora a
restaurátora. Praha : Academia, 1982. pp. 73-85.
47. Lazzari, Massimo and Chiantore, Oscar. Drying and oxidative degradation of linseed oil.
Polymer Degradation and Stability. 1999, Vol. 65, pp. 303-313.
48. Justnes, H., Østnor, T.A. and Barnils Vila, N. Vegetable oils as water repellents for
mortars. Proceedings of the International Conference on recent Trends in Concrete
technology and Structures, Coimbatore, India 2003
References
115
49. Influence of vegetable oils on durability and pore structure of mortars. Vikan, H. and
Justnes, H. 2006. Proceedings of the Seventh CANMET/ACI International Conference on
Durability of Concrete. pp. 417-430. May 28-June 3, ACI SP-234-25.
50. Papayianni, I. and Stefanidou, M. Durability aspects of ancient mortars of the
archeological site of Olynthos. Journal of Cultural Heritage. 8, 2007, pp. 193-196.
51. EN 1097-3:1998. Tests for mechanical and physical properties of aggregates - Part 3:
Determination of loose bulk density and voids.
52. EN 196-3:1995. Methods of testing cement - Part 3: Determination of setting time and
soundness.
53. EN 1015-3:1999. Methods of test for mortar for masonry - Part 3: Determination of
consistence of fresh mortar (by flow table).
54. EN 1015-6:1999. Methods of test for mortar for masonry - Part 6: Determination of bulk
density of fresh mortar.
55. EN 1015-11:1999. Methods of test for mortar for masonry - Part 11: Determination of
flexural and compressive strength of hardened mortar.
56. Qasrawi, Hisham Y. Concrete strength by combined nondestructive methods - Simply
and reliably predicted. Cement and Concrete research. 30, 2000, pp. 739-746.
57. BS 1881-203:1886. Testing concrete - Part 203: Recommendations for measurement of
velocity of ultrasonic pulses in concrete.
58. BS 1881-209. Testing concrete - Part 209: Recommendations for the measurement of
dynamic modulus of elasticity.
59. EN 1936:2006. Natural stone test methods - Determination of real density and apparent
density, and of total and open porosity.
60. Hirshwald, J. Die Prüfung der natürlichen Bausteine auf ihre Verwitterungsbeständigkeit.
Wilhelm Ernst & Sohn. 1908.

References
116
61. Water and its Interaction with Porous Inorganic Building Materials. Wendler, E. and
Charola, A.E. s.l. : Aedification Publishers, 2008. Hydrophobe V, 5th International Conference
on Water Repellent Treatment of Building Materials. pp. 57-74.
62. Barsottelli, M., et al. The hygrometric behaviour of some artificial stone materials used
as elements of masonry walls. Materials and Structures. 34, 2001, pp. 211-216.
63. EN 1015-18:2002. Methods of test for mortar for masonry - Part 18: Determination of
water absorption coefficient due to capillary action of hardened mortar.
64. The most important property of cement-lime mortar in masonry construction is....*. Tate,
Michael. Orlando, Florida, March 9-11, 2005 : s.n. International Building Lime Symposium
2005. www.buildinglime.org.
65. NORMAL 21/85. Permeabilità al vapor d´acqua. Roma : CNR-ICR, 1986.
66. Munsell Soil Colour Charts. New Windsor : Gretag Macbeth, 1998.
67. RILEM CPC 11.3. Absorption of water by immersion under vacuum.
68. Kendix, Elsebeth. M2ADL Ravenna, Italy, personal communication - interpretation of
spectras, 25.8.2009 .
69. Albayrak, A.T., et al. Investigation of the effects of fatty acids on the compressive
strength of the concrete and the grindability of the cement. Cement and Concrete Research.
35, 2005, pp. 400-404.
70. Arandigoyen, M. and Alvarez, J.I. Blended pastes of cement and lime: Pore structure and
capillary porosity. Applied Surface Science. 252, 2006, pp. 8077-8085.
71. Papayianni, I. Aristotle University of Thessaloniki. [personal communication].
Thessaloniki, Greece : s.n., 9. 9. 2009.
72. Michoinová, Dagmar. Příprava vápenných malt v péči o stavební památky. Praha :
Informační centrum ČKAIT, 2006. 80-86769-81-X.
References
117
73. Aimin, Xu and Chandra, S. Influence of polymer addition on the rate of carbonation of
portland cement paste. The International Journal of Cement Composites and Lightweight
Concrete. 1988, Vol. 10, 1.
74. Chandra, S. and Aavik, J. Influence of black gram (natural organic material) addition as
admixure in cement mortar and concrete. Cement and Concrete Research. 1983, Vol. 13, pp.
423-430.
75. Arcolao, Carla. Le ricette del restauro - Malte, intonaci, stucchi dal XV al XIX secolo.
Venezia : Marsilio Editori, 1998. 88-317-6911-1.
76. Staňková, Jaroslava, et al. Architektura v proměnách tisíciletí. Praha : Sobotáles, 2005.
80-86817-10-5.
77. Škvára, F. Chemie a technologie anorganických pojiv I., část 1. Cement, hydraulická
pojiva. s.n. : Institute of Chemical Technology Prague, 2003.
78. Čechová, Eva. The study of modified cements. [diploma thesis]. Praha : Institute of
Chemical Technology Prague, 2006.
79. Papayianni, I. and Stefanidou, M. Strength-porosity relationships in lime-pozzolan
mortars. Construction and Building Materials. 20, 2006, Vol. 9, pp. 700-705.
80. Wikipedia [Cited: 2.9.2009.] http://en.wikipedia.org/wiki/Surface_tension.
Acknowledgements
118
8 Acknowledgements
The work described in this thesis has been carried out within the EPISCON project (European
Ph.D. in Science for Conservation) founded by European Community’s Marie Curie EST 6th
Framework programme, Contract no. MEST-CT-2005-020559.
First of all, I thank to Prof. Ioanna Papayianni for selecting me for the EPISCON project and
for letting me to perform my research at the Aristotle University of Thessaloniki, Greece.
I would like to sincerely thank to everybody who helped me to complete this research.
I thank to Prof. Piero Tiano, Dr. Fabio Fratini and Dr. Silvia Rescic for performing Mercury
Intrusion Porosimetry and for letting me use their UV-microscope at CNR-ICVBC in Florence.
I also thank to Prof. Rocco Mazzeo, Dr. Silvia Prati and Elsebeth Kendix from Microchemistry
and Microscopy Art Diagnostic Laboratory (M2ADL) in Ravenna, Italy for FTIR-ATR analysis of my
specimens.
I would like to thank to the staff at the Aristotle University of Thessaloniki, namely to
Dr. Maria Stefanidou, Michalis Papachristoforou and Yiannis Goutsios for helping me measuring
compressive strength, and to Lambrini Papadopoulou from the Faculty of Geology, AUTH, for the
Scanning Electron Microscopy analysis of my specimens.
I thank to all who were willing to listen to my talking about mortars and especially to those
who were even discussing with me, namely to Dr. Fabio Fratini and Dr. Ioannis Ioannou.
I also thank to the Department of Chemical Technology of Monuments Conservation at the
Institute of Chemical Technology in Prague for the valuable knowledge I learnt there when working
on my diploma thesis, which I greatly appreciated when continuing the research on mortars during
my Ph.D. research.
I thank to Dr. Maria Stefanidou for providing me access to the laboratory in the last months
of my research even after the usual working time.
I thank to Vincenzo Starinieri, without whom the stay in Thessaloniki would be much harder.
And I thank to my family and friends for the continuous support they have been giving me.

List of appendices
List of appendices
Appendix I: Technical sheet of pozzolan
Appendix II: Technical sheet of hydraulic lime
Appendix III: Resistance to salinity – specimens’ documentation
Appendix IV: Freeze-thaw resistance – specimens’ documentation

Appendix I: Technical sheet of pozzolan
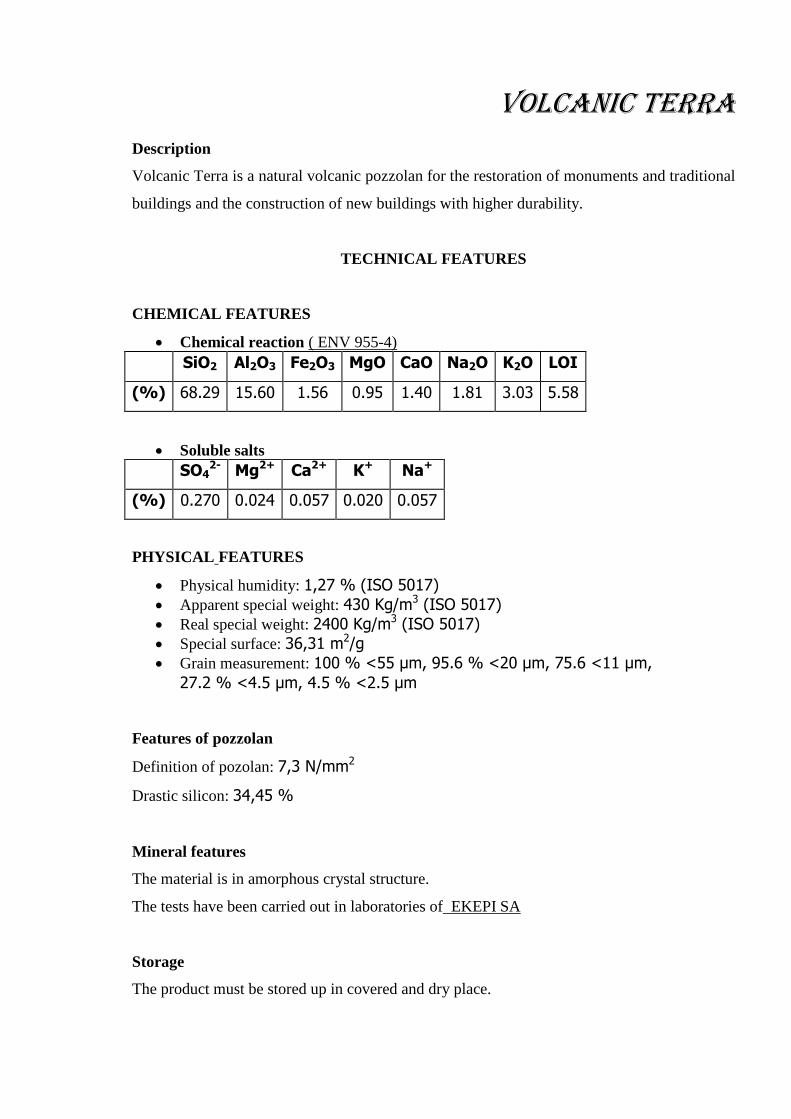
VOLCANIC TERRA Description
Volcanic Terra is a natural volcanic pozzolan for the restoration of monuments and traditional
buildings and the construction of new buildings with higher durability.
TECHNICAL FEATURES
CHEMICAL FEATURES
Chemical reaction ( ENV 955-4)
SiO2 Al2O3 Fe2O3 MgO CaO Na2O K2O LOI
(%) 68.29 15.60 1.56 0.95 1.40 1.81 3.03 5.58
Soluble salts
SO42- Mg2+ Ca2+ K+ Na+
(%) 0.270 0.024 0.057 0.020 0.057
PHYSICAL FEATURES
Physical humidity: 1,27 % (ISO 5017)
Apparent special weight: 430 Kg/m3 (ISO 5017)
Real special weight: 2400 Kg/m3 (ISO 5017)
Special surface: 36,31 m2/g
Grain measurement: 100 % <55 μm, 95.6 % <20 μm, 75.6 <11 μm,
27.2 % <4.5 μm, 4.5 % <2.5 μm
Features of pozzolan
Definition of pozolan: 7,3 N/mm2
Drastic silicon: 34,45 %
Mineral features
The material is in amorphous crystal structure.
The tests have been carried out in laboratories of EKEPI SA
Storage
The product must be stored up in covered and dry place.

Appendix II: Technical sheet of hydraulic lime

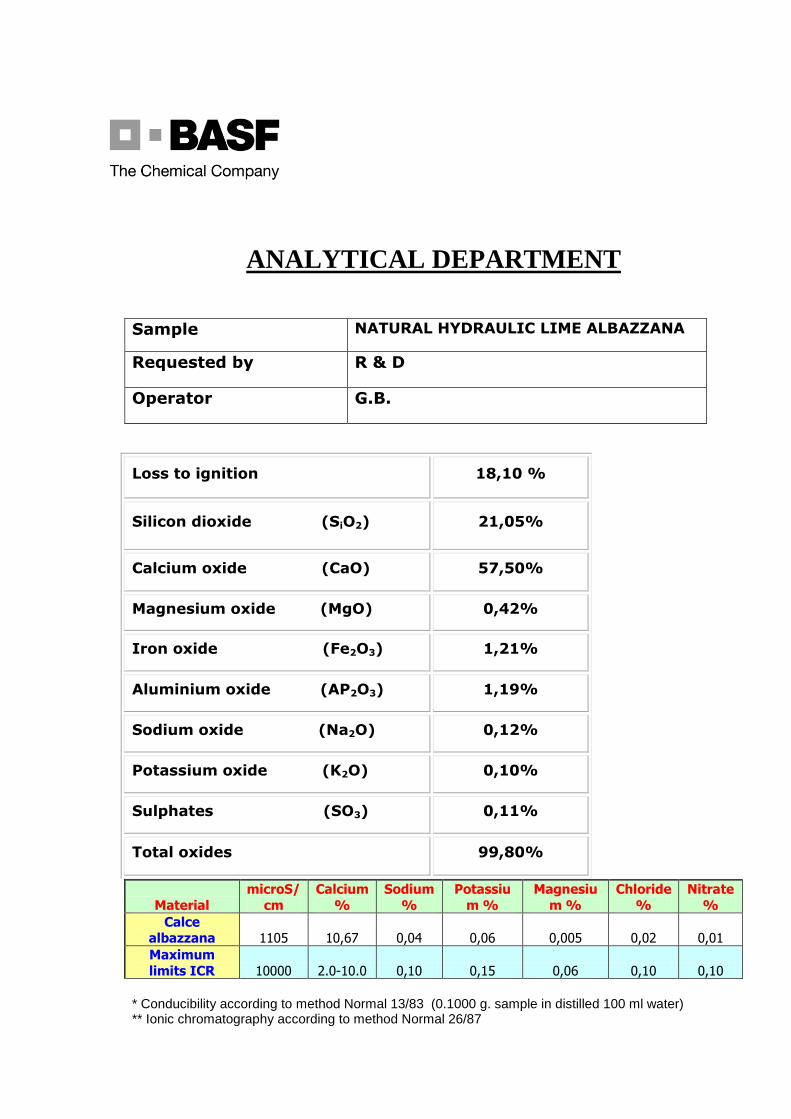
ANALYTICAL DEPARTMENT
Sample NATURAL HYDRAULIC LIME ALBAZZANA
Requested by R & D
Operator G.B.
Loss to ignition 18,10 %
Silicon dioxide (SiO2) 21,05%
Calcium oxide (CaO) 57,50%
Magnesium oxide (MgO) 0,42%
Iron oxide (Fe2O3) 1,21%
Aluminium oxide (AP2O3) 1,19%
Sodium oxide (Na2O) 0,12%
Potassium oxide (K2O) 0,10%
Sulphates (SO3) 0,11%
Total oxides 99,80%
Material
microS/
cm
Calcium
%
Sodium
%
Potassiu
m %
Magnesiu
m %
Chloride
%
Nitrate
%
Calce albazzana 1105 10,67 0,04 0,06 0,005 0,02 0,01
Maximum
limits ICR 10000 2.0-10.0 0,10 0,15 0,06 0,10 0,10
* Conducibility according to method Normal 13/83 (0.1000 g. sample in distilled 100 ml water) ** Ionic chromatography according to method Normal 26/87

Appendix III: Resistance to salinity
Documentation of the state of the specimens after 25 performed NaCl
crystallization cycles
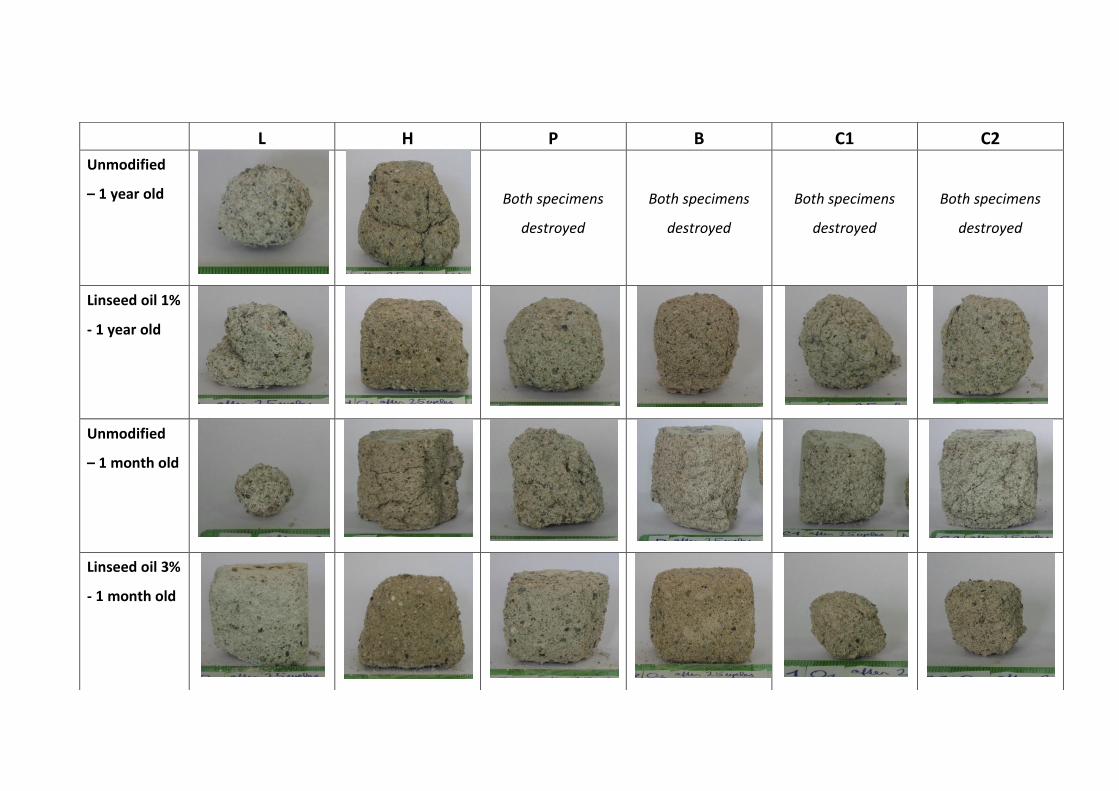
L H P B C1 C2
Unmodified
– 1 year old
Both specimens
destroyed
Both specimens
destroyed
Both specimens
destroyed
Both specimens
destroyed
Linseed oil 1%
- 1 year old
Unmodified
– 1 month old
Linseed oil 3%
- 1 month old

Appendix IV: Resistance to freeze-thaw cycles
Documentation of the state of the specimens after 25 performed freeze-
thaw cycles

L H P B C1 C2
Unmodified
– 1 year old Both specimens
destroyed
Both specimens
destroyed
Both specimens
destroyed
Both specimens
destroyed
Both specimens
destroyed
Linseed oil 1%
- 1 year old Both specimens
destroyed
Unmodified
– 1 month old Both specimens
destroyed
Linseed oil 3%
- 1 month old
Both specimens
destroyed
