the effect of land factors and management practices on rice yields · 2007-04-25 · the effect of...
TRANSCRIPT

The Effect of land factors and management practices on Rice Yields
(Case Study in Cyili inland Valley, Gikonko District, Rwanda)
Didace Kayiranga March 2006

The Effect of land factors and management practices on Rice Yields
(Case Study in Cyili inland Valley, Gikonko District, Rwanda)
by
Didace Kayiranga Thesis submitted to the International Institute for Geo-information Science and Earth Observation in partial fulfilment of the requirements for the degree of Master of Science in Geo-information Science and Earth Observation, Specialisation: Natural Resource Management; Sustainable Agriculture Thesis Assessment Board Prof E.M.A. Smaling (Chairman), NRS Department, ITC Prof Ir P.M. Driessen (External Examiner), Wageningen University Dr D. Rossiter (Internal Examiner), ESA Department, ITC Dr Ir C.A.J. M. de Bie (First Supervisor), NRS Department, ITC Ir Bart Krol (Second Supervisor), NRS Departement , ITC
INTERNATIONAL INSTITUTE FOR GEO-INFORMATION SCIENCE AND EARTH OBSERVATION ENSCHEDE, THE NETHERLANDS

Disclaimer This document describes work undertaken as part of a programme of study at the International Institute for Geo-information Science and Earth Observation. All views and opinions expressed therein remain the sole responsibility of the author, and do not necessarily represent those of the institute.

Dedicated to my Sons K.M. Arnaud and K.H.Darcy
And my wife M. Joselyne


i
Acknowledgements
I wish to extent my gratitude to three institutions for giving me the opportunity to undertake this MSc programme. The Agriculture Research Institute of Rwanda (ISAR) for approving my application to pursue this course and the financial contribution during my field work in Rwanda, the NUFFIC organisation for the scholarship and ITC for awarding me the admission and academic skills. This work was made possible by the support and contribution from many individuals to whom I am indebted and would like to express my gratitude. First, I would like to express my profound gratitude to my first supervisor Dr Kees de Bie for his inspiring guidance and support he accorded me during fieldwork, data processing and analysis. I thank you for your critical reading and comments you made which gave shape to this thesis. My special thanks to Ir Balt Krol my second supervisor for his encouragement. I say thanks to all farmers of Cyili irrigation scheme who shared their time and knowledge to explain their land management. My appreciation and thanks to:
• My fellow NRM_MSc students for their support in one or other way Raul from Mozambique Boiki from Botswana Fidelis from Namibia Nining from Indonesia Nunung from Indonesia Lily from Guatemala Demis from Ethiopia You have been nice to me and I wish you all the best. • Mr Tenge Ngoga and Mr Deo Rutamu my Rwandese colleagues for their friendship and
daily mutual support

ii
Abstract
Rice consumption in Rwanda is on the rise due to increasing urbanisation and increasing acceptance by the population. Much of the rapidly growing demand for rice in Rwanda will be met from increased production in irrigated lowlands, which cover about 1.2 % of the total arable land. Since the arable land is limited, the productivity has to be increased. Currently rice production is characterized by large variability in productivity, management practices and total production. One of the methods to enhance yield is by the minimizing the yield gap among farmer’s field through identifying biophysical factors that cause rice yield gap. The aim of this study was to quantifying the potential rice production of the study area and identifying the determining factors that are causes rice yield gap and derive a production model prerequisite to the development of site-specific recommendations to improve productivity. Diagnostic based on-farm survey was conducted on 87 irrigated lowland fields in Cyili irrigation scheme, situated in South-East of Rwanda, in September 2005 and yield gap constraint were identified through Comparative Performance Analysis (CPA) method. Data on land and management practices such as soil texture, land preparation, water management, weeding, cropping calendars; fertilizer management, disease control and actual yield were collected through interview. Climatic data (temperature, rainfall, sunshine hour) and record on past yield were collected at Ministry of agriculture and at “ISAR” (Institut des Sciences Agronomiques du Rwanda) research institute. Rice yield potential was estimated using the PS-1 model. Significant land and management parameters were selected trough descriptive statistics. The average yield was 3832 kg/ha with a standard deviation of 1490 kg/ha. Yield gap constraints were attributed to management factors based on performance of rice. Stepwise forward linear regression was applied to selects constraints for yield variability and to derive production model. The model generated a yield gap of 1855 kg/ha and explained 75 % of the yield variability. The identified yield constraints and their contribution to yield gap were: Tungro disease (64.1 %) and Soil suitability (35.9%) which is mainly related to water availability, soil texture and soil infiltration rate. There was a significant correlation between simulated yields by the model and actual observed yield (R= 0.86, P= 0.000). Therefore, the model can be used to quantify rice yield constraints in the Cyili irrigation scheme.

iii
Table of contents
1. Introduction ......................................................................................................................................1 1.1. Background .............................................................................................................................1
1.1.1. Rice production in Rwanda ................................................................................................1 1.1.2. Importance of Rice Crop in Rwanda ..................................................................................2 1.1.3. Major constraint to rice production in Rwanda..................................................................3
1.2. Problem stetement and Objectives..........................................................................................4 1.2.1. Problem Statement..............................................................................................................4 1.2.2. Objective ............................................................................................................................5 1.2.3. Research question...............................................................................................................5 1.2.4. Hypothesis and assumption ................................................................................................5
1.3. Conceptual Approach .............................................................................................................6 1.3.1 Yield gap analysis through CPA (Comparative Performance Analysis)............................6 1.3.2 Mobile GIS Tools for Spatial Field data collection ...........................................................7 1.3.3 Estimation of Potential production using PS-1 Model.......................................................8
1.4 Study area ...............................................................................................................................8 1.4.1 Location..............................................................................................................................8 1.4.2 Landscape ...........................................................................................................................9 1.4.3 Weather ..............................................................................................................................9 1.4.4 Predominant cropping system ..........................................................................................11 1.4.5 Land tenure.......................................................................................................................12
2. Rice cycle and effect of weather to rice .........................................................................................13 2.1. Introduction to rice crop .......................................................................................................13 2.2. Effect of climate on rice crop ...............................................................................................15
3. Methods and Materials...................................................................................................................17 3.1. Flow chart of research method .............................................................................................17 3.2. Sampling Methods ................................................................................................................18 3.3. Rapid Rural Apprisal (RRA) ................................................................................................19 3.4. Data Collection .....................................................................................................................19 3.5. Comparative Performance Analysis(CPA)...........................................................................20 3.6. PS-1 : Production Situation level 1.......................................................................................20 3.7. Data entry and normalisation................................................................................................21 3.8. Descriptive Statistics ............................................................................................................21 3.9. Multiple linear regression.....................................................................................................21
4. Results ............................................................................................................................................22 4.1. Rice potential production estimation...................................................................................22 4.2. Descriptive statistics .............................................................................................................23
4.2.1. Yields................................................................................................................................23 4.2.2. Land characteristics..........................................................................................................23 4.2.3. Operation sequence ..........................................................................................................26
4.3. Summary of Descriptive statistics. .......................................................................................40 4.4. Multiples linear Regression ..................................................................................................41
4.4.1. Production Model .............................................................................................................41

iv
4.4.2. Yield gap by yield constraints ..........................................................................................42 5. Discussion ......................................................................................................................................44
5.1. Yield gap...............................................................................................................................44 5.1.1. Incidence of Tungro disease.............................................................................................44 5.1.2. Land and management levels as represented by soil suitability parameter......................45 5.1.3. Method of fertiliser application........................................................................................45 5.1.4. Water availability .............................................................................................................45
5.2. Limitation of the model ........................................................................................................46 6. Conclusion and Recommendation..................................................................................................47 References ..............................................................................................................................................48 Appendix ................................................................................................................................................51

v
List of figures
Figure 1-1: Districts growing rice ,Source : (Fewsnet-Rwanda, 2004) ...................................................2 Figure 1-2:Trend of Rice yield in Rwanda, data : source (Jagwe J.N. and Okoboi, 2003) .................4 Figure 1-3: Recent Yield in the study area (data from Field officer of Cyili, 2005) ..............................5 Figure 1-4 : Partial yield gaps and their dominant constraints (De Bie, 2000) modified from Fresco (1984) .......................................................................................................................................................6 Figure 1-5: Component of yield gaps (Duwayri et al, 1999 ) adapted from De Datta ( 1981) ..............7 Figure 1-6: Location of Study Area on Aster Image................................................................................9 Figure 1-7: Rainfall, ET and ½ ET (Average data from 1979 to 2000: Rubona Station)......................10 Figure 1-8: The average monthly Maximum and Minimum temperature (data from Rubona Station).10 Figure 1-9: Average Daily sunshine in hours per day per month (data from Rubona Station) .............11 Figure 1-10: Example of Crop rotation in the study area.......................................................................11 Figure 2-1: Schematic diagram of life cycle of Rice (120 days variety) adapted from Stansel,J.W., 1975 as cited by Atanasiu . N (1983).....................................................................................................14 Figure 3-1: Flow chart of Research Method ..........................................................................................17 Figure 3-2: Plots Sampled within the study area ...................................................................................18 Figure 4-1: Estimation of Rice potential production .............................................................................22 Figure 4-2 : Left: Distribution of yield data and fitted normal distribution curve; Right: Normality test for yield data ..........................................................................................................................................23 Figure 4-3 : Soil Texture versus Yield...................................................................................................23 Figure 4-4: Soil suitability Classification and soil local name versus yield ..........................................24 Figure 4-5: Soil pH versus yield ............................................................................................................25 Figure 4-6: Soil Electrical conductivity ................................................................................................25 Figure 4-7: Infiltration rate “IR” (Cm/day)............................................................................................26 Figure 4-8 : Farmer’s field problem assessment ....................................................................................26 Figure 4-9: Management practices in time scale (from land preparation to harvesting) .......................27 Figure 4-10: Variety grown versus Yield...............................................................................................27 Figure 4-11: Crop residues management versus yield ...........................................................................28 Figure 4-12: Land preparation management versus yield ......................................................................28 Figure 4-13: Deep Hoeing versus Yield.................................................................................................29 Figure 4-14: Age of seedling versus yield .............................................................................................29 Figure 4-15: Date of transplanting versus yield .....................................................................................29 Figure 4-16: Number of plant/hill versus Yield .....................................................................................30 Figure 4-17: Applied Nitrogen versus Yield..........................................................................................31 Figure 4-18 : Soil condition during NPK application versus Yield .......................................................31 Figure: 4-19 Time before incorporation NPK versus Yield...................................................................32 Figure 4-20: Applied Urea versus Yield ................................................................................................32 Figure 4-21 : Time of Application Urea versus Yield ...........................................................................32 Figure 4-22: Time before Urea incorporation versus yield....................................................................33 Figure 4-23: Soil condition during Urea application versus Yield ........................................................33 Figure 4-24: Disease control versus yield ..............................................................................................34 Figure 4-25: Incidence of rice dead heart disease versus yield..............................................................35 Figure 4-26: Tungro Disease Occurrence versus yield ..........................................................................35

vi
Figure 4-27: Presence of green leaf hopper versus Yields.....................................................................35 Figure 4-28: Water availability ranking versus Yield & Soil suitability versus water availability ranking....................................................................................................................................................36 Figure 4-29: Water ranking availability map (very easy =1, to difficult =4&5)....................................37 Figure 4-30: Weeds diversity and yields................................................................................................37 Figure 4-31: Number of Weeding versus Yield .....................................................................................38 Figure 4-32 : Presence of cyperacea ssp versus Yield...........................................................................38 Figure 4-33: Weeding dates versus Yield (from First to Fourth Weeding) ...........................................39 Figure 4-34: Presence of Azola versus Yield .........................................................................................39 Figure 4-35: Relation between soil suitability class and number of weeding. ......................................40 Figure 4-36: Date of harvesting versus yield .........................................................................................40 Figure 4-37: Yield constraints to rice in CYILI (January to July season, 2005) ...................................42 Figure 4-38: Relation between Observed and predicted yield values....................................................43

vii
List of tables
Table 1-1: Rice Production in Rwanda ....................................................................................................4 Table 2-1: Critical temperatures at various growth stages during the development of rice (Yoshida, 1978) ......................................................................................................................................................16 Table 3-1: Crop indicatives values.........................................................................................................20 Table 3-2 : Example of data Normalization ..........................................................................................21 Table 4-1: Cross tabulation of soil suitability and soil texture ..............................................................25 Table 4-2: Number of plant per hill versus age seedling (count)...........................................................30 Table 4-3 : Number plant per hill versus date of transplanting (count).................................................30 Table 4-4: NPK- management practices (Correlation coefficient between variables) .........................31 Table 4-5: Cross tabulation between presence of Green leafhopper and Tungro disease (count).........36 Table 4-6: Relation between weeds diversity and presence of Cyperacea ssp......................................38 Table 4-7: Summary of final regression model causes Rice Yield variability in Cyili (Jan- July season, 2005) ......................................................................................................................................................41 Table 4-8: Quantified of rice yield gap in Cyili rice scheme by yield constraint (kg/ha; January to July Season, 2005) .........................................................................................................................................42
List of pictures Picture 1:Diopsis Macrophalma ..............................................................................................................3 Picture 2 : GPS& Ipac; Field_ interview and pH/EC meter...................................................................20 Picture 3: Urea applied (4 days before incorporation)...........................................................................33


THE EFFECT OF LAND FACTORS AND MANAGEMENT PRACTICES ON RICE YIELDS IN CYILI INLAND VALLEY, RWANDA
1
1. Introduction
1.1. Background
Food security has been a major issue in the world; many organizations from international to country scale are working together to assure current human needs and preserve land quality for future generations. The awareness of land management for food production might therefore be a compulsory task for agriculture land use planners, decision makers and farmers. To meet the increase food demand, still the improvement of lands use system to close the yield gap is necessary. Since the 1980s, Rwanda has been unable to meet its domestic food needs from national production. The high slope in upland and population pressure leads to soil erosion which contributes to loss of fertility and yield reduction.. The food deficit has been filled in by commercial imports and to a large extent of food aids. In order to create more self-reliant food balance food production has to be increased per unit area to meet the growing demand of population. One of the strategies to deal with food security is to close the gap between potential and actual yield by reducing yield constraints. According to De Bie (2000) many actual production situation face yields constraints that cause a considerable gap between actual yields and yields possible with improved technology. Actual yield levels are not only influence by land natural resources, but also and often even stronger by, indirectly socio- economic conditions(De Bie, 2000; Rajapakse, 2003; Rugege, 2002). To narrow yield gaps, proper agriculture policy and knowledge on constraints that limit soil productivity are required (Pradhan, 2004). The soil needs to be nurtured to remain productive. Paddy field has a dynamic and complex environment with much interaction of water, soil and rice crop. Different management has contrasting effects on the soil biology, physical and chemical properties which reflect in the yield differences (Pankhurst et al., 2005). Therefore yields gaps occur.
1.1.1. Rice production in Rwanda
The arable land in Rwanda is estimated to reach 1,385,000 ha. Rice is currently grown on approximately 7,455 ha in several regions of Rwanda with the main areas being PRB Cyili/Butare (4,358 ha of cultivable area ), Bugarama (2,984 ha ), Rwamagana (1,343 ha ) and Muvumba 920 ha (Minagri, 2003) . The total cultivated area is expected to increase to approximately 66,000 ha by the year 2016, due to continuing extending of new areas in the marshlands, covering the domestic needs by 2009 and allowing an annual surplus export estimated at US$ 170 million(Fewsnet-Rwanda, 2005).It is hoped that this will greatly contribute to food security in the country. Figure 1-1 shows districts in which rice is currently grown.

THE EFFECT OF LAND FACTORS AND MANAGEMENT PRACTICES ON RICE YIELDS IN CYILI INLAND VALLEY, RWANDA
2
Figure 1-1: Districts growing rice ,Source : (Fewsnet-Rwanda, 2004) Rice is not a traditional food crop of Rwandese farmers. There is no any scientific report concluding that wild rice exists in Rwanda during ancient times. It was introduced in the country in the 1950s (Jagwe and Okoboi, 2003). Since its introduction, rice has been cultivated in irrigated schemes developed from inland valley swamps in different provinces of the country. By 1967, significant progress had been made which resulted in the development of several rice schemes across the country. Since 1980, rice has become a staple food for cities in Rwanda and a source of income for farmers. Due to internal disorder, rice production had greatly suffered during the early year of the 1990s. However, rice production in the country has steadily and rapidly recovered since 1995. In 2003, it is estimated that about 26,736 tonnes of paddy were produced(Jagwe and Okoboi, 2003). In most cases rice is cultivated twice a year with a national average yield of about 4.6 tonnes of paddy /ha/season (Minagri, 2003).
1.1.2. Importance of Rice Crop in Rwanda
According to FEWS NET – Rwanda (2005), rice is one of the crops selected by the government (in the Ministry of Agriculture Policy) as a “priority crop” for promotion due to the following reasons: (i) it is well suited to the many marshlands in Rwanda; (ii) it has a high yield potential; (iii) it is eaten widely, is easy to cook, and is nutritious; (iv) there is a high demand for it on domestic and external markets; (v) it is easy to store and package.
N

THE EFFECT OF LAND FACTORS AND MANAGEMENT PRACTICES ON RICE YIELDS IN CYILI INLAND VALLEY, RWANDA
3
In addition to the reasons cited above for promoting rice production, another major motivation of growing rice is to reduce the amount of foreign currency spent on the imports of rice. In 2001, 5.26 billion Rwandese franc(Rwf) approximately $9 million was spent on rice imports (Minagri, 2003). In 2003, the amount of money spent on rice importation had decreased to Rwf 1.7 billion (Minagri, 2003). This is mainly due to the increase in area cultivated and subsequent increase in domestic rice production from 10,830 MT in 2001 to 18,113 MT in 2003(Jagwe and Okoboi, 2003)
1.1.3. Major constraint to rice production in Rwanda
Adverse climate (droughts, Flooding), poor soil, pest, weeds, inappropriate modern varieties, and lack of suitable modern technologies are the major causes of low productivity .The Ministry of Agriculture in 2003 (Minagri, 2003) has reported that according to managers of several rice schemes, which account for most of the rice production in Rwanda, the limiting constraints to rice production are:
• The important disease in the most rice growing areas is pyricurariosis caused by P.Orizae. It is common in Clyili and attacks the Yuny yine4 variety when grown for more than three consecutives seasons. This disease is able of causing 80% loss in term of yield(Jagwe and Okoboi, 2003)
• Most rice producers countrywise do complain about rice fly “Diopsis Macrophthalma”(figure 1-2) whose larvae eat tillers causing them to dry out . Insecticide such as “Sumithium” is recommended to control this pest(Jagwe and Okoboi, 2003).
Picture 1:Diopsis Macrophalma
• Deterioration and destruction of the drainage and irrigation infrastructure leading to lack of sufficient water for irrigation
• Insufficient of agriculture input (farm manure and Chemical fertilizer) in term of quality and quantity.
• Farmers generally do not have adequate power for land preparation and improved tools to carry out rice farming activities such as land preparation, weed control, water management, harvesting and post harvesting operation.
Rice productivity remains low on farm but the potentiality to increase yield exist (Minagri, 2002).

THE EFFECT OF LAND FACTORS AND MANAGEMENT PRACTICES ON RICE YIELDS IN CYILI INLAND VALLEY, RWANDA
4
1.2. Problem stetement and Objectives
1.2.1. Problem Statement
In actual rice faming system, farmer’s socio economic conditions do not allow intervention against yields constraints to achieve higher yield. The situation is that the actual production is far less than the potential production and can not satisfy the demand.
• Rice consumption has increased tremendously over the past decade in Rwanda. When we analyze the demand and supply of rice from 2001 to 2004, there is in average of 16,823 tons of rice to be supplied from abroad. The table 1-1 shows the summary of local rice production and importation from 2001 to 2004.
Table 1-1: Rice Production in Rwanda
Year Cultivated area (ha) Domestic production (M T) Importation (MT) 2001 4,750 10,820 27,879 2002 5,369 14,148 14,015 2003 6,020 18,114 12,119 2004 - 16,152 13.280
Source: Minagri, 2004
• Even though rice is a staple food in all cities of the country, it remains the major source of income for rice growers. At national level, the trend analysis from the year 1985 – 2002 (figure1-2) shows a high variability of rice yield. This has also been observed at farm level in Gikonko District(Minagri, 2004)
0
1000
2000
3000
4000
5000
6000
7000
8000
1984 1986 1988 1990 1992 1994 1996 1998 2000 2002 2004
Year
Are
a (
Ha
)
0.0
1.0
2.0
3.0
4.0
5.0
6.0
1985 1990 1995 2000 2005
Year
Yie
ld (
T/h
a)
Figure 1-2:Trend of Rice yield in Rwanda, data : source (Jagwe J.N. and Okoboi, 2003)
• Most farmers do not know much about the causes of yield variability (FAO, 2005) • In Cyili Rice Scheme, since 2000, rice yields are increasing (Figure 1-3), but the variability
among farmer’s productivity remained and the production cannot even satisfy the nearest town demand. The yield presented in figure 1-3 was calculated using production data of year 2000 to 2004 provided by the agriculture officer of Cyili irrigation scheme.

THE EFFECT OF LAND FACTORS AND MANAGEMENT PRACTICES ON RICE YIELDS IN CYILI INLAND VALLEY, RWANDA
5
y = 0.46x - 916.79R2 = 0.9719
0.00
1.00
2.00
3.00
4.00
5.00
6.00
2000 2001 2002 2003 2004 2005
Year
Yie
ld (
T/h
a)
Figure 1-3: Recent Yield in the study area (data from Field officer of Cyili, 2005)
• Therefore, it is necessary to identify the factors that are responsible for the rice yield gap,
mainly focusing on management and inherit soil properties aspects in order to improve productivity and close the current gap.
1.2.2. Objective
This study aims to identify lands and management factors that causes yield gaps in rice production and quantify the contribution of the identified constraints to overall rice yield gap in Cyili rice scheme, Gikonko District, Rwanda Specifics objectives The study set out to:
- Identify the location specific , land and management yield constraints of rice in the study area. - Quantify the potential and the actual farm yield in the study area. - Quantify yield gap for each constraint and derive a production model.
1.2.3. Research question
- What land and management factors that affect rice production? - What is the gap caused by each factor in the study area? - What is the potential and actual average on farm yields in the study area?
1.2.4. Hypothesis and assumption
Yield = f (Land, Management) Yield varies in the field due to physical, chemical and biological soil properties. The interactions of the tree components are highly influenced by the level of management such as irrigation rate, application of organic matter, type of fertilizer used and the sequence of field operations (activities done from land preparation to harvesting). In this study, we assume that solar radiation, temperature and rainfall have no impact on the variability of rice yield. Only management practices, static land resources and soil fertility status, water availability for irrigation are considered to influence yield variability.
THE EFFECT OF LAND FACTORS AND MANAGEMENT PRACTICES ON RICE YIELDS IN CYILI INLAND VALLEY, RWANDA
6
1.3. Conceptual Approach
1.3.1 Yield gap analysis through CPA (Comparative Performance Analysis)
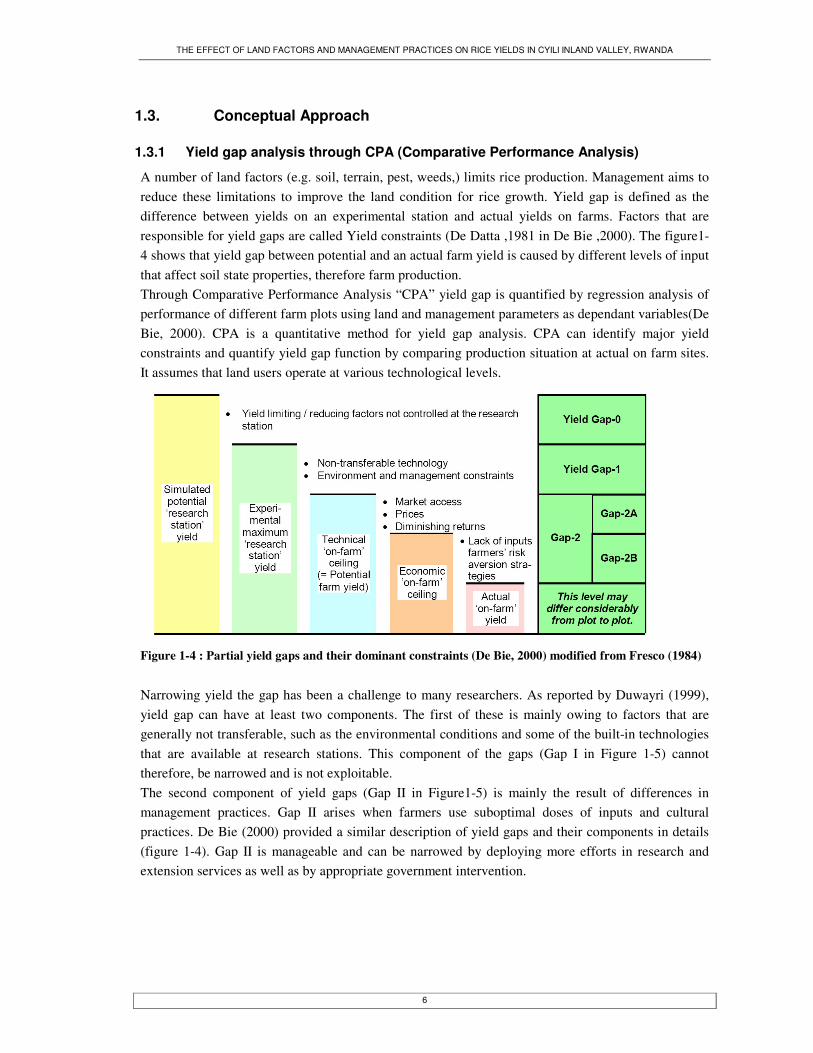
A number of land factors (e.g. soil, terrain, pest, weeds,) limits rice production. Management aims to reduce these limitations to improve the land condition for rice growth. Yield gap is defined as the difference between yields on an experimental station and actual yields on farms. Factors that are responsible for yield gaps are called Yield constraints (De Datta ,1981 in De Bie ,2000). The figure1-4 shows that yield gap between potential and an actual farm yield is caused by different levels of input that affect soil state properties, therefore farm production. Through Comparative Performance Analysis “CPA” yield gap is quantified by regression analysis of performance of different farm plots using land and management parameters as dependant variables(De Bie, 2000). CPA is a quantitative method for yield gap analysis. CPA can identify major yield constraints and quantify yield gap function by comparing production situation at actual on farm sites. It assumes that land users operate at various technological levels.
Figure 1-4 : Partial yield gaps and their dominant constraints (De Bie, 2000) modified from Fresco (1984) Narrowing yield the gap has been a challenge to many researchers. As reported by Duwayri (1999), yield gap can have at least two components. The first of these is mainly owing to factors that are generally not transferable, such as the environmental conditions and some of the built-in technologies that are available at research stations. This component of the gaps (Gap I in Figure 1-5) cannot therefore, be narrowed and is not exploitable. The second component of yield gaps (Gap II in Figure1-5) is mainly the result of differences in management practices. Gap II arises when farmers use suboptimal doses of inputs and cultural practices. De Bie (2000) provided a similar description of yield gaps and their components in details (figure 1-4). Gap II is manageable and can be narrowed by deploying more efforts in research and extension services as well as by appropriate government intervention.

THE EFFECT OF LAND FACTORS AND MANAGEMENT PRACTICES ON RICE YIELDS IN CYILI INLAND VALLEY, RWANDA
7
Figure 1-5: Component of yield gaps (Duwayri et al, 1999 ) adapted from De Datta ( 1981) Quantitative measures of the production capacity of the land that reflect soil and climatic condition are useful indicators of the state of the land resources (Bindraban et al., 2000); the estimation of production expressed as “grain equivalent”, provides as good integrator of soil quality and weather characteristics. This allows comparison of agriculture production under different state conditions and management. It however does not study the underlying causes.
1.3.2 Mobile GIS Tools for Spatial Field data collection
Mobile GPS is a technology for data collection. It integrates three essential components; Global Positioning System (GPS), Handheld Computer and GIS Software. The HP- IPAQ pocket running at 200 MHZ under MS-Windows is able to run Arc- Pad (v.6.3) and to connect to GPS. The pocket PC has backlight- features so that in bright sun the Screen is still perfectly readable(De Bie, 2002). The user can save the GPS – track log (as points in Lat- Long), or use the GPS to prepare shape files (point, line, or polygon feature) in the projection system of loaded maps. The software also allows to prepare forms (questionnaire), and to draw points, lines or polygons directly by hand on the screen. The exact acreage, as well as other dimension such as perimeter length of the field can be calculated by using the resulting coordinates and the software. The iPaq -Arc Pard- GPS combination comprises a compact but complete setup of digital survey equipment that can be employed in the field by car or on foot (De Bie, 2002) Most problem, with the system relate to knowledge on projection systems, the need to prepare *.prj files containing Projection information, and the proper use of datum settings. Once the GPS is connected, the position accuracy on loaded maps will be within 5 m pending on proper GPS reception. This advanced GIS technology can be applied to improve the quality and the efficiency of required geo- spatial information production with special emphasis on agricultural land uses(De Bie, 2002). Hence, the mobile techniques can be used for spatial data collection in agricultural surveys for yield gap analysis studies.

THE EFFECT OF LAND FACTORS AND MANAGEMENT PRACTICES ON RICE YIELDS IN CYILI INLAND VALLEY, RWANDA
8
1.3.3 Estimation of Potential production using PS-1 Model
Production situation “Production situation is a hypothetical land use system, with one or only a few relevant land qualities. Land qualities not considered in the definition of a production situation are assumed not to constrain the performance of the system. Land use is defined by the choice of crop and a fixed set of management”(Driessen and Konijn, 1992) . The production calculated is not the actual production but the potential production. Models of production situation are composed of number of sub models, each matching one-land use requirement against one land quality and translating the outcome of the matching into realized production potential. For this study, the potential production of rice of the study area is estimated based on production situation level 1. Production situation level 1 (PS-1) Production situation PS-1 represents a land use system with the level of dry mass production that a farmer would achieve if all constraints to crop growth can be eliminated. PS-1 quantifies crop performance, within physiological possibility of the crop, as, a function only of land qualities that a farmer cannot modify (i.e., solar radiation and temperature). All other land qualities are assumed to fully satisfy the corresponding land use requirements. This means that moisture availability to crop is optimum, that nutrient are present, in sufficient and balanced amounts and that there are no weeds, pests, diseases or other constraints. The biophysical production potential is determined by the solar radiation and temperature during the growing period and by the physiological characteristics of the crop. It is a crop production under optimum supply of water, nutrients and crop protection(Bindraban et al., 2000; Driessen and Konijn, 1992). Yield estimated using PS-1 can be summarized in the following relation: PS-1: P, Y = f (solar radiation, temperature, crop physiology) P = production Y = yield
1.4 Study area
1.4.1 Location
Rwanda is a small mountainous country of 26,000 km2 located in central Africa between 28o 30’E to 31oE and 1o to 3oS. It shares the border with Uganda in the North, Tanzania in the East, Burundi in the South and Congo in the West. The landscape is dominated by hills ending in low wetland and the altitude varies from 900 m to 4,500 m. The study area (Cyili inland valley) is located in Gikonko district, Butare province in south of Rwanda. It is within Longitude 29o 53' 26.45" and 29o 49’ 29.45" East and latitude 2o 28’ 18.18” and 2o 26’ 42.59” South. The total area of Cyili irrigation scheme is 242 ha.

THE EFFECT OF LAND FACTORS AND MANAGEMENT PRACTICES ON RICE YIELDS IN CYILI INLAND VALLEY, RWANDA
9
Aster Image band 3 2 1(RGB) January 27, 2004
Figure 1-6: Location of Study Area on Aster Image
1.4.2 Landscape
The study area belongs to Mayaga agro-ecological Zone(Verdoodt and van Ranst, 2003). In the north part, the landscape is characterised by hills and valleys that are regularly inundated. The altitude varies between 1350 and 1500 m above the sea level. The landscape of southern part is more abrupt, rough and dominated by quartzite chains. The soilscape is also strongly variable. Rocks outcrops characterise the hilltops, gravel soils are found on upper slopes. Younger soils found on foot slopes and have generally a higher productivity (Verdoodt and van Ranst, 2003).
1.4.3 Weather
Rainfall The study area is characterised by slightly higher annual rainfall, varying between 1100 and 1200 mm. Two rainy seasons alternate with two dry seasons. The first rain season starts from the September and ends in December. This period so-called “season A” corresponds with the first growing season in upland area. The maximum rainfall during the “season A” is generally recorded in November. The second rain season called “season B” starts with February and ends in May with a maximum rainfall recorded in April. The short dry period happens in January while the long one starts with June to end in September. The average monthly rainfall and evapotranspiration from 1979 to 2000 is shown in figure 1-7.

THE EFFECT OF LAND FACTORS AND MANAGEMENT PRACTICES ON RICE YIELDS IN CYILI INLAND VALLEY, RWANDA
10
0
50
100
150
200
250
300
Jan Feb Mar Ap May June July Aug Sep Oct Nov Dec
Month
Rai
nfal
l, E
T et
ET/
2 (m
m)
ET Rainfall ET/2
Figure 1-7: Rainfall, ET and ½ ET (Average data from 1979 to 2000: Rubona Station) Temperature The highest temperatures are recorded during July to September with average maximum temperature of 26 ºC and the minimum temperatures are recorded in June-July with an average of 13 ºC. The figure 1-8 shows the average maximum and minimum temperature for the year (2001- 2004).
0
5
10
15
20
25
30
1 2 3 4 5 6 7 8 9 10 11 12
Month
Tem
pera
ture
(o C
)
T Max
T Min
Figure 1-8: The average monthly Maximum and Minimum temperature (data from Rubona Station) Sunshine duration The daily sunshine variability is estimated to 6 %. The monthly average sunshine (figure 1-9) is 8.5 hours per day with a minimum of 8 and a maximum of 9.5 hours per day. More sunshine hours per day are experienced from June to August with an average of 9.3 hours/day.
Humid period

THE EFFECT OF LAND FACTORS AND MANAGEMENT PRACTICES ON RICE YIELDS IN CYILI INLAND VALLEY, RWANDA
11
Planting Harvesting
7.00
7.50
8.00
8.50
9.00
9.50
10.00
1 2 3 4 5 6 7 8 9 10 11 12
Month
Sun
shin
e du
ratio
n ( h
rs/d
ay)
Figure 1-9: Average Daily sunshine in hours per day per month (data from Rubona Station)
1.4.4 Predominant cropping system
Agriculture is the main activity in the study area. Farmers generally grow rice and a post rice crop in case of lack of water. Legumes (e.g., beans, groundnuts, maize or vegetables) are the most common crop, which can be grown as second crop otherwise farmers fallow. In neighbourhood upland the main crop are beans, sweet potatoes, bananas, maize and sorghum. In Cyili irrigation scheme rice is cultivated twice per year. All farmers crop rice during the season which starts with January and ends in June. During the season which starts with July to December, all farmers cannot grow rice because of shortage of water. In this case, half of the farmers are obliged to grow other crop than rice. The following year during the same season, those farmers who have not planted rice last year will grow rice now. The figure 1-10 shows an example the crop rotation followed by a farmer in the study area from 2002 to 2005. year Jan Feb Mar Apr May Jun Jul Aug Sep Oct Nov Dec
2002
2003
2004
2005
Rice Beans + maize + grounds nuts Figure 1-10: Example of Crop rotation in the study area

THE EFFECT OF LAND FACTORS AND MANAGEMENT PRACTICES ON RICE YIELDS IN CYILI INLAND VALLEY, RWANDA
12
1.4.5 Land tenure
In the study area, land is the most valuable, productive, and contested asset. It is now the key to rural survival, and it is one of the primary resources that will best support future economic growth. Despite efforts to improve land access and rights, land ownership remains a problem in Rwanda. According to (Rurangwa, 2004), Land-related problem include (but are not limited to):
• High population density and a very limited land resource pool, resulting in sub-optimal plot size for those that do hold land as well as an inability to accommodate the needs of the landless or returnees.
• Many conflicting claims to land parcels, which have been created by a series of population displacements and returns over the decades (a result of genocide and civil conflict).
• Tenure insecurity created by ambiguous, uncertain, and often unenforceable land rights. • Uncertain and inequitable women’s access and rights to land. • A lack of institutional and technical capacity to implement and sustain land reforms.
The situation described above applied also in the study area. Farmers are partial owner of the land because all marshlands belong to local government and farmers pay the rent every year. This situation had a negative impact on land management because farmers cannot invest much in their fields if they are not full owners. If a farmer is not able to pay the annual rental fee, his plot is given to another.

THE EFFECT OF LAND FACTORS AND MANAGEMENT PRACTICES ON RICE YIELDS IN CYILI INLAND VALLEY, RWANDA
13
2. Rice cycle and effect of weather to rice
2.1. Introduction to rice crop
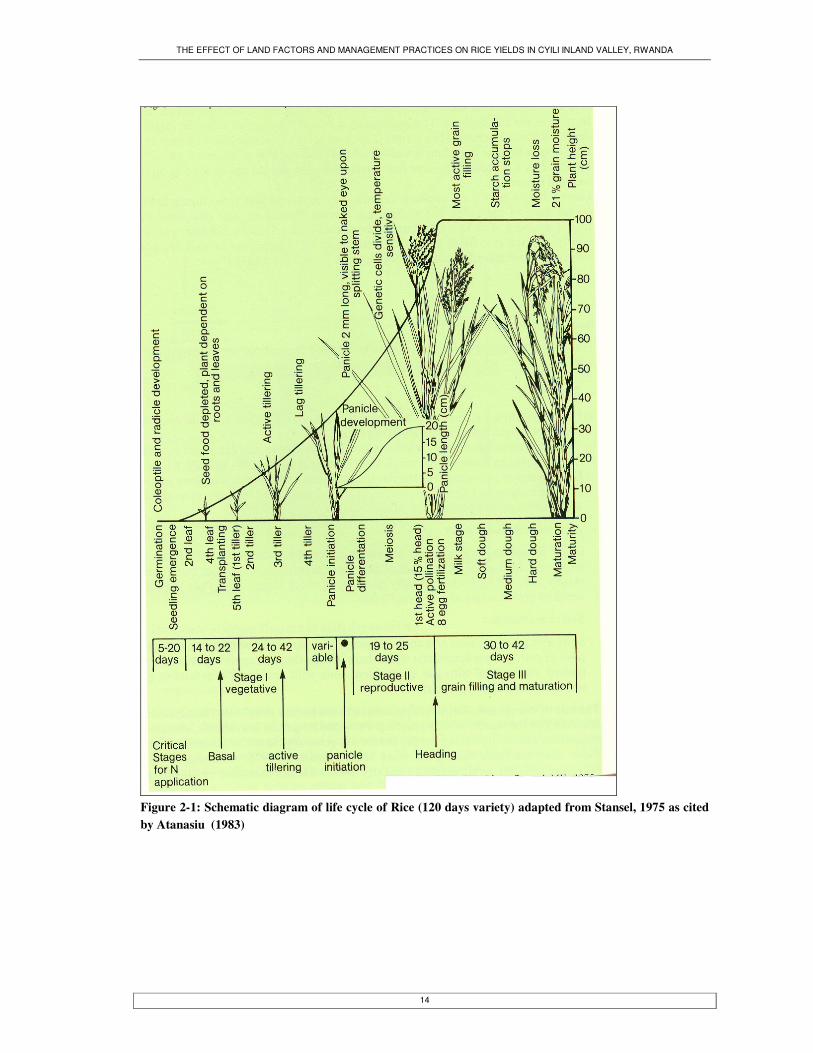
Oryza sativa , the dominant rice species , is believed to have originated in Southern Asia . Rice can be grown in a wide range of weather and physiographic conditions. Today , there are 111 countries in the world producing rice(Choudhury, 2005), these include Asians countries , most countries in West Africa , some counties in central and East Africa , most of central American countries , Australia and a few states in the United states of America . Rice is generally abundant in wet tropical climates but the crop flourishes also in humid regions of the subtropics and in temperate climates such as of Japan, Korea, China, Spain, Portugal, Italy, France, and USA. India and China are the two leading counties in rice production(Choudhury, 2005). The average rice yields in these rice-growing countries range from less than 1 to more than 6 t/ha(FAO, 2003). There are a number of biological, environmental and socioeconomic reasons for these large differences in yields. Low yields are associated with rain fed lowland rice, deepwater rice and poor socioeconomic conditions in the tropics whereas high yields are associated with irrigated rice and good socioeconomic conditions in the temperate region (Choudhury, 2005). The rice plant usually takes 3 to 6 months from germination to maturity. The growth period of rice crop is dependant on variety and the environment under which it is grown. A detailed discussion on the life cycle of rice is based on a 120 day variety (figure 2-1). The life cycle of the crop is divided into three growth stages: vegetative, reproductive and ripening. In the tropics, a 120-day variety spends about 60 days in vegetative stage, 30 days in the reproductive stage, and 30 days in the ripening stage(Atanasiu and J.Samy, 1983).
i) Vegetative stage
According to Choudhury (2005), the vegetative stage is characterized by active tillering, gradual increase in plant height and leaf emergence at regular intervals. All these contribute to increase in leaf area, which receives sunlight for photosynthesis. Initiation of tillering takes place when the main stem develops 5th or 6th leaf. The tiller number increases until it reaches to a stage called active tillering (when the rate of increase in tiller number per unit of time is high) followed by the maximum tillering stage (i.e. tiller number per plant per square meter is maximum). The tiller number declines after the maximum tillering stage, the end of effective tillering
THE EFFECT OF LAND FACTORS AND MANAGEMENT PRACTICES ON RICE YIELDS IN CYILI INLAND VALLEY, RWANDA
14
Figure 2-1: Schematic diagram of life cycle of Rice (120 days variety) adapted from Stansel, 1975 as cited by Atanasiu (1983)

THE EFFECT OF LAND FACTORS AND MANAGEMENT PRACTICES ON RICE YIELDS IN CYILI INLAND VALLEY, RWANDA
15
ii) Reproductive stage Reproductive stage is characterized by rice stem elongation, decline in tiller number, emergence of flag leaf (the last leaf), booting, heading and flowering. Internodes elongation usually begins around the initiation of panicle primordial, and continues till heading. During heading, the top five nodes are elongated and hence, the reproductive stage is also called internodes elongation. A rice crop takes 10- 14 days to complete heading and panicle initiation takes place during heading (heading refers to the time when 50 % of the panicles have emerged). There is variation in panicle formation within tillers of the same plant and between plants in the same field. Flowering begins after heading. In tropical environment, flowering occurs between 8 am and 1 pm. Fertilization is completed within 5-6 hours later(Choudhury, 2005).
iii) Ripening stage
Ripening occurs after fertilization. The Ripening stage is characterized by leaf senescence and grain growth. Grain growth includes increases in grain size, weight and changes in grain color. The ripening stage is subdivided into milky stage (i.e., white rice grain becomes white thick liquid, dough stage i.e, milk liquid in grain becomes thicker) and maturity stage (grain is fully developed, hard and free from green tint). The difference in growth duration of rice crop is mainly due to the differences in the vegetative stage whereas the length of reproductive stage and ripening stage are considered almost the same for every variety under a given environment. Early maturing varieties have a short vegetative period and hence, the panicle primordial takes place before maximum tillering stage. The late maturing varieties, on the other side, have long vegetative periods and the initiation of the panicle primordial takes place after the maximum tiller number stage. Management practices play an important role: a direct seeded plant starts tillering earlier than transplanted one, as the crop growth is setback for a period of about seven days due to damage caused during uprooting of transplanted rice(Choudhury, 2005).
2.2. Effect of climate on rice crop
In additional to management practices, rice yield is influenced by climatic condition factors such as rainfall, solar radiation, temperature, and relative humidity by affecting physiological process involved in grain production. Brief descriptions of the effects by solar radiation and temperature on rice are given below:
i) Solar radiation
Solar radiation increased plays a major role in determining biomass and grain yield. In dry season, solar radiation is usually at optimum level whereas in wet season, solar radiation is critical weather dependent. The solar radiation requirements of rice crop differ from one growth stage to another. Solar radiation at reproductive stage has the greatest effect on grain yield, than at the ripening stage and than at reproductive stage(Malabuyoc et al., 1993). The increase in dry matter between panicle initiation and harvest is highly correlated with solar radiation (Islam and Morison, 1992; Murata,

THE EFFECT OF LAND FACTORS AND MANAGEMENT PRACTICES ON RICE YIELDS IN CYILI INLAND VALLEY, RWANDA
16
1975). This indicated that the amount of solar energy received from as early as panicle initiation until crop maturation is important for the accumulation of dry matter during that period.
ii) Temperature
According to Yoshida (1978) rice crop is greatly influenced by temperature. During growth season the mean temperature and the temperature sum, range, distribution pattern, and diurnal changes are highly correlated with grain yields. The critical low and high temperature (bellow 20 ºC and above 30 ºC) vary from one growth stage to another, and they differ according to variety, duration of critical temperature, diurnal changes and physiological status of the plant. Critical temperature at various growing stage are given in the following table 2-1. Table 2-1: Critical temperatures at various growth stages during the development of rice (Yoshida, 1978)
Critical temperature(ºC) Growth Stages Low High Optimum
Germination 16- 18 45 18-40 Seedling emergence and establishment
12- 15 35 23-30
Rooting 16 35 25-28 Leaf elongation 1-12 45 31 Tillering 9-16 33 25-31 Initiation of panicle primordial 15 30 - Ripening 12-18 >30 20- 30
Certain varieties can tolerate temperatures of 44- 45 ºC. The optimum temperature for rice cultivation varies from 18 to 33 ºC. Lowland rice grown in varying water depths is inevitably affected by water temperature (Yoshida, 1978). Temperature affects grain yield by affecting tillering, spikelet formation and ripening . In the nursery, temperature greatly influences the growth rate just after the germination .Within a temperature range of 22- 31 ºC, the growth rate increases almost linearly with increasing temperature. High temperature increases the rate of emergence and provides more tiller buds. Symptoms caused by low temperatures are poor germination, slow growth, discoloration of seedling, stunted vegetative growth characterized by reduced height and tillering, delayed heading, incomplete panicle development , prolonged flowering period due to irregular heading, degeneration of spikelet, irregular maturity, sterility and abnormal grains. Extreme high temperatures are destructive to plant growth and can cause sterility (Satake, 1978).

THE EFFECT OF LAND FACTORS AND MANAGEMENT PRACTICES ON RICE YIELDS IN CYILI INLAND VALLEY, RWANDA
17
3. Methods and Materials
3.1. Flow chart of research method
Figure 3-1: Flow chart of Research Method
Study area Selection
Land parameters
Regression model
Quantified Yied gap
Descriptive statistics
Management aspects
Topographic map
Farmers Interview and field observation
Data coding ,entry and normalization
Stepwise multiple regression
Discussion of constraints related to yield gap
Prepare questionnaire research sheet
Pretest
Improved Questionnaire RRA
Spatial data Using GPS_Ipac
Aster Image
Sampled plots
Secondary data
- Min temp- Max temp- Rainfall- Sunshine
PS-1
Quantified Potential Yield
Past yield
Sampling method
Sample frame
Data Collection

THE EFFECT OF LAND FACTORS AND MANAGEMENT PRACTICES ON RICE YIELDS IN CYILI INLAND VALLEY, RWANDA
18
3.2. Sampling Methods
A random clustered sampling method was used to obtain land and management data for January to July Season, 2005. Randomisation was done to obtain variability; and clustering was done to increase the number and effectiveness of sampling (Thompson, 1991). Figure 3-2 shows the sampled plots in the study area.
Figure 3-2: Plots Sampled within the study area
Sampled plot

THE EFFECT OF LAND FACTORS AND MANAGEMENT PRACTICES ON RICE YIELDS IN CYILI INLAND VALLEY, RWANDA
19
3.3. Rapid Rural Apprisal (RRA)
Information on farmers’ perceptions of soil fertility and management practices that they use to crop rice was collected through individual semi-structured interviews at field. The interview was focusing on:
- management practices(January to June season , 2005 ) - farmer assessment of soil suitability - particular problems regarding rice production - actual yield
3.4. Data Collection
1. Land management Data collection has taken 5 weeks; it started on 11 September 2005 until 18 October 2005. After reaching the study area, we had 3 days for reconnaissance survey to get an overall idea of the study area and to make appointment with farmers and field officers. Rice plots were selected randomly in the location where farmers were growing rice during the “July - December” season. In general, the area was heterogeneous in terms of land management. During the fieldwork, data from 87 fields were collected. A checklist (Appendix 1) was used to collect data. Through interviews, the primary data on land parameters and management practices such as soil quality, land preparation, transplanting, fertilizer application, weeding, pest and disease controls, water management and actual rice yield were collected. 2. pH and EC The determination of pH and EC was done at field using pH_ EC meter. The pH_EC meter is a instrument which can be used to measure directly in the field the pH, EC, Redox and O2 dissolved in the water (Eijkelkamp, 2005). At each sampled field, a composite of topsoil (0-20 cm) was taken for analysis. Specific electrodes were use to measure pH (soil/ water 1:2.5) and EC (soil /water 1:5). 3. Texture, infiltration rate and soil suitability The “feel method”(Liebens, 2001; Thien, 1979) was used at field to determine the top soil(20 cm) texture. Although the feel method is prone to errors it is widely used and experienced soil scientists achieve results that are comparable to those from lab analyses. To minimize the errors, we used carefully the flowchart proposed by Liebens (2001). The infiltration rate (cm/day) recorded were farmers’ estimates. Farmers were asked “how many days standing water (10 cm depth) will remain on field after irrigation”. The “soil suitability” rating was farmer’s opinion of his paddy soil differentiated in 3 qualitative classes (Low, Medium, and High suitability). 4. Spatial field data A handheld computer and a GPS were used to digitize the boundary of samples plots. The operator walked along the boundary with the GPS–Ipaq system, which recorded the field polygons or lines coordinates. Irrigation canals were taken as lines features, and plots as polygons features. The obtained shape files were downloaded to the main computer for further analysis.

THE EFFECT OF LAND FACTORS AND MANAGEMENT PRACTICES ON RICE YIELDS IN CYILI INLAND VALLEY, RWANDA
20
Picture 2 : GPS& Ipac; Field_ interview and pH/EC meter 5. Secondary data Collection Rice yields of past years were collected from the Ministry of Agriculture and recent yield (from 2001 to 2004) were collected from the field officer in charge of the study area. Rainfall, temperature, sunshine hour were collected at Rubona weather station.
3.5. Comparative Performance Analysis(CPA)
Comparative Performance Analysis (CPA) method was used to identify yield constraints and their contribution to yield gap. CPA is quantitative method for yield gap analysis (De Bie, 2000). It aims at identifying major yield constraints and quantifying yield gaps related. CPA compares production situation at on farm sites. It assumes that land users operate at various management levels, i.e from indigenous and improved technologies. For successful CPA, the study must focus on particular land use class and the land use systems surveyed must reflect the entire prevailing range of environment condition and all type of level of technology practiced. CPA consider environmental conditions and management aspects as they occur in a specific study area (De Bie, 2000).
3.6. PS-1 : Production Situation level 1
PS-1 was used to calculate the potential rice yield of the study area. The data used to run the model are daily maximum temperature, daily minimum temperature, and daily number of sunshine-hour(Driessen and Konijn, 1992). The data from January to November 2005 were collected at Rubona weather station. The average data of December 2002, 2003 and 2004 were used to generate data of December 2005. For crop data, generic rice data (table 3-1) were used. The seeding rate of 40 kg/ha, seed mortality = 0 have been used and transplanting date set at 1st January 2005. Table 3-1: Crop indicatives values
Crop Rice Photosynthetic mechanism C3 SLA ( Specific leaf area , m2kg -1) 14-21 To ( threshold temperature of development , oC) 11 Tsum ( heat requirement for full development, oC) 1500 ke ( the extinction coefficient for visible light) 0.4 Tleaf ( heat sum for full development of leaf tissue ) 500

THE EFFECT OF LAND FACTORS AND MANAGEMENT PRACTICES ON RICE YIELDS IN CYILI INLAND VALLEY, RWANDA
21
3.7. Data entry and normalisation
Data entry and Normalisation was done using MS-Excel. Data were coded and a codebook was prepared as reference during data analysis (Appendix 2) .Variables and their related values were defined in the codebook. Coded tables were prepared in the Excel sheet. Units of measurement were standardized into standard measurement units. Nominal data were transformed into ratio data by normalisation to facilitate statistics analysis and data visualisation. ; The Table 3-1 shows an example of data normalisation. Nominal data were transformed into rational data containing only “0” or “1” (no, yes), so that they can be used for regression analysis. Table 3-2 : Example of data Normalization Raw data Normalized data Sample ID
Soil fertility class
Yield Kg/ha
Sample ID
Low Medium High Yield Kg/ha
1 Low 500 1 1 0 0 500 2 low 600 2 1 0 0 600 3 High 1200 3 0 0 1 1200
3.8. Descriptive Statistics
Descriptive Statistics including Turkey’s test were generated to screen which land and management parameters are significantly related with rice productivity. SPSS 12.01 software was used for this purpose. The statistical relationships were displayed as box plots and scatter plots.
3.9. Multiple linear regression
The response of the production function, Yield = F (land, management) is: Y = b0 +b1X1 +b2X2+b3X3+……bnXn Where Y in the rice yield (Kg/ha) explained by the land and management practices X1, X2, X3, Xn ; and b0, b1, b2, …bn are regression coefficients. Stepwise multiple linear regression method was used to model yield. Final regression equation was derived through researcher controlled trial and error approach to quantify the impact of yield constraints on yield.

THE EFFECT OF LAND FACTORS AND MANAGEMENT PRACTICES ON RICE YIELDS IN CYILI INLAND VALLEY, RWANDA
22
4. Results
4.1. Rice potential production estimation
The potential production of rice in the study area was estimated using PS-1. The result in figure 4-1 shows the increasing of storage organ weight from transplanting planting (day 1) to harvesting (day 172). At the harvesting day, rice potential yield was estimated to 13129 kg/ha. This result appears not to be realistic and over estimated. The results from “ISAR” research institute has reported an average of 8.2 T/ha grain yield in Cyili irrigation scheme(ISAR, 2003). The estimated yield with PS-1 shows that the temperature and solar radiation in Cyili are in the optimum condition to grow rice. The temperature range of the study area was 13 to 26 degree (figure 1-9) and sunshine hour average monthly ranging from 8 to 9.5 per day (figure 1-10). FAO publication suggests that the optimum temperature range is between 20- 35 oC(Chaudhary et al., 2003), while Yoshida (1978) proposed the range from 18 to 33 oC . Black (1973) cited by Drieseen (1992) reported that in the range of 15 to 25 oC, C-3 crops reach their maximum rate of assimilation.
Figure 4-1: Estimation of Rice potential production
1
1 January, planting 21st June, harvesting

THE EFFECT OF LAND FACTORS AND MANAGEMENT PRACTICES ON RICE YIELDS IN CYILI INLAND VALLEY, RWANDA
23
4.2. Descriptive statistics
The total sample size (N) number for this study was 87. Yield were recorded in different local units and converted into kg/ha. After normalization of all categorical data, all land and management practices data were subjected to descriptive statistics.
4.2.1. Yields
The distribution of yield data is shown in figure 4-2. The 87 Yield data obtained were subjected to descriptive statistics to test for normality to fulfil the assumption of regression analysis that dependable variable should be normal distributed(Moore and McCabe, 1998). There is sufficient statistical reasons to state that data are normal distributed. The P-value for Kolmogorov- Smirnov 2-tail test using as average 3832 kg and as standard deviation1490 kg/ha had a non - significant probability that data the follow a non-normal distribution (P= 43.8%); this there is not enough evidence to suggest that the data are not normally distributed. Transformation of the yield data was therefore not required.
2000 4000 6000 8000
yield
0
5
10
15
20
25
30
Freq
uenc
y
Mean = 3832.25Std. Dev. = 1490.485N = 87
0 2,000 4,000 6,000 8,000 10,000
Observed Value
-4
-2
0
2
4E
xpec
ted
Nor
mal
Normal Q-Q Plot of yield
Figure 4-2 : Left: Distribution of yield data and fitted normal distribution curve; Right: Normality test for yield data
4.2.2. Land characteristics
Soil texture
C CL SC SCL SiC SiCL SiL
Soil texture
2000
4000
6000
8000
Yie
ld (k
a/ha
)
62
63
4982
Figure 4-3 : Soil Texture versus Yield
Soil texture yield (kg/ha) countC 2248 8CL 3596 37SC 2712 5SCL 3987 7SiC 2429 4SiCL 5155 25SiL 2257 1

THE EFFECT OF LAND FACTORS AND MANAGEMENT PRACTICES ON RICE YIELDS IN CYILI INLAND VALLEY, RWANDA
24
Looking to the Count, the texture class “Clay Loam (CL)” and “Silty Clay Loam (SiCL)” were dominants soil texture. The figure 4-3 shows the relationship for different soil texture and yield. It is clearly that the yield data are significantly related to the soil topsoil texture (ANOVA analysis: P = 0.000). The average yield was high for plots with soil texture “Silty clay loam” (5155 kg/ha). These plots were also characterized by farmers as having high fertility, receiving enough water and were easy to plough. Soil suitability classification and soil local name
L M H
sc
2000
4000
6000
8000
yiel
d (k
g/ha
)
4982
16
A C
L M H
soil suitability Class
0.0
5.0
10.0
15.0
20.0
Infi
ltra
tio
n r
ate
(cm
/day
)
45
87
33
44
IK URY URH
sn
2000
4000
6000
8000
Yie
ld (k
g/ha
)
4982
16
B Figure 4-4: Soil suitability Classification and soil local name versus yield Farmers classified their fields in 3 suitability class following the hierarchy Low, Medium and High suitability. The mean yield between the 3 classes were significant different (ANOVA analysis: P = 0.000). Farmers (29x) who classified their soil as high suitable had significantly better yield (+ 1753 kg/ha) than the medium class (Figure 4-4 A). The ANOVA analysis (P= 0.000) of yield data related to soil local name given by farmers was significant (figure: 4-4 B). The cross table of soil suitability class and soil local name shows the reliability of farmer’s assessment (figure 4-4 D). 29 fields were classified as high suitability and were assigned the same local name “IK= IKIDOBORI”. 31 plots out of 33 were having medium suitability class were named “URY = URUBUMBA RUREKUYE” and 23 plots out of 25 of low suitability class were given the mane “URH = URUBUMBA RUREKUYE”. This classification is also related to soil infiltration rate. Plot with high suitability had low infiltration rate and plot with low fertility had high infiltration rate (Figure 4-4 C).
IK URH URYL 0 2 23 25M 0 31 2 33H 29 0 0 29
29 33 25 87Total count
soil local name Total count
soil suitability class
D

THE EFFECT OF LAND FACTORS AND MANAGEMENT PRACTICES ON RICE YIELDS IN CYILI INLAND VALLEY, RWANDA
25
Soil texture versus soil suitability class Table 4-1: Cross tabulation of soil suitability and soil texture
Soil suitability class were also related to top soil texture. The texture Silty clay Loam (SiCL) is classified as high suitability (23 X) and the soil texture Clay Loam (CL) as moderate suitability (29X). The low suitability is found on Clay(C) soil texture (8X). These results are confirmed with the
yield presented in the figure 4-3. Soil pH
0100020003000400050006000700080009000
5.8 6 6.2 6.4 6.6 6.8 7
Soil pH
Yiel
d (
Kg
/ha)
Figure 4-5: Soil pH versus yield Soil electrical Conductivity
150 200 250 300 350
Soil Electrical Conductivity
2000
4000
6000
8000
Yiel
d (k
g/ha
)
Figure 4-6: Soil Electrical conductivity
The soil pH in the study area ranges from 5.9 to 6.9. This range is suitable for rice, which has the optimum pH requirement of 6.6(Moorman and Nico Van Breemen, 1978). Within this ranges of pH soil is slightly- acid to near-neutral environment and nutrients are most readily available for uptake by roots (IRRI, 1978). The figure 4-5 shows that there no linear relation between the observed soil pH and yield data (simple regression analysis: P = 0.80, R2 = 0.00).
In the study area, the soil electrical conductivity is low (0.15 to 0.35 mS/cm). Such value has no harmful effect to rice .The figure 4-6 shows that the effect of EC on yield was not significant (ANOVA: P = 0.18). The optimum EC value for rice is below 3 mS/cm (Moorman and Nico Van Breemen, 1978).
C CL SC SCL SiC SiCL SiL
H 2 4 23 29M 29 2 1 1 33L 8 6 5 1 3 1 1 25
8 37 5 7 4 25 1 87
SSC
Total
Soil suitability Class * Top soil texture crosstabulation
Count
STEX
Total
(µS/cm)

THE EFFECT OF LAND FACTORS AND MANAGEMENT PRACTICES ON RICE YIELDS IN CYILI INLAND VALLEY, RWANDA
26
Infiltration rate
0
2000
4000
6000
8000
10000
0.0 5.0 10.0 15.0 20.0 25.0
Infiltration rate Cm/day
Yie
ld(
Kg
/ha)
Figure 4-7: Infiltration rate “IR” (Cm/day) Field’s problem assessment by farmers versus yield
NP CW CWF
Problem assessment (farmer opinion)
2000
4000
6000
8000
Yie
ld (k
g/ha
)
16
Figure 4-8 : Farmer’s field problem assessment The farmer’s assessment of problems related to low yield shows that (29 x) farmers don’t have problem and were getting high yield (5476 kg/ha in average). These farmers were getting enough water, and their field were more fertile than others. Compare to farmers who have problems of water shortage which affect the soil to become too compact when it dries up; the average yield was around 2819 (kg/ha).
4.2.3. Operation sequence
The rice-growing season in the study area, begin with December up to July of the following year. Most of farmers were starting to prepare land at the end of November 2004 and the first two weeks of December 2004. All operations carried out from land preparation to harvesting are summarized in the figure 4-9.
Problem assessment (Farmer view )
Average yield( Kg/ha)
Count
NP = No problem 5476 29 CW = Compact when dry & Lack of water
2819 41
CWF = Compact when dry, Lack of water & Lack of fertilizer
2531 10
As the infiltration rate increase, the yield trends to decrease. The simple regression analysis shows that the infiltration rate has a negative significant impact on yield (P = 0.000, R2 = 29.8 %) Yield (kg/ha) = 14 *IR2 + 4458*IR + 5837

THE EFFECT OF LAND FACTORS AND MANAGEMENT PRACTICES ON RICE YIELDS IN CYILI INLAND VALLEY, RWANDA
27
Figure 4-9: Management practices in time scale (from land preparation to harvesting)
The figure 4-9 shows the timing management for each activity of surveyed farmers. Note that there is a variability of the starting day for each operation. Variety grown
Facagro 56 Tox 4331
Variety
2000
4000
6000
8000
Yie
ld (k
g/ha
)
82
849
Figure 4-10: Variety grown versus Yield Land preparation Land preparation is the first activity of growing rice. A good land preparation provides a suitable terrain for crop establishment. All farmers in the study area were ploughing two times. They start with shallow land preparation ploughing followed by a deep ploughing. All activities related to land preparation were done by hand hoeing and none of farmers applied puddling before planting. The fallowing-grazing is not allowed in the Cyili rice scheme. Crop residues of the past crop were burned or incorporated. More than half of farmers burned crop residues (48x) and some of them
Within the study area, two rice varieties are used: “Facagro-56” and “Tox 4331”. According to farmers, Tox 4331 is a drought resistant variety than “Facagro-56. The effect of varieties on yield was not significant (ANOVA: p = 0.79) However, Farmer preferred “facagro-56” variety because of its high price on the market. 52 farmers out of 87 were cropping “Facagro-56” variety.
Shallow land preparation
Deep Land Preparation
Leveling
Planting
1 st Weeding
NPK Application
2 nd Weeding
Urea Application
3 rd Weeding
4 th Weeding
Harverting
Ope
ratio
n se
quen
ce
300 350 400 450 500 550
Julian day
14
721
758
708
752
779
783
238

THE EFFECT OF LAND FACTORS AND MANAGEMENT PRACTICES ON RICE YIELDS IN CYILI INLAND VALLEY, RWANDA
28
incorporated in the soil (39x). The following figure 4-11 shows the relation of crop residues management and yield. Crop Residues Management
No burning Not complet burning
Complet burning
Crop Residues Burning
2000
4000
6000
8000
Yie
ld (k
g/ha
) 37
4982
Figure 4-11: Crop residues management versus yield Shallow land preparation
-80 -70 -60 -50 -40 -30 -20 -10
Shallow Hoeing (Days before transplating )
2000
4000
6000
8000
Yie
ld k
g/ha
Figure 4-12: Land preparation management versus yield
Shallow land preparation starts from the second week of November to the third week of December. The simple regression analysis shows a positive significant effect of time of shallow land preparation on yield (t-test, P = 0.04, R2 = 4.6%).
The figure 4-11 shows the relationship between crop residue management and yield. It is clearly that there is no significant effect of burning or not burning crop residues on the yield (ANOVA: P= 0.12) Crop residues management
Average yield (kg/ha)
Count
No burning 3447 39 Not complete burning
4018 10
Complete burning 4152 38

THE EFFECT OF LAND FACTORS AND MANAGEMENT PRACTICES ON RICE YIELDS IN CYILI INLAND VALLEY, RWANDA
29
Deep land preparation
-50 -40 -30 -20 -10 0
Deep Hoieng (days before transplanting)
2000
4000
6000
8000Y
ield
(Kg/
ha)
Figure 4-13: Deep Hoeing versus Yield Age of seedlings at transplantation
0
2000
4000
6000
8000
10000
20 25 30 35 40 45 50 55 60
Age of Seedling at transplantation(days)
Yie
ld (
kg/h
a)
Figure 4-14: Age of seedling versus yield Date of transplanting
0
2000
4000
6000
8000
10000
0 10 20 30 40 50 60
Date of Transplanting (Days After 26 Dec )
Yie
ld (
Kg
/ha
)
Figure 4-15: Date of transplanting versus yield In the study area, the humid period stats at mi- February to mi- May (figure1-8) while the transplanting of rice starts at 26 December 2004 to 15 February 2005(figure 4-15). This shows that the transplanting was done before the normal humid period. Farmers are obliged to share the limited water available.
All farmers were practicing transplantation method. The seedling’s age vary between 27 to 55 days .The figure 4-14 shows that there is no linear relationship between age of seedling at transplanting time and yield. The simple regression analysis gives a no significant effect on yield (P = 0.19 , R2 = 0.02). Note that most of farmers use seedlings which have 28 to 35 days old.
Transplanting starts with the last week of December up to the end of the second week of February. Most farmers transplant during the two first weeks of January. The date of transplanting (26 Dec is taken as the reference) has a weak negative relationship with yield. The regression analysis shows a no significant effect of date of transplanting to yield (P = 0.08, R2= 3.4 %).
The figure 4-13 shows that there is no strong linear relation between timing of deep land preparation and yield. However, there was a positive significant effect of timing of deep hoeing to yield ( F-test, P= 0.03, R2 = 5.2%). Yield increased of 33 kg/ha for each day deep hoeing done closer to planting day.

THE EFFECT OF LAND FACTORS AND MANAGEMENT PRACTICES ON RICE YIELDS IN CYILI INLAND VALLEY, RWANDA
30
Number of plant per hill
3 4 5 6
Number of plant per hill
2000
4000
6000
8000Y
ield
(Kg/
ha)
Figure 4-16: Number of plant/hill versus Yield Table 4-2: Number of plant per hill versus age seedling (count)
3 4 5 618-35 27 13 15 136-40 4 3 7 041-51 8 7 2 0Total Count 39 23 24 1
Number plant per hillAge of seeds (days )
Table 4-3 : Number plant per hill versus date of transplanting (count)
3 4 5 626 Dec 04 - 4 jan 05 18 7 11 16 Jan 05 - 15 Jan 04 14 8 11 016 Jan 05 - 15 feb 05 7 8 1 0Total Count 39 23 24 1
Date of transplanting Number plant per hill
Transplanting rates was 3 to 6 plants per hill. The figure 1-16 shows that as the number of plant per hill increases, yields decrease. The effect of number of plant per hill on yield was significant (ANOVA: F-test, P= 0.000, R2 = 16.2 %).
The table 4-2 shows that many farmers used 3 plants/hill (27 x) in the range of 18- 35 days old. Farmers who plant late are likely using many plants per hill (4 to 5) and old (more than 36 days old). Probably they take chance to use the whole remaining plants. The date of transplanting versus number of plant per hill shows the same trend (table 4-3). Farmers who transplant early (18 X) are using less number of plants per hill. Only one farmer was planting early and was transplanting 6 plants per hill

THE EFFECT OF LAND FACTORS AND MANAGEMENT PRACTICES ON RICE YIELDS IN CYILI INLAND VALLEY, RWANDA
31
Fertilization Application Farmers do not applied farm manure .Only, chemical fertilizer such as Urea and NPK (17-17-17) were used in the study area. NPK application
0100020003000400050006000700080009000
0 20 40 60 80 100
Applied Nitrogen kg /ha
Yiel
d (
kg/h
a)
Figure 4-17: Applied Nitrogen versus Yield Soil moisture condition during NPK application
wet half wet dry
Soil condition during NPK application
2000
4000
6000
8000
Yie
ld(k
g/h
a)
31
80
49
Figure 4-18 : Soil condition during NPK application versus Yield Table 4-4: NPK- management practices (Correlation coefficient between variables)
Among the survey plots (87), fertilizer management was different in term of quantity of NPK applied, soil condition during NPK fertilizer application, time taken by farmers to incorporate NKP after the application and the application date of NPK. Most of variables are not or weakly correlated between them (table 4-4).
The figure 4-18 shows 3 classes of soil condition during NPK application (wet, half wet, dry). Soil condition had a significant effect to yield (ANOVA: F-test, P = 0.000).
Farmers used NPK (17 17 17) fertilizer as source of nitrogen. The total amount of nitrogen applied varied from 0 to 80 kg/ha (figure 4-17). The regression analysis shows that the applied nitrogen had a weak positive linear relation to yield and a non-significant effect to yield (t-test, P = 0.08, R2 = 3.2%).
npk_ha t_inc N_wet N_semwet N_dry t_npkr
Applied NPK/ha (npk_ha ), 1 Time to incorporate NPK ( t_inc) -0.238 1 NPK Applied in wet condition (N_wet) -0.039 -0.039 _NPK Applied in semi- wet condition (N_semwet) 0.185 -0.464 _ _NPK Applied in dry condition (N_dry) -0.098 0.375 _ _ _Day of application of NPK count from planting day (t_npkr)
0.178 0.080 -0.129 0.073 0.058 1

THE EFFECT OF LAND FACTORS AND MANAGEMENT PRACTICES ON RICE YIELDS IN CYILI INLAND VALLEY, RWANDA
32
Time before incorporation NPK
3 4 5 6 7 8
Days before incorporation of NPK (days)
2000
4000
6000
8000Y
ield
(kg/
ha)
R Sq Linear = 0.246
Figure: 4-19 Time before incorporation NPK versus Yield Farmers have a habit to incorporate fertilizer three days or more after application .The figure 4-19 shows that as the number of days before incorporation increase, yields decrease. The time before incorporation NPK had negative significant effect on yield (ANOVA: F- test, P= 0.000, R2= 24.6 %). Urea application
0100020003000400050006000700080009000
0 50 100 150
Top dressing Nitrogen( Kg/ha)
Yie
ld (
kg/h
a)
Figure 4-20: Applied Urea versus Yield
10 20 30 40 50 60
Timing of Urea Application (days from transplanting)
2000
4000
6000
8000
Yie
ld(k
g/ha
)
Figure 4-21 : Time of Application Urea versus Yield
Days count Mean yield kg/ha
3 10 5,300 4 25 4,349 5 23 3,640 6 12 3,335 7 15 2,864 8 2 2,485 Total 87 3,832
Farmers used Urea (46 0 0) fertilizer for the top dressing nitrogen application. The amount of Nitrogen applied vary from 0 to 120 kg/ha. It does not have a significant effect to yield. Simple regression analysis (t -test, P = 0.09, R2 = 3.2%).
The timing of application of urea varies from 18 to 60 days (count from transplanting day). The regression analysis shows no relation between with yield and timing of Urea application and had a non- significant effect to rice yield (F -test, P= 49, R2 = 0.0)

THE EFFECT OF LAND FACTORS AND MANAGEMENT PRACTICES ON RICE YIELDS IN CYILI INLAND VALLEY, RWANDA
33
Time before incorporation of Urea
4 5 6 7 8
Time to incorporate urea (days)
2000
4000
6000
8000
Yie
ld (k
g/ha
)
Figure 4-22: Time before Urea incorporation versus yield
Picture 3: Urea applied (4 days before incorporation) The regression analysis shows a no significant effect of time to incorporate urea fertilizer on yield (ANOVA: F- test, P= 0.16). The incorporation of Urea was done late, farmers take 4 to 8 days to incorporate Urea , probably the whole nitrogen was volatilized at that time reason why Urea application don’t have an effect to rice yield. High nitrogen fertilizer efficiency response was reported in West Africa when urea was applied in one deep placement during land preparation or at planting and was found also when half of urea was applied as basal dressing and incorporated into soil directly and other half was top-dressed five days before panicle initiation(Windmeijer , 1993). Soil condition during Urea application
wet half wet dry
Soil condition during Urea application
2000
4000
6000
8000
Yie
ld (k
g/ha
)
15
5
4982
16
6462
Figure 4-23: Soil condition during Urea application versus Yield
Days count Mean Yield (kg/ha)
4 2 3,158 5 31 3,573 6 27 3,920 7 26 4,122 8 1 3,333 Total 87 3,832
The figure 4-23 shows the relation between soil humidity condition during urea application and yield. Soil humidity condition during urea application had a significant effect to yield (ANOVA: F- test, P= 0.000).
The small white grains are urea particles

THE EFFECT OF LAND FACTORS AND MANAGEMENT PRACTICES ON RICE YIELDS IN CYILI INLAND VALLEY, RWANDA
34
Pest and disease Control Most common diseases and pests reported by farmers are pyrichyrariosis, Green plant-hopper and Diopsis. Stem borer is also reported at small scale. Even if there no serious damage, 39 farmers out of 87 who have applied pesticides to control disease have higher yield than those who do not applied pesticides. The common pesticide used is ‘Sumicombi.
0 1
Desease Control
2000
4000
6000
8000
Yie
ld (k
g/ha
)
16
38
4982
Figure 4-24: Disease control versus yield Rat control
0 1
Rat control
2000
4000
6000
8000
Yie
ld (k
g/ha
)
84982
Rice dead heart The presence of Diopsis ssp was higher in field. The larvae of these flies feed inside the stem and damage the vascular system resulting in dead heart disease (IRRI, 2003). The incidence of rice dead-heart in relation to yield is shown in the following figure 4-25.
Disease Control Count
Mean Yield kg /ha
No = 0 48 3,009 Yes = 1 39 4,844 Total 87 3,832
The ANOVA analysis show that, the disease control has a significant impact on yield (ANOVA: F -test, P = 0.000)
The ANOVA analysis shows a no significant effect of rat control to yield (ANONA: P = 0.37). Most of farmers do not face the rat problem. Only 3 out of 87 farmers have reported rat problem.

THE EFFECT OF LAND FACTORS AND MANAGEMENT PRACTICES ON RICE YIELDS IN CYILI INLAND VALLEY, RWANDA
35
0 5 10 15 20 25 30
Rice Deadhearts (%)
2000
4000
6000
8000
Yie
ld (K
g/ha
)
Figure 4-25: Incidence of rice dead heart disease versus yield Other Suspect disease Tungro disease
0.0 10.0 20.0 30.0 40.0 50.0
Incidence of Tungro disease
2000
4000
6000
8000
Yie
ld (k
g/ha
)
Figure 4-26: Tungro Disease Occurrence versus yield
The negative effect of tungro disease to yield is quite clear (Figure 4-26 A). The regression analysis shows a significant effect of occurrence of Tungro disease to rice yield (P = 0.000, R2 = 68 %). Tungro incidence was also related to soil suitability (ANOVA: F -test, P = 0.000). High suitable soils have low incidence of tungro and low suitable soil has high incidence of tungro (Figure 4-26 B). Green Leafhopper
no yes
Presence of Green Leafhopper
2000
4000
6000
8000
Yie
ld (k
g/ha
)
65
Figure 4-27: Presence of green leaf hopper versus Yields
Dead heart disease has had a negative significant impact to rice yield as shown by the simple regression analysis (P = 0.000, R2 = 38 %)
During the survey, green leafhoppers were present in many fields (69X); only 18 fields were safe. The ANOVA analysis shows a significant effect of presence of Green Leafhopper to yield (F-test, P= 0.000).
Low Moderate High
Soil suitability Class
0.0
10.0
20.0
30.0
40.0
50.0
Insi
denc
e of
Tun
gro
dise
ase
(%)
85
4479
7812
57
55
A B

THE EFFECT OF LAND FACTORS AND MANAGEMENT PRACTICES ON RICE YIELDS IN CYILI INLAND VALLEY, RWANDA
36
Table 4-5: Cross tabulation between presence of Green leafhopper and Tungro disease (count)
No yes0 18 2 20
10 0 6 615 0 7 720 0 9 925 0 13 1330 0 28 2835 0 1 140 0 2 250 0 1 1
18 69 87Total
Presence of Green- leafhopper
TotalIncidence of Tungro
(%)
Guarding bird All farmers were guarding birth from May to June. Yield loss due to bird was not quantified but according to the appreciation of farmers, it seems not to be serious problem. Water Management Water availability ranking and soil suitability classification
1 2 3 4 5
Water availability ranking (war)
2000
4000
6000
8000
Yie
ld (k
g/ha
)
L M H
Soil suitability classification
1
2
3
4
5
Wat
er
ava
ilab
ility
ra
nki
ng
Figure 4-28: Water availability ranking versus Yield & Soil suitability versus water availability ranking The availability of water depends to the location of the field. Fields which are located far from the main irrigation canal was receiving less water. The ANOVA analysis shows a significant effect of water availability to yield (F- test, P= 0.000, R2= 50.1%). The suitability classification was also related to water availability. Field classified as “high suitable’ were getting easily water (figure 4-28). Example of plot’s location and water availability is shown in the figure 4-29. The ranking class 4 and 5 in figure 4-28 were merged in the water ranking availability map and classified as “Difficult”.
Green leafhopper known as the vector of tungo disease were absent in the field without tungro disease, and present at different degree in field where we found tungro disease (Table 4-5).

THE EFFECT OF LAND FACTORS AND MANAGEMENT PRACTICES ON RICE YIELDS IN CYILI INLAND VALLEY, RWANDA
37
Figure 4-29: Water ranking availability map (very easy =1, to difficult =4&5) Weeding operation Weeds diversity
>6ssp 4- 5 ssp 1-3ssp
Weed diversity
2000
4000
6000
8000
Yiel
d (k
g/ha
)
16
43
82
Figure 4-30: Weeds diversity and yields
The difference of yield between plots with more weeds diversity and plots with less weeds diversity was significant (ANOVA, F-test, P= 0.00).Yield was high in plots with less number weed species and low in plots with high number weeds species .
Water flow
3 m
Drainage canal

THE EFFECT OF LAND FACTORS AND MANAGEMENT PRACTICES ON RICE YIELDS IN CYILI INLAND VALLEY, RWANDA
38
Number of weeding
2 3 4
Number of weeding
2000
4000
6000
8000
Yie
ld (
kg
/ha)
Figure 4-31: Number of Weeding versus Yield Presence of Cyperacea ssp
no yes
Presence of Cyperacea
2000
4000
6000
8000
Yiel
d kg
/ha
31
16
82
Figure 4-32 : Presence of cyperacea ssp versus Yield Table 4-6: Relation between weeds diversity and presence of Cyperacea ssp
In general, hydrological condition in lowland rice fields favour the growth and reproduction of aquatic and semi aquatic weeds like cyperacea ssp. Most of grasses species can not survived in the standing water while cyperacea ssp can. More weeds species were observed where there is less water available and therefore less cyperacea ssp because the hydrological conditions are not favourable for cyperacea growth (table 4-6). Date of Weeding (Days after transplanting) versus yield The simple regression analysis showed that the date of first Weeding (p= 0.69), second weeding (p= 0.89), third weeding (p= 0.21) or forth weeding (p= 0.11) had a non-significant effect to yield. Thus, the timing of weeding can not explain yield variability (figure 4-33). However, yield varies
All farmers weed at least two times. The figure 4-31 shows the relationship between number of weeding and yield. The number of weeding had a positive significant effect to yield (ANOVA: P = 0.000). The average yield related to number of weeding is shown in the table below:
Number of weeding Count
Mean yield kg/ha
2 21 2,461 3 31 3,539 4 35 4,914
Total 87 3,832
Yield was higher in the plot where Cyperacea ssp weed was founded and low in the absence of cyperacea ssp. The average yield was respectively 4647 kg/ha and 3200 kg/ha. The ANOVA analysis shows that the difference of average yield was significant (ANOVA: P= 0.000).
Presence of Cyperacea 1-3 ssp 4-5 ssp >6 ssp Total
0 21 28 4929 4 5 38
Total 29 25 33 87
Weeds diversity
NoYes

THE EFFECT OF LAND FACTORS AND MANAGEMENT PRACTICES ON RICE YIELDS IN CYILI INLAND VALLEY, RWANDA
39
significantly with the increasing of number of weeding (figure 4-31). The average yield obtained for two, three, four weeding were respectively 2461 kg/ha, 2539 kg/ha and 4919 kg/ha.
6 8 10 12 14 16 18 20First Weeding (No of days after
transplanting )
2000
4000
6000
8000
Yie
ld (k
g/ha
)
15 20 25 30 35 40
Second weeding (No of days after transplanting )
2000
4000
6000
8000
Yie
ld (k
g/ha
)
30 35 40 45 50 55 60
Third weeding (no days after transplaning)
2000
3000
4000
5000
6000
7000
8000
9000
Yile
d (k
g/ha
)
50 60 70 80
Fourth weeding (no of days after transplanting )
2000
3000
4000
5000
6000
7000
8000
9000
yiel
d kg
/ha
Figure 4-33: Weeding dates versus Yield (from First to Fourth Weeding) Presence of Azola
None Rare Frequent Abundant
Occurence of Azola
2000
4000
6000
8000
Yie
ld(k
g/ha
)
31
49
Figure 4-34: Presence of Azola versus Yield
The figure 4-34 shows the relationship between the presence of Azola and yield. Yield increase with increasing quantity of azola ssp. The average yield were respectively 3039; 4595; 4869; 4818 kg/ha for none, rare, frequent and abundant occurrence of azola ssp. The ANOVA analysis shows that the quantity of azola ssp had a significant effect to yield (P= 0.000). However, yield reduced when the Azola became abundant (figure 4-34).

THE EFFECT OF LAND FACTORS AND MANAGEMENT PRACTICES ON RICE YIELDS IN CYILI INLAND VALLEY, RWANDA
40
Number of weeding versus soil suitability
L M H
Soil suitability class
2
3
4N
umbe
r of
wee
ding
86
85
63
Figure 4-35: Relation between soil suitability class and number of weeding. Date of harvesting
150 160 170 180
Harvesting date (days after planting)
2000
4000
6000
8000
Yie
ld(k
g/ha
)
Figure 4-36: Date of harvesting versus yield
4.3. Summary of Descriptive statistics.
Through the process of descriptive statistics, 36 parameters were tested individually. It was found that 14 independents parameters had a significant impact to yield, these are:
• Soil texture • Soil suitability class • Soil infiltration rate • Number of seedling per hill • Methods of Urea and NPK application • Disease and pest control • Tungro incidence, • Rice dead heart disease • Water availability • Time before incorporation of NPK • Presence of Azola ssp in the field • Presence of Cyperacea ssp in the field
2 3 4Low 17 7 1 25
Moderate 4 22 7 33High 0 2 27 29
21 31 35 87
Soil suitabilty Class
Total
Count Nunber of weeding
Total
The figure 4-36 shows relation between soil suitability and number of weeding. Framers having suitable soils are weeding 4 times (29 X).It appears that they are taking care to their field than those farmers having low suitable soil (25 X) and moderate suitable soil (33 X).
The date of harvesting varies from 2 June to 25 July. The regression analysis showed that the date of harvesting had a no significant effect to yield (R2 = 0.01, P= 0.147)

THE EFFECT OF LAND FACTORS AND MANAGEMENT PRACTICES ON RICE YIELDS IN CYILI INLAND VALLEY, RWANDA
41
• Number of weeding • Weed diversity
From these 14 parameters, only 11 parameters have been used for multiple linear regressions. The selection of these parameters was based on the correlation between variables. The remaining parameters used in multiple regressions were:
• Soil suitability with 3 class ( Low, Medium and High) as a proxy indicators of parameters soil texture , infiltration rate, presence of azola , presence of cyperacea, weed diversity)
• Incidence of tungro disease (%) as a proxy of disease and pest management • Water availability as a proxy of water management. • Method of fertilizer application which was related to the soil condition (wet, semi wet or dry)
during the application of Urea and NPK. • Number of weeding as a proxy of weeds management. • Number of plant per hill
The significance value of parameters used in the multiple regressions is shown in appendix 4.
4.4. Multiples linear Regression
A stepwise multiple regressions was done to derive a model to identify land and management parameters that affect rice yield variability in the study area. The land and management practices that had a significant impact on yield as shown in descriptive statistics were used for stepwise multiple regression analysis.
4.4.1. Production Model
Out of 11 significant parameters, the estimated model included only two independents variables that significantly explained 75 % (Adj. R2 = 75 %, P= 0.000) of the total yield variability (Table 4-7). Table 4-7: Summary of final regression model causes Rice Yield variability in Cyili (Jan- July season, 2005)
R2 = 75.6 %
Adj.R2 = 75 %
SE = 492
3565
Predictors Coefficient R² when entered (%)
P- value
Insidence of Tungro Disease (%) -61 69.5 0.000
Soil suitability Class 701 72.1 0.000
Statistics Analysis = Multiple linear regression
Dependant variable = Yield of Rice
N= 87Method = Stepwise forwardConstant
The equation of the model is:
Where: PTUD = Incidence of tungro disease SSUIT = Soil suitability Class
SUITTUD SPhaKgYield *701*613565)/( +−=

THE EFFECT OF LAND FACTORS AND MANAGEMENT PRACTICES ON RICE YIELDS IN CYILI INLAND VALLEY, RWANDA
42
The stepwise multiple regression analysis suggests the following deduction: • The incidence of tungro disease becomes the main constraint factor to rice yield in the study
area. • The fact that water availability, soil texture, infiltration rate and number of weeding did not
appear in the final regression equation was caused by their correlation with soil suitability parameter.
• Disease and pest control (rice dead heart, green leafhopper, Diopsis) was also correlated with Tungro disease incidence.
4.4.2. Yield gap by yield constraints
The table 4-8 shows the estimated yield gaps (kg/ha) and the contribution of each yield constraint to the overall yield gap. Using the production function and parameter statistic, “ average” and “ best” values were derived for each explanatory parameter (De Bie, 2000). The estimated of the respective contribution are based on comparisons of the average yield level with the best yield value obtained from surveyed plots (87 samples). The difference in yield multiplied by the coefficient suggested by the model indicates the contribution to overall yield gap for each particular variable. Table 4-8: Quantified of rice yield gap in Cyili rice scheme by yield constraint (kg/ha; January to July Season, 2005)
The average estimated yield by the model is 3813 kg/ha and the best yield estimated is 5668 kg/ha. The total estimated yield gap of 1855 kg/ha appears to be caused by the following biophysical yield- constraint (Figure 4-37): Incidence of tungro disease (64.1%) and Soil suitability for rice (35.9 %). Note that soil suitability was a proxy indicator of infiltration rate, soil texture and water availability.
0
1000
2000
3000
4000
5000
6000
Yie
ld (k
g/ha
)
If soil suitability isconsidered High (35.9%)
Incidence of TungroDisease(64.1 %)
Average Actual Y ield :3832 kg/ha
Figure 4-37: Yield constraints to rice in CYILI (January to July season, 2005)
Min Max Mean best Mean Best
Constant 3565 1 1 3565 3565
Incidence of Tungro disease (%) -61 0 50 19.5 0 -1189 0 1189 64.1soil suitability 701 1 3 2.05 3 1437 2103 666 35.9
3813 56683832 8750
Independents variables Coefficient Measured values Measured values Partial yield gap
Yield gap (%)
Estimated yields ( kg/ha )
1855Actual Yield (Kg/ha)Estimated Yield gap (Kg/Ha)

THE EFFECT OF LAND FACTORS AND MANAGEMENT PRACTICES ON RICE YIELDS IN CYILI INLAND VALLEY, RWANDA
43
y = 0.7528x + 950.68R2 = 0.7559
0
2000
4000
6000
8000
10000
0 2000 4000 6000 8000 10000
Observed Yield (kg/ha)
Est
imat
ed Y
ield
(kg
/ha)
Figure 4-38: Relation between Observed and predicted yield values.
The figure 4-38 shows the relation between the actual and estimated yield with correlation coefficient (R= 0.86, significant at 0.01, P= 0.000). It shows that the production model can be used to predict with a standard error of 635 kg/ha the actual yield in the Cyili rice scheme.

THE EFFECT OF LAND FACTORS AND MANAGEMENT PRACTICES ON RICE YIELDS IN CYILI INLAND VALLEY, RWANDA
44
5. Discussion
5.1. Yield gap
The analysis of land and management parameters indicates two biophysical land factors that significantly affect rice yield in the study area. These are the incidence of tungro disease and soil suitability for rice. The average yield gap was 1855 kg/ha (Table 4-7) due to above factors. Most of farmers are not aware that they could increase yield by improvement of management practices. However all farmer are aware of the fertility of plot based on specific land properties of the plot like soil texture and infiltration rate which has an impact to the overall soil suitability. The timing of land preparation was not included in the final regression analysis. However it shows a negative impact on yield when it is done late. IRRI has reported many advantages of a good land preparation. For example, a good land levelling improves water management, which improves: weed suppression and control, crop establishment, nutrient use efficiency, crop uniformity and maturation, drainage and yields(IRRI, 2004). The FAO Expert Consultation on yield gap and productivity decline in rice production indicated that the yield gap “the gap between average farmer yields and the yields of the best farmers or those obtained in research plots” was approximately 46 percent in Asia (FAO, 2002) . Inappropriate crop management usually causes this gap; it is manageable and can be narrowed by enhancing research and extension services. The same results were found in Spain where the actual minimum and maximum rice yield was from 4 to 11 t/ha(Casanova et al., 2002). The raison for such discrepancies was the unbalanced between land characteristics and farming systems. The fact remains that there is at a certain extent untapped potential for increasing yields.
5.1.1. Incidence of Tungro disease
Pest and disease has always a negative impact to crop yield. In the study area, the major diseases are stem rot or dead-heat caused by Diopsis macrophthalma, Tungro disease and Pyrichyrariosis. The regression analysis shows that tungro disease affect negatively rice yield (figure 4-26), and the gap due to tungro was estimated at 64.1 % by the model (table 4-7). This is more assumed true because there were a huge difference in yield between fields with a high incidence of tungro and safe fields. In addition, we found that fields with a huge number of green leafhopper, vector of the Tungro disease, were having low yield compare to safe fields (figure 4-27). Apart from transmitting the virus, Green Leafhoppers are also destructive insects; they directly damage rice by sucking the plant sap (IRRI, 2003). When greater number of these pests attack the plant and suck the sap, the plats may dry up. It has been reported in Philippines that Green leaf hopper (Nephotettix impieties) is the vector of tungro disease and slightly reduced rice tillering (Holt et al., 1996; IRRI, 1970). It can attack crop from tillering stage , stem elongation to booting. The disease can reduce yield to 100% if plants are infected by tungro virus at early crop growing stage(IRRI, 2002; IRRI, 2003). Measures to prevent

THE EFFECT OF LAND FACTORS AND MANAGEMENT PRACTICES ON RICE YIELDS IN CYILI INLAND VALLEY, RWANDA
45
plant-to-plant spread of the disease within a crop are relatively difficult. Early warning of the risk of tungro infection, however, would allow preventive measures to be taken such as the adjustment of planting times or the targeted deployment of resistant varieties(Holt et al., 1996). Other authors proposed an integrated management based on crop rotation, delay planting, application of insecticides and resistant varieties(Sama et al., 1991).
5.1.2. Land and management levels as represented by soil suitability parameter
According to farmer’s classification, soil suitability was related to infiltration rate, facility to supply water and soil texture. High water holding capacity of soil implied water availability to plants. This study shows that field classified as having low suitability are characterised by: problem of water supply, high infiltration rate and in many cases are far from the main irrigation canal and had low yield. The model explains that 35.9 % of yield gap is linked to soil suitability which is a proxy combination of top soil texture, infiltration rate, and water availability taken as index that includes location specific within the irrigation network (Figure4-29). Direct relation between suitability status and yield is not easy to define because “suitability” has an interaction of many biophysical properties. Improved management practices are believed to enhance soil suitability. High yield of rice is obtained by making nutrient increasingly available through improved soil management practices (Patnaik, 1978). Patnaik (1978) observed also that the overall field fertility leading to high yield is linked to full nutrient use by optimum planting density , rice variety with greater ability to absorb native nutrients and good cultural practices like land preparation , time of planting , water management and weed control.
5.1.3. Method of fertiliser application
In the study area, the application of fertilizer (NPK and Urea) was done differently. Some farmers applied fertilizer when the field’s surface area was dry while others applied fertilizer when the soil was in wet or semi-wet condition. The top dressing NPK (17 17 17) application had a positive significant effect on rice grain yield when NPK (17 17 17) was applied in semi wet condition. Similarly results have been reported by (Casanova et al., 1999) who related a greater rice yield. response to nitrogen application under well drained rather than under poorly drained condition. However, the effect of soil drainage to the efficient use of mineral fertilizer is still controversial; De Datta (1970) reported that wherever top dressing of Nitrogen is necessary, temporary drainage for nitrogen top dressing offers no advantage in terms of grain yield. More research is necessary to investigate the relation between level of water during fertilizer application and rice yield in the study area; therefore determine the best way of mineral fertilizer application.
5.1.4. Water availability
Rice as a semi aquatic crop required much water to perform well; therefore the variable “water availability” is very important. Lack of water during the growing season reduce drastically yield. The average yield increased with increasing water availability (figure 4-28). Because of inter-correlation between “water availability” and soil suitability, it was not possible to highlight the effect of water availability to rice yield in multiple linear regression analysis. The fact is that a single factor cannot

THE EFFECT OF LAND FACTORS AND MANAGEMENT PRACTICES ON RICE YIELDS IN CYILI INLAND VALLEY, RWANDA
46
explain alone rice performance yield. To achieve better yield, all biophysical factors should be at optimum.
• Good irrigation only pays when high yields are aimed with required management practices • Improved varieties cannot perform better without appropriate irrigation and fertilizer use
efficiency.
5.2. Limitation of the model
The production model which explained significantly 75 % of yield constraints seems to be good. On the other hand, the limitation stays because the model could only explain two land and management parameters that significantly affect rice yield in the study area. This information should be used with caution. The selected limiting or influencing factors does not exclude that other plant constraints are also closely related to yield. Survey data on actual on farm management are generally less reliable than trial data. However, their cost is far less and data sets are more comprehensive.

THE EFFECT OF LAND FACTORS AND MANAGEMENT PRACTICES ON RICE YIELDS IN CYILI INLAND VALLEY, RWANDA
47
6. Conclusion and Recommendation
The yield gaps study on rice in Cyili irrigation scheme during January to July season 2005 identified two major biophysical constraints. The production model explains 73 % of the yield variability with an average yield gap of 1895 kg/ha. The impact of each identified constraints on yield was the incidence of tungro disease (64.1%) and soil suitability (35.9 %). Tungro disease is the major constraints which reduced yield in the study area. Farmers are not aware of this disease because it is new disease occurred two years ago. By regularly spraying insecticides to eliminate the vectors of the Tungro disease, and planting resistant varieties against tungro disease, farmer can achieve better yield. Among the cultural management practices, adjusting the date of planting is recommended. Similarly, harrowing the field to destroy virus host after harvesting are also advisable. Soil suitability was related to many parameters which causes yield variability such as water availability, soil texture and infiltration rate. The improved water management and fertilizer application method can contribute to reduce yield gap. The frequency of weeding was not in the final model due to correlation with soil suitability and occurrence of tungro disease but has a clear positive impact to yield individually. Varieties grown, planting date, land preparation aspects had no evident impact to rice yield. This study on yield gaps in Cyili irrigation scheme revealed that water management and disease controls are relevant for improving rice yield. Therefore to narrow yield gap of rice in the study area, the following recommendations are made:
• Research need to focus more on varieties resistant to tungro disease • Extension officers and researchers may use the finding of this study to focus more on
specific problems as identified by the present study. • Farmer should be aware that the closing of yield gap is possible and can be achieved
only if management practices are improved simultaneously. • Application of fertilizer did not show significant impact to yield. Further research is
necessary to proof the reliability of this information in the study area • Yield gap study based on biophysical parameters only has its merits but it could be
better to included in the model socio economic parameter such as credits facilities and prices at harvesting.

THE EFFECT OF LAND FACTORS AND MANAGEMENT PRACTICES ON RICE YIELDS IN CYILI INLAND VALLEY, RWANDA
48
References
Atanasiu N. , and J.Samy. 1983. Rice Effective USe of Fertilisers, Zurich, Switzerland.
Bindraban, P.S., J.J. Stoorvogel, D.M. Jansen, J. Vlaming, and J.J.R. Groot. 2000. Land quality indicators for sustainable land management: proposed method for yield gap and soil nutrient balance. Agriculture, Ecosystems & Environment 81:103-112.
Casanova, D., J. Goudriaan, J. Bouma, and G.F. Epema. 1999. Yield gap analysis in relation to soil properties in direct-seeded flooded rice. Geoderma 91:191-216.
Casanova, D., J. Goudriaan, M.M.C. Forner, and J.C.M. Withagen. 2002. Rice yield prediction from yield components and limiting factors. European Journal of Agronomy 17:41-61.
Chaudhary, R.C., J.S. Nanda, and D.V. Tran. 2003. Guide d'identification des contraintes de terrain à la culture du riz :
FAO , Departement of Agricuture , Rome , Italy [Online] http://www.fao.org/documents/show_cdr.asp?url_file=/docrep/006/y2778f/y2778f04.htm (verified 25 january 2006).
Choudhury, I. 2005. Enveronmental Status Evaluation of Agroecosystem of South 24 Paraganas Districtcs, West Bengal Using Remote Sensing and GIS Techniques, Nadia, West Bengal, India.
De Bie, K. 2000. Comparative Performance Analysis of Agro-Ecosystem, ITC, Enschede, The Netherlands.
De Bie, K. 2002. Novel Approachs to use RS- products for Mapping and Studying Agricultural Land Use Systems. Paper presented at SPRS 2002TC-VII: Commition VII, working Group VII, On Sustainable Agriculture :International Symposium on Ressource and Environmental Monitoring: 3-6 December 2002, Hyderabad.
Driessen, P.M., and N.T. Konijn. 1992. Land - use systems analysis, Wageningen, Netherlands.
Eijkelkamp. 2005. Instrument for Analysis in the Field [Online] http://www.surechem.com.my/download/eijkelkamp/P2/P2-73e.pdf (verified 25 jully).
FAO. 2002. The Development and Use of Integrated Crop Management for Rice Production [Online] http://www.fao.org/DOCREP/MEETING/004/AC346E/AC346E00.HTM.
FAO. 2003. Global rice production scenario :Sustainable rice production for food security Proceedings of the 20th Session of the International Rice Commission . Bangkok, Thailand, 23-26 July 2002 [Online] http://www.fao.org/documents/show_cdr.asp?url_file=/DOCREP/006/Y4751E/y4751e00.htm (verified 16 January 2006).
FAO. 2005. Support to the programme on intensification of Production for food security
Rwanda, Rome, Italy.
Fewsnet-Rwanda. 2004. Rwanda Food Security Updade [Online]. Available by http://www.fews.net/centers/files/Rwanda_200409en.pdf (verified 5 December).
Fewsnet-Rwanda. 2005. Favorable food security outlook [Online]. Available by http://www.fews.net/centers/innerSections.aspx?f=rw&m=1001618&pageID=monthliesDoc.

THE EFFECT OF LAND FACTORS AND MANAGEMENT PRACTICES ON RICE YIELDS IN CYILI INLAND VALLEY, RWANDA
49
Holt, J., T.C.B. Chancellor, D.R. Reynolds, and E.R. Tiongco. 1996. Risk assessment for rice planthopper and tungro disease outbreaks. Crop Protection 15:359-368.
IRRI. 1970. Rice Production Manuel.
IRRI. 1978. Soils and Rice, Los Banos , Philippines.
IRRI. 2002. Standard Evauation System for Rice (SES).
IRRI. 2003. Rice Doctor [Online] http://www.knowledgebank.irri.org/riceDoctor_MX/default.htm.
IRRI. 2004. Rice Knowledge Bank , TropRice [Online] http://www.knowledgebank.irri.org/defaultToGrow.htm (verified 30 December 2005).
ISAR. 2003. Actes d'atelier de formation sur les techniques de production et deconservations des semences de riz et de gestion des périmetres irrigués., Rubona-Butare, Rwanda.
Islam, M.S., and J.I.L. Morison. 1992. Influence of solar radiation and temperature on irrigated rice grain yield in Bangladesh. Field Crops Research 30:13-28.
Jagwe J.N. , and G. Okoboi. 2003. Marketing Survey of the Rice sub- sector in Rwanda.
(ISAR, CIAT, USAID), Kigali, Rwanda.
Liebens, J. 2001. Laboratory manual : GEO 3260: Geography of soils
University of West Florida [Online] http://uwf.edu/environmental/facultystaff/liebens/Manual_lab.doc (verified 16 August 2005).
Malabuyoc, J.A., J.G. Real, and S.K. De Datta. 1993. Grain yield as a function of rainfall, soil moisture and solar radiation in upland rice (Oryza sativa L.). Field Crops Research 34:37-45.
Minagri. 2003. Rapport de l'Enquete Agricole 2003. Unpublished, Kigali.
Minagri. 2004. Natonal Rice Programme, Kigali , Rwanda.
Moore, D.S., and G.P. McCabe. 1998. Introduction to the practice of statistics. Third edition ed. Freeman, New York.
Moorman, F.R., and Nico Van Breemen. 1978. Rice: Soil, Water, Land, IRRI - Los Banos, laguna, Philippines.
Murata, Y. 1975. Estimation and simulation of rice yield from climatic factors. Agricultural Meteorology 15:117-131.
Pankhurst, C.E., G.R. Stirling, R.C. Magarey, B.L. Blair, J.A. Holt, M.J. Bell, and A.L. Garside. 2005. Quantification of the effects of rotation breaks on soil biological properties and their impact on yield decline in sugarcane. Soil Biology and Biochemistry 37:1121-1130.
Patnaik.S. 1978. Natural Sources of Nutrients in Rice Soils .in :Rice &Soil, IRRI, Los Banos, Laguna , Phillipines.
Pradhan, R. 2004. The effect of land and management aspects on maize yield/ (case study in limpopo valley , Mozambique), MSc Thesis , ITC, Enschede.
Rajapakse. 2003. Biophysical Factors Defining Rice yield gaps /(A case study in NiZamabad District , India, Usind Object oriented Image analysis for field detection ), MSc Thesis , ITC, Enschede, The Nederlands.
Rugege, D. 2002. Regional analysis of maize - based land use systems for early warning applications, Wageningen University, Wageningen.
Rurangwa, E. 2004. Land Administration Developments in Rwanda [Online] http://www.fig.net/commission7/nairobi_2004/papers/ts_06_1_rurangwa.pdf.
Sama, S., A. Hasanuddin, I. Manwan, R.C. Cabunagan, and H. Hibino. 1991. Integrated management of rice tungro disease in South Sulawesi, Indonesia. Crop Protection 10:34-40.

THE EFFECT OF LAND FACTORS AND MANAGEMENT PRACTICES ON RICE YIELDS IN CYILI INLAND VALLEY, RWANDA
50
Satake, S.C., Yoshida,S. 1978. High Temperature - induced sterility in indica rices at flowering . Japanese Journal Crop Science 47:6-17.
Thien, A. 1979. A Flow diagram for teaching textutre by - feel analysis. Journal of Agrononic Education, 1979, vol.8,pp 54-55.
Thompson, S.K. 1991. Adaptive cluster sampling : designs with primary and secondary units. In: Biometrics, 47(1991)September, pp. 1103-1115.
Verdoodt, A., and E. van Ranst. 2003. Land evaluation for agricultural production in the tropics : a large-scale land suitability classification for Rwanda Ghent University, Laboratory of Soil Science, Ghent.
Windmeijer.P.N. , W.A. 1993. Inland Valleys in West Africa : An Agro-Ecological Characterization of Rice - Growing Environement , ILRI, Wageningen, The Netherlands.
Yoshida, S. 1978. Tropical climate and its infuence on rice.IRRI Reaserch paper . Series 20:25.

THE EFFECT OF LAND FACTORS AND MANAGEMENT PRACTICES ON RICE YIELDS IN CYILI INLAND VALLEY, RWANDA
51
Appendix
Appendix 1: Check list of land use survey 1. LOCALITY
• Map water control area (GPS-lines of bunds) – or make a nice sketch map • Put points in fields with numbers indicating water availability status; by ranking (1=best,
5=worst) • Assess the ranking for specific plots by cost-price (equal area basis)
2. QUESTIONNAIRE PART Then, by locality, for 5-10 plots // GENERAL
• Farmer’s Name Date Sample no. • Coordinates (UTM, WGS84) X (m) Y (m) • Polygon (iPaq) Name (dxsx) Field Size (m-sq) • How long been cultivating this plot? • What happened to rice yield over time? Why changes in yield?
3. SOIL • Local soil name How does it compare to other soils? Why different? • G/M/P for rice Soil problems … compact when dry/ too sandy/…
4. CROP CALENDAR
Jan- Jun 2003
Jul-Dec 2003
Jan- June 2004
Jul-Dec 2004
Jan- June 20005
Jul-Dec 2005
Crop-1 - Planting - Harvest. Crop-2 - Planting - Harvest.
5. RICE MANAGEMENT (Jan-Jun 2005; after harvesting last crop; “what next” Q’s)
1. Treatment crop residues when, how, how well, … 2. Fallow grazing when, duration 3. Shallow hand cultivation when 4. Deep (15cm) hand cultivation when 5. Puddling (?) when, how 6. Leveling by hand when, how 7. Manure application when, how incorporated, what, how much 8. Basal NPK dressing when, what, how much, incorporated & when?, level of
H2O

THE EFFECT OF LAND FACTORS AND MANAGEMENT PRACTICES ON RICE YIELDS IN CYILI INLAND VALLEY, RWANDA
52
9. Transplanting when, variety, age & quality, pl/hill, cm between/within rows
10. Gap filling when, how much (%) 11. Top dressing (0-3x) when, what, how much, incorporated & when?, level of
H2O 12. Hand weeding (0-4x) when, how often 13. Removing of sick plants when, why, how much 14. Spraying (diseases) when, why, what, how much, how 15. Spraying (pests) when, why, what, how much, how 16. Other Pest control (rats) when, how 17. Guarding against birds when, duration 18. Harvesting by hand when, how much 19. N.E.S. …, …
6. PROBLEMS ASSESSMENT • How much yield expected…why so low? … H2O shortage/sick
plants/pests/diseases/rats/birds/ No manure / no NPK’s/ soil problems (specify)/…
• Why the difference….more reasons?
• By “stated” reason: How much yield loss (farmer’s estimate) // check “difference” 7. WATER SHORTAGE
• When 10 cm H2O in field, how many days to infiltrate (drainage closed) • In general, period(s) of water shortage, by calendar dates • Then, period(s) of water shortage, by crop stage
Transplanting Tillering Panicle init Flowering Grain filling Maturing Period-dates Shortage Y/N
8. RELEVEE SHEET PART
• Crop Appearance • Plant spacing (ruler) • Possible deficiency/disease symptom …Tungro/Nitrogen/ Phosphate/… • Status of weeds (none, rare, frequent, abundant, dominant) • Diversity of weeds (1 spp, 2-5 spp., > 5 ssp.) • Abundance of cyperaceae (none, rare, frequent, abundant, dominant) • Status of Azolla (none, rare, frequent, abundant) • Soil texture topsoil (chart class) • Soil visual grouping (dry topsoil) based on colour, texture, smell, feeling, expertise, … • pH by instrument • EC by instrument • Coarse sand at water inlet / facing hill (none / little/ lots ) • Record of pictures taken • Any Q’s to me about this plot?

THE EFFECT OF LAND FACTORS AND MANAGEMENT PRACTICES ON RICE YIELDS IN CYILI INLAND VALLEY, RWANDA
53
Appendix: 2 Code Sheet
Code variables data type unit values comments
FN Farmer Name label naSD Sampling Date date naID Sample Label label na Combination of SD and sample no.of the dayFS Field Size m2 num m2Loc_N Locality name nominal na Ka=Kana
Mu=MukundoM1=Musambi1 M2=Musambi2 Ny=NyiramageniRu=Rugwa Rw=Rwasanzu
POT Plot Ownership Time num na
SN Soil Local Name (farmer name) nominal na IK = Ikidobori farmer ClassificationURH = Urubumba RufasheURY = Urubumba Rurekuye
SFC Soil Fertility Class for rice (farmer opinion ) nominal na L = Low farmer ClassificationM = MediumH = High
LF Low Fertility num na if "LF" then 1 , else 0MF Medium Fertility num na if "MF" then 1 , else 0HF High Fertility num na if "HF "then 1 , else 0
OXRED Oxydation / Reduction( Presence of rust & gray color) num na 1 = yes Field observation0 = no
STEX Soil Texture nominal SC = Sandy ClaySCL= Sandy Clay LoamSiL = Silty Loam SiC = silty ClaySiCL = Silty Clay LoanCL = Clay LoamC= Clay
CL Clay Loam num na if 'CL' then 1 , otherwise 0 SiCL Silty Clay Loam num na if 'SiCL' then 1 , otherwise 0
TINF Time to Infiltrate 10 cm of water num days Farmer Assessment INFR Infilitration Rate num cm/daySpH soil PH numSEC Soil Electrical Conductivity num (�s)/cmSP Soil problem nominal na C = Compact when dry
W = Water shortageF = Lack of Mineral FertilizerCW= C+WCF = C+FNP = No Problem
SP_C Soil problem C num na if 'C' then 1 , otherwise 0 SP_W soil problem W num na if 'W' then 1 , otherwise 0 SP_F Soil problem F num na if 'F' then 1 , otherwise 0 NP No Problem num na if 'NP' then 1 , otherwise 0
FG Fallowing Grazing nominal na no= no fallowing grazing CRB Crop Residues Burning nominal na FB= Full burning
NCB = Not Complete urning NB = no burning
FB Fully Burning num na if 'FB' then 1 , otherwise 0 NCB Not Complete Burning num na if 'NCB' then 1 , otherwise 0
NB No Burning num na if 'NB' then 1 , otherwise 0 SHLPD Shallow Land Preparation Date date naSHLPr Ref.shallow land preparation date number na SHLPD in days after 1 Nov 2004DLPD Deep Land preparation date date naDLPDr Ref.Deep Land preparation date number na DLPD in days after 1 Dec 2004Pu Puddling num na 0 = No puddling LevD Levelig Date date naLevDr Ref Leveling date nummer na
Soil and its parameter
General Information
Land Preparation

THE EFFECT OF LAND FACTORS AND MANAGEMENT PRACTICES ON RICE YIELDS IN CYILI INLAND VALLEY, RWANDA
54
Code variables data type unit values commentsPlanting and its parameters NuD Nuserly planting date date naAgeN Age of nuserly before transplanting num daysAgeS Age of seeds at planting date num daysPD Planting Date date na 26-Dec Referance planting date PDr Number of days after 26 Dec 2004 reference date num naPU Power used for Planting nominal na H = hand SQ Quality of Seed nominal na G = GoodP_H Numner of Plant /Hill num na 3 to 6 Dis1 Distance between Rows num cmDis2 Distance Within Rows num cmGF Gap Filing after Planting nominal na 0 = No gap filling Var Variety used during Planting nominal 0= Facagro 56 From University of Burundi
1=ToX 4331 From ITTA NigeriaWeeding oparation WD1 First Weeding Date date naWD1r Ref First Weeding Date num naWD2 Second Weeding Date date naWD2r Ref Second Weeding Date num naWD3 Third Weeding Date date na nv = no valueWD3r Ref Third Weeding Date num na 999 = no value WD4 Fourth Weeding date date na nv= no valueWD4r Ref Fourth Weeding date num na 999 = no value NW Number of Weeding num na 2 to 4Fertilisation and Desease control MA Manure Application num kgB_NPK Basal NPK Application num kgT_NPK Top Dressing NPK Application Date date na nv = no valueT_NPKr Ref Dressing NPK Application Date num naA_NPK Applied NPK per plot num kgNPK-ha Applied NPK per ha num kg/haT_INC Time Before Incorpation NPK num dayLev_W Field condittion during NPK application num na 1= Wet
2= Half Wet 3 =Dry
N_wet Appied NPK in Wet soil condition num na if 'N_wet' then 1 , otherwise 0 N_1/2wet Appied NPK in semi Wet soil condition num na if 'N_1/2 wet' then 1 , otherwise 0
N_dry Appied NKP in Dry soil condition num na if ' N-Dry' then 1 , otherwise 0 T_Urea Top Dressing Urea Application Date date naT_Urear Ref Dressing NPK Application Date num naA_Urea Applied Urea per plot num kgUrea - ha Applied Urea per ha num kg/ ha T_INC_U Time Before Incorpation Urea num dayLev_W_U Field condition during Urea application non na 1= Wet
2= Half Wet 3 =Dry
U_wet Appied Urea in wet soil condition num na if 'N_wet' then 1 , otherwise 0 U_1/2wet Appied Urea in semi - wet soil condition num na if 'N_1/2 wet' then 1 , otherwise 0 U_Dry Appied Urea in dry soil condition num na if ' N-Dry' then 1 , otherwise 0 DCAPP Desease Control applied nom na 1= yes Sumicombi applied
0= no disease control RatC Rat Control num na 1= yes
0 = noGarB Time of Guarding Bird num month

THE EFFECT OF LAND FACTORS AND MANAGEMENT PRACTICES ON RICE YIELDS IN CYILI INLAND VALLEY, RWANDA
55
Code Variables data type values commentsWater Management WAR Water Avalability Ranking num 5 equal classes 1 = Very Easy
2 =Easy3 =moderate4 =difficult5 =very dfficult
PWSH Period of Water Shortage nom na T=During transplantingV=during vegetative stageHF=during flowering and headingNSH= no shortage of waterTV=T+VVFH=V+FHTFH=T+FHTVHF=T+V+HF
PW-T Water shortage during Transplatation num na 1 = yes 0 = no
PW-V Water shortage during Vegetative stage num na 1 = yes 0 = no
PW-HF Water shortage during Heading /Flowering num na 1 = yes 0 = no
WS Water Availability during the growing periode num na 1 = water shortage 0.= no water shortage
Other Observations
CroAP Crop appearance categorical E= Excelent M = Medium P =Poor
PLaSM1 Plant Spacing measured at the field between row num cmPLaSM2 Plant Spacing measured at the field whithin row num cmPTuD Presence of Tungro Desease num %PGLH Presence of Green Leahopper num na 1= yes ; 0 = noSB Stem Borer num %P_DM Presence of Diopsis Macrophthalma nominal na 1= yes , 0 = noN_Def Nitrogen Defiency nom na 1 = yes
0 =no W_Di Weeds Diversity num na 1= 1-3ssp
2= 4 - 5ssp3= >6 ssp
P_Cy Presence of Cyperacea num na 0= None1= Rare
P_Az Presence of Azola categorical 0= None 1= Rare 2 =Frequent4=Abondant
P_CS Presence of Coarse Sand categorical na N= NoneL= LitleLL= Lots
None None Coarse sand mun na if 'None ' then 1 , otherwise 0 Little Little Coarse sand if 'Little' then 1 , otherwise 0 Lots Lots Coarse sand if ' Lots' then 1 , otherwise 0 HD Starting Harverting Date date naHDr Time between harversting and planting date num daysPro Actual Production per plot num kgE_Pro Espected Production per plot num kgPro_Epro Diference between Actual and Espected production num kg Yield Pruduction per ha num kg/Ha

THE EFFECT OF LAND FACTORS AND MANAGEMENT PRACTICES ON RICE YIELDS IN CYILI INLAND VALLEY, RWANDA
56
Appendix 3: Spreadsheet of field data (Rain season January to June 2005)
FN SD ID FS Loc_N POT SN SFC LF MF HF STEXKanyamahanga Claver 22-Sep d1s1 338 Rw 6 URY M 0 1 0 SiC Musonera Innocent 23-Sep d2s1 569 Rw 10 URH L 1 0 0 SiC Rutayisire Theobard 24-Sep d3s1 422 Rw 12 URY M 0 1 0 CL Kamamywa Madeleine 24-Sep d3s2 386 Rw 7 URH L 1 0 0 C Nzeyimana Isidore 24-Sep d3s3 428 Rw 8 URH L 1 0 0 C Ntezukobagira Alexis 24-Sep d3s4 531 Rw 12 IK H 0 0 0 SiCLNyirakamonyo Marigarita 27-Sep d4s1 670 Rw 15 URY L 1 0 0 CL Mukarwego Kansirida 27-Sep d4s2 281 Ru 20 IK H 0 0 1 SiCLHabumugisha Nehemiya 27-Sep d4s3 595 Ru 6 URY M 0 1 0 CL Mukarugabwa 27-Sep d4s4 800 Ru 5 URY M 0 1 0 SCL Muvunandinda 27-Sep d4s5 403 Ru 20 IK H 0 0 1 SCL Nyiragaju Agnes 27-Sep d4s6 616 Ru 10 URH L 1 0 0 C Thereza 27-Sep d4s7 580 Ru 11 URH L 1 0 0 C Habineza Michel 27-Sep d4s8 106 Ru 10 IK H 0 0 1 SiCLGakuru Antoni 28-Sep d5s1 433 Ru 10 IK H 0 0 1 SCL Nzeyimana 28-Sep d5s2 394 Ru 10 URH L 1 0 0 SiCMukunzi gaspard 28-Sep d5s3 504 Ru 11 URY M 0 1 0 SiCLKabera Laurant 28-Sep d5s4 430 Mu 10 URY M 0 1 0 CL Mukashema Mary 28-Sep d5s5 502 Mu 8 URY M 0 1 0 CL Mukahirwa Gaudence 28-Sep d5s6 401 Mu 12 IK H 0 0 1 SiCLNirere Yuriya 28-Sep d5s7 427 Mu 15 URY M 0 1 0 CL Rugorikunda karori 28-Sep d5s8 516 Mu 12 URY M 0 1 0 CL Kabagema odetta 29-Sep d6s3 578 Mu 20 URH L 1 0 0 C Ndayisenga Benoit 29-Sep d6s4 483 Mu 8 URY M 0 1 0 CL Kayisire Emmanuel 29-Sep d6s5 684 Mu 6 URH L 1 0 0 C Kabanda Joseph 29-Sep d6s6 439 Mu 11 IK H 0 0 0 SiCLSebagabo 29-Sep s6s7 486 Mu 12 URY M 0 1 0 CL Bigirimana Jean 29-Sep d6s8 140 Mu 14 URY M 0 1 0 CL Rugorikunda 29-Sep d6s2 409 Mu 7 URY M 0 1 0 CL Mukankunsi Bernadette 29-Sep d6s1 438 Mu 20 URH M 0 1 0 CL Ngirabakunzi Elie 30-Sep d7s1 512 Ka 21 IK H 0 0 1 SiCLNirere Jeanne 30-Sep d7s2 434 Ka 14 IK H 0 0 1 SCL Ruzindana Francois 30-Sep d7s3 480 Ka 7 IK H 0 0 1 SiCLKayitare gregoire 30-Sep d7s4 591 Ka 6 URH L 1 0 0 SC Ndikumwami 30-Sep d7s6 609 Ka 11 URH L 1 0 0 C Murekatete Dafroza 30-Sep d7s5 220 Ka 11 URH L 1 0 0 C Kamari 3-Oct d8s1 496 Ka 10 IK H 0 0 1 SiCLMinani gerard 3-Oct d8s2 382 Ka 10 IK H 0 0 1 SCL Renzaho jean 3-Oct d8s3 741 Ka 10 URY M 0 1 0 SCL Nyirahirwa madeleine 3-Oct d8s6 526 Ka 10 IK H 0 0 1 SiCLButoyi gedeo 3-Oct d8s5 327 Ka 6 URH L 1 0 0 SiCShumbusho 3-Oct d8s4 267 Ka 8 URY M 0 1 0 CL Mugabo 3-Oct d8s7 615 Ka 13 URY M 0 1 0 CL Ndayisenga Jean Damascene 4-Oct d9s1 501 Ka 14 IK H 0 0 1 SiCLMukandekezi Beatrice 4-Oct d9s2 576 Ka 8 URH L 1 0 0 SiL Kalisa Apolinaire 4-Oct d9s3 540 Ka 6 URY M 0 1 0 CL Mugarura gaspard 4-Oct d9s4 503 Ka 9 URY M 0 1 0 CL Tunga Phocas 4-Oct d9s5 558 Ka 10 IK H 0 0 1 SiCLMurekambanze Daniel 5-Oct d10s1 490 M1 15 IK H 0 0 1 SiCLBernard Bigiruhitiye 5-Oct d10s2 814 M1 8 URY M 0 1 0 CL Kabarira jean Pierre 5-Oct d10s3 334 M1 6 URY M 0 1 0 CL Bagorizi Gaspard 5-Oct d10s4 525 M1 14 URY M 0 1 0 CL Dusabe Gatarina 5-Oct d10s5 692 M1 13 IK H 0 0 1 SiCL

THE EFFECT OF LAND FACTORS AND MANAGEMENT PRACTICES ON RICE YIELDS IN CYILI INLAND VALLEY, RWANDA
57
FN SD ID FS Loc_N POT SN SFC LF MF HF OXREDHitimana 5-Oct d10s6 409 M1 18 URY M 0 1 0 1Mukarurangwa 5-Oct d10s7 530 M1 12 URY M 0 1 0 1Karibata 5-Oct d10s8 313 M1 10 URY M 0 1 0 1Bikurana Joseph 6-Oct d11s1 532 M1 10 URH L 1 0 0 1Ndayambaje Francois 6-Oct d11s2 186 M1 9 IK H 0 0 1 1Habamenshi celestin 6-Oct d11s3 574 M1 9 URY M 0 1 0 1Ndayiyishimiye jean 'Amour 7-Oct d12s1 675 M1 9 URY M 0 1 0 1Ndayisaba Jean damacsene 7-Oct d12s2 336 M1 11 IK H 0 0 1 0Ndihokubwayo viateur 7-Oct d12s3 371 M1 10 IK H 0 0 1 0Uwitije Alphonse 7-Oct d12s4 528 M1 12 IK H 0 0 1 0Bizimana 7-Oct d12s5 601 M1 13 IK H 0 0 1 0Barambe 7-Oct d12s6 519 M2 8 IK H 0 0 1 0umutoni 7-Oct d12s7 431 M2 8 IK H 0 0 1 0Sebarame 7-Oct d12s8 529 M2 6 URH L 1 0 0 1Itangishaka 12-Oct d13s1 443 M2 6 URH L 1 0 0 1Nzamwita Dieudonne 12-Oct d13s2 478 M2 6 URH M 0 1 0 1Byumvuhore Theodore 12-Oct d13s3 484 M2 12 URH L 1 0 0 1Murara 12-Oct d13s4 638 M2 14 URH L 1 0 0 1Bigirimana Leon 12-Oct d13s5 676 M2 10 IK H 0 0 1 0Habiyambere 12-Oct d13s6 376 M2 10 URY M 0 1 0 1Rekeraho Leonard 12-Oct d13s8 325 M2 8 URY M 0 1 0 1Ngarambe 12-Oct d13s7 558 M2 11 URY M 0 1 0 1Karorero Jean paul 13-Oct d14s1 587 M2 13 IK H 0 0 1 0Musada Marko 13-Oct d14s2 322 M2 8 URH L 1 0 0 1Mukarutesi cecile 13-Oct d14s3 478 M2 9 URH L 1 0 0 1Mupenda 13-Oct d14s4 482 M2 10 URH L 1 0 0 1Kaje 13-Oct d14s5 463 M2 11 URH L 1 0 0 1Hitimana lasaro 14-Oct d15s1 794 Ny 14 IK H 0 0 1 0Butare 14-Oct d15s2 400 Ny 7 IK H 0 0 1 0semutwa Deo 14-Oct d15s3 485 Ny 10 URY L 1 0 0 1Mujawamariya donata 14-Oct d15s4 511 Ny 19 URH L 1 0 0 1Misigaro 14-Oct d15s5 489 Ny 20 URY M 0 1 0 1Butera Thadee 14-Oct d15s6 687 Ny 11 URY M 0 1 0 1Ndayishimiye Theophile 14-Oct d15s7 547 Ny 8 IK H 0 0 1 0

THE EFFECT OF LAND FACTORS AND MANAGEMENT PRACTICES ON RICE YIELDS IN CYILI INLAND VALLEY, RWANDA
58
STEX CL SiCL TINF INFR SpH SEC SP SP_C SP_W SP_F NP FG CRB FB NCBSiC 0 0 1 10.0 6.7 176 CW 1 1 0 0 no FB 1 0SiC 0 0 2 5.0 6.3 176 CW 1 1 0 0 no NCB 0 1CL 1 0 2 5.0 6.4 176 CW 1 1 0 0 no FB 0 0
C 0 0 1 10.0 6.4 176 CW 1 1 0 0 no NB 1 0C 0 0 1 10.0 6.8 176 CF 1 0 1 0 no FB 1 0
SiCL 0 1 4 2.5 6.7 176 C 1 0 0 0 no NB 0 0CL 1 0 1 10.0 6.1 176 CWF 1 1 1 0 no NB 0 0
SiCL 0 1 4 2.5 6.3 230 NP 0 0 0 1 no NB 0 0CL 1 0 2 5.0 6.4 230 CF 1 0 1 0 no FB 1 0
SCL 0 0 3 3.3 6.7 230 CW 1 1 0 0 no FB 1 0SCL 0 0 4 2.5 6.2 230 NP 0 0 0 0 no NB 0 0
C 0 0 3 3.3 6 230 CF 1 0 1 0 no FB 1 0C 0 0 4 2.5 6.4 230 W 0 1 0 0 no NB 0 0
SiCL 0 1 3 3.3 6.6 230 NP 0 0 0 1 no FB 1 0SCL 0 0 4 2.5 6.8 230 NP 0 0 0 1 no NB 0 0
SiC 0 0 3 3.3 6.4 230 CW 1 1 0 0 no NB 0 0SiCL 0 1 2 5.0 6.4 230 CW 1 1 0 0 no NB 0 0
CL 1 0 2 5.0 6.7 204 C 1 0 0 0 no FB 1 0CL 1 0 2 5.0 5.9 204 C 1 0 0 0 no NCB 0 1
SiCL 0 1 4 2.5 6.2 204 NP 0 0 0 1 no NCB 0 1CL 1 0 1 10.0 6.6 204 C 1 0 0 0 no NCB 0 1CL 1 0 2 5.0 6.4 204 CW 1 1 0 0 no FB 1 0
C 0 0 2 5.0 6.8 204 CF 1 0 1 0 no FB 1 0CL 1 0 1 10.0 6.5 204 C 1 0 0 0 no NB 0 0
C 0 0 1 10.0 6.1 204 C 1 0 0 0 no NB 0 0SiCL 0 1 2 5.0 6.5 204 NP 0 0 0 1 no FB 1 0
CL 1 0 1 10.0 6.3 204 C 1 0 0 0 no NB 0 0CL 1 0 1 10.0 6.5 204 C 1 0 0 0 no FB 1 0CL 1 0 2 5.0 6.5 204 C 1 0 0 0 no NB 0 0CL 1 0 1 10.0 6.4 204 C 1 0 0 0 no NB 0 0
SiCL 0 1 3 3.3 6.4 256 C 1 0 0 0 no NB 0 0SCL 0 0 1 10.0 6.8 256 NP 0 0 0 1 no FB 1 0SiCL 0 1 1 10.0 6.4 256 NP 0 0 0 1 no NB 0 0
SC 0 0 0.5 20.0 6.5 256 CWF 1 1 1 0 no NB 0 0C 0 0 1 10.0 6.6 256 C 1 0 0 0 no NCB 0 1C 0 0 0.5 20.0 6.7 256 CWF 1 1 1 0 no FB 1 0
SiCL 0 1 4 2.5 6.1 256 NP 0 0 0 1 no NB 0 0SCL 0 0 4 2.5 6.5 256 NP 0 0 0 1 no NB 0 0SCL 0 0 2 5.0 6.3 256 C 1 0 0 0 no NB 0 0SiCL 0 1 2 5.0 6.2 256 C 1 0 0 0 no FB 1 0
SiC 0 0 0.5 20.0 6.8 256 C 1 0 0 0 no FB 1 0CL 1 0 1 10.0 6.4 256 C 1 0 0 0 no NB 0 0CL 1 0 2 5.0 6.2 256 C 1 0 0 0 no FB 1 0
SiCL 0 1 0.5 20.0 6.7 256 CW 1 1 0 0 no NB 0 0SiL 0 0 0.5 20.0 6.2 256 W 0 1 0 0 no NCB 0 1CL 1 0 2 5.0 6.5 256 C 1 0 0 0 no NB 0 0CL 1 0 2 5.0 6.1 256 C 1 0 0 0 no NB 0 0
SiCL 0 1 3 3.3 6.8 256 C 1 0 0 0 no NCB 0 1SiCL 0 1 3 3.3 6.4 241 NP 0 0 0 1 no FB 1 0
CL 1 0 4 2.5 6.9 241 F 0 0 1 0 no NB 0 0CL 1 0 2 5.0 6.5 241 F 0 0 1 0 no NB 0 0CL 1 0 3 3.3 6.4 241 C 1 0 0 0 no NB 0 0
SiCL 0 1 3 3.3 6.3 241 NP 0 0 0 1 no FB 1 0

THE EFFECT OF LAND FACTORS AND MANAGEMENT PRACTICES ON RICE YIELDS IN CYILI INLAND VALLEY, RWANDA
59
STEX CL SiCL TINF INFR SpH SEC SP SP_C SP_W SP_F NP FG CRB FB NCBCL 1 0 2 5.0 6.5 241 C 1 0 0 0 no FB 1 0CL 1 0 1 10.0 6.2 241 C 1 0 0 0 no FB 1 0CL 1 0 2 5.0 6.8 241 C 1 0 0 0 no FB 1 0
SCL 0 0 2 5.0 6.7 241 W 0 1 0 0 no NB 0 0SiCL 0 1 4 2.5 6.2 241 NP 0 0 0 1 no FB 1 0
CL 1 0 2 5.0 6 241 C 1 0 0 0 no FB 1 0CL 1 0 2 5.0 6.4 241 C 1 0 0 0 no FB 1 0
SiCL 0 1 3 3.3 6.7 241 NP 0 0 0 1 no NCB 0 1CL 1 0 4 2.5 6.6 241 NP 0 0 0 1 no NCB 0 0CL 1 0 4 2.5 6.2 241 NP 0 0 0 1 no FB 1 0
SiCL 0 1 4 2.5 6.3 241 NP 0 0 0 1 no FB 1 0SiCL 0 1 4 2.5 6.5 241 NP 0 0 0 1 no NCB 0 1SiCL 0 1 4 2.5 6.7 241 NP 0 0 0 1 no FB 1 0
CL 1 0 1 10.0 6.2 241 CWF 1 1 1 0 no NB 0 0CL 1 0 1 10.0 6.5 216 CW 1 1 0 0 no NB 0 0CL 1 0 2 5.0 6.4 216 C 1 0 0 0 no NB 0 0CL 1 0 1 10.0 6.2 216 CF 1 0 1 0 no NB 0 0
SiCL 0 1 1 10.0 6.2 216 CWF 1 1 1 0 no NB 0 0SiCL 0 1 4 2.5 6.4 216 NP 0 0 0 1 no FB 1 0
CL 1 0 2 5.0 6.2 216 C 1 0 0 0 no FB 1 0CL 1 0 2 5.0 6 216 C 1 0 0 0 no FB 1 0CL 1 0 1 10.0 6.7 216 C 1 0 0 0 no FB 1 0
SiCL 0 1 4 2.5 6.2 216 NP 0 0 0 1 no FB 1 0SC 0 0 1 10.0 6.1 216 CWF 1 1 1 0 no FB 1 0SC 0 0 2 5.0 6.3 216 C 1 0 0 0 no NB 0 0SC 0 0 1 10.0 6.1 216 C 1 0 0 0 no NB 0 0SC 0 0 2 5.0 6.4 216 C 1 0 0 0 no NB 0 0
SiCL 0 1 3 3.3 6.7 216 NP 0 0 0 1 no FB 1 0SiCL 0 1 3 3.3 6.8 216 NP 0 0 0 0 no FB 1 0
CL 1 0 1 10.0 6.1 216 C 1 0 0 0 no NB 0 0CL 1 0 1 10.0 6.1 216 CW 1 1 0 0 no NB 0 0CL 1 0 2 5.0 6.5 216 CF 1 0 1 0 no FB 1 0CL 1 0 2 5.0 6.4 216 C 1 0 0 0 no NB 0 0
SiCL 0 1 2 5.0 6.8 216 NP 0 0 0 1 no FB 1 0

THE EFFECT OF LAND FACTORS AND MANAGEMENT PRACTICES ON RICE YIELDS IN CYILI INLAND VALLEY, RWANDA
60
NB SHLPD SHLPr DLPD DLPDr Pu LevD LevDr NuD AgeN AgeS PD PDr PU SQ P_H0 1-Dec -35 10-Dec -26 0 2-Jan -3 1-Dec -35 35 5-Jan 10 H G 30 1-Dec -45 10-Dec -36 0 14-Jan -1 1-Dec -45 45 15-Jan 20 H G 30 2-Dec -54 10-Dec -46 0 20-Jan -5 1-Dec -55 55 25-Jan 30 H G 31 1-Dec -47 15-Dec -33 0 15-Jan -2 1-Dec -47 47 17-Jan 22 H G 50 1-Dec -45 15-Dec -31 0 10-Jan -5 1-Dec -45 45 15-Jan 20 H G 51 5-Dec -23 15-Dec -13 0 26-Dec -2 1-Dec -27 27 28-Dec 2 H G 31 3-Dec -53 10-Dec -46 0 20-Jan -5 10-Dec -46 46 25-Jan 30 H G 41 1-Dec -45 10-Dec -36 0 10-Jan -5 1-Dec -45 45 15-Jan 20 H G 30 10-Dec -46 20-Dec -36 0 20-Jan -5 10-Dec -46 46 25-Jan 30 H G 30 5-Dec -43 10-Dec -38 0 15-Jan -2 10-Dec -38 38 17-Jan 22 H G 41 2-Dec -26 15-Dec -13 0 22-Dec -6 10-Dec -18 28-Dec 2 H G 30 5-Dec -38 10-Dec -33 0 10-Jan -2 10-Dec -33 33 12-Jan 17 H G 50 10-Dec -36 15-Dec -31 0 10-Jan -5 10-Dec -36 36 15-Jan 20 H G 50 2-Dec -46 10-Dec -38 0 15-Jan -2 1-Dec -47 47 17-Jan 22 H G 41 3-Dec -53 10-Dec -46 0 15-Jan -10 10-Dec -46 46 25-Jan 30 H G 31 5-Dec -36 10-Dec -31 0 5-Jan -5 10-Dec -31 31 10-Jan 15 H G 51 2-Dec -39 15-Dec -26 0 4-Jan -6 10-Dec -31 31 10-Jan 15 H G 40 10-Dec -31 20-Dec -21 0 5-Jan -5 10-Dec -31 31 10-Jan 15 H G 50 15-Dec -31 20-Dec -26 0 10-Jan -5 10-Dec -36 36 15-Jan 20 H G 50 17-Dec -29 25-Dec -21 0 12-Jan -3 10-Dec -36 36 15-Jan 20 H G 30 15-Dec -31 24-Dec -22 0 10-Jan -5 10-Dec -36 36 15-Jan 20 H G 50 15-Dec -31 20-Dec -26 0 10-Jan -5 10-Dec -36 36 15-Jan 20 H G 40 21-Dec -56 4-Jan -42 0 12-Feb -3 1-Jan -45 45 15-Feb 51 H G 41 15-Dec -62 4-Jan -42 0 10-Feb -5 1-Jan -45 45 15-Feb 51 H G 31 18-Dec -59 5-Jan -41 0 10-Feb -5 1-Jan -45 45 15-Feb 51 H G 30 15-Dec -62 10-Jan -36 0 12-Feb -3 1-Jan -45 45 15-Feb 51 H G 31 20-Dec -57 10-Jan -36 0 10-Feb -5 1-Jan -45 45 15-Feb 51 H G 40 12-Dec -65 10-Jan -36 0 10-Feb -5 1-Jan -45 45 15-Feb 51 H G 41 8-Dec -69 8-Jan -38 0 10-Feb -5 1-Jan -45 45 15-Feb 51 H G 41 5-Dec -72 7-Jan -39 0 12-Feb -3 1-Jan -45 45 15-Feb 51 H G 41 5-Dec -44 10-Jan -8 0 12-Jan -6 15-Dec -34 34 18-Jan 23 H G 30 2-Dec -44 5-Jan -10 0 10-Jan -5 15-Dec -31 31 15-Jan 20 H G 31 5-Dec -41 4-Jan -11 0 12-Jan -3 15-Dec -31 31 15-Jan 20 H G 31 8-Dec -38 4-Jan -11 0 12-Jan -3 15-Dec -31 31 15-Jan 20 H G 50 10-Dec -36 3-Jan -12 0 12-Jan -3 15-Dec -31 31 15-Jan 20 H G 41 10-Dec -36 4-Jan -11 0 10-Jan -5 15-Dec -31 31 15-Jan 20 H G 51 5-Dec -40 4-Jan -10 0 12-Jan -2 15-Dec -30 30 14-Jan 19 H G 31 4-Dec -41 5-Jan -9 0 10-Jan -4 15-Dec -30 30 14-Jan 19 H G 31 4-Dec -41 5-Jan -9 0 10-Jan -4 15-Dec -30 30 14-Jan 19 H G 50 1-Dec -44 4-Jan -10 0 9-Jan -5 15-Dec -30 30 14-Jan 19 H G 40 6-Dec -39 4-Jan -10 0 12-Jan -2 15-Dec -30 30 14-Jan 19 H G 30 10-Dec -35 4-Jan -10 0 13-Jan -1 15-Dec -30 30 14-Jan 19 H G 30 8-Dec -37 4-Jan -10 0 12-Jan -2 15-Dec -30 30 14-Jan 19 H G 41 7-Dec -39 6-Jan -9 0 10-Jan -5 15-Dec -31 31 15-Jan 20 H G 30 10-Dec -36 6-Jan -9 0 10-Jan -5 15-Dec -31 31 15-Jan 20 H G 51 1-Dec -44 6-Jan -8 0 12-Jan -2 15-Dec -30 30 14-Jan 19 H G 50 5-Dec -40 6-Jan -8 0 10-Jan -4 15-Dec -30 30 14-Jan 19 H G 40 13-Dec -32 4-Jan -10 0 10-Jan -4 15-Dec -30 30 14-Jan 19 H G 40 14-Dec -12 18-Dec -8 0 20-Dec -6 25-Nov -31 31 26-Dec 0 H G 31 15-Nov -41 1-Dec -25 0 20-Dec -6 25-Nov -31 31 26-Dec 0 H G 41 15-Nov -41 2-Dec -24 0 21-Dec -5 25-Nov -31 31 26-Dec 0 H G 51 10-Nov -46 2-Dec -24 0 24-Dec -2 25-Nov -31 31 26-Dec 0 H G 30 15-Nov -41 2-Dec -24 0 22-Dec -4 25-Nov -31 31 26-Dec 0 H G 3

THE EFFECT OF LAND FACTORS AND MANAGEMENT PRACTICES ON RICE YIELDS IN CYILI INLAND VALLEY, RWANDA
61
NB SHLPD SHLPr DLPD DLPDr Pu LevD LevDr NuD AgeN AgeS PD PDr PU SQ P_H0 19-Nov -38 1-Dec -26 0 26-Dec -1 25-Nov -32 32 27-Dec 1 H G 30 20-Nov -37 2-Dec -25 0 24-Dec -3 25-Nov -32 32 27-Dec 1 H G 40 20-Nov -37 2-Dec -25 0 24-Dec -3 25-Nov -32 32 27-Dec 1 H G 31 8-Dec -26 14-Dec -20 0 27-Dec -7 25-Nov -39 39 3-Jan 8 H G 50 6-Dec -28 14-Dec -20 0 27-Dec -7 25-Nov -39 39 3-Jan 8 H G 50 2-Dec -32 16-Dec -18 0 27-Dec -7 25-Nov -39 39 3-Jan 8 H G 50 5-Dec -29 15-Dec -19 0 27-Dec -7 25-Nov -39 39 3-Jan 8 H G 50 5-Dec -29 15-Dec -19 0 26-Dec -8 25-Nov -39 39 3-Jan 8 H G 31 10-Dec -24 16-Dec -18 0 26-Dec -8 25-Nov -39 39 3-Jan 8 H G 30 10-Dec -24 15-Dec -19 0 24-Dec -10 25-Nov -39 39 3-Jan 8 H G 40 10-Dec -24 15-Dec -19 0 27-Dec -7 25-Nov -39 39 3-Jan 8 H G 30 5-Dec -29 12-Dec -22 0 26-Dec -8 3-Dec -31 31 3-Jan 8 H G 30 1-Dec -33 11-Dec -23 0 24-Dec -10 3-Dec -31 31 3-Jan 8 H G 31 1-Dec -33 10-Dec -24 0 23-Dec -11 3-Dec -31 31 3-Jan 8 H G 51 5-Dec -30 10-Dec -25 0 24-Dec -11 3-Dec -32 32 4-Jan 9 H G 51 2-Dec -33 8-Dec -27 0 24-Dec -11 3-Dec -32 32 4-Jan 9 H G 51 5-Dec -30 10-Dec -25 0 2-Jan -2 3-Dec -32 32 4-Jan 9 H G 41 3-Dec -32 11-Dec -24 0 2-Jan -2 3-Dec -32 32 4-Jan 9 H G 30 5-Dec -30 10-Dec -25 0 3-Jan -1 3-Dec -32 32 4-Jan 9 H G 40 10-Dec -25 10-Dec -25 0 29-Dec -6 3-Dec -32 32 4-Jan 9 H G 40 9-Dec -26 15-Dec -20 0 29-Dec -6 3-Dec -32 32 4-Jan 9 H G 30 8-Dec -27 16-Dec -19 0 2-Jan -2 3-Dec -32 32 4-Jan 9 H G 50 10-Dec -27 16-Dec -21 0 2-Jan -4 3-Dec -34 34 6-Jan 11 H G 30 8-Dec -29 15-Dec -22 0 3-Jan -3 3-Dec -34 34 6-Jan 11 H G 31 5-Dec -32 10-Dec -27 0 30-Dec -7 3-Dec -34 34 6-Jan 11 H G 31 4-Dec -33 20-Dec -17 0 2-Jan -4 3-Dec -34 34 6-Jan 11 H G 31 2-Dec -35 10-Dec -27 0 3-Jan -3 3-Dec -34 34 6-Jan 11 H G 40 4-Dec -30 14-Dec -20 0 28-Dec -6 5-Dec -29 29 3-Jan 8 H G 30 7-Dec -27 14-Dec -20 0 28-Dec -6 5-Dec -29 29 3-Jan 8 H G 31 5-Dec -29 10-Dec -24 0 27-Dec -7 5-Dec -29 29 3-Jan 8 H G 1 5-Dec -29 11-Dec -23 0 30-Dec -4 5-Dec -29 29 3-Jan 8 H G 50 6-Dec -28 10-Dec -24 0 30-Dec -4 5-Dec -29 29 3-Jan 8 H G 41 5-Dec -29 10-Dec -24 0 28-Dec -6 5-Dec -29 29 3-Jan 8 H G 30 4-Dec -30 12-Dec -22 0 27-Dec -7 5-Dec -29 29 3-Jan 8 H G 3

THE EFFECT OF LAND FACTORS AND MANAGEMENT PRACTICES ON RICE YIELDS IN CYILI INLAND VALLEY, RWANDA
62
Dis1 Dis2 GF Var WD1 WD1r WD2 WD2r WD3 WD3r WD4 WD4r NW MAB_NPK T_NPK20 15 0 0 17-Jan 12 3-Feb 29 15-Feb 41 nv -999 3 0 0 20-Jan20 15 0 0 25-Jan 10 10-Feb 26 nv -999 nv -999 2 0 0 30-Jan20 15 0 1 8-Feb 14 18-Feb 24 4-Mar 38 nv -999 3 0 0 11-Feb20 15 0 1 28-Jan 11 10-Feb 24 nv -999 nv -999 2 0 0 28-Jan20 15 0 0 28-Jan 13 13-Feb 29 nv -999 nv -999 2 0 0 1-Feb20 15 0 0 10-Jan 13 24-Jan 27 10-Feb 44 20-Mar 82 4 0 0 15-Jan20 15 0 0 5-Feb 11 22-Feb 28 3-Mar 37 nv -999 3 0 0 10-Feb20 15 0 1 25-Jan 10 18-Feb 34 27-Feb 43 18-Mar 62 4 0 0 30-Jan20 15 0 1 5-Feb 11 22-Feb 28 1-Mar 35 nv -999 3 0 0 10-Feb20 15 0 0 25-Jan 8 11-Feb 25 20-Feb 34 nv -999 3 0 0 30-Jan20 15 0 0 8-Jan 11 23-Jan 26 10-Feb 44 1-Mar 63 4 0 0 10-Jan20 15 0 1 22-Jan 10 12-Feb 31 nv -999 nv -999 2 0 0 26-Jan20 15 0 0 26-Jan 11 13-Feb 29 nv -999 nv -999 2 0 0 28-Jan20 15 0 0 28-Jan 11 12-Feb 26 26-Feb 40 15-Mar 57 4 0 0 29-Jan20 15 0 1 9-Feb 15 20-Feb 26 3-Mar 37 26-Mar 60 4 0 0 10-Feb20 15 0 1 20-Jan 10 4-Feb 25 nv -999 nv -999 2 0 0 21-Jan20 15 0 0 19-Jan 9 25-Jan 15 15-Feb 36 nv -999 3 0 0 20-Jan20 15 0 0 23-Jan 13 6-Feb 27 20-Feb 41 nv -999 3 0 0 23-Jan20 15 0 0 28-Jan 13 8-Feb 24 20-Feb 36 nv -999 3 0 0 29-Jan20 15 0 1 29-Jan 14 7-Feb 23 21-Feb 37 12-Mar 56 4 0 0 29-Jan20 15 0 1 28-Jan 13 4-Feb 20 nv -999 nv -999 2 0 0 29-Jan20 15 0 1 27-Jan 12 5-Feb 21 nv -999 nv -999 2 0 0 28-Jan20 15 0 0 23-Feb 8 7-Mar 20 nv -999 nv -999 2 0 0 25-Feb20 15 0 0 25-Feb 10 7-Mar 20 nv -999 nv -999 2 0 0 nv20 15 0 0 25-Feb 10 8-Mar 21 nv -999 nv -999 2 0 0 27-Feb20 15 0 0 24-Feb 9 9-Mar 22 20-Mar 33 nv -999 4 0 0 27-Feb20 15 0 1 26-Feb 11 8-Mar 21 21-Mar 34 nv -999 3 0 0 28-Feb20 15 0 1 25-Feb 10 6-Mar 19 20-Mar 33 nv -999 3 0 0 28-Feb20 15 0 1 23-Feb 8 9-Mar 22 22-Mar 35 nv -999 3 0 0 25-Feb20 15 0 0 24-Feb 9 11-Mar 24 25-Mar 38 nv -999 3 0 0 26-Feb20 15 0 0 28-Jan 10 9-Feb 22 24-Feb 37 20-Mar 61 4 0 0 29-Jan20 15 0 0 22-Jan 7 9-Feb 25 25-Feb 41 18-Mar 62 4 0 0 26-Jan20 15 0 0 23-Jan 8 10-Feb 26 25-Feb 41 20-Mar 64 4 0 0 25-Jan20 15 0 1 21-Jan 6 9-Feb 25 nv -999 nv -999 2 0 0 25-Jan20 15 0 1 27-Jan 12 9-Feb 25 21-Feb 37 nv -999 3 0 0 29-Jan20 15 0 0 25-Jan 10 8-Feb 24 20-Feb 36 nv -999 3 0 0 28-Jan20 15 0 0 24-Jan 10 6-Feb 23 18-Feb 35 nv -999 3 0 0 25-Jan20 15 0 1 25-Jan 11 8-Feb 25 18-Feb 35 15-Mar 60 4 0 0 26-Jan20 15 0 0 25-Jan 11 7-Feb 24 18-Feb 35 nv -999 3 0 0 25-Jan20 15 0 0 27-Jan 13 9-Feb 26 20-Feb 37 5-Mar 50 4 0 0 29-Jan20 15 0 0 24-Jan 10 10-Feb 27 nv -999 nv -999 2 0 0 21-Jan20 15 0 1 25-Jan 11 11-Feb 28 nv -999 nv -999 4 0 0 27-Jan20 15 0 0 22-Jan 8 9-Feb 26 20-Feb 37 nv -999 3 0 0 26-Jan20 15 0 0 25-Jan 10 9-Feb 25 nv -999 nv -999 4 0 0 30-Jan20 15 0 1 26-Jan 11 10-Feb 26 nv -999 nv -999 2 0 0 30-Jan20 15 0 1 22-Jan 8 8-Feb 25 18-Feb 35 nv -999 3 0 0 27-Jan20 15 0 1 26-Jan 12 10-Feb 27 22-Feb 39 nv -999 3 0 0 28-Jan20 15 0 0 24-Jan 10 12-Feb 29 24-Feb 41 20-Mar 65 4 0 0 28-Jan20 15 0 1 5-Jan 10 17-Jan 22 2-Feb 38 10-Mar 74 4 0 0 7-Jan20 15 0 1 5-Jan 10 15-Jan 20 30-Jan 35 10-Feb 46 4 0 0 8-Jan20 15 0 1 8-Jan 13 18-Jan 23 26-Jan 31 nv -999 3 0 0 10-Jan20 15 0 1 4-Jan 9 20-Jan 25 4-Feb 40 18-Feb 54 4 0 0 8-Jan20 15 0 1 6-Jan 11 20-Jan 25 5-Feb 41 25-Feb 61 4 0 0 10-Jan

THE EFFECT OF LAND FACTORS AND MANAGEMENT PRACTICES ON RICE YIELDS IN CYILI INLAND VALLEY, RWANDA
63
Dis1 Dis2 GF Var WD1 WD1r WD2 WD2r WD3 WD3r WD4 WD4r NW MAB_NPK T_NPK20 15 0 0 6-Jan 10 24-Jan 28 7-Feb 42 23-Feb 58 4 0 0 10-Jan20 15 0 1 5-Jan 9 18-Jan 22 3-Feb 38 24-Feb 59 4 0 0 8-Jan20 15 0 1 5-Jan 9 15-Jan 19 30-Jan 34 -999 3 0 0 8-Jan20 15 0 0 13-Jan 10 25-Jan 22 nv -999 nv -999 2 0 0 14-Jan20 15 0 1 10-Jan 7 22-Jan 19 6-Feb 34 25-Feb 53 4 0 0 15-Jan20 15 0 1 15-Jan 12 25-Jan 22 13-Feb 41 nv -999 3 0 0 17-Jan20 15 0 0 15-Jan 12 28-Jan 25 15-Feb 43 nv -999 3 0 0 18-Jan20 15 0 0 14-Jan 11 25-Jan 22 14-Feb 42 nv -999 4 0 0 17-Jan20 15 0 0 15-Jan 12 26-Jan 23 10-Feb 38 nv -999 4 0 0 17-Jan20 15 0 0 13-Jan 10 28-Jan 25 15-Feb 43 nv -999 3 0 0 15-Jan20 15 0 0 13-Jan 10 28-Jan 25 14-Feb 42 5-Mar 61 4 0 0 15-Jan20 15 0 0 16-Jan 13 26-Jan 23 13-Feb 41 8-Mar 64 4 0 0 18-Jan20 15 0 0 17-Jan 14 25-Jan 22 15-Feb 43 5-Mar 61 4 0 0 20-Jan20 15 0 0 16-Jan 13 25-Jan 22 nv -999 nv -999 2 0 0 18-Jan20 15 0 0 17-Jan 13 26-Jan 22 20-Feb 47 nv -999 3 0 0 18-Jan20 15 0 0 16-Jan 12 24-Jan 20 8-Feb 35 nv -999 3 0 0 18-Jan20 15 0 0 15-Jan 11 3-Feb 30 17-Feb 44 nv -999 3 0 0 17-Jan20 15 0 0 17-Jan 13 27-Jan 23 nv -999 nv -999 2 0 0 18-Jan20 15 0 1 17-Jan 13 28-Jan 24 12-Feb 39 2-Mar 57 4 0 0 18-Jan20 15 0 0 18-Jan 14 24-Jan 20 8-Feb 35 5-Mar 60 4 0 0 20-Jan20 15 0 0 21-Jan 17 8-Feb 35 20-Feb 47 nv -999 3 0 0 21-Jan20 15 0 0 18-Jan 14 13-Feb 40 26-Feb 53 nv -999 3 0 0 20-Jan20 15 0 1 20-Jan 14 8-Feb 33 20-Feb 45 15-Mar 68 4 0 0 22-Jan20 15 0 1 20-Jan 14 7-Feb 32 nv -999 nv -999 2 0 0 20-Jan20 15 0 1 25-Jan 19 9-Feb 34 nv -999 nv -999 2 0 0 25-Jan20 15 0 1 17-Jan 11 8-Feb 33 20-Feb 45 10-Mar 63 4 0 0 19-Jan20 15 0 1 17-Jan 11 8-Feb 33 nv -999 nv -999 2 0 0 20-Jan20 15 0 0 16-Jan 13 10-Feb 38 25-Feb 53 10-Mar 66 4 0 0 18-Jan20 15 0 0 14-Jan 11 1-Feb 29 24-Feb 52 9-Mar 65 4 0 0 16-Jan20 15 0 0 13-Jan 10 3-Feb 31 28-Feb 56 nv -999 3 0 0 15-Jan20 15 0 0 15-Jan 12 28-Jan 25 14-Feb 42 nv -999 3 0 0 17-Jan20 15 0 0 11-Jan 8 2-Feb 30 16-Feb 44 2-Mar 58 4 0 0 15-Jan20 15 0 0 17-Jan 14 7-Feb 35 nv -999 nv -999 2 0 0 20-Jan20 15 0 0 15-Jan 12 1-Feb 29 18-Feb 46 4-Mar 60 4 0 0 16-Jan

THE EFFECT OF LAND FACTORS AND MANAGEMENT PRACTICES ON RICE YIELDS IN CYILI INLAND VALLEY, RWANDA
64
T_NPKr A_NPK NPK_ha N/ha P205/ha K2O/ha T_INC Lev_W N_wet N_1/2wet N_dry T_Urea
15 5 148 25 25 25 7 1 1 0 0 5-Feb15 5 88 15 15 15 6 3 0 0 1 15-Feb17 10 237 40 40 40 4 1 1 0 0 20-Feb11 5 130 22 22 22 7 3 0 0 1 10-Feb17 5 117 20 20 20 6 3 0 0 1 15-Feb18 5 94 16 16 16 5 2 0 1 0 25-Feb16 5 75 13 13 13 7 1 1 0 0 25-Feb15 4 142 24 24 24 3 2 0 1 0 20-Feb16 5 84 14 14 14 4 1 1 0 0 24-Feb13 5 63 11 11 11 5 1 1 0 0 15-Feb13 6 149 25 25 25 3 2 0 1 0 25-Jan14 4 65 11 11 11 7 3 0 0 1 15-Feb13 3 52 9 9 9 7 3 0 0 0 15-Feb12 5 472 80 80 80 5 1 1 0 0 15-Feb16 7 162 27 27 27 4 2 0 1 0 22-Feb11 4 102 17 17 17 6 3 0 0 1 5-Feb10 3 60 10 10 10 6 1 1 0 0 28-Jan13 4 93 16 16 16 5 1 1 0 0 8-Feb14 3 60 10 10 10 5 1 1 0 0 8-Feb14 5 125 21 21 21 4 2 0 1 0 7-Feb14 3 70 12 12 12 5 3 0 0 1 8-Feb13 3 58 10 10 10 8 3 0 0 1 7-Feb10 3 52 9 9 9 5 3 0 0 1 8-Mar
-999 0 0 0 0 0 4 1 1 0 0 nv12 5 73 12 12 12 5 1 1 0 0 10-Mar12 5 114 19 19 19 4 2 0 1 0 9-Mar13 4 82 14 14 14 5 1 1 0 0 11-Mar13 4 286 49 49 49 5 1 1 0 0 8-Mar10 4 98 17 17 17 7 3 0 0 1 10-Mar11 3 68 12 12 12 4 1 1 0 0 11-Mar11 3 59 10 10 10 7 1 1 0 0 10-Feb11 5 115 20 20 20 4 2 0 1 0 10-Feb10 5 104 18 18 18 5 2 0 1 0 10-Feb10 3 51 9 9 9 4 3 0 0 1 12-Feb14 5 82 14 14 14 7 3 0 0 1 10-Feb13 5 227 39 39 39 5 3 0 0 1 11-Feb11 5 101 17 17 17 6 2 0 1 0 8-Feb12 4 105 18 18 18 5 2 0 1 0 10-Feb11 5 67 11 11 11 7 3 0 0 0 10-Feb15 6 114 19 19 19 4 2 0 1 0 11-Feb
7 3 92 16 16 16 7 3 0 0 0 10-Feb13 4 150 25 25 25 5 1 1 0 0 14-Feb12 4 65 11 11 11 4 1 1 0 0 11-Feb15 4 80 14 14 14 3 1 1 0 0 11-Feb15 3 52 9 9 9 8 3 0 0 1 13-Feb13 4 74 13 13 13 7 1 1 0 0 11-Feb14 4 80 14 14 14 5 1 1 0 0 12-Feb14 5 90 15 15 15 4 1 1 0 0 12-Feb12 7 143 24 24 24 3 2 0 1 0 20-Jan13 5 61 10 10 10 5 1 1 0 0 18-Jan15 7 210 36 36 36 4 3 0 0 1 20-Jan13 4 76 13 13 13 5 1 1 0 0 22-Jan15 5 72 12 12 12 4 2 0 1 0 22-Jan

THE EFFECT OF LAND FACTORS AND MANAGEMENT PRACTICES ON RICE YIELDS IN CYILI INLAND VALLEY, RWANDA
65
T_NPKr A_NPK NPK_ha N/ha P205/ha K2O/ha T_INC Lev_W N_wet N_1/2wet N_dry T_Urea
14 5 122 21 21 21 4 1 1 0 0 25-Feb12 5 94 16 16 16 6 2 0 1 0 18-Jan12 5 160 27 27 27 6 1 1 0 0 21-Jan11 2.5 47 8 8 8 7 3 0 0 1 27-Jan12 5 269 46 46 46 4 2 0 1 0 28-Jan14 5 87 15 15 15 5 1 1 0 0 28-Jan15 4 59 10 10 10 4 1 1 0 0 2-Feb14 6 179 30 30 30 3 2 0 1 0 28-Jan14 7 189 32 32 32 3 2 0 1 0 28-Jan12 6 114 19 19 19 5 2 0 1 0 2-Feb12 6 100 17 17 17 4 2 0 1 0 1-Feb15 5 96 16 16 16 4 2 0 1 0 1-Feb17 5 116 20 20 20 4 2 0 1 0 3-Feb15 3 57 10 10 10 3 1 1 0 0 1-Feb14 3 68 12 12 12 4 1 1 0 0 1-Feb14 3 63 11 11 11 6 1 1 0 0 1-Feb13 3 62 11 11 11 6 3 0 0 1 8-Feb14 3 47 8 8 8 7 3 0 0 0 1-Feb14 6 89 15 15 15 4 2 0 1 0 2-Feb16 3 80 14 14 14 6 1 1 0 0 28-Jan17 4 123 21 21 21 5 1 1 0 0 10-Feb16 4 72 12 12 12 5 1 1 0 0 15-Feb16 7 119 20 20 20 4 2 0 1 0 12-Feb14 4 124 21 21 21 3 3 0 0 1 10-Feb19 4 84 14 14 14 7 3 0 0 1 12-Feb13 3 62 11 11 11 4 3 0 0 1 10-Feb14 3 65 11 11 11 5 2 0 1 0 10-Feb15 6 76 13 13 13 5 2 0 1 0 12-Feb13 6 150 26 26 26 3 2 0 1 0 4-Feb12 6 124 21 21 21 6 3 0 0 0 5-Feb14 4 78 13 13 13 7 3 0 0 1 4-Feb12 3 61 10 10 10 6 1 1 0 0 5-Feb17 4 58 10 10 10 4 1 1 0 0 10-Feb13 5 91 16 16 16 3 2 0 1 0 2-Feb

THE EFFECT OF LAND FACTORS AND MANAGEMENT PRACTICES ON RICE YIELDS IN CYILI INLAND VALLEY, RWANDA
66
T_Urear A_Urea Urea- ha N-ha T_INC_U Lev_W_U U_wet U_1/2wet U_dry DCAPP RatC GarB31 2.5 74 34 7 2 0 1 0 1 0 231 3.0 53 24 5 3 0 0 1 0 0 226 5.0 118 55 4 1 1 0 0 1 0 224 3.0 78 36 6 3 0 0 1 1 0 231 3.0 70 32 5 2 0 1 0 0 0 259 3.0 56 26 7 2 0 1 0 1 0 231 3.0 45 21 4 1 1 0 0 0 0 236 2.5 89 41 7 2 0 1 0 1 0 230 3.0 50 23 5 1 1 0 0 0 0 229 3.0 38 17 6 1 1 0 0 0 0 228 3.0 74 34 7 2 0 1 0 1 0 234 3.0 49 22 5 3 0 0 1 0 0 231 3.0 52 24 5 3 0 0 1 0 0 229 3.0 283 130 5 1 1 0 0 1 1 228 3.0 69 32 6 1 1 0 0 1 0 226 3.0 76 35 6 3 0 0 0 0 0 218 0.0 0 0 6 1 1 0 0 0 0 229 2.5 58 27 5 1 1 0 0 0 0 224 3.0 60 27 7 1 1 0 0 0 0 223 3.0 75 34 6 2 0 1 0 1 0 224 0.0 0 0 5 3 0 0 1 0 0 223 3.0 58 27 7 3 0 0 1 0 0 221 3.0 52 24 5 3 0 0 1 0 0 2
-999 0.0 0 0 5 1 1 0 0 0 0 223 0.0 0 0 5 1 0 0 0 0 0 222 3.0 68 31 6 2 0 1 0 1 0 224 3.0 62 28 6 1 1 0 0 0 0 221 2.5 179 82 7 1 1 0 0 0 0 223 2.5 61 28 5 3 0 0 1 0 0 224 3.0 68 32 6 1 1 0 0 0 0 223 3.0 59 27 5 1 1 0 0 1 0 226 5.0 115 53 5 2 0 1 0 1 0 226 3.0 63 29 7 2 0 1 0 0 0 228 0.0 0 0 5 3 0 0 1 0 0 226 0.0 0 0 5 3 0 0 1 0 0 227 0.0 0 0 5 3 0 0 1 0 0 225 4.0 81 37 7 2 0 1 0 1 0 227 3.0 79 36 6 2 0 1 0 0 0 227 2.5 34 16 6 3 0 0 1 0 0 228 4.0 76 35 6 2 0 0 0 1 0 227 2.5 76 35 7 3 0 0 1 0 0 231 3.0 112 52 7 1 1 0 0 1 0 228 3.0 49 22 5 1 1 0 0 1 0 227 3.0 60 28 7 1 1 0 0 1 0 229 3.0 52 24 6 3 0 0 1 0 0 228 3.0 56 26 8 1 1 0 0 0 0 229 3.0 60 27 7 1 1 0 0 0 0 229 4.0 72 33 5 1 1 0 0 1 0 225 3.0 61 28 7 2 0 1 0 1 0 223 4.0 49 23 5 1 1 0 0 1 0 225 5.0 150 69 5 3 0 0 1 0 0 227 3.0 57 26 6 1 1 0 0 0 0 227 3.0 43 20 5 2 0 1 0 0 0 2

THE EFFECT OF LAND FACTORS AND MANAGEMENT PRACTICES ON RICE YIELDS IN CYILI INLAND VALLEY, RWANDA
67
T_Urear A_Urea Urea- ha N-ha T_INC_U Lev_W_U U_wet U_1/2wet U_dry DCAPP RatC GarB60 3.0 73 34 5 1 1 0 0 0 0 222 3.0 57 26 5 2 0 1 0 1 0 225 3.0 96 44 6 1 1 0 0 0 0 224 3.0 56 26 6 3 0 0 1 0 0 225 3.0 161 74 7 2 0 1 0 1 0 225 0.0 0 0 6 1 1 0 0 0 0 230 4.0 59 27 6 1 1 0 0 0 0 225 4.0 119 55 6 2 0 1 0 1 0 225 4.0 108 50 6 3 0 0 1 1 0 230 4.0 76 35 5 2 0 1 0 1 1 229 4.0 67 31 5 3 0 0 1 1 0 229 4.0 77 35 7 2 0 1 0 1 0 231 4.0 93 43 5 2 0 1 0 1 0 229 2.5 47 22 6 1 1 0 0 0 0 228 2.5 56 26 7 1 1 0 0 0 0 228 3.0 63 29 7 1 1 0 0 0 0 235 2.5 52 24 6 3 0 0 1 0 0 228 2.5 39 18 7 3 0 0 1 0 0 229 2.5 37 17 6 2 0 1 0 1 0 224 5.0 133 61 5 1 1 0 0 1 0 237 4.0 123 57 7 1 1 0 0 1 0 242 5.0 90 41 7 1 1 0 0 1 1 237 5.0 85 39 5 2 0 1 0 1 0 235 5.0 155 71 5 3 0 0 1 0 0 237 3.0 63 29 7 3 0 0 0 0 0 235 3.0 62 29 6 3 0 0 0 0 0 235 3.0 65 30 7 2 0 1 0 1 0 240 3.0 38 17 6 2 0 1 0 1 0 232 5.0 125 58 6 2 0 1 0 1 0 233 3.0 62 28 6 3 0 0 1 0 0 232 3.0 59 27 7 3 0 0 1 1 0 233 3.0 61 28 7 1 1 0 0 0 0 238 3.0 44 20 5 1 1 0 0 1 0 230 3.0 55 25 7 2 0 1 0 1 0 2

THE EFFECT OF LAND FACTORS AND MANAGEMENT PRACTICES ON RICE YIELDS IN CYILI INLAND VALLEY, RWANDA
68
WAR PWSH PW-T PW-VPW-HF WS CroAP PLaSM1 PLaSM2 PTuD PGLH SB P_DM N_Def W_Di
3 TV 1 1 0 1 M 20 18 25 1 10 1 1 14 T 1 1 0 1 E 15 20 30 1 25 1 1 12 TV 1 1 0 1 M 15 20 30 1 25 1 1 23 TVHF 1 1 1 1 P 15 25 30 1 25 1 1 13 TVHF 1 1 1 1 P 20 15 40 1 10 1 1 11 T 1 0 0 1 E 20 15 0 0 0 0 0 25 THF 1 0 1 1 P 25 15 30 1 20 1 1 11 NSH 0 0 0 0 E 20 20 0 0 0 0 0 34 THF 1 0 1 1 M 20 15 25 1 30 1 1 22 THF 1 0 1 1 M 15 18 25 1 20 1 1 22 THF 0 0 0 1 M 20 15 0 1 0 0 0 22 TVHF 1 1 1 1 P 25 18 40 1 20 1 1 14 TV 1 1 0 1 P 25 20 30 1 30 1 1 11 NSH 0 0 0 0 M 15 20 25 1 0 0 0 21 NSH 0 0 0 0 E 25 15 0 0 0 0 0 33 NSH 0 0 0 0 P 20 16 30 1 10 1 1 13 VHF 0 1 1 1 M 20 15 15 1 20 1 1 22 T 1 0 0 1 M 20 15 30 1 25 1 1 22 T 1 0 0 1 M 20 20 25 1 0 0 1 21 T 1 0 0 1 M 20 25 0 0 0 0 0 24 TV 1 1 0 1 P 20 15 30 1 30 1 1 14 THF 1 0 1 1 P 20 15 30 1 20 1 1 14 THF 1 0 1 1 P 20 15 30 1 20 1 1 12 NSH 0 0 0 0 M 20 25 25 1 0 0 1 13 THF 1 0 1 1 P 20 20 30 1 0 0 1 11 THF 1 0 1 1 E 20 25 0 0 0 0 1 23 TV 1 0 0 1 E 20 20 20 1 0 0 1 23 V 0 1 0 1 E 20 25 20 1 10 1 1 22 NSH 0 0 0 0 M 20 20 20 1 10 1 1 23 TV 1 1 0 1 M 20 20 20 1 20 1 1 21 NSH 0 0 0 0 E 15 20 10 1 10 0 0 23 NSH 0 0 0 0 E 20 20 0 0 0 0 0 23 NSH 0 0 0 0 M 20 20 25 1 10 1 1 23 TVHF 1 1 1 1 P 20 20 30 1 25 1 1 12 T 1 0 0 1 M 25 20 25 1 20 1 1 13 TV 1 1 0 1 P 25 20 30 1 20 1 1 11 TV 0 0 0 1 M 20 20 0 0 0 0 0 31 NSH 0 0 0 0 M 20 20 0 0 0 0 1 33 VHF 0 1 1 1 P 20 15 30 1 20 1 1 11 NSH 0 0 0 0 E 20 15 10 1 10 1 1 34 T 1 0 0 1 P 15 15 30 1 25 1 1 13 TVHF 1 1 1 1 M 20 15 20 1 20 1 1 12 TVHF 1 1 0 1 M 20 15 25 1 0 0 0 12 TV 1 1 0 1 P 25 15 30 1 25 1 1 13 TV 1 1 0 1 P 20 15 30 1 20 1 1 12 THF 0 1 1 1 M 20 15 20 1 20 1 1 22 VHF 1 0 1 1 M 15 15 20 1 0 0 1 22 THF 0 0 0 0 M 20 15 0 0 0 0 1 21 NSH 0 0 0 0 E 20 15 0 0 0 0 0 32 TV 1 1 0 1 M 20 20 30 1 20 1 1 33 TV 1 1 0 1 P 25 20 30 1 0 0 1 11 THF 1 0 1 1 M 20 20 15 1 0 0 1 31 HF 0 1 1 1 M 20 20 0 0 0 0 1 3

THE EFFECT OF LAND FACTORS AND MANAGEMENT PRACTICES ON RICE YIELDS IN CYILI INLAND VALLEY, RWANDA
69
WAR PWSH PW-T PW-VPW-HF WS CroAP PLaSM1 PLaSM2 PTuD PGLH SB P_DM N_Def W_Di1 VHF 0 1 1 1 M 15 15 0 0 0 0 0 31 V 1 0 0 1 M 20 20 0 0 0 0 1 32 TV 1 1 0 1 M 20 20 25 1 10 1 1 33 TV 1 1 0 1 P 15 20 50 1 20 1 1 11 T 0 1 0 1 E 20 20 15 1 0 0 1 32 V 0 0 1 1 M 20 20 15 1 0 0 1 31 HF 1 0 0 0 M 20 20 15 1 0 0 1 31 NSH 0 0 0 0 E 20 20 25 1 0 0 1 31 NSH 0 0 0 0 E 20 20 15 1 0 0 1 32 NSH 0 0 0 0 E 20 20 0 0 0 0 0 32 NSH 0 0 0 0 E 20 15 0 0 0 0 0 32 NSH 0 0 0 1 E 20 15 10 1 0 0 1 32 NSH 0 0 0 0 E 20 15 15 1 0 0 1 33 TV 1 1 0 1 P 20 15 30 1 20 1 1 13 TV 1 1 0 1 P 15 15 30 1 20 1 1 12 THF 1 0 1 1 M 20 15 30 1 20 1 1 33 THF 1 0 1 1 P 20 15 30 1 20 1 1 13 TV 1 1 0 1 P 20 15 30 1 20 1 1 11 NSH 0 0 0 0 E 20 15 0 0 0 0 1 32 T 1 0 0 1 M 20 15 20 1 0 0 0 31 T 1 0 0 1 M 20 15 20 1 10 1 1 32 THF 1 0 1 1 M 20 15 10 1 0 0 1 32 HF 0 0 1 1 E 20 15 10 1 20 1 1 33 VHF 1 0 1 1 P 20 15 30 1 20 1 1 13 THF 1 1 0 1 P 20 15 35 1 15 1 1 12 TV 1 1 0 1 M 20 15 25 1 10 1 1 13 TVHF 1 1 1 1 P 20 20 30 1 10 1 1 11 NSH 0 0 0 0 E 20 20 0 1 10 1 0 21 NSH 0 0 0 0 E 20 20 0 0 0 0 0 35 TV 1 1 0 1 M 20 20 30 1 20 1 1 25 TV 1 1 0 1 P 20 20 30 1 20 1 1 13 TV 1 1 0 1 E 20 20 10 1 20 1 1 22 V 0 1 0 1 M 20 20 25 1 10 1 1 21 NSH 0 0 0 0 E 20 20 0 0 10 1 0 3

THE EFFECT OF LAND FACTORS AND MANAGEMENT PRACTICES ON RICE YIELDS IN CYILI INLAND VALLEY, RWANDA
70
P_Cy P_Az P_CS None Little Lots HD HDr Pro E_Pro Pro_EPro Yield0 0 N 1 0 0 2-Jun 148 120 180 60 35500 0 N 1 0 0 30-Jun 166 154 180 26 27070 1 N 1 0 0 25-Jun 151 150 220 70 35550 0 N 1 0 0 30-Jun 164 90 100 10 23320 0 N 1 0 0 30-Jun 166 50 80 30 11680 1 N 1 0 0 2-Jun 156 250 300 50 47080 0 N 1 0 0 30-Jun 156 185 250 65 27611 3 N 1 0 0 15-Jun 151 210 250 40 74730 0 N 1 0 0 28-Jun 154 200 250 50 33610 0 N 1 0 0 30-Jun 164 250 300 50 31250 1 L 0 1 0 20-Jun 174 200 250 50 49630 0 N 1 0 0 30-Jun 169 120 150 30 19480 0 N 1 0 0 30-Jun 166 120 200 80 20690 0 L 0 1 0 30-Jun 164 30 60 30 28301 3 LL 0 0 1 30-Jun 156 250 300 50 57741 3 N 1 0 0 30-Jun 171 40 100 60 10150 0 N 1 0 0 25-Jun 166 200 200 0 39680 1 L 0 1 0 5-Jul 176 130 150 20 30230 0 N 1 0 0 10-Jun 146 170 200 30 33860 1 N 1 0 0 10-Jun 146 200 250 50 49880 0 N 1 0 0 30-Jun 166 120 150 30 28100 0 N 1 0 0 28-Jun 164 140 150 10 27130 0 L 0 1 0 25-Jul 160 150 200 50 25950 0 N 1 0 0 25-Jul 160 200 250 50 41410 0 N 1 0 0 25-Jul 160 150 150 0 21930 0 N 1 0 0 25-Jul 160 200 250 50 45560 0 N 1 0 0 28-Jul 163 180 220 40 37040 0 N 1 0 0 28-Jul 163 50 70 20 35710 0 L 0 1 0 25-Jul 160 150 200 50 36670 1 N 1 0 0 25-Jul 160 135 140 5 30820 0 N 1 0 0 30-Jun 163 300 350 50 58590 1 N 1 0 0 30-Jun 166 200 250 50 46080 0 N 1 0 0 30-Jun 166 150 200 50 31250 0 N 1 0 0 25-Jun 161 120 150 30 20300 0 L 0 1 0 25-Jun 161 180 200 20 29560 0 N 1 0 0 20-Jun 156 60 80 20 27271 3 N 1 0 0 20-Jun 157 350 400 50 70561 3 L 0 1 0 22-Jun 159 200 200 0 52360 0 L 0 1 0 22-Jun 159 200 250 50 26991 2 N 1 0 0 22-Jun 159 300 350 50 57030 0 N 1 0 0 22-Jun 159 80 100 20 24460 0 N 1 0 0 22-Jun 159 100 100 0 37450 0 N 1 0 0 22-Jun 159 250 250 0 40650 0 N 1 0 0 20-Jun 156 150 300 150 29940 0 N 1 0 0 20-Jun 156 130 150 20 22570 0 N 1 0 0 20-Jun 157 180 250 70 33330 0 N 1 0 0 21-Jun 158 200 250 50 39761 3 N 1 0 0 20-Jun 157 250 300 50 44801 1 N 1 0 0 1-Jun 157 400 400 0 81631 3 N 1 0 0 18-Jun 174 250 250 0 30710 0 N 1 0 0 15-Jun 171 100 100 0 29941 3 N 1 0 0 20-Jun 176 210 220 10 40001 3 N 1 0 0 20-Jun 176 300 300 0 43351 3 L 0 1 0 10-Jun 165 180 200 20 44011 1 N 1 0 0 20-Jun 175 250 300 50 4717

THE EFFECT OF LAND FACTORS AND MANAGEMENT PRACTICES ON RICE YIELDS IN CYILI INLAND VALLEY, RWANDA
71
P_Cy P_Az P_CS None Little Lots HD HDr Pro E_Pro Pro_EPro Yield1 3 L 0 1 0 10-Jun 165 180 200 20 44011 1 N 1 0 0 20-Jun 175 250 300 50 47171 3 N 1 0 0 20-Jun 175 120 150 30 38340 0 N 1 0 0 10-Jun 158 80 100 20 15041 3 L 0 1 0 5-Jun 153 100 150 50 53761 1 N 1 0 0 5-Jun 153 200 220 20 34841 3 L 0 1 0 5-Jun 153 250 280 30 37041 3 N 1 0 0 5-Jun 153 150 220 70 44641 1 N 1 0 0 5-Jun 153 200 250 50 53911 3 N 1 0 0 5-Jun 153 350 350 0 66291 3 N 1 0 0 5-Jun 153 300 350 50 49921 3 N 1 0 0 5-Jun 153 350 380 30 67441 1 N 1 0 0 5-Jun 153 220 280 60 51040 0 N 1 0 0 5-Jun 153 150 180 30 28360 0 N 1 0 0 10-Jun 157 120 150 30 27091 3 N 1 0 0 10-Jun 157 150 200 50 31380 0 L 0 1 0 10-Jun 157 100 150 50 20660 0 L 0 1 0 10-Jun 157 150 200 50 23511 3 N 1 0 0 10-Jun 157 400 400 0 59171 2 L 0 1 0 10-Jun 157 150 200 50 39891 3 N 1 0 0 5-Jun 152 125 150 25 38461 2 N 1 0 0 4-Jun 151 240 250 10 43011 3 N 1 0 0 10-Jun 155 260 300 40 44290 0 N 0 0 0 16-Jun 161 80 100 20 24840 0 L 0 1 0 2-Jun 147 150 180 30 31380 1 N 1 0 0 10-Jun 155 160 200 40 33200 0 N 1 0 0 5-Jun 150 120 150 30 25920 0 N 1 0 0 5-Jun 153 400 450 50 50381 3 N 1 0 0 4-Jun 152 300 400 100 75000 0 N 1 0 0 6-Jun 154 150 200 50 30930 1 N 1 0 0 5-Jun 153 120 120 0 23480 0 N 1 0 0 5-Jun 153 160 180 20 32720 0 N 1 0 0 5-Jun 153 300 350 50 43671 2 N 1 0 0 5-Jun 153 300 350 50 5484

THE EFFECT OF LAND FACTORS AND MANAGEMENT PRACTICES ON RICE YIELDS IN CYILI INLAND VALLEY, RWANDA
72
Appendix 4: Significance of parameters used for multiple regressions
Standardized Coefficients
B Std. Error Beta Lower Bound Upper Bound(Constant) 5,112.759 967.089 5.287 0.000 3,185.792 7,039.726ssuitwat 701.919 219.939 0.276 2.318 0.023 71.682 948.156
war -196.188 111.473 -0.139 -1.760 0.083 -418.303 25.927ptud -61.982 11.322 -0.436 -4.415 0.000 -72.541 -27.422
noweedin -238.360 172.996 -0.130 -1.378 0.172 -583.063 106.343n_wet 256.869 642.425 0.087 0.400 0.690 -1,023.190 1,536.928
N_1/2wet 904.037 619.149 0.290 1.460 0.148 -329.644 2,137.718n_dry 177.341 402.429 0.052 0.441 0.661 -624.515 979.198u_wet 180.900 524.263 0.061 0.345 0.731 -863.718 1,225.517
U_1/2wet -58.990 427.718 -0.019 -0.138 0.891 -911.238 793.257u_dry 89.890 397.386 0.027 0.226 0.822 -701.918 881.699p_h -181.557 110.896 -0.105 -1.637 0.106 -402.522 39.408
1Model
Unstandardized Coefficients
t Sig.
95% Confidence Interval for B