the effect of interbranch spacing on structural and ... · the effect of interbranch spacing on...
TRANSCRIPT

The effect of interbranch spacing on structural and rheological propertiesof hyperbranched polymer melts
Tu C. Le,1 B. D. Todd,1,a� P. J. Daivis,2 and A. Uhlherr3
1Centre for Molecular Simulation, Swinburne University of Technology, P.O. Box 218, Hawthorn,Victoria 3122, Australia2School of Applied Sciences, RMIT University, GPO Box 2476V, Melbourne, Victoria 3001, Australia3CSIRO Information Management and Technology, Private Bag 33, Clayton South, Victoria 3169, Australia
�Received 24 July 2009; accepted 21 September 2009; published online 22 October 2009�
Nonequilibrium molecular dynamics simulations were performed for a family of hyperbranchedpolymers of the same molecular weight but with different chain lengths between branches.Microscopic structural properties including mean squared radius of gyration, distribution of beadsfrom the center of mass and from the core and the interpenetration function of these systems werecharacterized. A relationship between the zero shear rate mean squared radius of gyration and theWiener index was established. The molecular and bond alignment tensors were analyzed tocharacterize the flow birefringence of these hyperbranched polymers. The melt rheology was alsostudied and the crossover from the Newtonian to non-Newtonian behavior was captured for allpolymer fluids in the considered range of strain rates. Rheological properties including the shearviscosity and normal stress coefficients obtained from constant pressure simulations were found tobe the same as those from constant volume simulations except at high strain rates due to sheardilatancy. A linear dependence of zero shear rate viscosities on the number of spacer units wasfound. The stress optical rule was shown to be valid at low strain rates with the stress opticalcoefficient of approximately 3.2 independent of the topologies of polymers. © 2009 AmericanInstitute of Physics. �doi:10.1063/1.3247191�
I. INTRODUCTION
In comparison with other classes of materials, polymershave one of the widest ranges of applications such as coat-ings, additives, drug and gene delivery, macromolecularbuilding blocks, nanotechnology, and supramolecularscience.1 The main key to a large number of applications ofpolymers is their special properties, which strongly dependon the molecular topologies. Based on the architecture, poly-mers are classified as linear, branched, or cross-linked poly-mers. Among these, branched polymers can be further clas-sified as graft, star, comb, or dendritic polymers. Thebranched polymers that have the most complex architectureare dendritic polymers including dendrimers and hyper-branched polymers. Dendrimers are perfectly branched tree-like structures whereas hyperbranched polymers have incom-pletely or irregularly branched topologies. Therefore,modeling dendrimers is less complicated as the structure iswell-defined while simulations of hyperbranched polymersface difficulties as for a given number of monomers, there isa large number of possible architectures of hyperbranchedpolymers.
As reported in our previous paper,2 there have been afew papers3–8 on hyperbranched polymer simulations usingMonte Carlo or Brownian dynamics techniques. Howeveronly the randomly branched architecture of hyperbranchedpolymers was modeled and rheological properties of thepolymer solution were analyzed. In experiments, although
the melts of some hyperbranched polymers have beenstudied,9 the architecture of these polymers is also randomlybranched due to the difficulties in the synthesis of well-defined dendritic polymers. Recently, dendronized polymerswith well-defined structures comprising a linear backboneand attached units of dendrons have been synthesized andmodeled10 but the melt rheology of these systems has notbeen studied. Therefore our aim in this paper is to studysome controlled specific architectures of hyperbranchedpolymers and the effect of branching topology on the meltrheology. The effect of linear spacers on the rheology ofdendritic polymers in solution has been studied experimen-tally for branched aromatic etherimide copolymers11 andtheoretically for bead-spring-dumbbell model perfectlybranched polymers using Brownian dynamics techniques12
and generalized Gaussian structure—an extension of theRouse model—for hyperbranched polymers.13 It has beenfound that spacer length/number of spacer units is an impor-tant architecture parameter that directly affects the rheologyof hyperbranched polymer solutions. In this work, nonequi-librium molecular dynamics �NEMD� simulations were per-formed for a family of hyperbranched polymer melts withthe same molecular weight but different numbers of spacerunits using coarse-grained14 uniform beads. The molecularweight of all hyperbranched polymers studied was chosen tobe the same as that for perfect trifunctional dendrimers ofgeneration 4. The total number of beads in dendrimers can becalculated as Ns= fb��f −1�g+1−1� / �f −2�+1 where f is thefunctionality of end groups, b is the number of monomers inthe chain units, and g is the generation number.15 With thea�Electronic mail: [email protected].
THE JOURNAL OF CHEMICAL PHYSICS 131, 164901 �2009�
0021-9606/2009/131�16�/164901/12/$25.00 © 2009 American Institute of Physics131, 164901-1
Downloaded 13 Jan 2010 to 136.186.72.210. Redistribution subject to AIP license or copyright; see http://jcp.aip.org/jcp/copyright.jsp

choice of f =3 and b=2, dendrimers of generation 4 willhave 187 beads. Structural and rheological properties of thisdendrimer as well as a linear chain of equivalent molecularweight were reported previously.15,16 In order to compare oursimulation data with those polymers, different trifunctional�f =3� hyperbranched polymers with the same number ofbeads per molecule were modeled. All polymers have oneimperfect branching point with the functionality of endgroups f =2. Hyperbranched polymers of type A have twobeads in the chain units �b=2� while polymers of type B, C,and D have three, four, and five beads, respectively, in thechain units. The schematic configuration of these hyper-branched polymers is presented in Fig. 1.
The remainder of this paper is organized as follows. Sec-tion II describes the methodology employed consisting ofisothermal-isobaric �NpT� and isothermal-isochoric �NVT�NEMD algorithms. Section III A presents the results and adiscussion of the structural properties of hyperbranchedpolymers with different architectures, including meansquared radii of gyration, distribution of mass, and the inter-penetration function. Section III B focuses on the flow bire-fringence effect for these hyperbranched polymers with dif-ferent spacer lengths. Rheological properties such as theshear viscosity and first and second normal stress coefficientsare shown in Sec. III B. Some conclusions are presented inthe final section.
II. METHODOLOGY
The models of hyperbranched polymers were built usingbeads with Weeks–Chandler–Anderson17 �WCA� intermo-lecular interaction and finitely extensible nonlinear elastic�FENE� �Ref. 18� bond potential. Nonbonded beads onlyhave the WCA potential interaction, which is the Lennard-Jones potential truncated at the position of the minimum andshifted to eliminate the discontinuity, whereas bonded beadshave both FENE and WCA interactions. Details of these po-tentials can be found in our previous paper.2 In the remainderof this paper, all quantities are expressed in terms of sitereduced units in which the reduction parameters are theLennard-Jones interaction parameters � and � and the mass,mi�, of bead � in molecule i. The reduced temperature isgiven by T�=kBT /� where kB is the Boltzmann constant, thedensity is given by ��=��3, the pressure tensor by P�
=P�3 /�, and strain rate by ��= �mi��2 /��1/2�. For simplicityof notation, the asterisk will be omitted hereafter.
To simulate fluids under shear, the molecular version ofthe SLLOD algorithm19 was applied. The reasons for usingthis version of the SLLOD algorithm have been discussedextensively elsewhere.20 To maintain the constant tempera-ture of simulations, the kinetic energy of the system has beenconstrained using the molecular version of the Gaussian iso-kinetic thermostat, which is derived from Gauss’s principleof least constraint. The equations of motion for bead � inmolecule i are given as
ri� =pi�
mi�+ ri · �u ,
�1�pi� = Fi� − �mi�/Mi�pi · �u − ��mi�/Mi�pi,
where ri� and pi� represent the position and thermal momen-tum of bead � in molecule i, �u is the velocity gradienttensor, ri=��=1
N� mi�ri� /Mi is the position of the center ofmass of molecule i, Fi� is the intermolecular force on bead �in molecule i, Mi=��=1
N� mi� is the mass of molecule i, pi
=��=1N� pi� is the momentum of the center of mass of molecule
i and �=�i=1N ��=1
Ns Fi� ·pi− ��i=1N pixpiy /�i=1
N pi2 is the thermo-
stat constraint multiplier.All NVT simulations in this work were performed at
constant volume at a reduced temperature of 1.25 and thereduced bead density of 0.84.
In order to keep the polymer systems at constant pres-sure in NpT NEMD simulations, the Nosé–Hoover integralfeedback mechanism was implemented.21 The equations ofmotion are defined as
ri� =pi�
mi�+ ri · �u + �ri,
pi� = Fi� − �mi�/Mi�pi · �u − ��mi�/Mi�pi − ��mi�/Mi�pi, �2�
V = 3�V .
The multiplier � can be obtained by solving the differ-ential equation given by
� =�p − p0�VQNkBT
, �3�
where Q is a damping factor, p0 is the required pressure, andp is the instantaneous isotropic pressure. In this work, Q waschosen to be 1000 to minimize the effect of unphysical os-cillations of volume, pressure, or atomic temperature causedby coupling the simulated system to the barostat, hence themelts were allowed to relax to compensate for the flow-induced changes in the pressure. All simulations were per-formed at the required pressure p0 of 5.42, which is the equi-librium pressure of the generation 2 dendrimer melt at thedensity of 0.84 in our previous study.22
The equations of motion of the beads were integratedwith time step �t=0.001 in reduced units using a fifth-orderGear predictor corrector ordinary differential equationsolver.23 After the hyperbranched polymer systems of 125molecules generated at low density had been compressed to
FIG. 1. Schematic architectures of hyperbranched polymers with differentnumbers of spacers.
164901-2 Le et al. J. Chem. Phys. 131, 164901 �2009�
Downloaded 13 Jan 2010 to 136.186.72.210. Redistribution subject to AIP license or copyright; see http://jcp.aip.org/jcp/copyright.jsp

the required density, they were equilibrated for 1�106 time-steps and the pressure or density was plotted against time tocheck if the system had reached the steady state. Twentyseparate production simulations, each consisting of 1�106
time-steps, are then performed for every system. The meansand standard errors were evaluated from results of all theseparate runs.
III. RESULTS AND DISCUSSION
A. Structural properties
As stated above, a group of four hyperbranched poly-mers of the same molecular weight was modeled usingcoarse-grained uniform beads. Typical instantaneous con-figurations of these hyperbranched polymers are shown inFig. 2. As mentioned above, simulated trifunctional hyper-branched polymers have one imperfect branching point withthe functionality of end groups f =2. They all have the samedegree of polymerization N of 187 as for a perfect dendrimerof generation 4. The only difference in their architectures isthe number of spacer units. Hyperbranched polymers of typeA have the number of spacer units b=2 while polymers oftype B, C, and D have that of three, four, and five, respec-tively. Two structural parameters, the degree of branchingand the Wiener index, were computed for these systems andresults are shown in Table I.
The degree of branching, which is defined as B=2D / �2D+L� where D is the number of fully branchedbeads and L is the number of partially reacted beads,24 wascalculated for the simulated hyperbranched polymers. Thevalue of the degree of branching varies from 0 for linearpolymers to 1 for dendrimers or fully branched hyper-branched polymers. As all simulated systems have only one
imperfect branching point, the value of L is always 1. Hy-perbranched polymers of type A and B have the same num-ber of fully branched beads of 61, hence they have the samedegree of branching of 0.992. Polymers of type C and Dhave the same number of fully branched beads of 30. There-fore they have the same degree of branching of 0.9836. Thesame values of the degree of branching for different hyper-branched polymers indicate that the degree of branching onlycharacterizes the extent of unbranched content within a hy-perbranched molecule and does not fully describe the archi-tecture of the systems. This is in agreement with many otherreports5–8 on hyperbranched polymers.
In addition to the degree of branching, the Wiener index,defined as W=1 /2� j=1
Ns �i=1Ns dij where Ns is the number of
beads per molecule and dij is the number of bonds separatingbead i and j of the molecule,6 was calculated to characterizethe topologies of simulated hyperbranched polymers ingreater detail. This parameter only describes the connectivityand is not a direct measure of the size of the molecules. Forpolymers of the same molecular weight, linear chain has thelargest value of W whereas star polymer with branch lengthof 1 and the core functionality of Ns−1 has the smallestvalue of W. In this work, the Wiener index is largest for thetype D system, which has the longest linear chain in betweenbranching points �spacer length b=5� and smallest for thetype A system which has the shortest linear chain betweenbranching points �b=2�. With increasing number of spacerunits from 2 to 5, the values of the Wiener index for hyper-branched polymers comprising 187 beads increase and fall inthe range between 246 388 and 387 540. Systems withhigher Wiener index or higher number of spacer units havemore open structures and larger topological separation ofbeads.
Figure 3 presents the mean squared radius of gyration,which can be calculated as shown in Eq. �4�, for hyper-branched polymers with different spacers,
�Rg2� � ��=1
Ns m��r� − rCM� · �r� − rCM���=1
Ns m� , �4�
where the angular brackets denote an ensemble or time av-erage, r� is the position of bead �, and rCM is the position ofthe molecular center of mass. At low strain rates, the value of
FIG. 2. Typical configurations of simulated hyperbranched polymers com-posed of 187 beads and different numbers of spacer units: Type A �b=2�,Type B �b=3�, Type C �b=4�, and Type D �b=5�.
TABLE I. Degree of branching and Wiener index for different hyper-branched polymer architectures simulated.
Type ofhyperbranchedpolymers Degree of branching Wiener index
A 0.9920 246 388B 0.9920 306 244C 0.9836 349 972D 0.9836 387 540
FIG. 3. Dependence of the radius of gyration on strain rate for hyper-branched polymers with different number of spacer units.
164901-3 NEMD hyperbranched polymers J. Chem. Phys. 131, 164901 �2009�
Downloaded 13 Jan 2010 to 136.186.72.210. Redistribution subject to AIP license or copyright; see http://jcp.aip.org/jcp/copyright.jsp

�Rg2� remains constant while at high strain rates where mol-
ecules are stretched, �Rg2� increases rapidly. Furthermore as
type A molecules have the most dense and rigid structurewhile type D molecules have the most open and flexiblearchitecture, the radius of gyration rises the least steadily fortype A hyperbranched polymers and the most steadily fortype D polymers. The ratio of the radii of gyration at strainrates of 0.0001 and 0.1 is 1.34 for type A, 1.52 for type B,1.81 for type C, and 2.08 for type D polymers. In addition,hyperbranched polymers of type A have the most compactarchitecture with the least extension of molecules in space asseen from Wiener index, hence at a given strain rate, theradius of gyration is lowest, whereas hyperbranched poly-mers of type D with the most spatial separation of beadshave the highest value of the radius of gyration. Data for theradii of gyration for different hyperbranched polymers werefitted using the Carreau– Yasuda equation25 �Rg
2�= �Rg2�0 / �1
+ �Rg��2�mRg where �Rg
2�0 is the zero shear rate squared ra-dius of gyration, Rg
is a time constant, and mRgis the power
law exponent. Results for the zero shear rate radii of gyrationwere plotted against the Wiener index as shown in Fig. 4. Anexponential function gives a very good fit to the zero shearrate mean square radius of gyration. The dependence of �Rg
2�0
on the Wiener index was found to be �Rg2�0=65�16�−87�7�
�e−W/�39�16��104� where the number in brackets shows thestatistical uncertainty from the standard error of the fit. If apower law function is used to fit the �Rg
2�0 data, the zeroshear rate mean squared radius of gyration scales as �Rg
2�0
W1.20�6�. The power law exponent of 1.20�6� for these hy-perbranched polymers in NEMD simulations is close to thevalue of 1.0 found for phantom chains neglecting long-rangeexcluded volume interactions and the correction terms in thecalculation of the end-to-end distance between twosegments.8 Brownian dynamics simulations5,6 which takeinto account the excluded volume and hydrodynamic inter-actions also showed a power law exponent of approximately1.0 for hyperbranched polymers of different molecularweights. Specifically the Brownian dynamics results showedthat the zero shear rate radius of gyration scales as �Rg�0
�W0.5Ns−0.85, which means that the squared radius of gyra-
tion scales as �Rg2�0�W�Ns
−1.7. It is interesting that this re-
lationship for hyperbranched polymers is very similar to thatfor linear chains in good solvents �Rg
2�0�W�Ns−1.824, which
results from W�Ns3 for linear polymers and �Rg�0�Ns
0.588
for linear molecules in good solvents.26 In ideal solvents ormelts, the squared radius of gyration for linear polymersscales as �Rg
2�0�Ns, hence the relationship between W, Rg,and Ns is expected to be �Rg
2�0�W�Ns−2.0. Taken together
these results show that more work is needed to clarify therelationship between W, Rg, and Ns, especially for polymermolecules with short branches.
Figure 5 presents the distribution of beads from the mo-lecular center of mass, which is defined as
gCM�r� =��i=1
N ��=1Ns ���r − �ri� − rCM����
N, �5�
where N is the number of molecules, ri� is the position ofbead � in molecule i, and rCM is the position of the center of
FIG. 4. Dependence of zero shear rate radii of gyration on Wiener index fordifferent hyperbranched polymers of the same molecular weight �the solidline representing fitting with the exponential function�.
FIG. 5. Distribution of mass from the center of mass for �a� different hy-perbranched polymers at strain rate of 0.0001, �b� different hyperbranchedpolymers at strain rate of 0.02, and �c� hyperbranched polymer of type B atstrain rate of 0.0001 and 0.02.
164901-4 Le et al. J. Chem. Phys. 131, 164901 �2009�
Downloaded 13 Jan 2010 to 136.186.72.210. Redistribution subject to AIP license or copyright; see http://jcp.aip.org/jcp/copyright.jsp

mass, for hyperbranched polymers of the same molecularweight. With increasing number of spacer units, the distribu-tion of mass becomes broader and the average distance ofbeads from the center of mass increases. This is in accor-dance with the topologies of hyperbranched polymer systemssimulated. Furthermore the shear-induced behavior of thedistribution of mass for different hyperbranched polymersshows a similar trend. At higher strain rates, the curves be-come wider and the peaks shift toward larger distance asmolecules are stretched under shear flow. This behavior wasalso observed in Brownian dynamics simulations for chargedhyperbranched polymers.4
In addition to the distribution of beads from the center ofmass, another form of intramolecular radial distributionfunction has been used. The distribution of beads from thecentral bead �the core�, defined as
gcore�r� =��i=1
N ��=2Ns ���r − �ri� − ri1����
N, �6�
where ri1 is the position of the core, for different hyper-branched polymers is presented in Fig. 6. Strong peaks at thedistance equal to the average bond length are observed for allsystems corresponding to the first neighbors of the core. Thesame height of these peaks for different hyperbranched poly-mers is due to the same number of beads around the core inthe innermost shell of the molecules. In contrast, in the outershells of the molecules, the separation of beads around thecore is lowest for the system of type A and highest for thesystem of type D. Therefore the distribution of beads fromthe core is the most narrow for type A polymers and broadestfor type D polymers. Similar to the radial distribution ofbeads from the center of mass, the distribution of beads fromthe core for all hyperbranched polymers under shear flowbecomes wider as the molecules are stretched.
In order to characterize the penetration of the volumeoccupied by the molecule by beads of other molecules, thepenetration function, defined as
ginter�r� =��i=1
N � j�iN ��=1
Ns ���r − �r j� − ri1����4�r2N
, �7�
where ri1 is the position of the core of molecule i and r j� isthe position of bead � in molecule j, was used and results areshown in Fig. 7. It can be clearly seen that the penetrationfunction for hyperbranched polymers increases with the in-crease in the number of spacer units. The system of type Ahas the lowest penetration function while the system of typeD has the highest penetration function. This is because poly-mer molecules with longer linear chains between branchingpoints are more open and freely accessible by beads of othermolecules whereas polymers with short chains betweenbranching points have more compact structures, which re-duce the probability of finding parts of other molecules in theinterior of a polymer molecule. Furthermore, under shearflow, the interpenetration increases with the increase in strainrate as molecules are stretched and become more open, henceparts of other molecules can gain access closer to the core ofthe hyperbranched polymer molecule.
B. Flow birefringence
In order to characterize the flow birefringence effect forhyperbranched polymer structures, the molecular and bondalignment tensors were computed. The form birefringence isthe birefringence caused by the alignment of the whole mol-ecules. This can be characterized by the molecular alignmenttensor defined as Sm= ��i=1
N �uiui−1 /3I��, where N is the totalnumber of molecules, ui is the unit vector denoting the ori-entation of single molecules, and I is the unit tensor. On theother hand, the intrinsic birefringence is the birefringencedue to the alignment of intramolecular bonds, which can becharacterized by the bond alignment tensor defined as Sb
= ��i=1N ��=1
Ns−1�ui�ui�−1 /3I�� where ui� is the unit vector be-tween adjacent beads.
Figure 8 shows the molecular alignment angle, m, andthe bond alignment angle, b, for different hyperbranchedpolymers. The molecular alignment angle is the average
FIG. 6. Distribution of mass from the core for �a� different hyperbranchedpolymers at strain rate of 0.0001, �b� different hyperbranched polymers atstrain rate of 0.02, and �c� hyperbranched polymer of type B at strain rate of0.0001 and 0.02.
164901-5 NEMD hyperbranched polymers J. Chem. Phys. 131, 164901 �2009�
Downloaded 13 Jan 2010 to 136.186.72.210. Redistribution subject to AIP license or copyright; see http://jcp.aip.org/jcp/copyright.jsp

angle between the flow direction and the molecular align-ment direction. On the other hand, the bond alignment angleis the average angle between the flow direction and the bondalignment direction. At low strain rates where polymer sys-tems are in the Newtonian regime, both molecular and bondalignment angles reach 45°. At high strain rates where sys-tems are in the non-Newtonian regime, the hyperbranchedpolymer of type A has the highest values of the alignmentangles m and b while the polymer of type D has the lowestvalues of m and b. This again can be explained by thetopologies of these systems. Type A hyperbranched polymerwith the smallest number of spacer units has the most com-pact and constrained structure. With increasing number ofspacer units, polymer architectures become less rigid, hencemolecules and bonds can stretch and align more easily withrespect to the flow field. Furthermore, at high strain rates, thebond alignment angle is always higher than the molecularalignment angle of the same polymer type.
Figure 9 presents the molecular order parameter Sm, de-fined as 3/2 of the largest eigenvalue of the molecular align-ment tensor and the bond order parameter Sb, defined as 3/2of the largest eigenvalue of the bond alignment tensor. Theother eigenvalues of the alignment tensor are about half ofthe largest eigenvalues indicating weaker ordering in theother two directions. Such ordering is consistent with theprolate ellipsoid molecular shape characterized by the eigen-values of the gyration tensor as discussed in our previouspaper.2 The order parameter of the molecular alignment ten-sor is actually a measure of the ordering of the anisotropy ofthe directors of the molecules. In all cases, the order param-eter remains constant at low strain rates and increases in highstrain rate regions. This indicates that for all hyperbranchedpolymers, the orientational ordering increases and the align-ments of molecules and bonds are more pronounced at highstrain rates. It can also be seen that with increasing numberof spacer units, the order parameter increases. The order pa-rameter for hyperbranched polymers with smaller number ofspacer units is always lower than that for polymers withlarger number of spacer units. This is because they havemore compact and constrained structures and it is more dif-ficult for the chain segments to stretch and align with respectto the flow field. Furthermore the bond order parameter isalways much lower than the molecular order parameter. Thisis due to the high level of branching of hyperbranched poly-mers and the excluded volume effect. In addition, the small-scale features are always less distorted by shear.27
FIG. 7. Comparison of the interpenetration function for �a� different hyper-branched polymers at strain rate of 0.0001, �b� different hyperbranchedpolymers at strain rate of 0.02, and �c� hyperbranched polymer of type A atstrain rate of 0.0001 and 0.02.
FIG. 8. �a� Molecular and �b� bond alignment angle for different hyper-branched polymers at different strain rates.
164901-6 Le et al. J. Chem. Phys. 131, 164901 �2009�
Downloaded 13 Jan 2010 to 136.186.72.210. Redistribution subject to AIP license or copyright; see http://jcp.aip.org/jcp/copyright.jsp

C. Rheological properties
The rheological properties of the polymer fluids undershear flow can be calculated from the components of themolecular pressure tensor,20 which is given by
PMV =�i=1
Npipi
Mi−
1
2�i=1
N
��=1
Ns
�j�i
N
��=1
Ns
rijFi�j� , �8�
where pi is the total peculiar center of mass momentum ofmolecule i, as defined by the equations of motion, rij =r j
−ri is the center of mass separation of molecules i and j,Fi�j� is the intermolecular force on bead � in molecule i dueto bead � in molecule j.
The isotropic pressure of polymeric systems under shearcan be calculated as
p = 13Tr�PM� = 1
3 �Pxx + Pyy + Pzz� . �9�
Results of the isotropic pressure for different hyperbranchedpolymers in NVT simulations are shown in Fig. 10�a�. It canbe seen that at low strain rates, the pressure of all systemsreaches a plateau while at high strain rates, the pressure in-creases rapidly. This indicates that the behavior of the isotro-pic pressure moves from the Newtonian to non-Newtonianregime. In comparison to linear and other branched poly-mers, the pressure for hyperbranched polymers shows a dif-ferent trend. A drop can be observed in the plot of pressureversus strain rate for linear, star, H, and comb-shaped poly-mer melts comprising of C100H202 molecules.28 Before therapid increase in pressure, linear molecules exhibit a pressure
drop of about 5% while the pressure of other branched poly-mers only have a small drop. The pressure data for hyper-branched polymers were fitted using the Carreau– Yasudaequation p= p0 / �1+ �p��2�mp where p0 is the zero shear ratepressure, p is a time constant from and mp is the power lawexponent. Fitting parameters are shown in Table II. As can beseen from this table, the zero shear rate isotropic pressureslightly increases with increasing number of spacer units dueto the larger spatial separation of beads. Furthermore, thecritical strain rate �critical at which the transition from New-tonian to non-Newtonian behavior of the pressure occurs canbe calculated as the inverse of p. The values of �critical werefound to be 0.06�2�, 0.07�3�, 0.09�2�, and 0.09�2� for hyper-branched polymers with the number of spacer units of 2, 3,4, and 5, respectively.
FIG. 9. Order parameter of the �a� molecular and �b� bond alignment tensorsfor different hyperbranched polymers at different strain rates.
FIG. 10. Dependence of the �a� isotropic pressure and �b� reduced beaddensity on strain rate of different hyperbranched polymers in NVT and NpTsimulations, respectively �solid lines representing fitting with the Carreau–Yasuda model�.
TABLE II. Parameters of the Carreau–Yasuda model fitted to the isotropicpressure vs strain rate dependence for NVT simulations.
Type ofhyperbranchedpolymers p0 p mp
A 5.295�6� 16.9�7� �0.46�2�B 5.334�4� 14.1�7� �0.48�3�C 5.336�9� 11�2� �0.6�1�D 5.34�1� 11�3� �0.6�3�
164901-7 NEMD hyperbranched polymers J. Chem. Phys. 131, 164901 �2009�
Downloaded 13 Jan 2010 to 136.186.72.210. Redistribution subject to AIP license or copyright; see http://jcp.aip.org/jcp/copyright.jsp

In contrast to NVT simulations with constant density andchanging pressure, NpT simulations have constant pressureand variable density. Figure 10�b� shows the reduced beaddensity as a function of shear rate in constant pressure simu-lations. It can be seen that the density reaches a plateau atlow strain rates while at high strain rates, the density fallsrapidly. This phenomenon is called shear dilatancy.29
Density data are fitted using the Carreau–Yasuda equation�=�0 / �1+ ����2�m� where �0 is the zero shear rate density,� is a time constant, and m� is the power law exponent.Results for these parameters are presented in Table III. Thetime constant for density � has lower values than that forisotropic pressure p. Therefore the critical strain rates atwhich the transition from Newtonian to non-Newtonian be-havior of the reduced bead density occurs are higher thanthose for the pressure.
From the components Pxy and Pyx of the molecularpressure tensor PM, the non-Newtonian shear viscosityof hyperbranched polymer fluids can be calculated as�=−�Pxy + Pyx� /2�. Shear viscosity data at different strainrates obtained from NpT and NVT simulations are presentedin Fig. 11. As can be seen, the shear thinning behavior iscaptured within the considered range of strain rates for hy-perbranched polymers of all types. The viscosities reach aplateau at low strain rates then decrease rapidly at high strainrates. Furthermore, the viscosities of the simulated fluids in-crease with increasing number of spacer units. Hyper-branched polymers of type A possess the lowest shear vis-cosities whereas polymers of type D have the highestviscosities. This is because hyperbranched polymers with alarger number of spacer units have longer branches and moreopen structure, which lead to more entanglement in the sys-tems and result in higher values of viscosity. However, atvery high strain rates, the trend is reversed, hyperbranchedpolymers with longer spacer length have lower viscositiesthan those with shorter spacer length. Results obtained fromNVT and NpT simulations only differ from each other athigh strain rates as they then apply to different state points.Viscosity values in the high strain rate regions obtained fromconstant pressure simulations are lower than those from con-stant volume simulations. The reason for the more pro-nounced shear thinning behavior in NpT simulations is be-cause of the “shear dilatancy”—the density decreases as theshear rate increases. However NpT and NVT simulation re-sults will be the same if the same state point is investigatedby setting the required pressure in NpT simulations equal tothe pressure obtained from NVT simulations at a given strainrate.21
Viscosity data were fitted using the Cross equation30
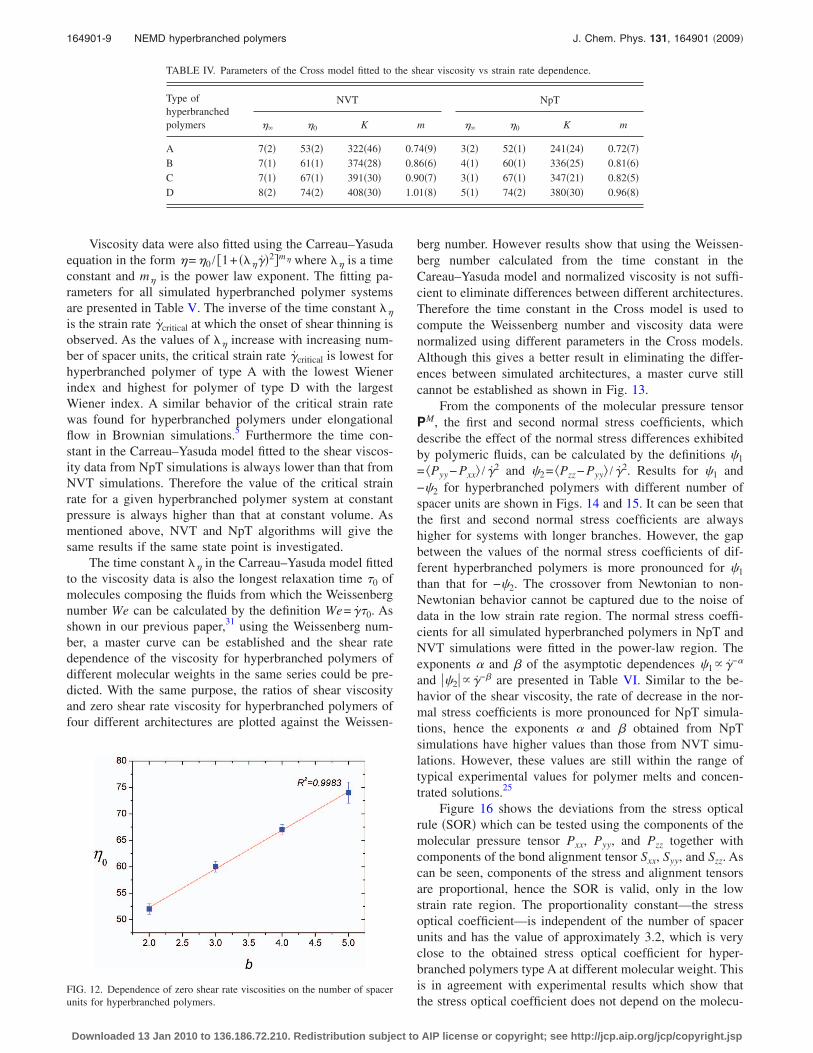
which is given by �=��+ ��0−��� / �1+ �K��mC� where �0 isthe zero shear viscosity, �� is the infinite shear viscosity, K isthe consistency index, and mC is the power law index. Fittingparameters are shown in Table IV. The NpT simulation zeroshear rate viscosities obtained from the Cross equation fit arethen plotted against the number of spacer units and resultsare shown in Fig. 12. It can be clearly seen that zero shearrate viscosities correlate linearly with the number of spacerunits b in hyperbranched polymer systems simulated. Theslope of the line is found to be 7.3�2�. The linear dependenceof �0 on the number of spacer units has also been investi-gated in Brownian dynamics simulations12 for hyper-branched polymers comprising 66 beads per molecule and inexperiments11 for hyperbranched aromatic etherimide co-polymers.
TABLE III. Parameters of the Carreau–Yasuda model fitted to the reducedbead density vs strain rate dependence for NPT simulations.
Type ofhyperbranchedpolymers �0 � m�
A 0.8412�2� 12.6�5� 0.175�9�B 0.8400�1� 11.1�3� 0.156�6�C 0.8400�2� 9.4�8� 0.18�2�D 0.8400�4� 9�2� 0.21�9�
FIG. 11. Shear viscosities vs strain rate for �a� different hyperbranchedpolymers in NVT simulations, �b� different hyperbranched polymers in NpTsimulations, and �c� hyperbranched polymer of type A in NVT and NpTsimulations �solid lines representing fitting with the Cross model�.
164901-8 Le et al. J. Chem. Phys. 131, 164901 �2009�
Downloaded 13 Jan 2010 to 136.186.72.210. Redistribution subject to AIP license or copyright; see http://jcp.aip.org/jcp/copyright.jsp
Viscosity data were also fitted using the Carreau–Yasudaequation in the form �=�0 / �1+ ����2�m� where � is a timeconstant and m� is the power law exponent. The fitting pa-rameters for all simulated hyperbranched polymer systemsare presented in Table V. The inverse of the time constant �
is the strain rate �critical at which the onset of shear thinning isobserved. As the values of � increase with increasing num-ber of spacer units, the critical strain rate �critical is lowest forhyperbranched polymer of type A with the lowest Wienerindex and highest for polymer of type D with the largestWiener index. A similar behavior of the critical strain ratewas found for hyperbranched polymers under elongationalflow in Brownian simulations.5 Furthermore the time con-stant in the Carreau–Yasuda model fitted to the shear viscos-ity data from NpT simulations is always lower than that fromNVT simulations. Therefore the value of the critical strainrate for a given hyperbranched polymer system at constantpressure is always higher than that at constant volume. Asmentioned above, NVT and NpT algorithms will give thesame results if the same state point is investigated.
The time constant � in the Carreau–Yasuda model fittedto the viscosity data is also the longest relaxation time �0 ofmolecules composing the fluids from which the Weissenbergnumber We can be calculated by the definition We= ��0. Asshown in our previous paper,31 using the Weissenberg num-ber, a master curve can be established and the shear ratedependence of the viscosity for hyperbranched polymers ofdifferent molecular weights in the same series could be pre-dicted. With the same purpose, the ratios of shear viscosityand zero shear rate viscosity for hyperbranched polymers offour different architectures are plotted against the Weissen-
berg number. However results show that using the Weissen-berg number calculated from the time constant in theCareau–Yasuda model and normalized viscosity is not suffi-cient to eliminate differences between different architectures.Therefore the time constant in the Cross model is used tocompute the Weissenberg number and viscosity data werenormalized using different parameters in the Cross models.Although this gives a better result in eliminating the differ-ences between simulated architectures, a master curve stillcannot be established as shown in Fig. 13.
From the components of the molecular pressure tensorPM, the first and second normal stress coefficients, whichdescribe the effect of the normal stress differences exhibitedby polymeric fluids, can be calculated by the definitions �1
= �Pyy − Pxx� / �2 and �2= �Pzz− Pyy� / �2. Results for �1 and−�2 for hyperbranched polymers with different number ofspacer units are shown in Figs. 14 and 15. It can be seen thatthe first and second normal stress coefficients are alwayshigher for systems with longer branches. However, the gapbetween the values of the normal stress coefficients of dif-ferent hyperbranched polymers is more pronounced for �1
than that for −�2. The crossover from Newtonian to non-Newtonian behavior cannot be captured due to the noise ofdata in the low strain rate region. The normal stress coeffi-cients for all simulated hyperbranched polymers in NpT andNVT simulations were fitted in the power-law region. Theexponents � and � of the asymptotic dependences �1�−�
and ��2��−� are presented in Table VI. Similar to the be-havior of the shear viscosity, the rate of decrease in the nor-mal stress coefficients is more pronounced for NpT simula-tions, hence the exponents � and � obtained from NpTsimulations have higher values than those from NVT simu-lations. However, these values are still within the range oftypical experimental values for polymer melts and concen-trated solutions.25
Figure 16 shows the deviations from the stress opticalrule �SOR� which can be tested using the components of themolecular pressure tensor Pxx, Pyy, and Pzz together withcomponents of the bond alignment tensor Sxx, Syy, and Szz. Ascan be seen, components of the stress and alignment tensorsare proportional, hence the SOR is valid, only in the lowstrain rate region. The proportionality constant—the stressoptical coefficient—is independent of the number of spacerunits and has the value of approximately 3.2, which is veryclose to the obtained stress optical coefficient for hyper-branched polymers type A at different molecular weight. Thisis in agreement with experimental results which show thatthe stress optical coefficient does not depend on the molecu-
TABLE IV. Parameters of the Cross model fitted to the shear viscosity vs strain rate dependence.
Type ofhyperbranchedpolymers
NVT NpT
�� �0 K m �� �0 K m
A 7�2� 53�2� 322�46� 0.74�9� 3�2� 52�1� 241�24� 0.72�7�B 7�1� 61�1� 374�28� 0.86�6� 4�1� 60�1� 336�25� 0.81�6�C 7�1� 67�1� 391�30� 0.90�7� 3�1� 67�1� 347�21� 0.82�5�D 8�2� 74�2� 408�30� 1.01�8� 5�1� 74�2� 380�30� 0.96�8�
FIG. 12. Dependence of zero shear rate viscosities on the number of spacerunits for hyperbranched polymers.
164901-9 NEMD hyperbranched polymers J. Chem. Phys. 131, 164901 �2009�
Downloaded 13 Jan 2010 to 136.186.72.210. Redistribution subject to AIP license or copyright; see http://jcp.aip.org/jcp/copyright.jsp

lar weight or branching of molecules.26 As discussed in ourprevious paper,2 the violation of the SOR in the high strainrate region occurs because it does not take into account theflow-induced changes of the radial distribution function ofhyperbranched polymers that becomes distorted at highstrain rates. Furthermore the deviations from the SOR corre-spond to the point where the pressure p���, which dependson the radial distribution function, begins to vary rapidly ascan be seen in Fig. 10�a� rather than that for the shear vis-cosity ���� as seen in Fig. 11. This confirms that the devia-tions are due to the changes in the local structure.
IV. CONCLUSIONS
In this work, hyperbranched polymers of the same mo-lecular weight of 187 beads but with different number ofspacer units of 2, 3, 4, and 5 were modeled using NEMD.The degree of branching was found to possess the samevalue for polymers of type A and B as well as for polymers
of type C and D. Therefore the Wiener index W was calcu-lated to fully characterize the architecture of simulated sys-tems. Microscopic structural properties, flow birefringence,and melt rheology of these systems were found to changesignificantly with an increasing number of spacer units.
The radius of gyration, distribution of beads, and theinterpenetration function were in accordance with the mo-
TABLE V. Parameters of the Carreau–Yasuda model fitted to the shear viscosity vs strain rate dependence.
Type ofhyperbranchedpolymers
NVT NpT
�0 � m� �0 � m�
A 48�6� 1422�615� 0.158�2� 47�1� 1338�240� 0.18�1�B 57.5�4� 1524�87� 0.186�4� 56.0�7� 1471�137� 0.200�8�C 63�5� 1612�93� 0.195�5� 62.2�7� 1562�127� 0.214�8�D 75�19� 1918�1268� 0.214�9� 69.6�5� 1801�730� 0.245�7�
FIG. 13. Shear viscosities vs Weissenberg number for different hyper-branched polymers in �a� NVT and �b� NpT simulations �solid lines repre-senting fitting with the Cross model�.
FIG. 14. First normal stress coefficient vs strain rate for �a� different hyper-branched polymers in NVT simulations, �b� different hyperbranched poly-mers in NpT simulation, and �c� hyperbranched polymer of type A in NVTand NpT simulations.
164901-10 Le et al. J. Chem. Phys. 131, 164901 �2009�
Downloaded 13 Jan 2010 to 136.186.72.210. Redistribution subject to AIP license or copyright; see http://jcp.aip.org/jcp/copyright.jsp

lecular architecture being less compact and more open withan increasing number of spacer units and have significantchanges induced by the shear flow. The mean squared zeroshear rate radius of gyration was found to scale with theWiener index as �Rg
2�0W1.20�6�.
For all systems, the flow alignment angle always con-verges to 45° in the Newtonian regime and decreases in thenon-Newtonian regime. Furthermore the molecular align-ment angle is found to be lower than the bond alignmentangle. On the other hand, the order parameter for simulatedhyperbranched polymers remains constant in the low strainrate region and increases at high strain rates. Besides, thesmaller value of the bond alignment parameter in compari-son with the molecular alignment parameter indicates thatthe intrinsic birefringence is fairly small compared to theform birefringence.
The crossover from the Newtonian to non-Newtonianbehavior was captured for all polymeric fluids in the range ofstrain rates considered. Rheological properties obtained fromNpT simulations were found to be the same as those fromNVT simulations except at high strain rates due to sheardilantancy. A linear dependence of zero shear rate viscositieson the number of spacer units was found for the hyper-branched polymer systems simulated. Furthermore it hasbeen found that using the Weissenberg number and normal-ized viscosity is not sufficient to eliminate differences be-tween different architectures of hyperbranched polymers. Al-though the isotropic pressure in NVT simulations andreduced bead density in NpT simulations show oppositetrends, they both have large critical strain rate at which thetransition from the Newtonian to non-Newtonian behavioroccurs. Furthermore the SOR was shown to be valid at low
FIG. 15. Second normal stress coefficient vs strain rate for �a� differenthyperbranched polymers in NVT simulations, �b� different hyperbranchedpolymers in NpT simulations, and �c� hyperbranched polymer of type A inNVT and NpT simulations.
TABLE VI. Estimated values of the exponents in the power law regions forthe first and second normal stress coefficients of different hyperbranchedpolymers.
Type ofhyperbranchedpolymers
NVT NpT
� � � �
Type A 1.0�2� 0.9�7� 1.2�5� 1.27�4�Type B 1.1�1� 1.0�3� 1.2�6� 1.26�9�Type C 1.0�9� 1.1�1� 1.1�9� 1.1�3�Type D 1.1�5� 1.1�4� 1.2�6� 1.1�6�
FIG. 16. Deviations from the stress optical rule—�Pxx− Pyy� / �Sxx−Syy� and�Pyy − Pzz� / �Syy −Szz� vs the logarithm of � for different hyperbranchedpolymers.
164901-11 NEMD hyperbranched polymers J. Chem. Phys. 131, 164901 �2009�
Downloaded 13 Jan 2010 to 136.186.72.210. Redistribution subject to AIP license or copyright; see http://jcp.aip.org/jcp/copyright.jsp

strain rates with the stress optical coefficient of approxi-mately 3.2 independent of the polymer topologies.
1 C. Gao and D. Yan, Prog. Polym. Sci. 29, 183 �2004�.2 T. C. Le, B. D. Todd, P. J. Daivis, and A. Uhlherr, J. Chem. Phys. 130,074901 �2009�.
3 D. Konkolewicz, O. Thorn-Seshold, and A. Gray-Weale, J. Chem. Phys.129, �2008�.
4 G. K. Dalakoglou, K. Karatasos, S. V. Lyulin, and A. V. Lyulin, J. Chem.Phys. 129, 034901 �2008�.
5 I. M. Neelov and D. B. Adolf, J. Phys. Chem. B 108, 7627 �2004�.6 P. F. Sheridan, D. B. Adolf, A. V. Lyulin, I. Neelov, and G. R. Davies, J.Chem. Phys. 117, 7802 �2002�.
7 A. V. Lyulin, D. B. Adolf, and G. R. Davies, Macromolecules 34, 3783�2001�.
8 A. H. Widmann and G. R. Davies, Comput. Theor. Polym. Sci. 8, 191�1998�.
9 S. Kunamaneni, D. M. A. Buzza, D. Parker, and W. J. Feast, J. Mater.Chem. 13, 2749 �2003�; Suneel, D. M. A. Buzza, D. J. Groves, T. C. B.McLeish, D. Parker, A. J. Keeney, and W. J. Feast, Macromolecules 35,9605 �2002�; S. B. Kharchenko, R. M. Kannan, J. J. Cernohous, S. Ven-kataramani, and G. N. Babu, J. Polym. Sci., Part B: Polym. Phys. 39,2562 �2001�; T. T. Hsieh, C. Tiu, and G. P. Simon, Polymer 42, 7635�2001�; T. T. Hsieh, C. Tiu, and G. P. Simon, ibid. 42, 1931 �2001�; P. J.Farrington, C. J. Hawker, J. M. J. Frechet, and M. E. Mackay, Macro-molecules 31, 5043 �1998�.
10 Y. Guo, J. D. Van Beek, B. Zhang, M. Colussi, P. Walde, A. Zhang, M.Kroger, A. Halperin, and A. D. Schluter, J. Am. Chem. Soc. 131, 11841�2009�; Y. Ding, H. C. Ottinger, A. D. Schluter, and M. Kroger, J. Chem.Phys. 127, 094904 �2007�.
11 L. J. Markoski, J. S. Moore, I. Sendijarevic, and A. J. McHugh, Macro-molecules 34, 2695 �2001�.
12 A. T. Lee and A. J. McHugh, Macromolecules 34, 7127 �2001�.13 C. Satmarel, C. Von Ferber, and A. Blumen, J. Chem. Phys. 124, �2006�.14 C. N. Likos, Soft Matter 2, 478 �2006�.15 J. T. Bosko, B. D. Todd, and R. J. Sadus, J. Chem. Phys. 121, 1091
�2004�.16 J. T. Bosko, B. D. Todd, and R. J. Sadus, J. Chem. Phys. 121, 12050
�2004�; 124, 044910 �2006�.17 J. D. Weeks, D. Chandler, and H. C. Anderson, J. Chem. Phys. 54, 5237
�1971�.18 G. S. Grest and K. Kremer, Phys. Rev. A 33, 3628 �1986�.19 D. J. Evans and G. P. Morriss, Statistical Mechanics of Nonequilibrium
Liquids �Academic, London, 1990�.20 B. D. Todd and P. J. Daivis, Mol. Simul. 33, 189 �2007�.21 P. J. Daivis and D. J. Evans, J. Chem. Phys. 100, 541 �1994�.22 J. T. Bosko, B. D. Todd, and R. J. Sadus, J. Chem. Phys. 123, �2005�.23 C. W. Gear, Numerical Initial Value Problems in Ordinary Differential
Equations �Prentice-Hall, Englewood Cliffs, NY, 1971�.24 D. Holter, A. Burgath, and H. Frey, Acta Polym. 48, 30 �1997�.25 R. B. Bird, C. F. Curtiss, R. C. Armstrong, and O. Hassager, Dynamics of
Polymeric Liquids �Wiley, New York, 1987�.26 M. Doi and S. F. Edwards, The Theory of Polymer Dynamics �Clarendon,
Oxford, 1986�.27 M. Kroger, W. Loose, and S. Hess, J. Rheol. 37, 1057 �1993�.28 A. Jabbarzadeh, J. D. Atkinson, and R. I. Tanner, Macromolecules 36,
5020 �2003�.29 O. Reynolds, Philos. Mag. 20, 469 �1985�.30 M. M. Cross, J. Colloid Sci. 20, 417 �1965�.31 T. C. Le, B. D. Todd, P. J. Daivis, and A. Uhlherr, J. Chem. Phys. 131,
044902 �2009�.
164901-12 Le et al. J. Chem. Phys. 131, 164901 �2009�
Downloaded 13 Jan 2010 to 136.186.72.210. Redistribution subject to AIP license or copyright; see http://jcp.aip.org/jcp/copyright.jsp